 Chester J. Sands1,2*
 William P. Goodall-Copestake3
 Sabine Stöhr4
 Bhavani E. Narayanaswamy2
 Peter Convey1,5,6,7
 Timothy D. O’Hara8
 Rafael Martín-Ledo9
- 1British Antarctic Survey, Natural Environment Research Council, Cambridge, United Kingdom
- 2Scottish Association for Marine Science, Oban, United Kingdom
- 3Royal Botanic Garden Edinburgh, Edinburgh, United Kingdom
- 4Swedish Museum of Natural History, Stockholm, Sweden
- 5University of Johannesburg, Johannesburg, South Africa
- 6Millennium Institute Biodiversity of Antarctic and Sub-Antarctic Ecosystems (BASE), Santiago, Chile
- 7Cape Horn International Center (CHIC), Puerto Williams, Chile
- 8Museums Victoria, Melbourne, VIC, Australia
- 9Aírea de Zoologiía, Facultad de Ciencias, Universidad de Extremadura, Badajoz, Spain
Accurate knowledge of geographic ranges of species is essential for effective conservation management. Species with large distributions and good connectivity are presumed to be resilient to adverse localized/regional conditions, whereas those with small ranges and, thus, smaller population sizes are more likely to be vulnerable. The rich benthic assemblages across the Southern Ocean are generally considered “Antarctic” with some input from South America contributing to diversity on the sub-Antarctic island shelves. However, molecular work over the past two decades is challenging the paradigm of a general Antarctic benthic fauna, with evidence mounting for assemblages being regionally unique in terms of genetic diversity, regardless of formal taxonomic species composition. The widely distributed brittle star, Amphiura belgicae, is one element of the Southern Ocean benthic assemblage that has a complex historical taxonomic background hinting that it may in reality be a complex of species, each with small geographic range and little connectivity. Our study identified deep genetic divisions between geographically isolated populations, particularly between those on the Patagonian shelf and elsewhere. Indeed, populations on the Patagonian shelf were more closely related to the sympatric sister species A. eugeniae than to any other Southern Ocean population. We compare our data with a study of Ophiuroglypha lymani from similar collections, highlighting that both show highly regionalized populations, particularly on Island shelves, and both share the curious phenomenon of a presumed outgroup species being an element of the ingroup. We suggest that the isolated populations of both these species are following distinct evolutionary and ecological trajectories and that both should be treated as species complexes.
1 Introduction
We are in an age of rapid biodiversity decline due primarily to anthropogenic impacts on habitat quality and climate (Dirzo et al., 2022). At the same time, scientific discoveries are highlighting that mature, diverse assemblages are providing ecosystem services that are essential to maintaining human quality of life and in some cases acting as “nature-based solutions”, such as carbon capture and sequestration, to human induced global problems (Sands et al., 2023). Identifying and managing mature assemblages requires sound taxonomic knowledge of the assemblage elements, as well as understanding of the geographical distributions of these elements and the connectivity between assemblages. In general, marine conservation management relies on species presence/absence information held in databases, and assesses distributions as indicated by records of presence. Identifications in databases are rarely confirmed by expert taxonomic examination, rather relying on field-based observations, thereby providing a major source of error. This is not offered as a criticism of field identifications, rather a frank acknowledgement of the difficulties of taxonomic identifications in general, particularly when characters are both subtle and variable, and original descriptions are difficult to interpret and reconcile with the specimen on the table. A case in point was highlighted as early as Mortensen (1936), regarding the ophiuroid (brittle star) species Amphiura belgicae Koehler, 1900, and is the focus of this study.
The genus Amphiura Forbes, 1843 is exceptionally species rich (471 species registered in WoRMS as of 3 April 2024) and has a global distribution. It is represented in the Southern Ocean with a total of 2114 records of 24 species (GBIF search greater than 50°S, 3 April 2024), and although not comparatively as species rich, the individual brittle stars can be locally abundant. The most abundant and widespread of these species is Amphiura belgicae, which is recorded as far north as the coast around Cape of Good Hope, South Africa, and as far south as the Ross and Weddell Seas, Antarctica. It was first described from material collected by the Belgica expedition, 1897–1899, from sampling locations in the Bellingshausen Sea. In describing Amphiura belgicae, Koehler used phrases (translated from French) such as “the disc is flattened, sometimes depressed in the center, most often rounded, but sometimes pentagonal and even somewhat excavated in the interbrachial spaces”, indicating this species can vary in general shape. He concluded by stating “Amphiura belgicae is easily distinguished from all known species of genus Amphiura”.
In 1908 Koehler examined material sampled from stations around the South Orkney Islands as part of the Scottish National Antarctic Expedition 1902–1904, from which he described Amphiura mortenseni Koehler, 1908b. He reported that it was “… easily characterized by the shape of its mouth shields provided with a prominent and well accentuated distal lobe … ventral surface covered with plates and two tentacular scales”. Amphiura belgicae mouth shields are also described as “sometimes offering a small lobe…”, the ventral surface is covered in small, interlocking, plates, and “The tentacular scales are two in number” (Koehler, 1900).
Koehler also examined material from the Swedish Antarctic Expedition 1901–1903, in which he noted the presence of both A. belgicae and A. mortenseni from South Georgia stations, as well as describing Amphiura alternans Koehler, 1923, also rounded or sub-pentagonal, sometimes convex disc, the oral shields also with a distal lobe, ventral surface covered with plates and variable tentacle scale presence. In his description he noted similarities and differences between A. alternans and several other Amphiura species, but not specifically A. belgicae or A. mortenseni.
Material from the German South-polar Expedition 1901–1903 was examined by Hertz (1927). She considered A. mortenseni a subspecies of Amphiura eugeniae Ljungman, 1867, and further described a second subspecies of A. eugeniae as Amphiura eugeniae gracilis Hertz, 1927.
The ophiuroids from the British National Antarctic (Discovery) Expedition 1901–1904 were examined by Mortensen (1936). When considering A. belgicae, he also examined and compared type material of A. eugeniae gracilis, A. mortenseni and A. alternans and concluded that the main characters overlapped substantially and with sufficient variation that these taxa should be synonymized to the single species A. belgicae. Finally, a further species, Amphilepis gymnopora Hertz, 1927 from the Kerguelen plateau has more recently been synonymized with A. belgicae by Clark (1970).
Given the difficulties of communication in the early 1900’s compared with today’s “information age”, it is understandable that the same species may have been described on more than one occasion by different taxonomists. However, a further complication is provided when the same taxonomist describes two or three distinct species from the same collection that are then eventually synonymized.
Cryptic or unrecognized diversity appears to be common in Antarctic ophiuroids (Hunter and Halanych, 2008; Martín-Ledo et al., 2013; Sands et al., 2015, 2021; Jossart et al., 2019). In this case it is possible that there may be subtle morphological differences seen by the taxonomists of the last century that were then inadequately expressed in their formal descriptions. We therefore set out to test the null hypothesis of Mortensen (1936), that A. belgicae and A. eugeniae are two distinct species, with the expectation of genetic diversity divided into two distinct, well supported clades. The alternative hypothesis is that these species are taxonomically/morphologically complex, with cryptic variation and genetic divergence present, as hinted at by the multiple species’ descriptions of Koehler and Hertz.
2 Methods
Specimens were collected during several research expeditions across the western sector of the Southern Ocean covering the Patagonian Shelf, Scotia Sea, Weddell Sea, Bellingshausen Sea and Amundsen Sea. Figure 1 illustrates the sampling range and details of specimens can be found at dx.doi.org/10.5883/DS-260324. Collections were made using Agassiz Trawls with a 1 cm inner mesh. Specimens were identified to general morphotype (e.g. Amphiura-like) before being placed in cold 100% ethanol and stored at −20°C for transport to the UK.
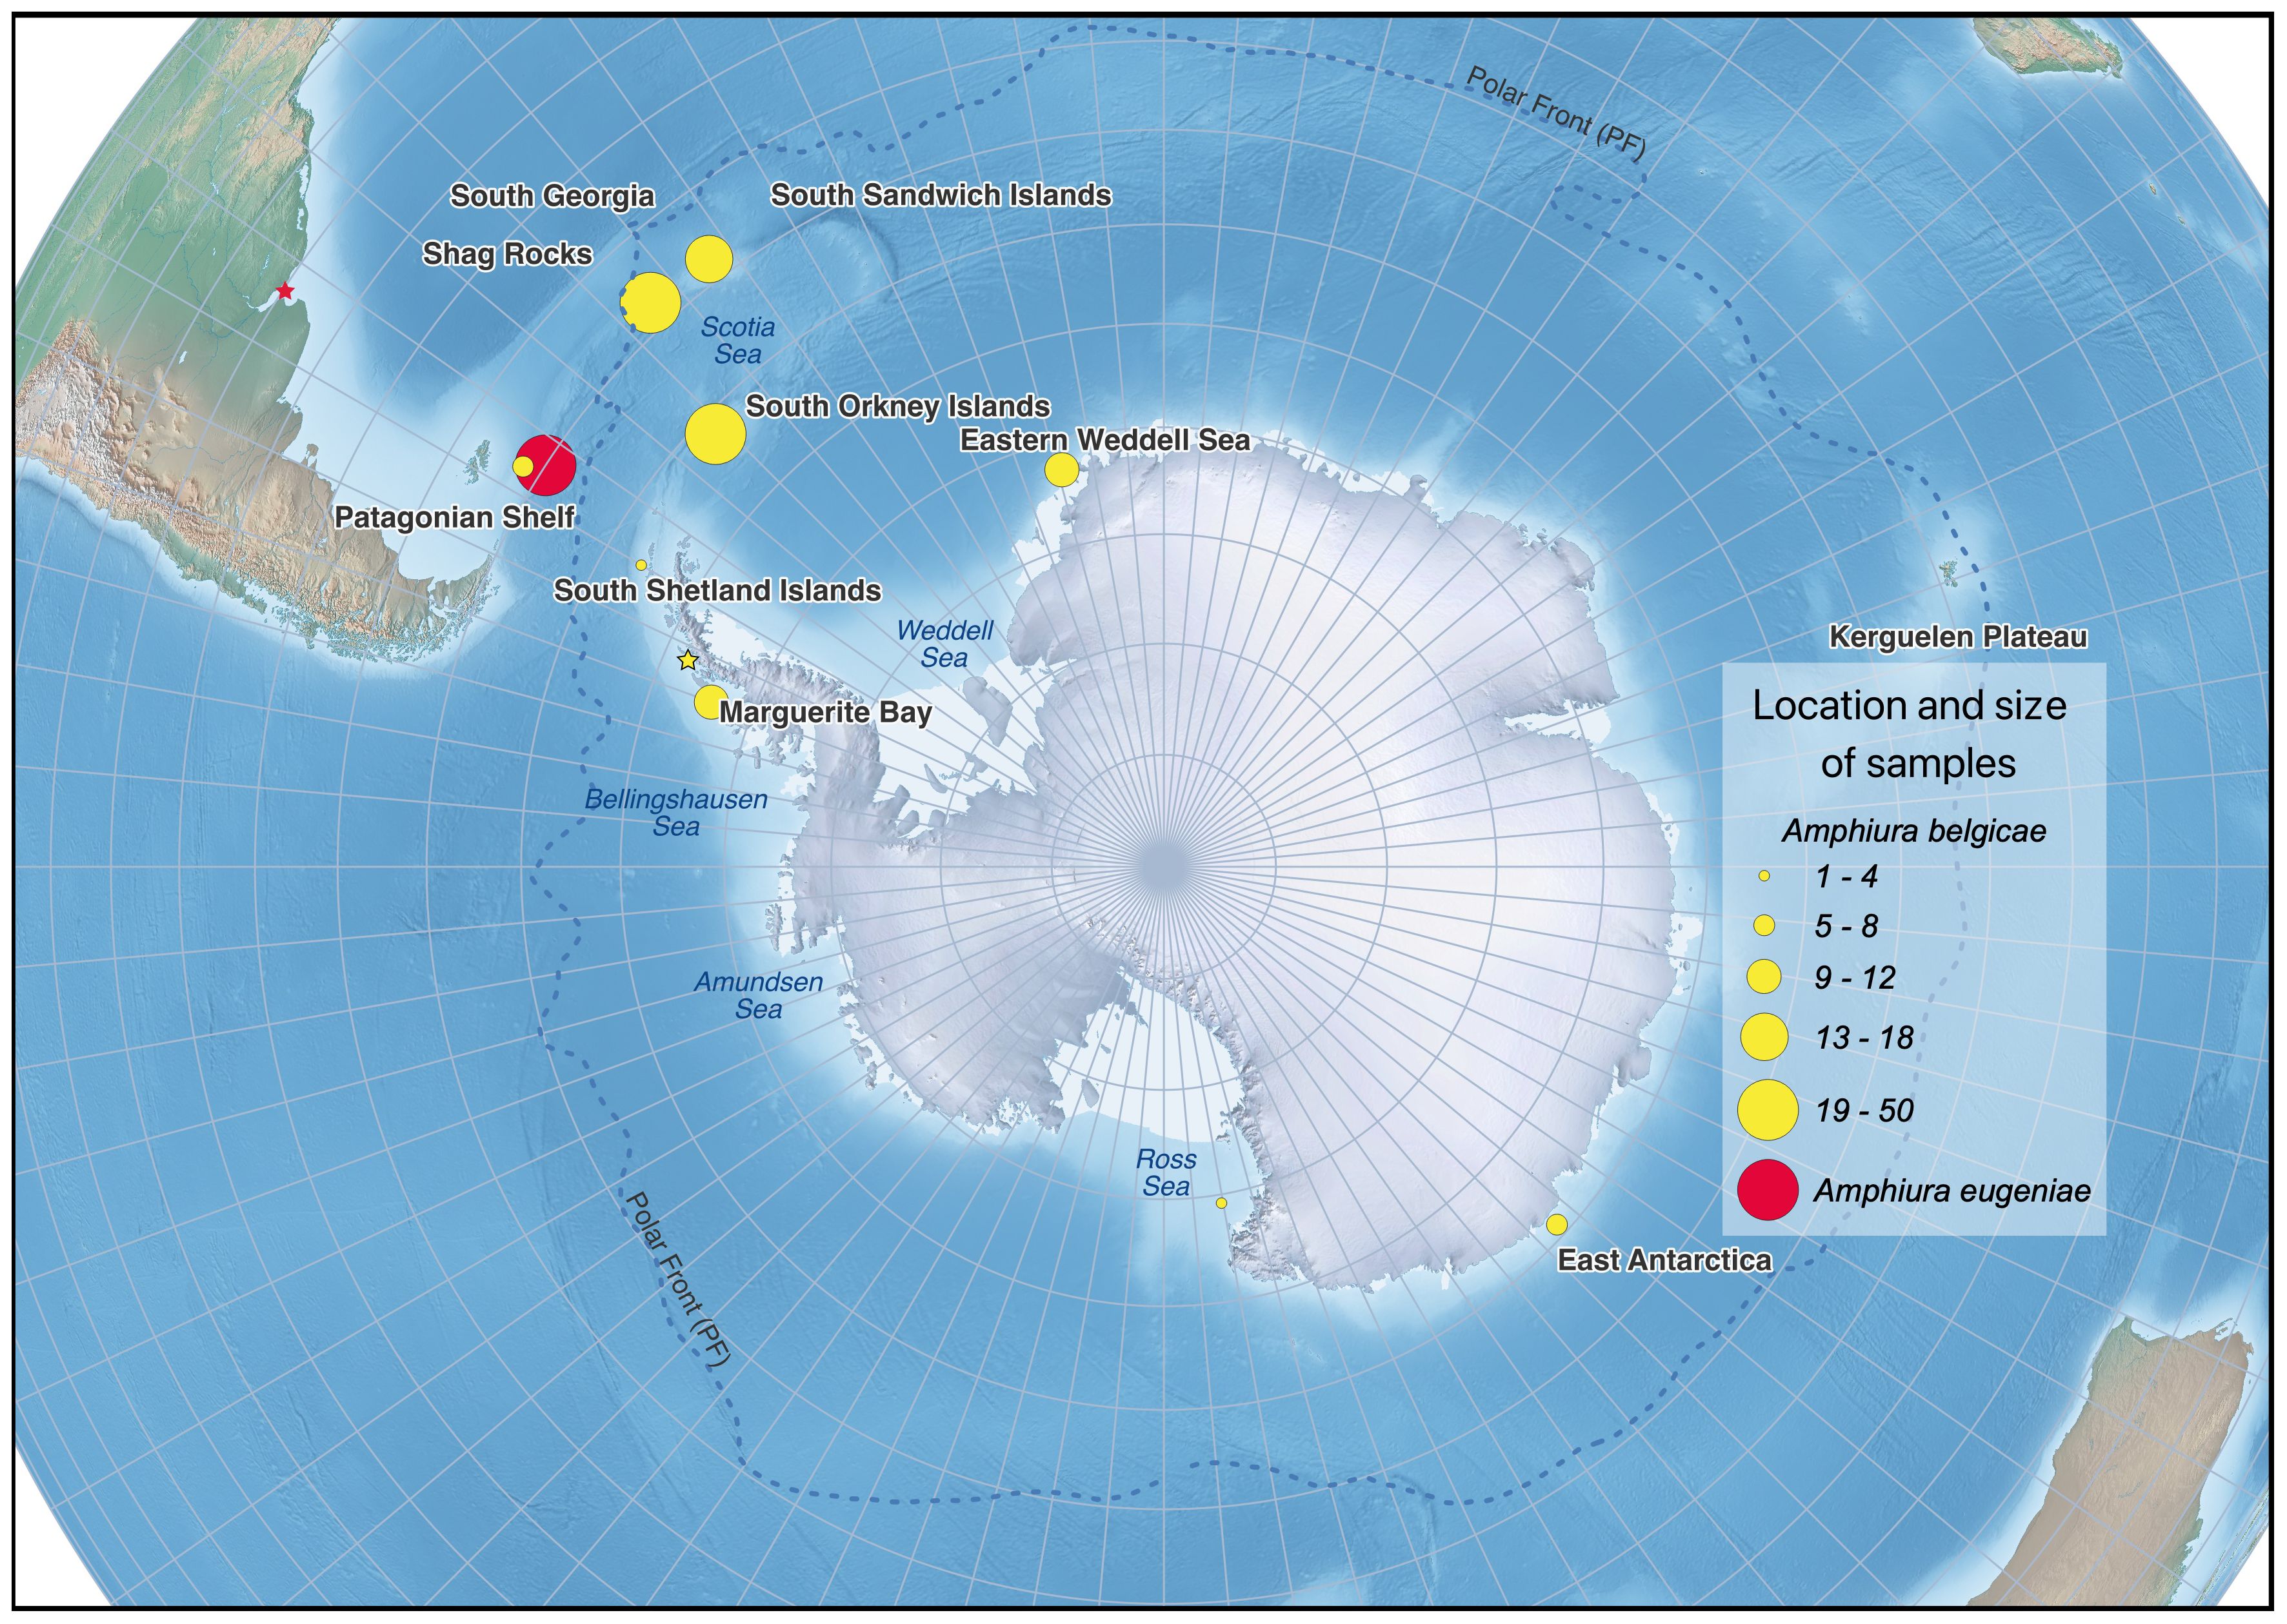
Figure 1. Map of Antarctica and the Southern Ocean showing where collections were made of Amphiura belgicae (yellow dots) and Amphiura eugeniae (red dot). The size of each dot is proportional to the sample size from that location. Stars indicate the type locality of each species.
Specimens were diagnosed following relevant descriptions (e.g. Koehler, 1923; Hertz, 1927, 1922, 1908a, 1908b, 1900; Ljungman, 1867; Mortensen, 1936, 1924) using a Leica M65 microscope. Amphiura specimens were photographed and ~3 mm3 of tissue removed from an arm tip for molecular analyses. DNA extraction and bidirectional sequencing of mitochondrial cytochrome c oxidase subunit 1 (CO1) were carried out at the Canadian Centre for DNA Barcoding, University of Guelph.
Sequences were base-called using Phred in CodonCode Aligner V5.0.1, trimmed and assembled into individual contigs that were checked by eye before multiple alignment using the MUSCLE algorithm (Edgar, 2004). The alignment was translated using mitochondrial echinoderm code to verify an open reading frame. Summary statistics were generated in DNAsp v5 (Rozas et al., 2003; Librado and Rozas, 2009) to explore signals of diversity, selection and population dynamics. Within and among group distances were calculated in MEGA v10.2.4 (Kumar et al., 2018) using percentage differences (uncorrected P) and maximum composite likelihood.
Relationships between sequences were initially explored by building a statistical parsimony network (Templeton et al., 1992) as implemented in PopArt (Leigh and Bryant, 2015).
Phylogenetic analyses using identified Amphiura species were then conducted to assess diversity and the inferred systematic position of Amphiura belgicae in relation to other species. Outgroups (Ophiacantha wolfarntzi Martín-Ledo et al., 2013, Ophiacantha pentactis Mortensen, 1936, Ophiacantha vivipara Ljungman 1871, Amphilepis sp., Ophiuroglypha carinifera Koehler, 1901, Ophiuroglypha lymani Ljungman 1871, Ophiocamax gigas Koehler, 1900, Ophiactis asperula Philippi 1858) were included to root the phylogeny providing polarity and some systematic order. Phylogenetic reconstruction was conducted using both Bayesian (Mr Bayes v3.2.1) and Maximum Likelihood (RAxML v8) analyses (Ronquist et al., 2012; Stamatakis, 2014) using a GTR+G model of site evolution in each of three codon partitions. The resulting phylogenies were edited in Figtree v1.4.4 (Rambaut, 2012) and further edited in Graphic v3.1 (Picta inc.) to manually collapse poorly supported branches (bootstrap support < 50, posterior probabilities < 0.8). A reduced dataset of three to four representative sequences from each clade was used to estimate clade divergence times. The analysis was conducted in BEAST2 v2.7.5 under a GTR+G model, a Yule speciation prior and an optimized relaxed clock set to 2.48 × 10⁻⁸ per lineage per million years (Naughton et al., 2014; Sands et al., 2015). To enable direct comparison with a previous study (Sands et al., 2015), a dataset of Ophiuroglypha lymani was reanalyzed using the same clock rate and including extra individuals sampled from Tristan da Cunha seamounts.
Demographic exploration was conducted using the Bayesian Skyline Plot (Drummond et al., 2005) function in BEAST2 v2.7.5 (Bouckaert et al., 2014) for each spatial-genetic group. Working files were set up with an HKY+G model, strict clock with rate 2.48 × 10⁻⁸ (Naughton et al., 2014), and a coalescent Bayesian skyline prior. Runs included 108 generations sampling every 1000 states. Results were first checked for effective sample size, convergence and mixing in Tracer v1.7.1, with the same package used to generate the skyline plots.
3 Results
A total of 139 specimens of Amphiura belgicae and 26 specimens of A. eugeniae were examined in this study. A. eugeniae differs very subtly from A. belgicae, primarily the presence of a small papilla on the outside of the outer mouth papilla, the attitude of the tentacle pore scales in which the pair at each scale are characteristically perpendicular to each other as opposed to a more acute angle typically seen with A. belgicae and shorter arm spines for A. eugeniae. These characters were subtle and there was considerable variation particularly in the shape and number of tentacle scales observed in A. belgicae. The type locality for A. eugeniae is the bay north of Buenos Aires, in the far northern part of the Patagonian shelf. All our samples were collected on the southernmost region of the Patagonian shelf, the Burdwood Bank. Direct comparison of our samples to the holotype stored at the Swedish Natural History Museum satisfies us that they have been identified correctly. The neat genetic clustering of A. belgicae (n=19) sampled from Burdwood Bank from A. eugeniae (see below) supports our taxonomic observations.
The Amphiura sequences analyzed here were not strongly grouped in respect to the Ophiactis asperula outgroup (BS=38 Figure 2). While some GenBank sequences contributed to our analyses, several sequences attributed to Amphiura on GenBank were excluded as they did not cluster with the included sequences. This reinforces our position on the need for careful taxonomic determination prior to database submission, but it limited the taxonomic depth of the analysis. Within the Amphiura sequences, A. belgicae together with A. eugeniae form a well-supported clade (BS=87) separate from all other Amphiura sampled.
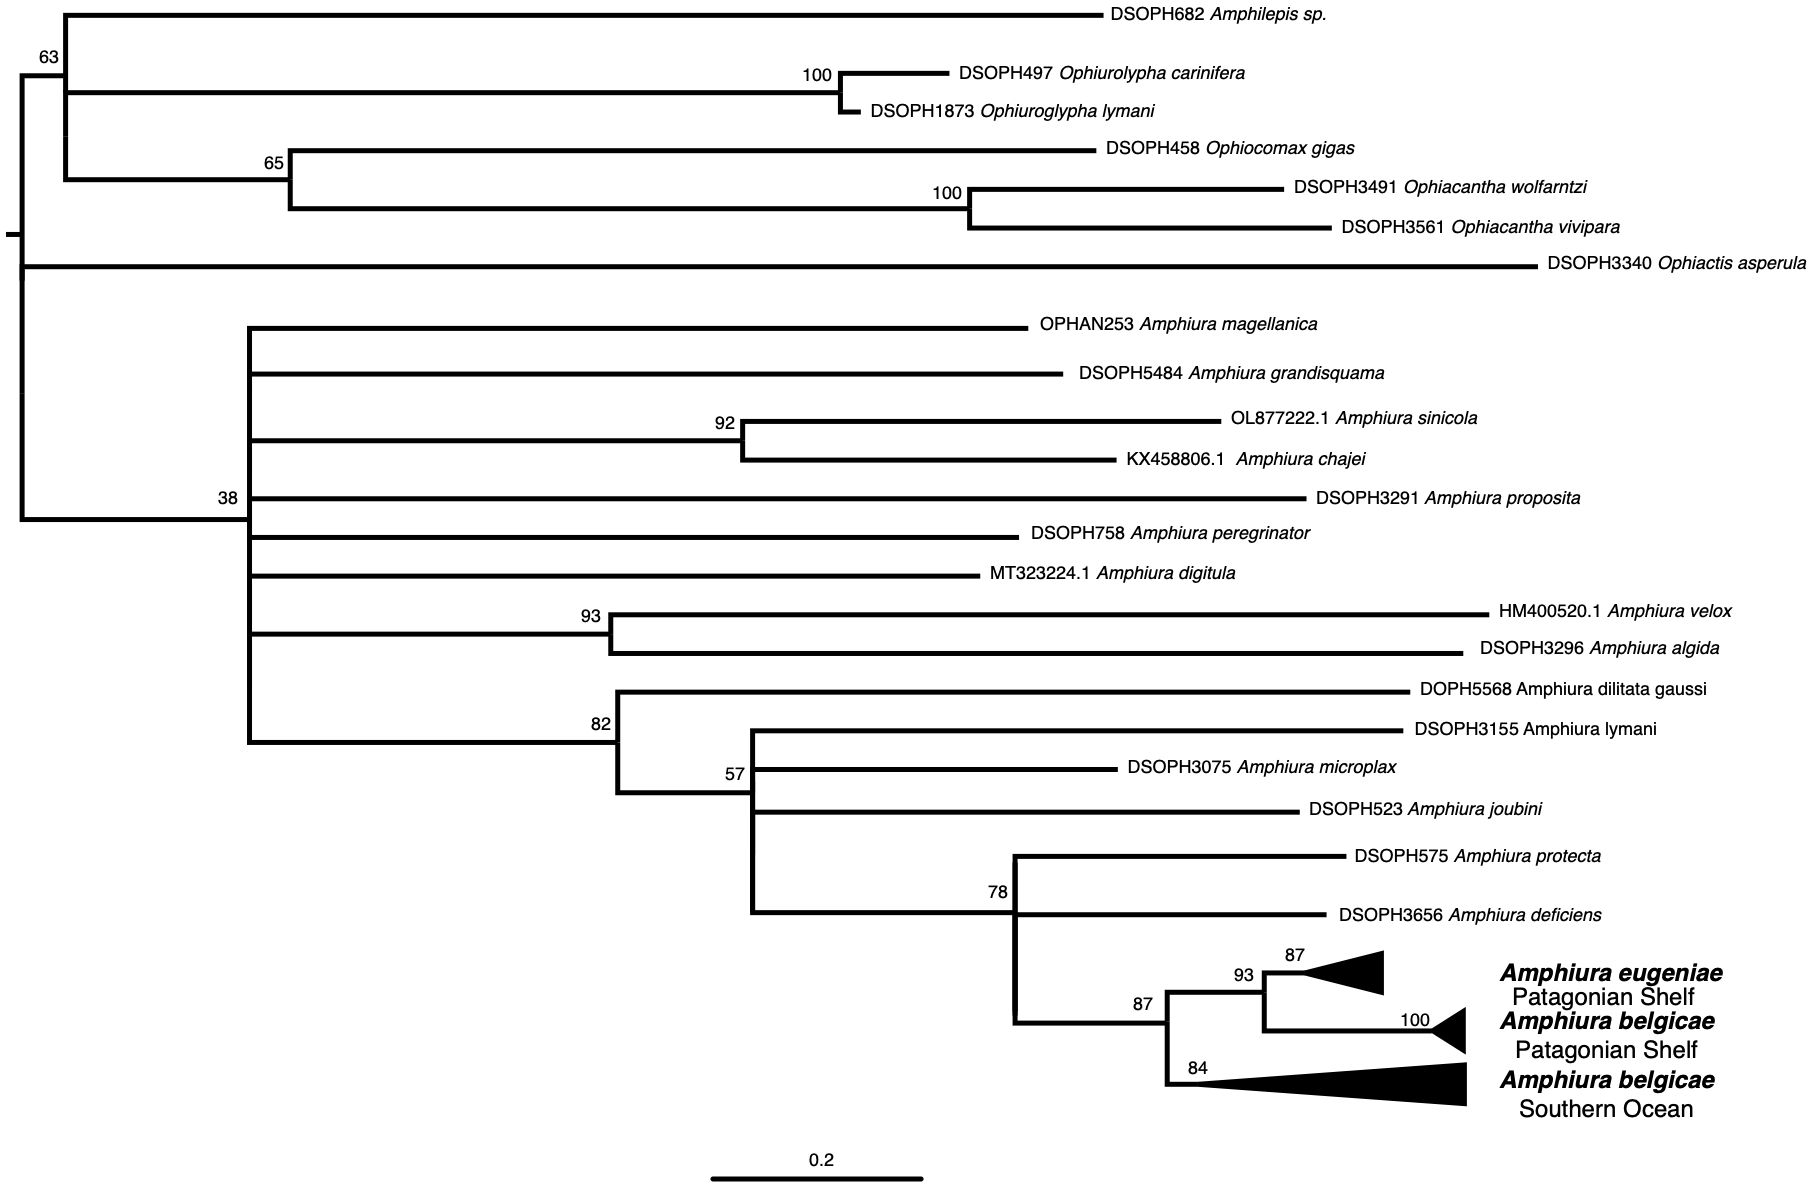
Figure 2. Maximum likelihood phylogeny produced with cytochrome c oxidase subunit 1 sequences of Amphiura species in relation to Amphiura belgicae and outgroups. Node support values were generated by bootstrap pseudoreplicates. Nodes with less than 50% bootstrap support were collapsed, apart from the Amphiura clade node that was left for context only as it has no support in this analysis.
From the other localities sampled A. belgicae was collected around South Georgia (n=14) and Shag Rocks (n=49), the South Orkney Islands (n=30), along the shelf and offshore island regions of the Antarctic Peninsula (n=14), and locations on the East Antarctic shelf including the Ross Sea, and West Antarctic shelf (n=17). Although there was some subtle variation in characters across this sampling range, morphological variation had no regional patterns and corresponds with Mortensen (1936) observations of a broadly variable species.
Summary molecular statistics are presented in Table 1. Haplotype diversity was high (HD > 0.9) in most locations apart from the Antarctic Peninsula where it was quite low (HD<0.5). Nucleotide diversity (π) was very high (π > 0.02) for the total dataset and the A. belgicae dataset. High nucleotide diversity in relation to haplotype diversity in mtCO1 has been shown to be a good predictor of taxonomic complexity (Goodall-Copestake et al., 2012) and this ratio alone provides strong evidence supporting that A. belgicae variation does not conform to the expectation of a panmictic species. South Orkney Island and Antarctic Peninsula groupings also had higher than expected nucleotide diversity (π > 0.01), along with significantly negative values for Tajima’s D statistic, indicating rare variates are more common than expected and suggesting purifying selection or, perhaps, recent population expansion (Tajima, 1989). Fu’s S statistic also identifies population size changes (Fu, 1996, 1997) and the highly significant value for Shag Rocks indicates recent population expansion. However, Ramos-Onsins and Roza’s R2 statistic (Ramos-Onsins and Rozas, 2002), designed to identify population expansion, was not significant for any of these groupings.
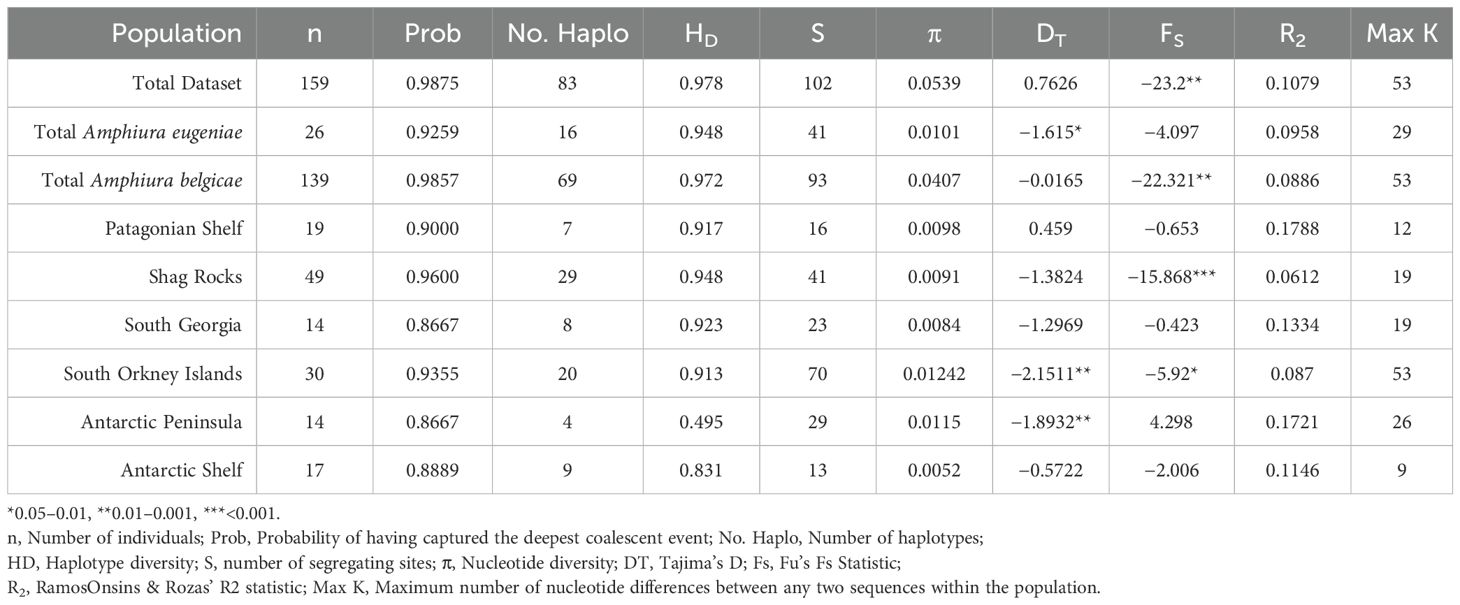
Table 1. Summary statistics of molecular diversity in geographic regions of Amphiura belgicae and A. eugeniae based on cytochrome c oxidase subunit 1 sequences.
The depth of divergence between locations was highlighted by examining pairwise distances, particularly between the Patagonian shelf population and other populations. The population of A. belgicae from Burdwood Bank on the Patagonian shelf was more similar to the sympatric A. eugeniae population (7.39% uncorrected P, 8.7% corrected) than to any other A. belgicae population, where distances ranged from 10.29% uncorrected P or 13.22% corrected between Patagonia and Antarctic Peninsula, and 12.07 uncorrected P or 16.33 corrected between Patagonia and Shag Rocks (Table 2). The most similar populations were Shag Rocks and South Georgia (2.48% uncorrected P, 2.6% corrected P), which are also the populations separated by the smallest distance (approximately 30 km of deep water separating the two shelf regions). Within-population variation ranged from 0.052% within Antarctic Shelf and 1.23% within South Orkney individuals.
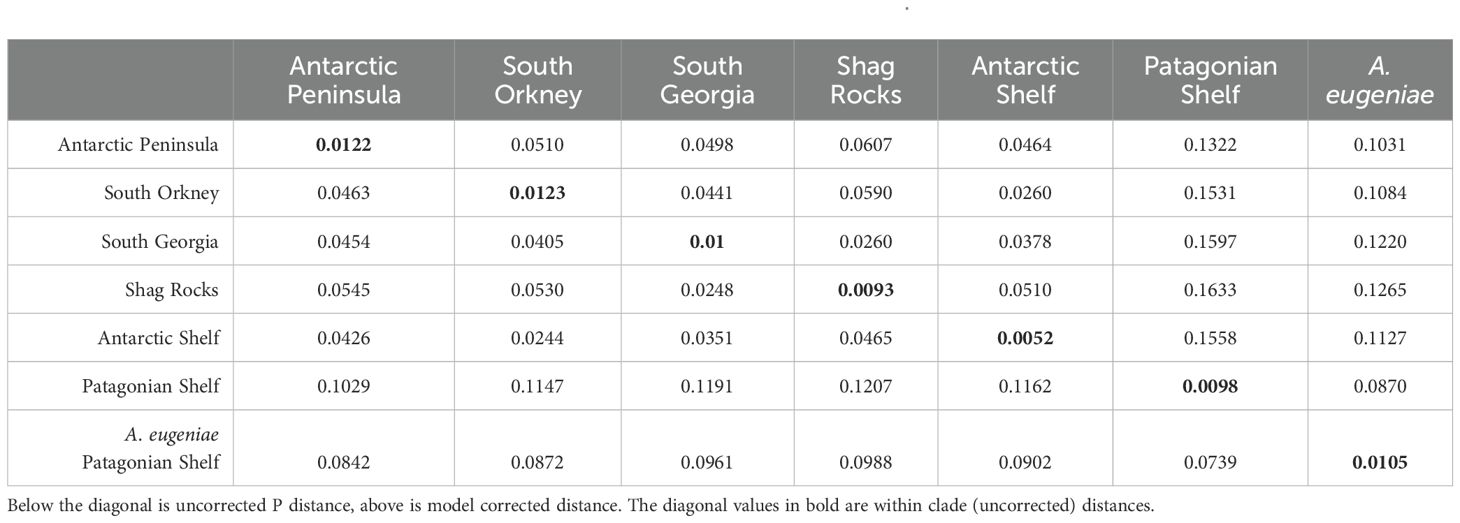
Table 2. Pairwise distance between geographic clades of Amphiura belgicae and A. eugeniae.
The divergence between groups is further highlighted in the network analysis (Figure 3) where, in general, region-specific haplotypes are clearly grouped together.
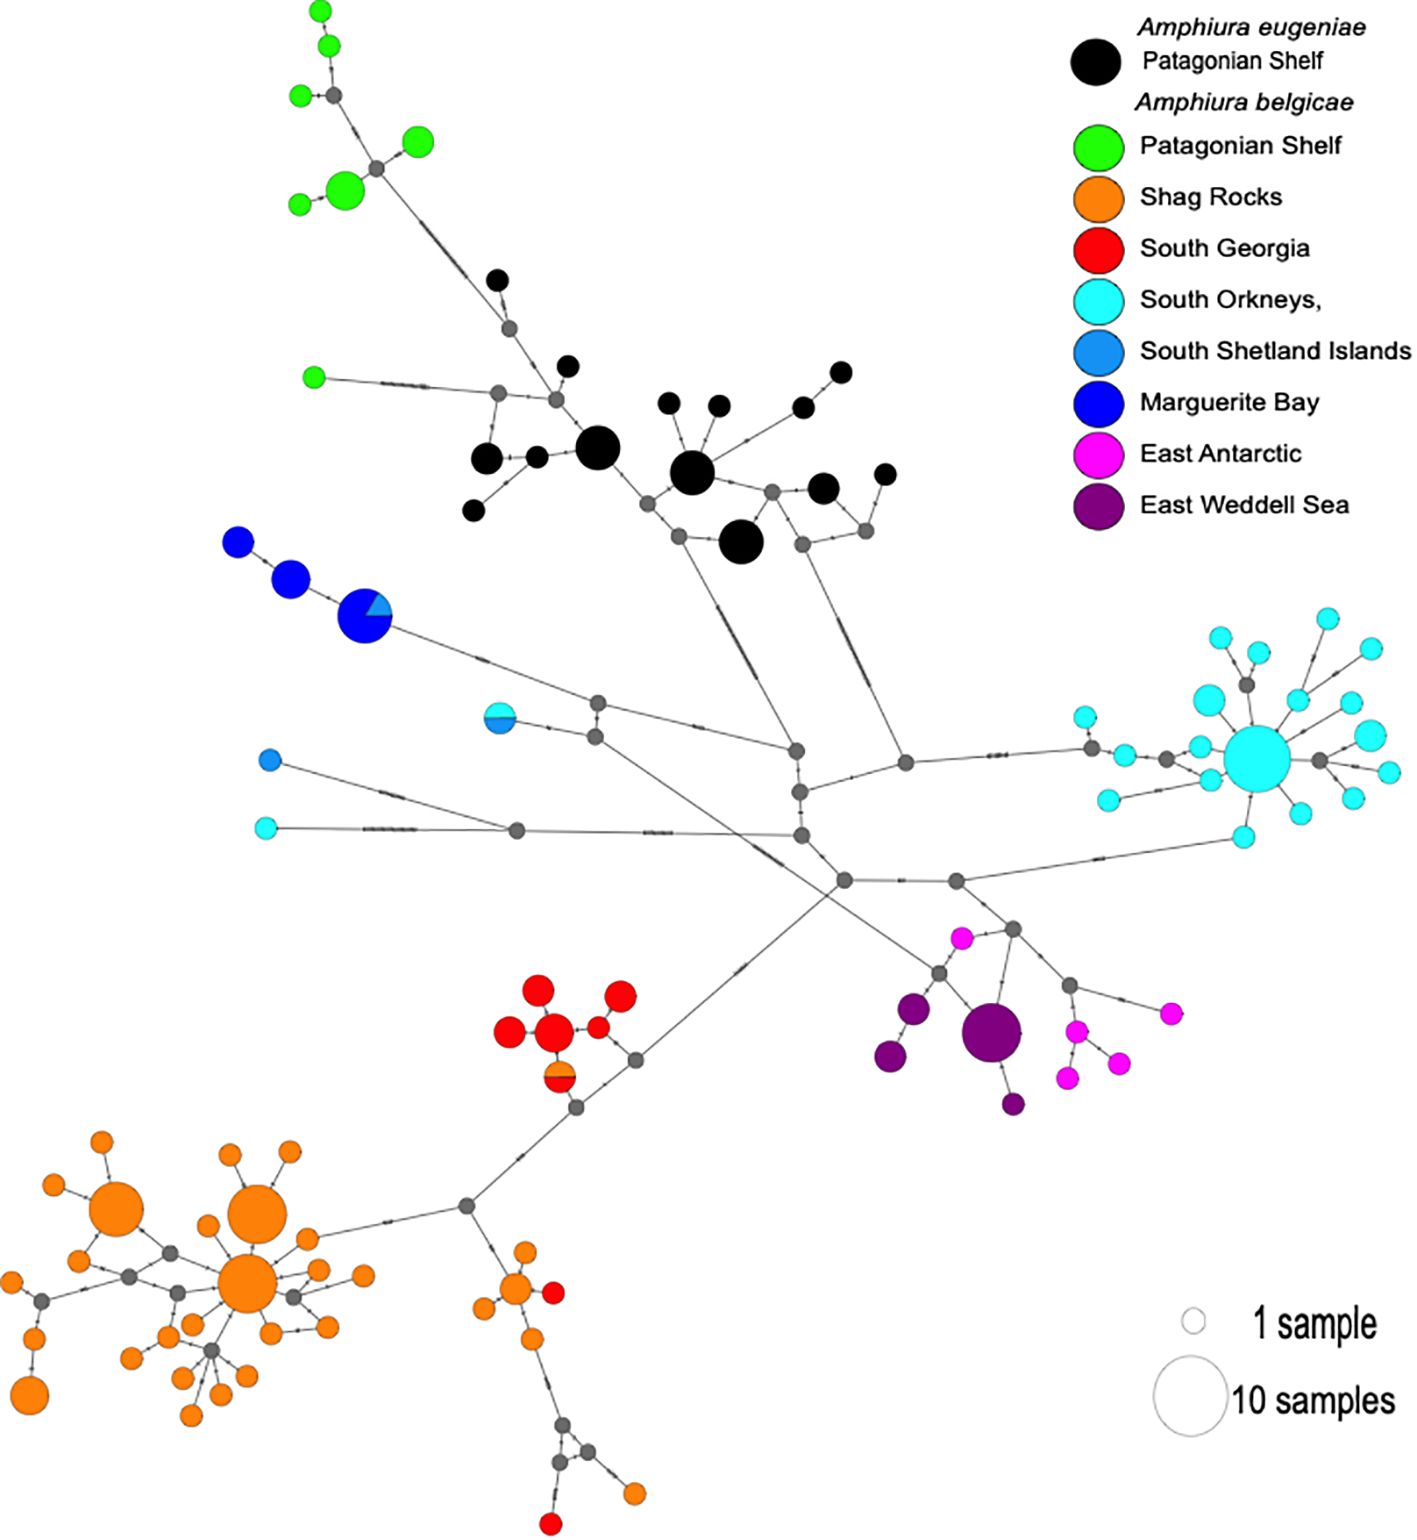
Figure 3. Haplotype network as produced by TCS procedure in PopArt. Circle colour indicates sampling location. Circle size is proportional to frequency of the haplotype it represents. Each hash through a connecting line represents a base change between haplotypes, which are unsampled haplotypes, possibly ancestral states. Small grey circles are nodes in the network also representing unsampled haplotypes.
Amphiura belgicae genetic diversity was strongly partitioned into geographic groupings with strongly supported clades for each of the regions sampled (Figure 4). Individuals from the Patagonian Shelf clustered into a clade along with Amphiura eugeniae. Again, the two singleton sequences, one from the South Orkney Island shelf, and one from the South Shetland Islands (closely associated with the Antarctic Peninsula shelf) did not cluster with any of the clades in either likelihood or Bayesian analyses. Two other individuals, one from the South Orkney Islands, the other from the South Shetland Islands, were sequence identical. A third South Shetland Island individual shared identical sequence with some individuals from Marguerite Bay, further south along the Antarctic Peninsula shelf. These relationships are also clearly visualized in Figure 3 and help explain the very high haplotype diversity: nucleotide diversity ratios. Details of the phylogeny at an individual sequence level are given in Supplementary Figure 1.
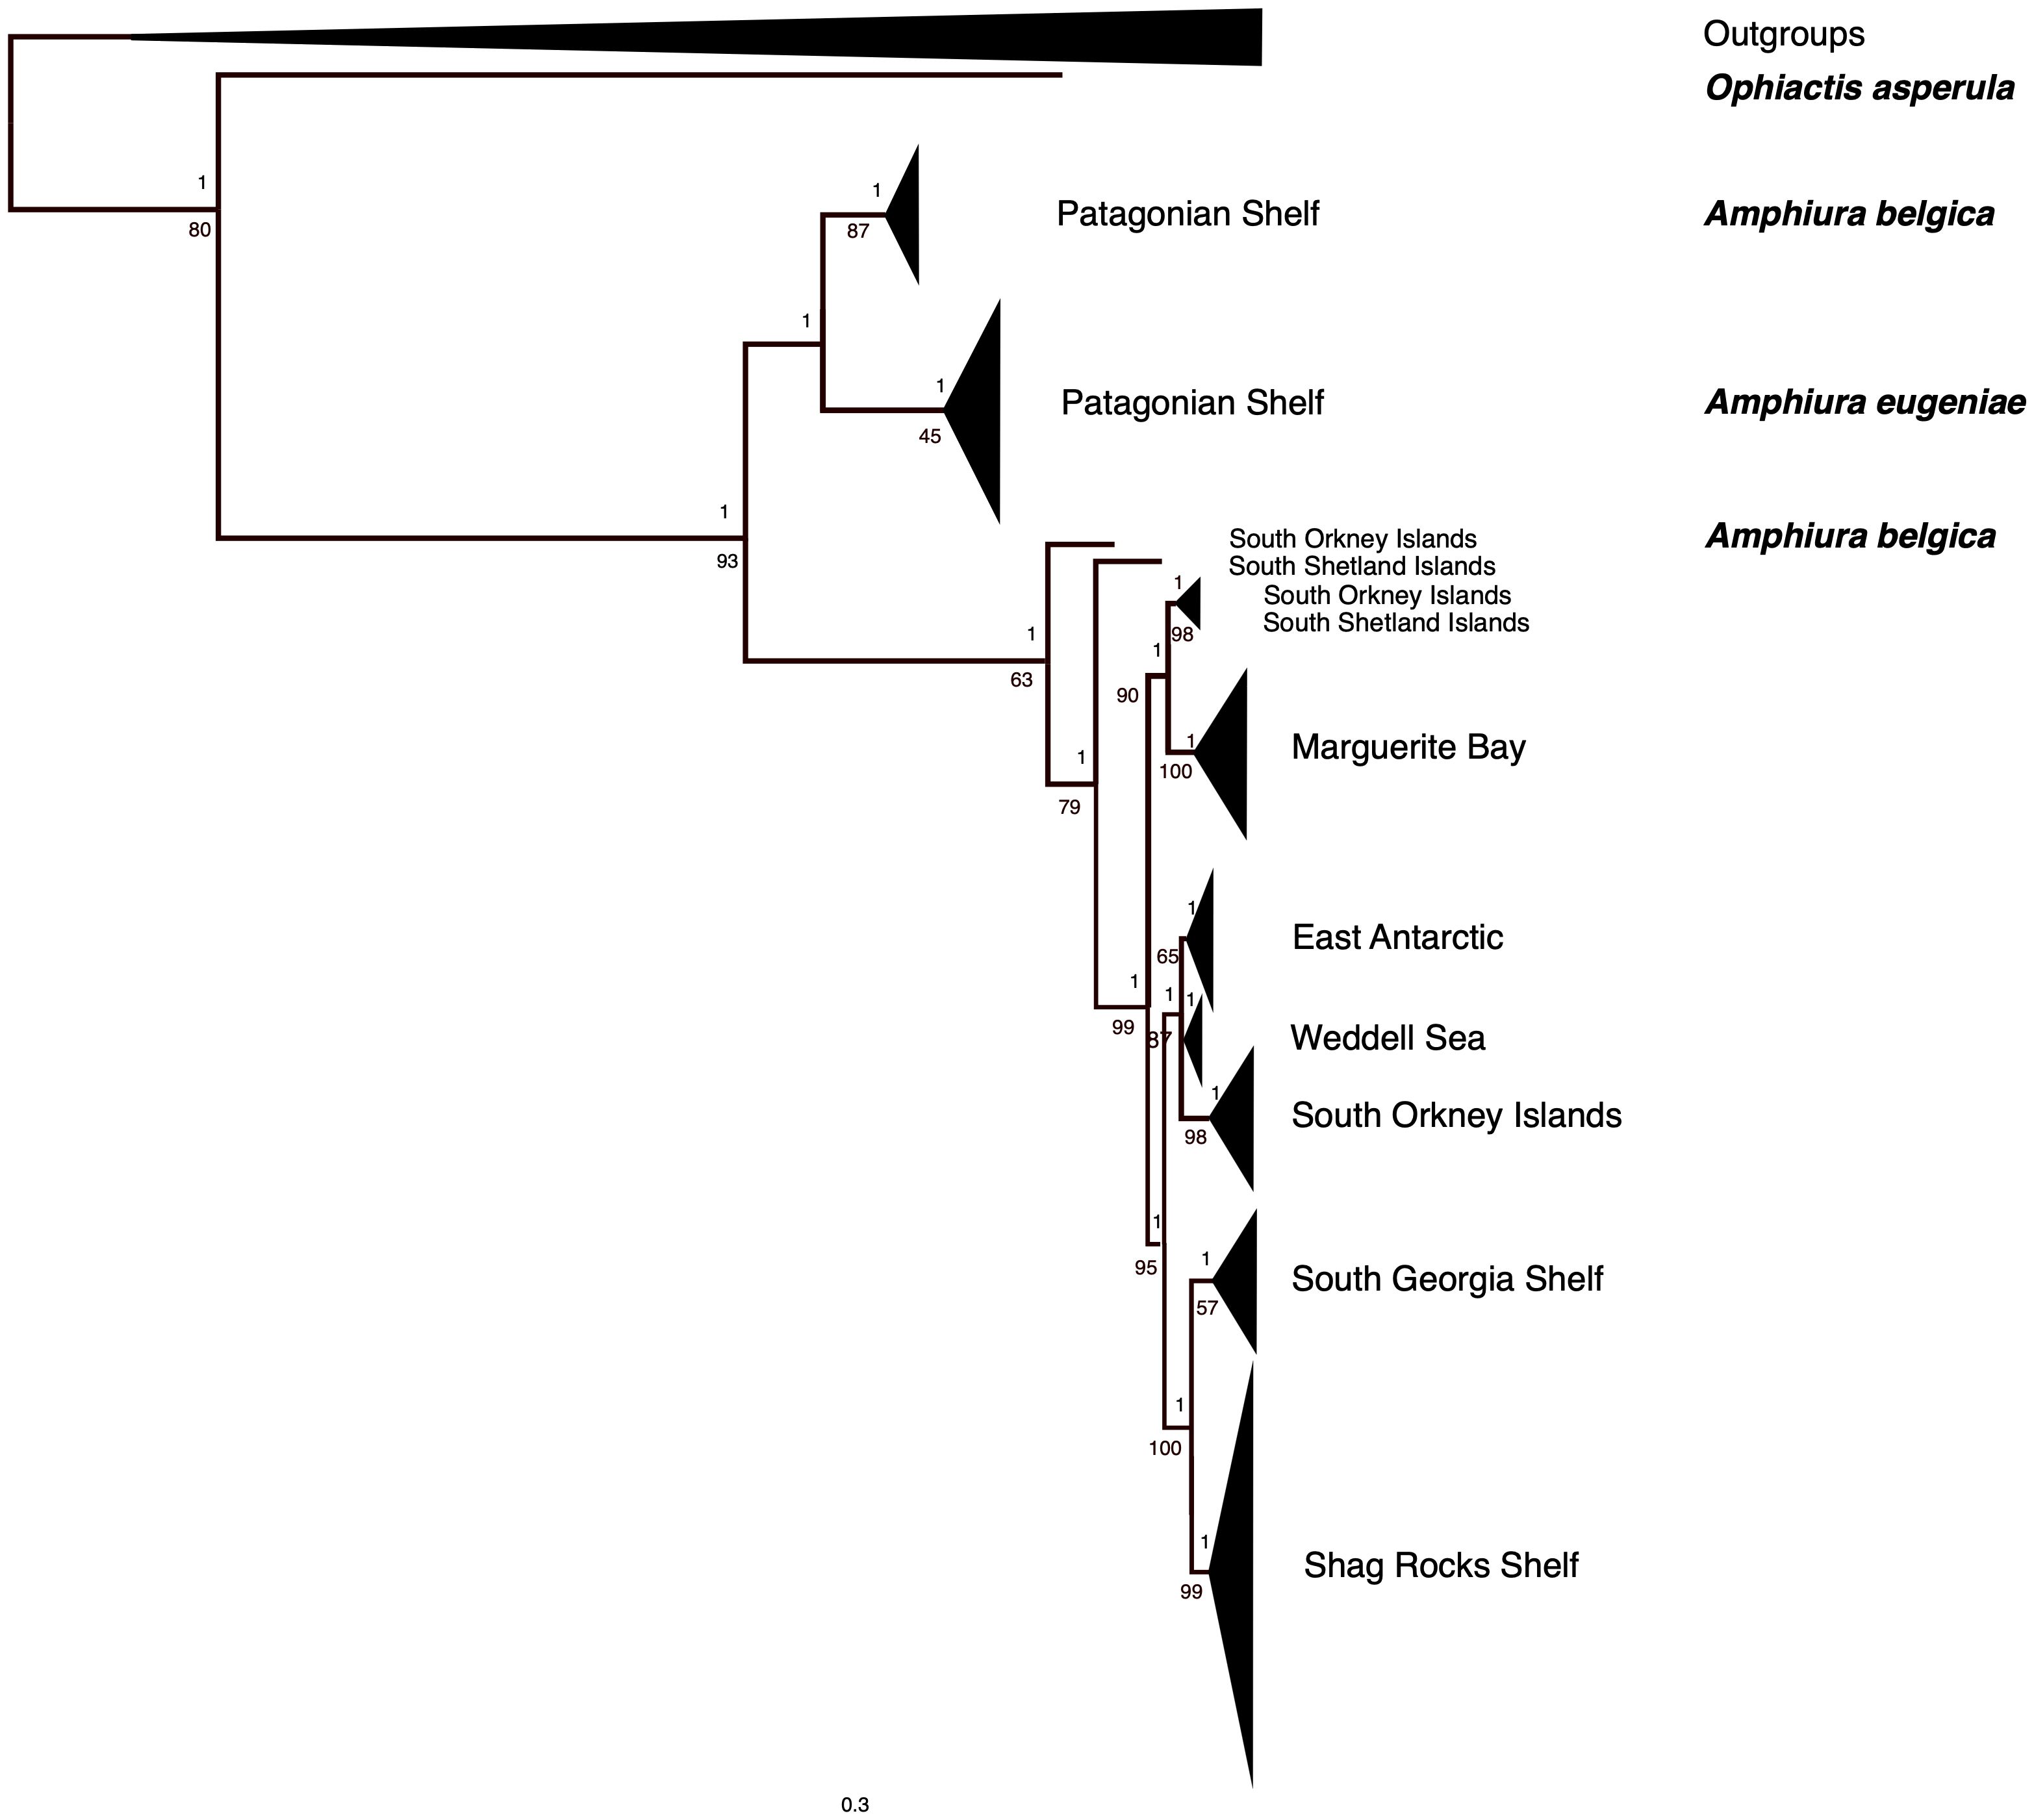
Figure 4. Maximum likelihood phylogeny of cytochrome c oxidase subunit 1 sequences of Amphiura belgicae, A. eugeniae and outgroups. Geographically supported clades were collapsed with the size of the resulting triangle proportional to the number of sequences included, and the depth of the triangle corresponds to the depth of diversity within the clade. Node support values on the top of the line are Bayesian posterior probabilities, on the bottom of the line are bootstraps. The unexpanded tree with all tip sequence identifications is available in Supplementary Figure 1.
Assuming the accuracy of the clock rate used, diversification within Amphiura belgicae began in the Pliocene, with the current geographic lineages forming in the mid- to late-Pleistocene (Figure 5). Although error associated with these analyses is large, this is similar to those divergence times estimated for the diversification of Ophiuroglypha lymani. Estimates of mean divergence times and associated error are provided in Supplementary Table 1.
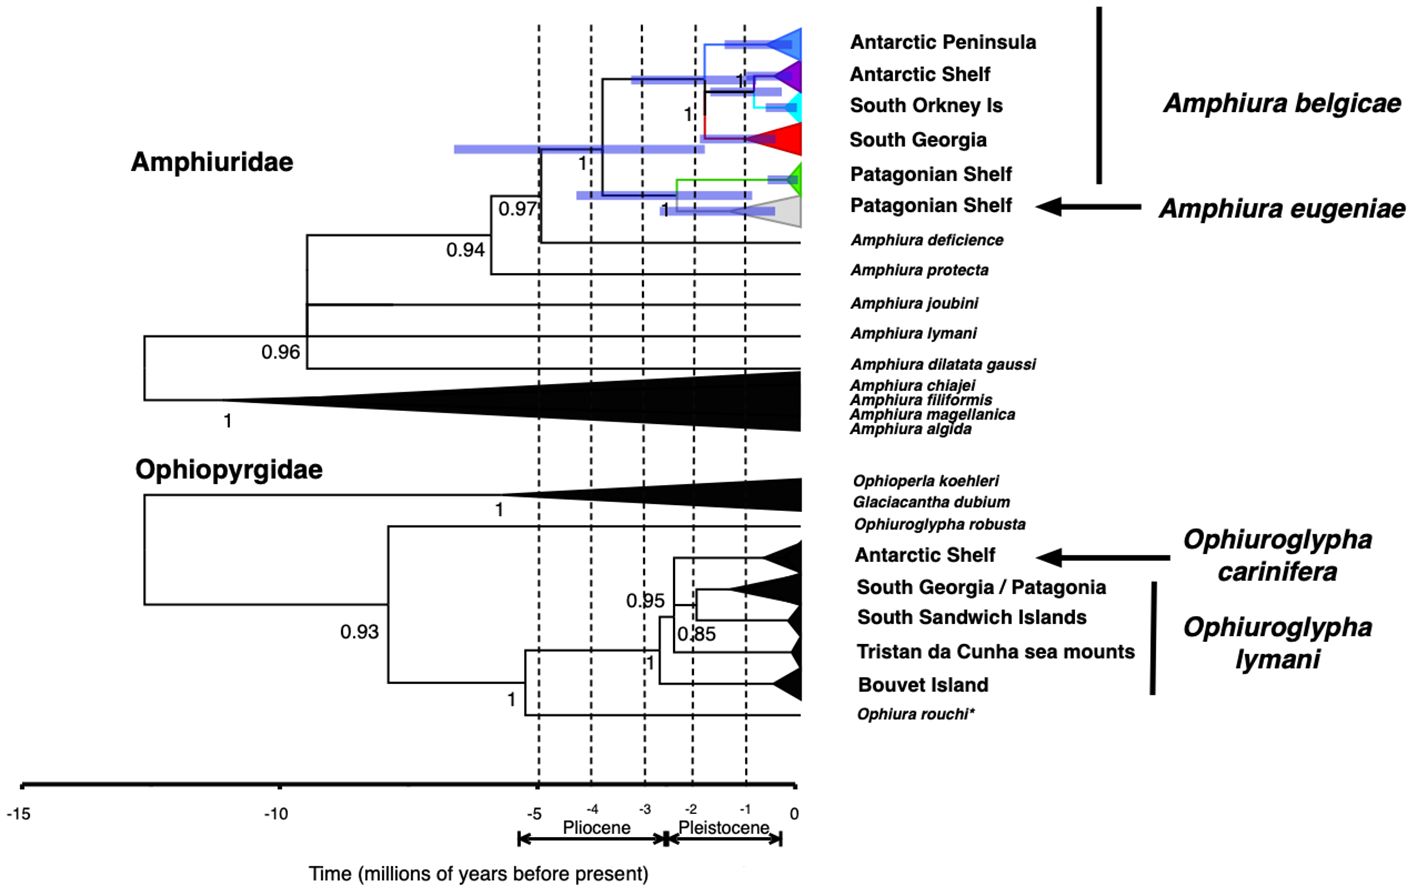
Figure 5. Bayesian phylogenies of Amphiura belgicae complex with Amphiuridae outgroups directly compared with Ophiuroglypha lymani complex and other Ophiopyrgidae outgroups. Both analyses used the same clock rate. The purple node bars represent the error at the assessed nodes. More detail for error associated with Ophiuroglypha lymani nodes can be found in Figure 7 of Sands et al. (2015). *Ophiura rouchi does not fit the characters of genus Ophiura, rather it exhibits the form of Ophiuroglypha and should be redescribed as Ophiuroglypha rouchi. This is likely to be the case for all Southern Ocean “Ophiura” species.
Population size changes as estimated by Bayesian skyline plots were associated with wide error bars, but most suggest stable or increasing population sizes over the last 300,000 years, apart from the Antarctic Peninsula which shows a slow population decline that has subsequently increased over the past 100,000 years (Figure 6). The island shelf regions of Shag Rocks, South Georgia and South Orkney Islands all show rapid population growth over the past 50,000 years. Patagonian shelf, Antarctic shelf and A. eugeniae exhibit a slower population increase over the 300,000 years.
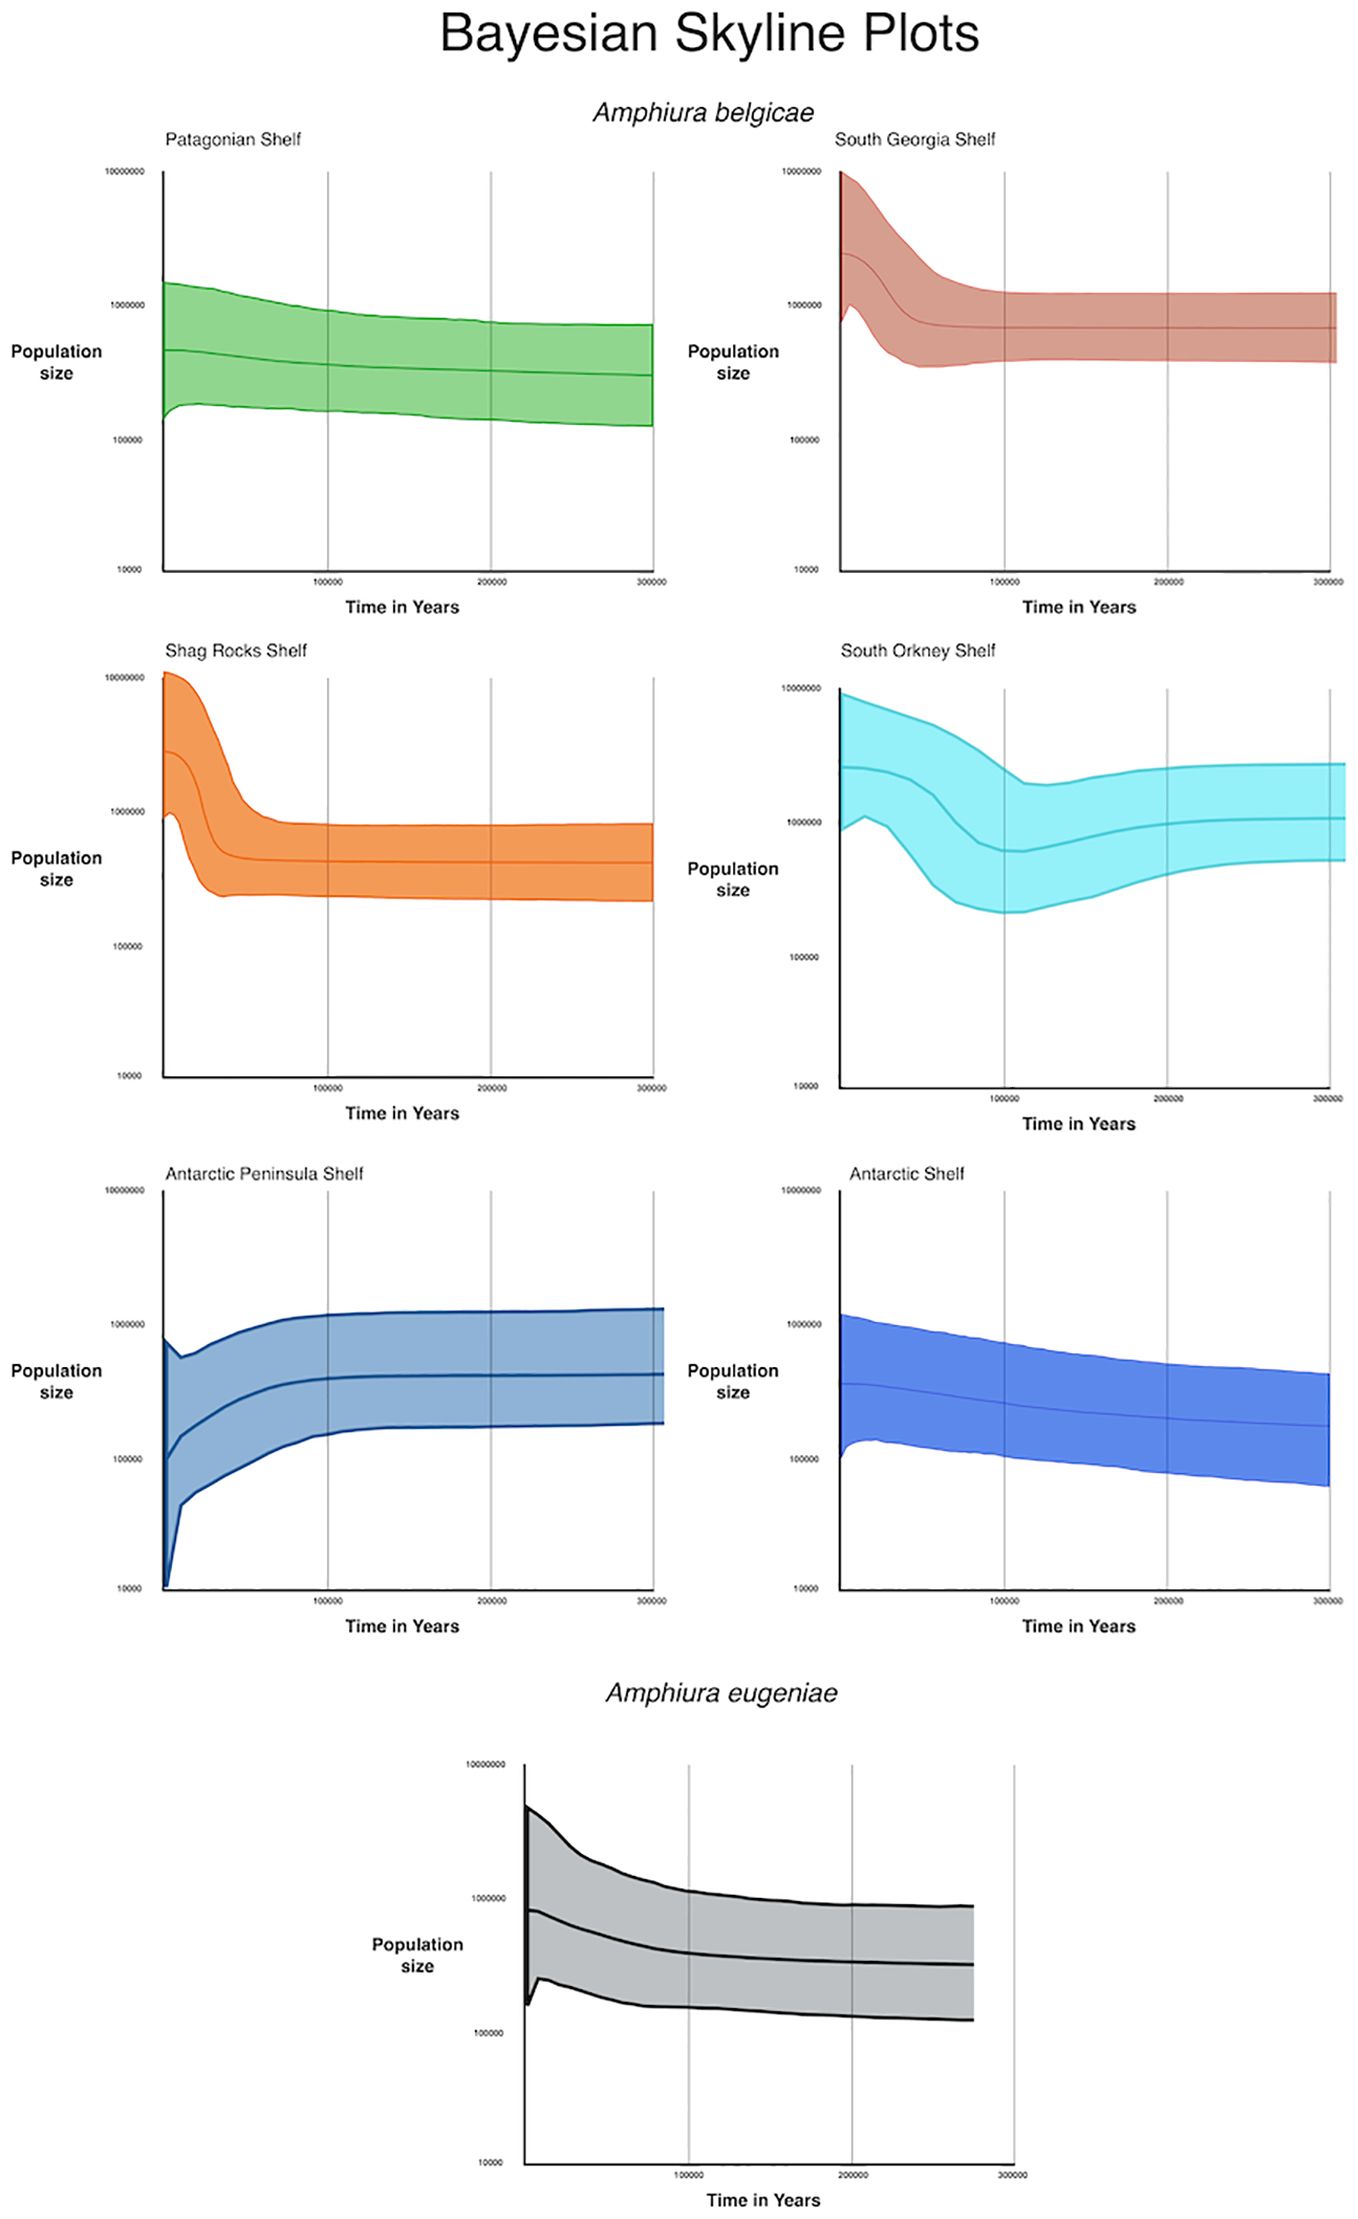
Figure 6. Bayesian skyline plots showing the estimated change in population size, with error, over time for the geographically descrete clades of Amphiura belgicae and A. eugeniae. The present is at the Y axis (X=0). The Y axis is population size in a log scale.
4 Discussion
Species level divergences that are difficult to distinguish using morphology alone appear common across the assemblages of the Southern Ocean (Hemery et al., 2012; Dietz et al., 2015; Dömel et al., 2017; Hauquier et al., 2017; González-Wevar et al., 2019). Generally, studies of Southern Ocean diversification have identified geographically structured genetic populations (Raupach and Wägele, 2006; Linse et al., 2007; Leese and Held, 2008), although there are notable exceptions where some species appear to have true circumpolar distributions (Wilson et al., 2009; McLaughlin et al., 2023). Patterns of geographically explicit probable species level diversity have also been demonstrated in previous studies of Southern Ocean brittle stars. The large snake star Astrotoma agassizi Lyman, 1875 was shown to have distinct genetic groups across the Drake Passage, with a clade found among a sample of individuals from the Antarctic Peninsula being distinct from two clades recovered from individuals sampled from the Patagonian shelf (Hunter and Halanych, 2008). Shortly after this study, evidence was found that suggested two different life history strategies were present in A. agassizi, with the Patagonian Shelf population described as brooding their young (Bernasconi, 1965), and yet lecithotrophic ophiopleutus larvae were recovered from the Ross Sea with Antarctic clade A. agassizi mitochondrial DNA (Heimeier et al., 2010). A further study extended the sample collection region around the Antarctic shelf and used single nucleotide polymorphisms (SNPs) to test the relatedness between the Antarctic clade and the two Patagonian clades (Galaska et al., 2017), confirming that the regions indeed hosted distinct populations, albeit with some hybrids present. The two Patagonian clades also appeared to represent two distinct populations. These findings prompted a further study with much broader geographic sampling across the Southern Ocean, including island shelf regions and samples of the sister species Astrotoma drachii Guille, 1979 from New Zealand waters along with other outgroups (Jossart et al., 2019). Results obtained from the latter study suggested that A. agassizi was far more diverse than previously suspected, with up to seven divergent clades. Some of these clades were specific to regions and, in one case where clade distributions overlapped, size dimorphism between clades was observed suggesting character displacement, an ecological phenomenon that occurs between sympatric sister species (Brown and Wilson, 1956). The final piece of evidence suggesting that the diversity observed represents species level distinctions was that the sister species, A. drachii mentioned above, grouped as a clade amongst all the others and was not distinct from A. agassizi.
The divergences observed in this study between geographically discrete clades of Amphiura belgicae could be considered sufficiently deep to represent species groupings, particularly that of A. belgicae sampled from the Patagonian shelf. These individuals were genetically closer to samples of A. eugeniae than they were to any of the other clades of A. belgicae. Indeed, A. eugeniae, as with Astrotoma drachii, is paraphyletic in relation to A. belgicae and should be considered as an element of the A. belgicae complex. This is a pattern that has also been recorded in the species complex of Ophiuroglypha lymani (Sands et al., 2015). In this example the sister species, Ophiuroglypha carinifera, is found only around the Antarctic continental shelf and is morphologically distinct from O. lymani, which is located on island shelves across the Southern Ocean and Patagonia. O. lymani was inferred to be a species complex as the depth of divergence among some geographically explicit clades exceeded that between O. lymani and O. carinifera.
Given the depth of divergence and the sister species being included as an ingroup, we suggest that A. belgicae is a species complex of which A. eugeniae is one element. If this is the case, and particularly if each clade were confirmed as a unique species, it presents a challenge to estimates of Southern Ocean biodiversity and richness. At present it is generally accepted that A. belgicae, O. lymani and A. agassizii are three species found across the Southern Ocean, implicitly meaning that they each have large population sizes that are well connected. Such species would be considered resilient and of little conservation concern. Our data suggest that the A. belgicae sampled in this study show regionally isolated populations on the sampled islands, which are distinctly different from the Patagonian shelf population, and even the Antarctic Peninsula shelf population is distinct from that of the shelf around the continent proper. From a conservation perspective this interpretation shifts the emphasis from a single resilient species to what would be multiple more vulnerable species. Furthermore, if this is the case for A. belgicae, O. lymani and A. agassizii, how many more members of the Southern Ocean benthic assemblage follow this pattern? Perhaps one viable approach to address this question is to consider whether there is a shared mechanism behind the pattern that can be extrapolated more widely.
Whether each clade is treated as a separate species, or only the Patagonian clade is accepted to be a distinct species, may have little effect on conservation management, at least until each species element is thoroughly morphologically investigated and formally described, which is inevitably a long and uncertain process. Methods of species delimitation may be applied but these are not always accurate, particularly in mitochondrial DNA studies (Sands et al., 2021) and have little influence in a conservation management context. However, if it can be shown that entire assemblages share patterns of unappreciated diversity, particularly if a common mechanism or process can be generally applied, then a robust model of biogeographic diversity can be presented as a management tool (Garrick et al., 2006).
To begin to explore this process, we considered some simple historical demographic characteristics of A. belgicae with O. lymani. Molecular clock analyses in general are assumption heavy and interpretation should be made with caution. This is particularly the case using a single genetic marker, but by assuming and applying a shared clock rate across studies the results can broadly be compared. Both A. belgicae and O. lymani began to diverge in the Pliocene, with clade level variation originating at the beginning of the Pleistocene (Figure 5). Although uncertainty prevents any claims of shared timings, there is sufficient evidence to further pursue this line of reasoning in more robust multi-marker studies. Poulin et al. (2014) surveyed studies of divergences between Southern Ocean invertebrates occurring either side of the Drake Passage and found divergences ranging from 6.7 to 10.9% which was equated to divergence times between 1 and 14.5 million years. Overall, it was inferred that the early Pleistocene was likely to be the onset of diversification, at least between Antarctic Peninsula and Patagonian Shelf, for most groups. This date could be seen as a minimum given the clock-rates underlying it were all faster than that used in this and other recent ophiuroid studies (Naughton et al., 2014; Sands et al., 2015; O’Hara et al., 2017; Weber et al., 2019).
Analyses of population size change show that populations of A. belgicae have been growing rapidly over the past 50,000 to 100,000 years on the island shelves of Shag Rocks, South Georgia and the South Orkney Islands. Stable or slowly growing populations are indicated on the Patagonian shelf for both A. belgicae and A. eugeniae, and also for the Antarctic shelf population of A. belgicae. Conversely, although, again, error bars are wide, the Antarctic Peninsula population shows a decrease in population size over the past 100,000 years. Due to small sample sizes only Patagonian Shelf and South Georgia shelf populations of O. lymani were analyzed, along with O. carinifera (Sands et al., 2015). All three of these populations showed signals of growth over the past 100,000 years of similar magnitudes to those seen with the rapidly growing A. begicae populations. Again, uncertainty and a strictly pattern-based observation do not give definitive answers but may be considered a pilot study providing a sound basis for further research.
Amphiura as a genus is polyphyletic in relation to the related genera Amphioplus and Amphipholis (O’Hara et al., 2017, 2018), and we suggest that it should be considered for revision. However, Amphiura is a difficult genus in general to work with, and, even in this putative species complex, the traditional characters of mouth shields, mouth papillae and tentacle papillae vary in shape, size and attitude sufficiently within each geographic region that creating a reproducible diagnosis for each genetic/geographic group will prove difficult. The species and subspecies raised by Koehler and Hertz may well be among the genetic clades identified here, but the vague language used in the descriptions, along with the character variation observed, failed to convince Mortensen (1936), and are equally unhelpful here despite our new results. Although our data appear to reject the null hypothesis of Mortensen’s single A. belgicae species, more rigorous studies using multiple nuclear markers to better clarify modern day gene flow and species tree relationships would provide a clearer and more robust assessment of the true depth of divergence of the geographic clades.
There is no doubt that the Southern Ocean benthic assemblage is old and rich, performing many important and probably also many unrecognized ecosystem services. Our results add to evidence that there is not one single Southern Ocean benthic assemblage, but rather a mosaic of assemblages, each one following an internally shared evolutionary and ecological trajectory in isolation from other assemblages. Given the difficulties in morphologically distinguishing or describing species with varying diagnostic characters, we suggest using simple phylogeographic techniques to identify regions where there is shared cryptic diversity and singling out these as biogeographic regions in need of conservation management.
Data availability statement
The data presented in the study are deposited in BOLD and accessible via the DOI:dx.doi.org/10.5883/DS-260324.
Ethics statement
Ethical approval was not required for the study involving animals in accordance with the local legislation and institutional requirements because it was not required for the specimens used in this study.
Author contributions
CS: Conceptualization, Data curation, Formal analysis, Funding acquisition, Investigation, Methodology, Project administration, Resources, Validation, Writing – original draft, Writing – review & editing. WG-C: Supervision, Validation, Writing – review & editing. SS: Supervision, Validation, Writing – review & editing. BN: Supervision, Validation, Writing – review & editing. PC: Supervision, Validation, Writing – review & editing. TO: Data curation, Resources, Validation, Writing – review & editing. RM-L: Conceptualization, Validation, Writing – review & editing.
Funding
The author(s) declare financial support was received for the research, authorship, and/or publication of this article. Funding for sequencing was largely provided by the Census of Antarctic Marine Life. Curation and taxonomic determinations were funded by SYNTAX grant and an Antarctic Science Bursary to CS.
Acknowledgments
We thank Rachel Downey and Camille Moreau for assistance sorting samples. A special thanks also to Elena Zaikina who assisted RM-L with taxonomic determinations and documentation. We would like to thank the captains and crew of the RRS James Clark Ross and FS Polarstern for assistance in collecting samples. Samples were collected during cruises JR144, JR179, JR230, JR262, JR275, PS77 and PS82.
Conflict of interest
The authors declare that the research was conducted in the absence of any commercial or financial relationships that could be construed as a potential conflict of interest.
The author P. Convey declared that they were an editorial board member of Frontiers, at the time of submission. This had no impact on the peer review process and the final decision.
Publisher’s note
All claims expressed in this article are solely those of the authors and do not necessarily represent those of their affiliated organizations, or those of the publisher, the editors and the reviewers. Any product that may be evaluated in this article, or claim that may be made by its manufacturer, is not guaranteed or endorsed by the publisher.
Supplementary material
The Supplementary Material for this article can be found online at: https://www.frontiersin.org/articles/10.3389/fevo.2024.1416418/full#supplementary-material
References
Bernasconi I. (1965). Astrotoma agassizii Lyman, especie vivípara del Atlántico sur (Ophiuroidea, Gorgonocephalidae). Contrib. Científica 015, 1Á5.
Bouckaert R., Heled J., Kühnert D., Vaughan T., Wu C.-H., Xie D., et al. (2014). BEAST 2: A software platform for bayesian evolutionary analysis. PloS Comput. Biol. 10, e1003537. doi: 10.1371/journal.pcbi.1003537
Brown W. L. Jr., Wilson E. O. (1956). Character displacement. Syst. Biol. 5, 49–64. doi: 10.2307/2411924
Clark A. M. (1970). Notes on the family Amphiuridae (Ophiuroidea). Bull. Br. Museum (Natural History) Zoology. 19, 1–81. doi: 10.5962/bhl.part.24085
Dietz L., Arango C. P., Dömel J. S., Halanych K. M., Harder A. M., Held C., et al. (2015). Regional differentiation and extensive hybridization between mitochondrial clades of the Southern Ocean giant sea spider Colossendeis megalonyx. Open Sci. 2, 140424. doi: 10.1098/rsos.140424
Dirzo R., Ceballos G., Ehrlich P. R. (2022). Circling the drain: the extinction crisis and the future of humanity. Philos. Trans. R. Soc B Biol. Sci. 377, 20210378. doi: 10.1098/rstb.2021.0378
Dömel J. S., Melzer R. R., Harder A. M., Mahon A. R., Leese F. (2017). Nuclear and mitochondrial gene data support recent radiation within the sea spider species complex Pallenopsis patagonica. Front. Ecol. Evol. 4. doi: 10.3389/fevo.2016.00139
Drummond A. J., Rambaut A., Shapiro B., Pybus O. G. (2005). Bayesian coalescent inference of past population dynamics from molecular sequences. Mol. Biol. Evol. 22, 1185–1192. doi: 10.1093/molbev/msi103
Edgar R. C. (2004). MUSCLE: a multiple sequence alignment method with reduced time and space complexity. BMC Bioinf. 5, 113. doi: 10.1186/1471-2105-5-113
Fu Y. (1996). New statistical tests of neutrality for DNA samples from a population. Genetics 143, 557–570. doi: 10.1093/genetics/143.1.557
Fu Y.-X. (1997). Statistical tests of neutrality of mutations against population growth, hitchhiking and background selection. Genetics 147, 915–925. doi: 10.1093/genetics/147.2.915
Galaska M. P., Sands C. J., Santos S. R., Mahon A. R., Halanych K. M. (2017). Crossing the divide: admixture across the antarctic polar front revealed by the brittle star Astrotoma agassizii. Biol. Bull. 198–211. doi: 10.1086/693460
Garrick R. C., Sands C. J., Sunnucks P. (2006). The use and application of phylogeography for invertebrate conservation research and planning, in Insect biodiversity and dead wood: Proceedings of a symposium for the 22nd International Congress of Entomology (Asheville, NC, USA), 15–22.
González-Wevar C. A., Gérard K., Rosenfeld S., Saucède T., Naretto J., Díaz A., et al. (2019). Cryptic speciation in Southern Ocean Aequiyoldia eightsii (Jay 1839): Mio-Pliocene trans-Drake Passage separation and diversification. Prog. Oceanogr. 174, 44–54. doi: 10.1016/j.pocean.2018.09.004
Goodall-Copestake W. P., Tarling G. A., Murphy E. J. (2012). On the comparison of population-level estimates of haplotype and nucleotide diversity: a case study using the gene cox1 in animals. Heredity. 109 (1), 50–56. doi: 10.1038/hdy.2012.12
Hauquier F., Leliaert F., Rigaux A., Derycke S., Vanreusel A. (2017). Distinct genetic differentiation and species diversification within two marine nematodes with different habitat preference in Antarctic sediments. BMC Evol. Biol. 17, 120. doi: 10.1186/s12862-017-0968-1
Heimeier D., Lavery S., Sewell M. A. (2010). Molecular species identification of Astrotoma agassizii from planktonic embryos: further evidence for a cryptic species complex. J. Hered. 101, 775–779. doi: 10.1093/jhered/esq074
Hemery L. G., Eléaume M., Roussel V., Améziane N., Gallut C., Steinke D., et al. (2012). Comprehensive sampling reveals circumpolarity and sympatry in seven mitochondrial lineages of the Southern Ocean crinoid species Promachocrinus kerguelensis (Echinodermata). Mol. Ecol. 21, 2502–2518. doi: 10.1111/j.1365-294X.2012.05512.x
Hertz M. (1927). Die ophiuroiden der deutschen südpolar-expedition 1901-1903. Dtsch. Südpolar-Exped. 19, 1–56.
Hunter R. L., Halanych K. M. (2008). Evaluating connectivity in the brooding brittle star Astrotoma agassizii across the Drake Passage in the Southern Ocean. J. Hered. 99, 137–148. doi: 10.1093/jhered/esm119
Jossart Q., Sands C. J., Sewell M. A. (2019). Dwarf brooder versus giant broadcaster: combining genetic and reproductive data to unravel cryptic diversity in an Antarctic brittle star. Heredity 123, 622–633. doi: 10.1038/s41437-019-0228-9
Koehler R. (1900). Note préliminaire sur les Echinides et les Ophiures de l’Expédition antarctique belge. impr: Hayez.
Koehler R. (1901). Expédition Antarctique Belge. Résultats du voyage de S. Y. “Belgica” en 1897-98-99. Echinides et Ophiures. Zoologie, 1–42.
Koehler R. (1908a). Astéries, Ophiures et Échinides de l’Expédition Antarctique Nationale Écossaise. Trans. R. Soc Edinb. 46, 529–649.
Koehler R. (1908b). Asteries, Ophiures et Echinides recueillis dans les mers australes par la “Scotia. (1902-1904. Zool. Anz. 32, 140–147.
Koehler R. (1922). Echinodermata ophiuroidea (Sydney: Printed by John Spence). Available at: https://www.biodiversitylibrary.org/item/44167. doi: 10.5962/bhl.title.11722
Kumar S., Stecher G., Li M., Knyaz C., Tamura K. (2018). MEGA X: molecular evolutionary genetics analysis across computing platforms. Mol. Biol. Evol. 35, 1547–1549. doi: 10.1093/molbev/msy096
Leese F., Held C. (2008). Identification and characterization of microsatellites from the Antarctic isopod Ceratoserolis trilobitoides: nuclear evidence for cryptic species. Conserv. Genet. 9, 1369–1372. doi: 10.1007/s10592-007-9491-z
Leigh J. W., Bryant D. (2015). popart: full-feature software for haplotype network construction. Methods Ecol. Evol. 6, 1110–1116. doi: 10.1111/2041-210X.12410
Librado P., Rozas J. (2009). DnaSP v5: a software for comprehensive analysis of DNA polymorphism data. Bioinformatics 25, 1451–1452. doi: 10.1093/bioinformatics/btp187
Linse K., Cope T., Lörz A.-N., Sands C. J. (2007). Is the Scotia Sea a centre of Antarctic marine diversification? Some evidence of cryptic speciation in the circum-Antarctic bivalve Lissarca notorcadensis (Arcoidea: Philobryidae). Polar Biol. 30, 1059–1068. doi: 10.1007/s00300-007-0265-3
Ljungman A. V. (1871). Om tvänne nya arter. Ophiurider Öfversigt af Kungliga Vetenskapsakademiens Förhandlingar. 1870, 5, 471–476.
Ljungman A. V. (1867). Ophiuroidea viventia huc usque cognita, enumerat (Öfversigt af Kgl. Vetenskaps-Akademiens Förhandlingar 1866) 23, 303–336.
Lyman T. (1875). Zoological results of the Hassler expedition: ophiuridae and astrophytidae. (Vol. 2). (Cambridge USA: University Press).
Martín-Ledo R., Sands C. J., López-González P. J. (2013). A new brooding species of brittle star (Echinodermata: Ophiuroidea) from Antarctic waters. Polar Biol. 36, 115–126. doi: 10.1007/s00300-012-1242-z
McLaughlin E. L., Wilson N. G., Rouse G. W., McLaughlin E. L., Wilson N. G., Rouse G. W. (2023). Resolving the taxonomy of the Antarctic feather star species complex Promachocrinus ‘kerguelensis’ (Echinodermata: Crinoidea). Invertebr. Syst. 37, 498–527. doi: 10.1071/IS22057
Mortensen T. (1924). Echinoderms of New Zealand and the auckland-campbell islands: II. Ophiuroidea (Videnskabelige Meddelelser fra Dansk Naturhistorisk Forening) 77, 91–177.
Mortensen T. (1936). Echinoidea and Ophiuroidea, in Discovery reports (Cambridge, UK: Cambridge), 199–348.
Naughton K. M., O’Hara T. D., Appleton B., Cisternas P. A. (2014). Antitropical distributions and species delimitation in a group of ophiocomid brittle stars (Echinodermata: Ophiuroidea: Ophiocomidae). Mol. Phylogenet. Evol. 78, 232–244. doi: 10.1016/j.ympev.2014.05.020
O’Hara T. D., Hugall A. F., Thuy B., Stöhr S., Martynov A. V. (2017). Restructuring higher taxonomy using broad-scale phylogenomics: The living Ophiuroidea. Mol. Phylogenet. Evol. 107, 415–430. doi: 10.1016/j.ympev.2016.12.006
O’Hara T. D., Stöhr S., Hugall A. F., Thuy B., Martynov A. (2018). Morphological diagnoses of higher taxa in Ophiuroidea (Echinodermata) in support of a new classification. Eur. J. Taxon. 1–35. doi: 10.5852/ejt.2018.416
Poulin E., González-Wevar C., Díaz A., Gérard K., Hüne M., Part B. (2014). Divergence between Antarctic and South American marine invertebrates: What molecular biology tells us about Scotia Arc geodynamics and the intensification of the Antarctic Circumpolar Current. Glob. Planet. Change 123, 392–399. doi: 10.1016/j.gloplacha.2014.07.017
Rambaut A. (2009). FigTree. Tree figure drawing tool. http://tree.bio.ed.ac.uk/software/figtree.
Ramos-Onsins S. E., Rozas J. (2002). Statistical properties of new neutrality tests against population growth. Mol. Biol. Evol. 19, 2092–2100. doi: 10.1093/oxfordjournals.molbev.a004034
Raupach M. J., Wägele J. W. (2006). Distinguishing cryptic species in Antarctic Asellota (Crustacea: Isopoda)-a preliminary study of mitochondrial DNA in Acanthaspidia drygalskii. Antarct. Sci. 18, 191–198. doi: 10.1017/S0954102006000228
Ronquist F., Teslenko M., van der M. P., Ayres D. L., Darling A., Höhna S., et al. (2012). MrBayes 3.2: Efficient bayesian phylogenetic inference and model choice across a large model space. Syst. Biol. 61, 539–542. doi: 10.1093/sysbio/sys029
Rozas J., Sanchez-DelBarrio J. C., Messeguer X., Rozas R. (2003). DnaSP, DNA polymorphism analyses by the coalescent and other methods. (Oxford, UK: Oxford Univ Press). doi: 10.1093/bioinformatics/btg359
Sands C. J., O’Hara T., Barnes D. K. A., Martín-Ledo R. (2015). Against the flow: evidence of multiple recent invasions of warmer continental shelf waters by a Southern Ocean brittle star. Evol. Popul. Genet. 3. doi: 10.3389/fevo.2015.00063
Sands C. J., O’Hara T. D., Martín-Ledo R. (2021). Pragmatic assignment of species groups based on primary species hypotheses: the case of a dominant component of the Southern Ocean benthic fauna. Front. Mar. Sci. 8. doi: 10.3389/fmars.2021.723328
Sands C. J., Zwerschke N., Bax N., Barnes D. K. A., Moreau C., Downey R., et al. (2023). PERSPECTIVE • The growing potential of antarctic blue carbon. Oceanography 36. doi: 10.5670/oceanog.2023.s1.5
Stamatakis A. (2014). RAxML version 8: A tool for phylogenetic analysis and post-analysis of large phylogenies. Bioinformatics 30, 1312–1313. doi: 10.1093/bioinformatics/btu033
Tajima F. (1989). Statistical method for testing the neutral mutation hypothesis by DNA polymorphism. Genetics 123, 585–595. doi: 10.1093/genetics/123.3.585
Templeton A. R., Crandall K. A., Sing C. F. (1992). A cladistic analysis of phenotypic associations with haplotypes inferred from restriction endonucleaase mapping and DNA sequence data. III. Cladogram estimation. Genetics 132, 619–633. doi: 10.1093/genetics/132.2.619
Weber A. A.-T., Stöhr S., Chenuil A. (2019). Species delimitation in the presence of strong incomplete lineage sorting and hybridization: Lessons from Ophioderma (Ophiuroidea: Echinodermata). Mol. Phylogenet. Evol. 131, 138–148. doi: 10.1016/j.ympev.2018.11.014
Keywords: diversity, taxonomy, conservation biology, speciation, benthos, Ophiuroidea, Southern Ocean
Citation: Sands CJ, Goodall-Copestake WP, Stöhr S, Narayanaswamy BE, Convey P, O’Hara TD and Martín-Ledo R (2024) The diverse and widespread Southern Ocean ophiuroid Amphiura belgicae should be considered a species complex. Front. Ecol. Evol. 12:1416418. doi: 10.3389/fevo.2024.1416418
Received: 12 April 2024; Accepted: 25 July 2024;
Published: 19 August 2024.
Edited by:
Rubén G. Mateo, Autonomous University of Madrid, SpainReviewed by:
Lenaig G. Hemery, Pacific Northwest National Laboratory (DOE), United StatesAmanda Cunha, Universidade Federal de Viçosa, Brazil
Copyright © 2024 Sands, Goodall-Copestake, Stöhr, Narayanaswamy, Convey, O’Hara and Martín-Ledo. This is an open-access article distributed under the terms of the Creative Commons Attribution License (CC BY). The use, distribution or reproduction in other forums is permitted, provided the original author(s) and the copyright owner(s) are credited and that the original publication in this journal is cited, in accordance with accepted academic practice. No use, distribution or reproduction is permitted which does not comply with these terms.
*Correspondence: Chester J. Sands, Y2pzYW5AYmFzLmFjLnVr