
94% of researchers rate our articles as excellent or good
Learn more about the work of our research integrity team to safeguard the quality of each article we publish.
Find out more
ORIGINAL RESEARCH article
Front. Ecol. Evol. , 27 June 2024
Sec. Urban Ecology
Volume 12 - 2024 | https://doi.org/10.3389/fevo.2024.1411290
 Xiaoyan Ren
 Fengying Yan*
Sustainable spatial planning increasingly emphasizes the protection and restoration provided by nature to human welfare, yet scientifically assessing and managing the societal utilization status of natural ecological assets (EAs) remains a challenge. This study introduces a novel classification of EAs based on the degree of dependency of human societies, and establishes an assessment framework for the spatial utilization status of EAs, incorporating indicators related to “pattern-quality-supply-demand-risk”. These indicators are integrated into the construction of ecological security patterns to optimize the management of EAs. Validated in Changxing County, Zhejiang Province, China, key findings include: (1) In 2020, the EAs of Changxing provided a value of CNY 77.936 billion, with livable climate assets dominating and carbon assets least prevalent. (2) Urban development has led to EA loss, with the most significant losses in high-supply areas and the highest loss risks in areas with scarce EAs, yet maintaining an overall balance of supply and demand. (3) In 2020, the total area of EA sources in Changxing was 487.34 km², accounting for 34% of the total land area, with 42.34% classified as high-security zones and 11.21% as high-alert zones. This study proposes an approach to ecological spatial optimization management that integrates the spatial utilization status of EAs, providing planners with practical tools and illustrative cases for seamlessly incorporating localized ecological elements into spatial planning. Our research applies to regions facing challenges related to EA loss and striving for sustainable development, offering strategies for ecological restoration, compensation, and optimization management.
Urbanization and industrialization have globally disrupted ecosystems, impacting human welfare and shrinking agricultural and ecological spaces due to ongoing urban expansion (Liu and Yang, 2012; Liu et al., 2017). This exacerbates development conflicts across urban, agricultural, and ecological areas, undermining sustainable territorial development (Newbold et al., 2015; Kindu et al., 2016) and leading to natural resource depletion, energy and food supply imbalances, human–land conflicts, and climate change (Costanza et al., 2014; Su et al., 2016). Diverse ecosystem services provided by natural resources and ecological environments are essential for human and socio-economic sustainability (Daily et al., 2009; Xepapadeas, 2011; Raheem and de Carvalho, 2022), yet their variations are often neglected in economic, spatial planning, and ecological policies (Obst and Vardon, 2014; Liang et al., 2023). Effective ecological management, including functional zoning, green infrastructure, and ecological security maintenance, emerges as a prime natural-based solution (Gonzalez et al., 2017; Luo et al., 2021; Hoover et al., 2023) Recognizing natural resources as pivotal in ecosystem material and energy cycles (Barbier, 2019), a social usage assessment based on EA can guide stakeholders in understanding and balancing ecological welfare, enhancing ecological decision-making, and sustainable spatial planning.
Following Costanza et al.’s (1997) foundational work on ecosystem service principles and valuation, leading to global ecosystem service value mapping, the field has seen intensive exploration in the valuation of ecosystem services, spawning concepts like natural capital, Ecosystem Service Value (ESV), and Gross Ecosystem Product (GEP) (Remme et al., 2015; Zou et al., 2020; Jiang et al., 2021; Shen et al., 2021). Research in developed countries has predominantly focused on integrating natural capital valuation into environmental-economic accounting frameworks, utilizing Natural Capital Accounting (NCA), Ecosystem Service Assessment (ESA), and market and non-market valuation methods (Farber et al., 2002; Acosta et al., 2020; Capriolo et al., 2020). NCA quantifies ecosystem service values by measuring natural resource stocks and flows, aiming to incorporate these values into national economic accounts (Hein et al., 2020; Fleming et al., 2022), while ESA combines quantitative and qualitative methods to assess ecosystem services’ socio-economic contributions, emphasizing their critical role in human welfare (Kremen and Ostfeld, 2005; Ayanu et al., 2012). Ecosystem services are valued using market pricing and non-market valuation methods (Schägner et al., 2013). Despite extensive research aiding ecosystem service valuation, the understanding of its response to urban development remains limited, yet it is crucial for integrating natural elements into spatial and ecological policy-making (Zank et al., 2016; Lourdes et al., 2022).
In response to valuing ecosystem services, the concept of ecological assets (EAs) has become a key quantitative tool in natural resource management (Zheng et al., 2019; Yang et al., 2021). Significant advancements have been made in defining, categorizing, and assessing EAs, with Gao emphasizing their encompassment of natural resource and ecosystem service values (Gao et al., 2020), and Hein focusing on their utility attributes as crucial components of natural resource assets (Hein et al., 2016). Despite ongoing research, a distinct classification system for measuring EA usage remains undeveloped (Gao et al., 2020). Current accounting methods, integrating remote sensing and ecological models (Ouyang et al., 2016; Cao et al., 2022; Li et al., 2023), and most assessment studies primarily focus on the spatial dynamics of physical and value quantities (Cao et al., 2022; Li et al., 2022), yet comprehensive assessments linking to ecological space management are still lacking, limiting their applicability in guiding sustainable urban ecological management.
Current sustainable spatial planning emphasizes the role of nature in human well-being, focusing on the protection and restoration of ecosystems to enhance ecosystem services (Wang et al., 2023). Research has shown that optimizing ecological spatial patterns can improve ecological functions and benefits while maintaining ecological security patterns is crucial for well-being (Loro et al., 2015; Men and Pan, 2023). However, the prevalent “source identification-resistance surface construction-ecological corridor extraction” method often overlooks the value attributes within ecological security patterns (Gao et al., 2021; Pan et al., 2022), neglecting the critical link between ecological sources and socio-economic development. This oversight poses challenges for effectively managing natural well-being and mitigating ecological degradation. China’s urbanization has entered a stage of high-quality development, with counties serving as the primary frontiers in the latter phase of this process. A critical scientific issue in urban ecology is how spatial planning decisions can regulate and enhance the ecological welfare benefits of cities. Incorporating the social value attributes of EAs into the construction of ecological security patterns allows for a comprehensive understanding of the supply and utilization of ecological welfare. This approach aids planners in integrating ecological factors into spatial planning and asset management. Based on the above discussion, this study addresses the following research questions: (1) How can the types of EAs be defined to accurately identify and map these assets at temporal and spatial scales? (2) How can comprehensive assessment indicators be established to measure the sustainability of regional EAs? (3) How can the social utilization of EAs be incorporated into regional ecological management and pattern optimization to inform policy-making for spatial regulation? In light of these questions, this study proposes the following hypotheses: (1) Clearly defining the types of EAs will enable precise characterization of the social utilization of different types of EAs; (2) Integrating a more comprehensive assessment of EA development can provide stronger support for regional ecological management decisions; (3) Proposing a systematic framework (Figure 1) that facilitates the incorporation of EA assessment results into regional ecological management and the optimization of ecological security patterns will offer valuable insights for advancing the theory and practice of ecological spatial planning.
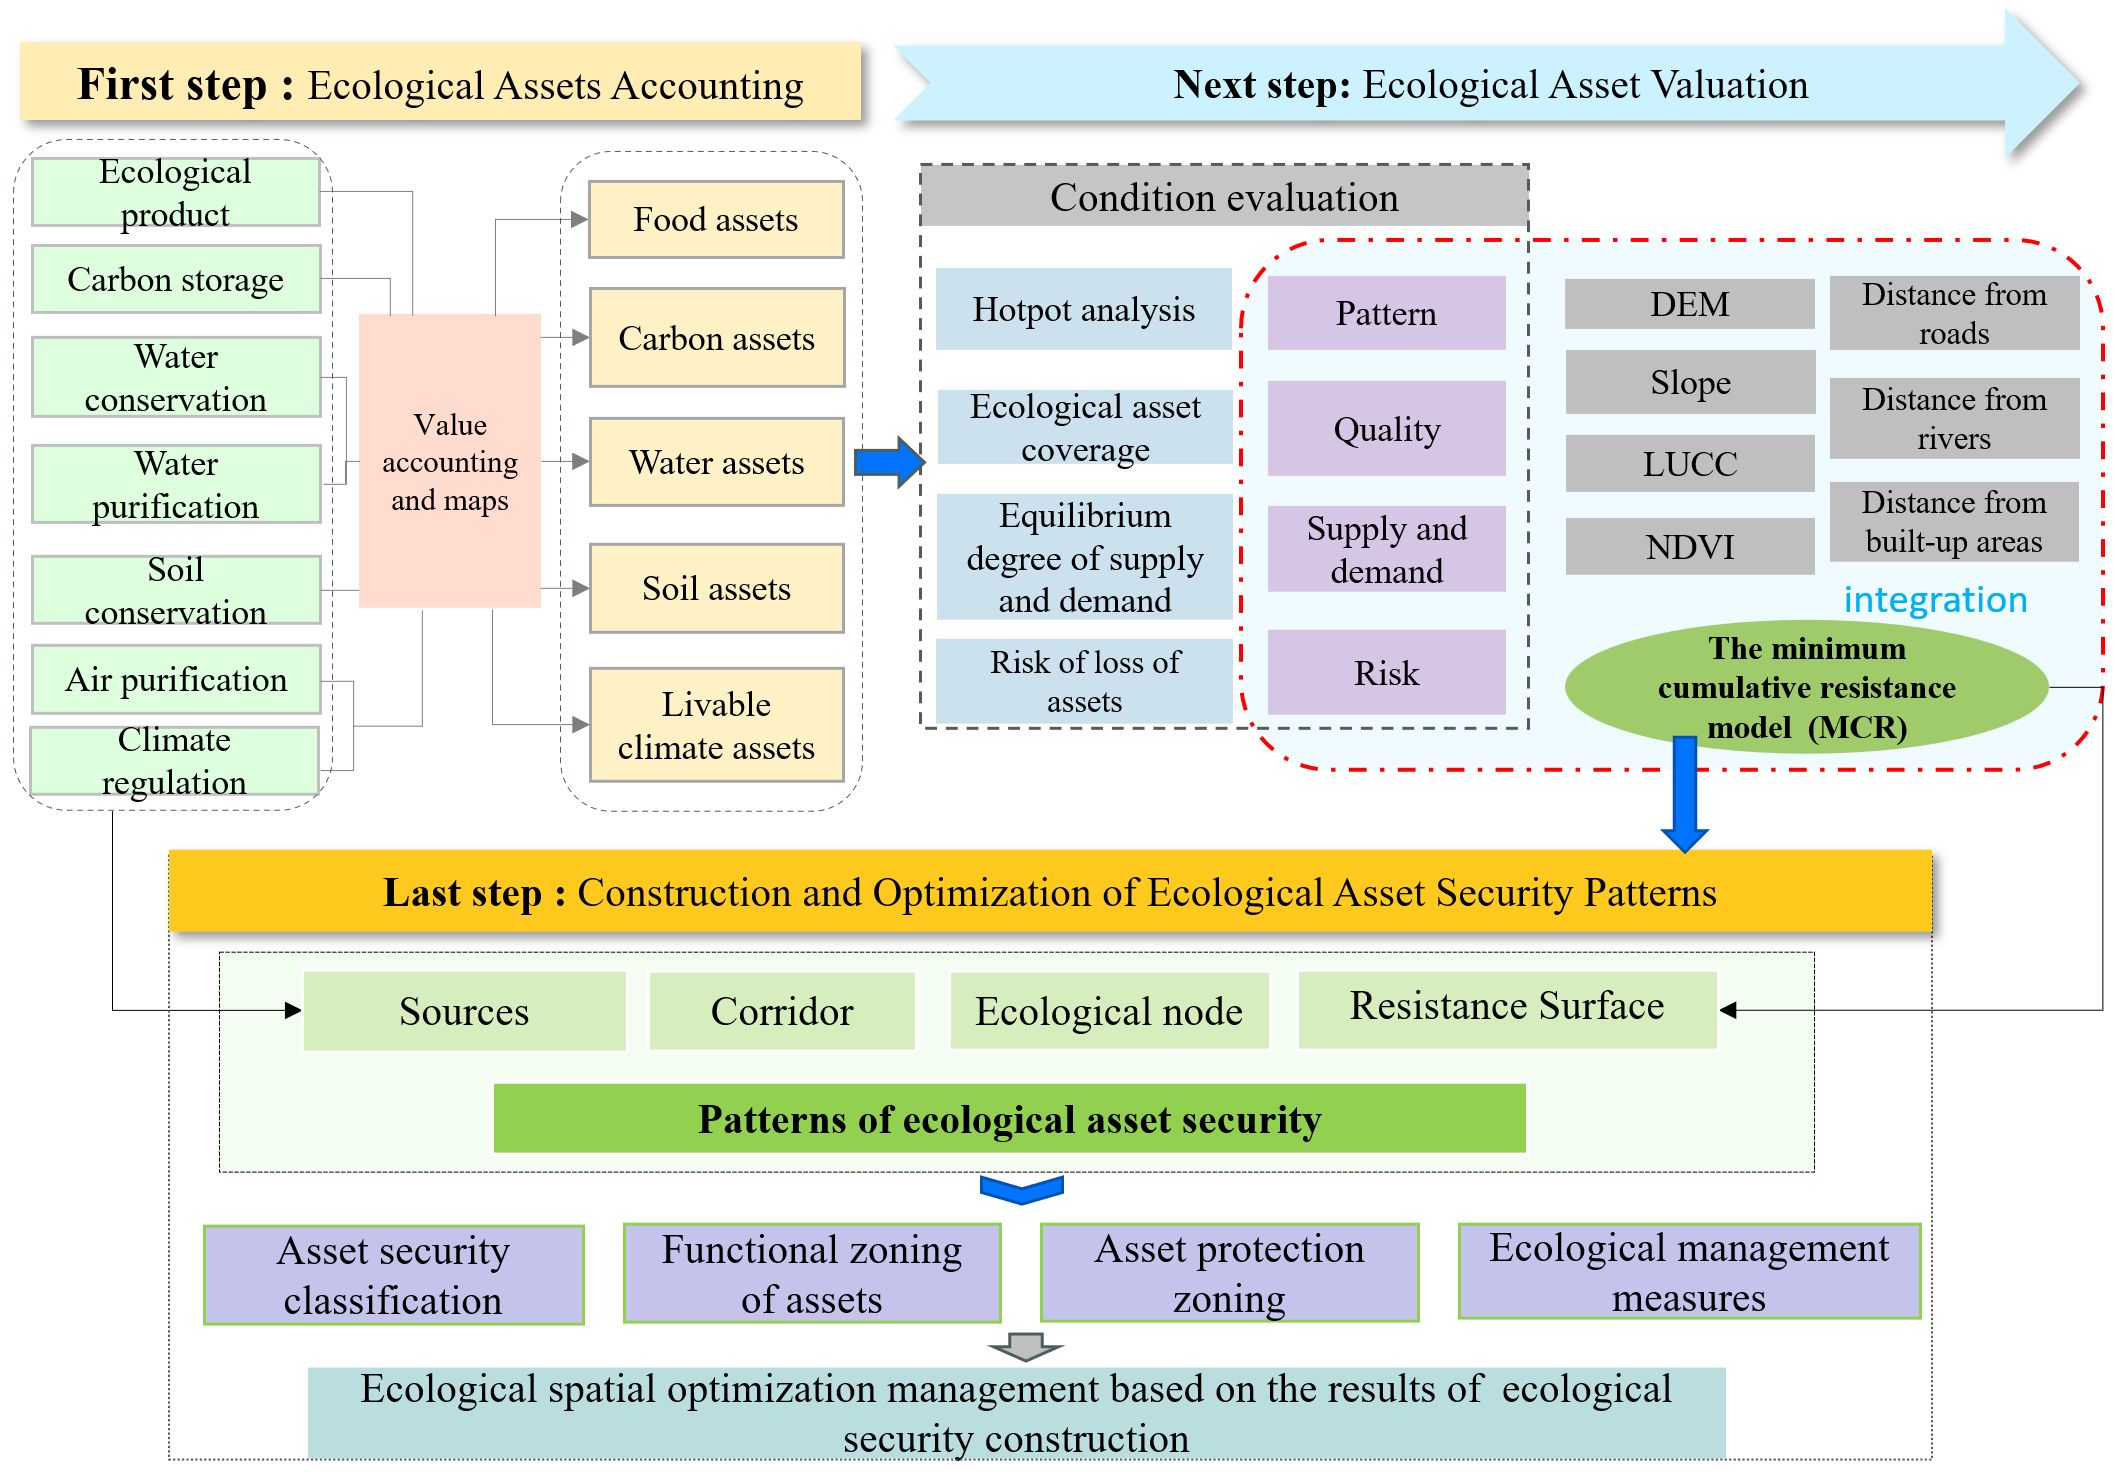
Figure 1 The applied methodological framework in this study outlines the steps taken to account for seven types of ecosystem services, forming five categories of EAs, and incorporating the accounting assessment results into the steps of regional ecological security pattern optimization and management.
EA integrates the intrinsic value of natural resources with the benefits of ecosystem services, encompassing all ecological welfare utilized by human societies (Raymond et al., 2009; Gómez-Baggethun and Groot, 2010). This study comprehensively examines the inherent characteristics of EAs (Bowers et al., 2011; Lin et al., 2015), starting from the degree of dependence on human societal usage, while integrating operability and measurability. EAs are categorized into five types: food, carbon, water, soil, and Livable climate assets. This categorization forms the foundation for their accounting and assessment.
Food assets are digestible substances produced by ecosystems, exchangeable for money, and consumed by humans or animals. They fulfill physiological and biochemical energy requirements and provide direct, indirect, or potential economic benefits as ecological economic resources.
Carbon assets refer to the quantifiable carbon fixed in plants or soil by natural ecosystems, absorbing atmospheric CO2 and synthesizing organic matter, creating tradable resources and value in the market.
Water assets encompass the economic value of water volume retention and quality enhancement functions of natural ecosystems, including the market value from water conservation and purification.
Soil assets include the market value generated by soil conservation functions within ecosystems, such as forests and grasslands, involving layers like canopy and roots that protect soil, reduce erosion, and maintain soil functionality.
Livable climate assets denote the market value and resources derived from ecosystems’ functions in lowering temperatures, increasing air humidity, purifying air, and enhancing human habitat comfort.
Zhejiang Province, an integral part of China’s Yangtze River Delta, is distinguished for its strategic significance in economic, cultural, and ecological realms, exemplifying a balanced approach to economic growth and ecological protection (Zhang et al., 2014). Changxing, a top-tier economic county within Huzhou City, Zhejiang, is strategically positioned between Suzhou and Hangzhou, by the southwest shore of Lake Tai (Figure 2). It lies between 30°43′–31°11′ N latitude and 119°33′–120°06′ E longitude, featuring a subtropical maritime monsoon climate with an average annual temperature of 15.6°C and annual rainfall of about 1300mm. Covering 1430 km2 and overseeing 3 subdistricts, 9 towns, and 2 townships, Changxing boasts diverse ecological landscapes including mountains, hills, lakes, rivers, and coastlines. These rich ecological resources hold immense significance in EA assessment and accounting, providing multifaceted data and cases essential for a comprehensive evaluation of different ecosystem types’ contributions to the economy and society. Thus, Changxing serves as an ideal model for EA accounting and management exploration, offering insights applicable to other regions.
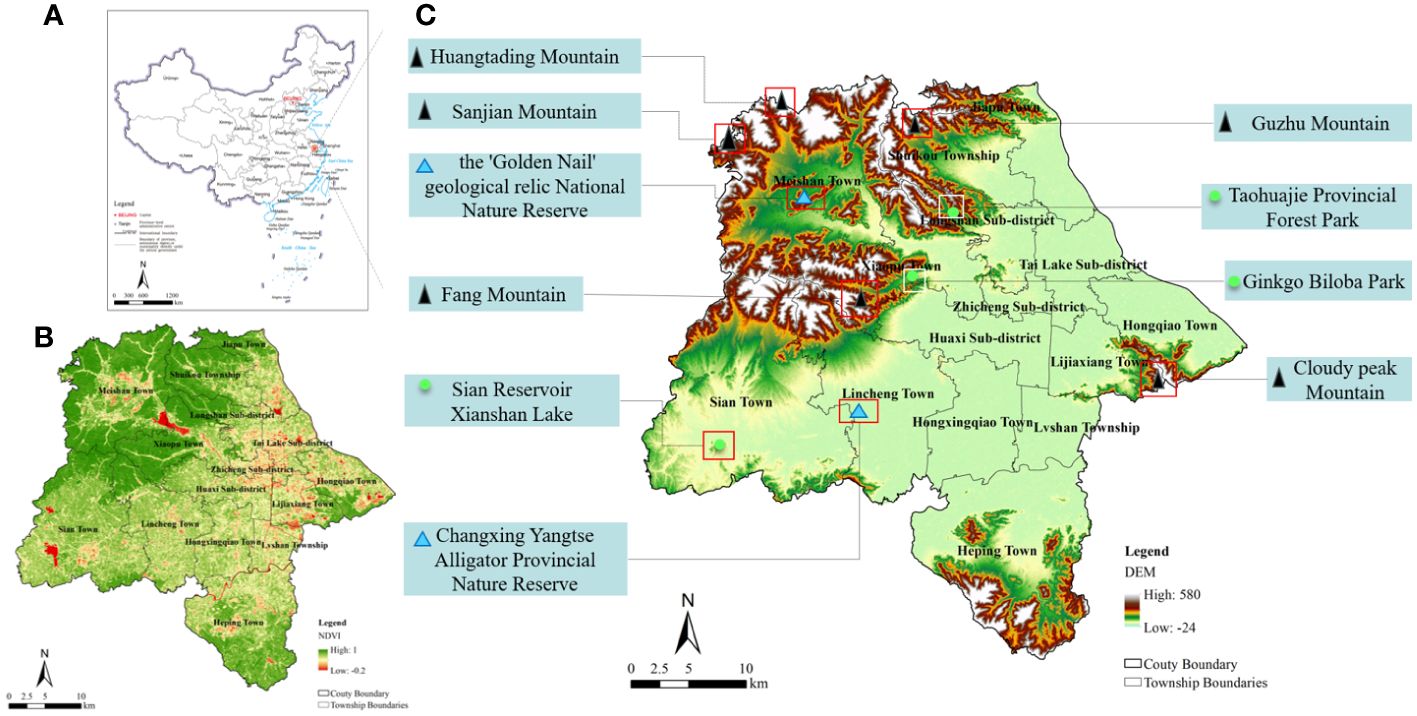
Figure 2 Overview of the study area. (A) Regional overview map. (B) Vegetation coverage in the study area in 2020. (C) Elevation and distribution of key natural resources in the study area.
The land use data for the study area was sourced from the Changxing Bureau of Natural Resources and Planning, with a spatial resolution of 3 meters. The rainfall, evapotranspiration, and runoff data were obtained from the Changxing Bureau of Meteorology and Water Resources. Data on atmospheric pollutant emissions, types of pollutants, and aquatic pollutant types and quantities were acquired from the Changxing Environmental Protection Bureau. The DEM and soil data parameters used in this study were obtained from the National Earth System Science Data Center (http://www.geodata.cn). Population and socio-economic data for each township in the study area were gathered from the “Changxing Statistical Yearbook” and statistical bulletins, with specific data names and sources listed in Table 1.
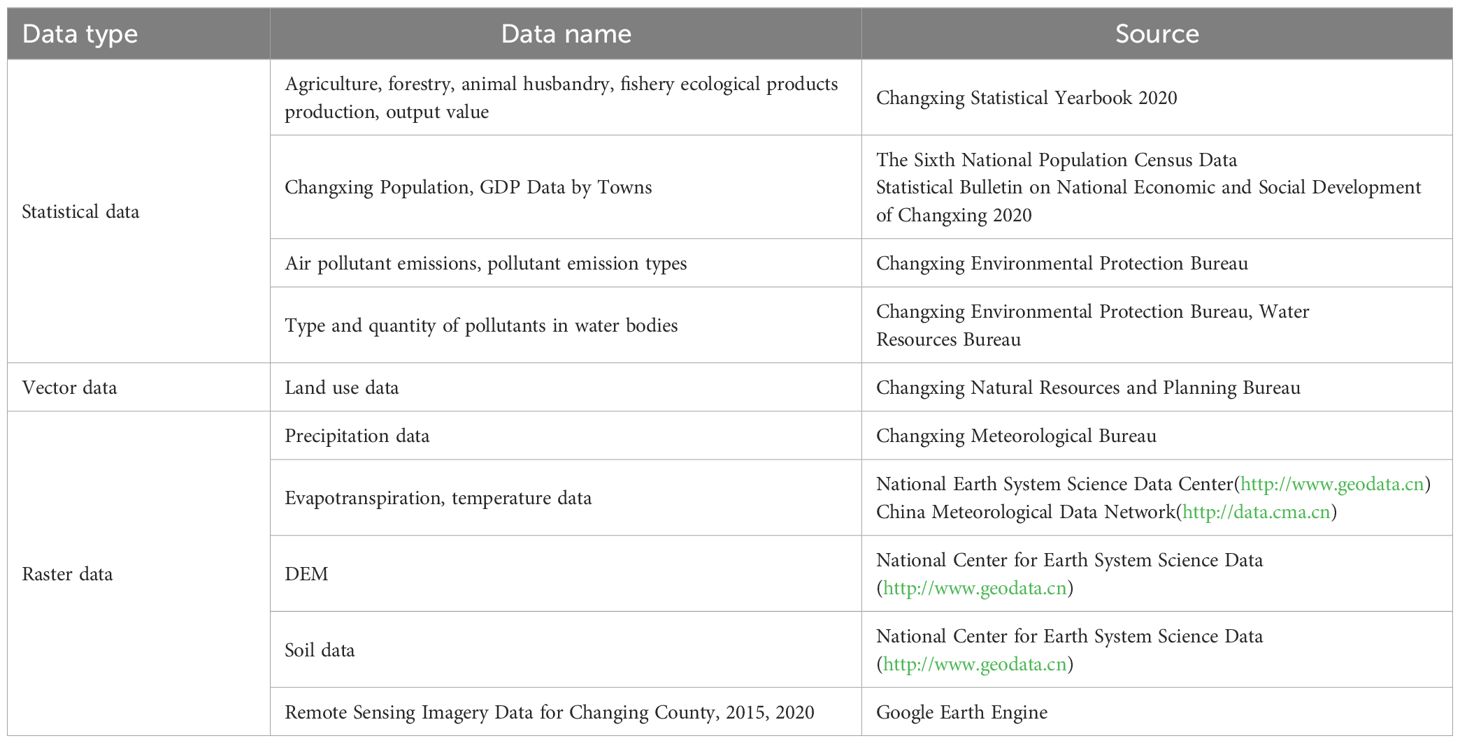
Table 1 Sources of data for the study.
This study, focusing on the current state of ecological resources in Changxing, selected seven ecosystem service functions—ecological products, carbon sequestration, water conservation, water purification, soil conservation, air purification, and climate regulation—for the valuation of the utilization status of five types of EAs. The valuation process involved estimating the biophysical quantities and then converting these into monetary values. Table 2 provides a detailed overview of the assessment indicators and data description used in this study.

Table 2 Models and connotations of EA accounting methods.
In evaluating the development status of ecosystems, both domestic and international research has focused on elements, structure, patterns, processes, functions, welfare, and supply-demand relationships (Burkhard et al., 2012; Wei et al., 2017). These efforts have resulted in the development of well-established assessment methods to identify critical ecological issues in key areas for further research. This study aims to construct evaluation indicators for the social utilization of EAs by integrating the stock and flow values of these assets (Maes et al., 2013; Qian et al., 2022). Drawing on existing research, we select four indicators—pattern, quality, supply–demand, and risk—to assess the social utilization of EAs in county-level urban areas.
The spatial pattern indicator aids in examining the spatial organization structure of EA supply. By identifying patterns, we can quickly pinpoint core supply areas and deficit regions, facilitating the implementation of appropriate protection and management measures. We employ the Getis-Ord Gi* statistical method to quantify the spatial distribution of EAs (Li Z, et al., 2020). Utilizing the spatial analysis functions of ArcGIS 10.7, we calculate the Getis-Ord Gi* index to identify hotspots and cold spots, representing areas of high and low EA supply, respectively.
The EA quality indicator represents the per-unit area value of EAs, reflecting the overall condition and quality of the assets (Lourdes et al., 2022). This study utilizes ArcGIS 10.7 to standardize pixel values for assessing the coverage of EAs per unit area, thereby deriving the per-unit area EA coverage index. The natural breaks method categorizes the quality of various EAs into three levels—low, medium, and high.
The supply–demand assessment indicator reflects the balance between the social demand for and the supply of EAs, aiding in evaluating the sustainability and coordination of regional ecosystems (Wang et al., 2021). This indicator guides the effective utilization and management of resources. In this study, the EA supply index and demand index are used to calculate the supply-demand equilibrium, revealing the utilization status of EAs within the study area. The supply index represents the normalized value of per-unit area EAs within township units. The demand index is characterized by population density, per capita GDP, and the ratio of built-up land within township units. The calculation formula is as follows:
In Equation 1, σ represents the proportion of construction land, expressed in percentage (%). ρ stands for population density, measured in individuals per square kilometer (people·km−2). P denotes per capita gross domestic product (GDP) at the regional level, presented in ten thousand yuan per square kilometer (10,000 yuan·km−2). The calculation formula for supply–demand equilibrium is as follows:
In Equation 2, X and Y represent the normalized coefficients of EA supply and demand values for various counties within the research area. READ denotes the equilibrium degree of supply and demand. A positive READ signifies an oversupply of EAs. A value of 0 indicates a balance between EA supply and demand, while a negative READ signifies a shortage of EAs about demand (Wei et al., 2017).
The EA risk indicator reflects the extent of various pressures and threats faced by EAs, including habitat destruction and human disturbances (Qian et al., 2022). This study assesses the risk status of EAs in the study area by evaluating the extent of EA occupation. Using the spatial analysis capabilities of ArcGIS and temporal land use data, we calculate the EA loss due to urban expansion from 2015 to 2020. The EA loss for each township unit is assessed based on the per-unit area value of occupied ecological land, followed by spatial visualization and characteristic analysis of the loss risk.
Determining EA sources is essential for shaping an optimal EA security pattern. This study defines EA sources as continuous landscape patches with high ecological value, offering ecosystem services, preserving key ecological processes, and contributing to ecological products and welfare. We selected dense forests, large river and lake systems, and scenic areas with high EA quality for identifying key EA source patches. Areas exceeding 0.03 km² for forests, 0.10 km² for river and lake systems, and 0.02 km² for scenic spots, combined with high-quality EA patches, were marked as EA sources (Li H, et al., 2020).
Ecological resistance refers to the hindrances faced by species and ecological processes in migration and interaction across various landscape patches, influenced by land cover types and human disturbances (McCluney et al., 2014). This study defines EA resistance as the spatial obstacles impacting ecological resources’ capacity to provide products and services. Utilizing five normalized coverage values of EAs, elevation, slope, land cover type, proximity to roads, water bodies, residential areas, and vegetation coverage, a total of 12 indicators were used to construct Changxing’s EA resistance surface. To minimize subjective bias, spatial principal component analysis determined the weights for each indicator, detailed in Table 3.
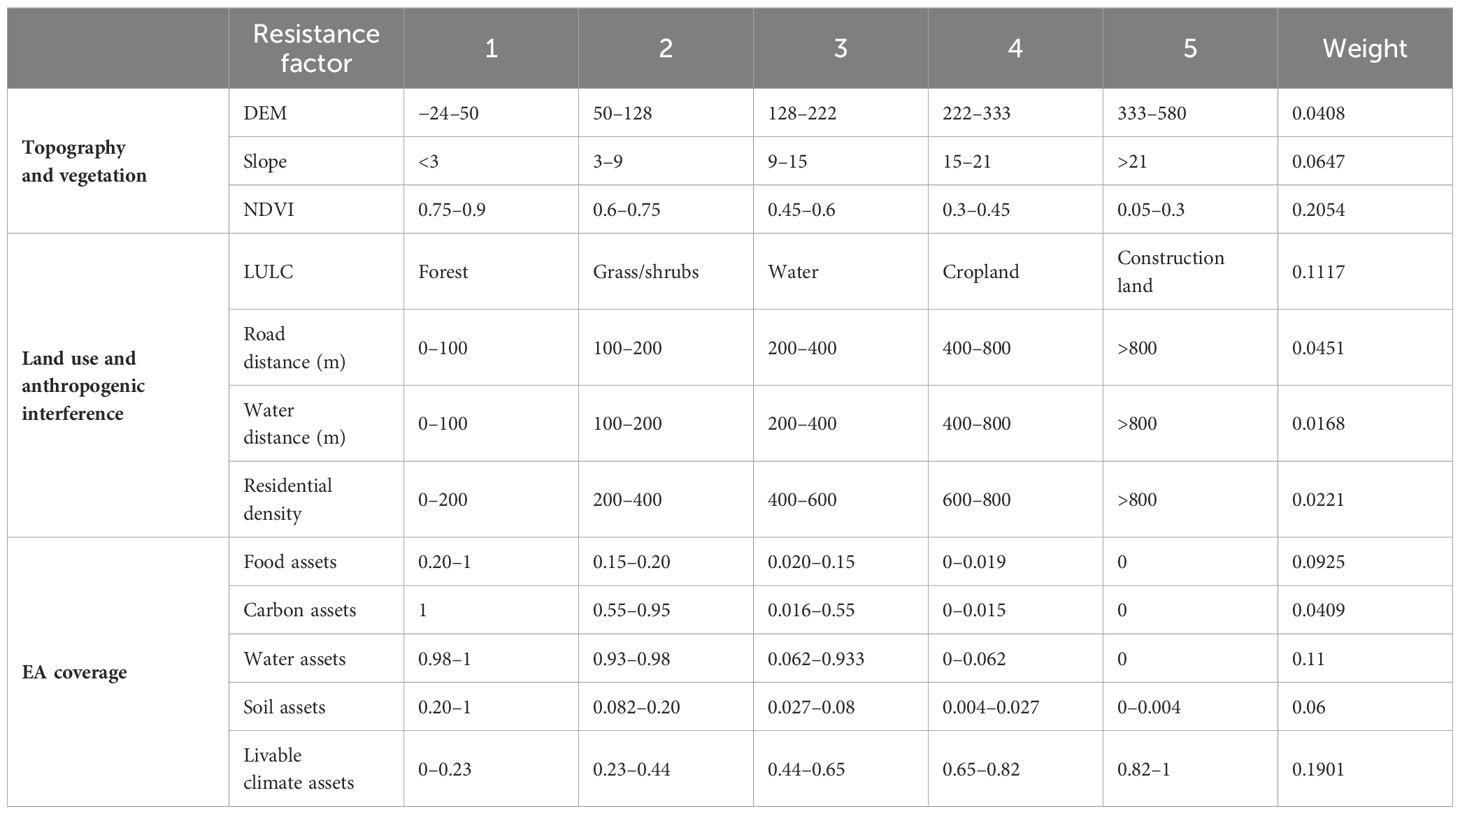
Table 3 Resistance factors and gradation of ecological source expansion.
Ecological corridors are paths that facilitate connectivity between ecological sources with minimal resistance, optimizing ecological connectivity. The Minimum Cumulative Resistance (MCR) model, a staple in landscape ecology, is extensively used for identifying ecological corridors (Wei et al., 2022). The gravity model, applied to quantify the importance of ecological corridors identified by the MCR model, uses weighted interactions between origins to evaluate corridor significance. This study utilizes the MCR model and gravity model to identify corridors of significant EAs, with the following calculation formulas.
In Equation 3, MCR stands for Minimum Cumulative Resistance; Dij represents the distance for migratory species from ecological source j to landscape patch i; denotes the adjusted resistance of landscape patch i; f signifies the proportionality of cumulative resistance to distance. This study utilized the Cost Path tool in ArcGIS 10.7. Utilizing the ecological resistance surface, this study connected paths from designated ecological sources to others, encompassing all as origins and integrating the layers into a comprehensive corridor network.
In Equation 4, Pij denotes the interaction force between ecological source patches i and j; Ai and Aj respectively represent the weights of ecological source sites i and j; Kij signifies the standardized resistance value between ecological source sites i and j; Qi and Qj represent the resistance values of ecological source sites i and j; Si and Sj depict the areas of ecological source sites i and j; Lij refers to the cumulative resistance value between ecological source sites i and j; Lmax stands for the maximum cumulative resistance value among all ecological source patches.
We established the EA network and security pattern within the research area, based on ecological sources, minimum EA resistance surfaces, ecological corridors, and ecological nodes. Using spatial metrics from the minimum resistance values, a natural break approach was applied to categorize the resistance values into five levels, ranging from low to high ecological security areas: high ecological security zones, moderately high ecological security zones, moderate ecological security zones, moderately low ecological security zones, and low ecological security zones.
The 2020 EA inventory of Changxing, detailed in Table 4 and Figure 3, shows a total asset value of CNY 77.94 billion. Livable climate assets dominated at 84%, offering 121.48 billion kWh of climate regulation and 28,400 tons of air purification, valued at CNY 65.63 billion, predominantly utilized in the central region. Food assets, mainly supplied by central and southern areas, contributed CNY 6.27 billion, 8% of the total. Water assets, with a conservation total of 5.34 billion m³, amounted to CNY 4.43 billion, 6% of the total, with significant contributions from the northwest. Soil conservation, led by ecosystems such as trees, prevented about 88.53 million tons of soil erosion, valued at CNY 1.59 billion, mainly in the northwest and south. Carbon sequestration by ecosystems totaled 237,100 tons, valuing carbon assets at CNY 12 million, with forests in northwestern towns as the primary source.
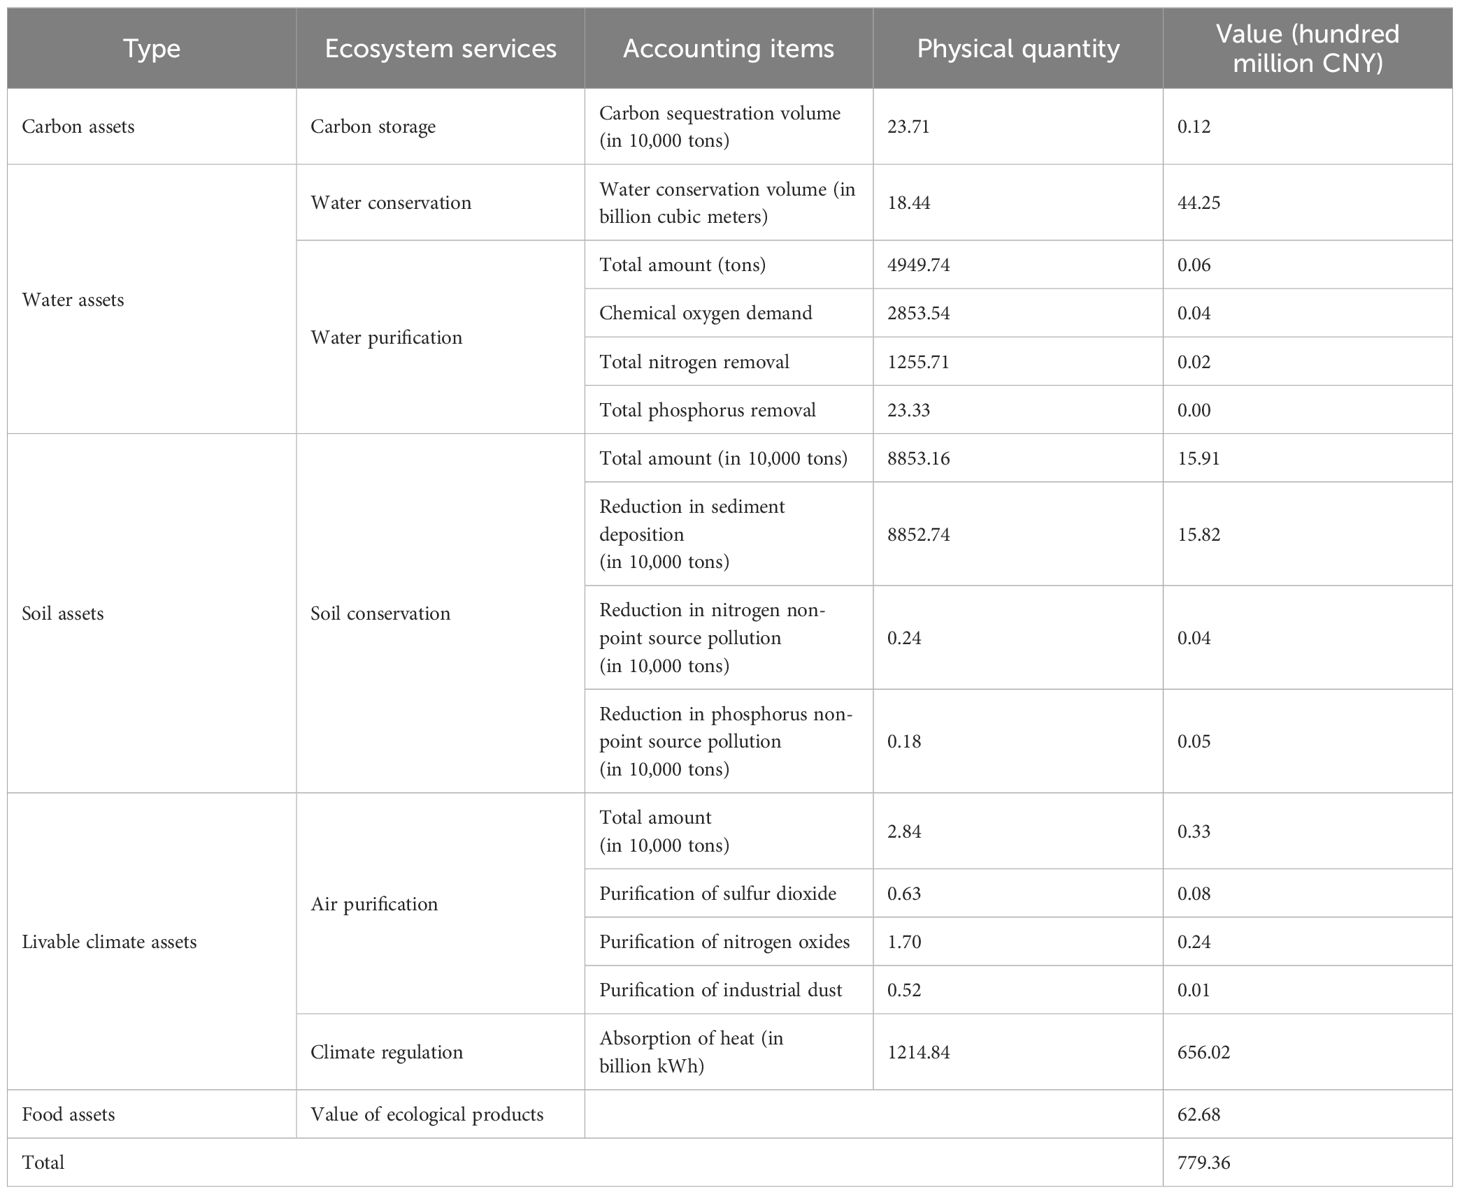
Table 4 Accounting results of EAs in Changxing in 2020.
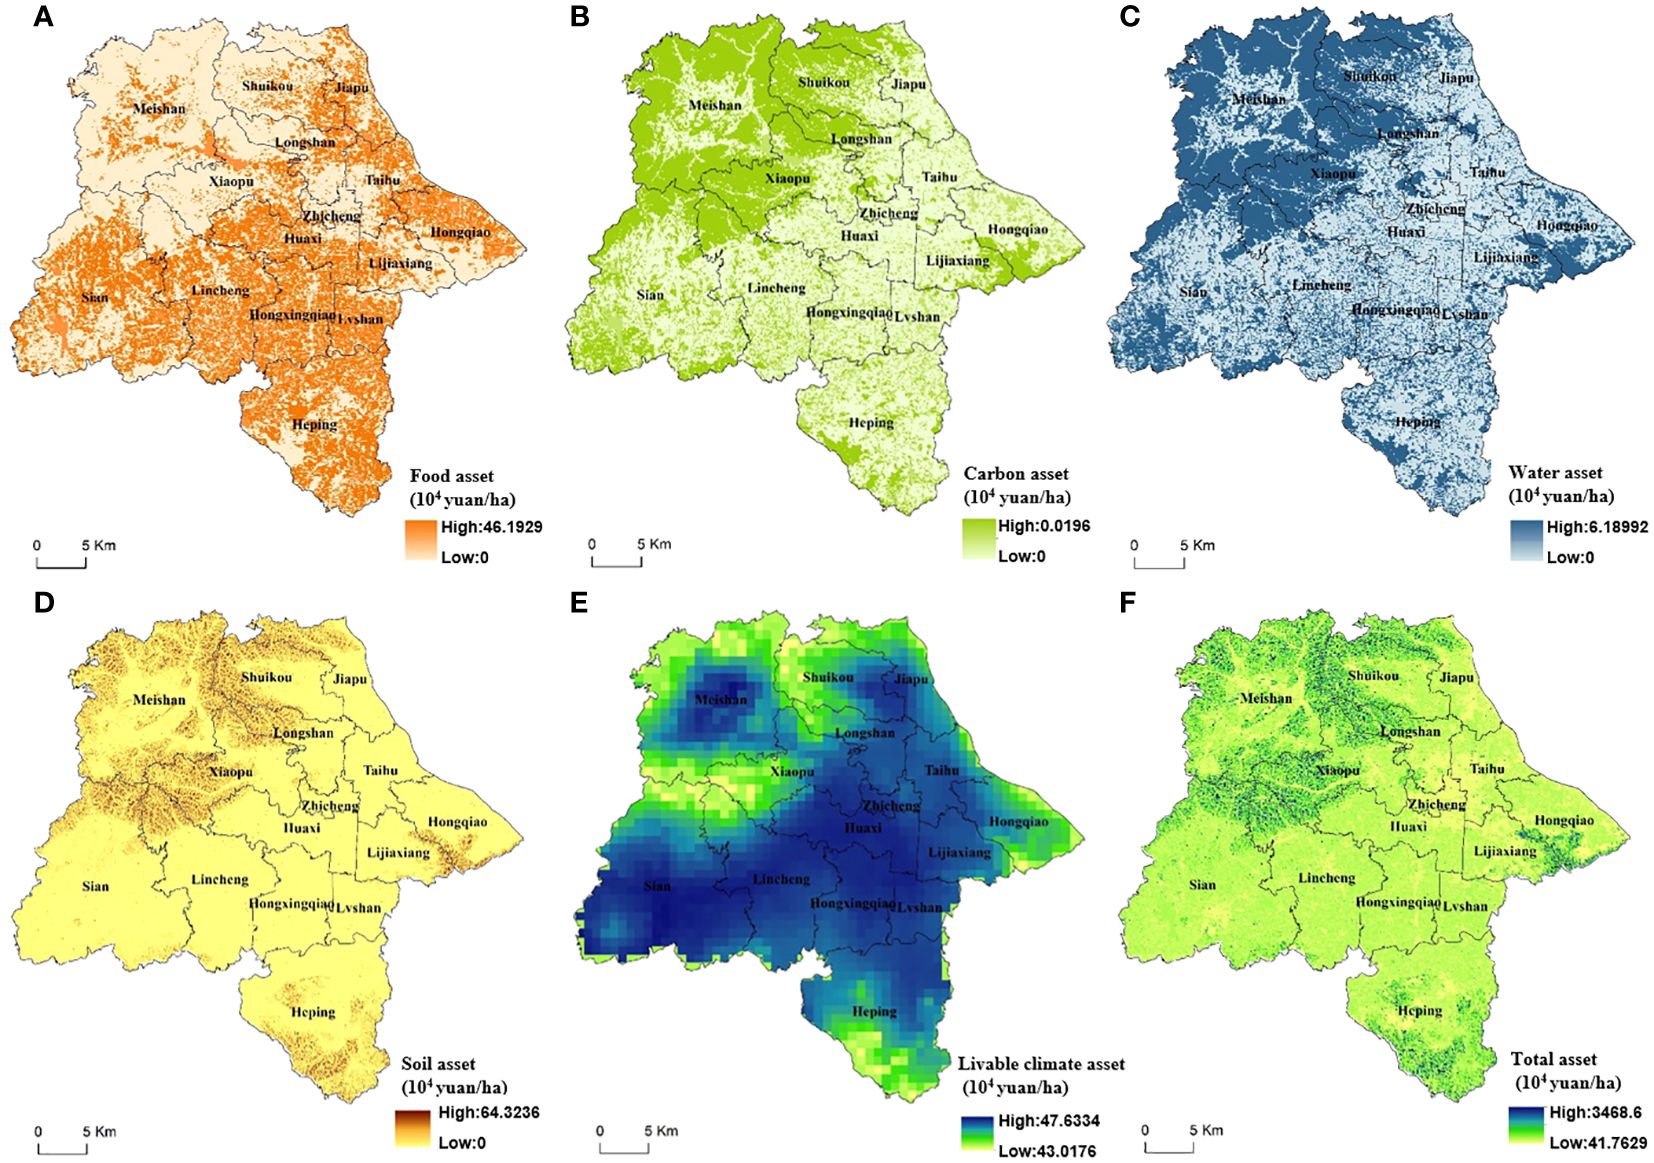
Figure 3 Spatial distribution of EAs in Changxing in 2020. (A–F) Spatial distribution of food asset, carbon asset, water asset, soil asset, livable climate asset, and total asset, respectively.
Utilizing ArcGIS’s hotspot identification tool, this study analyzed the 2020 spatial hot and cold spot patterns of Changxing’s EAs, as shown in Figure 4. Results reveal that EA hotspots predominantly cluster in northwest Meishan Town, while Taihu Subdistrict and Lijiaxiang Town are marked by cold spots, and central Huaxi Subdistrict by sub-cold spots. Carbon, water, and soil assets display similar hot and cold spot distributions, with Meishan Town being a hotspot and Taihu Subdistrict, Lijiaxiang Town, and Huaxi Subdistrict as cold spots. Food asset hotspots are concentrated in Si’an Town and Lincheng Town, with cold spots in the central urban area. Livable climate assets have hotspots in Si’an Town and cold spots in Taihu Subdistrict, Lijiaxiang Town, Longshan Subdistrict, Zhicheng Subdistrict, and Huaxi Subdistrict. From the perspective of spatial distribution, the natural resource endowment, land use types, and human activity distribution across townships significantly influence the spatial patterns of EAs. Hotspot areas, which are the primary regions of ecological resources in Changxing, coincide with areas of relatively sparse human activity. In contrast, cold spot areas are predominantly concentrated in the central urban areas, where human activities have resulted in a fragmented distribution of ecological resources.
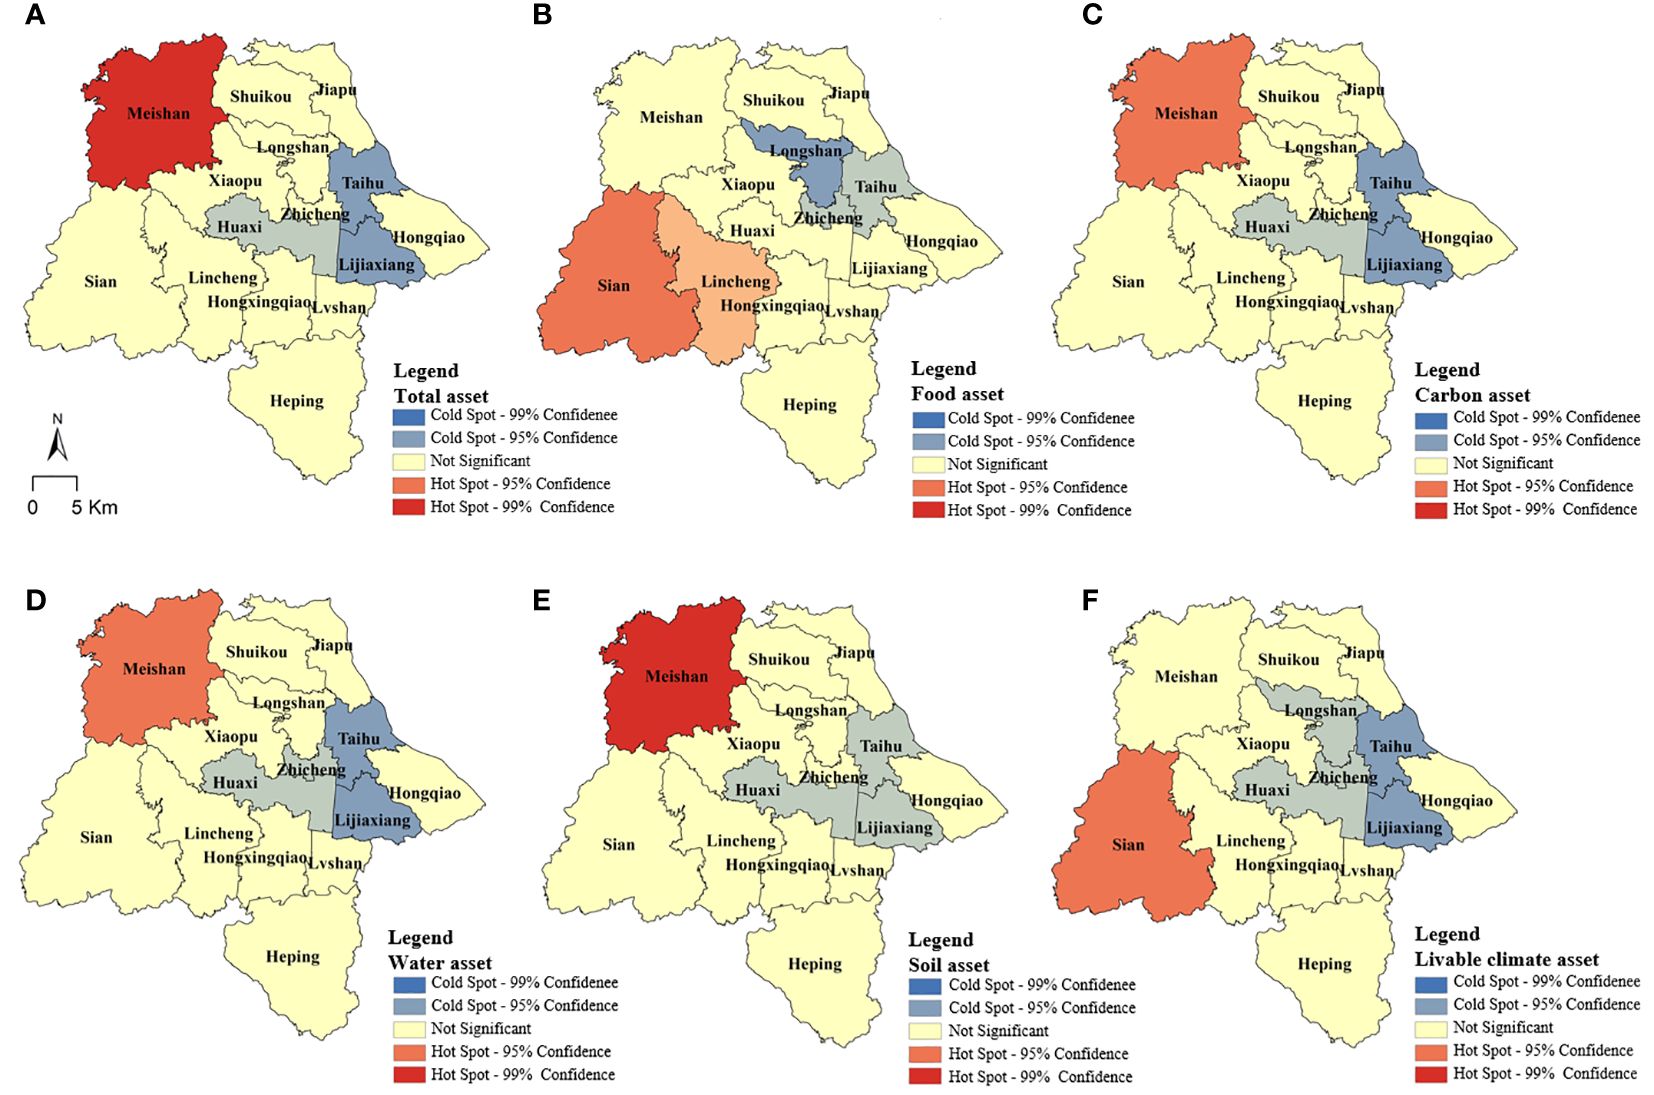
Figure 4 Spatial distribution pattern of EAs in Changxing in 2020. (A–F) Hot and cold spot distribution patterns of total asset, food asset, carbon asset, water asset, soil asset, and livable climate asset, respectively.
This study utilized a normalized spatial coverage index to evaluate the quality of EAs in Changxing in 2020. Using ArcGIS’s natural break method, the EAs were classified into high, medium, and low categories. The analysis revealed that the overall quality of EAs in Changxing was predominantly medium, with limited areas of high-quality assets, primarily concentrated in the northwest and lower quality in the central region (Figure 5). In 2020, the high-quality food assets in Changxing were primarily concentrated in the central region, which serves as the main source of food assets and an important agricultural production area for the county. Carbon assets were predominantly of low quality, with high-quality carbon assets mainly located in the northwest region. Water assets in Changxing were generally at a medium to high level, with the central urban area having fewer water assets. The northwest forests and central farmlands exhibited strong water conservation capabilities, providing a higher supply of water assets. High-quality habitable climate assets in Changxing are primarily concentrated in the higher-altitude forest areas of the northwest. The central region experiences higher temperatures compared to the northwest forest areas, resulting in greater consumption of total habitable climate assets. This leads to relatively higher vegetation evaporation, which is detrimental to moisture retention and increases the likelihood of heat island formation. The soil asset quality in Changxing was generally at a medium to low level. The farmland areas in the central region had lower soil retention capacity, resulting in lower soil asset quality, whereas the soil assets in the northwest region were relatively higher in quality.
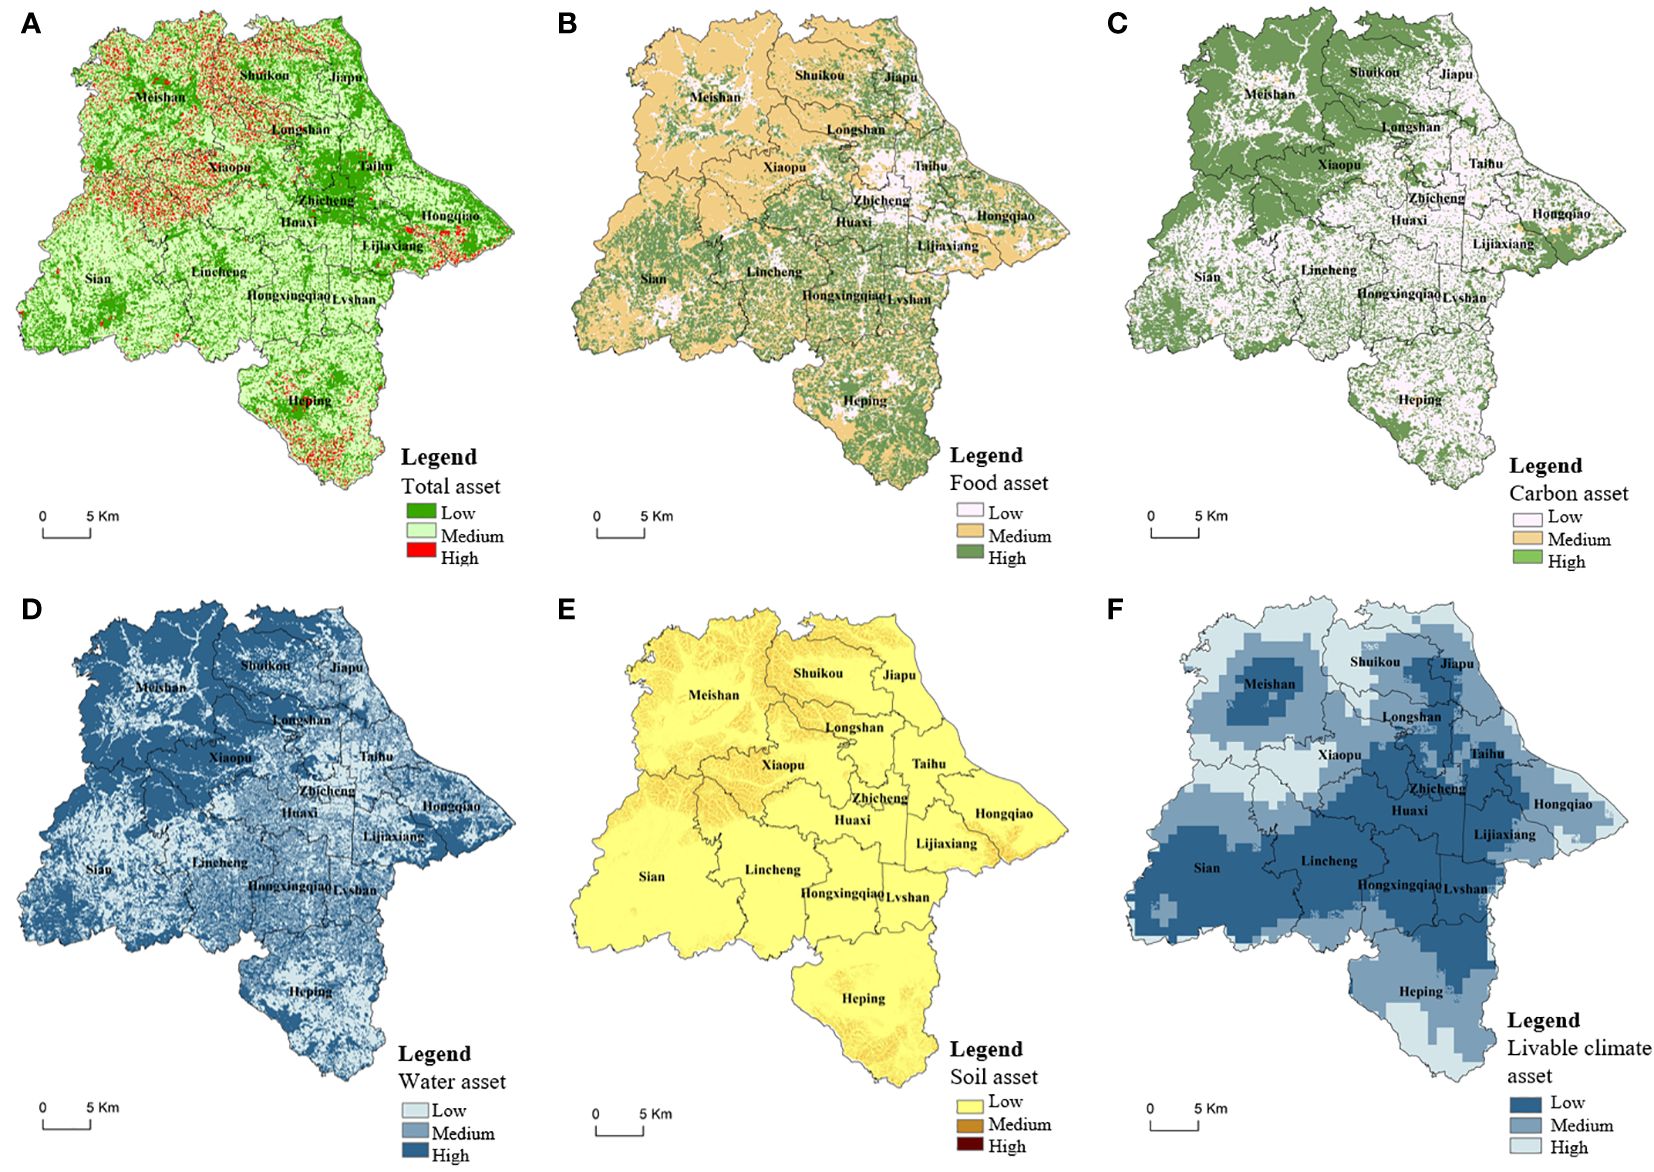
Figure 5 Distribution of EA quality in Changxing in 2020. (A–F) Quality distribution of total asset, food asset, carbon asset, water asset, soil asset, and livable climate asset, respectively.
This study assessed the 2020 EA supply–demand index in Changxing, using townships as units and classifying the index via ArcGIS 10.7’s natural break method, as depicted in Figure 6. The results show a general supply–demand equilibrium in Changxing’s EAs, with a notable equilibrium coefficient of 0.07. However, spatial heterogeneity is evident, with EA supply diminishing from northwest to southeast, opposite to the demand index trend. The central urban area, densely populated, emerges as a high-demand zone, while the resource-rich northwestern townships are primary supply areas. Spatial analysis of the supply index reveals significant variability among townships, with high supply areas often corresponding to lower demand, especially in Meishan, Si’an, Shuikou, Xiaopu, and Heping Towns. In contrast, the central urban region faces high EA demand. Over half of the townships, particularly Meishan Town, exhibit supply-demand equilibrium, but the central urban area shows an imbalance. Through the supply–demand assessment, it was determined that the primary supply areas of EAs in Changxing are located in the northwest, forming a pattern encircling the central urban area. As the central urban area expands, the demand for development is likely to impact the surrounding townships’ ability to supply EAs. Therefore, maintaining a balanced supply-demand structure of EAs in future urban development poses significant challenges.
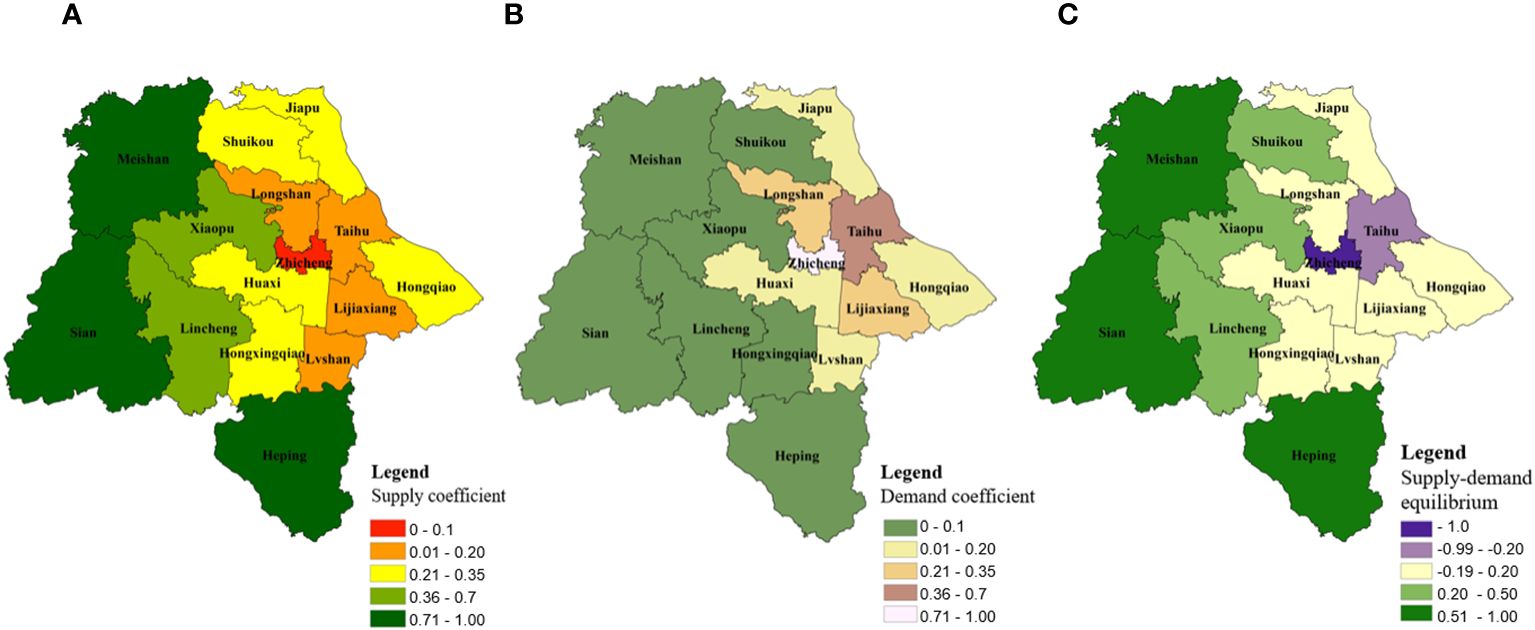
Figure 6 Supply and demand status of EAs in Changxing in 2020. (A) Spatial distribution of the EA supply coefficient. (B) Spatial distribution of the demand coefficient. (C) Spatial distribution of the supply–demand equilibrium.
Using ArcGIS 10.7 and land-use data from 2015 to 2020, this study analyzed the impact of urban expansion on ecological land in Changxing, resulting in a loss of EAs (Table 5). Over five years, land development led to an estimated EA loss of 8.573 billion yuan, representing an 11% loss rate. Meishan Town experienced the highest depletion, followed by Heping, Si’an, Lincheng, and Xiaopu Towns.
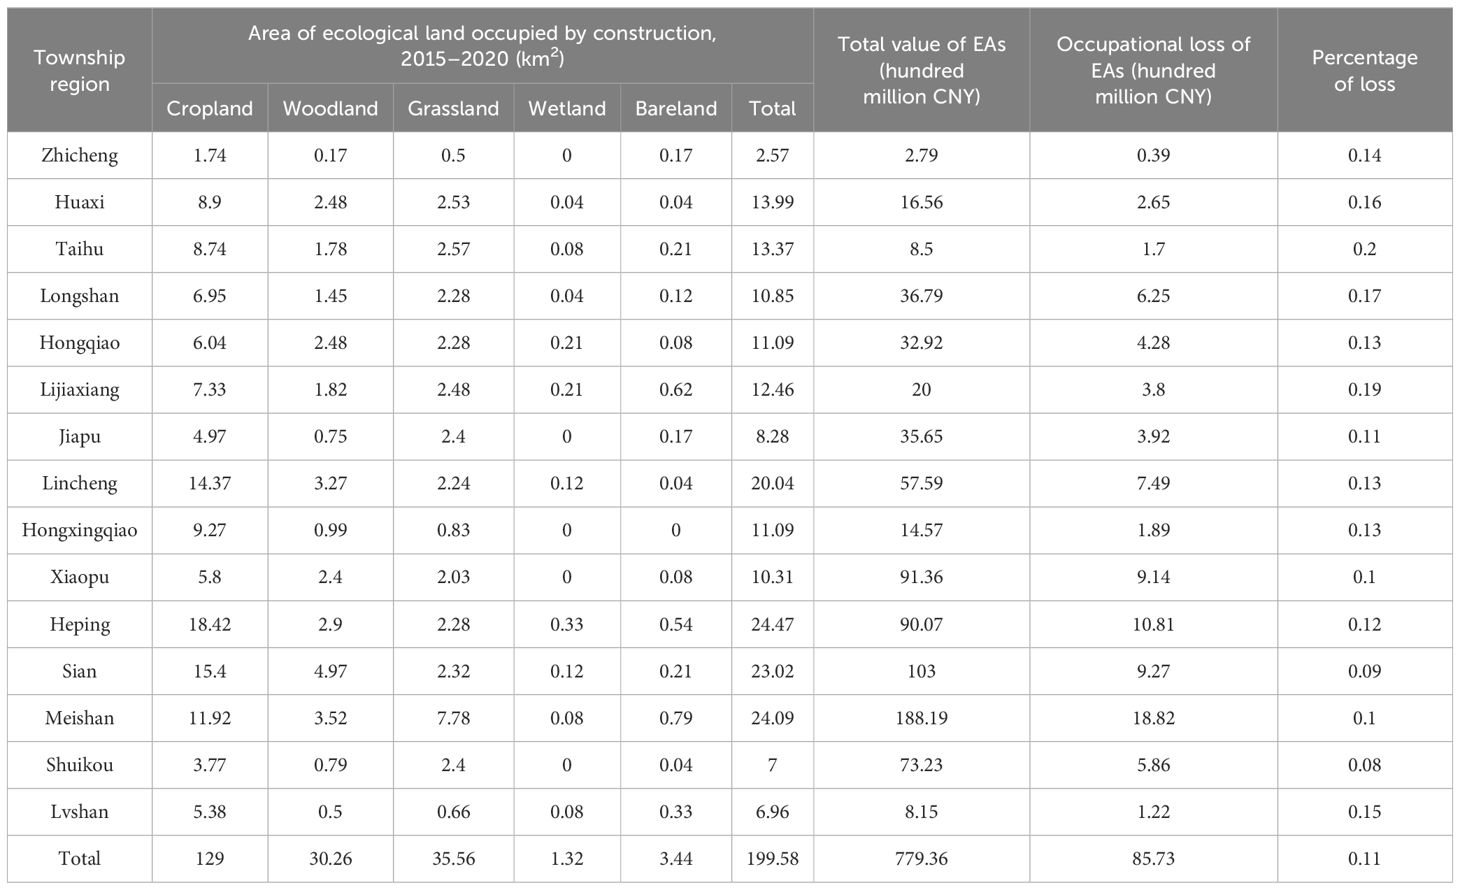
Table 5 The EA loss in each township of Changxing from 2015 to 2020.
Furthermore, the study evaluated the risk of EA loss due to construction across Changxing’s townships, with spatial distribution depicted in Figure 7. Taihu Street and Lijiaxiang Town faced high risk, while Longshan Street, Huaxi Street, and Lyushan Township had relatively high risk. Additionally, Lincheng Town, Hongxingqiao Town, Zhicheng Street, and Hongqiao Town showed moderate risk. Conversely, Meishan, Jiapu, and Heping Towns exhibited relatively low risk, and Sian, Shuikou, and Xiaopu Towns had low risk. The central urban area, with its low ecological resource density and high urban development, had a lower EA supply, indicating that densely populated regions might face greater ecological risks if surrounding EAs degrade significantly. Therefore, in urban development, it is essential to evaluate the costs of development and construction from the perspective of regional EA flows to mitigate ecological environmental risks.
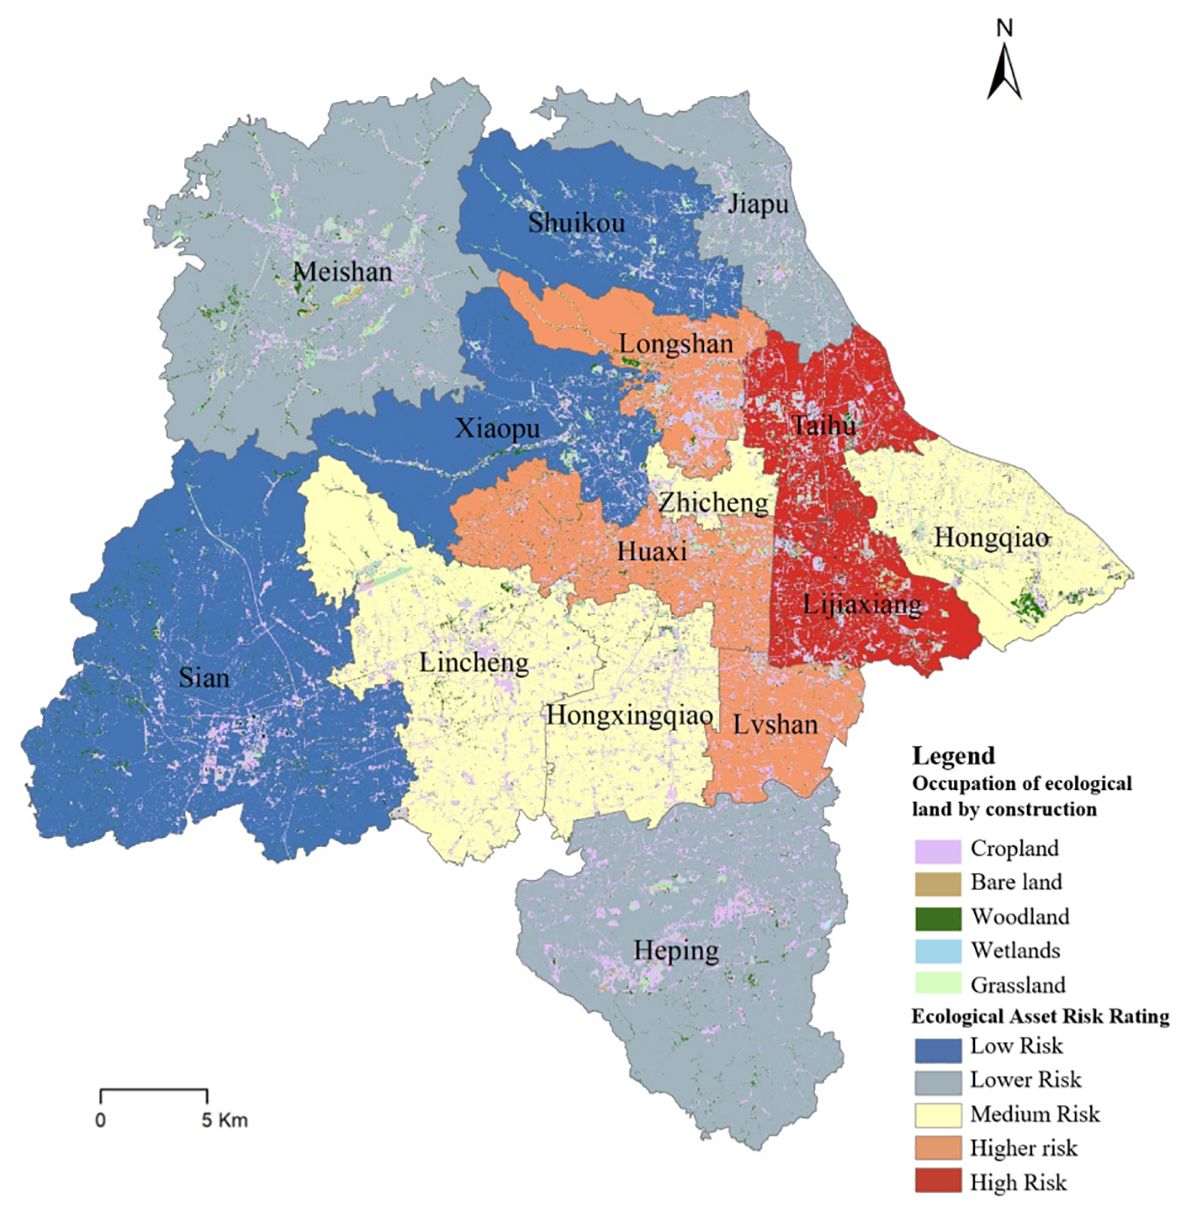
Figure 7 EA loss risk in Changxing in 2020.
Based on the regional classification of high-quality EAs and the overlay extraction of extensive ecological resource patches, the spatial distribution of ecological source areas in Changxing and their proportion in each township is depicted in Figure 8. The results indicate that the total area of ecological source areas in Changxing covers 487.34 km2, accounting for 34% of the total land area. Forests represent the predominant type of ecological source areas, comprising 92% of the total, while wetlands account for 7%. These ecological source areas contribute to 42% of the overall EAs. The spatial distribution of ecological source areas exhibits significant disparities, with primary concentrations in the northwestern region of the study area, particularly in Meishan Town, accounting for 66% of the total land, followed by 59% in Xiaopu Town and 51% in Shuikou Township. Overall, ecological source areas are more concentrated in the northwestern townships of the study area, while their distribution is relatively scattered elsewhere.
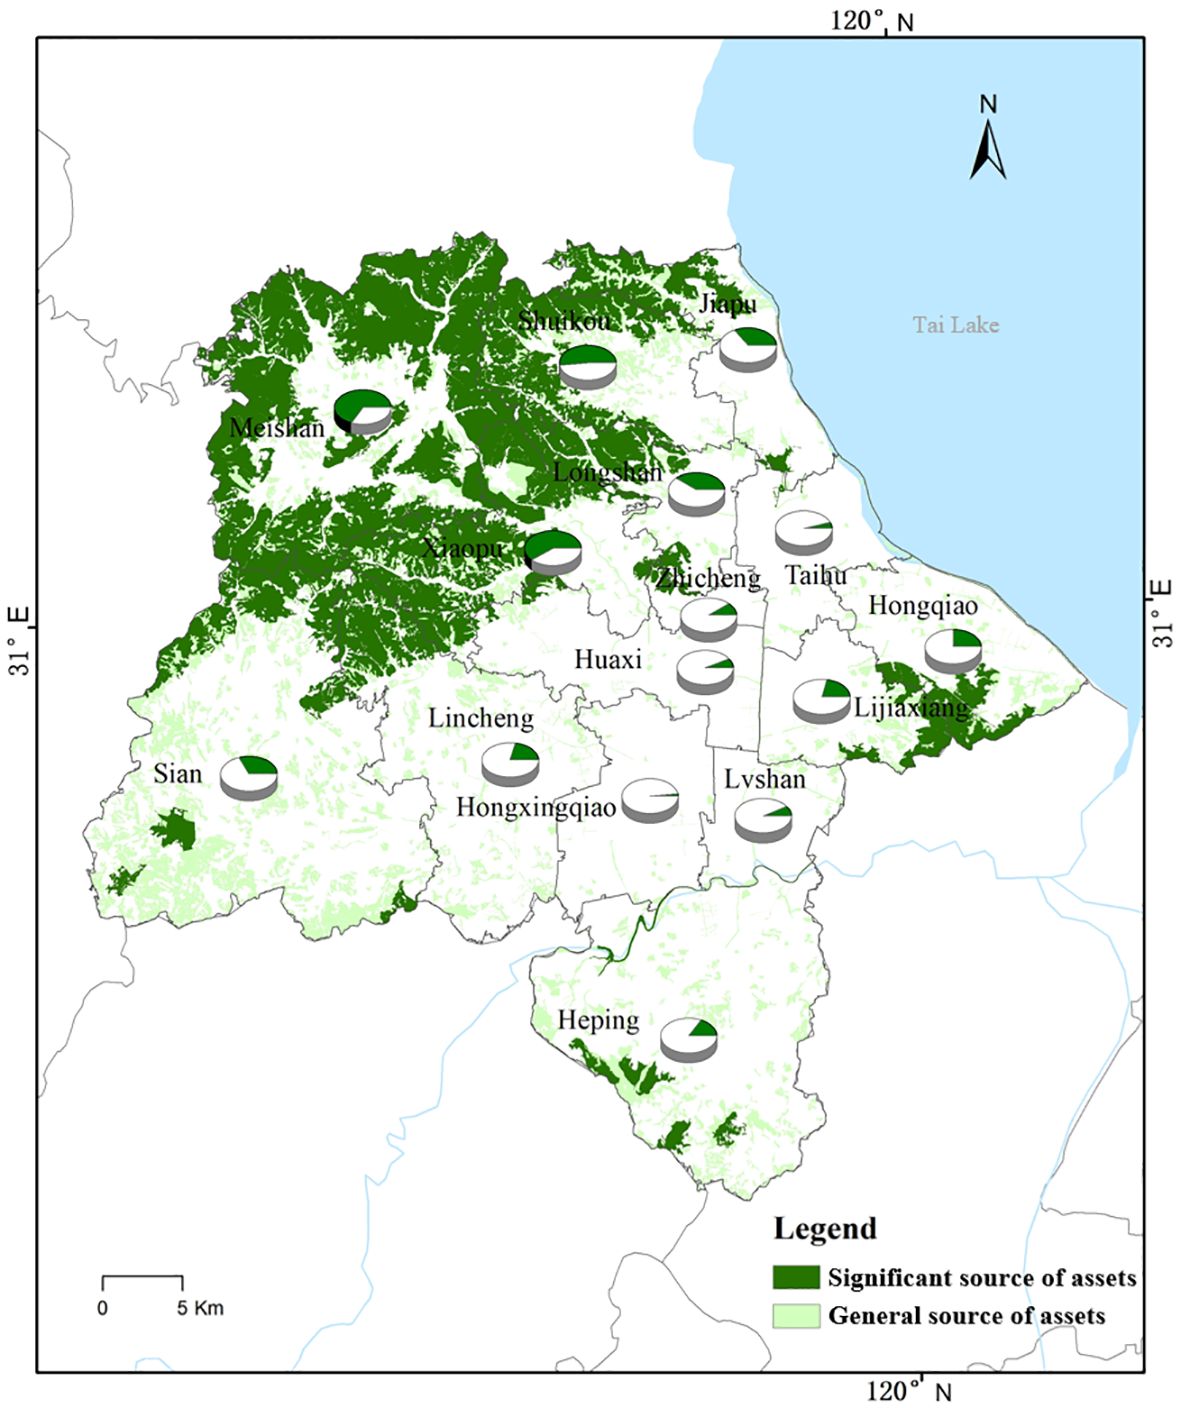
Figure 8 Spatial distribution of ecological sources in Changxing.
Utilizing 12 indicators derived from the natural conditions of Changxing, land use, and human activity disturbance data, a spatial principal component analysis was conducted. The analysis involved a resistance grading of the 12 indicators and a weighted overlay based on different resistance factors, culminating in the creation of comprehensive and minimal resistance surfaces for the EA spatial patterns in Changxing, depicted in Figure 9. The results reveal that high-resistance EA areas in Changxing are primarily located in regions characterized by low vegetation cover, intense urban development, and scarcity of EAs. These areas extend outward in proximity to the transportation network, mainly concentrated in the central urban area of Changxing and the centers of various townships. The minimum resistance surface highlights the resistance distribution from the core to the periphery of EA source areas. The results indicate a two-tiered differentiation in the spatial pattern of EAs in Changxing, with low-resistance areas predominantly concentrated in the northwestern townships. Conversely, the central and southern regions exhibit higher accumulated resistance values, posing significant hindrances to the flow of ecological resource assets from the northern areas towards the central and southern regions.
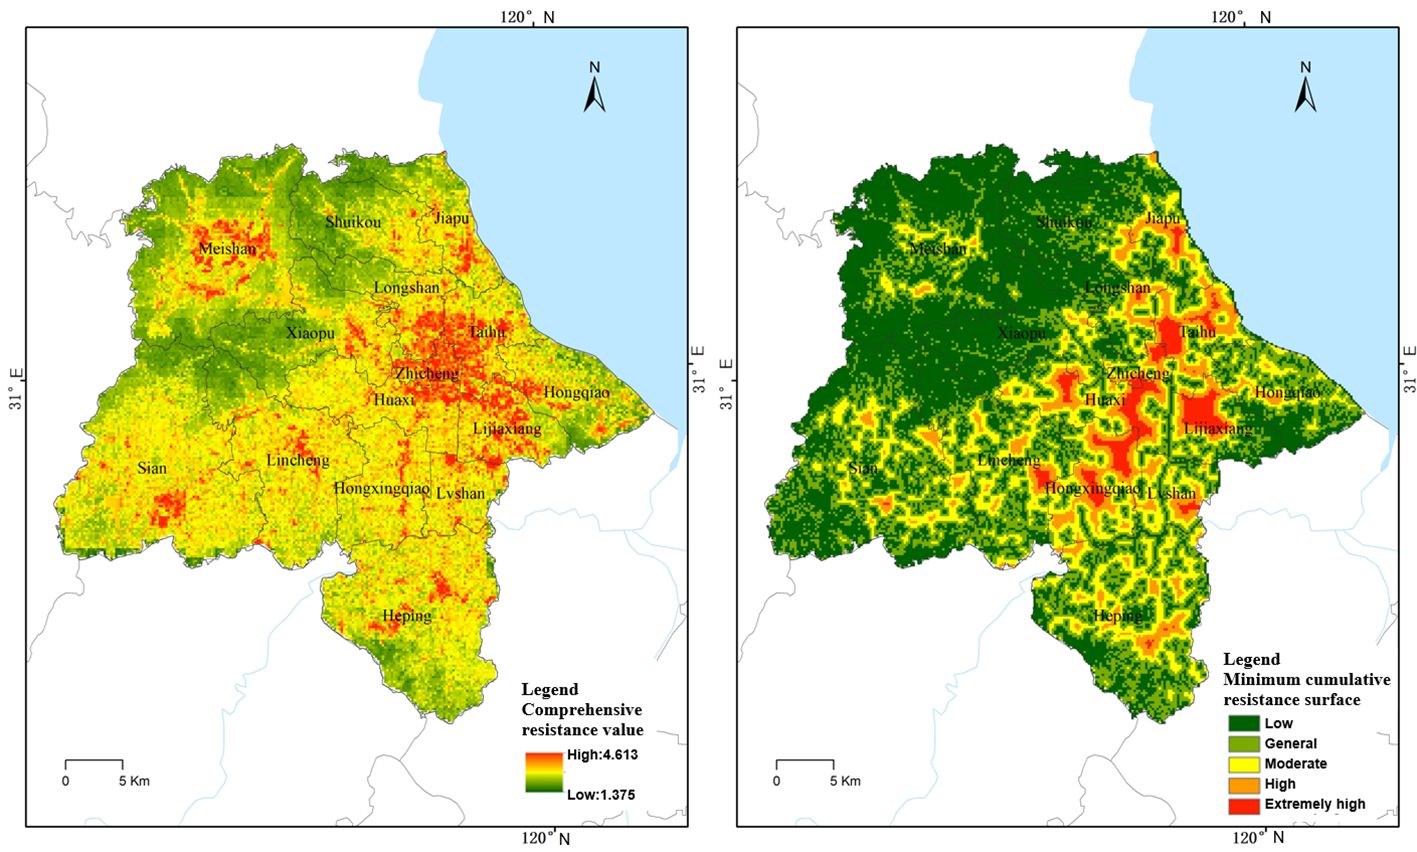
Figure 9 Spatial distribution of total and minimum resistance surfaces of EAs in Changxing.
Upon establishing a resistance surface, this study constructed an EA security pattern for Changxing by identifying and overlaying ecological corridors and nodes, as depicted in Figure 10. The analysis revealed 29 key ecological corridors totaling 421.054 km in length, along with 17 ecological nodes. Influenced by topography and ecological source area distribution, most corridors extend northwest–southeast. Among them, 20 are primary north–south corridors and 9 are secondary corridors. These corridors connect crucial EA source areas in Meishan, Shuikou, and Xiaopu Towns, forming a network that includes key conservation areas and scenic spots. This stable structure facilitates the diffusion and flow of ecological streams and services between EA source areas.
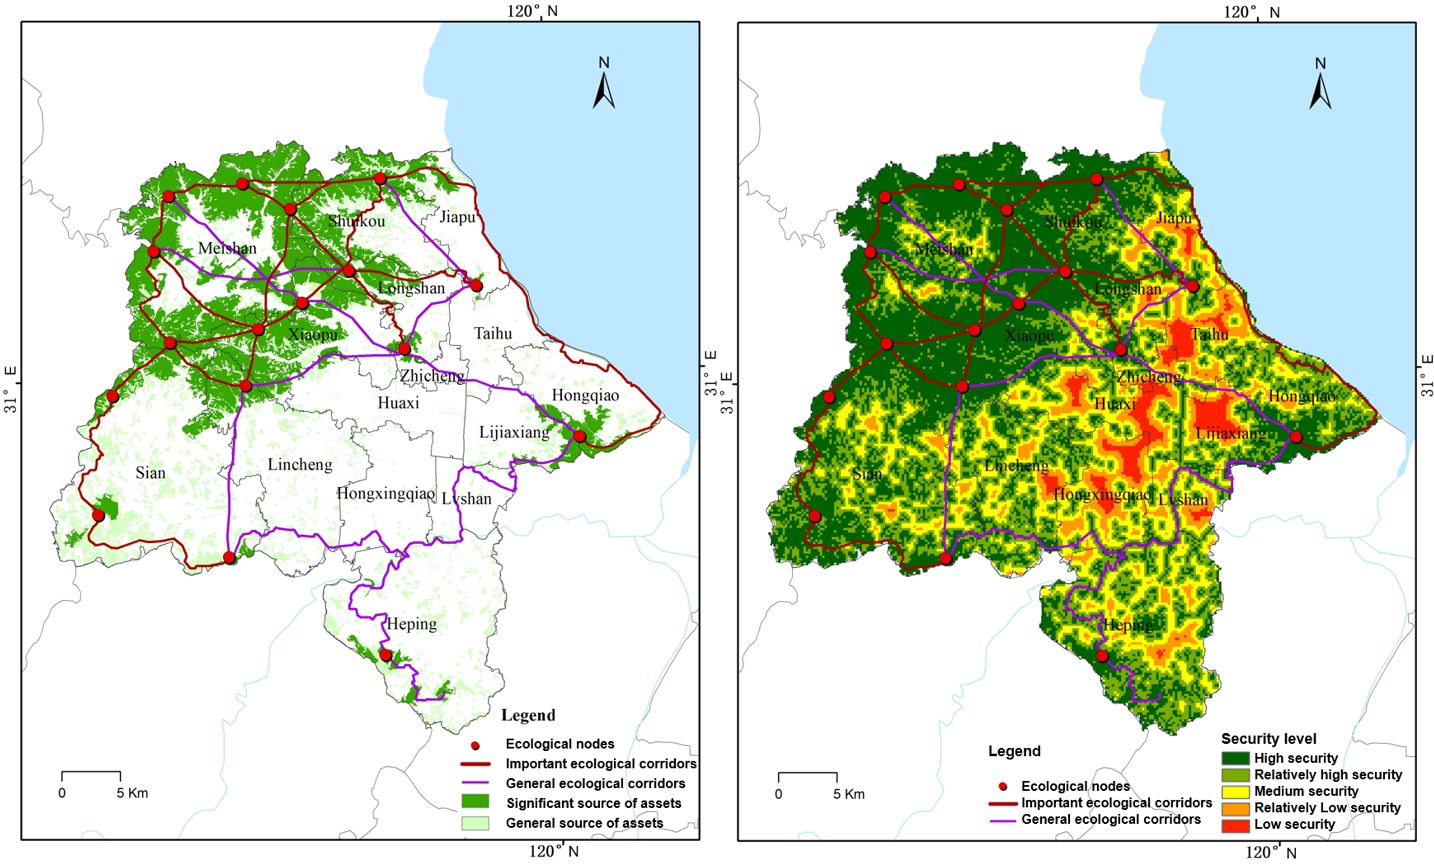
Figure 10 Ecological security patterns and regulatory zones in Changxing.
Utilizing natural break points to classify the minimum resistance surface, this study established an EA security level for Changxing, revealing a high overall ecological security. High to relatively high security areas, covering 605.12 square kilometers or 42.34% of the county, are primarily near forests, grasslands, and farmlands. Medium security zones, accounting for 30% of the area (425.24 km2), are mainly in distant farmlands and grasslands from urban centers. Low to relatively low-security areas span 159.76 km2, constituting 11.21% of the total, and are concentrated in the central urban area, Lijiaxiang, and Hongxingqiao Towns. These zones, critical for urban development boundary delineation, lack significant EA sources and corridors.
This study analyzed the spatial supply and usage characteristics of five types of EAs in Changxing from the perspective of ES function values and summarized typical issues faced during the development of ecological resources in the county, referencing relevant research.
Our study reveals that Changxing’s EA supply value amounted to CNY 77.936 billion, surpassing its Gross Regional Product of CNY 70.24 billion, indicating a substantial intangible supply of EAs over its socioeconomic value. Notably, among Huzhou City’s counties, Changxing exhibits the most significant decreasing trend in EA fluctuations (Yu et al., 2006). In the context of rapid economic growth, the county experiences low per capita and unit area EA holdings, with EAs contributing a minor fraction to GDP and elevated pollution levels (Long et al., 2021). The study also shows an imbalance in the supply and demand of EAs in Changxing’s central urban and economically active areas. Therefore, for economically developed regions like Changxing, future efforts should focus on reducing pollutant emissions per unit of output, optimizing GDP structure, prioritizing ecological economic development, and fostering coordinated growth between the national economy and ecological conservation.
In Changxing, significant overlap of high-value EAs poses a challenge, reflecting diverse natural resource endowments across the region. Premium EA sources and corridors are predominantly concentrated in Meishan, Shuikou, and Xiaopu in the northwest, while the central urban area lacks such assets. Despite the rich EA supply in these northwestern towns, annual data indicate notable losses in ecological resources. Fragmentation of EA sources and susceptibility to human disturbances contribute to further depletion, undermining the region’s ecological security. Additionally, there’s a lag in integrating EAs into planning, with present strategies delaying EA assessment and management incorporation, particularly in ecological space management. This oversight prioritizes socio-economic development over EA conservation, neglecting protection and restoration efforts. Addressing these issues is crucial for enhancing EA quality and promoting the region’s green economy.
Optimizing the Ecological Network for Sustained Urban Development. Enhancing ecological network management fosters ecosystem protection, ecological welfare, biodiversity conservation, and urban sustainability (Donati et al., 2022; Molné et al., 2023). Changxing, stretching from north to south, includes key mountains, the “Golden Nail” geological Relic National Nature Reserve, Taohuajie Provincial Forest Park, major lakes, and the Changxing Yangtze Alligator Provincial Nature Reserve. These unique natural features form crucial EA supply and barrier zones. Considering the county’s significant ecological conservation areas and resource distribution, this study proposes a three-horizontal and four-vertical spatial network development pattern focused on three major EA functional landscapes. It suggests tailored EA management strategies for different ecological areas and protection zones (Figure 11).
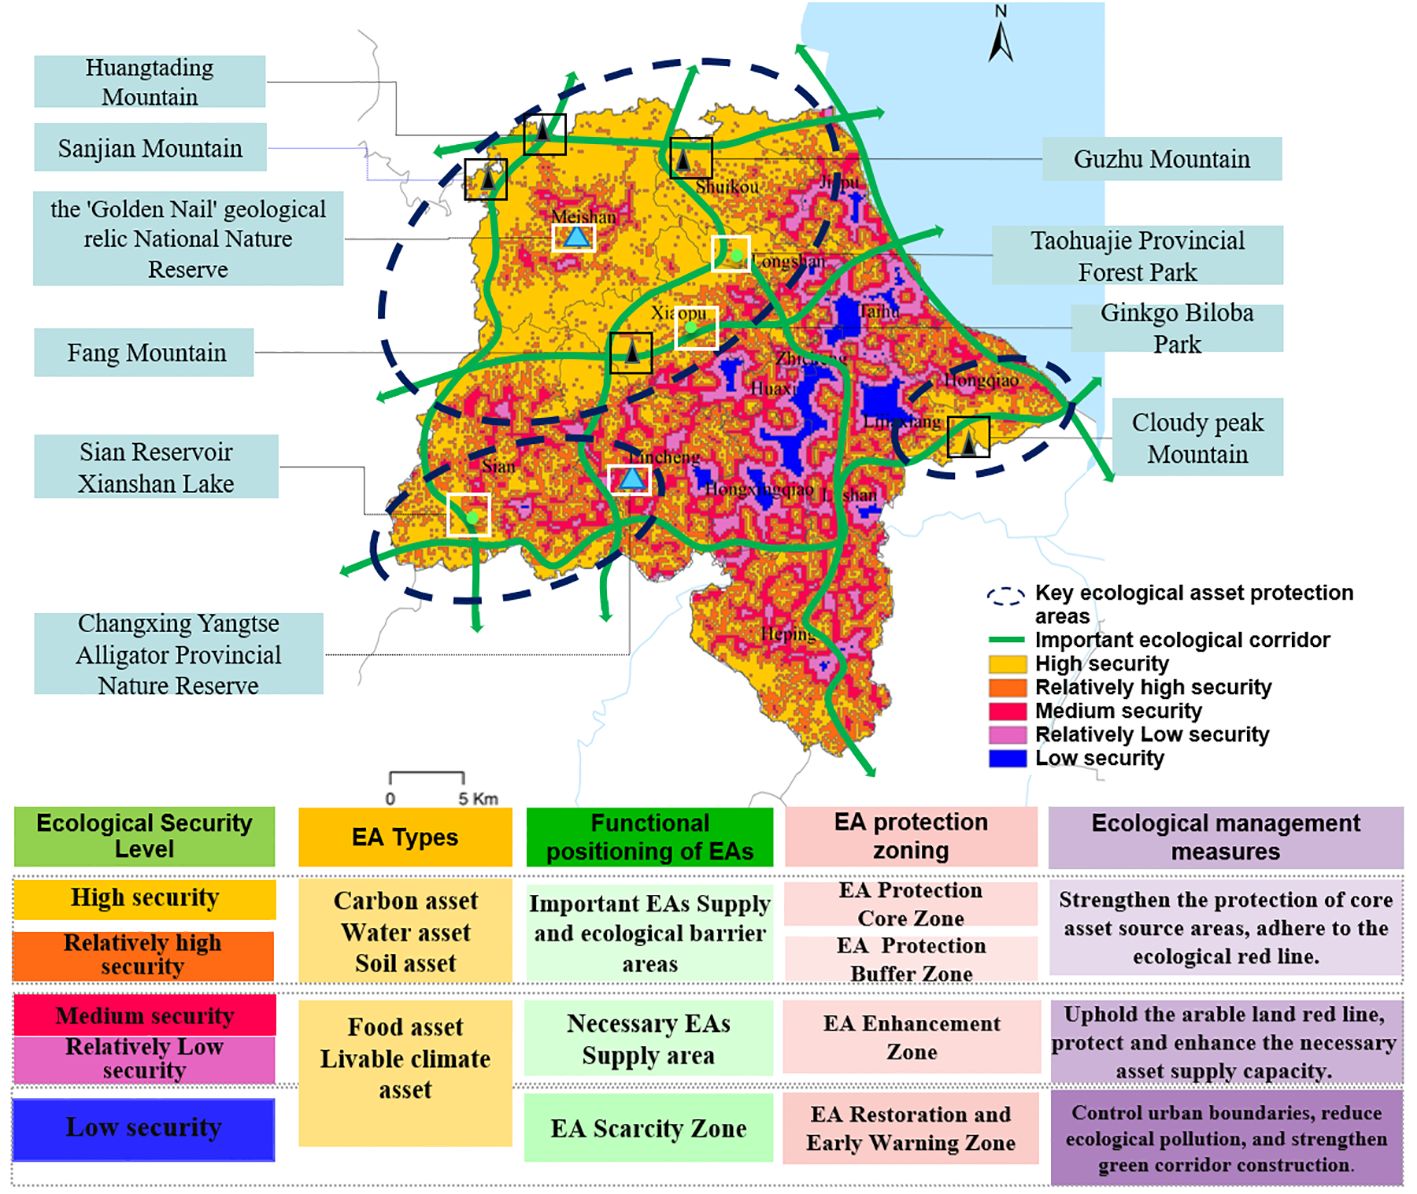
Figure 11 Strategies for optimizing the control of ecological space in Changxing.
In Changxing, the northwestern towns of Meishan, Shuikou, Xiaopu, and the southwestern town of Si’an are vital suppliers of carbon, water, soil, food, and climate assets, boasting high ecological security levels. These regions serve as critical EA supply and barrier zones, central to ecological protection. Adjacent areas with elevated security levels are recommended as EA protection buffer zones, reinforcing the safeguarding of key asset sources and adherence to ecological red lines.
In the central and southern regions of Changxing, primarily suppliers of food assets with moderate demand for climate assets, ecological security levels are moderately low. These areas should be designated as essential EA protection enhancement zones, focusing on upholding basic farmland red lines and enhancing EA supply capacity.
Changxing’s central urban area and surrounding town centers exhibit low ecological security levels, facing a scarcity of EA resources. These areas serve as primary consumption zones for EAs and crucial zones for restoration and early warning. Development activities detrimental to vital EAs should be strictly prohibited, with delineated construction land growth boundaries and intensified green corridor development to enhance EA spatial flow.
To optimize the EA security framework in Changxing, it is imperative to enhance the protection of EA sources and prioritize the role of ecological corridors in facilitating spatial flow and stability of ecological resource assets. Key functional landscape areas in the county’s northwest, southwest, and southeast should be safeguarded, while the central region requires the introduction of both natural and artificial ecological corridors to enhance connectivity between essential ecological sources and nodes. Future strategies for Changxing should prioritize the protection and enhancement of significant EAs in alignment with regional development needs, expanding the area of ecological sources to improve overall ecological quality. Additionally, establishing a comprehensive EA compensation mechanism and implementing targeted ecological resource management are crucial steps to enhance the continuous supply capacity of EAs.
EA assessment is a method that transforms natural resources and ecosystem services into economic values, aimed at elucidating ecosystems’ contributions to the economy and society, providing a scientific basis for decision-makers in ecological planning and management (Gómez-Baggethun and Groot, 2010; Liu et al., 2010). Currently, spatial planning is undergoing a transformative phase, with an increasing focus on ecological restoration and the integration of natural factors into urban planning (Ronchi et al., 2020; Delibas et al., 2021). As a vital evaluative tool, EA assessment quantifies and assesses ecosystem services and welfare provided by different land-use types, offering support and guidance for spatial planning decision-making and element control. In practical planning, EA assessment is applied in both preliminary and process assessments of current and proposed plans. Considering ecosystem sustainability and the environmental-economic impact of planning proposals, aids in ensuring a balance between ecological protection and sustainable development, thus preventing excessive consumption of EAs and facilitating rational trade-offs and optimizations.
This study integrates the results of EA development status assessment into the ecological security framework, enabling targeted identification and construction of ecological security patterns with strong operability and efficiency in delineating the supply and spatial flow of EAs. This approach facilitates precise zoning and tiering of EAs, contributing insights to regional ecological space management and planning. Nonetheless, the study has significant limitations that may impact the effectiveness of EA pattern optimization. These include insufficient integration with local planning projects and unvalidated guidance for ecological protection and control zoning. The study also inadequately addresses the role of EAs in socio-economic activities and their future applications, with mechanisms for their contribution to socio-economic development remaining unexplored. Therefore, future work should focus on developing a more comprehensive, practice-based EA assessment system and application process. This includes integrating real-world projects to develop more scientific assessment indicators, establishing monitoring and early warning systems, and formulating relevant laws, regulations, and policy support. These efforts aim to provide practical recommendations for fostering a green economy and sustainable urban development.
This study develops a comprehensive assessment index and optimization framework for EA utilization, employing a multimodal approach integrating remote sensing, land use, and localized ecological data to quantitatively evaluate the utilization status of five categories of EAs. Our findings reveal that in 2020, Changxing’s EAs provided an economic value of approximately CNY 77.936 billion. However, these assets play a relatively minor role in the socio-economic development of the region. EAs are trending towards loss, with the most significant depletion occurring in the primary supply regions. Despite an overall balanced supply-demand situation and a high level of ecological security in Changxing, spatial distribution characteristics show overlapping high-supply areas and a polarized ecological security pattern. This study proposes future strategies for Changxing based on the developmental positioning of EAs, delineating zones for EA protection, buffering, enhancement, and early warning. It suggests a networked corridor-node development model to optimize the spatial pattern of EAs and implement differentiated zone-specific management measures.
This research illustrates the vital role of EAs in sustaining human societal development and their application in ecological space management, offering new perspectives and case references for nature-based urban planning solutions. We advocate for integrating the EA assessment application framework into spatial planning systems and plan to further summarize practical project experiences from this study to guide future decision-making.
The original contributions presented in the study are included in the article/supplementary material, further inquiries can be directed to the corresponding author.
XR: Conceptualization, Formal analysis, Investigation, Methodology, Visualization, Writing – original draft. FY: Conceptualization, Funding acquisition, Project administration, Writing – review & editing.
The author(s) declare financial support was received for the research, authorship, and/or publication of this article. This research was funded by the “National Natural Science Foundation of China”, grant numbers “42341207 and 52338002”.
The authors would like to thank the anonymous reviewers for their comments and suggestions.
The authors declare that the research was conducted in the absence of any commercial or financial relationships that could be construed as a potential conflict of interest.
All claims expressed in this article are solely those of the authors and do not necessarily represent those of their affiliated organizations, or those of the publisher, the editors and the reviewers. Any product that may be evaluated in this article, or claim that may be made by its manufacturer, is not guaranteed or endorsed by the publisher.
Acosta L. A., Maharjan P., Peyriere H. M., Mamiit R. J. (2020). Natural capital protection indicators: Measuring performance in achieving the Sustainable Development Goals for green growth transition. Environ. AND SUSTAINABILITY Indic. 8. doi: 10.1016/j.indic.2020.100069
Ayanu Y. Z., Conrad C., Nauss T., Wegmann M., Koellner T. J. E. S. (2012). Quantifying and mapping ecosystem services supplies and demands: a review of remote sensing applications. Environ. Sci. Technol. 46 (16), 8529–8541. doi: 10.1021/es300157u
Barbier E. B. (2019). The concept of natural capital. OXFORD Rev. OF ECONOMIC Policy 35, 14–36. doi: 10.1093/oxrep/gry028
Bowers E. P., Von Eye A., Lerner J. V., Arbeit M. R., Weiner M. B., Chase P., et al. (2011). The role of ecological assets in positive and problematic developmental trajectories. J. Adolesc. 34 (6), 1151–1165. doi: 10.1016/j.adolescence.2011.07.007
Burkhard B., Kroll F., Nedkov S., Müller F. (2012). Mapping ecosystem service supply, demand and budgets. Ecol. Indic. 21, 17–29. doi: 10.1016/j.ecolind.2011.06.019
Cao Y., Kong L., Ouyang Z. (2022). Characteristics and driving mechanism of regional ecosystem assets change in the process of rapid urbanization—A case study of the Beijing–Tianjin–Hebei urban agglomeration. J. Remote Sens. 14 (22), 5747. doi: 10.3390/rs14225747
Capriolo A., Boschetto R. G., Mascolo R. A., Balbi S., Villa F. (2020). Biophysical and economic assessment of four ecosystem services for natural capital accounting in Italy. Ecosystem Serv. 46, 101207. doi: 10.1016/j.ecoser.2020.101207
Costanza R., D'arge R., De Groot R., Farber S., Grasso M., Hannon B., et al. (1997). The value of the world's ecosystem services and natural capital. NATURE 387, 253–260. doi: 10.1038/387253a0
Costanza R., De Groot R., Sutton P., van der Ploeg S., Anderson S. J., Kubiszewski I., et al. (2014). Changes in the global value of ecosystem services. Global Environ. Change 26, 152–158. doi: 10.1016/j.gloenvcha.2014.04.002
Daily G. C., Polasky S., Goldstein J., Kareiva P. M., Mooney H. A., Pejchar L., et al. (2009). Ecosystem services in decision making: time to deliver. Front. Ecol. Environ. 7, 21–28. doi: 10.1890/080025
Delibas M., Tezer A., Bacchin T. K. (2021). Towards embedding soil ecosystem services in spatial planning. Cities 113, 103150. doi: 10.1016/j.cities.2021.103150
Donati G. F. A., Bolliger J., Psomas A., Maurer M., Bach P. M. (2022). Reconciling cities with nature: Identifying local Blue-Green Infrastructure interventions for regional biodiversity enhancement. J. Environ. Manage. 316, 115254. doi: 10.1016/j.jenvman.2022.115254
Farber S. C., Costanza R., Wilson M. (2002). Economic and ecological concepts for valuing ecosystem services. Ecol. Econ. 41 (3), 375–392. doi: 10.1016/S0921-8009(02)00088-5
Fleming A., O'grady A. P., Stitzlein C., Ogilvy S., Mendham D., Harrison M. T. (2022). Improving acceptance of natural capital accounting in land use decision making: Barriers and opportunities. Ecol. Econ. 200, 107510. doi: 10.1016/j.ecolecon.2022.107510
Gao J., Du F., Zuo L., Jiang Y. (2021). Integrating ecosystem services and rocky desertification into identification of karst ecological security pattern. Landsc. Ecol. 36, 2113–2133. doi: 10.1007/s10980-020-01100-x
Gao J., Wang Y., Zou C., Xu D., Lin N., Wang L., et al. (2020). China’s ecological conservation redline: A solution for future nature conservation. Ambio 49, 1519–1529. doi: 10.1007/s13280-019-01307-6
Gómez-Baggethun E., De Groot R. (2010). Natural capital and ecosystem services: the ecological foundation of human society. Ecosyst. Serv. 30, 105–121. doi: 185.244.208.83
Gonzalez A., Thompson P., Loreau M. (2017). Spatial ecological networks: planning for sustainability in the long-term. Curr. Opin. Environ. Sustainability 29, 187–197. doi: 10.1016/j.cosust.2018.03.012
Hein L., Bagstad K., Edens B., Obst C., De Jong R., Lesschen J. P. (2016). Defining ecosystem assets for natural capital accounting. PloS One 11 (11), e0164460. doi: 10.1371/journal.pone.0164460
Hein L., Bagstad K. J., Obst C., Edens B., Schenau S., Castillo G., et al. (2020). Progress in natural capital accounting for ecosystems. Science 367 (6477), 514–515. doi: 10.1126/science.aaz8901
Hoover F.-A., Meerow S., Coleman E., Grabowski Z., Mcphearson T. (2023). Why go green? Comparing rationales and planning criteria for green infrastructure in U.S. city plans. Landscape Urban Plann. 237, 104781. doi: 10.1016/j.landurbplan.2023.104781
Jiang H., Wu W., Wang J., Yang W., Gao Y., Duan Y., et al. (2021). Mapping global value of terrestrial ecosystem services by countries. Ecosystem Serv. 52, 101361. doi: 10.1016/j.ecoser.2021.101361
Kindu M., Schneider T., Teketay D., Knoke T. (2016). Changes of ecosystem service values in response to land use/land cover dynamics in Munessa–Shashemene landscape of the Ethiopian highlands. Sci. Total Environ. 547, 137–147. doi: 10.1016/j.scitotenv.2015.12.127
Kremen C., Ostfeld R. S. (2005). A call to ecologists: measuring, analyzing, and managing ecosystem services. Front. Ecol. Environ. 3 (10), 540–548. doi: 10.1890/1540-9295(2005)003[0540:ACTEMA]2.0.CO;2
Li P., Chen J., Li Y., Wu W. (2023). Using the InVEST-PLUS model to predict and analyze the pattern of ecosystem carbon storage in Liaoning province, China. J. Remote Sens. 15 (16), 4050. doi: 10.3390/rs15164050
Li J., Huang L., Cao W. J. (2022). An influencing mechanism for ecological asset gains and losses and its optimization and promotion pathways in China. J. Geogr. Sci. 32 (10), 1867–1885. doi: 10.1007/s11442-022-2027-0
Li Z.-T., Li M., Xia B.-C. (2020). Spatio-temporal dynamics of ecological security pattern of the Pearl River Delta urban agglomeration based on LUCC simulation. Ecol. Indic. 114, 106319. doi: 10.1016/j.ecolind.2020.106319
Li H., Ma T., Wang K., Tan M., Qu J. (2020). Construction of ecological security pattern in northern Peixian based on MCR and SPCA. J. Ecol. Rural Environ. 36, 1036–1045. doi: 10.19741/j.issn.1673-4831.2020.0100
Liang C., Zhang R.-C., Zeng J. (2023). Optimizing ecological and economic benefits in areas with complex land-use evolution based on spatial subdivisions. Landscape Urban Plann. 236, 104782. doi: 10.1016/j.landurbplan.2023.104782
Lin Z., Wu C., Hong W. (2015). Visualization analysis of ecological assets/values research by knowledge mapping. Acta Ecologica Sin. 35, 142–154. doi: 10.1016/j.chnaes.2015.07.005
Liu S., Costanza R., Farber S., Troy A. (2010). Valuing ecosystem services: theory, practice, and the need for a transdisciplinary synthesis. Ann. N.Y. Acad. Sci. 1185 (1), 54–78. doi: 10.1111/j.1749-6632.2009.05167.x
Liu J., Liu Y., Li Y. (2017). Classification evaluation and spatial-temporal analysis of "production-living-ecological" spaces in China. Dili Xuebao/Acta Geographica Sin. 72, 1290–1304.
Liu Y., Yang R. (2012). The spatial characteristics and formation mechanism of the county urbanization in China. Dili Xuebao/Acta Geographica Sin. 67, 1011–1020.
Long Z., Zhang Z., Liang S., Chen X., Ding B., Wang B., et al. (2021). Spatially explicit carbon emissions at the county scale. Resources Conserv. Recycling 173. doi: 10.1016/j.resconrec.2021.105706
Loro M., Ortega E., Arce R. M., Geneletti D. (2015). Ecological connectivity analysis to reduce the barrier effect of roads. An innovative graph-theory approach to define wildlife corridors with multiple paths and without bottlenecks. Landscape Urban Plann. 139, 149–162. doi: 10.1016/j.landurbplan.2015.03.006
Lourdes K. T., Hamel P., Gibbins C. N., Sanusi R., Azhar B., Lechner A. M. (2022). Planning for green infrastructure using multiple urban ecosystem service models and multicriteria analysis. Landscape Urban Plann. 226, 104500. doi: 10.1016/j.landurbplan.2022.104500
Luo Y., Wu J., Wang X., Peng J. (2021). Using stepping-stone theory to evaluate the maintenance of landscape connectivity under China’s ecological control line policy. J. Cleaner Production 296, 126356. doi: 10.1016/j.jclepro.2021.126356
Maes J., Teller A., Erhard M., Liquete C., Braat L., Berry P., et al. (2013). Mapping and assessment of ecosystems and their services. An Analytical Framework for Ecosystem Assessments under Action 5, 1–58. doi: 10.2779/12398
McCluney K. E., Poff N. L., Palmer M. A., Thorp J. H., Poole G. C., Williams B. S., et al. (2014). Riverine macrosystems ecology: sensitivity, resistance, and resilience of whole river basins with human alterations. Front. Ecol. Environ. 12 (1), 48–58. doi: 10.1890/120367
Men D., Pan J. (2023). Incorporating network topology and ecosystem services into the optimization of ecological network: A case study of the Yellow River Basin. Sci. Total Environ. 912, 169004. doi: 10.1016/j.scitotenv.2023.169004
Molné F., Donati G. F. A., Bolliger J., Fischer M., Maurer M., Bach P. M. (2023). Supporting the planning of urban blue-green infrastructure for biodiversity: A multi-scale prioritisation framework. J. Environ. Manage. 342, 118069. doi: 10.1016/j.jenvman.2023.118069
Newbold T., Hudson L. N., Hill S. L. L., Contu S., Lysenko I., Senior R. A., et al. (2015). Global effects of land use on local terrestrial biodiversity. NATURE 520, 45–50. doi: 10.1038/nature14324
Obst C., Vardon M. (2014). Recording environmental assets in the national accounts. OXFORD Rev. OF ECONOMIC Policy 30, 126–144. doi: 10.1093/oxrep/gru003
Ouyang Z.-Y., Zheng H., Xie G., Yang W., Liu G., Shi Y., et al. (2016). Accounting theories and technologies for ecological assets, ecological compensation and scientific and technological contribution to ecological civilization. Acta Ecol. Sin. 36 (22), 7136–7139. doi: 10.5846/stxb201611142310
Pan N., Du Q., Guan Q., Tan Z., Sun Y., Wang Q. (2022). Ecological security assessment and pattern construction in arid and semi-arid areas: A case study of the Hexi Region, NW China. Ecol. Indic. 138, 108797. doi: 10.1016/j.ecolind.2022.108797
Qian Y., Dong Z., Yan Y., Tang L. (2022). Ecological risk assessment models for simulating impacts of land use and landscape pattern on ecosystem services. Sci. Total Environ. 833, 155218. doi: 10.1016/j.scitotenv.2022.155218
Raheem N., de Carvalho R. M. (2022). Imperiled: The Encyclopedia of Conservation. Eds. DellaSala D. A., Goldstein M. I. (Oxford: Elsevier), 1–6.
Raymond C. M., Bryan B. A., Macdonald D. H., Cast A., Strathearn S., Grandgirard A., et al. (2009). Mapping community values for natural capital and ecosystem services. Ecol. Econ. 68 (5), 1301–1315. doi: 10.1016/j.ecolecon.2008.12.006
Remme R. P., Edens B., Schröter M., Hein L. (2015). Monetary accounting of ecosystem services: A test case for Limburg province, the Netherlands. Ecol. Economics 112, 116–128. doi: 10.1016/j.ecolecon.2015.02.015
Ronchi S., Arcidiacono A., Pogliani L. (2020). Integrating green infrastructure into spatial planning regulations to improve the performance of urban ecosystems. Insights from an Italian case study. Sustain. Cities Soc. 53, 101907. doi: 10.1016/j.scs.2019.101907
Schägner J. P., Brander L., Maes J., Hartje V. (2013). Mapping ecosystem services' values: current practice and future prospects. Ecosyst. Serv. 4, 33–46. doi: 10.1016/j.ecoser.2013.02.003
Shen J., Guo X., Wang Y. (2021). Identifying and setting the natural spaces priority based on the multi-ecosystem services capacity index. Ecol. Indic. 125, 107473. doi: 10.1016/j.ecolind.2021.107473
Su W., Chen W., Guo R., Ru J. (2016). The occupation of river network by urbanrural land expansion in Taihu Basin. China J. Nat. Resour 34, 1289–1301.
Wang L., Wang S., Liang X., Jiang X., Wang J., Li C., et al. (2023). How to optimize high-value GEP areas to identify key areas for protection and restoration: the integration of ecology and complex networks. Remote Sens. 15. doi: 10.3390/rs15133420
Wang Z., Zhang L., Li X., Li Y., Fu B. (2021). Integrating ecosystem service supply and demand into ecological risk assessment: a comprehensive framework and case study. Landscape Ecol. 36, 2977–2995. doi: 10.1007/s10980-021-01285-9
Wei H., Fan W., Wang X., Lu N., Dong X., Zhao Y., et al. (2017). Integrating supply and social demand in ecosystem services assessment: a review. Ecosyst. Serv. 25, 15–27. doi: 10.1016/j.ecoser.2017.03.017
Wei H., Zhu H., Chen J., Jiao H., Li P., Xiong L. (2022). Construction and optimization of ecological security pattern in the Loess Plateau of China based on the Minimum Cumulative Resistance (MCR) model. J. Remote Sens. 14 (22), 5906. doi: 10.3390/rs14225906
Xepapadeas A. (2011). The economics of ecosystems and biodiversity: ecological and economic foundations. Environ. AND Dev. ECONOMICS 16, 239–242. doi: 10.1017/S1355770X11000088
Yang Y., Jia Y., Ling S., Yao C. (2021). Urban natural resource accounting based on the system of environmental economic accounting in Northwest China: a case study of Xi’an. Ecosyst. Serv. 47, 101233. doi: 10.1016/j.ecoser.2020.101233
Yu D.-Y., Pan Y.-Y., Liu X., Wang Y.-Y., Zhu W.-Q. (2006). Ecological capital measurement by remotely sensed data for Huzhou and its socio-economic application. Chin. J. Plant Ecol. 30, 404.
Zank B., Bagstad K. J., Voigt B., Villa F. (2016). Modeling the effects of urban expansion on natural capital stocks and ecosystem service flows: A case study in the Puget Sound, Washington, USA. Landscape Urban Plann. 149, 31–42. doi: 10.1016/j.landurbplan.2016.01.004
Zhang W., Wang W., Li X., Ye F. (2014). Economic development and farmland protection: An assessment of rewarded land conversion quotas trading in Zhejiang, China. Land Use Pol. 38, 467–476. doi: 10.1016/j.landusepol.2013.12.008
Zheng H., Wang L., Peng W., Zhang C., Li C., Robinson B. E., et al. (2019). Realizing the values of natural capital for inclusive, sustainable development: Informing China’s new ecological development strategy. Proc. Natl. Acad. Sci. 116 (17), 8623–8628. doi: 10.1073/pnas.1819501116
Keywords: ecological asset assessment, ecological security pattern, ecological management, spatial planning, comprehensive framework
Citation: Ren X and Yan F (2024) Integrating the social utilization status of ecological assets for spatial optimization management: a comprehensive framework. Front. Ecol. Evol. 12:1411290. doi: 10.3389/fevo.2024.1411290
Received: 02 April 2024; Accepted: 10 June 2024;
Published: 27 June 2024.
Edited by:
Salvador García-Ayllón Veintimilla, Polytechnic University of Cartagena, SpainReviewed by:
Anlu Zhang, Huazhong Agricultural University, ChinaCopyright © 2024 Ren and Yan. This is an open-access article distributed under the terms of the Creative Commons Attribution License (CC BY). The use, distribution or reproduction in other forums is permitted, provided the original author(s) and the copyright owner(s) are credited and that the original publication in this journal is cited, in accordance with accepted academic practice. No use, distribution or reproduction is permitted which does not comply with these terms.
*Correspondence: Fengying Yan, ZmVuZ3lpbmdAdGp1LmVkdS5jbg==
Disclaimer: All claims expressed in this article are solely those of the authors and do not necessarily represent those of their affiliated organizations, or those of the publisher, the editors and the reviewers. Any product that may be evaluated in this article or claim that may be made by its manufacturer is not guaranteed or endorsed by the publisher.
Research integrity at Frontiers
Learn more about the work of our research integrity team to safeguard the quality of each article we publish.