
94% of researchers rate our articles as excellent or good
Learn more about the work of our research integrity team to safeguard the quality of each article we publish.
Find out more
ORIGINAL RESEARCH article
Front. Ecol. Evol., 15 July 2024
Sec. Urban Ecology
Volume 12 - 2024 | https://doi.org/10.3389/fevo.2024.1407350
This article is part of the Research TopicExploring the Multifaceted Relationship Between Human Health and Urban Nature in Times of CrisesView all 8 articles
 Changqing Peng1,2†Kun Yang1,2,3†Tingfang Jia4Chunxue Shang5
 Anling Li1Xingfang Pei1Qingqing Wang1Rixiang Chen1Dingpu Li1
 Yi Luo1,3*
Introduction: Green sustainable development is an important part of the United Nations Sustainable Development Goals (SDGs) and China’s ecological civilization construction.
Methods: This paper combines the characteristics of the development of lakeside cities, gives full play to the advantages of modern remote sensing technology to collect the indicators related to the green sustainable development of lakeside cities, adopts the Analytic Hierarchy Process (AHP) and the CRiteria Importance Through Inter-criteria Correlation (CRITIC) subjective and objective weighting methods and the difference coefficient method to determine the weights of the indicators, evaluates the green sustainable development of a typical lakeside city of Kunming for more than 30 years, and analyzes the influencing factors using the gray degree of correlation.
Results: The results show the following: (1) From 1990 to 2021, the level of green sustainable development in the urban area around Dianchi Lake fluctuated in stages, with an overall upward trend, and the green development index increased from 0.25 in 1990 to 0.5 in 2021. (2) The coefficient of variance determined by the optimization model can be a better compromise between the objective and subjective weights of the indicators, and the massive occupation of wetlands and arable land around the lake in the urban expansion has become a major factor in the development of the city, with a combined weight of 10.30% and 8.79%, respectively. (3) The urban population and economic scale are currently the main drivers of the green and sustainable development of a lakeside city, with a correlation of 0.843 and 0.769, respectively.
Discussion: The growth of urban population and economic scale plays a pivotal role in driving the green and sustainable development of lakeside cities, while the potential impact of tourism development should also be considered.
Green development has a rich history, with early scholars addressing various concepts and concerns related to this topic. For instance, Malthus (1923) put forth “the theory of absolute scarcity of resources,” Ricardo (2010) highlighted how “natural resources constrain economic growth,” and Marsh (2001) emphasized “the negative impacts of industrialization on the natural environment.” However, it was not until the global financial crisis of 2008 that a universal consensus began to emerge regarding the necessity of green development. International organizations, such as the United Nations, and countries worldwide have since proposed green development plans (Skea and Nishiok, 2008; Barbier, 2011; UNEP, 2012; Wang et al., 2018) in an effort to revive their economies and gain a competitive edge in the new era. The Sustainable Development Goals (SDGs), which were proposed by the United Nations General Assembly in 2015, represented the shared aspirations of global stakeholders. They sought to balance economic, social, and cultural concerns while promoting economic, social, and environmental development. Additionally, they provided indicators and measurements to track progress toward the key SDGs (Barbier and Burgess, 2017; Fonseca and Carvalho, 2019). Currently, the traditional economic growth model is causing various problems worldwide, including ecological imbalances, environmental damage, climate anomalies, land quality degradation, resource depletion, and species extinction, which are creating dilemmas for human social development by oppressing resources and the environment. Many countries have made significant efforts to achieve a sustainable future through the formulation of green development strategies, policies, and actions. As the world’s largest developing country, China has prioritized development and has actively pursued the implementation of the sustainable development agenda. During the Fifth Plenary Session of the 18th Central Committee of the Communist Party of China (CPC) in 2015, General Secretary Xi Jinping introduced the new development philosophy of innovation, coordination, greenness, openness, and sharing. Among these, “green” development is essential for achieving sustainable development. However, the assessment of green sustainable development in China faces challenges due to the complex and diverse natural environment, regional socio-economic imbalances, and limitations such as insufficient data and research methodology. Furthermore, green development is a multifaceted system that encompasses economic, social, and ecological aspects, requiring a comprehensive consideration of various factors during evaluation.
With the increasing number of concepts and practices related to green development, research on the measurement model of green development level and its application has been increasingly emphasized. Cheng and Ge (2020) used the entropy weighting method combined with GIS visualization and related spatial change parameters to examine the spatial characteristics of green development of Belt and Road countries. Carli et al. (2018) employed the AHP decision-making technique in a smart metropolitan environment to analyze the sustainable development of energy, water, and environmental systems using objective performance indicators. Yang et al. (2022) used a super-efficiency epsilon-based measure model that included undesirable output to evaluate the green development efficiency of seven urban agglomerations in China. Kawakubo et al. (2018) introduced the Urban CASBEE integrated assessment system, which evaluates the sustainability of cities and communities worldwide based on SDG indicators and greenhouse gas emissions. Qiu et al. (2020) analyzed the spatial–temporal heterogeneity of green development efficiency and its influencing factors in the growing Xuzhou Metropolitan Area for the period 2000–2015. The slacks-based measure (SBM) model, spatial autocorrelation, and the geographically weighted regression (GWR) model were used to conduct the analysis. Guo et al. (2020) developed an assessment framework that includes the economic, social, and environmental greening indexes, and a level of government support to evaluate green development.
Socio-economic statistics serve as the primary data source for assessing green development at various scales. For instance, Xian et al. (2020) analyzed data from the 2018 Sichuan Provincial Yearbook and local bulletins to evaluate 18 indicators across five cities, resulting in a suitable green development indicator system for the Tuojiang River basin. Wang et al. (2018) constructed an urban green development evaluation index system by directly obtaining or indirectly calculating data from the Statistical Yearbook, Water Resources Bulletin, Environmental Status Bulletin, and environmental databases of nine cities in the Pearl River Delta. In assessing the green economy development of 15 sub-provincial cities in China, Shi et al. (2016) utilized data from statistical yearbooks and identified favorable and unfavorable factors for urban green economy development. Long et al. (2021) employed a dynamic evaluation method based on panel data to evaluate the green development level of 30 coal-resource-based cities in China. Feng et al. (2017) estimated the global pattern of green development performance and its influencing factors by analyzing data and panel data from 41 regions (including 165 countries/subregions) using the green development performance index. Remote sensing information products also play a significant role in sustainability evaluation. For example, Watmough et al. (2019) employed satellite remote sensing data to explain up to 62% of the variation in household wealth levels in rural areas of western Kenya, indicating the potential of satellite data in supporting the data revolution required to monitor SDGs, especially those related to poverty eradication and inclusivity. Mulligan et al. (2020) utilized remote sensing and spatial ecosystem service modeling to investigate nature’s contribution to the goals under SDG 6. In summary, socio-economic statistics and remote sensing data have been extensively utilized in assessing and monitoring green development and sustainability. These approaches provide valuable insights into the progress and challenges associated with achieving SDGs.
Scholars worldwide have extensively researched the assessment of green development in cities, both theoretically and practically. However, there are several notable issues that still require attention in this field. Firstly, the current indicator system predominantly adopts an “anthropocentric” perspective, emphasizing the measurement of the relationship between economic development, resource utilization, and environmental degradation. This approach often neglects the desired state of the ecological environment system itself. Secondly, effectively balancing the weights of subjective and objective indicators in assessment methodologies presents a challenge. The meaningful harmonization of these weights is a difficult task to accomplish. Thirdly, most studies rely on data collected at administrative divisions such as provinces, counties, and townships, and these studies primarily employ statistical data, which fail to capture the true spatial distribution and heterogeneity of cities. Lastly, while remote sensing has been utilized in sustainability assessments, the focus has primarily been on individual sustainability goals. The potential of remote sensing data in establishing a methodology and framework for evaluating a composite sustainability index remains largely unexplored.
Plateau lakeside cities not only exhibit the typical laws and characteristics of urban development but also possess unique features. Ensuring green development that aligns with the SDGs index system and reflects China’s new development concept is a crucial challenge for the sustainable development of plateau lakeside cities. Kunming, as a representative plateau lakeside city centered around Dianchi Lake, has witnessed continuous improvement in urbanization level and quality since the 1990s. However, years of urban expansion, population growth, economic development, and excessive emissions have exerted significant pressure on the ecological environment of lakes and their surrounding areas. Therefore, implementing green development measures holds immense significance in enhancing the ecological environment of lakes, transforming the production and lifestyle patterns of urban residents, and promoting regional sustainability.
Space-based Earth observation technologies offer unique advantages and are increasingly recognized as crucial for understanding the Earth system and extracting knowledge. They provide a fresh perspective for monitoring and assessing SDGs. By utilizing the diverse metadata sets generated through remote sensing monitoring, cities can undergo more sophisticated spatial and temporal analyses. This enables a deeper understanding of urban dynamics and supports effective decision-making processes.
Drawing on the research conducted by Zhang et al. (2016) and relevant empirical evidence from various institutions and countries (OECD, 2011; UNEP, 2012; Alfsen et al., 1987; Czech Statistical Office, 2011; National Institute of Statistics and Geography of Mexico (INEGI), 2011; Statistics Netherlands, 2011), this study explores the dimensions of urban green development. Specifically, it encompasses two dimensions: the integration of “greening” into economic activities and the promotion of a healthy green supply. Employing modern remote sensing technology and geographic information technology, this paper collects observational data to establish green sustainable development indicators for the second dimension of urban green development in the vicinity of Dianchi Lake, a plateau lakeside city. The study assesses the performance of green sustainable development over a period of more than 30 years, analyzes its patterns of change, and identifies the key factors influencing the green sustainable development of lakeside cities.
The focus of this paper is the urban area surrounding Dianchi Lake, which is not defined by administrative divisions but rather as part of Kunming, a megacity situated in the central Yunnan urban agglomeration on the Yunnan–Guizhou Plateau, often referred to as the “Pearl of the Plateau.” Kunming experiences a low-latitude plateau mountain monsoon climate due to its location in the middle of the Yunnan–Guizhou Plateau, characterized by low latitude and high altitude. The presence of plateau lakes such as Dianchi Lake and Yangzonghai Lake helps regulate temperature and humidity. Additionally, influenced by warm and humid air flows from the southwest Indian Ocean, the region enjoys abundant sunshine and a short frost period, resulting in a pleasant year-round spring-like climate. Human settlements around Dianchi Lake date back as early as 30,000 years ago, making it one of the first national historic and cultural cities. Since the 1990s, with significant economic development, the built-up area of Kunming has expanded considerably. The impervious area has grown at a rate of 237.29 km/10 years (Lin et al., 2021). The urban population has also increased from 1.48 million in 1990 to 6.74 million in 2020. However, this rapid urbanization has led to severe conflicts between human activities and land use, resulting in substantial damage to the ecological sustainability of the lake and terrestrial ecosystems. In this study, we selected the urban boundaries and Dianchi Lake in the Dianchi Lake area of Kunming for analysis in various years, including 1990, 1995, 2000, 2005, 2010, 2015, and 2018, as our study area (Figure 1).
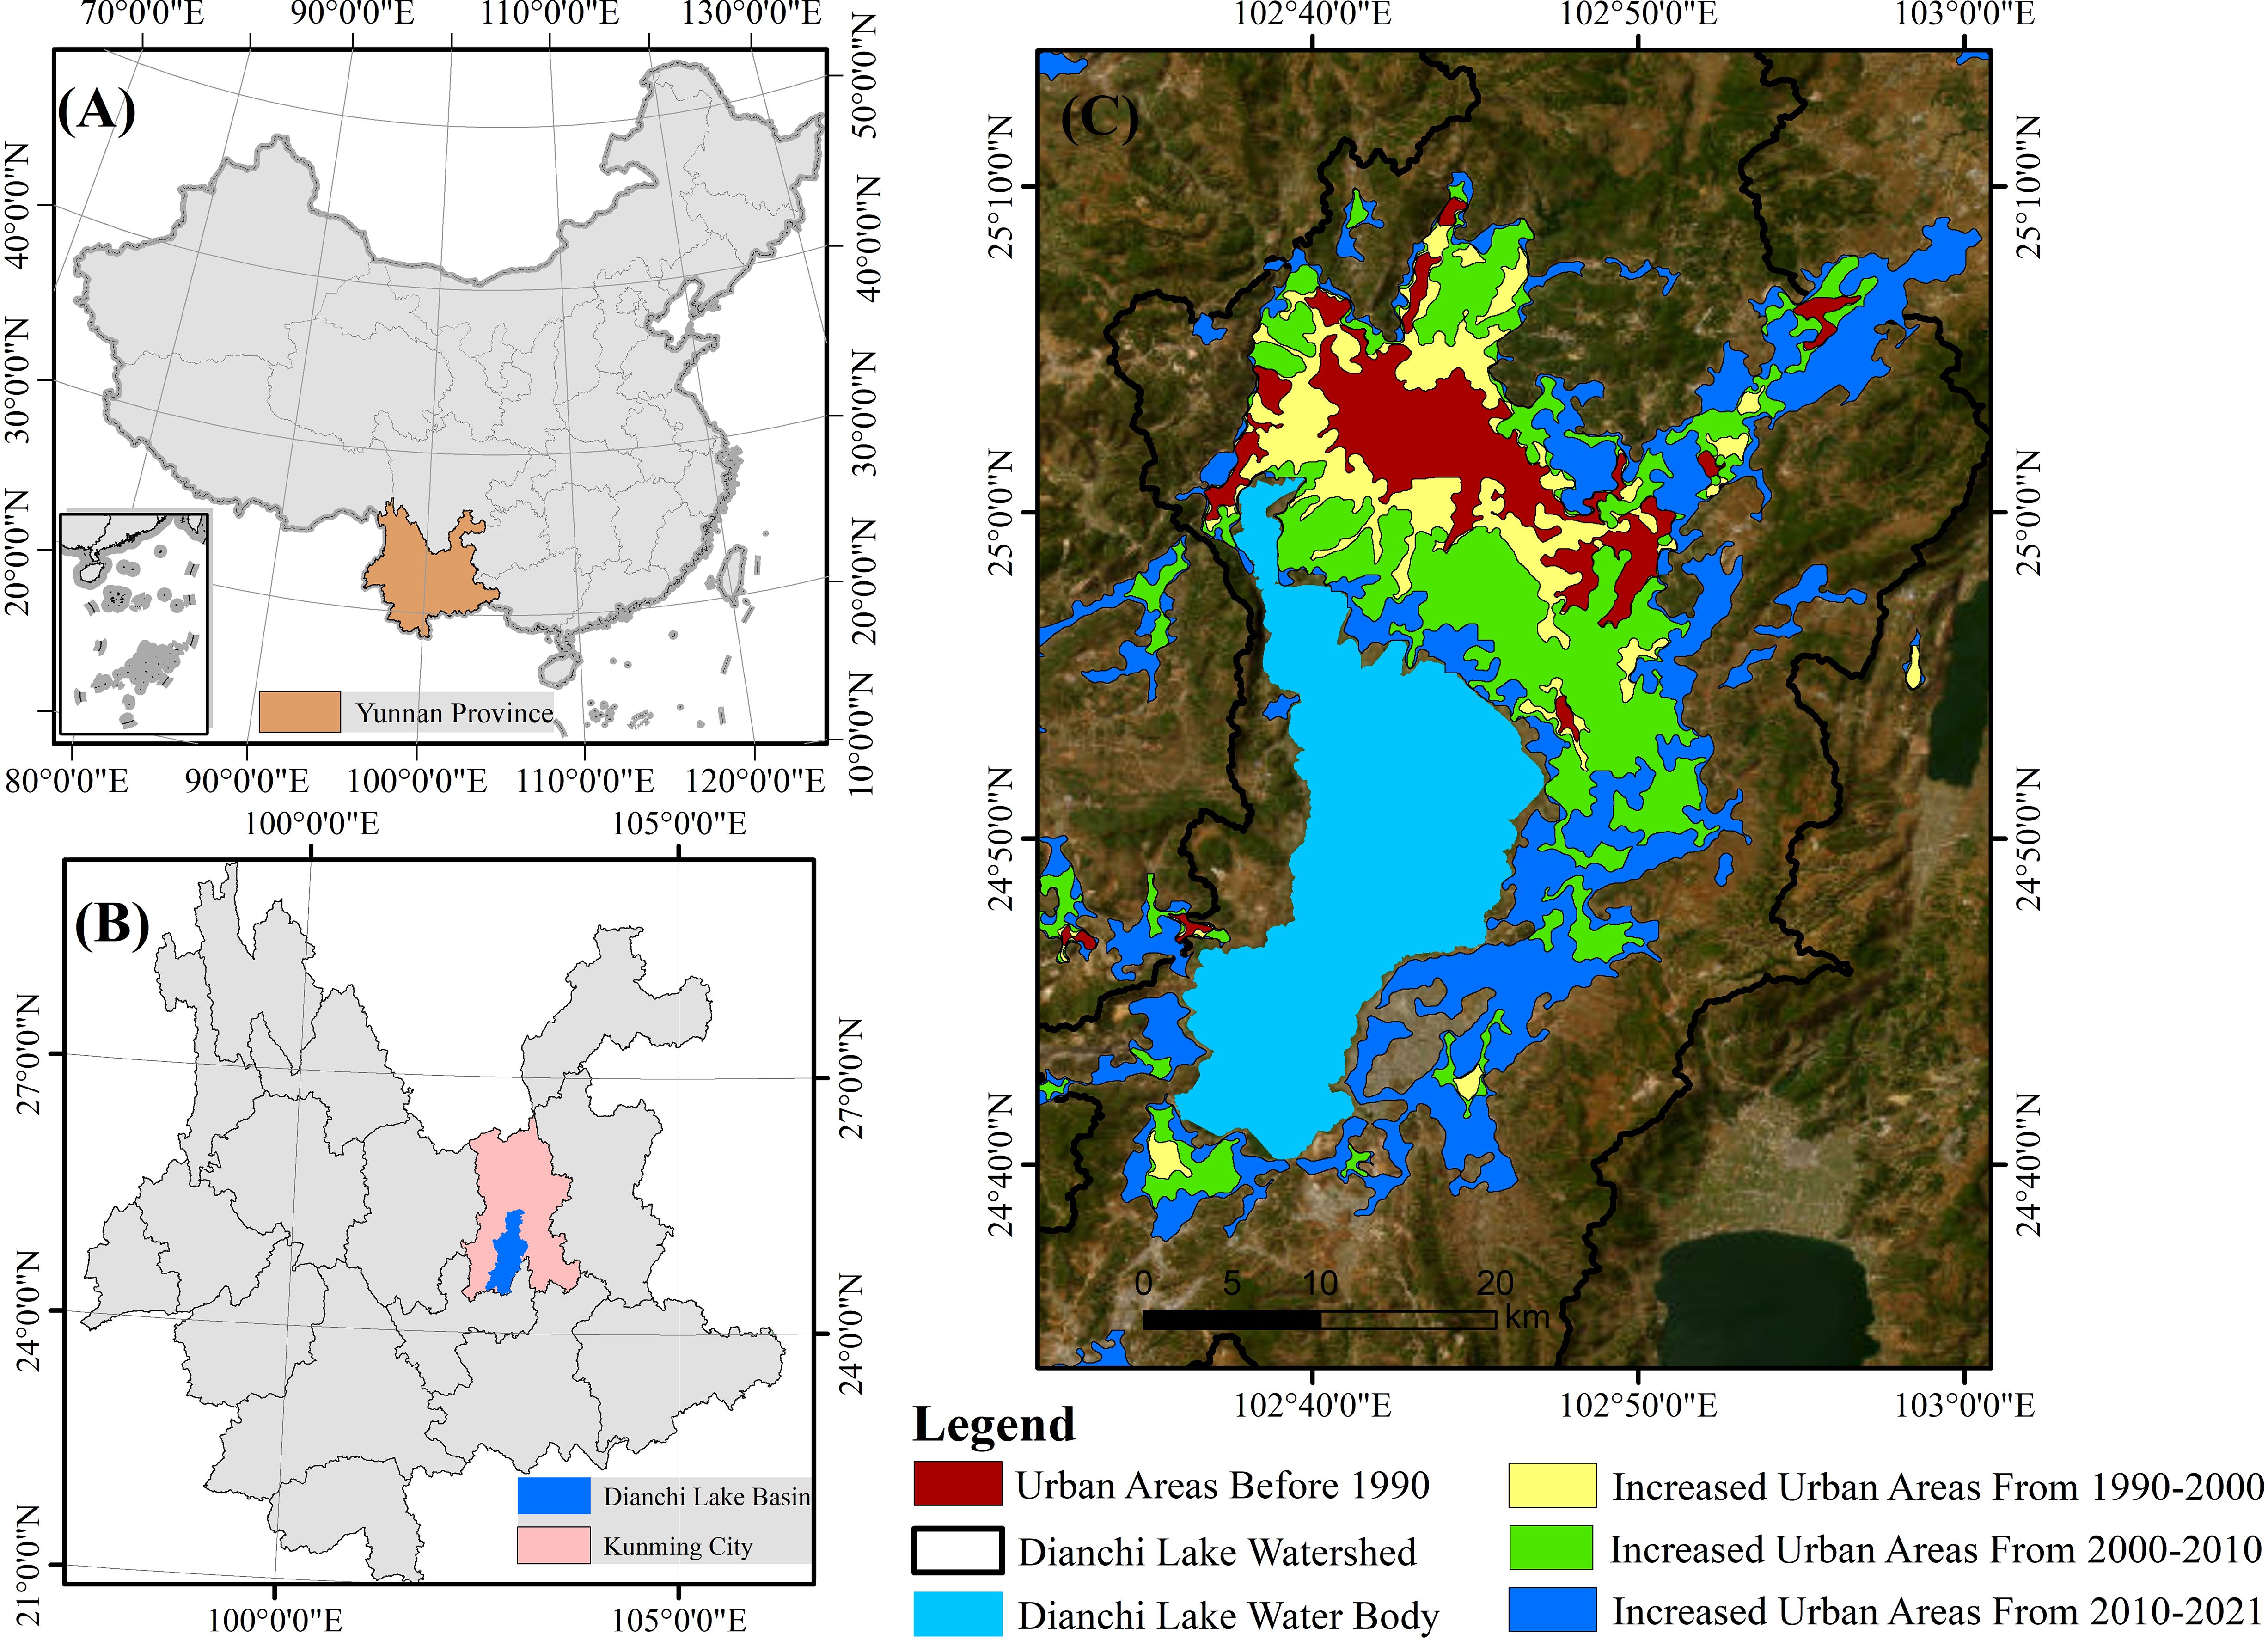
Figure 1 Study area. (A) Location of Yunnan in China. (B) Location of Dianchi Lake Basin in Yunnan. (C) Location of the urban area around Dianchi Lake in the Dianchi Lake Basin.
Indicators used to evaluate green sustainable development should align with international standards, national policies, and local implementation strategies. By incorporating international perspectives, national objectives, and localized approaches, the indicator system can effectively guide and support the pursuit of green development at the regional level. This comprehensive approach ensures that regional initiatives align with global and national priorities while also addressing specific local needs and conditions. Furthermore, green sustainable development indicators should meet public expectations by bringing economic and health benefits, contributing to climate change mitigation and adaptation, offsetting negative environmental and societal impacts of development, and enhancing quality of life (Pakzad and Osmond, 2016). Taking into account these considerations and referring to the Green Development Indicator System issued by the National Development and Reform Commission, this study employs modern remote sensing technology and geographic information technology to construct a set of 18 indicators for quantifying and evaluating the green sustainable development of Kunming (Table 1).
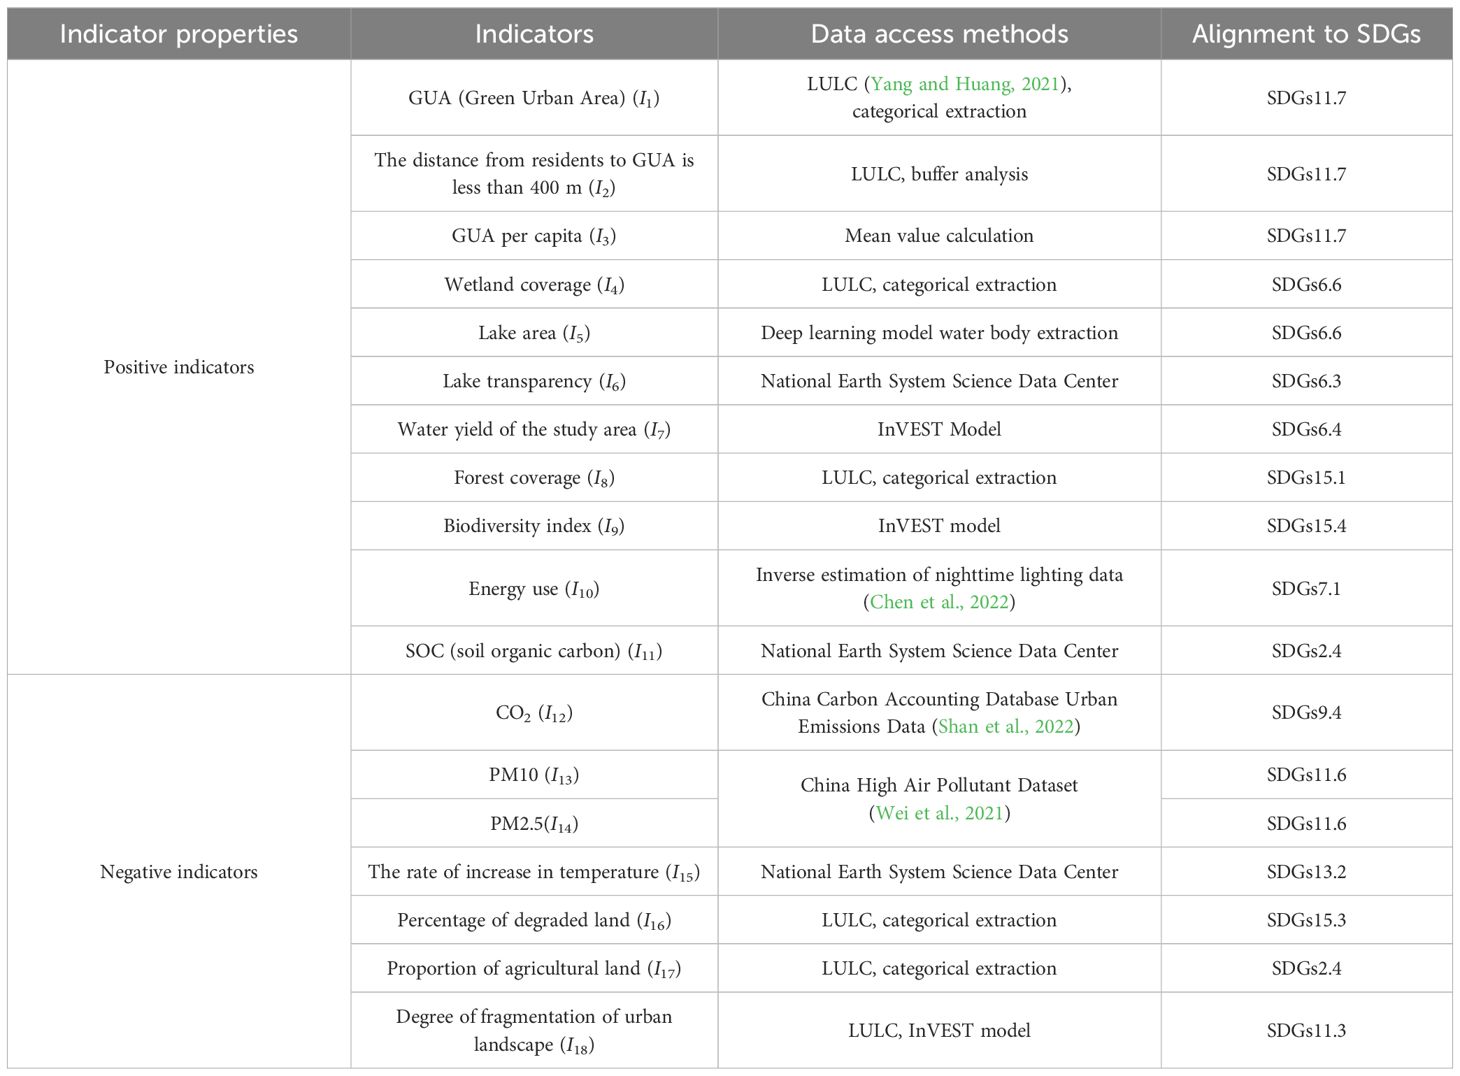
Table 1 Indicator system of green sustainable development for plateau lakeside cities.
To facilitate comparison and evaluation of the indicators, it is essential to standardize the original data due to variations in magnitude, units, dimensions, ranges, and impacts of different indicators on development assessment. The Min–Max standardization method is employed, which scales the data to a standardized range between 0 and 1. Each index is standardized using Equations 1 and 2:
Positive indicators use:
Negative indicators use:
where xij is the original value of indicator i in year j, zij is the normalized value of indicator i in year j (i = 1, 2, 3, … n; j = 1, 2, 3, … m), and maxj(xij) and minj(xij) are the maximum and minimum values of indicator i in all years j, respectively.
The Analytic Hierarchy Process (AHP) is a quantitative analysis method widely used in various fields, including sustainable development. It enables the determination of the relative importance of different factors and facilitates the evaluation of decision-making schemes’ advantages and disadvantages. In the context of sustainable development, the AHP method has been applied to diverse areas, such as sustainable urban planning (Tian et al., 2013; Carli et al., 2018), energy management (Väisänen et al., 2016; Wang et al., 2017; Shah, 2020; Albayrak and Demirtas, 2016), environmental protection (Yu et al., 2019), identification of risk factors for infectious disease spread (Ghorui et al., 2021), and socio-economic development (D’Adamo and Rosa, 2016). The AHP method is utilized to determine the weight of indicators. However, its subjectivity lies in the judgment matrix. The judgment matrix values are derived from a comprehensive balance of objective data, previous research experience, expert opinions, and analysts’ understanding. Consequently, the judgment matrix may lack consistency. To address this issue, AHP calculates the consistency ratio (CR) (Saaty, 2008) to assess and improve the consistency of the judgment matrix. The CR is defined as shown in Equation 3:
Here, RCI is the stochastic consistency index, which is the average of the consistency indicators computed from the randomly occurring judgment matrices, and CI is the matrix in terms of λmax, which is the consistency index of the largest eigenvalue, as shown in Equation 4.
In general, the smaller the CR, the better the consistency of the judgment matrix, and it is usually considered that when CR < 0.1, the judgment matrix is considered acceptable; in contrast, the judgment may be unreliable and must be elicited again.
Furthermore, it is crucial to acknowledge that there exist correlations between some of the selected indicators, which is a significant aspect that cannot be overlooked. The AHP method has already established the subjective weights of each indicator based on their relative importance to green sustainable development. The CRiteria Importance Through Inter-criteria Correlation (CRITIC) method calculates the weights of indicators by comprehensively considering data volatility and correlations. Its fundamental concept is based on two key factors. The first factor is contrast intensity, which measures the magnitude of the value gap between evaluation schemes of the same indicator using standard deviation. In other words, the standard deviation represents the difference in values among the schemes for the same indicator. A larger standard deviation indicates a greater difference in values among the schemes. Secondly, it accounts for conflicts between evaluation indicators, taking into consideration the interrelationships and potential conflicts between different indicators. The conflict between indicators is based on the correlation between indicators. If there is a strong positive correlation between two indicators, it means that the conflict between the two indicators is low, which can be quantified as , where is the correlation coefficient between the evaluation indicators Im and In. The objective weight determination of each indicator is measured by the synthesis of contrast strength and conflict, and let denote the amount of information contained in the In indicator, then can be expressed as shown in Equation 5:
The larger is, the more information indicator In contains and the more important the indicator is; thus, the objective weight W” of indicator In should be as shown in Equation 6:
In order to reflect both subjective and objective weights, the coefficients for determining the combination weights are the established α and β of the optimization model, such that the composite weight vector is as shown in Equation 7:
where α and β are the coefficients to be determined for the subjective–objective combination to be assigned, satisfying α,β ≥ 0 and α + β = 1. In this paper, the difference coefficient method is used to determine the value of α,β, as shown in Equation 8:
where T′ is the coefficient of variation of the components of W′, as shown in Equation 9:
is the rearrangement of the components in the subjective weight vector W′ from smallest to largest, and n is the number of indicators. , substituting into Equation 7 to obtain the composite weight vector of each indicator.
The green development index (GDI) is calculated from the weighted average of the individual indexes of 18 remotely sensed inversions, and the formula is: , . G is the GDI, Yi is the individual index of the index, n is the number of the indexes, and Wi is the composite weight value of index i.
The effective implementation of local sustainable development plans is influenced by key factors such as economic scale structure, political culture, and social development variables. In selecting the driving factors, we consider their representativeness, scientific basis, data availability, applicability of statistical standards to urban areas, and relevant research findings in various fields (Wang et al., 2024; Chen et al., 2015; Li et al., 2013; Yang et al., 2018; Li et al., 2021; Guo et al., 2022). We have identified a comprehensive set of factors that impact the establishment of green sustainable development in lakeside cities and have made preliminary judgments on each variable, as presented in Table 2. The economic scale and industrial structure are crucial aspects of the economic development of a region or country. A larger economic scale generates greater resources, fostering a diversified and competitive industrial structure, and enabling increased investment in capital and technical support for environmental management. Therefore, we use GDP per capita to measure the economic scale of the study area, the output value of the secondary industry (OVSI), and the output value of the tertiary industry (OVTI) to represent the industrial structure. Marketization processes, if blindly and irrationally pursued, can lead to environmental issues. Government regulation is necessary to ensure proper market behavior. Thus, government regulation significantly influences environmental efficiency, and the government’s intervention in the market is reflected through the growth rate of fixed asset investment (GRFAI). As the capital of Yunnan Province, Kunming serves as the gateway to the southwest region of China, facing South and Southeast Asia. It possesses abundant animal and plant resources and a unique climate. Since the reform and opening up, Kunming has attracted numerous business investments and tourists, which has put pressure on the ecological environment. Therefore, we utilize total import and export trade (TIEV) and total tourism income (TIFT) to represent the city’s openness and vitality. Scientific innovation is a vital factor in sustainable society development. Research suggests that improving technological capability plays a crucial role in enhancing productivity and environmental performance (Fisher-Vanden and Wing, 2008; Ang, 2009). Advanced technological innovation contributes to better energy conservation and environmental indicators. Thus, we employ the number of authorized patents as a proxy for scientific innovation. Regarding social development, population serves as a fundamental basis. Population growth brings forth various environmental challenges for cities, and the disposable income of residents is closely related to social consumption. Therefore, urban population and urban residents’ disposable income serve as indicators of social development. The primary data for the aforementioned influencing factors are derived from the Kunming Statistical Yearbook and Yunnan Statistical Yearbook.
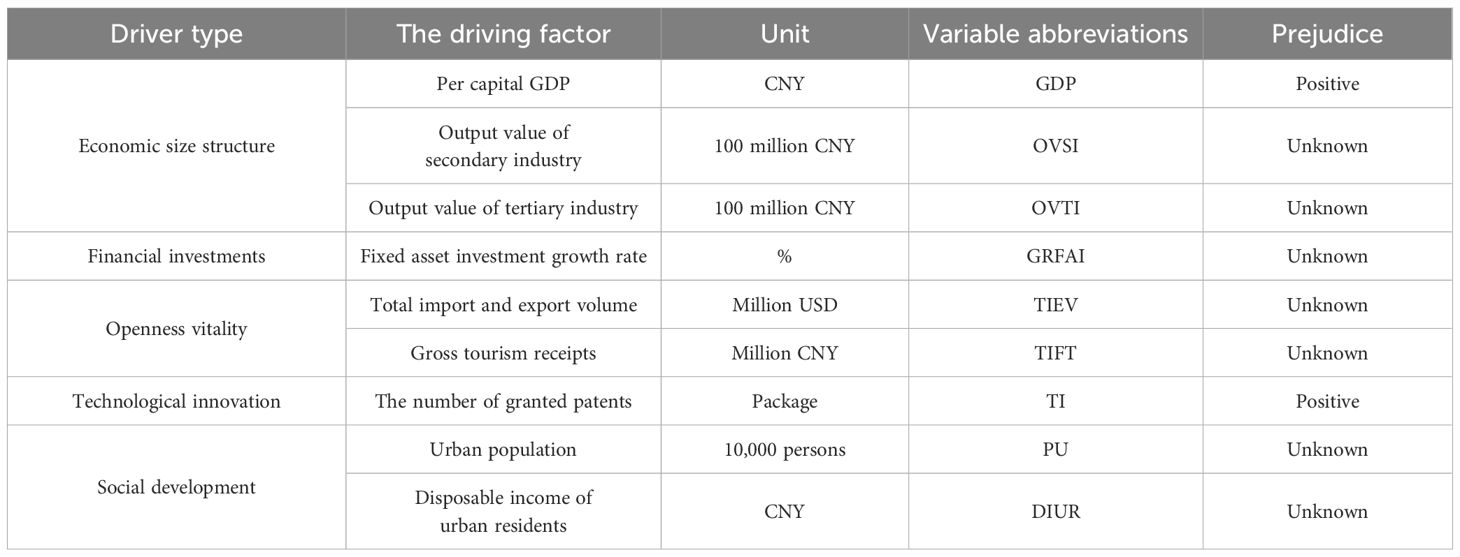
Table 2 Impact factors and related symbols.
The gray correlation method was used to further explore the factors affecting the green sustainable development of lakeside cities. Gray correlation analysis is a quantitative analysis of the similarity between the influencing factors and behavioral results, which is used to analyze the correlation between the reference series and the comparable series; each influencing factor is the comparable series, and the GDI is the reference series, as shown in Equation 10:
where is a comparable sequence xi (xi = xi (k) = {xi (1), xi (2),…, xi (n)}, k = 1, 2,…, n, i = 1, 2,…, m) and the reference sequence x0 (x0 = x0 (k) = {x0 (1), x0 (2),…, x0 (n)} k = 1, 2,…, n), the gray correlation coefficients at time k. xi and x0 are subject to a dimensionless treatment, and ρ is a differentiation factor, usually assumed to be 0.5.
The GDI formula was used to calculate the green sustainable development quality of cities around Dianchi from 1990 to 2021 (Figure 2). The results demonstrate a fluctuating stage-wise pattern with an overall upward trend in the green sustainable development level of the city. During the period from 1990 to 1994, Kunming City’s GDI exhibited an upward trend, ranging from 0.258 to 0.313. The years 1993 to 1994 experienced the highest growth rate, followed by a return to average growth, indicating that the city’s early construction phase presented significant opportunities alongside environmental risks. From 1995 to 2001, Kunming’s GDI gradually increased from 0.290 to 0.495, indicating progress in environmental protection and sustainable development, likely influenced by the government’s environmental policies and increased investment. The period from 2002 to 2009 witnessed the most fluctuation in Kunming’s GDI, with the peak rate of change occurring in 2005 and 2009. During this time, the city faced intense developmental pressures leading to environmental challenges. However, upon recognizing these issues, proactive efforts were undertaken to improve the situation. From 2010 to 2021, Kunming’s GDI remained relatively stable, with minor fluctuations. The overall level remained high, particularly after 2015, indicating a balance between urban development and green initiatives. However, certain uncertainties continue to cause fluctuations in the city’s green development.
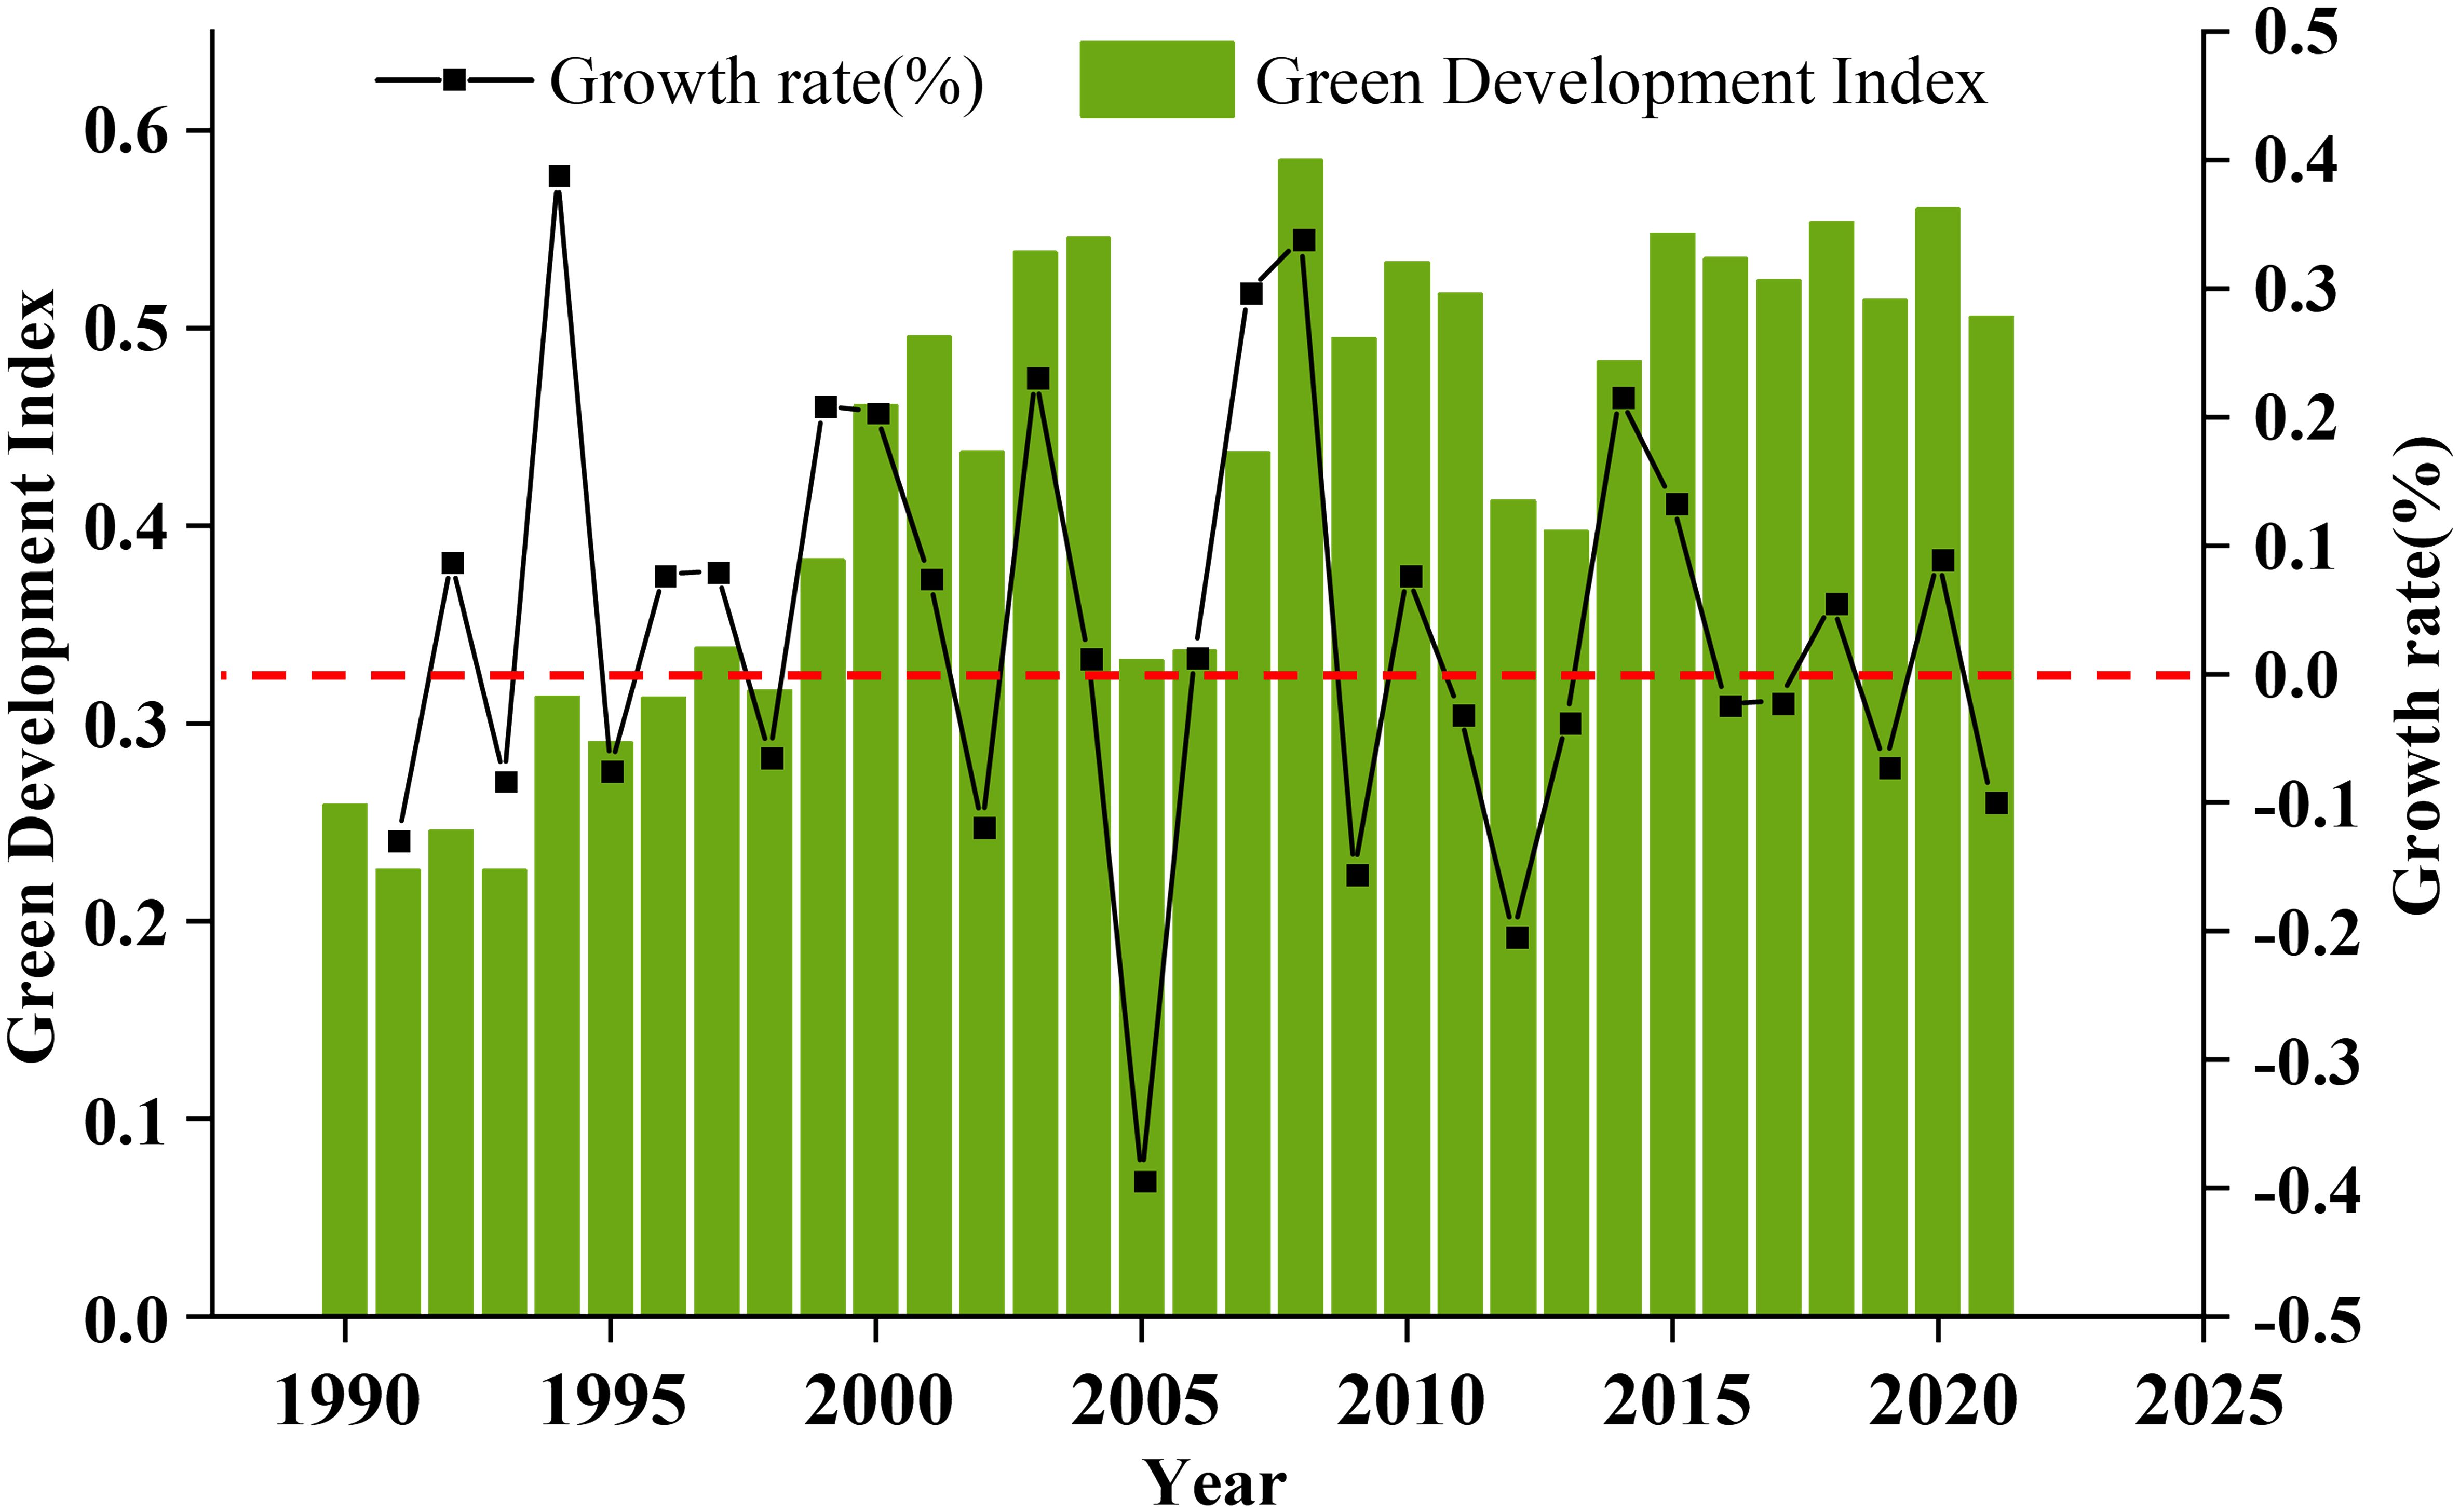
Figure 2 Green development index (GDI).
In the subjective weighting process, we employed the AHP multi-criteria decision-making method to establish a pairwise comparison matrix of indicators (Table 3). The comparison matrix reveals the significance of Green Urban Areas (GUAs) in Kunming’s green sustainable development. GUAs play a crucial role in providing ecosystem services, absorbing dust, enhancing air quality, promoting a green and healthy lifestyle, and facilitating recreational activities. However, it appears that certain factors related to GUA have greater importance than the actual area occupied by GUA in urban areas. Specifically, the walking distance of residents to GUA, the per-capita GUA, and the degree of urban green landscape fragmentation hold more weight, with contrast weights of 1.465, 1.327, and 2.151, respectively. These weights indicate that urban planners should strategically plan the distribution of GUAs based on population density and growth. By reducing the walking distance to GUA, residents are more likely to utilize GUA frequently, leading to increased per-capita occupancy. As shown in Figure 3A, the 23-km-long Dianchi Greenway around the Caohai section allows citizens to enjoy the ecological, health, and social benefits it provides. Furthermore, indicators directly related to lakes, such as wetland area, lake area, lake trophic index, and lake basin water yield, share similar eigenvalues in the comparison matrix. These eigenvalues are 0.724, 0.824, 0.778, and 0.820, respectively, reaffirming the significance of lakes in local green and sustainable development. Protecting lakes not only preserves valuable ecological assets like wetlands but also maintains essential ecosystem services such as water resource regulation, flood control, and biodiversity preservation. Moreover, lakes serve as a vital source of clean water for urban residents, thereby improving water quality. The forest coverage remains crucial for urban green sustainable development. The contrast weight consistently exceeds one, indicating its high significance, with an eigenvector of 1.183. Forests provide ecological functions such as carbon storage, climate regulation, and biodiversity protection, which complement urban functions. Moreover, forests contribute to economic development by supplying wood, pulp, and fuel wood, creating employment opportunities and economic benefits in the wood and forestry industries. They also support ecotourism and leisure activities, bringing economic opportunities to local communities and enhancing overall human wellbeing. Conversely, biodiversity receives relatively less emphasis in terms of comparison weight, with the lowest characteristic value. This observation reflects the primary functions of cities, such as human habitation, commercial activities, cultural centers, education, political administration, transportation, and infrastructure provision. Cities and biodiversity share a complex and contradictory relationship. Urbanization poses challenges to biodiversity, given that cities predominantly revolve around human activities. However, cities also possess the potential to drive biodiversity conservation and sustainable development. As shown in Figures 3B, C, by implementing sound urban planning and effective environmental management, and fostering public participation, the negative impact of cities on biodiversity can be mitigated, promoting the harmonious coexistence of urban areas and nature. Furthermore, energy utilization stands out prominently in terms of comparison weight. Among the 16 indicators, all exhibit weights greater than one, with an eigenvalue of 1.502. In recent years, the advancement of science and technology has diversified energy sources. Renewable energy, such as solar, wind, and hydropower, with their low or zero carbon emissions, have become increasingly prominent compared to traditional fossil fuels. The utilization of clean energy in cities offers numerous benefits, including reducing greenhouse gas emissions, combating climate change, and improving air quality by minimizing air pollution. The development of the clean energy industry presents new economic opportunities for urban areas, as it reduces energy costs, enhances energy efficiency, and promotes sustainable urban economic growth. Furthermore, clean energy adoption decreases reliance on imported energy, enhances energy security, and positions cities as environmental protection and sustainable development models. This positive image attracts investment, talent, tourists, and other valuable resources, thereby fostering the city’s sustainable development and prosperity. However, rapid urbanization has resulted in significant land use changes, including increased impervious areas, extensive soil sealing, and land wastage. These changes have substantially reduced the availability of soil for green vegetation, hampered the degradation of pollutants by microorganisms, and caused a decline in soil organic carbon content. Consequently, urban ecosystems struggle to provide suitable habitats for animals and plants, severely impacting the ecological balance. Evaluating and measuring green development becomes a vital indicator for addressing these challenges. In plateau lakeside cities, air quality indicators such as PM10 and PM2.5 have a relatively limited influence on green and sustainable development. This is attributed to natural factors such as high terrain, abundant mountains, complex topography, cool climate, stable atmospheric circulation, and extensive vegetation coverage in these lakeside cities. Additionally, the relatively lower population density and slower economic development in the western region contribute to less emphasis on regional ecological construction. However, lakeside cities still face common challenges, including carbon dioxide emissions and regional temperature rise. The temperature increase exacerbates extreme weather events such as rainstorms and droughts, posing threats to infrastructure, residents’ wellbeing, industrial production, and ecosystems. These challenges hinder the sustainable development of plateau lakeside cities.The objective weighting analysis (Table 4) using the CRITIC weighting method reveals significant weights assigned to wetland area (10.71%) and agricultural productive land area (10.04%) in lakeside cities. These findings vividly demonstrate the urban expansion that has occurred over the past 30 years. Remote sensing data on land use change confirm that the inland expansion of lakeside cities primarily encroaches upon wetlands surrounding the lake, with some encroachment on cultivated land facing the mountains. This heavy reliance on wetlands and cultivated land for urban expansion is not conducive to sustainable urban planning. Furthermore, indicators with higher variability have been assigned greater weights in the analysis. GUA receives a weight of 7.57%, while biodiversity status, carbon dioxide emissions, PM10, and PM2.5 receive weights of 6.74%, 6.85%, 7.08%, and 6.82%, respectively. Additionally, the selected indicators exhibit significant variability, with a conflict value exceeding 14 and the highest conflict value reaching 21.129. This indicates that the selected indicators possess limited correlation and effectively represent various aspects of urban green development evaluation.
Table 3 Two-by-two comparison matrix for AHP.
Figure 3 Urban development conservation effectiveness map. Image source: (A, B) https://www.thepaper.cn/newsDetail_forward_26507155; (C) https://finance.sina.com.cn/jjxw/2021–11-18/doc-iktzscyy6349207.shtml.
Table 4 Results of CRITIC weight calculation.
In the integrated assignment (Figure 4), the optimization model determines the coefficient of variation with a value of 0.106 for α and 0.894 for β. The model assigns a lower weight to subjective weight and a higher weight to objective weight, emphasizing a comprehensive weighting approach based on actual data conditions, including correlation, volatility, and mean value. This approach allows for the reflection of objective data facts while considering subjective input. To evaluate the green sustainable development of lakeside cities more effectively using the established indicators, certain indicators stand out prominently, namely, I10, I11, I16, and I18. Although subjective weight initially appears high, the model optimization process adjusts the final comprehensive weight to a lower level, ensuring the stability and robustness of the indicator system.
Figure 4 Indicator weighting charts.
The indicators of green sustainable development in the study area exhibit distinct temporal variation throughout the study period (Figure 5). The proportion of GUA experienced an initial upward trend from 1990 to 2005, followed by a subsequent decline from 2006 to 2021. During the early stages of urban development, particularly in the early 21st century, the green city area accounted for over half of the total urban area, reaching a peak of 52.54%. Simultaneously, the GDI of the city reached a high level, peaking at 0.538. However, since then, the proportion of green city areas has steadily diminished, with a corresponding increase in urban impervious surfaces (Figure 6). Several positive indicators exhibited a stepwise upward trend, including the decrease in distance between residents and GUA to less than 400 m, per-capita GUA, forest coverage, and soil organic carbon. The distance between residents and GUA within the 400-m range increased from 214 km² to 1,514 km², marking a sevenfold increase. The minimum per-capita GUA was 33 m², while the maximum reached 86.3 m². Forest coverage also witnessed an increase from 0.25% to 4.35%. Meanwhile, other indicators displayed fluctuating growth or decline. Notably, the lake area, lake water quality indicators, water yield, biodiversity index, and temperature growth rate exhibited the most significant fluctuations, indicating lingering issues in water environment management, biodiversity protection, and climate response within the study area. These factors contribute to the instability of regional green sustainable development.
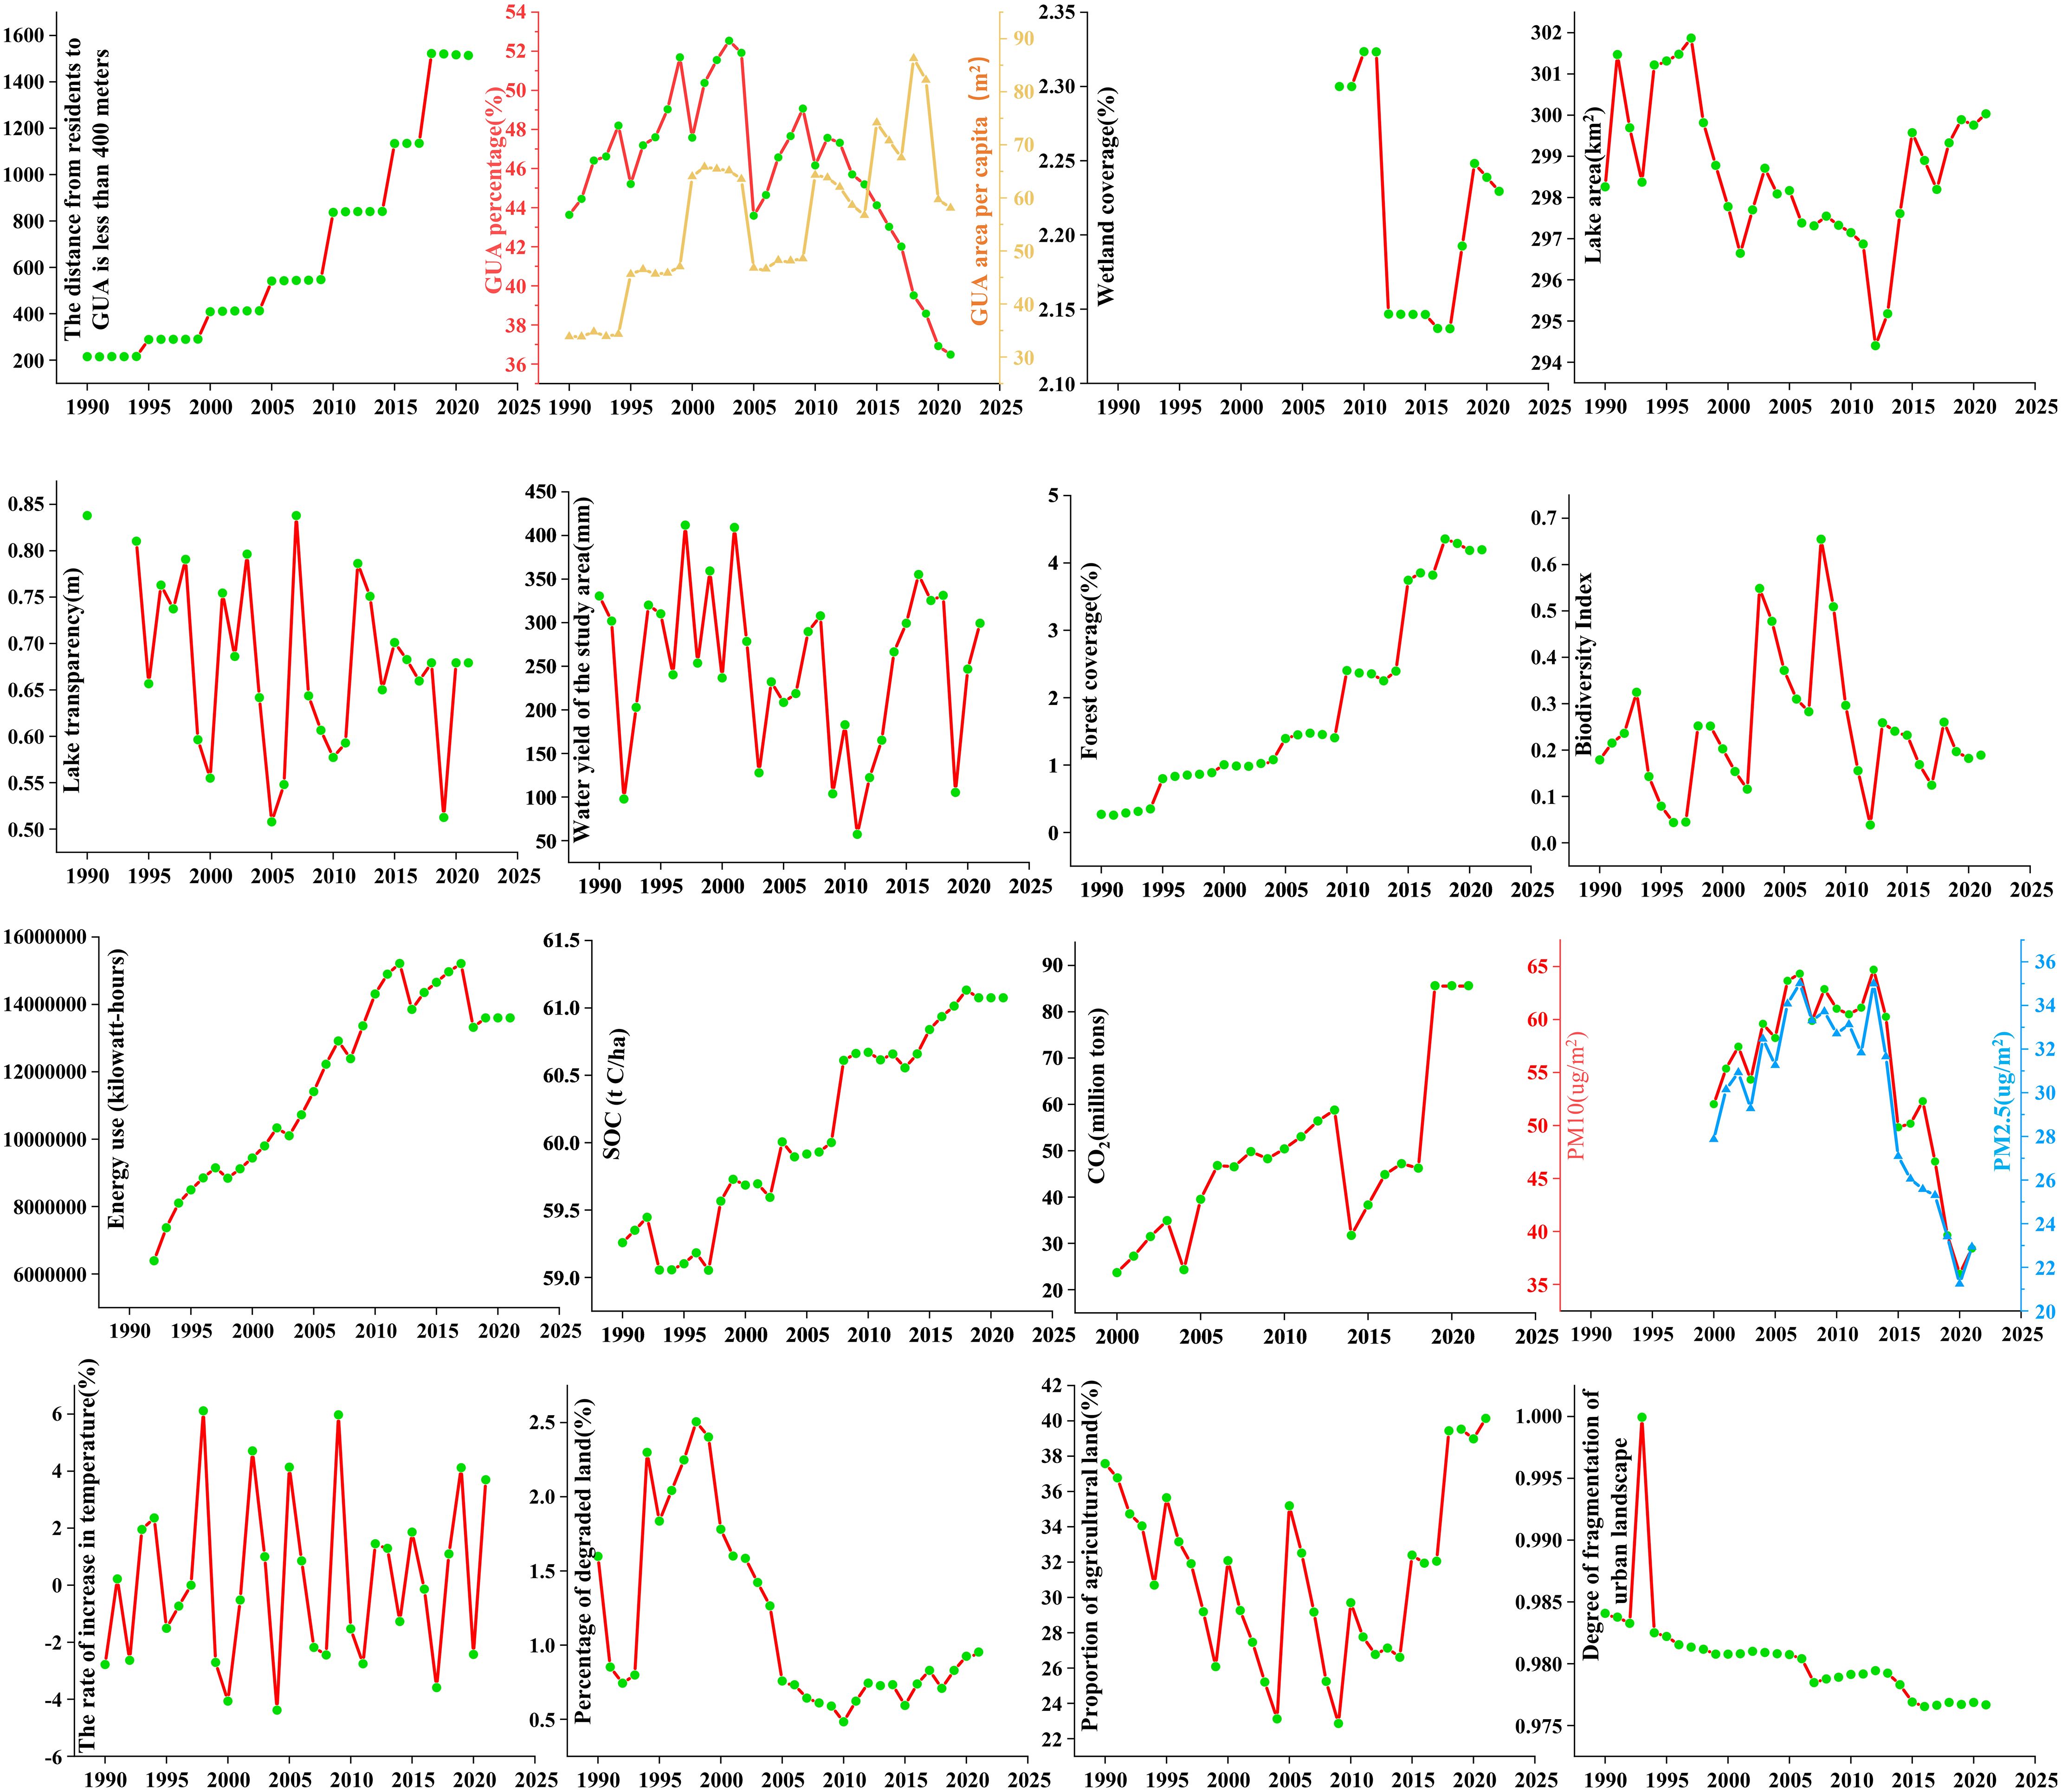
Figure 5 Time trends in annual averages of indicators.
In addition, spatial variations are observed in several indicators. As the urban boundary expands eastward of Dianchi Lake, a significant amount of green land and cultivated land is incorporated into the urban area. Notably, cultivated land undergoes a transformation from grassland to impervious water surfaces, demonstrating changes in land use patterns. Cultivated land has become a primary source of urban construction land. Currently, there is still a conversion of cultivated land into grassland, primarily occurring at the urban boundary in the northeast and southeast (Figure 6C). It is anticipated that this land may be converted into urban construction land in the future. Habitat quality, a crucial indicator of biodiversity, consistently remains low. However, spatially, the habitat conditions outside the city surpass those within the city. High-value areas are typically found at the junction of lakes and cities (Supplementary Figure 3). Examining the urban air indexes, such as PM10 (Supplementary Figure 5) and PM2.5 (Supplementary Figure 6), it is evident that urban expansion has not alleviated air pollution in the city center, and air quality in new urban areas continues to deteriorate over time. Moreover, lakeside cities are not immune to the impacts of global climate change. The highest urban temperatures are steadily increasing, persistently occurring in the central area of the city throughout the year, while lower temperature values are consistently found in the northeast (Supplementary Figure 7).
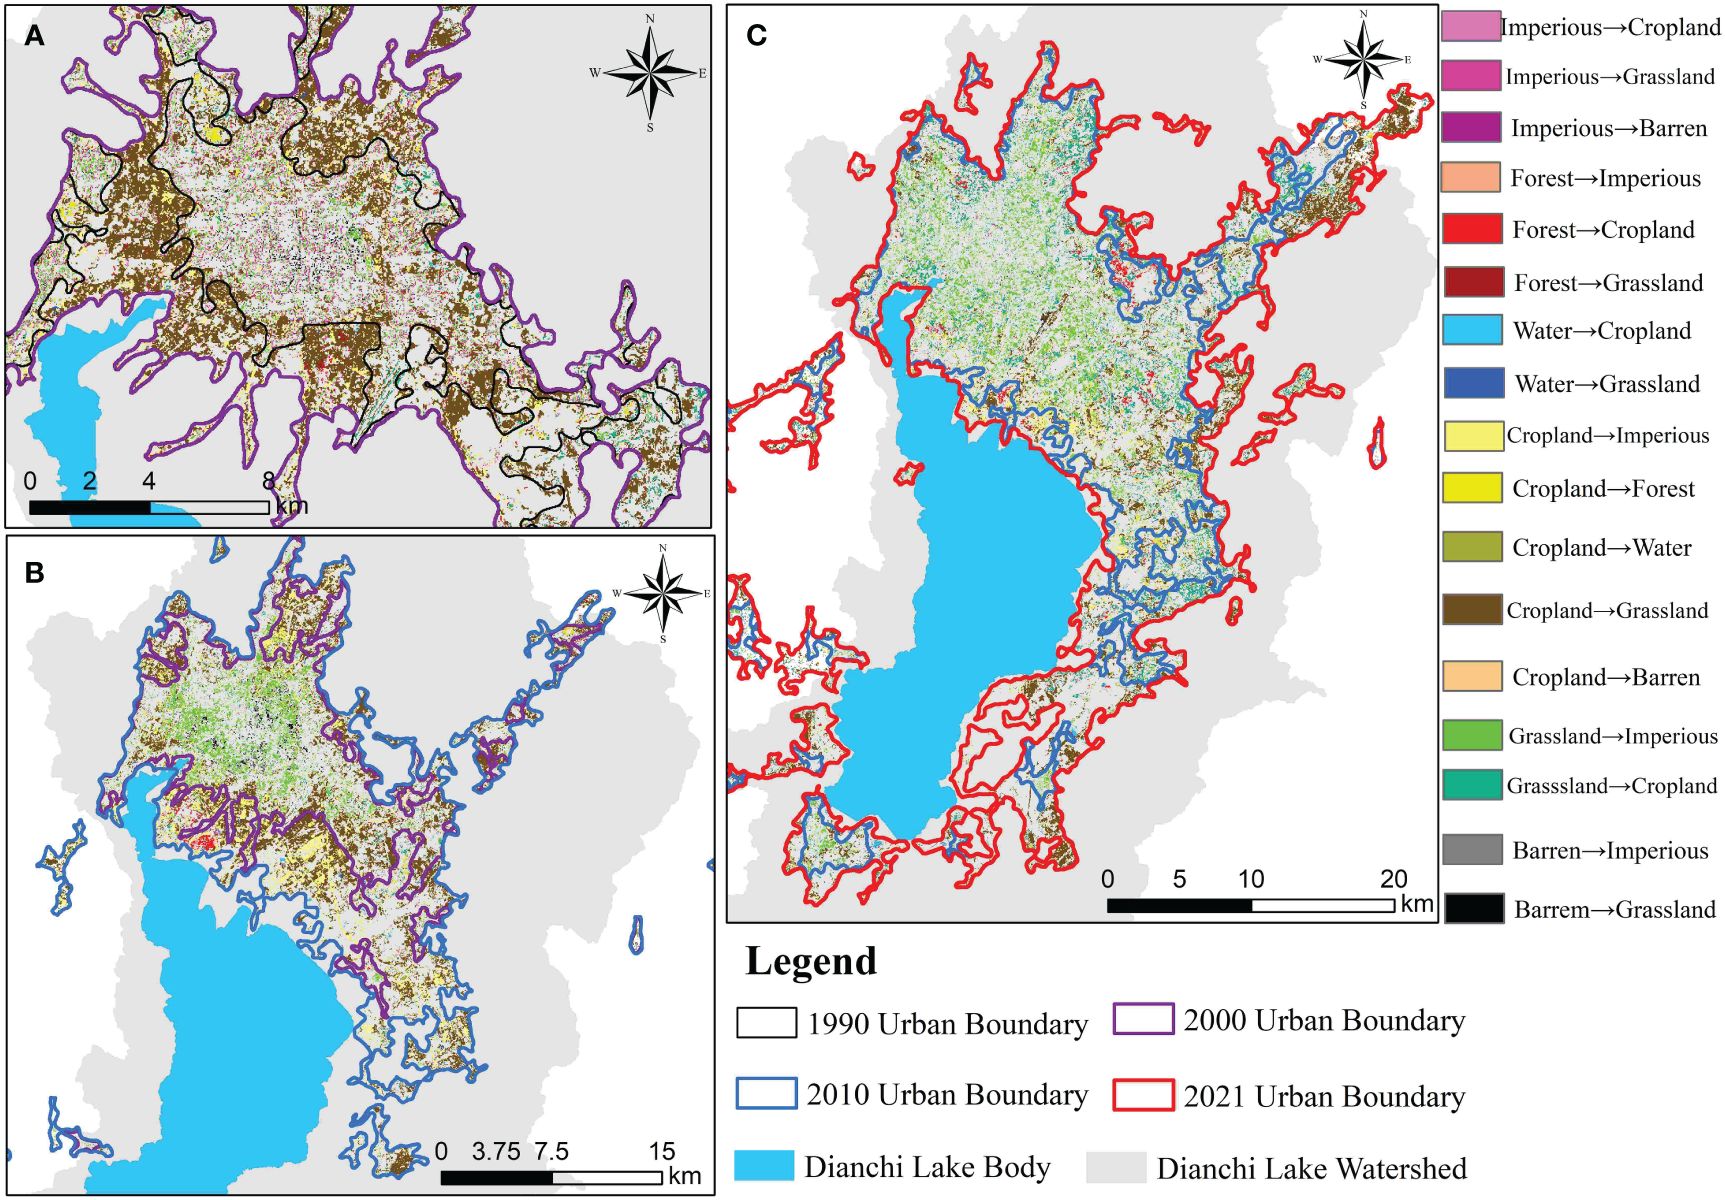
Figure 6 Land use transfer. (A) Land transfer 1990–2000. (B) Land transfer 2000–2010. (C) Land transfer 2010–2021.
Table 5 presents the results of the Gray Relational Grade (GRG) for each influencing factor and the GDI. Economic development, in terms of scale and structure, significantly impacts the level of regional green development. The GRG for GDP and GDI is 0.769, ranking second overall and first in terms of long-term impact. The GRG for OVSI is 0.764, ranking third, while the GRG for 0VTI and GDI is 0.7l, ranking seventh. Furthermore, there is a close relationship between government financial investment and green development, as evidenced by the GRG of GRFAI and GDI, which is 0.737. The opening vitality of the region also influences green development, with the GRG for TIEV and GDI being 0.747, ranking fifth. This influence is more significant than the development of the local tertiary industry and financial input. Conversely, the GRG for TIFT and GDI is 0.694, ranking last. However, during a specific development period, there was a strong correlation between TIFT and local green development in 2015, with a correlation coefficient of 0.991. The research findings indicate that the correlation between TIFT and green development has been steadily increasing since 2009, reaching its highest point of 0.99 in 2016. Interestingly, during this period, the green development level of the city continued to decline, suggesting that tourism development exerted significant pressure on the local green environment. Moreover, the contribution of scientific and technological innovation to green development in plateau lakeside cities is not as notable as in eastern cities, with the GRG for TI being relatively low at 0.695. Additionally, social development, particularly urban population, significantly affects the green development level of lakeside cities. The analysis reveals that the GRG for PU and GDI is 0.843, consistently ranking first throughout the year. Similarly, the GRG for DIUR and GDI is 0.76, consistently maintaining a high level of correlation.
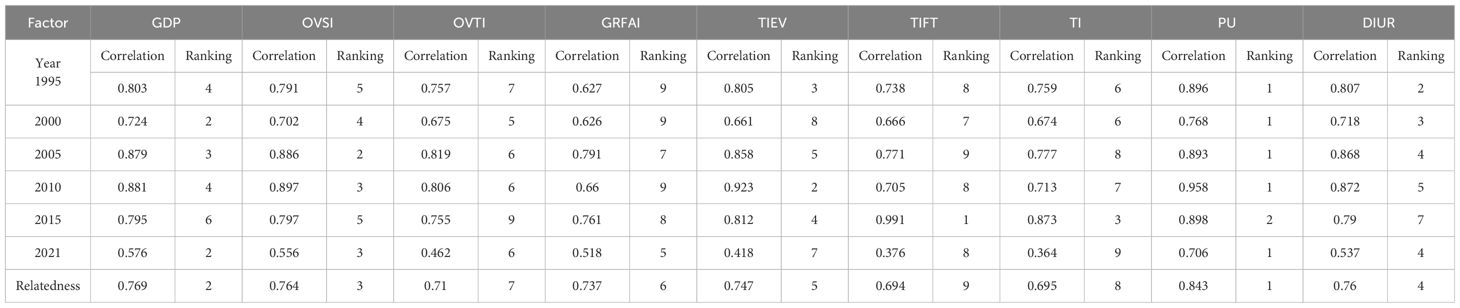
Table 5 Gray correlation and ranking of impact factors.
Existing research has made significant progress in evaluating cities comprehensively in terms of their economic, social, and environmental aspects. However, from a macro perspective, it is important not to overlook the crucial influencing factors at the micro scale. This article focuses on evaluating green development within the context of the new development philosophy, which effectively highlights the advantages and challenges of green development in plateau lakeside cities. It also reveals local information and hidden patterns of influence that may not be evident in overall development assessments. For instance, the period from 2003 to 2008 witnessed rapid urban expansion in Kunming (Lin et al., 2021). Additionally, urban planners should pay attention to the construction and proper distribution planning of green spaces within the city. Some studies have assessed the contribution of GUA to SDGs (Lorenzo-Sáez et al., 2021), or directly used GUA as a factor in evaluating urban ecology (Wang et al., 2024). In this paper, GUA is given a relatively high weight in evaluating the GDI. Considering that GUA occupies more than half of the urban area, it is clear that urban GDI values are significantly influenced by GUA, underscoring its importance to the green development of lakeside cities.
Among various factors, social development has the most significant impact on urban green development, particularly the urban population size. While population influx has contributed to urban economic development, educational levels, and scientific and technological innovation, the rapid increase in population has exerted immense pressure on improving the urban ecosystem. Residential expansion, infrastructure construction, and increased waste generation have adverse effects on urban green development. This issue is particularly relevant to plateau lakeside cities, where inward development requires the protection of lake wetlands and outward expansion faces geographical barriers, leading to increasingly restricted urban land availability. The growing population density, concentrated in specific areas, hampers the green and healthy development of cities. Furthermore, the economic scale of a region generally has a positive impact on the environment. As people’s income levels and quality of life improve, they tend to seek higher-quality environmental ecosystems and pay more attention to environmental protection. However, in the western region, factors such as education levels, science and technology, culture, and national beliefs, along with the complexity of the original ecosystem, result in weaker contributions of per-capita GDP to green development compared to developed regions, and in some cases, even a negative impact. Additionally, rapid economic development, excessive utilization of natural resources, and the irrational introduction of heavy industries have led to an unbalanced industrial structure, causing the generation of hazardous wastes and the degradation of regional green development.
It is important to emphasize the significant role of regional openness and vitality in the green development of a lakeside city. The correlation between Trade, Investment, and Financial Transactions (TIFT) and the GDI reached its peak in 2015. Kunming, as the capital of Yunnan Province, possesses abundant economic, political, and cultural resources. It serves as a gateway to other regions within Yunnan, boasting unique natural advantages including favorable climate and breathtaking scenery. The development of tourism has played a pivotal role in driving the local economy, facilitating economic structural adjustments, increasing residents’ income, and securing more financial resources. These funds have been adequately invested to enhance technological innovation capabilities and improve the environment. However, the rapid growth of tourism has also resulted in increased population influx, temporary spikes in population density, and escalated social consumption. Moreover, the pursuit of immediate gains in tourism development has sometimes overlooked environmental protection concerns, leading to haphazard and unsustainable development practices that harm the vegetation and overall environment of scenic areas. Such issues greatly hinder the region’s green development.
Despite the overall upward trend in Kunming’s GDI, the presence of unstable stages indicates underlying problems in the city’s green development. This instability is closely linked to the indicators used to assess green development, such as lake area, lake eutrophication, biodiversity status, and temperature fluctuations. These indicators have displayed long-term instability, warranting special attention to their impacts on the city’s sustainable and green development. Therefore, it is imperative to carefully consider the influence of changes in these indicators on the city’s green and sustainable development.
Over the course of 30 years, the lakeside city has undergone three distinct phases in its green and sustainable development: high-speed upward development, unstable development, and stable development. Each stage has been driven by unique factors influencing the trajectory of green development. Reflecting on this developmental history provides valuable insights and lessons for the future.
Firstly, the expansion of lakeside cities is limited. Inward expansion requires the protection of lake and wetland ecosystems, while outward expansion necessitates the rational utilization of cultivated land and mountain areas to preserve their ecological functions. Internally, there is a need to expand the area of green zones and implement precise urban green space planning to provide safe, inclusive, and convenient green public spaces.
Secondly, effective urban planning and construction are crucial to enhance land use efficiency and accommodate a growing population. Alongside population growth, it is essential to implement incentive policies for attracting talented individuals. Currently, technological innovation shows the strongest correlation with green and sustainable development compared to other factors. Ultimately, the weak technological innovation capacity in the region needs to be addressed by attracting more scientific and technological talent. This will enhance the ability to improve environmental efficiency, stimulate local educational and cultural advancements, and strengthen people’s environmental awareness.
Thirdly, the rapid development of the tourism industry necessitates the consideration of improving local infrastructure and regulating the construction of tourist attractions to prevent extensive development that harms the ecological environment. It is important to strengthen promotional efforts, raise tourists’ environmental awareness, and control the sources of environmental pollution.
We have established a green sustainable development index system for lakeside cities using data obtained from modern remote sensing and geographic information technology. However, it is important to note that the remote sensing inversion data itself may have a certain degree of error, which has not been taken into account in this study.
During the collection of indicators, the development age of some indicators is missing due to limitations in remote sensing technology and sensor function. The use of interpolation methods to fill these gaps may inadvertently conceal the actual development of indicators, thus affecting the accuracy of the assessment. It is worth mentioning that this study solely relies on remote sensing technology for data collection, without fully leveraging its potential. The analysis conducted in this paper only examines the temporal trends of green development in the case study, and we anticipate obtaining more comprehensive spatial distribution data in the future to support spatial analysis. Furthermore, it is important to acknowledge that this paper focuses solely on the green sustainable development of a specific lakeside city and lacks comparative experiments and verification with other similar cities. In conclusion, while our research presents a green sustainable development index system for lakeside cities, it is crucial to consider the limitations and potential sources of error in the data collection process. Future studies should aim to incorporate more robust spatial data and conduct comparative analyses with similar cities to enhance the validity and generalizability of the findings.
This paper focuses on the “healthy green supply” dimension of urban green development. It utilizes geographical information data and employs the AHP and CRITIC methods to determine index weights. By constructing an evaluation index system, it assesses the level of green sustainable development in a plateau lakeside city over the past 30 years. Furthermore, the gray correlation analysis method is used to identify the driving factors behind green sustainable development in lakeside cities. The findings indicate that between 1990 and 2021, the level of green sustainable development in the urban area surrounding Dianchi Lake exhibited stages of fluctuation, showing an overall upward trend. The development can be categorized into three stages: rapid rise, unstable development, and stable development. The optimization model’s difference coefficient effectively balances the subjective and objective weights of the indicators during the assessment. Urban expansion has resulted in the occupation of significant wetlands and farmland around the lakeside, becoming important factors influencing the green and sustainable development of the lakeside city, with comprehensive weights of 10.30% and 8.79%, respectively. Moreover, the growth of urban population and economic scale plays a pivotal role in driving the green and sustainable development of lakeside cities, while the potential impact of tourism development should also be considered.
The original contributions presented in the study are included in the article/Supplementary Material. Further inquiries can be directed to the corresponding author.
CP: Writing – original draft, Methodology, Validation. KY: Conceptualization, Resources, Writing – review & editing. TJ: Writing – review & editing. CS: Writing – review & editing. AL: Writing – review & editing. XP: Software, Writing – review & editing. QW: Writing – review & editing. RC: Data curation, Writing – review & editing. DL: Data curation, Writing – review & editing. YL: Conceptualization, Funding acquisition, Resources, Writing – review & editing.
The author(s) declare financial support was received for the research, authorship, and/or publication of this article. The authors would like to thank all the authors for their hard work in this research. This research was funded by the Yunnan Province Innovation Team Project (202305AS350003), the National Natural Science Foundation of China (42271441), and the 2023 Graduate Research Innovation Fund, Yunnan Normal University (YJSJJ23-A23).
The authors declare that the research was conducted in the absence of any commercial or financial relationships that could be construed as a potential conflict of interest.
All claims expressed in this article are solely those of the authors and do not necessarily represent those of their affiliated organizations, or those of the publisher, the editors and the reviewers. Any product that may be evaluated in this article, or claim that may be made by its manufacturer, is not guaranteed or endorsed by the publisher.
The Supplementary Material for this article can be found online at: https://www.frontiersin.org/articles/10.3389/fevo.2024.1407350/full#supplementary-material
Albayrak E., Demirtas E. A. (2016). A sustainable energy planning approach using analytic hierarchy process: A case study for Turkey. Renewable Sustain. Energy Rev. 59, 1535–1549.
Alfsen K. H., Bye T. A., Lorentsen L. (1987). Natural Resource Accounting and Analysis: the Norwegian Experience (Norway: Central Bureau of Statistics, Oslo). 1978e1986.
Ang J. B. (2009). CO2 emissions, research and technology transfer in China. Ecol. Economics. 68, 2658–2665. doi: 10.1016/j.ecolecon.2009.05.002
Barbier E. B. (2011). A global green new deal: Rethinking the economic recovery. Choice Rev. 48, 48. Available at: www.cambridge.org9780521132022.
Barbier E. B., Burgess J. C. (2017). The sustainable development goals and the systems approach to sustainability. Economics: The Open-Access, Open-Assessment E-J. 11 (2017-28), 1–22. doi: 10.5018/economics-ejournal.ja.2017-28
Carli R., Dotoli M., Pellegrino R. (2018). Multi-criteria decision-making for sustainable metropolitan cities assessment. J. Environ. management. 226, 46–61. doi: 10.1016/j.jenvman.2018.07.075
Chen J., Gao M., Cheng S., Hou W., Song M., Liu X., et al. (2022). Global 1 km × 1 km gridded revised real gross domestic product and electricity consumption during 1992-2019 based on calibrated nighttime light data. figshare. Dataset 9 (1), 202. doi: 10.1038/s41597-022-01322-5
Chen X, Liu X, Hu D. (2015). Assessment of sustainable development: A case study of Wuhan as a pilot city in China. Ecological Indicators 50, 206–214. doi: 10.1016/j.ecolind.2014.11.002
Cheng C., Ge C. (2020). Green development assessment for countries along the belt and road. J. Environ. Manage. 263, 110344. doi: 10.1016/j.jbusres.2022.03.041
Czech Statistical Office (2011). Green Growth in the Czech Republic Selected Indictors (Czech: Czech Statistical Office).
D’Adamo I., Rosa P. (2016). Remanufacturing in industry: advices from the field. Int. J. Advanced Manufacturing Technology. 86, 2575–2584. doi: 10.1007/s00170-016-8346-5
Feng C., Wang M., Liu G., Huang J. (2017). Green development performance and its influencing factors: A global perspective. J. Cleaner Production. 144, 323–333. doi: 10.1016/j.jclepro.2017.01.005
Fisher-Vanden K., Wing I. S. (2008). Accounting for quality: Issues with modeling the impact of R&D on economic growth and carbon emissions in developing economies. Energy economics. 30, 2771–2784. doi: 10.1016/j.eneco.2007.04.002
Fonseca, Carvalho (2019). The reporting of SDGs by quality, environmental, and occupational health and safety-certified organizations. Sustainability 11, 5797. doi: 10.3390/su11205797
Ghorui N., Ghosh A., Mondal S. P., Bajuri M. Y., Ahmadian A., Salahshour S., et al. (2021). Identification of dominant risk factor involved in spread of COVID-19 using hesitant fuzzy MCDM methodology. Results physics. 21, 103811. doi: 10.1016/j.rinp.2020.103811
Guo F., Lv X., Yu W., Ren J., Chu N. (2020). Performance evaluation and driving mechanism of green development in Shandong Province based on panel data of 17 cities. Scientia Geographica Sinica. 40, 200–210. doi: 10.13249/j.cnki.sgs.2020.02.005
Guo J., Wei Z., Xian X., Ren J., Zhou H. (2022). Dynamic change and driving force of natural capital in Qinghai Province based on the three-dimensional ecological footprint, China. Ecol. Indicators. 145, 109673. doi: 10.1016/j.ecolind.2022.109673
Kawakubo S., Murakami S., Ikaga T., Asami Y. (2018). Sustainability assessment of cities: SDGs and GHG emissions. Building Res. Inf. 46, 528–539. doi: 10.1080/09613218.2017.1356120
Li H., Fang K., Yang W., Wang D., Hong X. (2013). Regional environmental efficiency evaluation in China: Analysis based on the Super-SBM model with undesirable outputs. Math. Comput. Modelling. 58, 1018–1031. doi: 10.1016/j.mcm.2012.09.007
Li P., Zhang R., Xu L. (2021). Three-dimensional ecological footprint based on ecosystem service value and their drivers: A case study of Urumqi. Ecol. indicators. 131, 108117. doi: 10.1016/j.ecolind.2021.108117
Lin Z., Peng S., Hong L., Xu Q., Zhou Y. (2021). Dynamic monitoring and spatio-temporal pattern evolution of built-up urban areas in central Yunnan based on luminescent data. Study Soil Water Conserv. 28, 265–271. doi: 10.13869/j.cnki.rswc.2021.01.033
Long R., Li H., Wu M., Li W. (2021). Dynamic evaluation of the green development level of China's coal-resource-based cities using the TOPSIS method. Resour. Policy 74, 102415. doi: 10.1016/j.resourpol.2021.102415
Lorenzo-Sáez E., Lerma-Arce V., Coll-Aliaga E., Oliver-Villanueva J. V. (2021). Contribution of green urban areas to the achievement of SDGs. Case study in Valencia (Spain). Ecol. Indicators. 131, 108246. doi: 10.1016/j.ecolind.2021.108246
Marsh G. P. (2001). The Earth as Modified by Human Action: A New Edition of Man and Nature (Boston, MA, USA: Adamant Media Corporation).
Mulligan M., van Soesbergen A., Hole D. G., Brooks T. M., Burke S., Hutton J. (2020). Mapping nature's contribution to SDG6 and implications for other SDGs at policy relevant scales. Remote Sens. Environment. 239, 111671. doi: 10.1016/j.rse.2020.111671
National Institute of Statistics and Geography of Mexico (INEGI). (2011). Green Growth Indicators for Mexico. (Aguascalientes, Ags). Available at: https://www.inegi.org.mx.
Pakzad P., Osmond P. (2016). Development a sustainability indicator set for measuring green infrastructure performance. Procedia-social Behav. Sci. 216, 68–79. doi: 10.1016/j.sbspro.2015.12.009
Qiu F., Chen Y., Tan J., Liu J., Zheng Z., Zhang X. (2020). Spatial-temporal heterogeneity of green development efficiency and its influencing factors in growing metropolitan area: a case study for the Xuzhou metropolitan area. Chin. geographical Sci. 30, 352–365. doi: 10.1007/s11769-020-1114-3
Ricardo D. (2010). On the Principles of Political Economy and Taxation (Whitefish, MT, USA: Kessinger Publishing, LLC).
Saaty T. L. (2008). Decision making with the analytic hierarchy process. Int. J. Serv. Sci. 1, 83–98. doi: 10.1504/IJSSCI.2008.017590
Shah S. A. A. (2020). Feasibility study of renewable energy sources for developing the hydrogen economy in Pakistan. Int. J. Hydrogen Energy. 45, 15841–15854. doi: 10.1016/j.ijhydene.2019.09.153
Shan Y., Guan Y., Hang Y., Zheng H., Li Y., Guan D., et al. (2022). City-level emission peak and drivers in China. Sci. Bull. 67 (18), 1910–1920. doi: 10.1016/j.scib.2022.08.024
Shi B., Yang H., Wang J., Zhao J. (2016). City green economy evaluation: Empirical evidence from 15 sub-provincial cities in China. Sustainability. 8, 551. doi: 10.3390/su8060551
Skea J., Nishiok S. (2008). Policies and practices for a low-carbon society. Clim. Policy (Earthscan). 8, 5–16. doi: 10.3763/cpol.2008.0487
Statistics Netherlands. (2011). Green Growth in the Netherlands (Netherlands). Available at: https://www.cbs.nl/en-gb.
Tian W., Bai J., Sun H., Zhao Y. (2013). Application of the analytic hierarchy process to a sustainability assessment of coastal beach exploitation: a case study of the wind power projects on the coastal beaches of Yancheng, China. J. Environ. Management. 115, 251–256. doi: 10.1016/j.jenvman.2012.11.015
Väisänen S., Mikkilä M., Havukainen J., Sokka L., Luoranen M., Horttanainen M. (2016). Using a multi-method approach for decision-making about a sustainable local distributed energy system: A case study from Finland. J. Cleaner Production. 137, 1330–1338. doi: 10.1016/j.jclepro.2016.07.173
Wang L., Yuan G., Long R., Chen H. (2017). An urban energy performance evaluation system and its computer implementation. J. Environ. management. 204, 684–694. doi: 10.1016/j.jenvman.2017.09.041
Wang M. X., Zhao H., Cui J. X., et al. (2018). Evaluating green development level of nine cities within the Pearl River Delta, China. J. Cleaner Production. 174, 315–323. doi: 10.1016/j.jclepro.2017.10.328
Wang Z. L., Tao F., Leng H. J., Wang Y. H., Zhou T. (2024). Multi-scale analysis on sustainability and driving factors based on three-dimensional ecological footprint: A case study of the Yangtze River Delta urban agglomeration, China. J. Cleaner Production 436, 140596. doi: 10.1016/j.jclepro.2024.140596
Watmough G. R., Marcinko C. L., Sullivan C., Tschirhart K., Mutuo P. K., Palm C. A., et al. (2019). Socioecologically informed use of remote sensing data to predict rural household poverty. Proc. Natl. Acad. Sci. 116, 1213–1218. doi: 10.1073/pnas.1812969116
Wei J., Li Z., Xue W., Sun L., Fan T., Liu L., et al. (2021). The ChinaHighPM10 dataset: generation, validation, and spatiotemporal variations from 2015 to 2019 across China. Environ. Int. 146, 106290. doi: 10.1016/j.envint.2020.106290
Xian J., Feng Y., Li L., Li Y., Wen X., Zhou Y. (2020). Green development evaluation system of Tuojiang River basin. J. Physics: Conf. Ser. 1549, 22033. doi: 10.1088/1742-6596/1549/2/022033
Yang J., Huang X. (2021). The 30 m annual land cover dataset and its dynamics in China from 1990 to 2019. Earth Syst. Sci. Data 13, 3907–3925. doi: 10.5194/essd-13-3907-2021
Yang Y., Ling S., Zhang T., Yao C. (2018). Three-dimensional ecological footprint assessment for ecologically sensitive areas: A case study of the Southern Qin Ling piedmont in Shaanxi, China. J. cleaner production. 194, 540–553. doi: 10.1016/j.jclepro.2018.05.132
Yang T., Zhou K., Zhang C. (2022). Spatiotemporal patterns and influencing factors of green development efficiency in China's urban agglomerations. Sustain. Cities Soc. 85, 104069. doi: 10.1016/j.scs.2022.104069
Yu L., Wu X., Zheng X., Zheng T., Xin J., Walther M. (2019). An index system constructed for ecological stress assessment of the coastal zone: a case study of Shandong, China. J. Environ. Management. 232, 499–504. doi: 10.1016/j.jenvman.2018.11.084
Keywords: SDGs, new development philosophy, Kunming, indicator, AHP, CTITIC, weight, correlation
Citation: Peng C, Yang K, Jia T, Shang C, Li A, Pei X, Wang Q, Chen R, Li D and Luo Y (2024) Assessment of green sustainable development in plateau lakeside cities. Front. Ecol. Evol. 12:1407350. doi: 10.3389/fevo.2024.1407350
Received: 26 March 2024; Accepted: 11 June 2024;
Published: 15 July 2024.
Edited by:
Hélder Tiago Da Silva Lopes, University of Minho, PortugalReviewed by:
Ying Zhu, Xi’an University of Architecture and Technology, ChinaCopyright © 2024 Peng, Yang, Jia, Shang, Li, Pei, Wang, Chen, Li and Luo. This is an open-access article distributed under the terms of the Creative Commons Attribution License (CC BY). The use, distribution or reproduction in other forums is permitted, provided the original author(s) and the copyright owner(s) are credited and that the original publication in this journal is cited, in accordance with accepted academic practice. No use, distribution or reproduction is permitted which does not comply with these terms.
*Correspondence: Yi Luo, bHlzaXN0QHlubnUuZWR1LmNu
†These authors have contributed equally to this work and share first authorship
Disclaimer: All claims expressed in this article are solely those of the authors and do not necessarily represent those of their affiliated organizations, or those of the publisher, the editors and the reviewers. Any product that may be evaluated in this article or claim that may be made by its manufacturer is not guaranteed or endorsed by the publisher.
Research integrity at Frontiers
Learn more about the work of our research integrity team to safeguard the quality of each article we publish.