- 1State Key Laboratory of Remote Sensing Science, Aerospace Information Research Institute, Chinese Academy of Sciences, Beijing, China
- 2Institute of Urban Systems Engineering, Beijing Academy of Science and Technology, Beijing, China
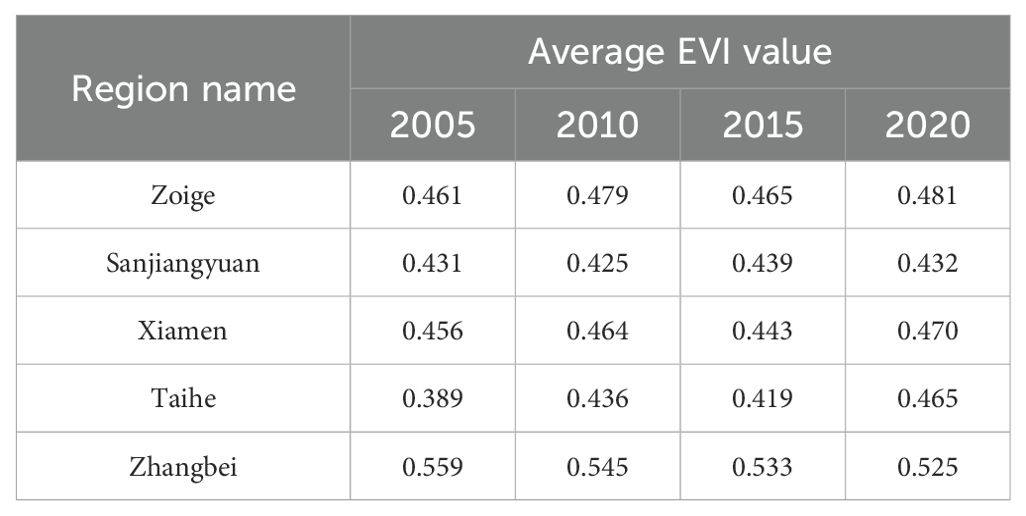
Ecological vulnerability assessment is crucial for environment protection, ecological restoration and resource utilization. However, many former studies have limitations in the indicator system of the assessment, which were not comparable for different types of ecologically vulnerable areas. It is difficult to apply directly to the ecological vulnerability assessment of different types and in various regions. Aiming to solve these problems, the study proposed a well-established and comprehensive indicator system for ecological vulnerability assessment and conducted ecological vulnerability assessment application of five types of typical ecologically vulnerable areas of China based on remote sensing, meteorological, geographic and other data. The results show that the average EVIs value of Zhangbei County ranging from 0.525 to 0.559 are the highest among the five research areas during the four periods, followed by Zoige region and Xiamen bay. However, the region with the lowest average EVI value varies. In 2005 and 2015, it was Taihe County, while in 2010 and 2020, it was the Sanjiangyuan region. The variation of average EVIs in the five typical areas presents slight fluctuation and remains generally stable from 2005 to 2020. It indicates that the environmental protection measures and projects undertaken by the Chinese government in recent years have had a striking effect, curbing the trend of ecological environment deterioration.
1 Introduction
The ecologically vulnerable region, also known as an Ecotone (Niu, 1989), refers to the transitional area between two different types of ecosystems. These regions are characterized by internal instability, sensitivity to external stimuli, vulnerability to loss, and challenges in recovery. Additionally, their environmental degradation surpasses the existing socio-economic and technological capabilities to sustain long-term human development (De Lange et al., 2010). The ecological environment conditions in these transitional areas differ from the core areas of the two different ecosystems. These regions experience significant changes in their ecological environment and have become critical areas for ecological protection. The objective of ecological vulnerability assessment is to identify the key factors that contribute to vulnerability, examine the pathways through which vulnerability occurs, and elucidate the variations in exposure under different human activities and natural environmental conditions (Preston et al., 2011; Shukla et al., 2018; Yang et al., 2023).Various methods have been employed for the specific assessment of vulnerability in ecologically vulnerable regions. These methods include fuzzy comprehensive assessment (Dixon, 2005; Martino et al., 2005; Wang et al., 2008; Liu et al., 2017), the analytic hierarchy process (AHP) (Li and Fan, 2014; Song et al., 2010), principal component analysis (PCA) (Huang et al., 2003; Li et al., 2006), artificial neural network evaluation (Park et al., 2004), land-cover change assessment (Swetnam et al., 2011), and landscape valuation (Aspinall and Pearson, 2000). Among them, the AHP technique is one of the most commonly adopted assessment tools (Liu et al., 2017).
China has some of the largest ecologically vulnerable areas, the most vulnerable ecological types, and the most obvious ecological vulnerabilities in the world (Zou et al., 2021; Zhang et al., 2017a, b). The spatial distribution of vulnerable ecological areas ranges from the arid and semi-arid regions in the north to the hilly and mountainous areas in the southwest, the Qinghai-Tibet Plateau area, and the aquatic-terrestrial ecotone in the eastern coastal regions (Ma et al., 2023; He et al., 2023; Tian and Chang, 2012; He et al., 2018; Li et al., 2011; Song et al., 2015; Liu et al., 2017).Most methods of ecological vulnerability assessment focus on specific research areas by selecting specific indicators to evaluate a particular vulnerability phenomenon or by selecting multiple indicators to conduct a comprehensive evaluation of the vulnerable environment (Liu et al., 2017; Song et al., 2015; Zhang et al., 2017b), making them unsuitable for large-scale and multi-type environmental assessments of ecologically vulnerable areas. Due to the development of spatial information technology, multi-source, multi-temporal and large-scale evaluation indicators can be obtained through remote sensing (RS) and geographic information system (GIS) technology (Kamran and Yamamoto, 2023; Dai et al., 2022; Cutter et al., 2003; Hao et al., 2003; Metzger et al., 2005; Rahman et al., 2009; Liu et al., 2017), which significantly improves evaluation efficiency and reduces evaluation costs. Establishing an assessment indicator system for ecological vulnerability in China can help the government standardize and promote the protection of ecologically vulnerable areas, clarify protection priorities, and provide evidence for crafting reasonable strategies (Song et al., 2015; Li and Fan, 2014; Lu et al., 2012). Thus, there exists an acute need for a comprehensive and objective assessment of China’s eco-environment (Liu et al., 2017).
Many studies have tried to developa framework forassessing the vulnerability of ecological systems with high applicability (Ma et al., 2023; He et al., 2023; De Lange et al., 2010). However, most of these methods remain at the qualitative level. Although a few methods have quantitative attributes, there are still many problems (Zou and Yoshino, 2017; Hou et al., 2016; Hong et al., 2016), including: ①Limitations in the research area, and the research object is relatively single, often only targeting a particular type of area(such as mountains, grasslands, or farmland) for evaluation, and the evaluation results are difficult to compare between different types of areas; ②The selected indicators are not easily obtainable, resulting in poor operability; ③The assignment of weights for each indicator is either subjective or calculated entirely using mathematical methods, which results in poor flexibility and often leads to research results deviating from reality.
The study proposed a well-established and comprehensive indicator system for ecological vulnerability assessment using “natural cause-result performance” model based on remote sensing and GIS, which can achieve refined assessment of ecological vulnerability at the pixel scale. The indicator system can be used for the quantitative assessment of five types of ecologically vulnerable areas in China combining common and proprietary indicators, which has changed the traditional assessment system for single vulnerability type. Spatial-temporal variations for typical regions in China from 2005 to 2020 were analyzed based on the Ecological Vulnerability Index (EVI) calculated from this indicator system.The indicator system can also help the relevant eco-environment managers developing scientific policies to monitor the ecological vulnerability status and promote efficient protection and sustainable utilization of ecological resources.
2 Date and methods
2.1 Study area
To study ecological vulnerability in China, we selected five typical experimental regions according to the “Outline of national ecological fragile area protection plan” issued by the Ministry of Environmental Protection, PRC (Ministry of Environmental Protection, PRC, 2008), including: Zhangbei County in Northern China’s agro-pastoral ecotone; Zoige Plateau in Southwestern China’s hilly agro-pastoral ecotone; Xiamen Bay’s aquatic-terrestrial ecotone; Taihe County’s hilly red soil region of Southern China; and the Sanjiangyuan region in the Qinghai-Tibet Plateau’s compound erosion zone (Figure 1). The areas of these regions range from 1786 km2 to 349408 km2.
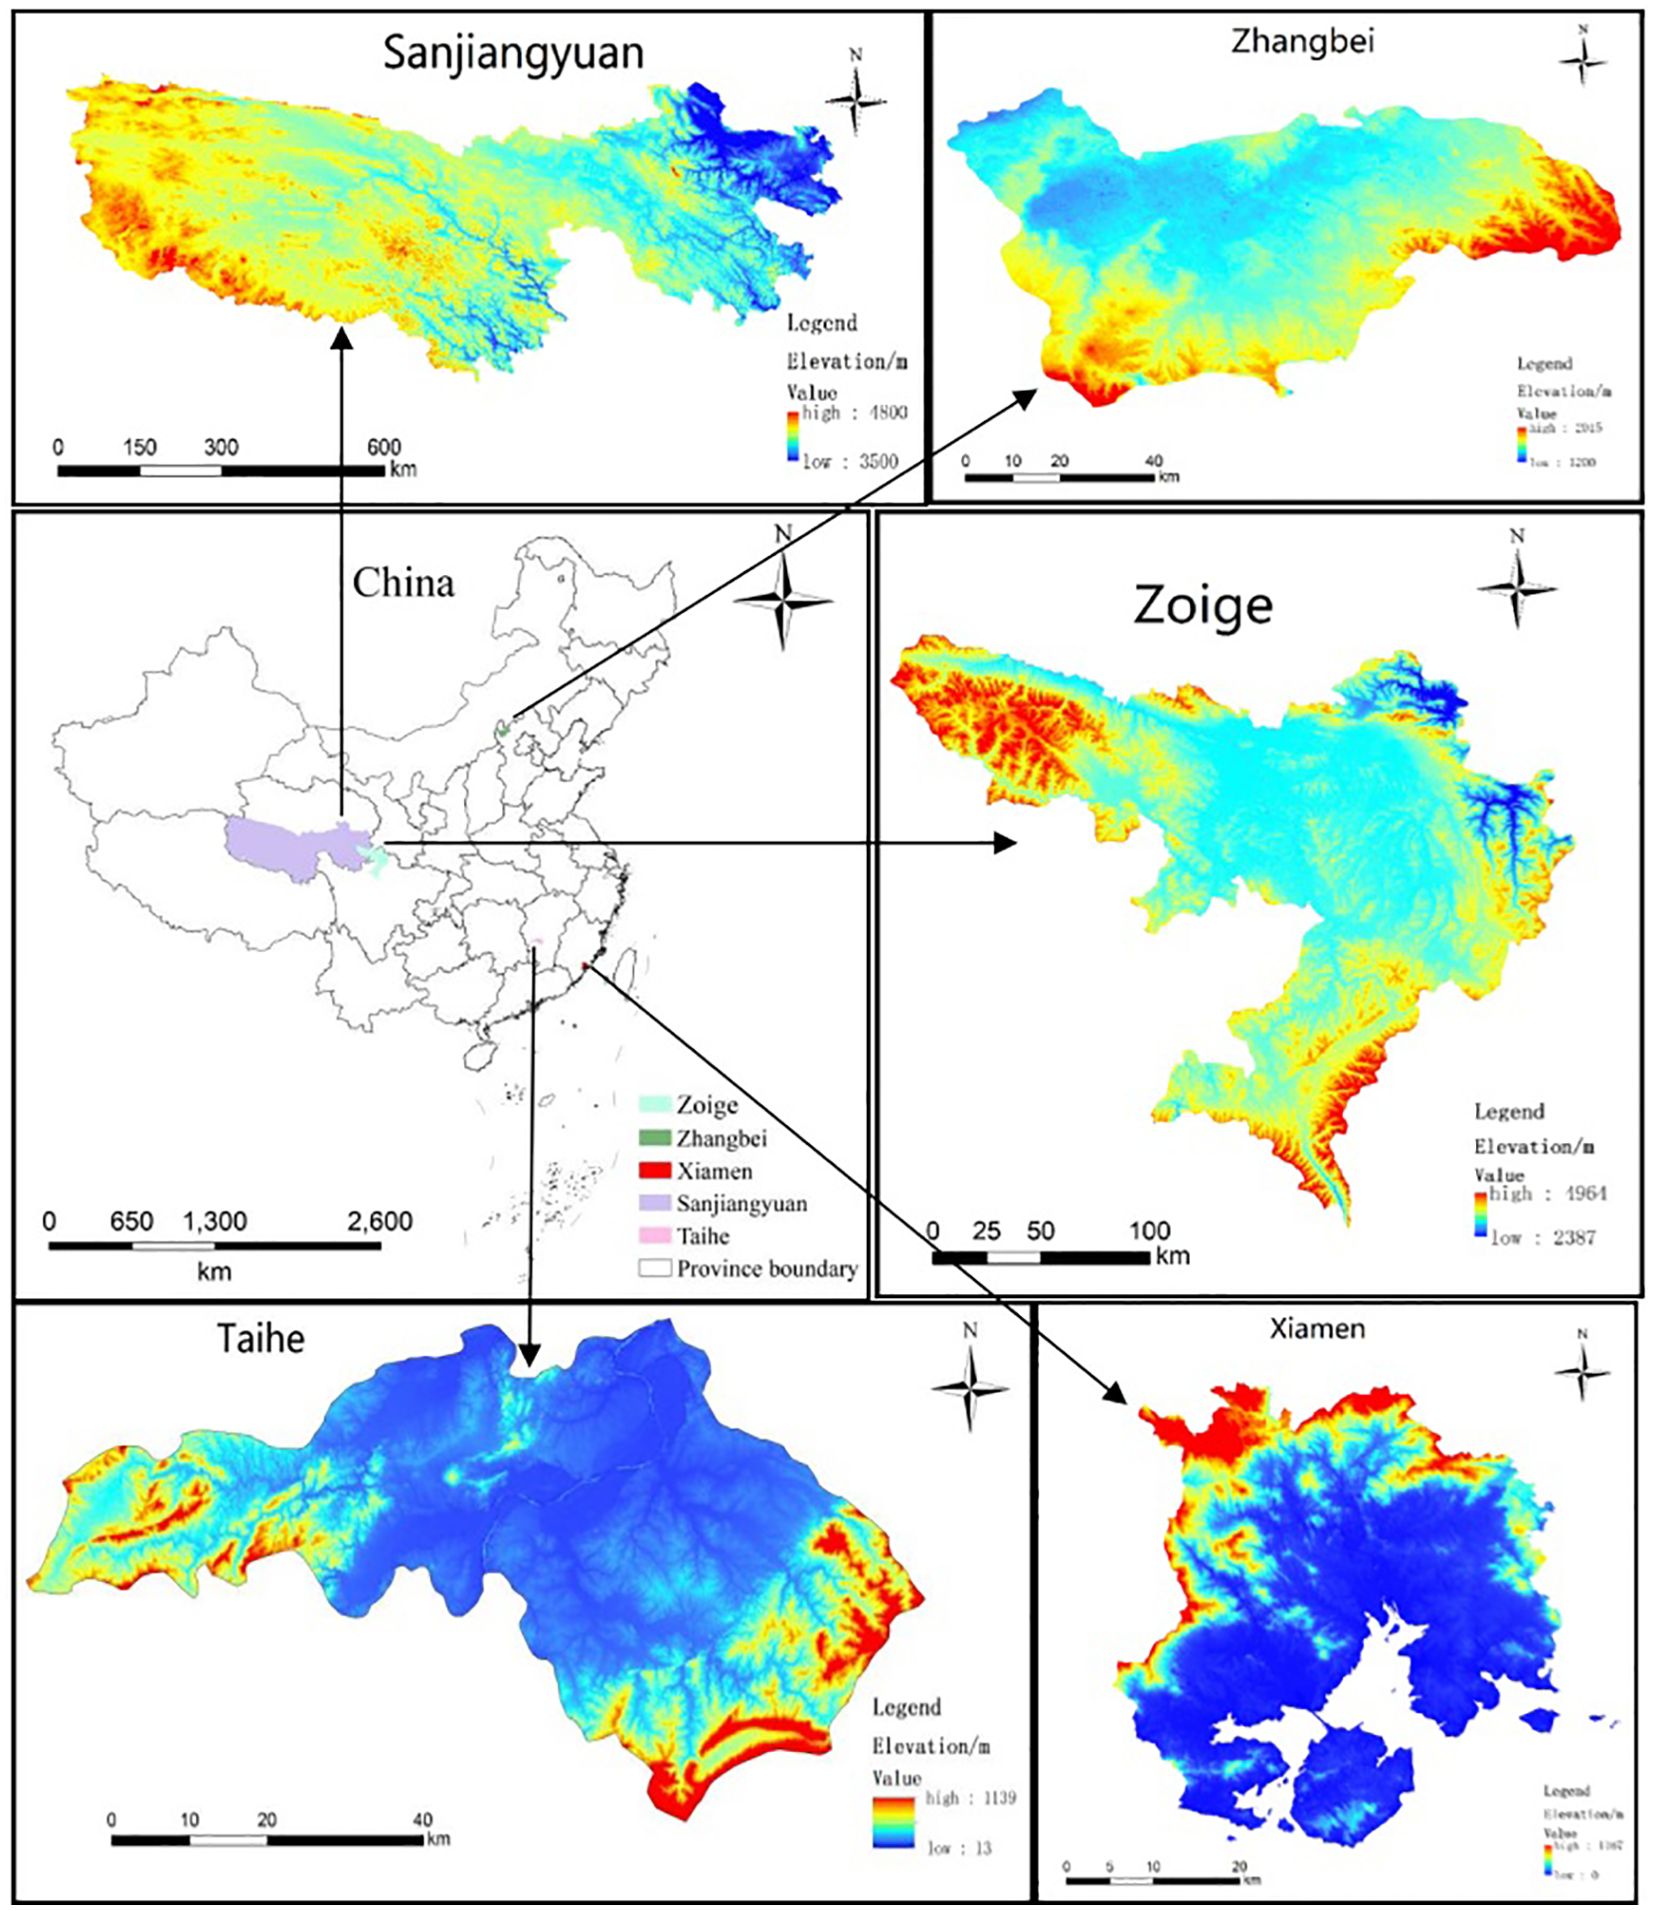
Figure 1. Locations of the five typical experimental regions with various spatial scale in China (Purple area: Sanjiangyuan region in the Qinghai-Tibet Plateau’s compound erosion zone; Green area: Zhangbei County in Northern China’s agro-pastoral ecotone; Blue area: Zoige Plateau in Southwestern China’s hilly agro-pastoral ecotone; Red area: Xiamen Bay’s aquatic-terrestrial ecotone; Pink area: Taihe County’s hilly red soil region of Southern China).
The Zoige Plateau is located in the northeastern part of the Qinghai-Tibet Plateau and forms the largest plateau swamp wetland in the world (Jiang et al., 2017). The climate is characterized by a typical humid/semi-humid monsoon climate in the continental cold-temperate zone (Shen et al., 2019). Xiamen Bay is an estuarine harbor along the southeast coast of China located between Xiamen City, Longhai City, and Kinmen County in Fujian Province (Qian et al., 2023). Human activities and rapid urbanization pose significant risks to the ecological health of estuaries and undermine ecosystems’ ability to maintain natural functions (Pan et al., 2016; Wang et al., 2018; Zhang et al., 2020; Chen et al., 2021). Taihe County is located in central southern Jiangxi Province.The terrain within Taihe County centers around the Ganjiang River Valley, extending in four directions and gradually rising, forming a basin landform northeast to southwest. The southeast and west rise, while the middle descends (Liu et al., 2008). Zhangbei County is located in the interleaving zone between farmland and animal husbandry areas in northern Hebei province. It constitutes the main part of the poverty belt around Beijing and Tianjin (Huang et al., 2019) and has been identified by the national government as a key area for conducting the project of converting arable land into grassland and forestland (Liu and Li, 2017; Sun et al., 2016). The Sanjiangyuan region, in the northeastern Qinghai-Tibet Plateau, contains the headwaters of Asia’s three longest rivers: the Yangtze, Yellow, and Lancang. It is the world’s largest, highest, and most concentrated aquatic region (Fan et al., 2010; Liu et al., 2017; Li, 2012).
2.2 Date collection
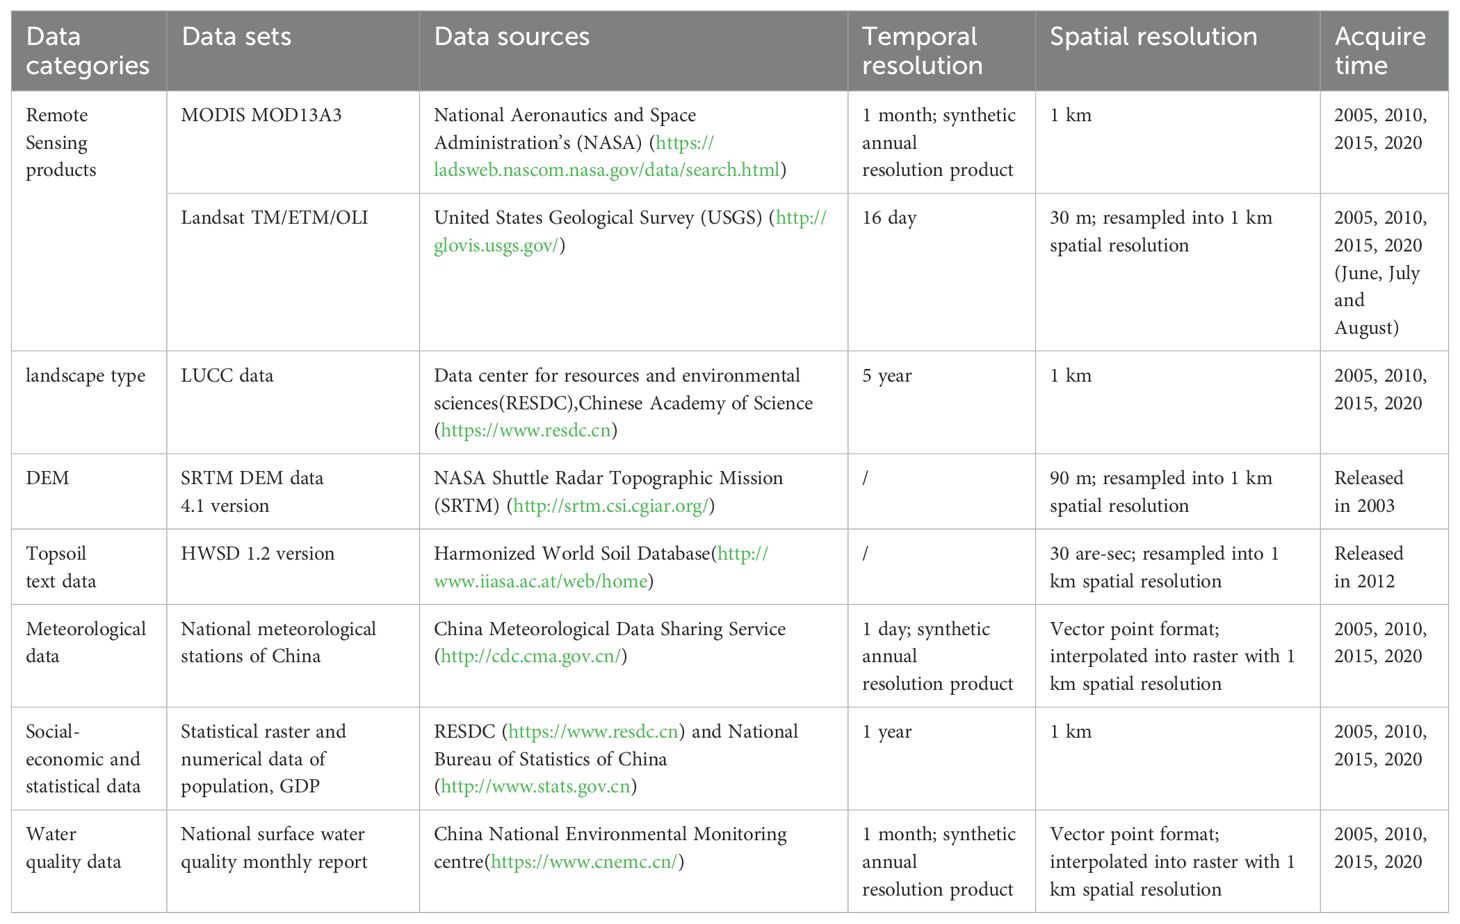
This study collected five categories of data across four time periods - 2005, 2010, 2015, and 2020: remote sensing data, DEM data, landscape data, topsoil text data, meteorological data, socio-economic and statistical data, and water quality data. The detailed information of data categories, sources and resolution is as shown in Table 1.
This study utilized two types of remote sensing data: Moderate Resolution Imaging Spectroradiometer (MODIS) and Landsat imagery. Specifically, MOD13A3 data acquired from https://ladsweb.nascom.nasa.gov/data/search.html were used to extract vegetation information. Landsat TM/ETM/OLI images from the United States Geological Survey (USGS; http://glovis.usgs.gov/) were used to retrieve information of chlorophyll concentration in water and suspended sediment concentration in water.
Digital elevation model (DEM) data, critical for ecological vulnerability (EV) analysis, was acquired from the National Aeronautics and Space Administration’s (NASA) Shuttle Radar Topographic Mission (SRTM) at 90 m spatial resolution (http://srtm.csi.cgiar.org/). This data was resampled to 1 km resolution, and regional slope maps at 1 km resolution were compiled using ArcGIS 10.5.
Topsoil text classification data were derived from the Harmonized World Soil Database (HWSD 1.2 version), which was accessed over the internet,and downloaded at: http://www.iiasa.ac.at/web/home. Water qulity data are collected from National Environmental Monitoring centre (https://www.cnemc.cn/).
Meteorological data was acquired from the China Meteorological Data Sharing Service (cdc.cma.gov.cn/). The original records from primary surface meteorological stations were archived as ASCII files submitted by meteorology personnel in each province, city, and county. These station data were interpolated into continuous surface data using an ordinary Kriging method with a spherical semi-variogram model (Kumar et al., 2023).
Socio-economic data consisted of statistical data in grids and tables. Population density and GDP data from 2005-2020 at 5-year intervals were acquired from the Thematic Database for Human-Earth System (Institute of Geographic Sciences and Natural Resources Research, CAS, 2000) at 1x1 km resolution. All socio-economic data were converted to raster format using ArcGIS 10.5. Per capita, arable and grassland area statistics were calculated by integrating Land Use/Cover Change(LUCC) data with statistical population data for each county. These data are critical for evaluating human impacts on the eco-environment.
All datasets were projected using the Albers projection and transferred to 1 km × 1 km raster data to unify the scale.
2.3 Methodology
2.2.1 Construction of the indicator system
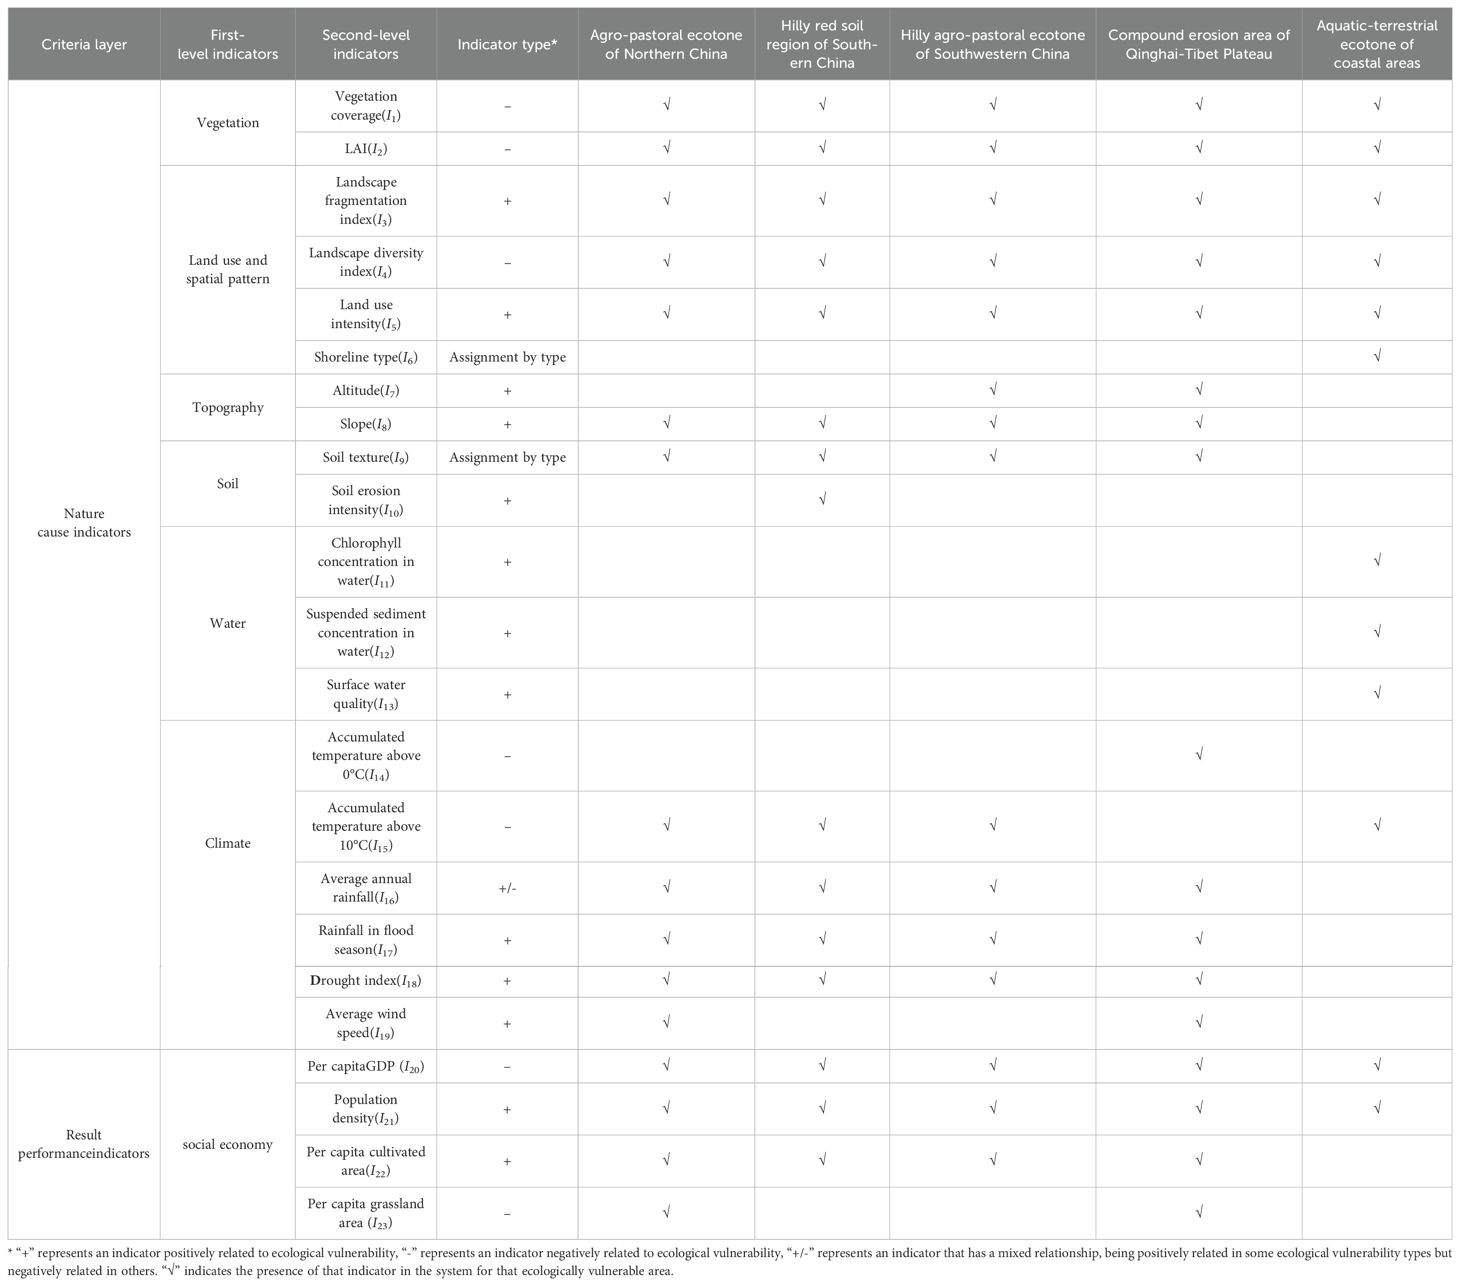
Establishing an indicator system is key to assessment, as it considers both the internal function and structure of eco-environmental systems and their relationship with external factors. Its indicators are comprehensive and extensive and generally reflect the vulnerable state of the ecological environment from the aspects of natural, social and economic development. The selection of theoretical model is the foundation to constructing an ecological vulnerability assessment indicator system. Many commonly used conceptual models such as PSR (Pressure-State-Response) and SRP (Sensitivity-Resilience-Pressure) are evolved from the “cause-result” model. And the “cause-result” model can clearly analyze the causes of ecological vulnerability in typical areas. Namely, when the ecosystem itself is highly sensitive, it generates primary ecological vulnerability; When an ecosystem is disturbed by human activities beyond its threshold for maintaining its own stability, secondary vulnerability arises. Therefore, this study adopts the “cause-result” model to construct the ecological vulnerability assessment indicator system for typical vulnerable areas in China (Wu and Tang, 2022).
Numerous indicators could be derived to evaluate ecological vulnerability based on analyzing its causes and characteristics. However, including all possible causes and manifestations would generate an unwieldy indicator system, increasing workload and diluting key indicators, leading to inaccurate results. Therefore, we streamline the system by selecting only the main causal and characteristic indicators. The dominant vulnerability factors and characteristics differ across China’s vast and ecologically diverse territory. Thus, varying indicators are required, reducing the comparability of assessment results between regions.
Moreover, using region-specific indicators would produce results similar to natural zoning. To overcome this, we added ecological vulnerability performance indicators as a correction factor. Ultimately, we established an assessment indicator system that considers operability (i.e., the accessibility of indicators), comparability, and simplicity and differs from natural zoning. The leading causal indicators of ecological vulnerability include vegetation, terrain, soil, climate, and water bodies. The result performance indicators encompass economic development, social health, and related factors.
Establishing the assessment indicator system can be divided into the following steps. The leading causes of ecological vulnerability of the five typical ecologically vulnerable areas were identified. Then, vulnerability performance and characteristics were analyzed through extensive investigation and research. On this basis, optional vulnerability factors for each ecologically vulnerable area were selected, including common vulnerability indicators applicable to all ecologically vulnerable areas and specific vulnerability indicators for each area.Finally, the indicator system includes 7 first-level indicators, and 23 second-level indicators were established, as shown in Table 2.
2.2.2 Indicator calculation
There are 7 first-level indicators in the indicator system. The explanation, calculation and normalization of the relationship between each indicator and vulnerability are as follows.
2.2.2.1 Vegetation
The First-level indicators of vegetation include two Second-level indicators: Vegetation coverage (I1) and LAI (leaf area index) (I2). Vegetation coverage negatively correlates with ecological vulnerability. This comprehensive indicator quantifies vegetation covering the land surface. Vegetation coverage is retrieved from remote sensing data. First, NDVI is calculated from Red and NIR satellite imagery. Then, vegetation coverage is calculated using the following formula based on the relationship between coverage and NDVI:
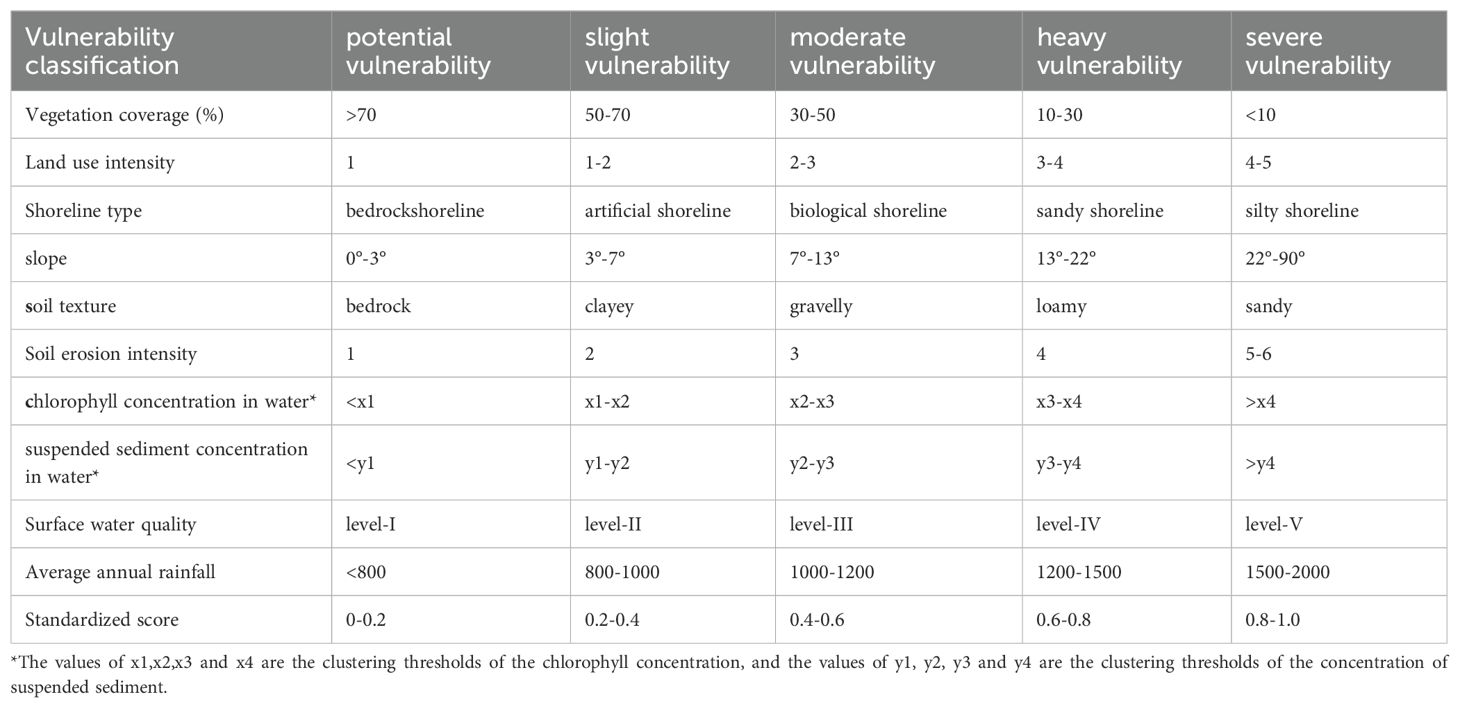
Where represents the NDVI value of bare land or non-vegetated area, and represents the NDVI value of high vertical density pixels. Generally, the minimum value of NDVI in the image is taken as , and the maximum value is taken as . The corresponding relationship between vegetation coverage and evaluation index scores is shown in Table 3.
LAI is a comprehensive indicator of the utilization of light energy and the canopy structure of vegetation. LAI indicator in the study is acquired from Global Inventory Modeling and Mapping Studies (GIMMS LAI3g) products provided by the GIMMS program at the Global Land Cover Facility, University of Maryland (http://sites.Bu.edu/cliveg/).
2.2.2.2 Land cover and spatial pattern
The indicators of land cover and spatial pattern include landscape fragmentation index (I3), landscape diversity index (I4), land use intensity (I5) and Shoreline type (I6). The landscape fragmentation index represents the fragmentation degree of natural and artificial segmentation. it is positively correlated with ecological vulnerability and is calculated by the following formula.
Where n is the number of landscape types, Ni is the number of patches of landscape type i, and A is the total area of each type of landscape. The land cover data is derived from GlobeLand30, the 30-meter resolution global land cover data product developed by China.
The landscape diversity index is negatively correlated with ecological vulnerability.Commonly used landscape diversity indexes include the Shannon-weaver diversity index and Simpson diversity index. This study uses the Shannon diversity index, and the calculation method is shown in the following formula:
Where H is the landscape diversity index, Pi is the area percentage of landscape type i, and m is the number of landscape types.
Land use intensity refers to the percentage of construction land area within a defined extent. It is calculated as:
Where I represents the intensity of land use in the study area. Gi represents the intensity grade value of the ith land use type. Ci is the proportion of the ith land use type to the total land area.n is the number of land use types of land systems in the study area. The land use type is classified according to the degree of human interference in its natural state.
China’s offshore marine comprehensive survey and evaluation program divides the coastline types into five categories: bedrock shoreline, sandy shoreline, silty and muddy shoreline, biological shoreline and artificial shoreline. Different shoreline types are vulnerable to different risks of seawater erosion, and the causes of coastal erosion are in turn the reduction of river sediment into the sea, artificial sand mining, sea level rise and coastal engineering. As shown in Table 3.
2.2.2.3 Topography
The indicators of topography include altitude (I7) and slope (I8). Altitude is one of the important geomorphic vulnerability factors. In the complex erosion vulnerability area of the Qinghai-Tibet Plateau, many vulnerability performances vary with altitude, such as rainstorms, debris flow and salinization. The vertical water and heat conditions changes are evidentin a southwest farming-pastoral ecotone in mountainous areas. Generally, under the same conditions of other factors, the higher the altitude, the higher the ecological vulnerability, and the altitude is positively correlated with the ecological vulnerability (Li et al., 2006; Wang et al., 2008).
The slope is one of the important topographic factors. The larger the slope, the easier it is to induce some natural disasters, such as landslides and debris flows. Generally, with the same other factors, the greater the slope, the higher the ecological vulnerability, and vice versa. Due to the complex relationship between slope and erosion amount, it is generally believed that the larger the slope, the stronger the erosion, significantly when the slope increases to more than 15°, the erosion amount increases rapidly. When the slope increases to a certain value, the erosion amount will not increase. Given this, the slope is divided into five levels according to the potential risk rating standard of soil erosion published by the Ministry of Water Resources in 1997. The corresponding relationship between the slope classification and the index score is shown in Table 3.
2.2.2.4 Soil
The indicators of soil include soil texture (I9) and soil erosion intensity (I10). Different soil textures present different ecological vulnerabilities. Soil erosion intensity is a narrow sense of water and soil loss, which can quantitatively express and measure the amount and intensity of soil erosion in a particulararea. The soil erosion intensity is calculated using the look-up table method (Ministry of Water Resources of the People’s Republic of China, 1997), as shown in Table 3. The relationship between soil and ecological vulnerability is shown in Table 4.
2.2.2.5 Water
The indicators of water include chlorophyll concentration in water (I11), suspended sediment concentration in water (I12) and surface water quality (I13). Chlorophyll concentration in the water body is an indicator of plankton distribution and the most fundamental indicator to measure the primary productivity and eutrophication of the water body. The movement of suspended sediment in the coastal waters often causes the port channel siltation and the coastline’s deformation. The chlorophyll concentration and suspended sediment concentration in water retrieved from remote sensing are divided into five levels by cluster analysis, namely:<x1, x1-x2, x2-x3, x3-x4,>x4. x1, x2, x3, x4 are obtained by calculating the mean value and mean square deviation. The vulnerability of the ecological environment’s impact on surface water quality is divided into five levels according to the National Environmental Quality Standard for Surface Water of China,As shown in Table 3.
2.2.2.6 Climate
The indicators of climate include accumulated temperature above 0°C (I14), accumulated temperature above 10°C (I15), average annual rainfall (I16), rainfall in flood season (I17), dryness index (I18) and average wind speed (I19). The accumulated temperature is the sum of the daily average temperature greater than a critical temperature value, and the accumulated temperature above 0°C is the sum of the daily average temperature ≥ 0°C, the same is the indicator of accumulated temperature above 10°C. Heat resources not only directly affect the formation of ecosystems but also affect the evolution of ecological vulnerability through the coordination with water resources, forest coverage and other aspects. The accumulated temperature is negatively correlated with ecological vulnerability.
Average annual precipitation is an important indicator of water resources in a region. The amount of precipitation can affect the formation of a fragile ecological environment through runoff and groundwater. However, excessive precipitation will also affect ecological vulnerability, so there is a positive correlation between precipitation and ecological vulnerability. The five ecological vulnerability area types examined in this study have distinct characteristics. Frequent and intense rainstorms and severe surface water erosion characterize the vulnerability of the southern red soil hilly area.However, the vulnerability of Aquatic-terrestrial ecotone in coastal areas is characterized by frequent occurrences of climate disasters such as tides, typhoons, and rainstorms. The corresponding relationship between the annual average precipitation and vulnerability of the former two regions is shown in Table 3. The other three types of ecological vulnerability areas, including northern forest, grass, agriculture and animal husbandry staggered area, southwest farming-pastoral ecotone in the mountainous area, and compound erosion area of Qinghai-Tibet Plateau are characterized by varying degrees of water shortage. The annual average precipitation in these areas is negatively correlated with regional ecological vulnerability.
Rainfall during the flood season indicates vulnerability to natural disasters. Higher rainfall increases disaster vulnerability in the evaluated area. This positive correlation makes flood season precipitation a useful indicator of ecological vulnerability.
The dryness index (K) indicates regional aridity, typically quantified by water and heat budgets. K, calculated via a modified Sheranov formula, measures the balance of water and heat. Imbalance results in extreme drought under hot, dry climates. Higher dryness values reflect greater ecological fragility and positive correlation with environmental vulnerability.
Where T10 refers to an annual accumulated temperature above 10°C, P10 refers to annual precipitation during the days when the temperature is above 10°C.
The wind has serious erosion damage on the surface and plants. Strong winds have intensified the land’s sandy process and the desertification area’s expansion, causing more destructive disastrous weather such as sandstorms, which severely damage vegetation. The degree of wind is characterized by the average wind speed, which positively correlates with ecological vulnerability.
2.2.2.7 Social economy
The indicators of social economy include per capita GDP (I20), population density (I21), per capita cultivated area (I22) and per capita grassland area (I23). Per capita GDP indicates the regional economic development level and negatively correlates with ecological vulnerability. The population density of a region is also an important factor affecting the vulnerability of the ecological environment, and it is positively correlated with ecological vulnerability. Per capita cultivated area represents the combination of population and land resources and is also one of the main factors contributing to the vulnerable ecological environment. It is positively related to ecological vulnerability. Animal husbandry is important in the Qinghai-Tibet Plateau composite erosion ecological area and the northern farming-pastoral ecotone. The per capita grassland area can represent the carrying capacity of livestock, which is negatively correlated with the vulnerability of the ecological environment.
2.2.3 Indicator standardization
As the measurement of each indicator is expressed in different units, the indicators must be standardized by converting them into dimensionless values between 0 and 1 before calculation. Distinct standardization methods are employed for selected indicators according to national standards or references, as shown in Table 3. Other indicators are standardized by normalization. The standards of positive indicators are normalized through Equation 6, and the standards of negative indicators are normalized by Equation 7.
Where refers to the maximum value of the indicator, refers tothe minimum value of the indicator, and y refers to the normalized value for the indicator.
2.2.4 Weight calculation
The weight of each indicator is calculated by Analytic Hierarchy Process (AHP).The AHP technique is one of the most commonly adopted assessment tools (Li et al., 2009; Ying et al., 2007; Liu et al., 2017). The basic process of determining the weight coefficient of AHP includes four steps. (1) Constructing the hierarchical structure model of tomographic analysis. (2) Construct the interpretation matrix. (3) Sorting by layer and checking the consistency. (4) Total ranking to obtain decision results.
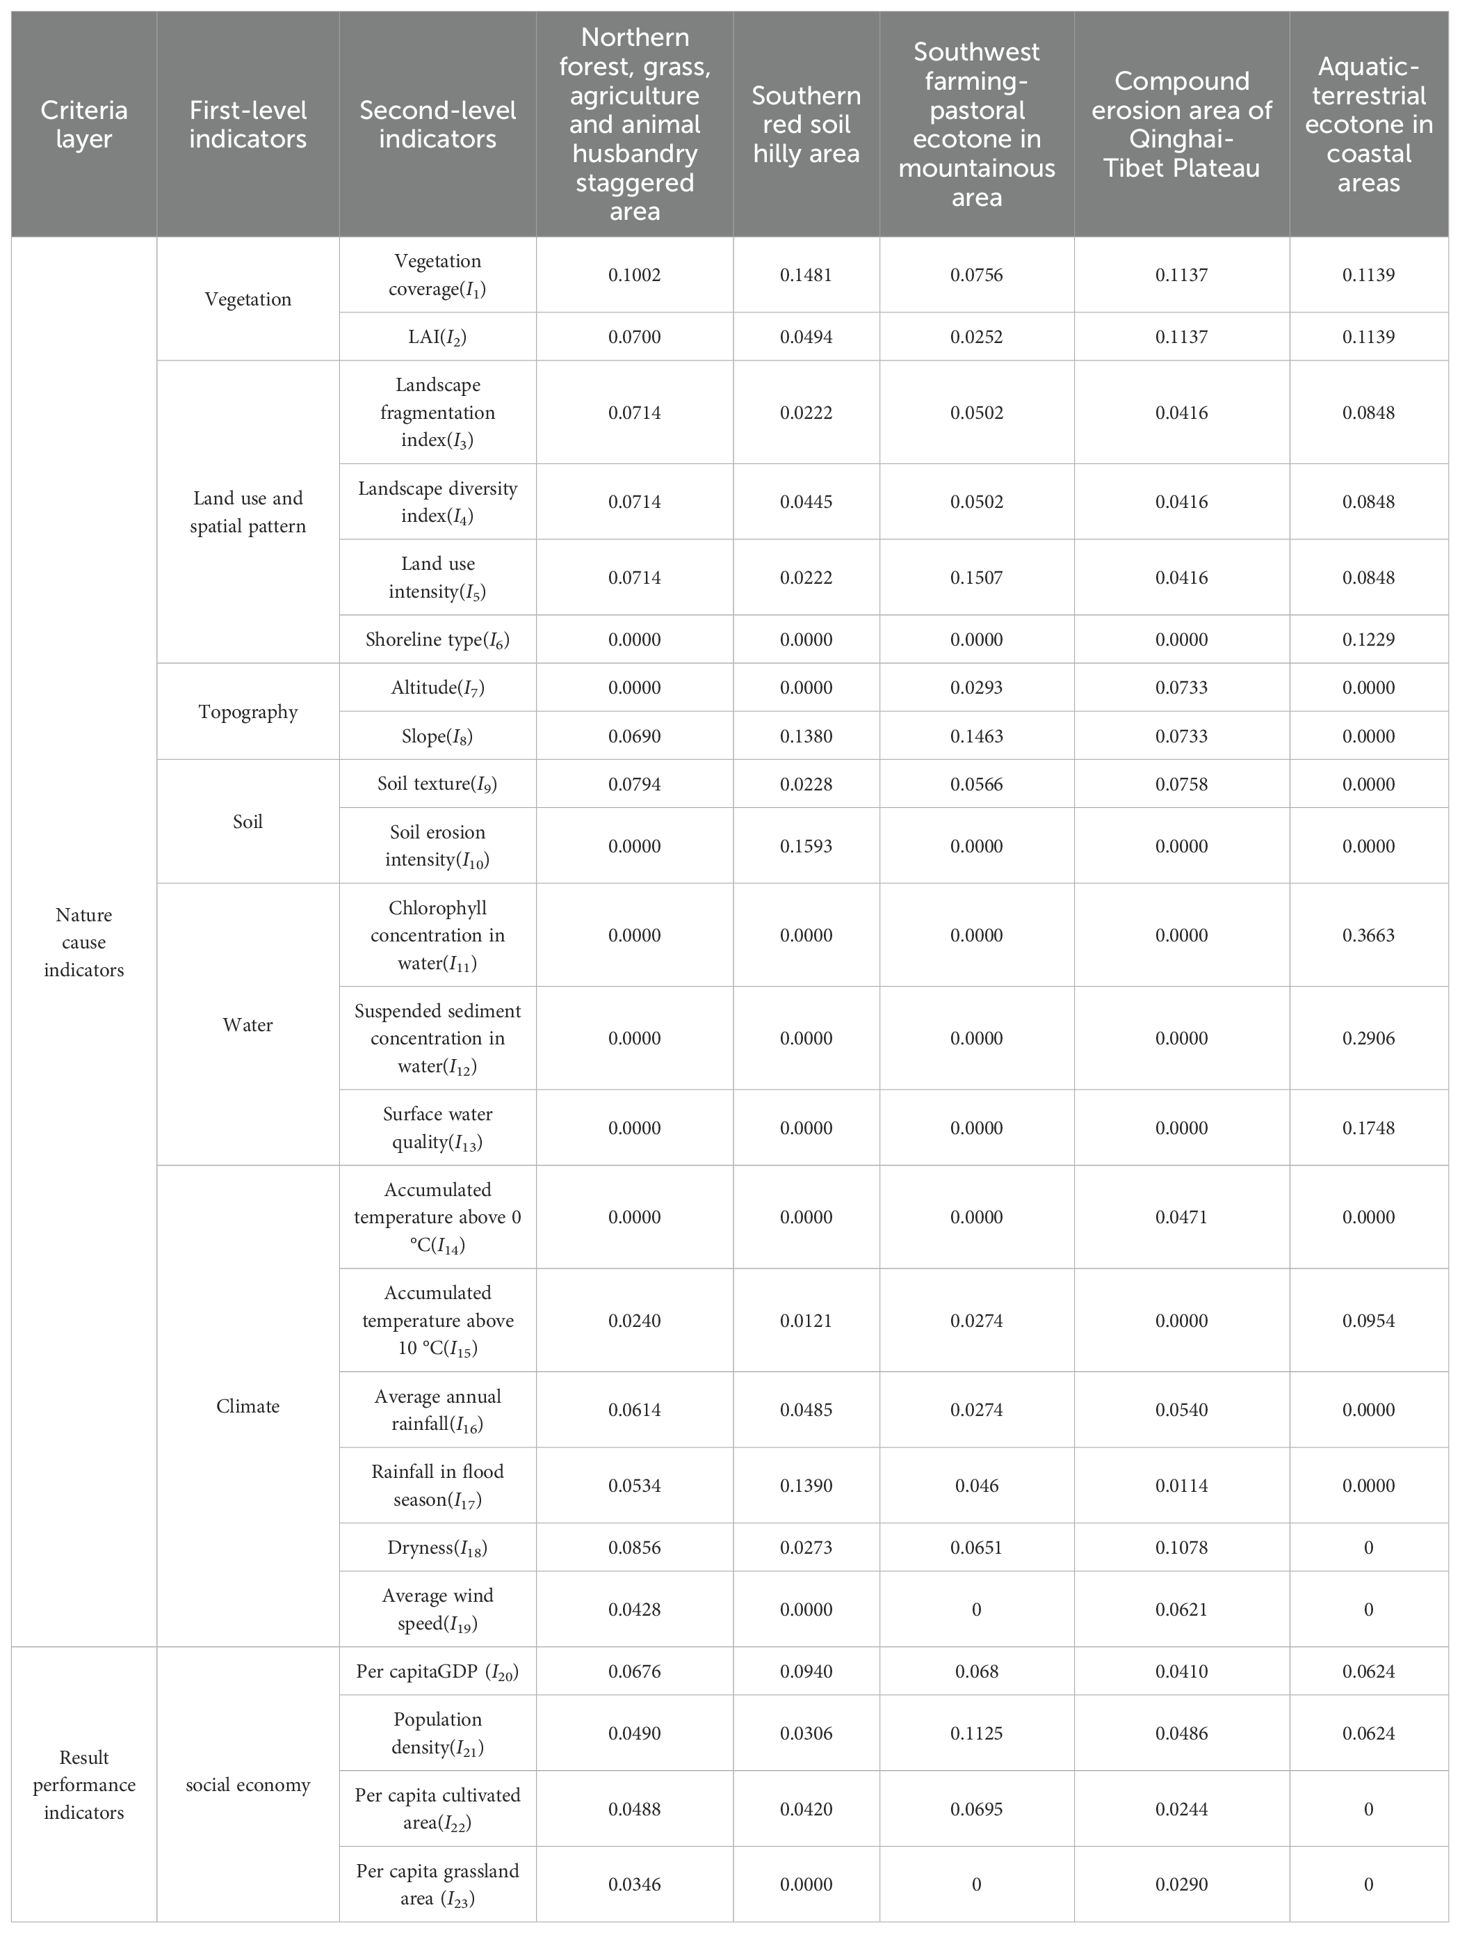
Using AHP to calculate the weight requires the relative importance of each indicator. The relative importance is obtained through expert consultation and literature review based on analyzing the characteristics and causes of each ecologically vulnerable area. The study consulted more than 40 experts and referenced approximately 120 relevant literature to determine the relative importance ranking of each indicator (Gao et al., 2012; Liu et al., 2017; Zhang et al., 2017a; Guo et al., 2020; Boori et al., 2021; Yang et al., 2023; Jiang et al., 2023). The weight of each indicator varies from each other. The comparison between different ecologically vulnerable areas needs to comprehensively consider the types of vulnerable areas and regional vulnerability characteristics. The study calculated a group of reference weights for each of the five ecologically vulnerable areas based on AHP according to the causes, characteristics and specific vulnerability phenomena of each ecologically vulnerable area, as shown in Table 5.
2.2.5 Ecological vulnerability comprehensive index
The ecological vulnerability is expressed by the Ecological Vulnerability Index (EVI). EVI is calculated by the quality index method, which is the weighted sum of all standardized secondary index values, as shown in the following formula.
Where EVI represents the comprehensive index of ecological vulnerability,n is the number of indicators in the evaluation system. Ij is the standardized value of the jth indicator, and Wj is the weight of the jth indicator.
2.2.6 Ecological vulnerability status stratification
Ecological vulnerability status stratification can help us to understand ecological vulnerability changes and the comprehensive ecosystem condition. Various methods are employed to classify the EVI into different levels, including natural break classification (Zou et al., 2021), manual threshold and so on. However, the grading results obtained by the natural break point method are not convenient for comparing the vulnerability of the same region at different periods, nor for comparing the vulnerability between different regions, as their segmentation thresholds for EVI maps are unfixed, which minimizes within-class variation and maximizes between-class variation and varies with the statistical characteristic values of EVI maps. The manual threshold method, which uses unified fixed thresholds to classify ecological vulnerability levels, is more convenient for quantitatively comparing ecological vulnerability in different periods and regions.
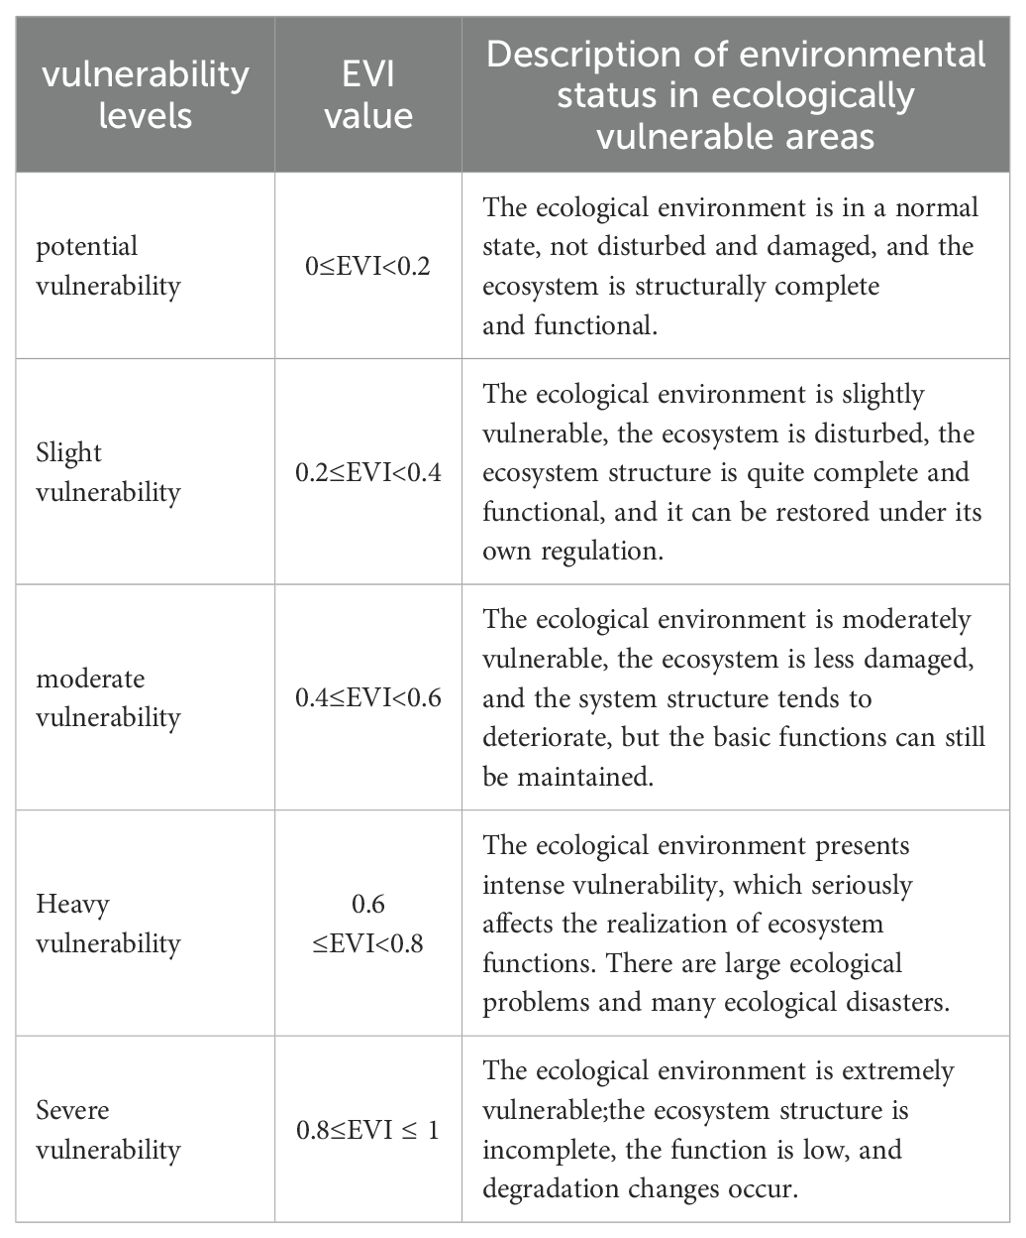
The ecologically vulnerable environment is divided into five levels:potential vulnerability, slight vulnerability, moderate vulnerability, heavy vulnerability and severe vulnerability, according to the value of EVI using the manual threshold method.The relationship between EVI value and vulnerability level is shown in Table 6.
The final result of the assessment is expressed as the thematic map of the ecological vulnerability level, supplemented by the corresponding descriptive text of the spatial distribution of the ecological vulnerability, including the ecological functions and system vitality of the assessed ecological vulnerability area. The temporal and spatial variations of ecological vulnerability in the study areas can also be analyzed based on the multi-temporal remote sensing and climatic data.All the processing and analyses regarding spatial data were carried out using ArcGIS10.2.
3 Results
3.1 Spatial and temporal characteristics of the EVI
Data for the indicators was collected in the five experimental regions for 2005, 2010, 2015, and 2020. Ecological vulnerability was assessed based on the indicator system presented. All spatial datasets were processed with the same projections and resolutions. The comparisons of average EVI value in the five study areas in 2005, 2010, 2015 and 2020 are shown in Table 7. The average EVIs value of Zhangbei County ranging from 0.525 to 0.559 are the highest among the five research areas during the four periods, followed by Zoige region and Xiamen bay. However, the region with the lowest average EVI value varies. In 2005 and 2015, it was Taihe County, while in 2010 and 2020, it was the Sanjiangyuan region.
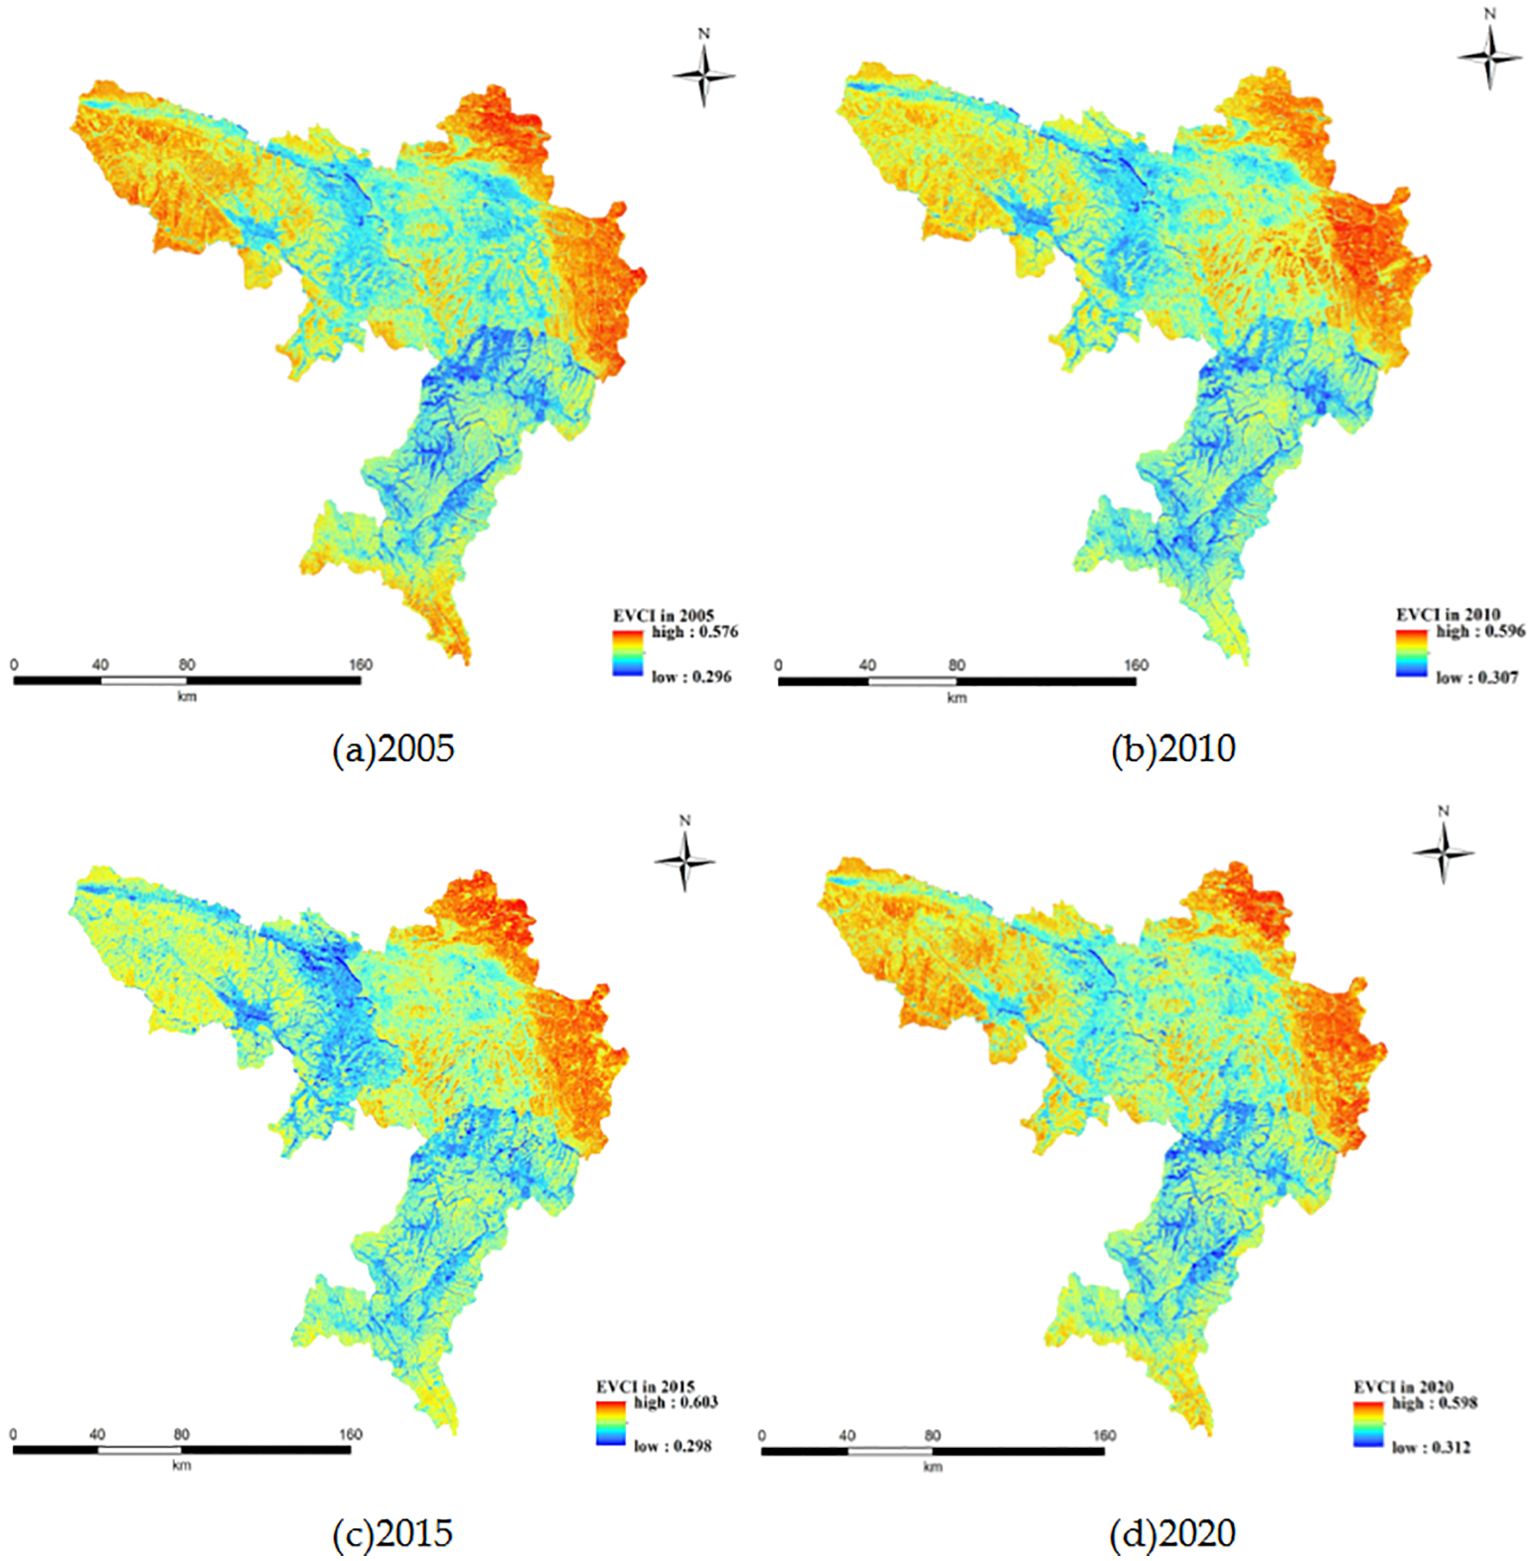
Figures 2A-D shows the spatial distribution of EVI in Zoige region, located in the hilly agro-pastoral ecotone of Southwestern China, for 2005, 2010, 2015, and 2020. According to the statistic, the average value of EVI in the Zoige region for 2005, 2010, 2015 and 2020 is respectively 0.461, 0.479, 0.465 and 0.481, ranging from 0.296 to 0.576, 0.307 to 0.596, 0.298 to 0.603and 0.312 to 0.598, with the standard deviations of 0.041, 0.040, 0.043 and 0.040.The results indicate that the ecological vulnerability of the Zoige region changed relatively little from 2005to 2020, with an average EVI value ranging from 0.29 to 0.62. EVI values are higher in the northwest compared to the middle and southeast regions. The trend of ecological vulnerability in Zoige shows a gradual increase over time.
Figures 3A–D shows the spatial distribution of EVI in the Sanjiangyuan region, located in the compound erosion area of the Qinghai-Tibet Plateau, for 2005, 2010, 2015, and 2020.The EVI spatial distribution shows greater ecological vulnerability in the northwest and western areas of the Sanjiangyuan region. In contrast, the ecological environment in the central region of the Sanjiangyuan region is relatively slight, while the ecological vulnerability in the eastern region of the Sanjiangyuan region is relatively heavy.According to the statistic, the average value of EVI in Sangjiangyuan region for 2005, 2010, 2015 and 2020 is respectively 0.431, 0.425, 0.439 and 0.432, ranging from 0.295 to 0.597, 0.271 to 0.602, 0.313 to 0.614 and 0.299 to 0.601, with the standard deviations of 0.041, 0.041, 0.042 and 0.042. According to thetemporal distribution characteristics, the ecological vulnerability value in the Sanjiangyuan region shows a fluctuation of first decreasing, then increasing, and then decreasing again, indicating that the trend of ecosystem degradation in Sanjiangyuan region has been preliminarily curbed.
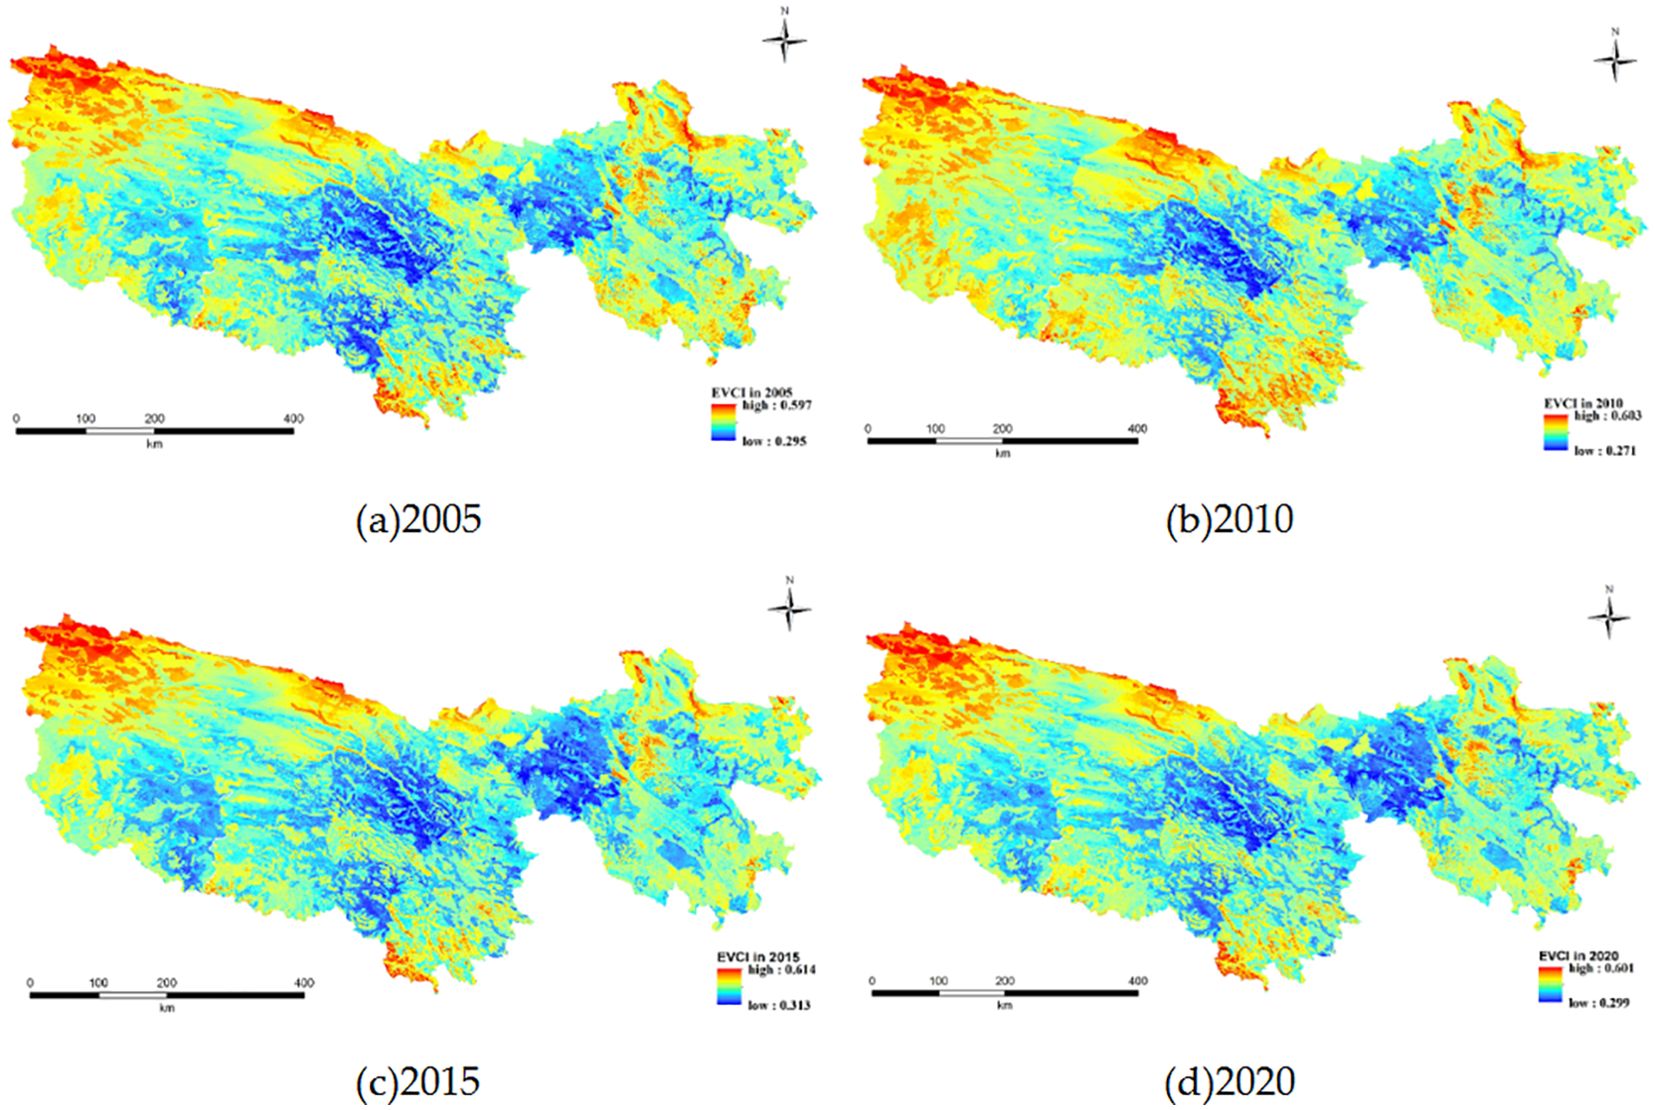
Figure 3. Spatial distribution of EVI in Sanjiangyuan region in (A) 2005, (B) 2010, (C) 2015, (D) 2020.
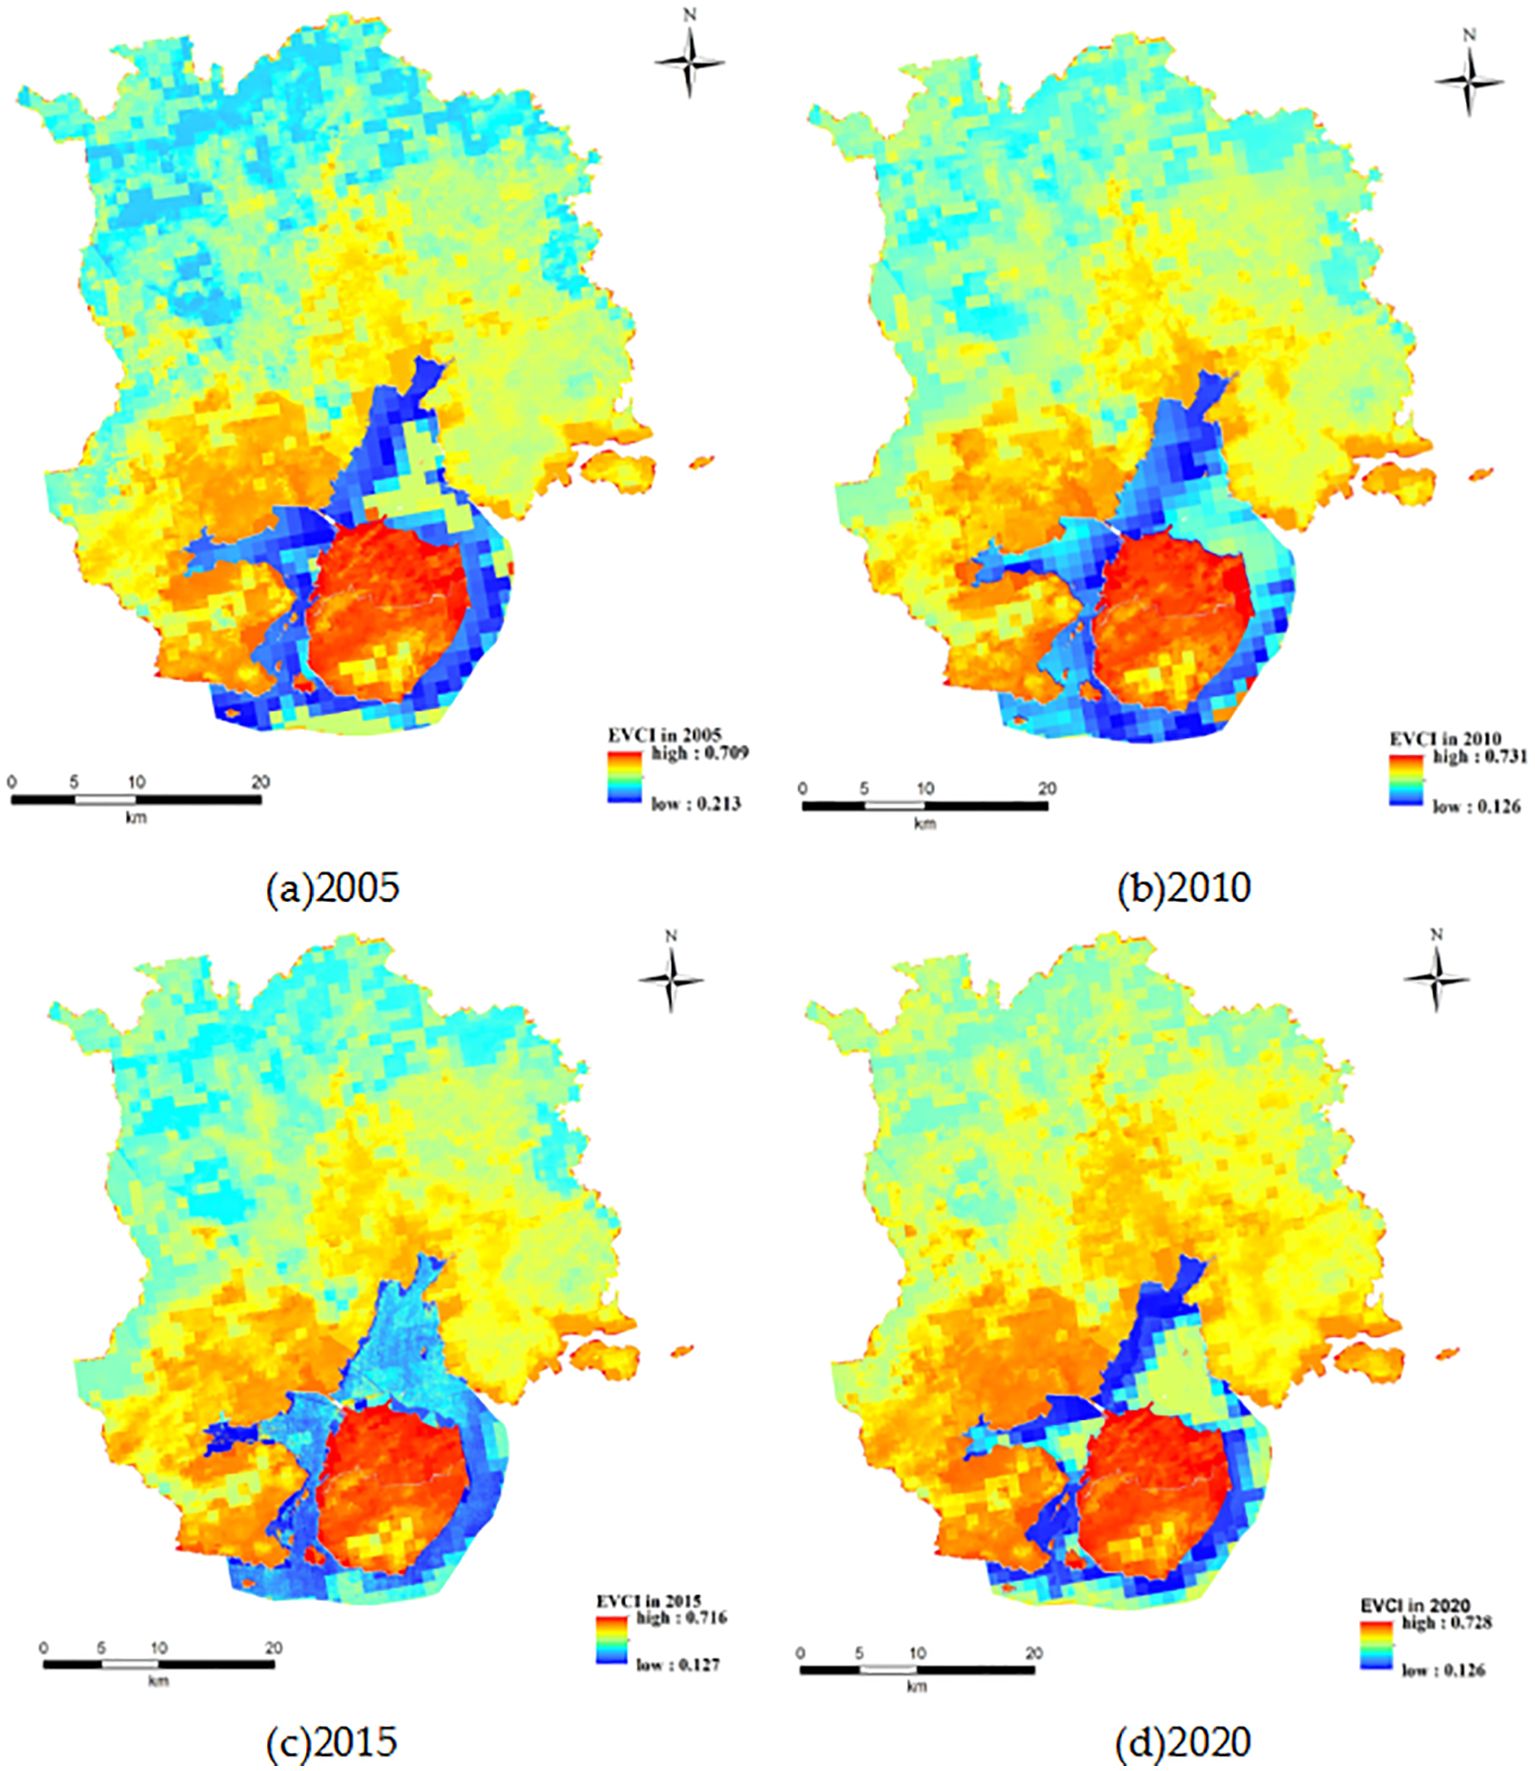
The spatial distributions of EVI in Xiamen Bay in the aquatic-terrestrial ecotoneofcoastal areas for 2005, 2010, 2015 and 2020 are shown in Figures 4A–D. The spatial heterogeneity of ecological vulnerability in Xiamen is high, and the ecological vulnerability value of the mainland area in the north of Xiamen is low, but the ecological vulnerability value of Xiamen Island is high. The ecological vulnerability of the water body part in the land water junction area is lower than that of the land part as a whole.According to the statistic, the average value of EVI in the Xiamen region for 2005, 2010, 2015 and 2020 is respectively 0.456, 0.464, 0.443 and 0.470, ranging from 0.213 to 0.709, 0.126 to 0.731, 0.127to 0.716 and 0.126 to 0.728, with the standard deviations of 0.108, 0.102, 0.100 and 0.113. Overall, with environmental governance, there is a trend of decreasing water body vulnerability and increasing land comprehensive vulnerability.
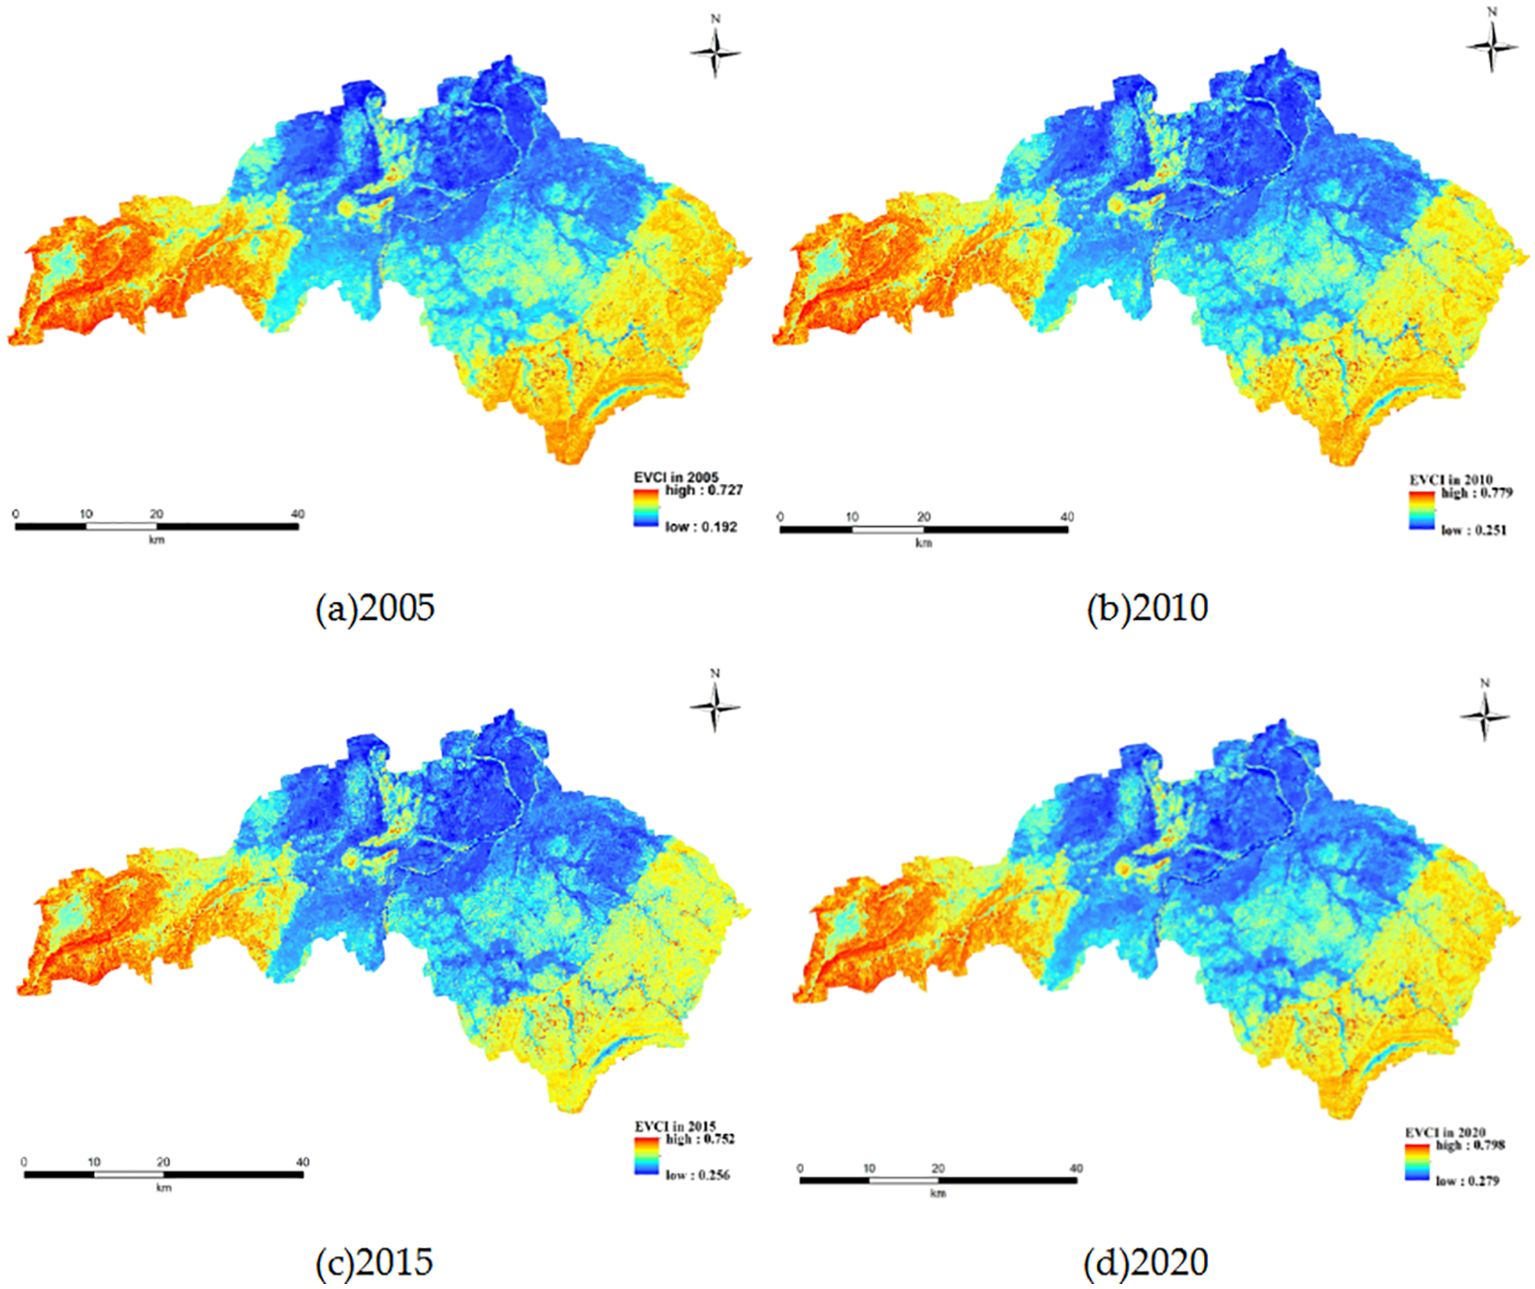
The spatial distributions of EVI in Taihe county in the hilly red soil region of Southern China for 2005, 2010, 2015 and 2020 are shown in Figures 5A–D. The overall EVI of Taihe County varies greatly in spatial distribution, with some regions in the west and southeast being at a relatively high value of vulnerability, while the northern and central regions are at a relatively low value of vulnerability.According to the statistic, the average value of EVI in the Taihe region for 2005, 2010, 2015 and 2020 is respectively 0.389, 0.436, 0.419and 0.465, ranging from 0.192 to 0.727, 0.251 to 0.779, 0.256to 0.752 and 0.279 to 0.798, with the standard deviations of 0.089, 0.081, 0.074 and 0.078.
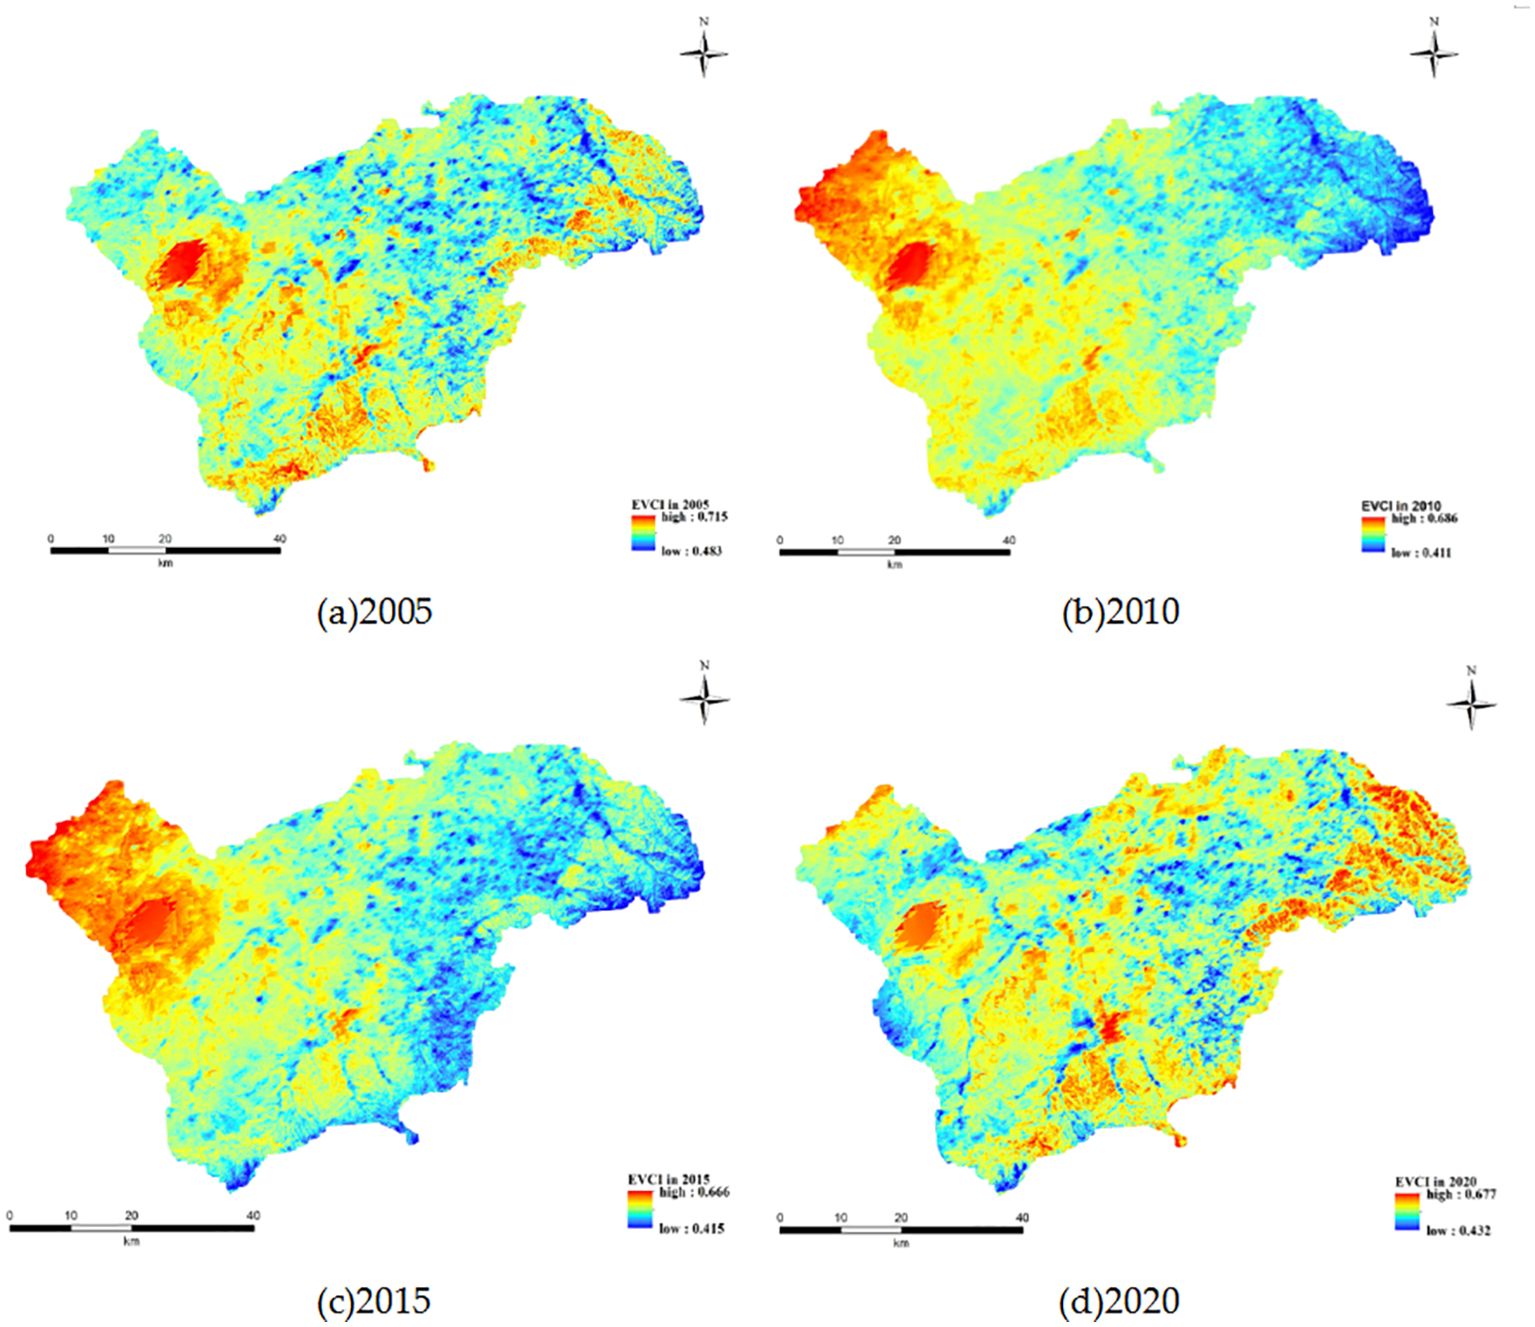
The spatial distributions of EVI in Zhangbei County in the agro-pastoral ecotone of Northern China for 2005, 2010, 2015 and 2020 are shown in Figures 6A-D. According to the statistic, the average value of EVI in the Zhangbei region for 2005, 2010, 2015 and 2020 is respectively 0.559, 0.545, 0.533 and 0.525, ranging from 0.483 to 0.715, 0.411 to 0.686, 0.415to 0.666 and 0.432 to 0.677, with the standard deviations of 0.017, 0.034, 0.032 and 0.020.From 2005 to 2020, the ecological vulnerability of the Zhangbei region showed a trend of first increasing and then decreasing, with an overall ecological vulnerability index ranging from 0.41 to 0.72, ranking in moderate and heavy vulnerability levels. Among them, some regions in the Southwest experienced significant changes in vulnerability during the four phases, showing a trend of increasing and then decreasing vulnerability. The vulnerability level in the eastern region was lower than in the western region.
3.2 Dynamic change of ecological vulnerability
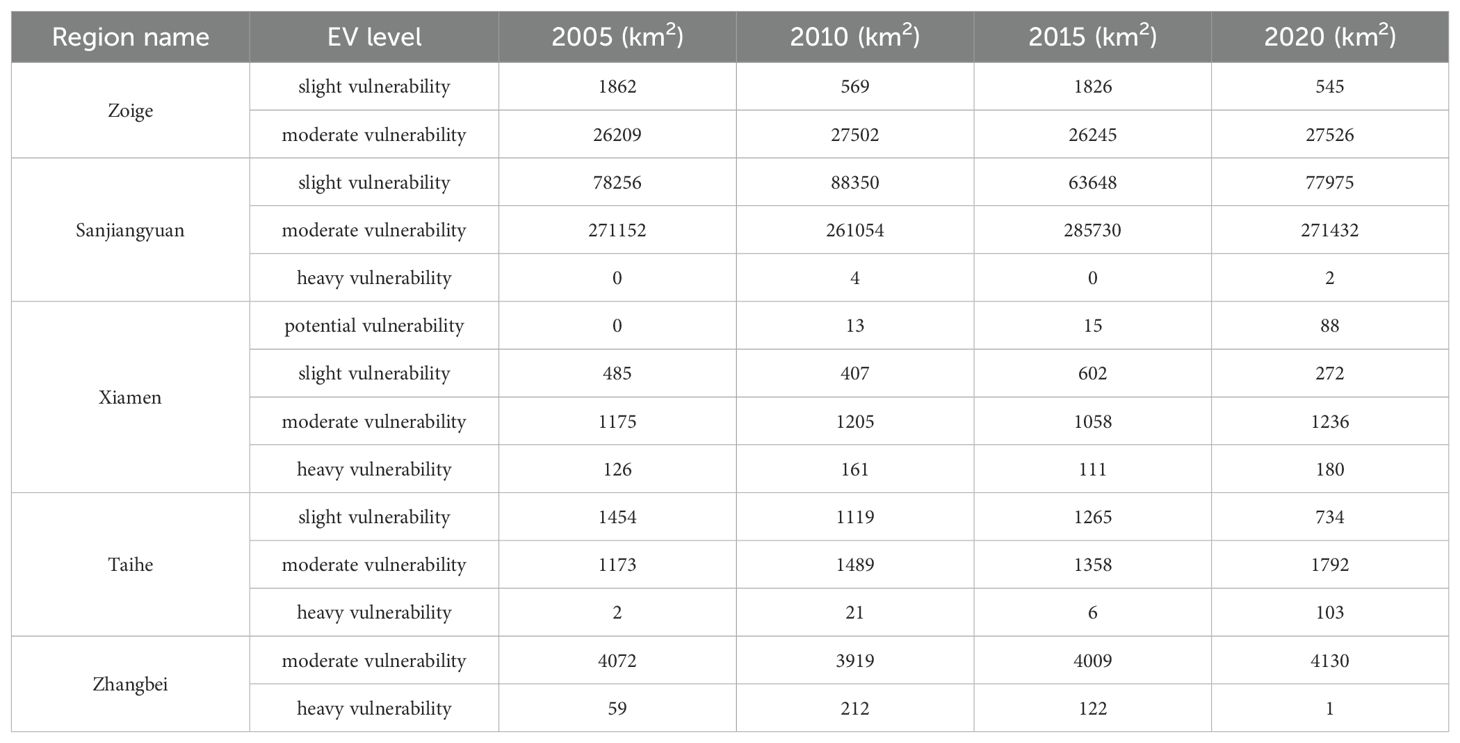
General changes in ecological vulnerability for the five study areas from 2005 to 2020 were analyzed in the context of EVI values presented in Table 8. The area of each ecological vulnerability level for five study areas is computed based on the geo-statistics method. There were only two ecological vulnerability levels in the Zoige region,slight and moderate, from 2005 to 2020. Most areas in the Zoige regionwere at a moderate vulnerability level. The area of moderate vulnerability level was 26209 km2 in 2005, which accounts for 93.4% of the total area.That was 27502 km2 in 2010 (account for 98.0%), 26245 in 2015 (account for 93.4%) and 27526 in 2020 (account for 98.1%). Overall,the ecological vulnerability in the Zoige region has undergone minimal changes from 2005 to 2020.
In the compound erosion area of the Qinghai-Tibet Plateau, there were three ecological vulnerability levels in the Sanjiangyuan region from 2005 to 2020, slight, moderate, and heavy. In 2005, about 271152 km2 area was a moderate vulnerability, accounting for 77.6% of the total area. The remaining area was a slight vulnerability. Although the area with a moderate vulnerability level decreased to 261054 km2 and a slight vulnerability level increased to 88350 in 2010, a severe vulnerability area of 4 km2 emerged. The area with moderate vulnerability level increased to 285730km2 in 2015 and then decreased to 271432 in 2020. Overall, although the ecological vulnerability of the Sanjiangyuan region fluctuated from 2005 to 2020, the change was insignificant. As an Urban ecosystem greatly disturbed by human activities, Xiamen Bay contained four levels of ecological vulnerability which ranged from potential vulnerability to heavy vulnerability during 2005 and 2020. There was no area with potential vulnerability in 2005, but it increased to 13km2in 2010, 15km2 in 2015 and 88km2 in 2020. The area with a slight vulnerabilitylevel was485km2 in 2005, which decreased to 407km2 in 2010, then increased to 602 km2 in 2015, and finally decreased to 272 km2 in 2020. At any time between 2005 and 2020, the area with moderate vulnerability level in the Xiamen regionwas the largest, accounting for 65.8% in 2005, 67.5% in 2010, 59.2% in 2015, and 69.2% in 2020 of the total area. At the same time as the area with potential vulnerability levels increased, the area with severe vulnerability levels also showed a fluctuating upward trend from 2005 to 2020.Taihe County, whichis located in the hilly red soil region of Southern China, contained three levels of ecological vulnerability areas from 2005 to 2020. The area with slight vulnerability was1454km2in 2015, accounting for 55.3% of the total area. At the same time,only an area of 2km2 was heavy vulnerability. However, the area with slight vulnerability decreased to 734km2 in 2020, and the area with heavy vulnerability increased to 103km2. The ecological environment of Taihe County showed a significant deterioration trend from 2005 to 2020.The ecological vulnerability of Zhangbei County in the agro-pastoral ecotone of Northern China was relatively unified. Most areas in Zhangbei were moderate vulnerability, which was 4072km2 in 2005, 3919km2 in 2010, 4009km2 in 2015, and 4130km2 in 2020, respectively, accounting for 98.6%, 94.9%, 97.0% and 100% of the total area. Overall, the ecological vulnerability of Zhangbei County remains stable, with little change from 2005 to 2020.
4 Discussion
4.1 Trends in ecological vulnerability changes
In this paper, we built a indicator system to evaluate the ecological vulnerability of five experimental areas in China at different scales and spatial locations based on remote sensing, meteorological, geographic and other data and analyzes the spatio-temporal variability of the EVI maps in four periods during 2005 and 2020. We found that the ecosystems of these five typical variable areas in China are generally at moderate levels of vulnerability, which is consistent with previous assessments of ecological vulnerability in China or regions (Liu et al., 2017; Zhao et al., 2018).
From the perspective of temporal trends, the mean EVI across the five experimental areas exhibited minimal fluctuation and remained generally stable from 2005 to 2020, as shown in Figure 7. This indicates China’s recent environmental protection measures and projects have curbed ecological deterioration. Especially in Zhangbei country, the average EVI shows a significant downward trend, for afforestation has been taken as an important means to improve the ecological environment, and key ecological engineering such as the Beijing and Tianjin sandstorm source control project and the matching of returning farmland to forests and barren mountains have been organized and implemented.
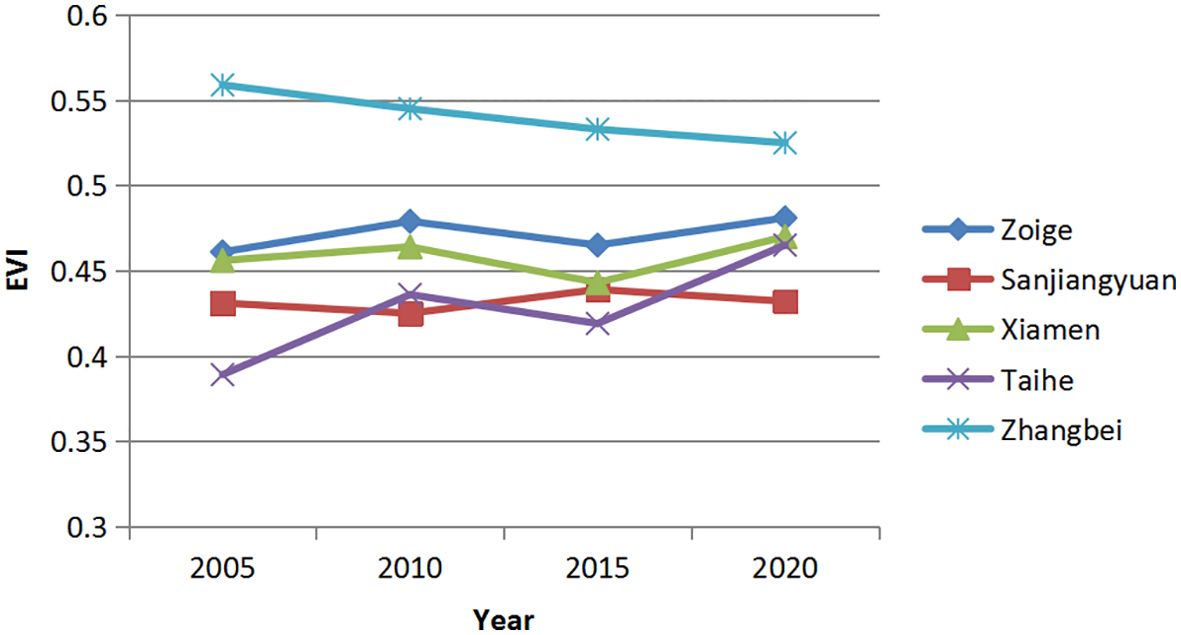
Figure 7. Temporal variability of the average EVI across the five experimental areas during 2005 and 2020.
4.2 Applicability and limitations of the indicator system
There are many studies on EVI in many countries based on meteorological data, geographic data and remote sensing data, but its the first time a unique study to establish an indicator system for various types of ecological vulnerability, especially suitable for most vulnerable types in China (Liu et al., 2017; Zhang et al., 2017a; Guo et al., 2020; Boori et al., 2021; Yang et al., 2023). Compared to other studies, they utilized a fixed set of indicators to evaluate specific areas or types of vulnerability. In contrast, this study employed a combination of common indicators and specialized indicators to evaluate various types of vulnerable areas. Moreover, it enables quantitative comparisons of the evaluated areas from different spatio-temporal perspectives. By utilizing advanced remote sensing and GIS technologies to obtain spatio-temporal data at different scales, and utilizing remote sensing inversion or extraction of ecological indices and spatialization of meteorological observation data, the vulnerability assessment results are superior to other methods in terms of quality, accuracy, and real-time monitoring, while spending less effort and lower costs. When comparing this study to other studies, its methodology can be applied to assess vulnerability or conduct risk assessments in any regional study area. However, other studies have limitations stemming from various local factors, weight,diverse regional aspects, and differences in scale and data availability, among other factors (Song et al., 2010). In an advancement, this study showed factors attributed to RSEI dynamics and change patterns with statistics, and in the last RSEI validation,which not only related to the actual situation of the area but also reliable the development requirements of the region.
There are also some limitations in the study. Firstly, it is difficult to determine the optimal threshold for grading evaluation indicators, so we can only refer to relevant national standards, previous research literature, or equal intervals to determine the thresholds. Secondly, the determination of weights requires experts to rank the importance of each indicator due to the use of AHP, which makes the indicator system somewhat subjective. Finally, this study used a fixed manual threshold method to facilitate a quantitative comparison of vulnerability in different periods and regions to grade the vulnerability evaluation results. However, the distribution of ecological vulnerability index values showed significant heterogeneity in different levels, making the vulnerability grading results not obvious.
5 Conclusion
This study employs the constructed ecological vulnerability evaluation indicator system to evaluate the ecological vulnerability of five experimental areas in China at different scales and spatial locations based on remote sensing, meteorological, geographic and other data and analyzes the spatio-temporal variability of the EVI maps in four periods during 2005 and 2020. The results show the constructed ecological vulnerability evaluation indicator system in this study has good applicability and robustness. The ecological vulnerability of the five experimental areas presented little fluctuation and remained generally stable from 2005 to 2020. The trend of ecological environment deterioration has curbed the environmental protection measures and projects taken by China government in recent years.
Data availability statement
The original contributions presented in the study are included in the article/supplementary material. Further inquiries can be directed to the corresponding author.
Author contributions
MX: Conceptualization, Validation, Writing – original draft. CC: Conceptualization, Writing – review & editing. SZ: Data curation, Visualization, Writing – original draft. XY: Data curation, Methodology, Writing – original draft. BB: Writing – review & editing. KW: Software, Writing – original draft. HG: Validation, Visualization, Writing – original draft. XG: Investigation, Validation, Writing – original draft. JL: Data curation, Writing – original draft. YY: Investigation, Software, Writing – original draft.
Funding
The author(s) declare financial support was received for the research, authorship, and/or publication of this article. This work was supported by the project of the National Key R&D Program of China (grant number: 2021YFB3901300).
Acknowledgments
We thank to the support and scholarship of State Key State Key Laboratory of Remote Sensing Science of China. Our gratitude is also extended to reviewers for their efforts in reviewing the manuscript and their very encouraging, insightful and constructive comments.
Conflict of interest
The authors declare that the research was conducted in the absence of any commercial or financial relationships that could be construed as a potential conflict of interest.
Publisher’s note
All claims expressed in this article are solely those of the authors and do not necessarily represent those of their affiliated organizations, or those of the publisher, the editors and the reviewers. Any product that may be evaluated in this article, or claim that may be made by its manufacturer, is not guaranteed or endorsed by the publisher.
References
Aspinall R., Pearson D. (2000). Integrated geographical assessment of environmental condition in water catchments: linking landscape ecology, environmental modelling and GIS. J. Environ. Manage. 59 (4), 299–319.
Boori M. S., Choudhary K., Paringer R., Kupriyanov A. (2021). Spatiotemporal ecological vulnerability analysis with statistical correlationbased on satellite remote sensing in Samara, Russia. J. Environ. Manage. 285, 112138. doi: 10.1016/j.jenvman.2021.112138
Chen B. H., Kang W., Xu D., Hui L. (2021). Long-term changes in red tide outbreaks in Xiamen Bay in China. Estuar. Coast. Shelf Sci. 249, 107095. doi: 10.1016/j.ecss.2020.107095
Cutter S. L., Boruff B. J., Shirley W. L. (2003). Social vulnerability to environmental hazards. Soc. Sci. Q. 84 (2), 242–261.
Dai X., Feng H., Xiao L., Zhou J., Wang Z., Zhang J., et al. (2022). Ecological vulnerability assessment of a China’s representative mining city based on hyperspectral remote sensing. Ecol. Indica. 145, 109663. doi: 10.1016/j.ecolind.2022.109663
De Lange H. J., Sala S., Vighi M., Faber J. H. (2010). Ecological vulnerability in risk assessment—A review and perspectives. Sci. Total Environ. 408, 3871–3879. doi: 10.1016/j.scitotenv.2009.11.009
Dixon B. (2005). Groundwater vulnerability mapping: a GIS and fuzzy rule basedintegrated tool. Appl. Geogr. 25, 327–347. doi: 10.1016/j.apgeog.2005.07.002
Fan J. W., Shao Q. Q., Liu J. Y., Wang J. B., Harris W., Chen Z. Q., et al. (2010). Assessment of effects of climate change and grazing activity ongrassland yield in the Three Rivers Headwaters Region of Qinghai-TibetPlateau, China. Environ. Monit. Assess. 170, 571–584. doi: 10.1007/s10661-009-1258-1
Gao J., Lv S., Zheng Z., Liu J. (2012). Typical ecotones in China. J. Resour. Ecol. 3, 297–307. doi: 10.5814/j.issn.1674-764x.2012.04.002
Guo B., Zang W., Luo W. (2020). Spatial-temporal shifts of ecological vulnerability of KarstMountain ecosystem-impacts of global change and anthropogenic interference. Sci.Total Environ. 741, 140256. doi: 10.1016/j.scitotenv.2020.140256
Hao L., Wang J., Shi P., Fan Y. (2003). Vulnerabiity assessment of regional snow disaster of animal husbandry: taking pasture of Inner Mongolia as an example. J. Nat. Disast. 12 (2), 51–57.
He D., Hou K., Li X. X., Wu S. Q., Ma L. X. (2023). A reliable ecological vulnerability approach based on the construction of optimal evaluation systems and evolutionary tracking models. J. Cleaner Production 418, 138246. doi: 10.1016/j.jclepro.2023.138246
He L., Shen J., Zhang Y. (2018). Ecological vulnerability assessment for ecologicalconservation and environmental management. J. Environ. Manage. 206, 1115–1125. doi: 10.1016/j.jenvman.2017.11.059
Hong W., Jiang R., Yang C., Zhang F., Su M., Liao Q. (2016). Establishing an ecological vulnerability assessment indicator system for spatial recognition and management of ecologically vulnerable areas in highly urbanized regions: A case study of Shenzhen, China. Ecol. Ind. 69, 540–547. doi: 10.1016/j.ecolind.2016.05.028
Hou K., Li X., Wang J., Zhang J. (2016). An analysis of the impact on land use and ecological vulnerability of the policy of returning farmland to forest in Yan’an, China. Environ. Sci. pollut. Res. 23, 4670–4680. doi: 10.1007/s11356-015-5679-9
Huang F., Liu X., Zhang Y. (2003). GIS-based eco-environmental vulnerability evaluation in west Jilin Province. Sci. Geogr. Sin. 23 (1), 95–100.
Huang A., Xu Y., Liu C., Lu L., Zhang Y., Sun P., et al. (2019). Simulated town expansion under ecological constraints: A case study of Zhangbei County, Heibei Province, China. Habitat Int. 91, 101986. doi: 10.1016/j.habitatint.2019.05.005
Jiang B., Chen W., Dai X., Min X., Liu L., Sakai T., et al. (2023). Change of the spatial and temporal pattern of ecological vulnerability: A case study on Cheng-Yu urban agglomeration, Southwest China. Ecol. Indic. 149, 110161. doi: 10.1016/j.ecolind.2023.110161
Jiang W. G., Lv J. X., Wang C. C., Chen Z., Liu Y. H. (2017). Marsh wetland degradation risk assessment and change analysis: a case study in the Zoige plateau, China. Ecol. Indic. 82, 316–326. doi: 10.1016/j.ecolind.2017.06.059
Kamran M., Yamamoto K. (2023). Evolution and use of remote sensing in ecological vulnerability assessment: a review. Ecol. Indica. 148, 110099. doi: 10.1016/j.ecolind.2023.110099
Kumar P., Rao B., Burman A., Kumar S., Samui P. (2023). Spatial variation of permeability and consolidation behaviors of soil using ordinary kriging method. Groundwater Sustain. Dev. 20, 100856. doi: 10.1016/j.gsd.2022.100856
Li A., Wang A., Liang S., Zhou W. (2006). Eco-environmental vulnerability evaluation in mountainous region using remote sensing and GIS – a case study in the upper reaches of Minjiang River. China. Ecol. Model. 192 (1–2), 175–187. doi: 10.1016/j.ecolmodel.2005.07.005
Li J. (2012). Study of society-ecology system vulnerability based on tourism, in caseof Sanjiangyuan. Underwater 2, 210–211.
Li P. X., Fan J. (2014). Regional ecological vulnerability assessment of the Guangxi Xijiang River Economic Belt in Southwest China with VSD Model. J. Resour. Ecol. 5, 163–170. doi: 10.5814/j.issn.1674-764X.2014.02.009
Li L., Shi Z. H., Yin W., Zhu D., Ng S. L., Cai C. F., et al. (2009). A fuzzy analytichierarchy process (FAHP) approach to eco-environmental vulnerabilityassessment for the Danjiangkou reservoir area, China. Ecol. Modell. 220, 3439–3447. doi: 10.1016/j.ecolmodel.2009.09.005
Li Y., Tian Y.-p., Li C.-k. (2011). Comparison study on ways of ecological vulnerability assessment - A case study in the Hengyang Basin. Proc. Environ. Sci. 10, 2067–2074. doi: 10.1016/j.proenv.2011.09.323
Liu D., Cao C., Dubovyk O., Tian R., Chen W., Zhuang Q., et al. (2017). Using fuzzy analytic hierarchy process for spatio-temporal analysis of eco-environmental vulnerability change during 1990–2010 in Sanjiangyuan region, China. Ecol. Indic. 73, 612–625. doi: 10.1016/j.ecolind.2016.08.031
Liu Y. S., Li Y. H. (2017). Revitalize the worlds countryside. Nature 548 (7667), 275–277. doi: 10.1038/548275a
Liu C., Wang Q., Mizuochi M., Wang K., Lin Y. M. (2008). Human behavioral impact on nitrogen flow—A case study of the rural areas of the middle and lower reaches of the Changjiang River, China. Agriculture Ecosyst. Environ. 125, 84–92. doi: 10.1016/j.agee.2007.12.001
Lu C. Y., Gu W., Dai A. H., Wei H. Y. (2012). Assessing habitat suitability based on geographic information system (GIS) and fuzzy: a case study of Schisandra sphenanthera Rehd. et Wils. in Qinling Mountains China. Ecol. Model. 242, 105–115. doi: 10.1016/j.ecolmodel.2012.06.002
Ma L., Hou K., Tang H., Liu J., Wu S., Li X., et al. (2023). A new perspective on the whole process of ecological vulnerability analysis based on the EFP framework. J. Cleaner Production 426, 139160. doi: 10.1016/j.jclepro.2023.139160
Martino F. D., Sessa S., Loia V. (2005). A fuzzy-based tool for modelization andanalysis of the vulnerability of aquifers: a case study. Int. J. Approximate Reasoning 38, 99–111. doi: 10.1016/j.ijar.2004.05.001
Metzger M. J., Leemans R., Schröter D. (2005). A multidisciplinary multi-scale framework for assessing vulnerabilities to global change. Int. J. Appl. Earth Obs. Geoinf. 7 (4), 253–267.
Ministry of Environmental Protection, PRC (2008). Outline of national ecological fragile area protection plan. Available online at: https://www.mee.gov.cn/gkml/hbb/bwj/200910/t20091022_174613.htm. (accessed May 11, 2022).
Niu W. Y. (1989). The discriminatory index with regard to the weakness, overlapness, andbreadth of ecotone. Acta Ecologica Sin. 9, 97–105.
Pan X., Sun Y., Wu J., Chen P. (2016). Study on the spatial-temporal characters of landscape pattern changes in coastal zone of Xiamen Bay. Ecol. Sci. 35, 117–123.
Park Y. S., Chon T. S., Kwak I. S., Lek S. (2004). Hierarchical community classification and assessment of aquatic ecosystems using artificial neural networks. Sci. Total Environ. 327 (1), 105–122.
Preston B. L., Yuen E. J., Westaway R. M. (2011). Putting vulnerability to climate change onthe map: a review of approaches, benefits, and risks. Sustain. Sci. 6, 177–202. doi: 10.1007/s11625-011-0129-1
Qian L. Y., Wang F. F., Cao W., Ding S., Cao W. (2023). Ecological health assessment and sustainability prediction in coastal area: A case study in Xiamen Bay, China. Ecol. Ind. 148, 110047. doi: 10.1016/j.ecolind.2023.110047
Rahman M. R., Shi Z. H., Cai C. F. (2009). Soil erosion hazard evaluation – an integrated use of remote sensing. GIS and statistical approaches with biophysical parameters towards management strategies. Ecol. Model. 220, 1724–1734. doi: 10.1016/j.ecolmodel.2009.04.004
Shen G., Yang X., Jin Y., Xu B., Zhou Q. (2019). Remote sensing and evaluation of the wetland ecological degradation process of the Zoige Plateau Wetland in China. Ecol. Ind. 104, 48–58. doi: 10.1016/j.ecolind.2019.04.063
Shukla R., Sachdeva K., Joshi P. K. (2018). Demystifying vulnerability assessment of agriculturecommunities in the Himalayas: a systematic review. Nat. Hazards 91, 409–429. doi: 10.1007/s11069-017-3120-z
Song G. B., Chen Y., Tian M. R., Lv D. H., Zhang S. S., Liu S. L. (2010). The ecological vulnerability evaluation in southwestern mountain region of China based on GIS and AHP method. Procedia Environ. Sci. 2, 465–475. doi: 10.1016/j.proenv.2010.10.051
Song G., Li Z., Yang Y., Semakula H. M., Zhang S. (2015). Assessment of ecological vulnerability and decision-making application for prioritizing road side ecological restoration: A method combining geographic information system, Delphi survey and Monte Carlo simulation. Ecol. Ind. 52, 57–65. doi: 10.1016/j.ecolind.2014.11.032
Sun P. L., Xu Y. Q., Yu Z. L., Liu Q., Xie B. P. (2016). Scenario simulation and landscape pattern dynamic changes of land use in the poverty belt around beijing and Tianjin: A case study of Zhangjiakou city, Hebei province. J. Geographical Sci. 3, 272–296. doi: 10.1007/s11442-016-1268-1
Swetnam R. D., Fisher B., Mbilinyi B. P., Munishi P. K. T., Willcock S., Ricketts T. (2011). Mapping socio-economic scenarios of land cover change: a GIS method to enable ecosystem service modelling. J. Environ. Manage. 93 (3), 563–574.
Tian Y., Chang H. (2012). Bibliometric analysis of research progress on ecologicalvulnerability in China (In Chinese). Acta Geographica Sin. 67, 1515–1525.
Wang J. T., Yun X. J., Su H. T., Qing Y., Dong Y. P., Zhang D. M. (2008). Technologies to monitor the rodent in the degraded grassland in Three-River Headwaters region. Pratacult. Sci. 8, 027.
Wang M., Cao W. Z., Guan Q. S., Wu G. J., Wang F. F. (2018). Assessing changes of mangrove forest in a coastal region of southeast China using multi-temporal satellite images. Estuar. Coast. Shelf S 207, 283–292. doi: 10.1016/j.ecss.2018.04.021
Wu X. L., Tang S. Y. (2022). Comprehensive evaluation of ecological vulnerability based on the AHP-CV method and SOM model: A case study of Badong County, China. Ecol. Ind. 137, 108758. doi: 10.1016/j.ecolind.2022.108758
Yang Z., Li B., Nan B., Dai X., Peng C., Bi X. (2023). A methodological framework for assessing pastoral socio-ecological systemvulnerability: A case study of Altay Prefecture in Central Asia. Sci.Total Environ. 862, 160828. doi: 10.1016/j.scitotenv.2022.160828
Ying X., Zeng G. M., Chen G. Q., Tang L., Wang K. L., Huang D. Y. (2007). CombiningAHP with GIS in synthetic evaluation of eco-environment qualitya case studyof Hunan Province, China. Ecol. Model. 209, 97–109. doi: 10.1016/j.ecolmodel.2007.06.007
Zhang F., Liu X., Zhang J., Wu R., Ma Q., Chen Y. (2017a). Ecological vulnerability assessment based on multi-sources data and SD model in Yinma River Basin, China. Ecol. Model. 349, 41–50. doi: 10.1016/j.ecolmodel.2017.01.016
Zhang X., Wang L., Fu X., Li H., Xu C. (2017b). Ecological vulnerability assessment based on PSSR in Yellow RiverDelta. J. Cleaner Production 167, 1106e1111. doi: 10.1016/j.jclepro.2017.04.106
Zhang D., Wang Y. Y., Yu W. W., Ma Z. Y., Chao B. X., Chen G. C., et al. (2020). Assessment of habit suitability and restoration potential of mangroves in Xiamen Bay, China. J. Appl. Oceanogr. 40, 43–55.
Zhao J. C., Ji G. X., Tian Y., Chen Y. L., Wang Z. (2018). Environmental vulnerability assessment for mainland China based on entropy method. Ecol. Indic. 91, 410–422. doi: 10.1016/j.ecolind.2018.04.016
Zou T., Chang Y., Chen P., Liu J. (2021). Spatial-temporal variations of ecological vulnerability in Jilin Province(China), 2000 to 2018. Ecol. Ind. 133, 108429. doi: 10.1016/j.ecolind.2021.108429
Keywords: ecologically vulnerable areas, indicator system, spatial-temporal variations, remote sensing, spatial analysis
Citation: Xu M, Cao C, Zhong S, Yang X, Bashir B, Wang K, Guo H, Gao X, Li J and Yang Y (2024) Ecological vulnerability assessment and spatial-temporal variations analysis in typical ecologically vulnerable areas of China. Front. Ecol. Evol. 12:1406444. doi: 10.3389/fevo.2024.1406444
Received: 28 March 2024; Accepted: 26 August 2024;
Published: 25 September 2024.
Edited by:
Ioannis Kokkoris, University of Patras, GreeceCopyright © 2024 Xu, Cao, Zhong, Yang, Bashir, Wang, Guo, Gao, Li and Yang. This is an open-access article distributed under the terms of the Creative Commons Attribution License (CC BY). The use, distribution or reproduction in other forums is permitted, provided the original author(s) and the copyright owner(s) are credited and that the original publication in this journal is cited, in accordance with accepted academic practice. No use, distribution or reproduction is permitted which does not comply with these terms.
*Correspondence: Chunxiang Cao, Y2FvY3hAYWlyY2FzLmFjLmNu
 Min Xu
 Chunxiang Cao
 Shaobo Zhong2
 Barjeece Bashir