 Zhenya Liu
 Yiqing Zhao1
95% of researchers rate our articles as excellent or good
Learn more about the work of our research integrity team to safeguard the quality of each article we publish.
Find out more
ORIGINAL RESEARCH article
Front. Ecol. Evol. , 04 June 2024
Sec. Ecophysiology
Volume 12 - 2024 | https://doi.org/10.3389/fevo.2024.1399584
The impact of climate warming on wetland ecosystems is a current focal point in ecological research. In this study, the Napahai wetland, a typical plateau wetland in northwest Yunnan Province, was selected as the study site to understand the growth and survival strategies of emergent plants in a plateau wetland under climate warming conditions. Open-top chambers (OTCs) were used to simulate warming in three treatments (i.e., control group, 2.0 ± 0.5°C, and 4.0 ± 0.5°C) in order to study the responses of the functional traits of the dominant emergent plant Schoenoplectus tabernaemontani to simulated warming. The results showed that simulated warming significantly reduced the photosynthetic carbon assimilation capacity and biomass accumulation of S. tabernaemontani, as well as its nitrogen content and vascular bundle density, while it significantly increased the vascular bundle size. The growing season accumulated temperature (AT) and the mean temperature of the hottest month (WT) were the main temperature factors influencing the functional traits of S. tabernaemontani. In summary, simulated warming significantly affected the functional traits of S. tabernaemontani, which demonstrated effective adaptation to warming conditions. As the temperature rises and the light and productivity decrease, S. tabernaemontani prioritizes the supply of limited resources to the underground part to ensure the biomass supply of the reproductive structure. This study provides a case for revealing the response patterns and ecological adaptation strategies of plateau wetland plants to climate warming.
Rising temperature is one of the primary features of climate change (Collins et al., 2013). According to the Fifth Assessment Report of the Intergovernmental Panel on Climate Change (IPCC), the global average temperature of the near-surface atmosphere will increase by 0.3–1.7°C (RPC2.6 scenario) or 2.6–4.8°C (RPC8.5 scenario) (IPCC, 2013). Climate warming significantly affects the structure and function of wetland ecosystems, with a particularly pronounced impact in high latitudes and altitudes (Lindborg et al., 2021). Studying the impact of climate warming on plateau wetland ecosystems has crucial practical significance (Erwin, 2009; Čížková et al., 2013; Gopal, 2013). The northwest region of Yunnan Province, China, is located on the southeastern edge of the Qinghai–Tibet Plateau, which has numerous plateau lakes (Gopal, 2013). Due to the unique ecological structure characterized by “lakeside–basin–mountainous” features, these lakes are classified into closed or semi-closed wetland types, rendering the ecosystem relatively fragile (Junk et al., 2013). With the gradual intensification of climate warming in the region, understanding how and to what extent the structure and function of wetland ecosystems respond to climate warming has become a key to understanding the region’s adaptation to climate change and strengthening wetland conservation and sustainable resource utilization.
The lakeside zone is a major component of the plateau wetland ecosystem in northwest Yunnan. Plants, as the core of its structure and functionality, are highly sensitive to climate variations (Walther et al., 2002; Erwin, 2009). Temperature is one of the primary factors determining plant physiological functions, adaptation strategies, and distribution ranges (Moles et al., 2014). Exploring the adaptive strategies of dominant plants in the lakeside zone to climate warming is crucial for effectively understanding the dynamics of the plateau wetland and for scientifically addressing climate change. Due to the conceptual magnitude of adaptation strategies (such as the tolerance or the degree of temperature adaptation) being difficult to effectively measure and compare, studies on plant adaptability have emphasized the quantitative measurement of plant functional trait sets (Kessler et al., 2007; Soudzilovskaia et al., 2013). One important aspect involves understanding the trends and the extent of change, as well as the quantitative relationship between different traits and temperature, elucidating the reasons for the different traits coordinately adapting to temperature changes (Soudzilovskaia et al., 2013). In response to temperature changes, plants exhibit varying degrees of adaptation in their morphological structure and physiological and other functional traits (Soudzilovskaia et al., 2013; Moles et al., 2014; Esperon-Rodriguez et al., 2020; Li et al., 2023). Within the optimal temperature range for plants, the photosynthetic rates of most plants increase with rising temperatures. However, with further increases beyond the plant’s optimal temperature, the photosynthetic rates decrease (Kouki et al., 2006; Bagley et al., 2015). On a global scale, the annual average temperature is significantly negatively correlated with the nitrogen and phosphorus contents of plants (Wright et al., 2004). A study on 10 plant species at eight locations in the southern Mediterranean found a significant negative correlation between the annual average minimum temperature and the leaf biomass accumulation (Roche et al., 2004). The significant correlation between plant functional traits and temperature reflects the response strategies of plants to temperature changes (Ahrens et al., 2020; Anderson and Song, 2020). However, these correlations are currently less studied in wetland plants, and the main temperature factors that specifically affect the plant functional traits and adaptability are also unclear.
In this study, the Napahai wetland, a typical plateau wetland in northwest Yunnan Province, China, was selected as the study site. Schoenoplectus tabernaemontani, the dominant emergent plant in the lakeside zone of Napahai, was chosen as the study subject. An open-top artificial warming system was constructed and the photosynthetic physiological parameters, biomass, the elemental contents, and the material transport structural characteristics of the plant were measured to explore the response of plant functional traits to warming and to identify the primary temperature factors affecting these traits in order to clarify the adaptation mechanism and the response strategies of wetland dominant plants to cope with global warming in the future.
The Napahai wetland is located at Shangri-La in the middle of the Hengduan Mountains on the southeastern part of the Qinghai–Tibet Plateau (27°49′–27°55′ N, 99°37′–99°43′ E), with an altitude of 3,260 m and an area of 3,100 km2. The wetland was developed on limestone substrates, with sinkholes formed by erosion at the bottom of the basin. The water flows underground for 10 km before joining the Jinsha River. It represents a unique type of plateau wetland at low latitude and high altitude in China, which is characterized by features of “basin–lakeside–facing mountain” displaying both closed and semi-closed characteristics.
Napahai Lake is located in the plateau temperate zone of the northern temperate climate in China, which is characterized by a cold and temperate humid climate. The annual mean temperature of this region is 5.4°C, with mean temperatures of 13.2°C in the hottest month (July) and −3.7°C in the coldest month (January) and a mean cumulative temperature above 10°C. The annual average precipitation in this region is 619.9 mm. Due to the influence of the Indian Ocean monsoon, the Napahai Lake region is divided into a typical dry season (from November to May) and a wet season (from June to October). During the wet season, precipitation is significantly higher, accounting for over 80% of the total annual precipitation, and the wetland is dominated by lake or swamp landscapes. In contrast, the dry season has less precipitation, constituting less than 20% of the total annual precipitation, leading to a pronounced aridity, and the wetland is characterized by meadow landscapes. In addition, the solar radiation in Napahai Lake is strong, with an annual average sunshine duration of 2,180.3 h.
The Napahai Lake wetland is an intersection zone for a diverse distribution of numerous plant species. All of the plant species in the area are herbaceous, showcasing a rich variety of plant types, with emergent and submerged plants being predominant. The lakeside zone is dominated by emergent plants, and the key species include S. tabernaemontani, Polygonum hydropiper, Polygonum amphibium, Eleocharis liouana, Zizania latifolia, and Sparganium stoloniferum.
In April 2014, nine in situ research units were established in the Napahai wetland (Figure 1). Each unit is a circular pool with a diameter of 2.4 m. The units were spaced 3 m apart and were interconnected through PVC pipes to maintain consistent flooding conditions. Based on the IPCC’s fifth prediction results, the research units were divided into three groups, with three replications in each group. One group served as the control (CK), while the other two groups were subjected to experimental warming using open-top chambers (OTCs). The OTCs, with a bottom diameter of 2.4 m and a height of 2.4 m, were made with sunlight panels. The sizes of the open tops were designed to achieve atmospheric warming within the research units, with temperature increases of 2.0 ± 0.5°C (ET-2, experimental warming of 2°C) and 4.0 ± 0.5°C (ET-4, experimental warming of 4°C).
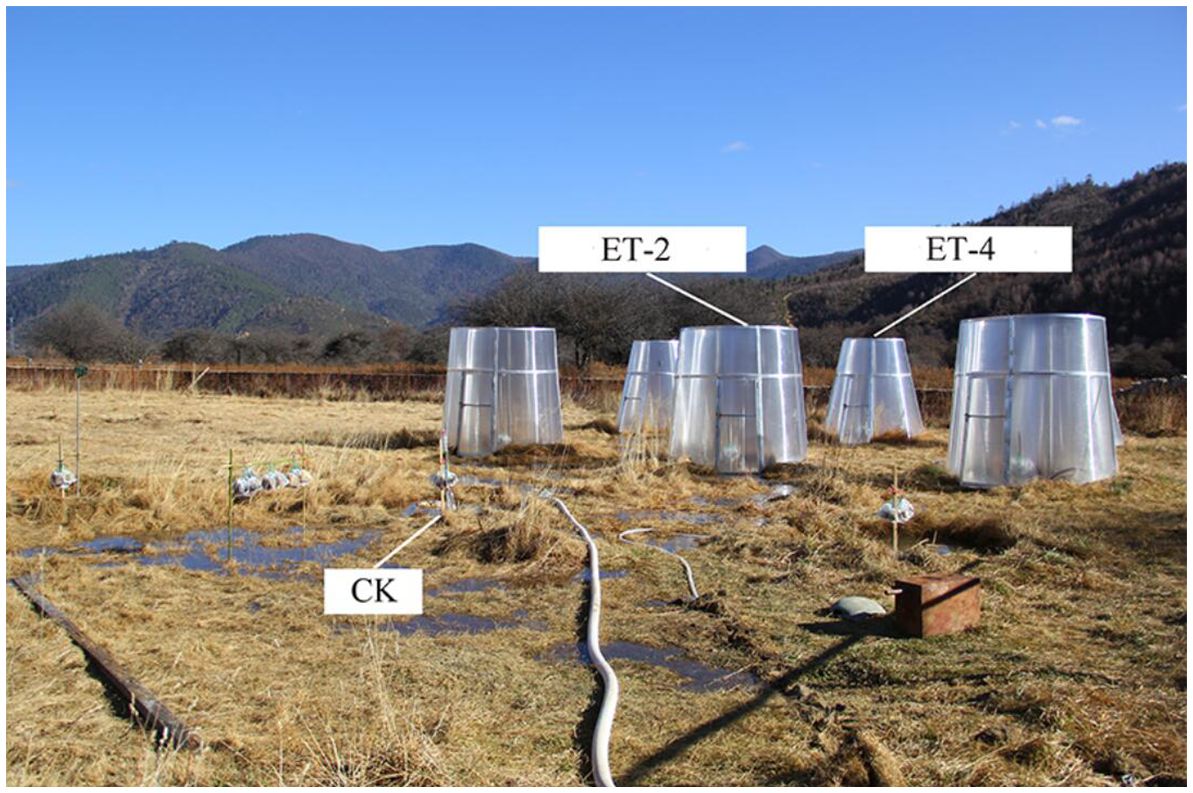
Figure 1 Open-top chambers (OTCs) in the Napahai wetland.
The temperature loggers (TP-2200 Humidity and Temperature Loggers) were fixed at a distance of 1 m above the water surface in each research unit, which were monitored in three groups, i.e., CK, ET-2, and ET-4, in real time. The loggers automatically recorded the temperature throughout the day, with one recording per hour. The temperature data were exported and processed at the end of the experiment. Based on the temperature data recorded by the system, various temperature parameters for each treatment group were calculated, including the mean annual temperature (mean), the maximum temperature (max), the minimum temperature (min), the growing season accumulated temperature (season), and the daytime (diurnal) and nighttime (nocturnal) accumulated temperatures. The study period spanned from April 2017 to September 2018. Compared with that of the CK group, the temperatures in the ET-2 and ET-4 treatments increased by an average of 2.18°C and 3.62°C, respectively, which was in line with the expectations of the experimental design.
S. tabernaemontani is a common lakeside plant in plateau wetlands and is widely distributed. Based on field inspections and preliminary studies, it was found that the dominance of S. tabernaemontani in lakeside zones at different altitudes varies and that it is extremely sensitive to changes in environmental factors. The functional traits of S. tabernaemontani have strong environmental plasticity. Therefore, it is an ideal material for the study of the response of functional traits to changes in environmental factors and can better explain the adaptability of the functional traits of wetland plants to greenhouse effects, as well as the correlations among functional traits.
In April 2017, a sufficient number of plant clones were excavated under natural conditions in the Napahai Lake wetland. Plants with similar growth patterns were selected for the experiment. These plants were transplanted into plastic pots with a diameter of 35 cm and height of 40 cm and were cultivated with in situ soil (height, 30 cm). The pots were assigned into the different research units, with five pots per research unit and a total of 15 pots under each temperature treatment. The water depth in each research unit was set to mimic a natural water-flooded environment (20–30 cm). After potting, enhanced management of the transplanted plants was implemented to ensure their survival.
In July and August 2018, the plant photosynthetic parameters were measured in situ under field conditions. Three vigorously growing plants were selected from each research unit as the measurement subjects. A portable photosynthesis measurement system (LI-6400; LI-COR Bioscience Inc., Lincoln, NE, USA) was used to determine the net photosynthetic rate of the plants. During the measurements, a stable photosynthetic photon flux density (PPFD) was obtained using the system’s built-in red–blue light source. All measurements were taken between 8:00 and 12:00 a.m. as plants are more likely to reach their peak photosynthetic rate during this time. Due to the narrow leaves of S. tabernaemontani, which could not cover the entire leaf chamber of the photosynthesis instrument, two adjacent leaves with similar growth were selected and placed side by side in the leaf chamber for measurement. The mature part about 25 cm away from the top of each leaf was measured.
Before measurements, the leaves were exposed to 1,200 μmol m−2 s−1 PPFD to maximize the stomatal opening for photosynthesis. Once a stable net photosynthetic rate is achieved, the PPFD was increased to 1,500 μmol m−2 s−1. After stabilizing for 3–5 min, the net photosynthetic rate (Pn, in micromoles per square meter per second), the stomatal conductance (Gs, in millimoles per square meter per second), and the transpiration rate (Tr, in millimoles per square meter per second) were determined. During measurement of the plant photosynthetic parameters, the temperature, the atmospheric pressure difference, and the CO2 concentration in the leaf chamber were maintained consistent with external conditions.
After measurement of the plant photosynthetic parameters, the entire plant was excavated and promptly brought back to the laboratory for biomass determination. The aboveground and belowground parts of the plant were separated in the laboratory, The belowground part was divided into rhizomes, adventitious roots, and subterranean buds. Each part was washed to remove dust and debris, followed by drying in a 75°C oven for 48 h until a constant weight was achieved. The weights (in grams) of the aboveground biomass (Bioabove), rhizome biomass (Biostem), adventitious root biomass (Bioroot), and subterranean bud biomass (Biobud) were calculated.
The Belowground biomass (Biodown) is the sum of rhizome biomass (Biostem), adventitious root biomass (Bioroot), and subterranean bud biomass (Biobud) (Equation 1). Bioa/d is the ratio of aboveground biomass (Bioabove) and Belowground biomass (Biodown) (Equation 2). The biomass (Bio) is the sum of aboveground biomass (Bioabove) and Belowground biomass(Biodown) (Equation 3).
After drying, each part of the plant tissue was pulverized into powder. For powder pretreatment, the sulfuric acid–peroxide digestion method was used. The carbon (C), nitrogen (N), and phosphorus (P) contents (in grams per kilogram) of each tissue were determined with the vario total organic carbon (TOC) analyzer and the AA3 continuous flow analyzer.
From each research unit, three segments of leaves and stems were taken and brought back to the laboratory in moist conditions. The small segments were hand-cut into cross-sections using a double-sided blade and then water-mounted slices were made. The mature vascular structures of the leaves and stems were observed and photographed under a microscope. Four independent vascular bundle (×400) images were taken for each small segment of leaf and stem, totaling 36 images for each treatment. In addition, four images of the vascular bundles were taken with a lower magnification (×50). Image analysis was conducted using ImageJ software (v.1.48; http://rsbweb.nih.gov/ij/). The vascular bundle ×400 images were used to measure the leaf conduit length (LCL, in micrometers), width (LCW, in micrometers), and area (LCA, in square micrometers); the leaf sieve tube area (LSA, in square micrometers); the leaf vascular bundle length (LBL, in micrometers) and width (LBW, in micrometers); the stem conduit length (SCL, in micrometers), width (SCW, in micrometers), and area (SCA, in square micrometers); the stem sieve tube area (SSA, in square micrometers); and the stem vascular bundle length (SBL, in micrometers) and width (SBW, in micrometers).
On the other hand, the vascular bundle ×50 images were used to determine the number of vascular bundles in the field of view, the leaf vascular bundle density (LBD, number per square millimeter) and the stem vascular bundle density (SBD, number per square millimeter), which were calculated as the number of vascular bundles per unit area.
The data were analyzed using the “vegan” package in the R statistical analysis software (v.3.01; http://ftp.ctex.org/mirrors/CRAN/) and the Canoco data analysis software (v.5.0; canoco5.com). One-way ANOVA with least significant difference (LSD) post-hoc test was employed for the differential tests on plant functional traits under three temperature treatments, examining the variations of these plant functional traits with temperature increase. Principal component analysis (PCA) was conducted to identify the plant functional traits that contributed the most to the overall variance. Redundancy analysis (RDA) was employed to determine the main temperature factors affecting plant functional traits and to explore the relationship between these plant functional traits and temperature factors. Pearson’s correlation analysis was performed to further determine the bivariate relationship trends between the plant functional traits and temperature factors. The statistical significance level for all analyses was p< 0.05. All figures were drawn using the SigmaPlot (v.10.0; http://www.systatsoftware.cn/) plotting software.
Compared with the CK group, warming significantly reduced the net photosynthetic rate, stomatal conductance, and transpiration rate of S. tabernaemontani. There were significant differences in the net photosynthetic rate in the three groups, which gradually decreased as the temperature increased. However, the stomatal conductance and the transpiration rate showed no significant differences between the CK and ET-2 groups, but were significantly decreased in the ET-4 treatment (Figures 2A-C). Corresponding to the photosynthetic parameters, warming overall reduced the biomass, but the extent of reduction varied between the aboveground and belowground parts (Figures 2D-I). Compared with the CK group, the aboveground biomass (Bioabove) and the total biomass (Biomass) of S. tabernaemontani were significantly decreased in warming. However, there were no significant differences between the ET-2 and ET-4 treatments for both Bioabove and Biomass (Figures 2D, E). The trend of the belowground stem biomass (Biostem) was consistent with that of Bioabove and Biomass. However, there were no significant differences in the belowground root biomass (Bioroot), the belowground bud biomass (Biobud), and the total belowground biomass (Biodown) between the three treatments (Figures 2E, G-I). In contrast to the trend of Bioabove and Biomass, the aboveground-to-belowground biomass ratio (Bioa/d) was significantly increased with warming (Figure 2F).
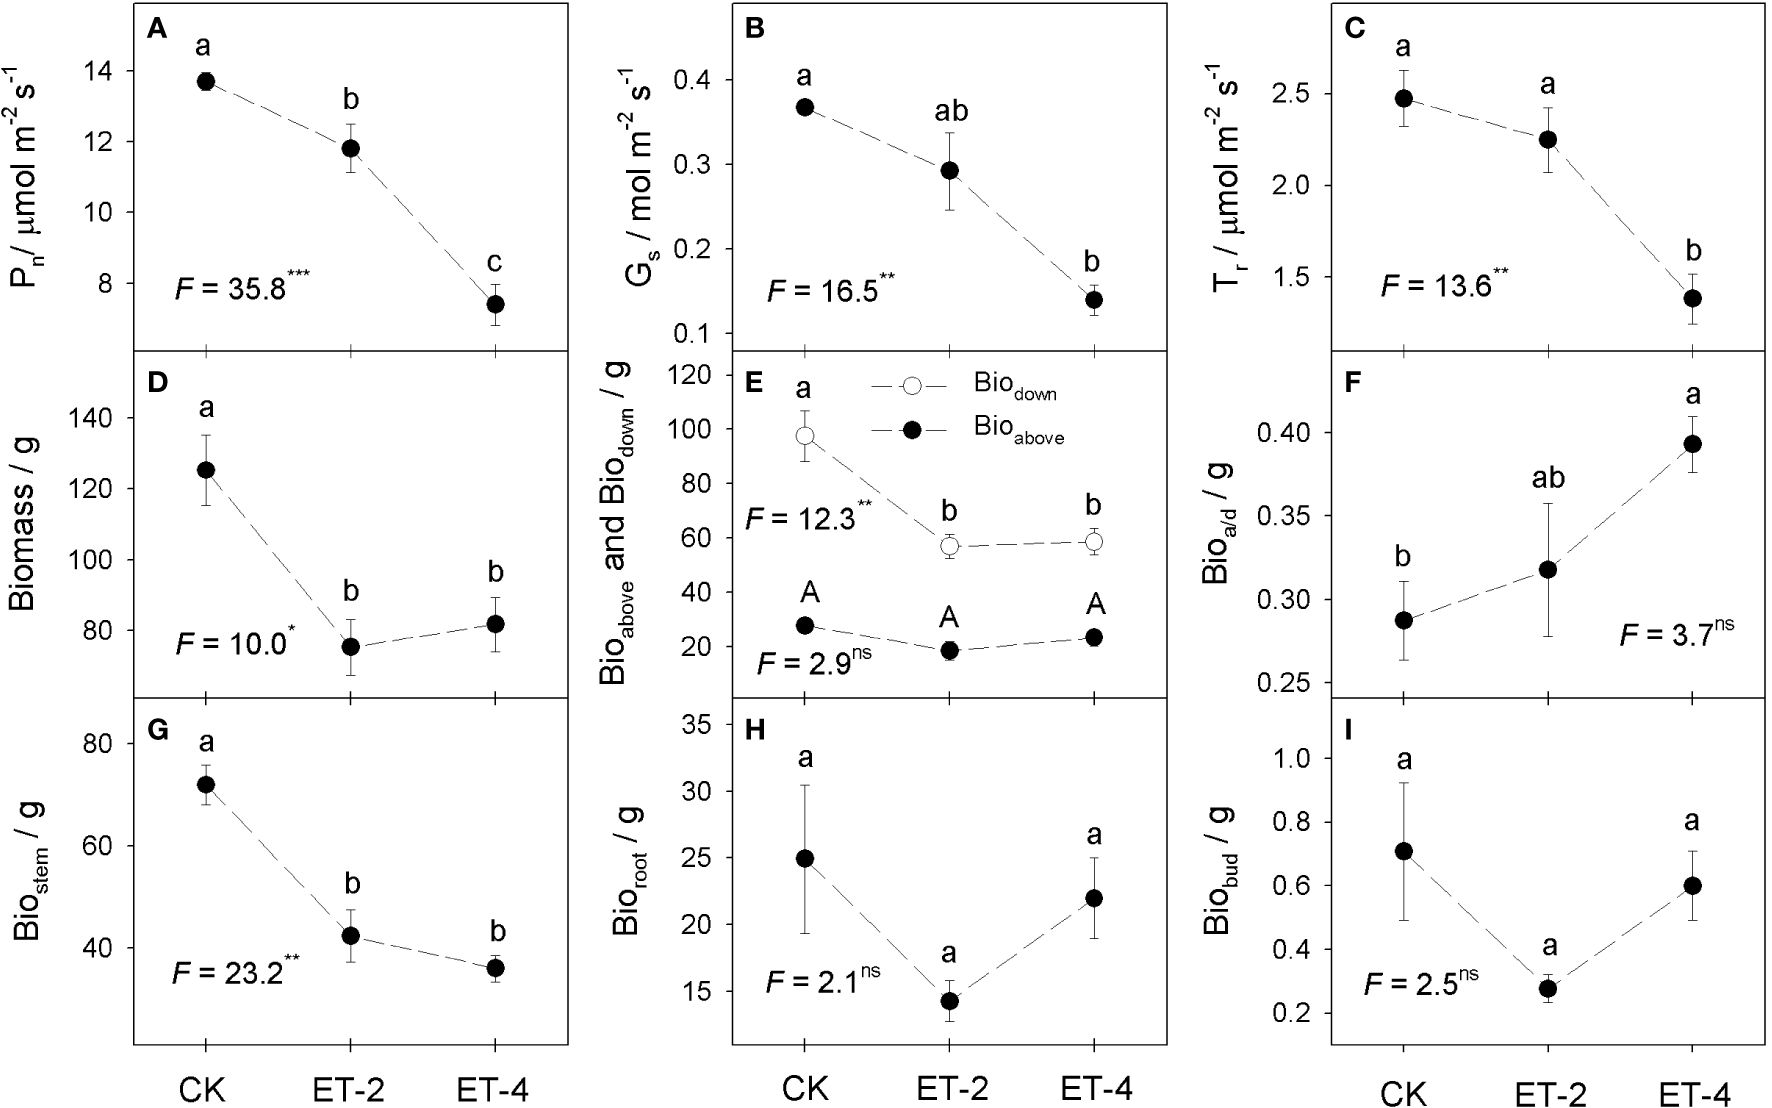
Figure 2 Differences in the plant photosynthetic parameters and biomass (average ± SE) among the different temperature treatments.CK, the control; ET-2, experimental warming of 2°C; ET-4, experimental warming of 4°C; Pn, net photosynthetic rate (A); Gs, stomatal conductance (B); Tr, transpiration rate (C); Biomass, total biomass (D); Bioabove, aboveground biomass (E); Biodown, belowground biomass (E); Bioa/d, the ratio of aboveground biomass and belowground biomass (F); Biostem, belowground stem biomass (G); Bioroot, belowground root biomass (H); Biobud, belowground bud biomass (I). For each trait, no significantly different (p > 0.05) was marked with the same superscript letter, while different letters indicate the traits was significantly different (p< 0.05).
Compared with the CK group, the nitrogen contents of the aboveground part, belowground stem, and belowground bud of S. tabernaemontani (Nabove, Nstem, and Nbud, respectively) all significantly decreased with warming, but no significant differences were observed between treatments ET-2 and ET-4. In contrast, the carbon content in belowground buds (Cbud) was significantly increased with warming. For the other elemental contents, particularly the phosphorus content in all tissues, no significant differences between the CK, ET-2, and ET-4 groups were observed (Figure 3).
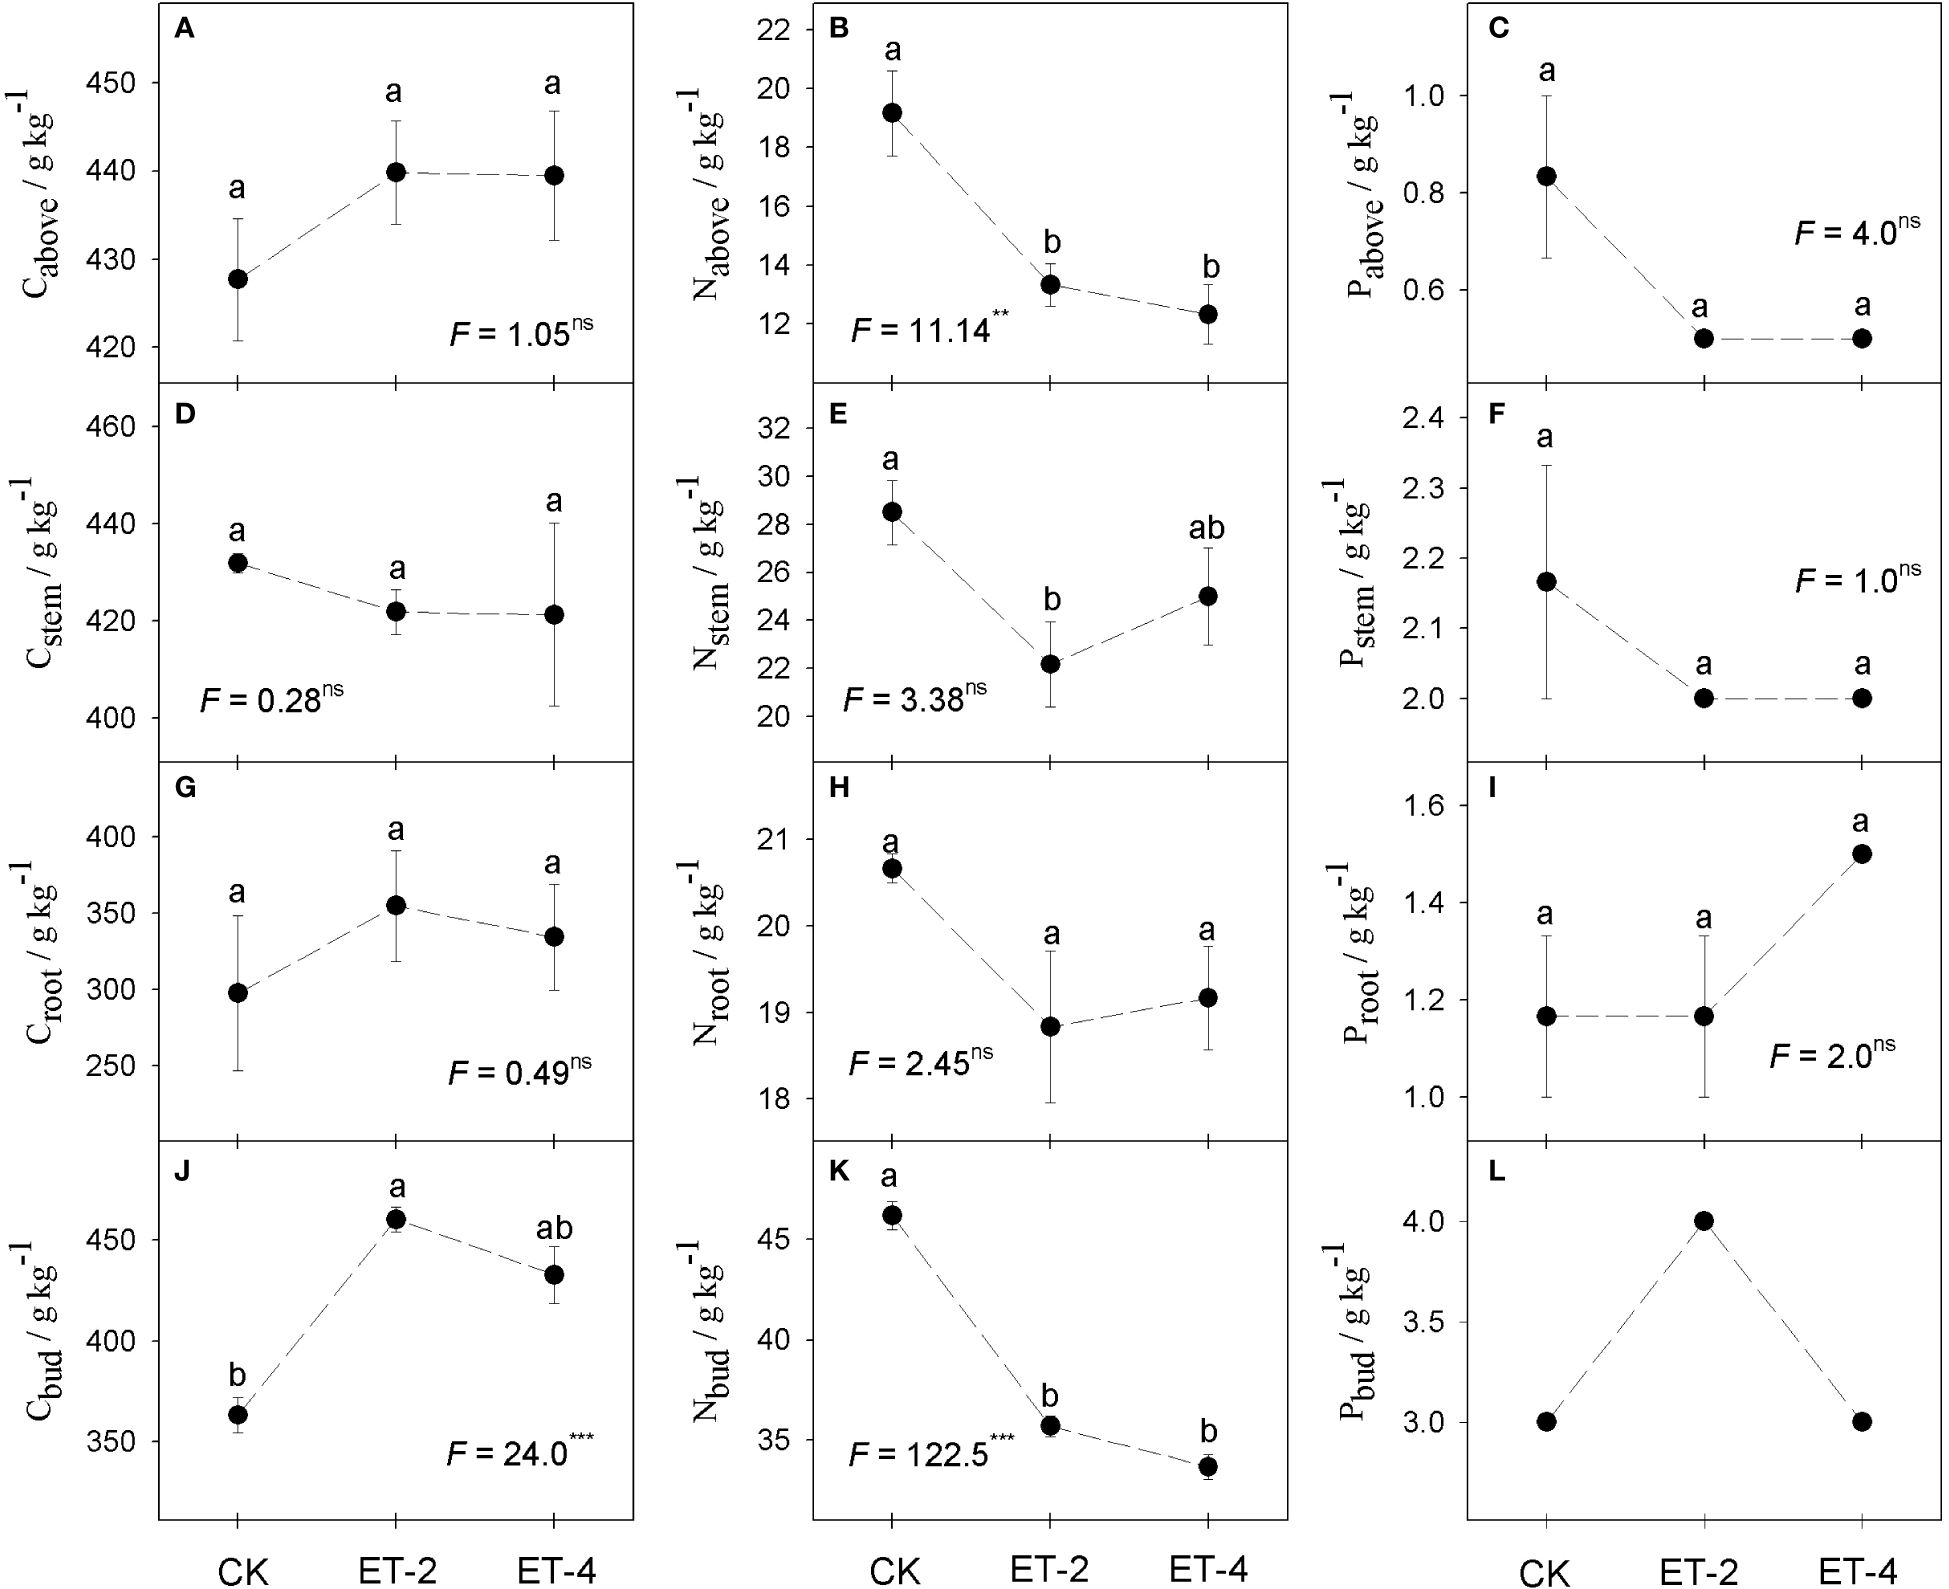
Figure 3 Differences in the carbon (C), nitrogen (N), and phosphorus (P) contents of plant parts among the different temperature treatments.CK, the control; ET-2, experimental warming of 2°C; ET-4, experimental warming of 4°C; Cabove, aboveground carbon content (A); Nabove, aboveground nitrogen content (B); Pabove, aboveground phosphorus content (C); Cstem, carbon content of aboveground stem (D); Nstem, nitrogen content of belowground stem (E); Pstem, phosphorus content of belowground stem (F); Croot, carbon content of belowground root (G); Nroot, nitrogen content of belowground root (H); Proot, phosphorus content of belowground root (I); Cbud, carbon content of belowground bud (J); Nbud,nitrogen content of belowground bud (K); Pbud, phosphorus content of belowground bud (L). For each trait, no significantly different (p > 0.05) was marked with the same superscript letter, while different letters indicate the traits was significantly different (p< 0.05).
Warming increased the size of the vascular bundle structures and decreased the density of the vascular bundle of S. tabernaemontani. Compared with the CK group, the sizes of the vascular bundle structures, including the cross-sectional lengths (LCL and SCL), widths (LCW and SCW), and areas (LCA and SCA) of the conduits; the cross-sectional areas of sieve tubes (LSA and SSA); and the cross-sectional lengths (LBL and SBL) and widths (LBW and SBW) of the vascular bundles in the leaves and stems, were generally larger in the warming treatment (Figure 4). Compared with that of the leaves, the vascular bundle structure size of the stems was more sensitive to temperature changes. All sizes of the stem vascular bundle structures showed significant differences between the CK and the warming treatments; for the leaves, only the LCL, LCA, and LSA responded significantly to warming (Figure 4). Specifically, the SCL, SCW, and SCA showed significant differences among the CK, ET-2, and ET-4 groups (Figures 4A-C). Compared with those of the CK group, the SSA, SBL, and SBW in the ET4 treatment were significantly higher (Figures 4D-F). The LCL, LCA, and LSA were significantly higher in the warming treatment (Figures 4A, C, D). In contrast to the vascular bundle structure size, the vascular bundle density in both leaves and stems of S. tabernaemontani was significantly reduced by warming (Figure 4G).
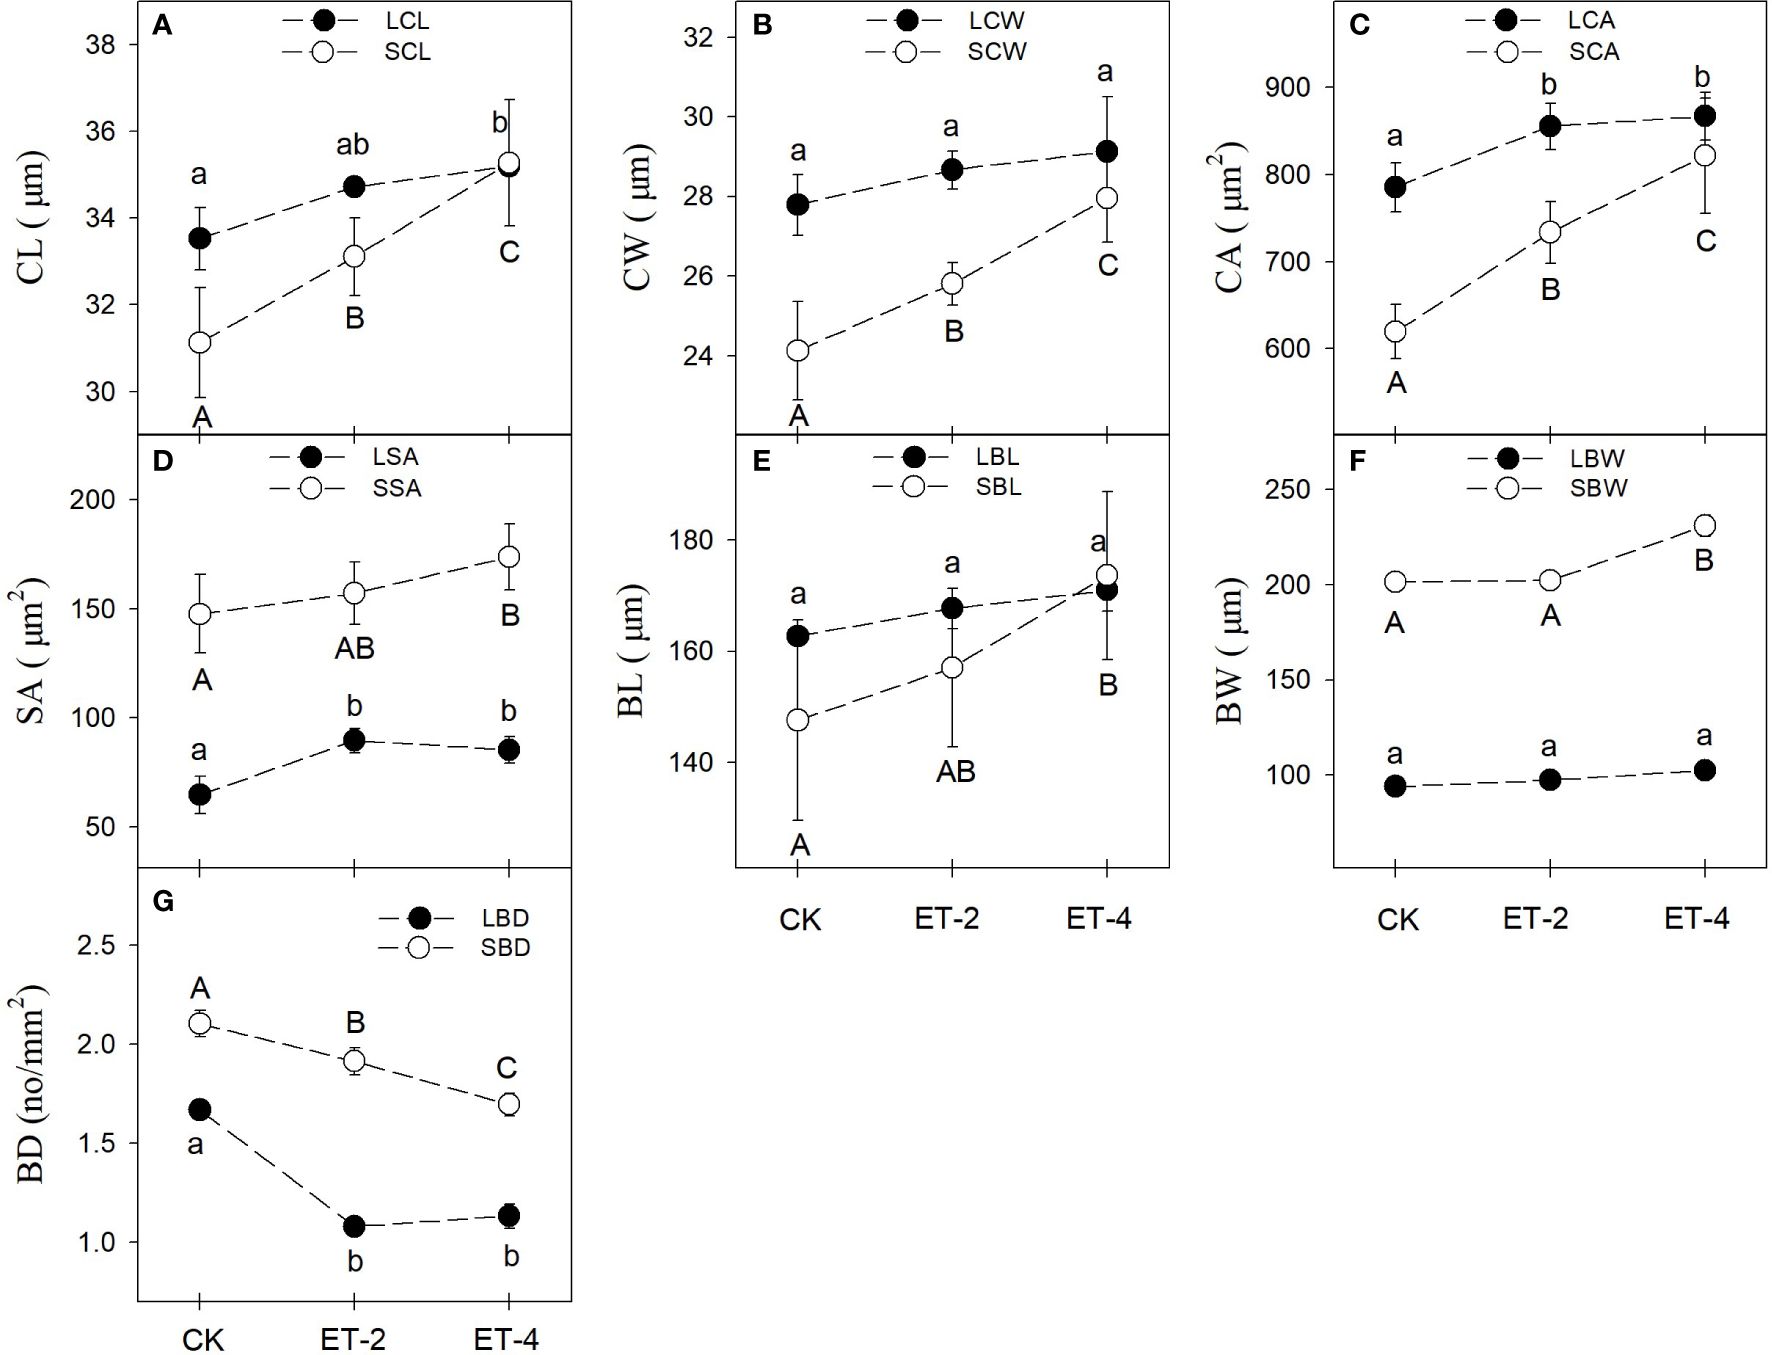
Figure 4 Differences in the plant conduit, sieve tube, vascular bundle traits (average ± SD) among the different temperature treatments.CK, the control; ET-2, experimental warming of 2°C; ET-4, experimental warming of 4°C; CL, length of conduit (A); CW, width of conduit (B); CA, area of conduit (C); SA, area of sieve tube (D); BL, length of vascular bundle (E); BW, width of stem vascular bundle (F); BD, density of vascular bundle (G). LCL, length of leaf conduit (A); SCL, length of stem conduit (A); LCW, width of leaf conduit (B); SCW, width of stem conduit (B); LCA, area of leaf conduit (C); SCA, area of stem conduit (C); LSA, area of leaf sieve tube (D); SSA, area of stem sieve tube (D); LBL, length of leaf vascular bundle (E); SBL, length of stem vascular bundle (E); LBW, width of leaf vascular bundle (F); SBW, width of stem vascular bundle (F); LBD, leaf vascular bundle density (G); SBD, stem vascular bundle density (G). For each trait, no significantly different (p > 0.05) was marked with the same superscript letter, while different letters indicate the traits was significantly different (p< 0.05).
The first and second principal axes of the functional traits of S. tabernaemontani explained 42.02% and 20.46% of the total variance (Table 1). The traits that significantly correlated with the first principal axis were: net photosynthetic rate, stomatal conductance, transpiration rate, total biomass, belowground biomass, belowground rhizome biomass, aboveground-to-belowground biomass ratio, aboveground nitrogen content, aboveground phosphorus content, belowground bud carbon and nitrogen contents, leaf vascular bundle length, width and density, stem conduit length, width and area, and stem vascular bundle density. The traits that were significantly correlated with the second principal axis were: aboveground biomass, root biomass, and leaf conduit width (Table 1). These traits were the main characteristic parameters that regulate the function of S. tabernaemontani to adapt to warming.
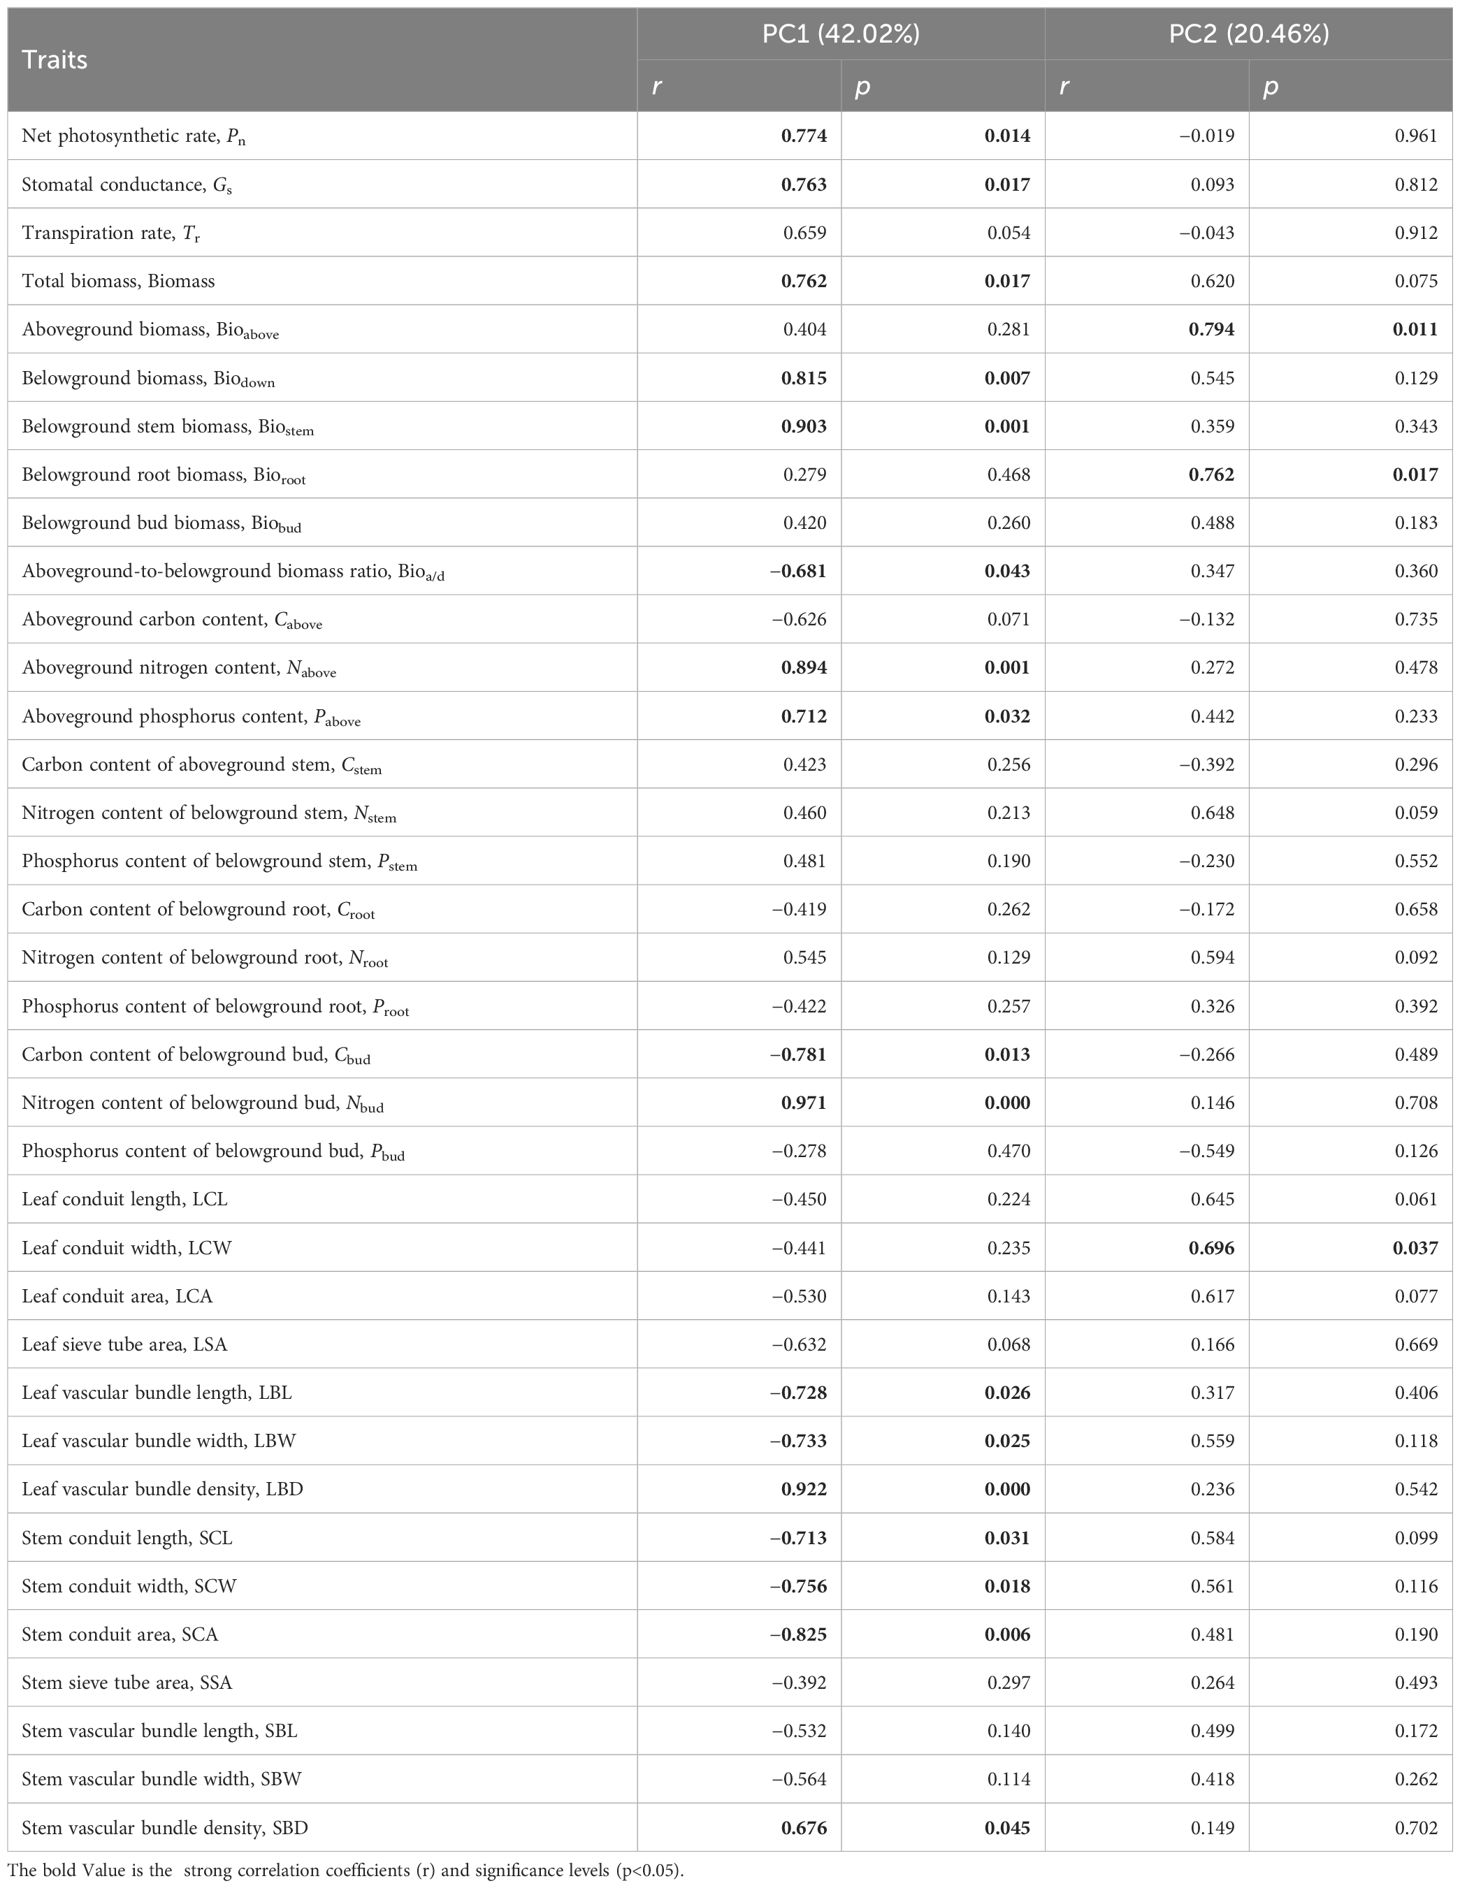
Table 1 Correlations of the functional traits of Schoenoplectus tabernaemontani with the first two axes of the principal component analysis (PCA).
There are certain correlations among the functional traits of S. tabernaemontani in response to warming (Table 2). Specifically, the net photosynthetic rate was significantly positively correlated with the stomatal conductance, the transpiration rate, the belowground rhizome biomass, the belowground bud nitrogen content, and the stem vascular bundle density. Stomatal conductance showed significant positive correlations with the belowground biomass and rhizome biomass, the aboveground nitrogen content, the belowground bud nitrogen content, and the stem vascular bundle density. The transpiration rate was also significantly positively correlated with the belowground bud nitrogen content, but was significantly negatively correlated with the aboveground-to-belowground biomass ratio. There was an overall positive correlation between the biomass, nitrogen and phosphorus contents, and the vascular bundle density, but a negative correlation between these parameters and the carbon content and vascular bundle structure size.
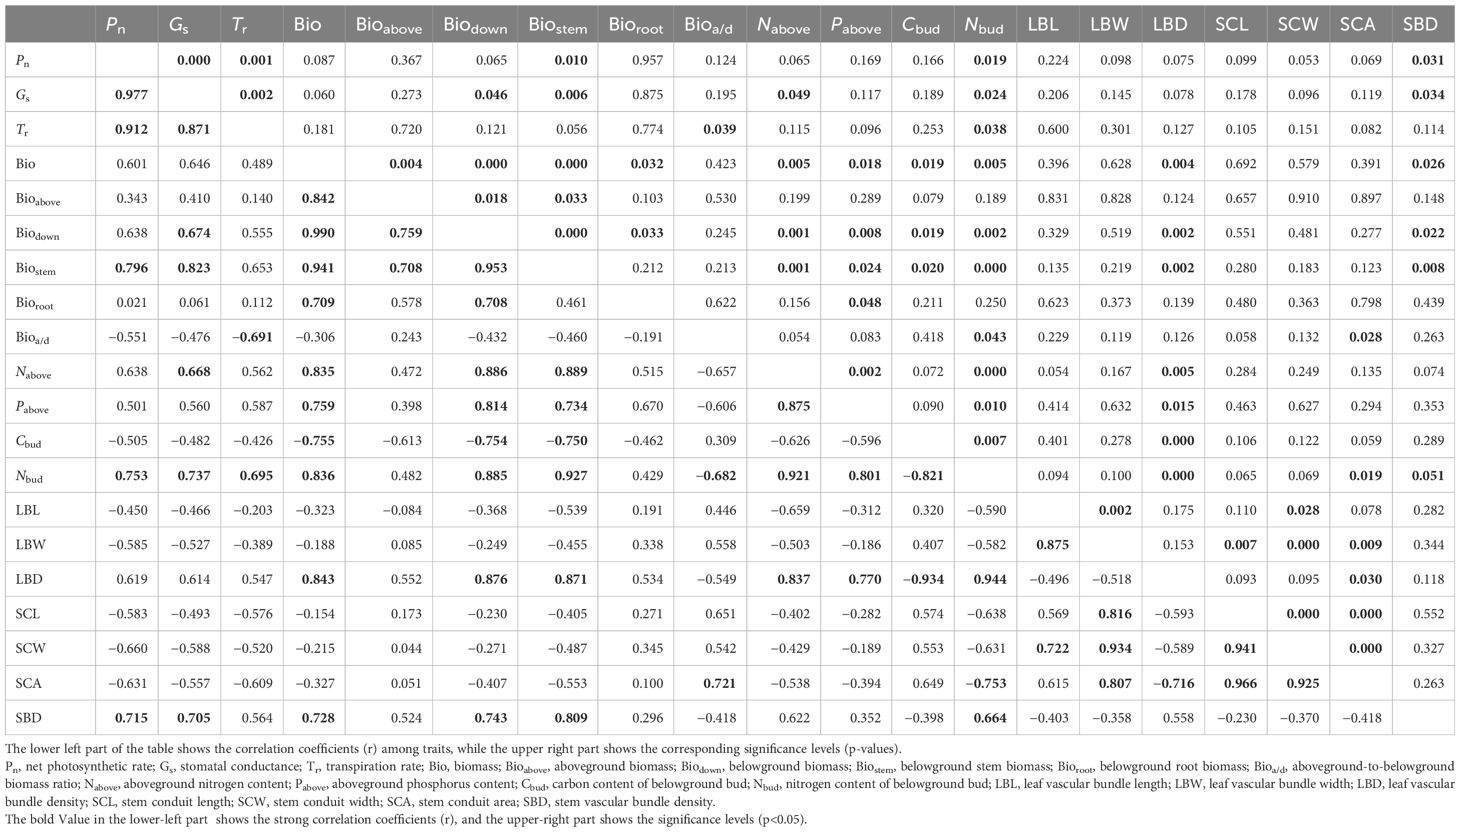
Table 2 Pearson’s bivariate correlations among functional traits by principal component analysis (PCA).
The RDA based on the functional traits and temperature factors showed that the first and second principal axes explained 60.78% and 5.46%, respectively, of the total variance (Figure 5). The growing season accumulated temperature (AT) and the mean temperature of the hottest month (WT) were identified as the main temperature factors influencing the functional traits of S. tabernaemontani, which explained 60.7% (F = 10.8, p< 0.01) and 5.6% (F = 1.0, p = 0.39), respectively. These two temperature factors showed significant negative correlations with the photosynthetic parameters, various biomass components, the aboveground nitrogen and phosphorus contents, the belowground bud nitrogen content, and the stem and leaf vascular bundle density. In addition, they exhibited significant positive correlations with the aboveground-to-belowground biomass ratio, the belowground bud carbon content, the stem vascular bundle width, and the stem conduit size (Table 3).
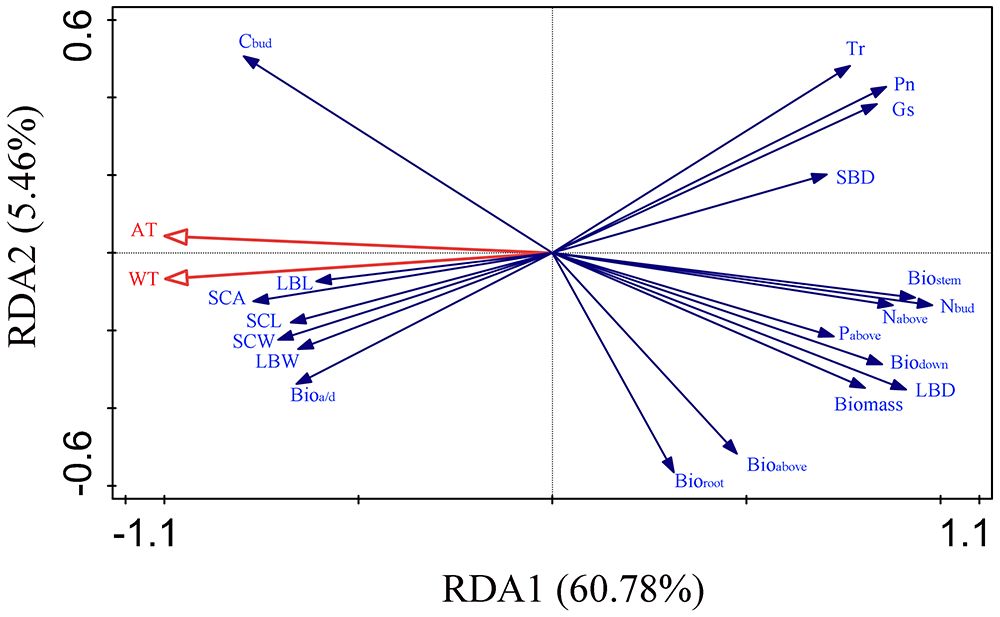
Figure 5 Redundancy analysis (RDA) of the functional traits and temperature factors. AT, growing season accumulated temperature; WT, mean temperature of the hottest month; Pn, net photosynthetic rate; Gs, stomatal conductance; Tr, transpiration rate; Bio, total biomass; Bioabove, aboveground biomass; Biodown, belowground biomass; Biostem, belowground stem biomass; Bioroot, belowground root biomass; Bioa/d, aboveground-to-belowground biomass ratio; Nabove, aboveground nitrogen content; Nbud, nitrogen content of belowground bud; Pabove, aboveground phosphorus content; Cbud, carbon content of belowground bud; LBL, length of leaf vascular bundle; LBW, width of leaf vascular bundle; LBD, leaf vascular bundle density; SCL, length of stem conduit; SCW, width of stem conduit; SCA, area of stem conduit; SBD, stem vascular bundle density.
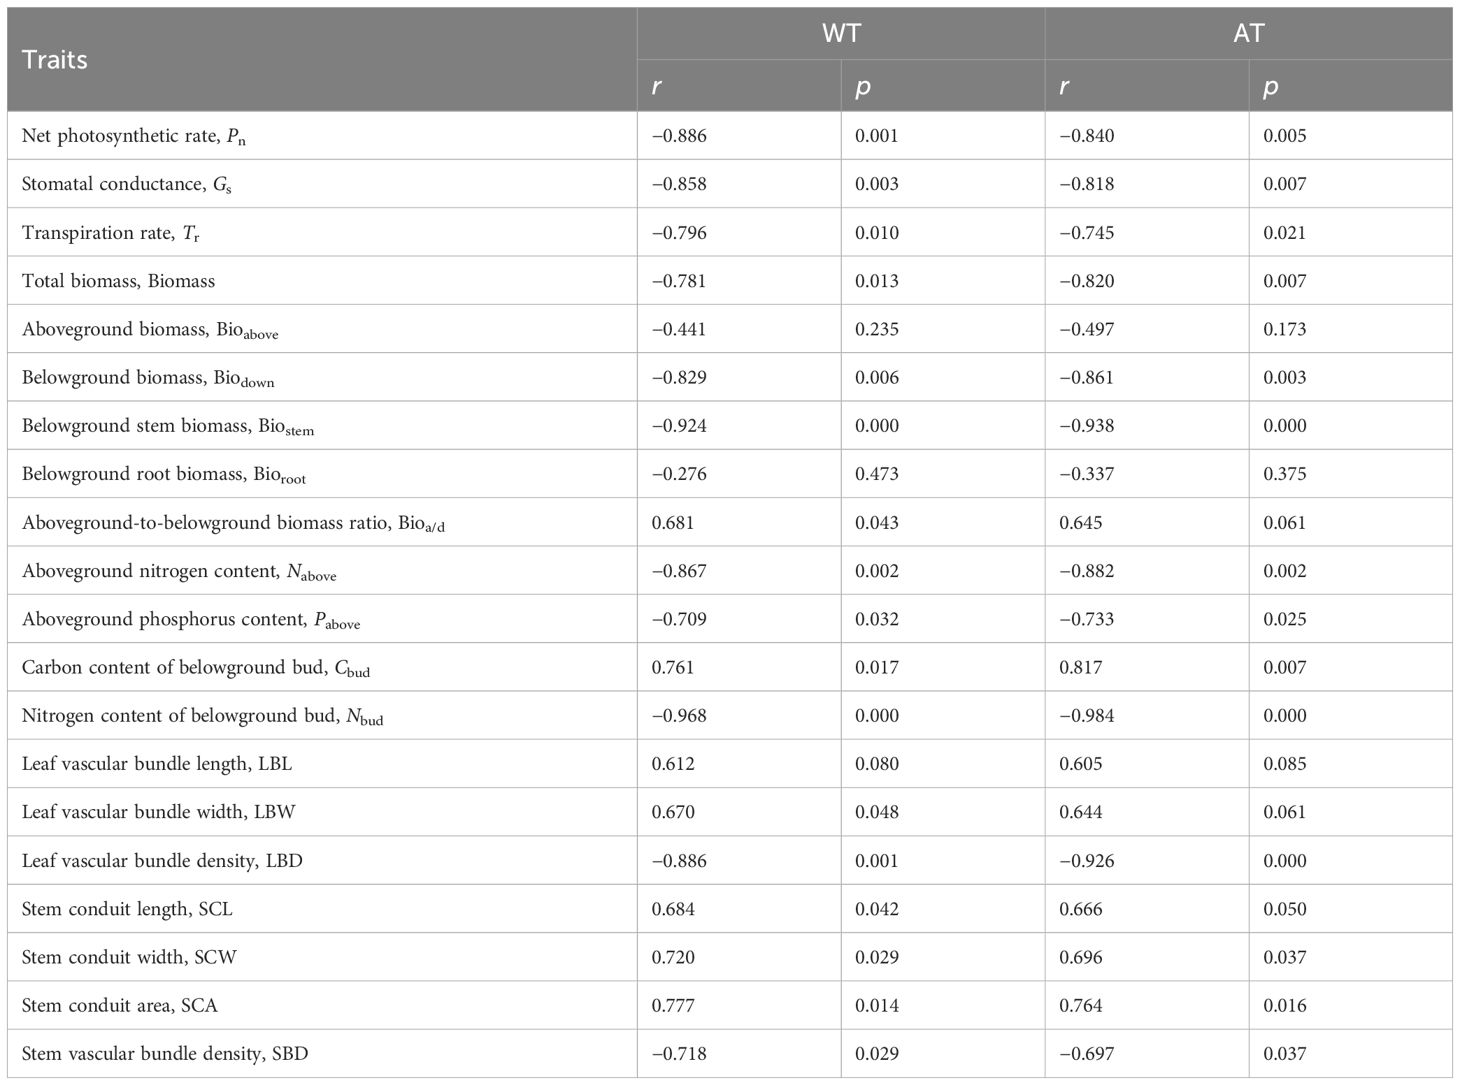
Table 3 Correlation between the functional traits and the growing season accumulated temperature (AT) and mean temperature of the hottest month (WT).
Simulated warming significantly reduced the net photosynthetic rate, stomatal conductance, and transpiration rate of S. tabernaemontani (Figure 2), indicating that high temperatures inhibit the photosynthetic carbon assimilation capacity and water vapor exchange ability of this plant. Previous studies on aquatic plants such as Typha orientalis and Z. latifolia in plateau regions have also reached similar conclusions (Yu et al., 2022; Zhao et al., 2022), suggesting that the decline in the photosynthetic productivity of aquatic plants in plateau regions is a common phenomenon in the context of climate warming. When the environmental temperature exceeds the optimal temperature for plant growth, the net photosynthetic rate decreases (Kim and Portis, 2005). Even if higher temperatures can increase the actual photosynthetic rate of plants, the increase in the photorespiration and plant respiration can lead to a decrease in the net photosynthetic rate (Dusenge et al., 2019). In the process of carbon fixation, ribulose-1,5-bisphosphate carboxylase (RuBisCo) can enhance the photosynthetic efficiency. The amount of active RuBisCo is limited by the activity of the RuBisCo activating enzyme, which is affected by temperature increase, shade, or CO2 elevated concentration inhibition by environmental conditions (Robinson and Portis, 1989; Sage and Kubien, 2007). In addition to this direct effect, warming can also indirectly affect the activity of RuBisCo activase by reducing the electron transfer rate, redox potential, and the amount of triose phosphates, thereby reducing the photosynthetic efficiency and other photosynthesis-related processes (Sage and Kubien, 2007; Dusenge et al., 2019). Therefore, enhancing the heat stability of plants will benefit maintaining a higher net photosynthetic rate (Kumar et al., 2009).
Simulated warming significantly reduced the aboveground biomass and the total biomass of S. tabernaemontani, while the belowground biomass remained unchanged, leading to the aboveground-to-belowground biomass ratio being decreased (Figure 2). The regulatory capacity of the aboveground is stronger than that of belowground, and plants generally increase the proportion of biomass allocated to the underground portion when resources are limited (Wang et al., 2022). The aboveground portion is the vegetative tissue of plants, while that of the belowground is related to the clonal reproduction of S. tabernaemontani. For biomass allocation in warming, the decrease in the aboveground proportion and the increase in the belowground proportion indicate that plants prioritize limited biomass for offspring. Higher temperatures typically extend the growing season by bringing spring forward and delaying winter. However, for many plants, moderate warming may shorten the time required for plant development. For example, before plant maturity, moderate warming can shorten the time for leaf construction, thereby shortening the overall development process of plants (Gray and Brady, 2016; Ibañez et al., 2017; Lippmann et al., 2019). This rapid developmental process of plants will reduce the total carbon fixation, thereby altering the energy allocation ratio of plants to nutritional and reproductive structures (Lippmann et al., 2019). The unchanged total belowground biomass and the significant increase in carbon content in belowground buds are manifestations of warming significantly promoting the increase in the carbon proportion of the reproductive structures (Figures 2 and 3). Therefore, temperature increases beyond the species’ optimal range could jeopardize survival by influencing the genetic potential of plants in terms of adaptation and biomass (Lippmann et al., 2019).
Consistent with the decrease in photosynthetic capacity, the nitrogen contents in the aboveground part, the belowground rhizome, and the belowground buds all significantly decreased (Figure 3). Nitrogen is a structural element of photosynthetic proteins, especially a component of the RuBisCo enzyme, an essential protein for photosynthesis. It is also the raw material for all protein metabolism and amino acid synthesis in plants. Both the global leaf and the wetland plant economics spectra have demonstrated a significant positive correlation between the net photosynthetic rate and the nitrogen content (Wright et al., 2004; Pan et al., 2020). A higher photosynthetic rate, a higher nitrogen content, and a lower specific leaf weight are typical characteristics of resource-acquisitive plants, while lower net photosynthetic rate and nitrogen content, along with a higher specific leaf weight, are typical characteristics of resource-conservative plants (Wright et al., 2004; Reich, 2014; Joswig et al., 2022; Que et al., 2022). Wetland plants generally gather at the “low investment-quick return” end of the resource acquisition spectrum (Pan et al., 2020). The significant reductions in the net photosynthetic rate and nitrogen content in various parts of S. tabernaemontani in warming indicate that, as the temperature increases, the plant’s resource utilization gradually shifts toward the resource-conservative type. Warming reduces the nitrogen supply by decreasing the activity and the amount of enzyme, reaction media, and other substances in S. tabernaemontani, thereby reducing the net photosynthetic rate, which is consistent with the findings of previous studies. Therefore, the insufficient supply of mineral nutrients is one of the reasons for the decrease in the photosynthetic productivity of S. tabernaemontani in warming.
The impact of warming is not only reflected in the development of plants, but changes in their structural architecture are also equally crucial for their adaptation to warming (Casal and Balasubramanian, 2019). The morphological and structural changes in plants with temperature variations are called thermomorphogenesis (Casal and Balasubramanian, 2019). All plant traits have an optimal temperature range for environmental adaptation, allowing them to function maximally. Deviations from this optimal condition result in reduced trait performance, with the temperature response curves resembling downward-opening parabolas. Excessive deviations can lead to fatal damage (Lippmann et al., 2019). Warming leads to an overall increase in the cross-sectional area of the vessels, sieve tubes, and vascular bundles in the stems and leaves of S. tabernaemontani. However, the density of vascular bundles decreased significantly, and the degree of response of the vascular bundles in the stems was higher than that in the leaves (Figure 4). The reduction in the vascular bundle density could increase the conductive resistance of the conduits and sieve tubes, affecting the transmission pathways of water and nutrients (Sack and Holbrook, 2006). In order to maintain their physiological processes and growth, plants increase the size of the vascular bundles to supply more water and nutrients to the leaves. This enhances photosynthesis, leading to the production of more organic compounds and promoting the accumulation of organic matter in plants (Brodribb and Feild, 2000; Brodribb et al., 2002; Santiago et al., 2004). Therefore, changes in the vascular bundle structure of S. tabernaemontani in warming may be a survival adaptation strategy exhibited in physiological functions. Alterations in the vascular bundle structure of S. tabernaemontani as a plant thermal morphogenetic adaptation benefit creating an optimal microenvironment for photosynthetic tissues and maintaining the temperature conditions for photosynthesis within the optimal range.
The AT and the WT are the primary temperature factors influencing the functional traits of S. tabernaemontani (Figure 4). The AT directly impacts the aging rate of plants, which influences the duration of photosynthesis. The WT represents extreme high temperatures in the plant’s growth environment. In general, the longer the duration of the highest temperature, the stronger the inhibitory effect on the plant anatomical structure, leading to changes in a series of metabolic processes that affect the photosynthetic rate of plants and the accumulation and distribution of products (Hendrickson et al., 2008; Djanaguiraman et al., 2011; Li et al., 2020; Zhen et al., 2020). These two temperature factors showed significant negative correlations with the photosynthetic parameters, the various biomass components, the aboveground nitrogen and phosphorus contents, the belowground bud nitrogen content, and the stem and leaf vascular bundle density. There were significant positive correlations with the aboveground-to-belowground biomass ratio, the belowground bud carbon content, the stem bundle width, and the stem conduit size (Table 3), indicating that the AT and the WT achieved the response of S. tabernaemontani to warming by modulating the aforementioned temperature-sensitive traits. When the temperature is suitable, a higher photosynthetic capacity is advantageous for the formation of photosynthetic products, including primary metabolites and the accumulation of certain secondary metabolites (Morales et al., 2020). The ability of the plant’s phloem to transport assimilates is also highly sensitive to photosynthesis. The response of a plant’s vascular traits to temperature improves its ability to obtain resources and to transport materials when the temperature changes, improving its performance and survival ability.
The original contributions presented in the study are included in the article/supplementary material. Further inquiries can be directed to the corresponding authors.
ZL: Conceptualization, Writing – original draft, Writing – review & editing. YQZ: Investigation, Writing – review & editing. HY: Methodology, Writing – original draft, Writing – review & editing. YZ: Data curation, Writing – review & editing. HG: Supervision, Writing – review & editing. MS: Conceptualization, Funding acquisition, Resources, Writing – review & editing.
The author(s) declare financial support was received for the research, authorship, and/or publication of this article. This research was financially supported by the Foundation of the Agricultural Joint Basic Research Project of Yunnan Province (202101BD070001–099), the Foundation of the Key Laboratory of Plateau Wetland Conservation, Restoration and Ecological Services of Yunnan Province (202105AG070002), and the Foundation of the Biodiversity Fund of Yunnan Province.
The authors declare that the research was conducted in the absence of any commercial or financial relationships that could be construed as a potential conflict of interest.
All claims expressed in this article are solely those of the authors and do not necessarily represent those of their affiliated organizations, or those of the publisher, the editors and the reviewers. Any product that may be evaluated in this article, or claim that may be made by its manufacturer, is not guaranteed or endorsed by the publisher.
Ahrens C. W., Andrew M. E., Mazanec R. A., Ruthrof K. X., Challis A., Hardy G., et al. (2020). Plant functional traits differ in adaptability and are predicted to be differentially affected by climate change. Ecol. Evol. 10, 232–248. doi: 10.1002/ece3.5890
Anderson J. T., Song B. H. (2020). Plant adaptation to climate change—Where are we? J. Systematics Evolution 58, 533–545. doi: 10.1111/jse.12649
Bagley J., Rosenthal D. M., Ruiz-Vera U. M., Siebers M. H., Kumar P., Ort D. R., et al. (2015). The influence of photosynthetic acclimation to rising CO2 and warmer temperatures on leaf and canopy photosynthesis models. Global Biogeochemical Cycles 29, 194–206. doi: 10.1002/2014GB004848
Brodribb T. J., Feild T. S. (2000). Stem hydraulic supply is linked to leaf photosynthetic capacity: evidence from New Caledonian and Tasmanian rainforests. Plant Cell Environment 23, 1381–1388. doi: 10.1046/j.1365-3040.2000.00647.x
Brodribb T. J., Holbrook N. M., Gutiérrez M. V. (2002). Hydraulic and photosynthetic co-ordination in seasonally dry tropical forest trees. Plant Cell Environment 25, 1435–1444. doi: 10.1046/j.1365-3040.2002.00919.x
Casal J. J., Balasubramanian S. (2019). Thermomorphogenesis. Annu. Rev. Plant Biol. 70, 321–346. doi: 10.1146/annurev-arplant-050718-095919
Čížková H., Květ J., Comín F. A., Laiho R., Pokorný J., Pithart D. (2013). Actual state of European wetlands and their possible future in the context of global climate change. Aquat. Sci. 75, 3–26. doi: 10.1007/s00027-011-0233-4
Collins W., Fry M., Yu H., Fuglestvedt J., Shindell D., West J. (2013). Global and regional temperature-change potentials for near-term climate forcers. Atmospheric Chem. Physics 13, 2471–2485. doi: 10.5194/acp-13-2471-2013
Djanaguiraman M., Prasad P. V., Boyle D. L., Schapaugh W. T. (2011). High-temperature stress and soybean leaves: Leaf anatomy and photosynthesis. Crop Sci. 51, 2125–2131. doi: 10.2135/cropsci2010.10.0571
Dusenge M. E., Duarte A. G., Way D. A. (2019). Plant carbon metabolism and climate change: elevated CO2 and temperature impacts on photosynthesis, photorespiration and respiration. New Phytol. 221, 32–49. doi: 10.1111/nph.15283
Erwin K. L. (2009). Wetlands and global climate change: the role of wetland restoration in a changing world. Wetlands Ecol. Management 17, 71–84. doi: 10.1007/s11273-008-9119-1
Esperon-Rodriguez M., Rymer P. D., Power S. A., Challis A., Marchin R. M., Tjoelker M. G. (2020). Functional adaptations and trait plasticity of urban trees along a climatic gradient. Urban Forestry Urban Greening 54, 126771. doi: 10.1016/j.ufug.2020.126771
Gopal B. (2013). Future of wetlands in tropical and subtropical Asia, especially in the face of climate change. Aquat. Sci. 75, 39–61. doi: 10.1007/s00027-011-0247-y
Gray S. B., Brady S. M. (2016). Plant developmental responses to climate change. Dev. Biol. 419, 64–77. doi: 10.1016/j.ydbio.2016.07.023
Hendrickson L., Sharwood R., Ludwig M., Whitney S. M., Badger M. R., Caemmerer S. (2008). The effects of rubisco activase on C4 photosynthesis and metabolism at high temperature. J. Exp. Bot. 59, 1789–1798. doi: 10.1093/jxb/erm373
Ibañez C., Poeschl Y., Peterson T., Bellstädt J., Denk K., Gogol-Döring A., et al. (2017). Ambient temperature and genotype differentially affect developmental and phenotypic plasticity in Arabidopsis thaliana. BMC Plant Biol. 17. doi: 10.1186/s12870-017-1068-5
IPCC. (2013). Technical Summary. In: Climate Change 2013: The Physical Science Basis. Contribution of Working Group I to the Fifth Assessment Report of the Intergovernmental Panel on Climate Change (Cambridge: Cambridge University Press).
Joswig J. S., Wirth C., Schuman M. C., Kattge J., Reu B., Wright I. J., et al. (2022). Climatic and soil factors explain the two-dimensional spectrum of global plant trait variation. Nat. Ecol. Evolution 6, 36–50. doi: 10.1038/s41559-021-01616-8
Junk W. J., An S., Finlayson C., Gopal B., Květ J., Mitchell S. A., et al. (2013). Current state of knowledge regarding the world’s wetlands and their future under global climate change: a synthesis. Aquat. Sci. 75, 151–167. doi: 10.1007/s00027-012-0278-z
Kessler M., Siorak Y., Wunderlich M., Wegner C. (2007). Patterns of morphological leaf traits among pteridophytes along humidity and temperature gradients in the Bolivian Andes. Funct. Plant Biol. 34, 963–971. doi: 10.1071/FP07087
Kim K., Portis A. R. (2005). Temperature dependence of photosynthesis in arabidopsis plants with modifications in rubisco activase and membrane fluidity. Plant Cell Physiol. 46, 522–530. doi: 10.1093/pcp/pci052
Kouki H., Kazumasa I., Almaz B., Onno M., Yusuke O. (2006). Temperature acclimation of photosynthesis: mechanisms involved in the changes in temperature dependence of photosynthetic rate. J. Exp. Botany 57, 291–302. doi: 10.1093/jxb/erj049
Kumar A., Li C., Portis A. R. (2009). Arabidopsis thaliana expressing a thermostable chimeric Rubisco activase exhibits enhanced growth and higher rates of photosynthesis at moderately high temperatures. Photosynthesis Res. 100, 143–153. doi: 10.1007/s11120-009-9438-y
Li Y., Liang W., Zhao B. (2020). Physiological and microstructural responses of two Rhododendron cultivars to high temperature and low light. Hortic Environ Biote 61, 445–458. doi: 10.1007/s13580-020-00234-w
Li W., Liu Z., Zhao J., Ma L., Wu J., Qi J., et al. (2023). Leaf mechanical properties as potential predictors of leaf-litter decomposability. Forestry Res. 3. doi: 10.48130/FR-2023-0021
Lindborg R., Ermold M., Kuglerová L., Jansson R., Larson K. W., Milbau A., et al. (2021). How does a wetland plant respond to increasing temperature along a latitudinal gradient? Ecol. Evol. 11, 16228–16238. doi: 10.1002/ece3.8303
Lippmann R., Babben S., Menger A., Delker C., Quint M. (2019). Development of wild and cultivated plants under global warming conditions. Curr. Biol. 29, 1326–1338. doi: 10.1016/j.cub.2019.10.016
Moles A. T., Perkins S. E., Laffan S. W., Flores-Moreno H., Awasthy M., Tindall M. L., et al. (2014). Which is a better predictor of plant traits: temperature or precipitation? J. Vegetation Sci. 25, 1167–1180. doi: 10.1111/jvs.12190
Morales F., Ancín M., Fakhet D., González-Torralba J., Gámez A. L., Seminario A., et al. (2020). Photosynthetic metabolism under stressful growth conditions as a bases for crop breeding and yield improvement. Plants 9, 88. doi: 10.3390/plants9010088
Pan Y., Cieraad E., Armstrong J., Armstrong W., Clarkson B. R., Colmer T. D., et al. (2020). Global patterns of the leaf economics spectrum in wetlands. Nat. Commun. 11, 4519. doi: 10.1038/s41467-020-18354-3
Que Q., Ouyang K., Li C., Li B., Song H., Li P., et al. (2022). Geographic variation in growth and wood traits of Neolamarckia cadamba in China. Forestry Res. 2. doi: 10.48130/FR-2022-0012
Reich P. B. (2014). The world-wide “fast-slow” plant economics spectrum: a traits manifesto. J. Ecol. 102, 275–301. doi: 10.1111/1365-2745.12211
Robinson S. P., Portis A. R. (1989). Ribulose-1,5-bisphosphate carboxylase/oxygenase activase protein prevents the in vitro decline in activity of ribulose-1,5-bisphosphate carboxylase/oxygenase. Plant Physiol. 90, 968–971. doi: 10.1104/pp.90.3.968
Roche P., Díaz-Burlinson N., Gachet S. (2004). Congruency analysis of species ranking based on leaf traits: which traits are the more reliable? Plant Ecol. 174, 37–48. doi: 10.1023/B:VEGE.0000046056.94523.57
Sack L., Holbrook N. M. (2006). Leaf hydraulics. Annu. Rev. Plant Biol. 57, 361–381. doi: 10.1146/annurev.arplant.56.032604.144141
Sage R. F., Kubien D. (2007). The temperature response of C3 and C4 photosynthesis. Plant Cell Environ. 30, 1086–1106. doi: 10.1111/j.1365-3040.2007.01682.x
Santiago L. S., Goldstein G., Meinzer F. C., Fisher J. B., MaChado K., Woodruff D., et al. (2004). Leaf photosynthetic traits scale with hydraulic conductivity and wood density in Panamanian forest canopy trees. Oecologia 140, 543–550. doi: 10.1007/s00442-004-1624-1
Soudzilovskaia N. A., Elumeeva T. G., Onipchenko V. G., Shidakov I. I., Salpagarova F. S., Khubiev A. B., et al. (2013). Functional traits predict relationship between plant abundance dynamic and long-term climate warming. Proc. Natl. Acad. Sci. 110, 18180–18184. doi: 10.1073/pnas.1310700110
Walther G. R., Post E., Covey P., Menzel A., Parmesan C., Beebee T. J., et al. (2002). Ecological responses to recent climate changes. Nature 416, 389–395. doi: 10.1038/416389a
Wang X., Huang X., Wang Y., Yu P., Guo J. (2022). Impacts of site conditions and stand structure on the biomass allocation of single trees in larch plantations of Liupan Mountains of Northwest China. Forests 13, 177. doi: 10.3390/f13020177
Wright I. J., Reich P. B., Westoby M., Ackerly D. D., Baruch Z., Bongers F., et al. (2004). The worldwide leaf economics spectrum. Nature 428, 821–827. doi: 10.1038/nature02403
Yu H., Sun M., Liu Z., Zhao Y., Chen H., Yang H. (2022). Responses of plant functional traits of Eleocharis Liouana to environmental changes on Northwestern Yunnan Plateau, China. Available online at: https://ssrn.com/abstract=4058206. doi: 10.2139/ssrn.4058206
Zhao Y., Sun M., Guo H., Feng C., Liu Z., Xu J. (2022). Responses of leaf hydraulic traits of Schoenoplectus tabernaemontani to increasing temperature and CO2 concentrations. Bot. Stud. 63, 2. doi: 10.1186/s40529-022-00331-2
Keywords: plateau wetland, simulated warming, Schoenoplectus tabernaemontani, functional traits, environmental response
Citation: Liu Z, Zhao Y, Yu H, Zhao Y, Guo H and Sun M (2024) Response of the functional traits of Schoenoplectus tabernaemontani to simulated warming in the Napahai wetland of northwestern Yunnan, China. Front. Ecol. Evol. 12:1399584. doi: 10.3389/fevo.2024.1399584
Received: 12 March 2024; Accepted: 10 May 2024;
Published: 04 June 2024.
Edited by:
Lin Zhang, Hubei University of Chinese Medicine, ChinaReviewed by:
Zhiquan Cai, Chinese Academy of Sciences (CAS), ChinaCopyright © 2024 Liu, Zhao, Yu, Zhao, Guo and Sun. This is an open-access article distributed under the terms of the Creative Commons Attribution License (CC BY). The use, distribution or reproduction in other forums is permitted, provided the original author(s) and the copyright owner(s) are credited and that the original publication in this journal is cited, in accordance with accepted academic practice. No use, distribution or reproduction is permitted which does not comply with these terms.
*Correspondence: Huijun Guo, aGpndW8xQHNpbmEuY29t; Mei Sun, c20wNTEwMjE1QDE2My5jb20=
Disclaimer: All claims expressed in this article are solely those of the authors and do not necessarily represent those of their affiliated organizations, or those of the publisher, the editors and the reviewers. Any product that may be evaluated in this article or claim that may be made by its manufacturer is not guaranteed or endorsed by the publisher.
Research integrity at Frontiers
Learn more about the work of our research integrity team to safeguard the quality of each article we publish.