 Sandra Müller1*†
 Olaf Jahn2†
 Kirsten Jung3†Oliver Mitesser4†
 Christian Ammer5†Stefan Böhm3,6†
 Martin Ehbrecht5†
 Almo Farina7
 Swen C. Renner8†Nadia Pieretti9†
 Peter Schall5†Marco Tschapka3,10†
 Konstans Wells11†
 Michael Scherer-Lorenzen1†
- 1Faculty of Biology, Geobotany, University of Freiburg, Freiburg, Germany
- 2Museum für Naturkunde – Leibniz Institute for Evolution and Biodiversity Science, Berlin, Germany
- 3Evolutionary Ecology and Conservation Genomics, University Ulm, Ulm, Germany
- 4Field Station Fabrikschleichach, Animal Ecology and Tropical Biology, Biocenter, University of Würzburg, Rauhenebrach, Germany
- 5Silviculture and Forest Ecology of the Temperate Zones, University of Goettingen, Göttingen, Germany
- 6Siebert Consult, Lindau, Bodensee, Germany
- 7Department of Pure and Applied Sciences, The University of Urbino, Urbino, Italy
- 8Head of Ornithology, Zoology, Natural History Museum Vienna, Vienna, Austria
- 9Independent researcher, Recanati, Italy
- 10Smithsonian Tropical Research Institute, Ancon, Panama
- 11Department of Biosciences, Swansea University, Swansea, United Kingdom
Introduction: In production forests, management can have cascading effects on biodiversity and ecosystem services. Acoustic diversity reflects the diversity of vocalizing animals and has also considerable recreational value for human well-being, but the relationship between acoustic diversity and forest management remains largely unexplored
Method: We recorded acoustic diversity on forest plots along a gradient of silvicultural management intensity (SMI) in three regions of Germany. We explored the diurnal and seasonal temporal dynamics in acoustic diversity index (ADI) from March to July using generalized additive mixed models (GAMMs). We further investigated the interrelation between acoustic diversity and silvicultural management intensity, forest structural diversity, as well as tree diversity, bird species richness and abundance using structural equation modeling (SEM).
Results: Silvicultural management intensity had significant effects on the temporal dynamics of ADI in May and June from dawn till dusk, but variance explained by SMI was low. We confirmed our hypothesis that ADI was reduced by SMI due to its cascading effects on forest structural diversity and bird species richness and abundance.
Discussion: Acoustic diversity indices can provide valuable insights into how forest management affects the acoustic activity of soniferous communities. We discuss how this can indicate both changes in species diversity as well as their vocal activity. We further address potential implications for forest management.
1 Introduction
The way humans utilize, transform, and manage ecosystems has tremendous impacts on biodiversity and the ecosystem functions provided by those species able to persist in human-altered landscapes (Newbold et al., 2015; Purvis et al., 2021; Jaureguiberry et al., 2023). By managing forests, mainly with a focus to optimize timber production, humans alter forest structure and tree species composition, with cascading effects on associated biodiversity (Penone et al., 2019; Ampoorter et al., 2020; Heidrich et al., 2020). In the face of the various challenges posed by global change (climate crisis, biodiversity crisis, global health crisis), land use management needs to ensure the multi-functionality of ecosystems and address the various public demands beyond food and timber production, including nature-based recreation, health maintenance, education, and experience. Preserving and restoring biodiversity is an important key to ensure multi-functionality – not only in forests (Gamfeldt et al., 2008; Cardinale et al., 2012; Hooper et al., 2012; van der Plas et al., 2016; Le Provost et al., 2023). At the same time, there is growing evidence that increased biodiversity enhances the beneficial effects of forests on human health and well-being (Civitello et al., 2015; Marselle et al., 2021; Gillerot et al., 2022; Steinparzer et al., 2022; Gillerot et al., 2024; Rozario et al., 2024a). Soniferous animals, especially the prominent acoustic activity of birds in spring, are important mediators in connecting people to nature and its benefits (Ratcliffe et al., 2013; Hedblom et al., 2014; Phillips et al., 2023). In a pan-European study, for example, it has been shown that bird species richness is highly correlated with people’s life satisfaction to a similar extent as income (Methorst et al., 2021). However, as bird populations decline, so does the acoustic diversity of spring soundscapes and their potential ecosystem-service function to humans (Morrison et al., 2021).
Soundscapes comprise the often complex acoustic environment, consisting of animal sounds (biophony), noises generated by physical and chemical activities in the environment (geophony), and human-generated sounds (anthropophony) (Pijanowski et al., 2011a, b). Monitoring acoustic diversity patterns can reveal ecologically relevant insights into patterns and drivers of acoustic habitat characteristics (Retamosa Izaguirre et al., 2021; Ross et al., 2021; Barbaro and Froidevaux, 2022; Müller et al., 2022; Scarpelli et al., 2023). These acoustic habitat characteristics in turn are important for acoustic niche partitioning and connectivity, as they determine the communication channels between the individuals inhabiting this space (Mullet et al., 2017). Forest management can impact the richness, abundance, and functional composition of local bird assemblages (Wells et al., 2011; Schulze et al., 2019), potentially with direct consequences for the acoustic diversity that characterizes the soundscape. In addition, patterns of acoustic diversity are likely to be influenced by various factors that contribute to the daily plasticity of bird vocal activity and sound transmission quality, such as habitat structure, weather conditions, resource availability, and the presence of potential predators (Slagsvold, 1977; McNamara et al., 1987; Slabbekoorn et al., 2002; Brown and Handford, 2003; Bruni et al., 2014; Naguib and Riebel, 2014; Schäfer et al., 2017). Furthermore, noise levels in the form of anthropophony and geophony have been shown to modify the singing behavior of birds (Francis et al., 2009; Barber et al., 2010).
The temporal patterns of acoustic activity and diversity in soundscapes can be measured and analyzed using acoustic indices. The latter have attracted increasing attention by researchers and conservationists as potential tools and proxies for biodiversity monitoring across large spatial and temporal scales (Sugai et al., 2018; Alcocer et al., 2022). To date, roughly 70 different acoustic indices have been developed. However, their correct application and, above all, their interpretation is subject to certain pitfalls and caveats (Bradfer-Lawrence et al., 2023). Studies investigating their ability to reveal meaningful ecological patterns regarding their applicability as proxies for species richness of soniferous animals, have produced mixed results and uncovered clear limitations (Quinn et al., 2023; Sethi et al., 2023). One reason for this is the intrinsic characteristic of acoustic indices to integrate all components of the soundscape, regardless of whether they originate from geophony, anthropophony, or biophony. This is problematic as it makes the assessment of changes in acoustic diversity notoriously difficult and prone to misinterpretation. However, calculating indices only for relevant frequency ranges and aggregating over meaningful ecological time periods can partly overcome these limitations (Metcalf et al., 2020; Bradfer-Lawrence et al., 2023; Xu et al., 2023). Acoustic indices are calculated over minute intervals. However, processes such as competition for acoustic space typically limit the number of birds singing together within a minute (Staniewicz et al., 2023). If there is acoustic overlap and masking within the dawn chorus, acoustic indices often do not increase linearly with increasing species richness but tend to level-off at some point (Sueur et al., 2008; Beason et al., 2023), or show otherwise unexpected behavior (Gasc et al., 2015). Yet, it remains unclear at what time of the day and when in the spring season the above-mentioned factors would have the strongest effects on acoustic diversity. Intuitively, we assumed that differences would be most pronounced when birds are most active (e.g. at dawn and when the peak of the breeding season is reached) but differences between study plots may be better detected by analyzing longer periods of the day and the season, rather than focusing on dawn periods during the peak breeding period. For a short period of time at dawn, even study plots with low bird diversity may show diverse choruses of several species singing together. Meanwhile, study plots with higher numbers of vocalizing bird species should show greater continuity of vocal activity throughout the season. Therefore, the objectives of this study were to determine (1) how forest management intensity affects acoustic diversity over time and then (2) whether it can be explained by changes in bird species richness and abundance in differently managed forests. In order to address the first objective, we analyzed diurnal patterns of acoustic diversity over several months in spring, using generalized additive mixed models (GAMMs) to identify the periods when management intensity had the strongest effect on acoustic diversity across our study plots. In doing so, this study also contributes to describing and understanding the phenology of acoustic dynamics in different habitats, which few studies have addressed (but see Gage and Axel, 2014; Buxton et al., 2016; Oliver et al., 2018; Grinfeder et al., 2022). Acoustic data were collected along a gradient of forest management intensity in three German regions: the Swabian Alb (southwest Germany), the Hainich-Dün (central Germany), and the Schorfheide-Chorin (northeast Germany), all part of the Biodiversity Exploratory network (Fischer et al., 2010). Differences in forest management (see Methods section for more details) were quantified using an index of silvicultural management intensity (SMI, Schall and Ammer, 2013), which accounts for variations in stand age, tree species composition, and stand basal area among forest plots.
To address our second objective, we applied a structural equation modeling (SEM) approach, hypothesizing that increased forest management intensity reduces vertical and horizontal structural heterogeneity and tree species diversity with negative effects on bird species richness and abundance (MacArthur and MacArthur, 1961; Tews et al., 2004; Czeszczewik et al., 2015; Renner et al., 2018; Schall et al., 2018; Penone et al., 2019; Reise et al., 2019; Ampoorter et al., 2020; Müller et al., 2020; Basile et al., 2021). Finally, we hypothesized that this reduction in mean bird richness and abundance would result in lower acoustic diversity, revealing a cascading negative effect of forest management intensity on spring acoustic diversity.
2 Methods
2.1 Study sites
The study sites are part of the Biodiversity Exploratory research program (Fischer et al., 2010) a platform of study plots that were established in 2006 in three regions in Germany: (1) Schorfheide-Chorin (SCH) in north-east Germany (N 53.16°–52.85° and E 13.59°–14.05°); (2) Hainich-Dün (HAI) in central Germany (N 51.37–50.95° and E 10.19–10.77°); and (3) Swabian Alb (ALB) in south-west Germany (N 48.51–48.35° and E 9.20–9.60°). Within each region, 50 study plots measuring 100 m x 100 m were established in forests of varying composition and management for surveys of biodiversity and ecosystem processes.
The study plots in the Schorfheide-Chorin are located in one of the most sparsely populated areas in Germany, north of Berlin, situated within the UNESCO Biosphere Reserve that was established in 1990. The current geomorphology of the landscape was formed during the last ice age. This is the region with the lowest altitude, at 3-140 meters above sea level. The average annual temperature is between 8 and 8.5 °C and the average annual rainfall is only 500-600 mm. The gradient of silvicultural management practices among the study plots range from managed forests, including Scots pine (Pinus sylvestris, L.), European beech (Fagus sylvatica, L.), pine-beech, and oak (Quercus robur, L. and Quercus petraea, (Mattuschka) Liebl.) dominated forests to semi-natural unmanaged beech forests in the core areas of the biosphere reserve. Most of the forests are managed age-class forests, the currently unmanaged forests have not been logged since 1990.
The Hainich-Dün region is characterized by extensive beech forests on limestone and loess. With 16,000 ha, the Hainich is one of the largest continuous deciduous forest areas in Germany at an altitude of 285–550 m above sea level. The average annual precipitation is between 500 and 800 mm and the average annual temperature ranges between 6.5 and 8 °C. Some of our study plots are part of the Hainich National Park that was established in 1997. The Dün is a mountain ridge with an extension of 270 km² of which about half is covered by forest. The study plots are located in unmanaged natural beech forests (Hainich National Park), selection-cutting beech forests, and managed age-class forests either dominated by beech or by Norway spruce (Picea abies, (L.) H. Karst.). However, spruce is declining due to increasing intensity and frequency of droughts and subsequent bark beetle infestation.
The Exploratory Swabian Alb is located in limestone-rich mountain ranges. The area is characterized by a mosaic of wooded and open areas. It is the study region with the highest altitude (460-860 m above sea level), with correspondingly low mean annual temperatures (6-7 °C) and the highest precipitation levels of the three regions (annual average: 700-1000 mm). The forest types range from old beech forests in nature reserves, to managed beech forests with a high proportion of spruce and other species, to intensively managed beech or spruce monocultures. The age structure of the managed forests ranges from young afforestations to mid-aged forests, with trees more than a hundred years old. A special feature of the Swabian Alb are the mixture of ravine and slope forests, which are particularly rich in species and structure.
2.2 Acoustic recording procedure and data processing
The acoustic diversity of the study plots was assessed from recordings made by a prototype version of the autonomous recorder “Soundscape Explorer Terrestrial” (SET) by Lunilettronik Cooperativa, Fivizzano, Italy. Each recorder was equipped with an omnidirectional microphone capsule EMY-63M/P (sensitivity (0 dB = 1 V Pa-1. 1 kHz): dB -38 +/- 3, signal to noise ratio: > 60 dB, input voltage of the analog-to-digital converter (ADC): 0.75 Vrms (root-mean-square voltage) (personal communication with Lunilettronik Coop.)). The microphone gain was manually set to +25 dB. Recorders were programmed to record for one minute every ten minutes per day, with a sampling rate of 48 kHz and bit depth of 16 bits. One recording period lasted approximately two months, after which batteries and SD cards were replaced. In this study, we analyzed acoustic data collected from March through July 2016, to track acoustic activity throughout the spring and summer. Due to technical failures (a mix of battery, recorder, or SD-Card malfunctions) some study plots had to be excluded from further analysis (see Table 1, for the number of plots included per time period). Each recording device was placed at 2 m height, within a fenced area of the plots that contained also the equipment of a small weather station and other sensitive technical instruments.
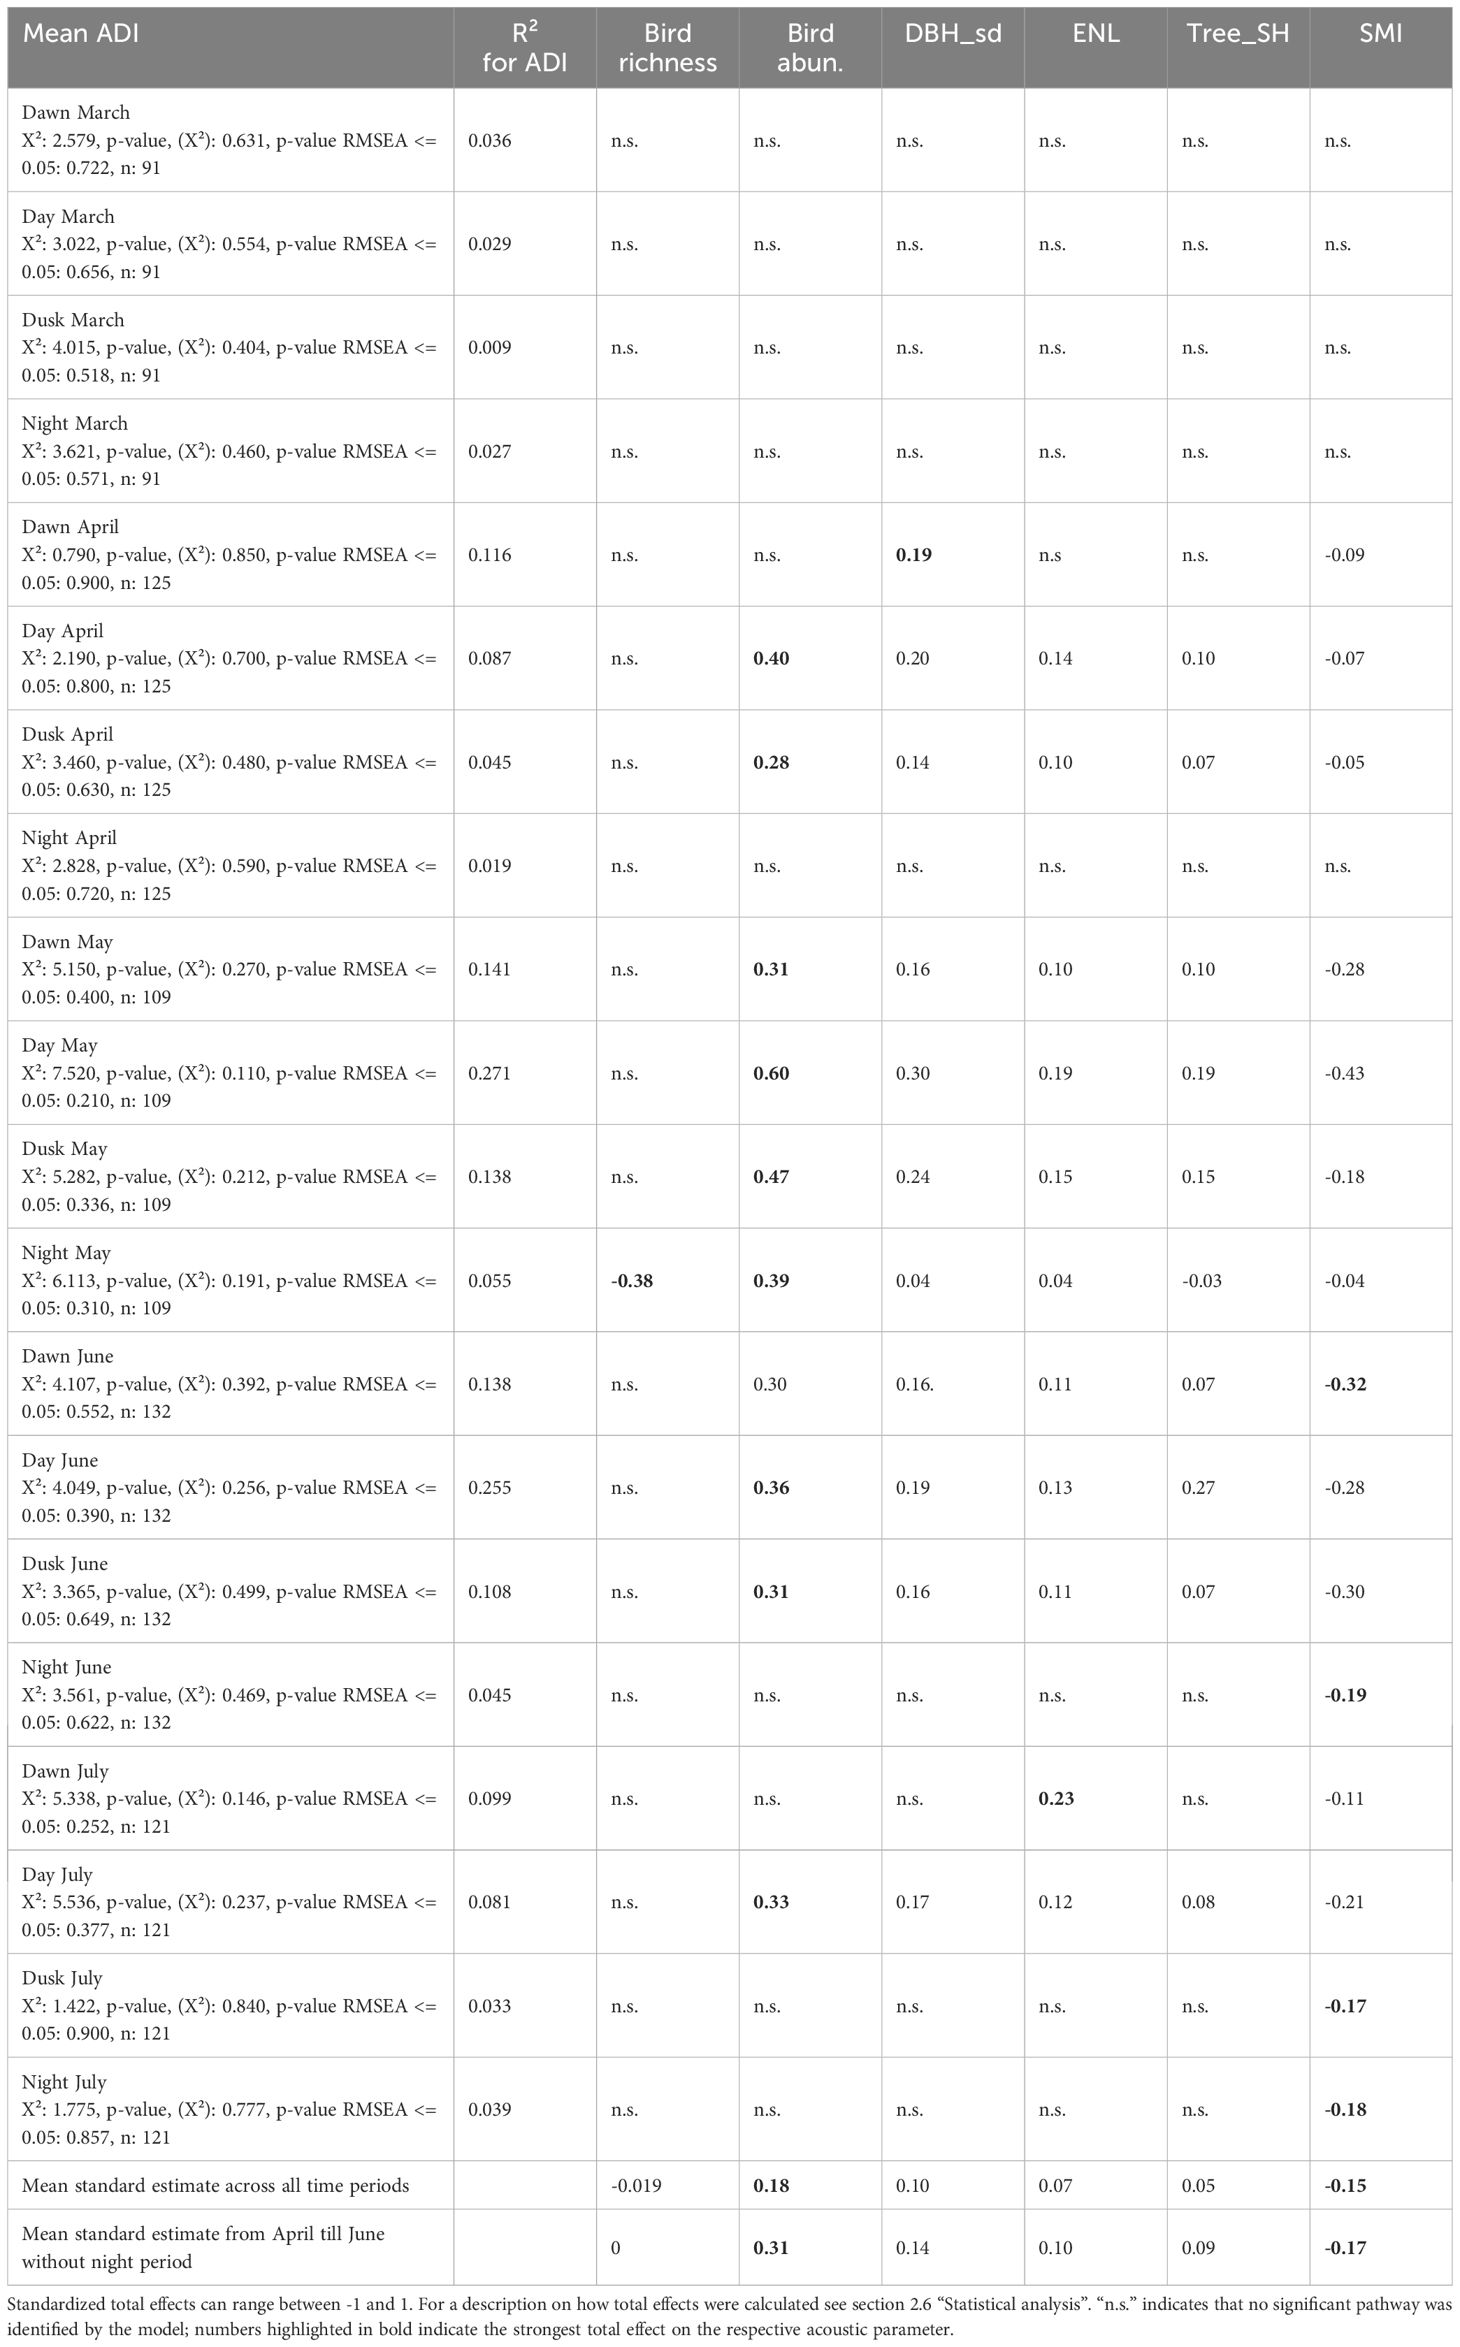
Table 1. Standardized total effects on ADI derived from structural equation models for each time period from March till July (dawn, day, dusk, and night).
We computed the acoustic diversity index (ADI) (Villanueva-Rivera et al., 2011) to analyze temporal acoustic patterns. The ADI is calculated as the Shannon entropy of the relative distribution of acoustic energy across frequency bands. It is a measure of acoustic diversity across the entire frequency range and thus comprises all components of the soundscape. There is already ample literature that tests and compares the performance of different indices with respect to other measures of biodiversity, the majority focusing on bird species richness (Zhao et al., 2019; Alcocer et al., 2022). Therefore, rather than comparing the performance of different indices, this study focused on investigating temporal patterns of acoustic diversity and its drivers. For this purpose, we chose an index that a) showed temporal patterns that clearly related to known vocal activity patterns of birds in our study system (Supplementary Figures S1–S4) and b) has been shown to be robust with respect to the shape of the vocal units as well as the frequency of occurrence of vocalizations and their intensity (Zhao et al., 2019), while also relating well to bird diversity under different environmental conditions (Mammides et al., 2017; Turner et al., 2018; Müller et al., 2020; Sánchez-Giraldo et al., 2020; Boullhesen et al., 2021; Retamosa Izaguirre et al., 2021). The best practice criteria defined by Bradfer-Lawrence et al. (2023) were thus met.
The ADI was calculated for each wave file using the “multiple sounds” function in the soundecology package (Villanueva-Rivera and Pijanowski, 2016) in the R statistical computing environment (R Core Team, 2017). We calculated ADI across the frequency range of 0–24 kHz using 1 kHz steps and a decibel threshold of −50 dB.
The quality of the audio data was assessed by reviewing the first and last recording of each recording period. For data cleaning purposes, scatterplots of the ADI per plot across 24h periods were used to identify outlying index values, which led to direct identification of corrupted recordings. Corrupted recordings contained technical noise due to battery failure or were affected by a drop in microphone sensitivity, so no signals were captured. However, recordings containing noise from wind and rain were included for further data processing. In a previous study we showed that the correlation of monthly mean values of ADI between plots for which rainy days were considered or not was high (> 0.99, Müller et al., 2022). This is also in line with the recommendation to average acoustic indices over longer time periods to even out outliers, e.g. peaks from rain and strong wind (Bradfer-Lawrence et al., 2019). The total number of study plots included was 91, 125, 109, 132 and 121 for the months of March, April, May, June, and July respectively. Supplementary Figures S5–S8 show that varying the number of plots had only marginal effects on the upper part of the structural equation models (SEMs), that specified the effects of forest management intensity, forest structure, and tree species diversity on bird abundance and richness. The strongest differences were observed for March, when only 91 plots could be included in the analysis.
2.3 Silvicultural management intensity
The silvicultural management intensity index (SMI) was developed by Schall and Ammer (2013) and consists of a risk of stand loss component (SMIr: probability of stand loss before the age of 180) and a density component (SMId: relative deviance between actual basal area of the forest stand and the corresponding basal area carrying capacity of the site, based on a stand with identical tree species composition). The risk of stand loss is a function of tree species and stand age, while stand density quantifies the impact of recent and past tree removals and regeneration methods by relating the actual biomass to a reference. At the operational level, SMI primarily responds to management practices such as removals through maintenance, thinning, and harvest operations that decrease stem number, basal area, growing stock (commercial wood volume), and biomass (Schall and Ammer, 2013). The SMI successfully distinguishes managed from unmanaged forest stands, and also reflects the variability of forest management as well as stand properties across the entire range of forest study plots of the Biodiversity Exploratories (see Schall and Ammer, 2013 for more details). The majority of the study plots had SMI values between 0.14 and 0.33 (1st and 3rd quartiles of the SMI distribution between plots, Figure 1). The 3rd quartile represented age-class forest stands, particularly beech- or spruce-dominated forests with high density and an average stand age of 80 years, typically associated with intensive forest management (Schall and Ammer, 2013). Plots with even higher SMI values (SMI > 0.55) indicated very young stands of high stem density, i.e. the highest values were associated with spruce-dominated forest age classes (45-65 years). Only two plots had such high SMI values. In contrast, plots with SMI values around the 1st quartile were unmanaged or extensively managed mature stands (average age 130 years). The latter were either mixed or single species stands, with or without being managed in the age class system. The lowest SMI values are related to unmanaged or extensively managed beech forests, both pure and mixed stands, with an age between 140 and 175 years. Thus, the three regions, which are part of biosphere reserves or the Hainich national park, were characterized by low management intensities. In particular, 42.6% of the plots are deciduous stands with a stand age of > 120 years, while at national level only 8.9% of all forest stands fall into this category (cf. Figure 1, source: BMEL, 2014). The corresponding data is based on a forest inventory carried out on the study plots from 2008 to 2010 (see data availability statement).
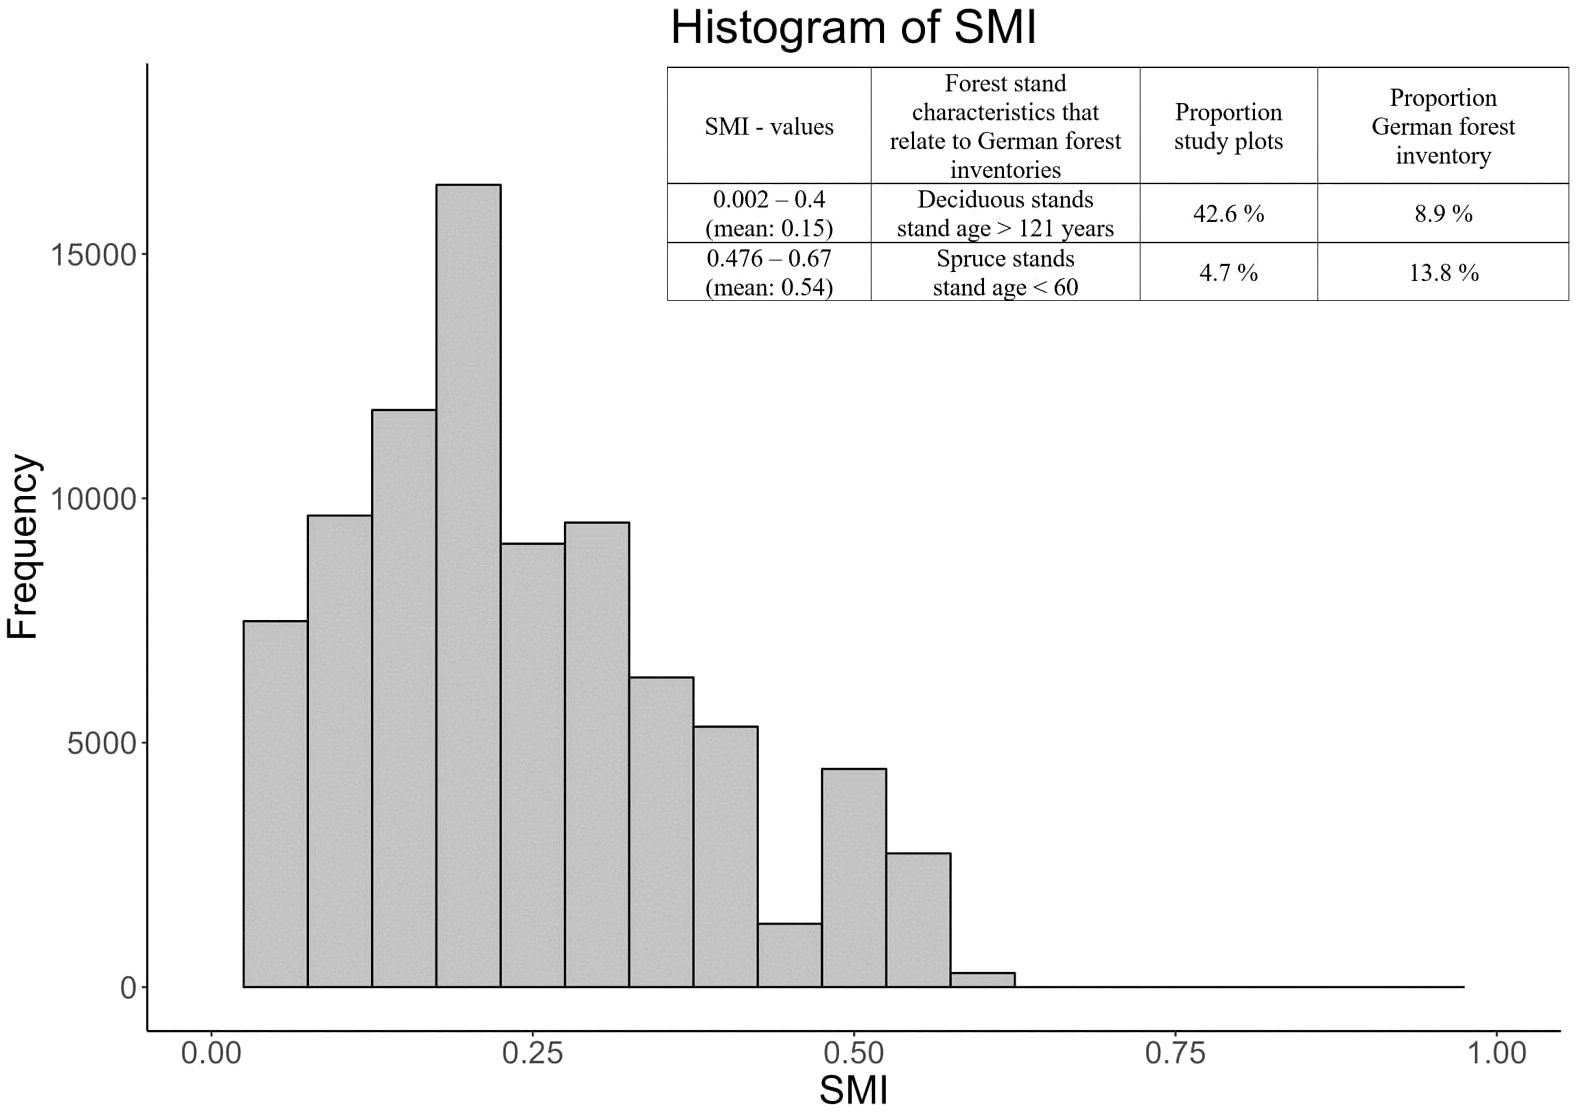
Figure 1. Histogram of silvicultural management intensity index (SMI) across the three regions. Minimum SMI: 0.002, 1st quartile: 0.130, median: 0.210, 3rd quartile: 0.318, maximum: 0.602. The integrated table highlights differences in the proportion of intensively and extensively managed forests between the study plots and forest stands at the national level (BMEL, 2014).
2.4 Forest features
Biodiversity in general and birds in particular benefit greatly from habitat heterogeneity and tree species diversity (e.g. MacArthur and MacArthur, 1961; Boecklen, 1986; Penone et al., 2019; Ampoorter et al., 2020; Heidrich et al., 2020; Basile et al., 2021). Therefore, we chose two properties that are related to horizontal and vertical structural heterogeneity, the standard deviation of the diameter at breast height (DBHsd) and the effective number of layers (ENL). In addition, we included tree species diversity to test our hypothesis. DBHsd and tree species diversity were based on the forest inventory carried out on the study plots from 2008 to 2010 (see data availability statement). All trees with a diameter ≥ 7 cm were included in the inventory. Tree species diversity was calculated as the Shannon diversity based on the number of individuals per species. The effective number of layers (ENL), was determined by terrestrial laser scanning (TLS) in 2014 (Ehbrecht et al., 2016). The index quantifies vertical stand structure by applying the inverse Simpson-Index to the vertical distribution of points in 3D space. Index values increase with increasing stand height and a more even occupation of 3D space by foliage, branches, and stems along the vertical axis (Ehbrecht et al., 2016).
2.5 Bird species richness and abundance
Birds were surveyed by standardized audiovisual 5-minute point counts, including all individuals seen or heard within the 100 m x 100 m study plots (Wells et al., 2012; Renner et al., 2014). Each site was surveyed five times per year, between 2008 and 2012. The surveys took place during the main breeding season (March 15 to June 15), in the period between sunrise and 11:00 am. The sequence in which sites were visited was randomized. Relative abundance of the species per plot and year was calculated as the maximum number of individuals counted per species (Renner et al., 2014). Bird species richness for each site was computed by averaging the number of species observed per plot over the five survey years. Unfortunately, bird count data were not available for the years 2013-2016. By averaging the counts over five consecutive years, we aimed to smooth over temporal fluctuations and obtain a representative measure of the spatial variation in bird species richness across plots (Holmes et al., 1986). We acknowledge that this is not ideal and would weaken the relationship between acoustic indices and bird richness and abundance, as this average is only a proxy for actual richness and abundance in the year recorded. Nevertheless, we consider this proxy to be appropriate, as forest management did not change significantly over this period per plot, as the amount of biomass harvested per plot showed no temporal trend (Supplementary Figures S13, S14).
2.6 Statistical analysis
To model diurnal patterns of the acoustic diversity index (ADI) for different months, we fitted generalized additive mixed models (GAMMs) with a beta distribution to our acoustic dataset, using the “bam”-function within the mgcv-package 1.8-42 (Wood, 2017). As our study focus was to analyze the effect of day time and month on the acoustic diversity index (and not the effect of weather and temperature) we aggregated data into median ADI values per diurnal time period (00:00, 00:10, 00:20 …) across a whole month for each plot (Bradfer-Lawrence et al., 2023). For the GAMMs, the ADI median values were standardized to values between one and zero in order to meet the model assumptions and correctly fit a beta error- distribution family (“betar”) with a “logit” link-function. To account for spatial autocorrelation, we added research plot coordinates as an additional smooth term and region as a random factor (see Tables 2, 3 for model specifications).

Table 2. Model specifications and output for GAMM model excluding SMI.
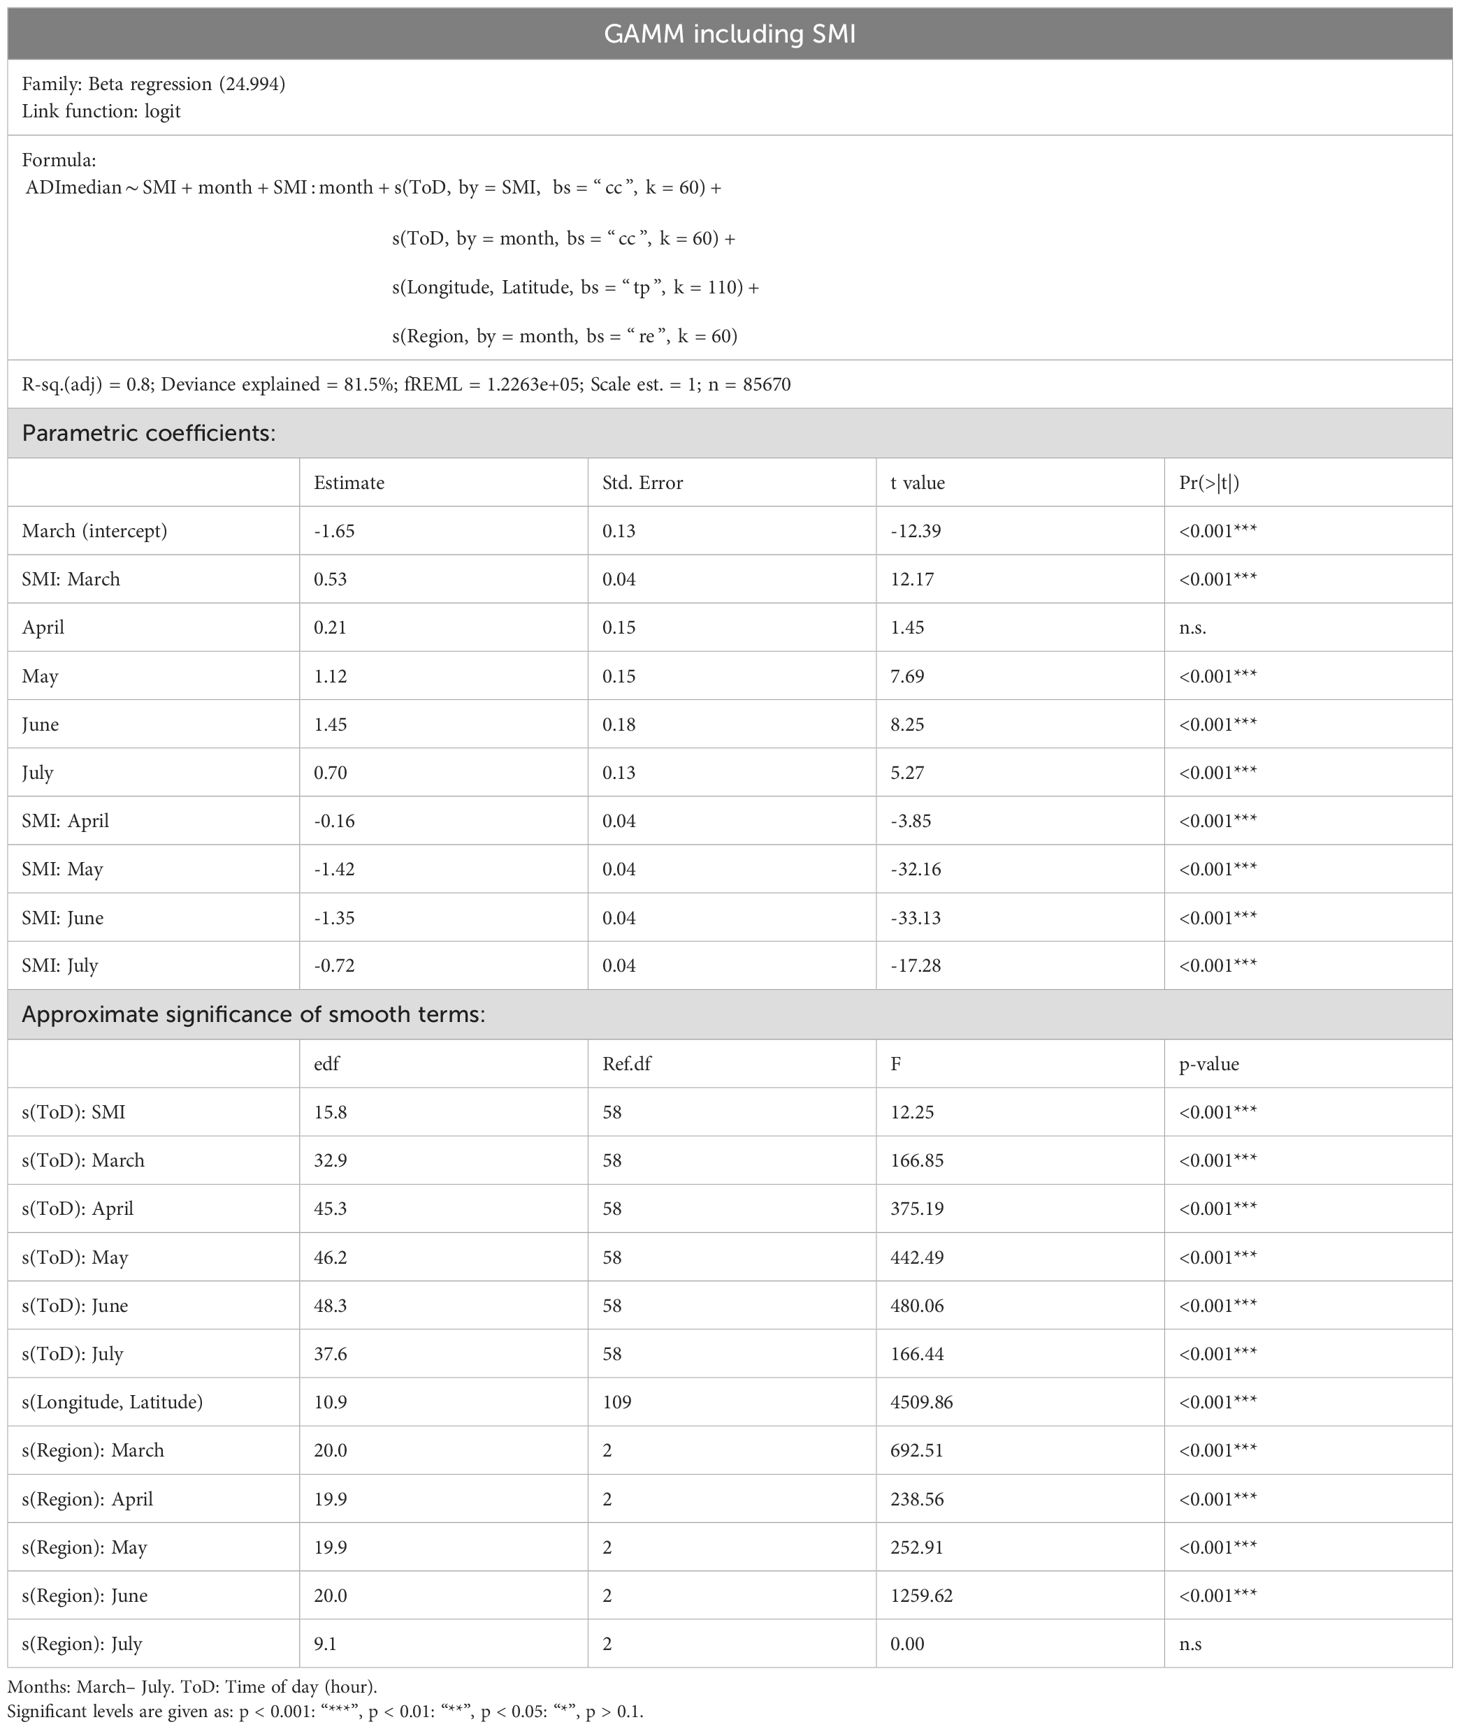
Table 3. Model specifications and output for GAMM model including SMI.
We formulated a model using a smoothed nonlinear spline for time of day (ToD) grouped by month to account for diurnal and monthly patterns in the acoustic dataset. To test how much additional deviance in ADI among the study plots would be explained by the silvicultural management index (SMI), we compared the deviance explained from models including only temporal parameters (time of day and month) to a model that also included SMI. Thus, we extended the purely temporal models by including month, SMI and their interaction as non-smooth parameters. We also added SMI as a grouping factor to the smoothed nonlinear spline for ToD and month. We then stepwise simplified the models, using AIC model selection approaches, until the SMI component was excluded from the final model to compare how much deviance was explained by SMI. All models were checked graphically using the “gam.check”-function (mgcv-package 1.8-42; Wood, 2017). Results graphs were produced using the “plot_smooth”-function from the itsadug-package (version 2.4.1., van Rij et al., 2022).
To test the hypothesized cascading links between SMI, forest structural features, tree species diversity, and bird species richness and abundance on ADI we applied a structural equation modeling (SEM) approach. Structural equation modeling is a multivariate statistical method that allows for hypothesis testing of complex networks of relationships (e.g. Grace et al., 2010), identifying direct and indirect drivers. To test our hypothesis that increasing silvicultural management intensity causes a decrease in acoustic diversity, we built a priori structural equation models, based on our conceptual model (Figure 2). We run separate models for the four different daytime periods (dawn, day, dusk, and night) and the five months from March to July, hypothesizing that the strength of the effects of forest management, forest features, tree species diversity, as well as bird species richness and abundance on acoustic diversity would change through the day phases and spring season. We expected lower values for the standardized coefficients between bird species richness, bird abundance and acoustic diversity at night, when few birds are active and lower values in July when the acoustic activity of birds eventually declines as the breeding season comes to an end.
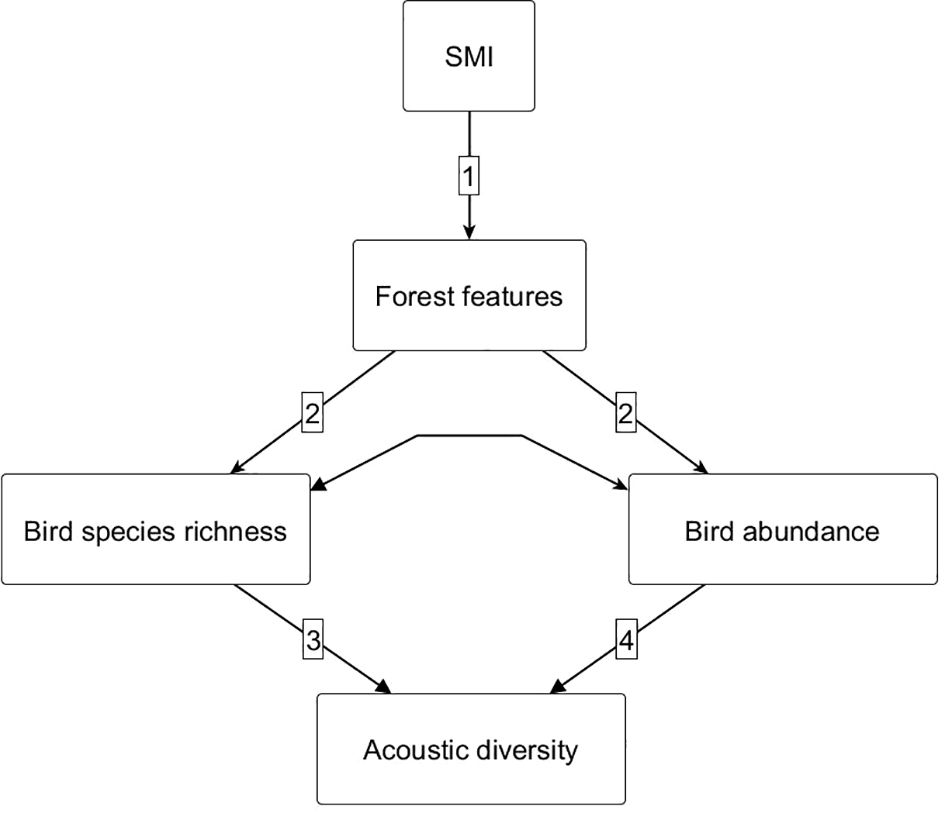
Figure 2. The hypothesized conceptual framework, assuming that silvicultural management intensity indirectly affects acoustic diversity via its effects on forest features and bird species richness and abundance. (1) Direct effect of silvicultural management intensity (SMI) on forest features. (2) Direct effect of forest features on birds. (3) Direct effect of birds on acoustic diversity.
We first tested and refined our conceptual model using mean ADI values (not standardized) for the month of May, covering the period from dawn to dusk. The SMI was included as a direct driver of forest features and tree species diversity (path 1, Figure 2). Forest features and tree species diversity were included as direct drivers for mean bird species richness and abundance (years 2008 – 2012, path 2, Figure 2). In other words, we tested how forest management intensity and forest features affected the average number of bird species and their abundance present on these plots over several years and hypothesized a direct link to acoustic diversity (path 3, Figure 2). Correlation among bird species richness and abundance (double headed arrows) was added to the a priori model. After applying this predefined model, we tested for missing relationships among our variables (i.e. linkages or paths), using the modification indices (“modindices”) function and considered every suggestion with a value >2, before proceeding (Grace, 2006). As a result, we included silvicultural management intensity as a direct driver for bird species richness and abundance, as well as acoustic diversity. We added a missing path only if a causal relationship was biologically valid, e.g. we ignored the biologically absurd option that acoustic diversity had a causal effect on tree species diversity. Once the final model was defined, it was applied to all subsequent time periods.
Models were run using the software package lavaan in R (Rosseel, 2012). The function fits models using maximum likelihood based on observed and expected covariance matrices. The model fit is estimated as the overall model p-value which indicates whether the two covariance matrices are significantly different from each other (p < 0.05, poor model fit) or not (p > 0.05, good model fit). In order to assess which of the variables (bird species richness, bird abundance, forest features, or SMI) had the highest total effect on acoustic diversity at different time periods the standardized path coefficients within each possible pathway between the respective variable and the acoustic variable were multiplied and all resulting products were summed (Grace, 2006, Table 1). Prior to the SEM analysis we calculated linear models with ‘exploratory region’ as an explanatory factor for all variables, and used the residuals from this model as input variables in the SEM. The variables were scaled, i.e. divided by 10, to ensure that all variables were within the same numerical range. The tree species diversity variable was log transformed to meet the model assumptions. All statistical analyses were performed in R 4.3.1 (R Core Team, 2023).
3 Results
3.1 Forest management impacts on temporal patterns of the acoustic diversity index
In all months, the diurnal patterns of the ADI exhibited distinct peaks around dawn and dusk (Figure 3). The dawn peak was always higher than the dusk peak. The peaks gradually shifted with the changing times of sunrise and sunset in spring and early summer. Clear minima of ADI appeared in the afternoon. From March to June, this was roughly around 15:00 and thus seemed to be independent of daylength. In July, however, this minimum shifted towards the early evening (~19:00, Figure 3). The highest average ADI values were observed in June. Noticeable, the seasonal increase in ADI from March to June was not only observed at dawn and dusk, but also during daylight hours. Finally, in June and July, values during daylight hours were almost as high as the dawn and dusk values. In July, the ADI decreased again and the peaks at dawn and dusk were less pronounced, but still noticeable. After sunset, however, acoustic activity declined more slowly in July than in the previous months.
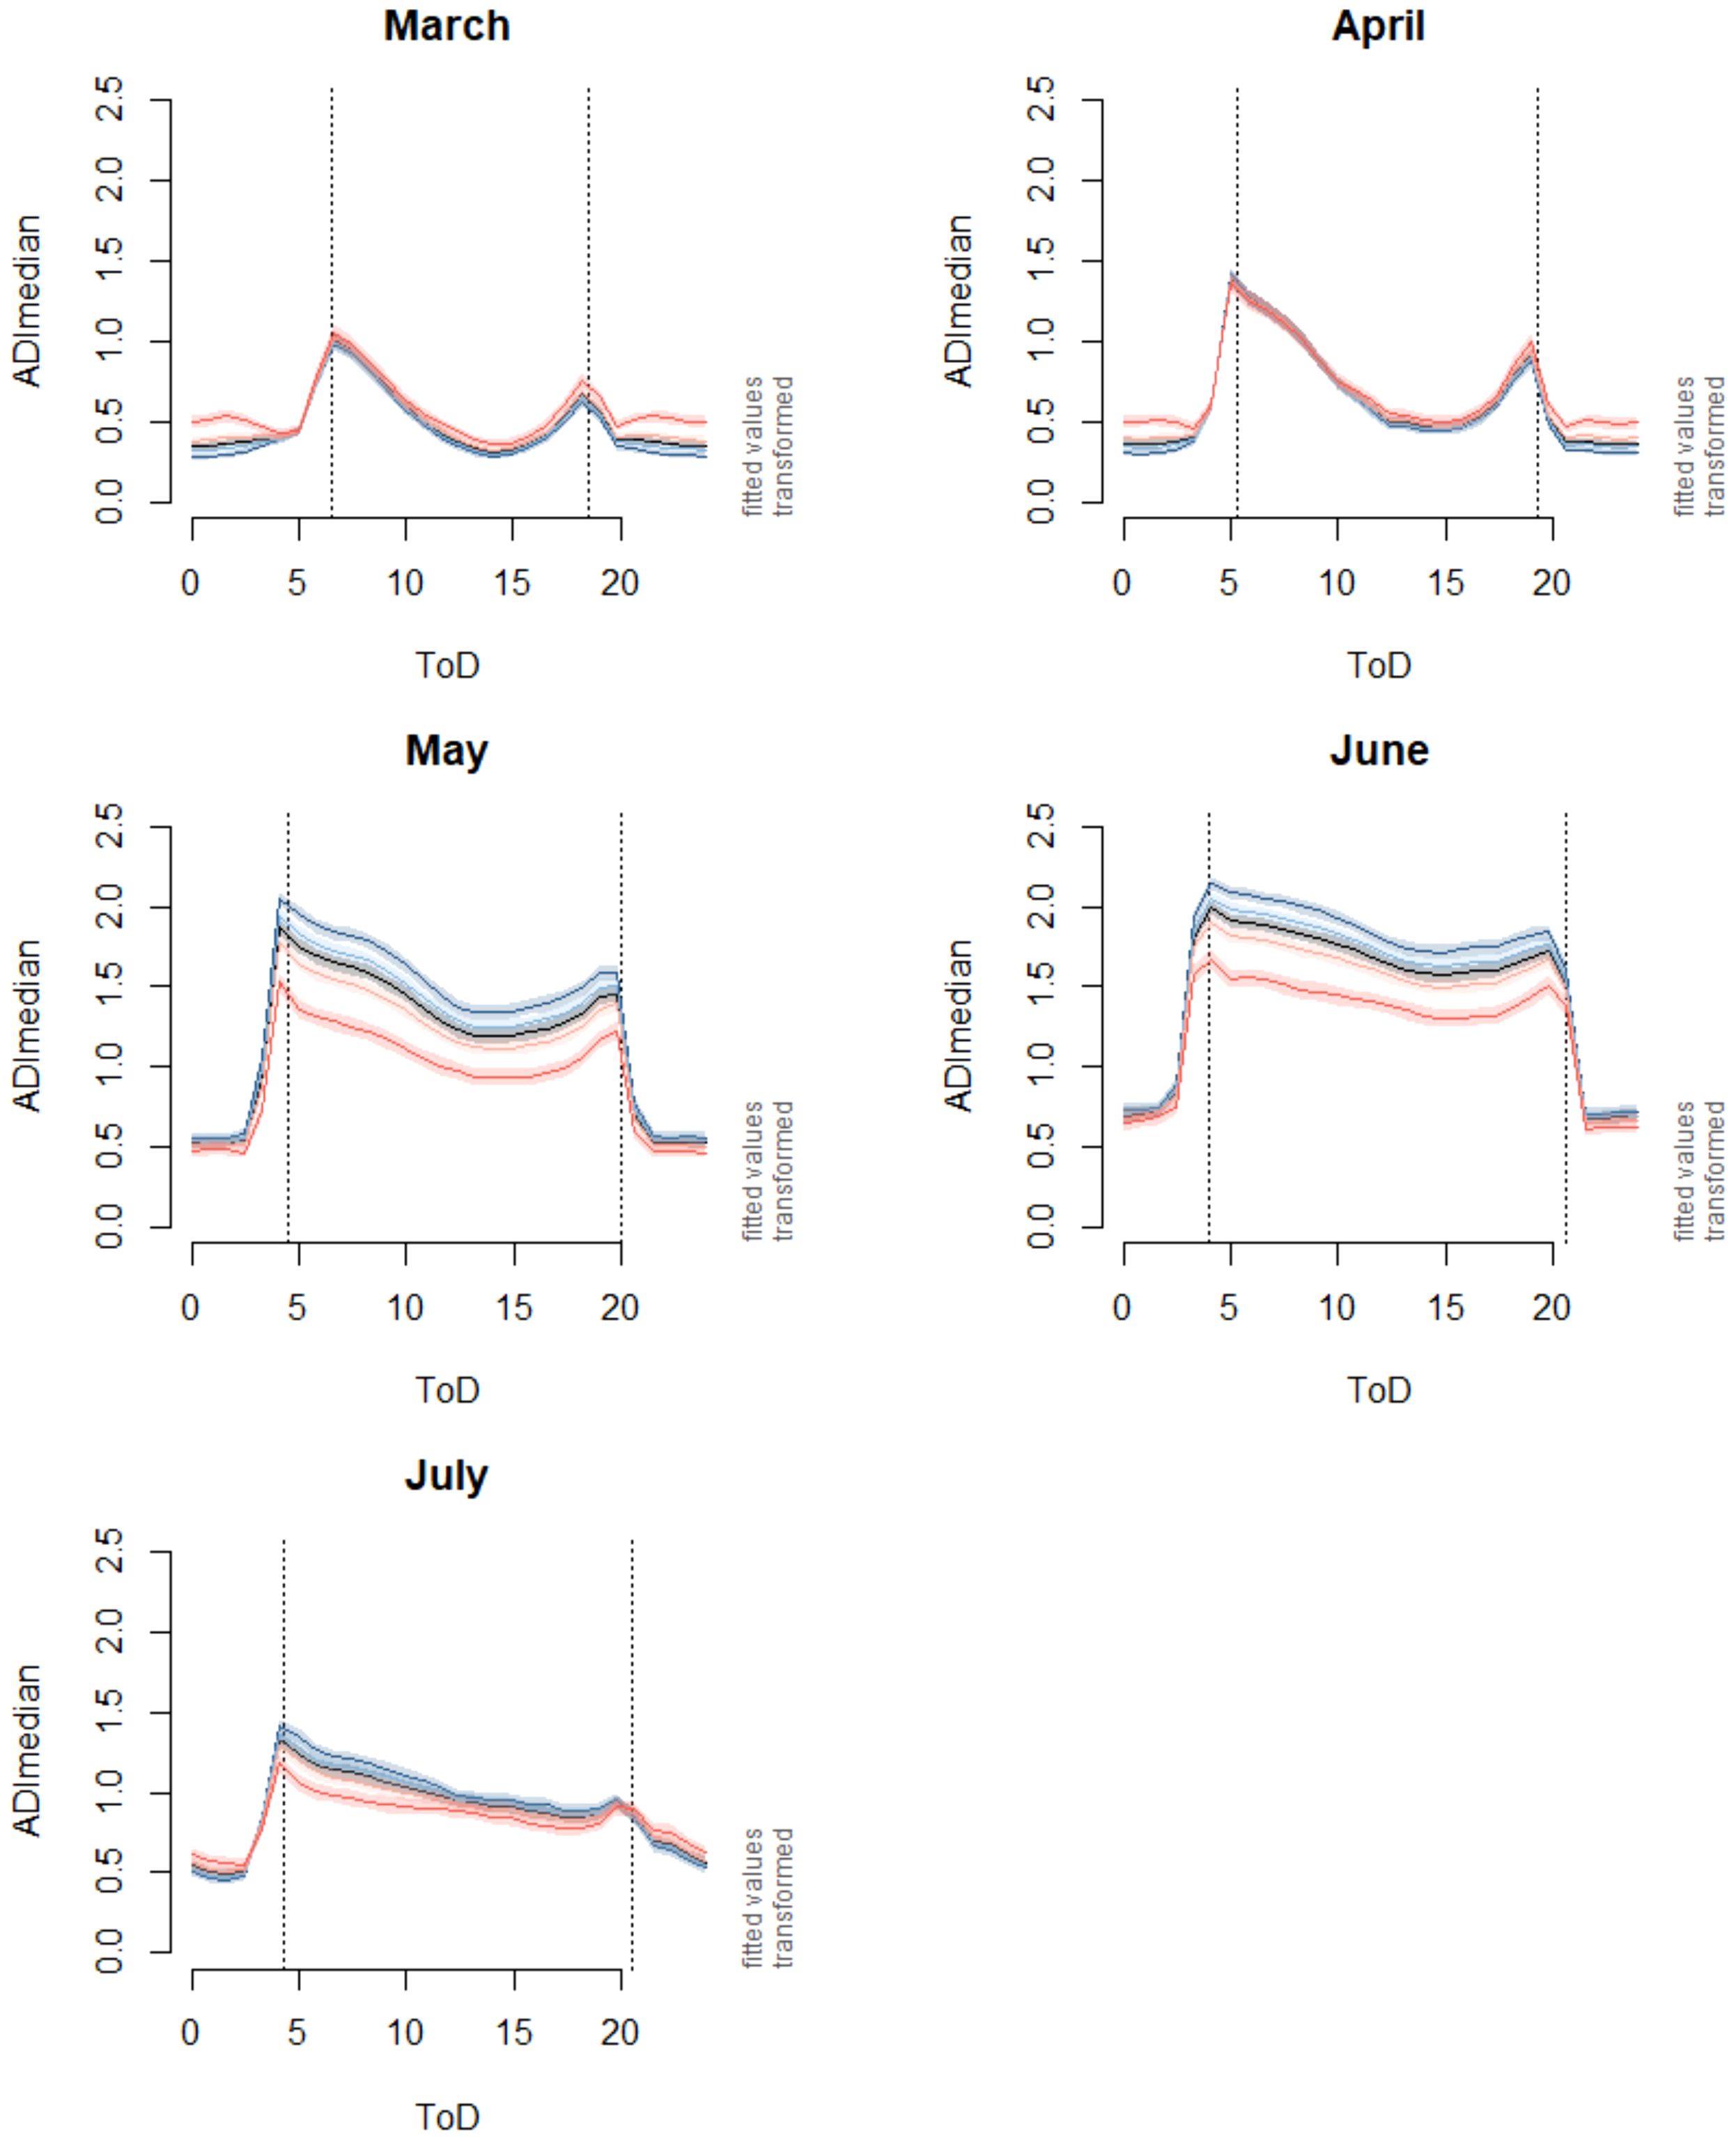
Figure 3. Fitted effects on diurnal and monthly ADI patterns and the influence of SMI (silvicultural management intensity), based on model 1 (Table 3), using “exploration region” as a random factor. Values for this graph were fitted using the Hainich-Dün region as an example. Dark blue line: fitted values for the minimum of the SMI distribution (0.002), light blue line: 1st quartile of the SMI distribution (0.13), light red line: 3rd quartile of the SMI distribution (0.32), and dark red line: maximum of the SMI distribution (0.6). ToD: Time of the day. Vertical lines show the times of sunrise and sunset on the 15th of each month in the Hainich-Dün region (central region).
Overall, the factors “month” and “time of the day” explained most of the deviance (80.8%, Table 2). The SMI turned out to be a highly significant factor in our model (s(ToD: SMI): edf: 15.8, Ref.df: 58, F: 12.5, p-value < 0.001 ***, Table 3). The interaction with the factor “month” (SMI: month, in Table 3) was also significant. The effect of SMI was strongest in May and June (cf. Figure 3). While the more complex model including SMI was justified on the basis of model selection methods using the AIC (ΔAIC of the full model versus the model without SMI: 288.4), the inclusion of SMI only explained an additional 0.7% of the deviation [deviance explained including SMI (Table 3): 81.5%, excluding SMI: 80.8% (Table 2)]. Comparing ADI values for the highest silvicultural management intensities with values for the lowest intensities (dark red and dark blue lines in Figure 3), we observed strong effects of SMI on ADI in May and June from dawn to dusk. However, when the gradient in SMI was less pronounced (comparing 1st and 3rd quartile SMI values, light red and blue values in Figure 3), the effects on ADI were marginal.
3.2 Drivers of the acoustic diversity index
ADI-values during daylight hours in May were directly driven by plot-level relative bird abundance (Figure 4). Note that bird species richness and abundance were highly correlated among our study plots, so the effects of the two cannot be clearly separated. We tested two alternative models, including bird species richness (mean across 2008-2012) and bird abundance (mean across 2008-2012) separately (Supplementary Figures S9, S10). Both models explained a similar amount of variance in ADI, and model fit was comparable. Standardized coefficients of bird abundance on ADI were about twice as high as for bird species richness. As expected, bird species richness and abundance increased with increasing horizontal and vertical structural heterogeneity (DBHsd and ENL) and tree species diversity (Tree-SH). Forest structural features (DBHsd and ENL) in turn decreased with increasing silvicultural management index (SMI). However, no effect of SMI could be found for tree species diversity. Looking at the relationships between the different SEM parameters per region, we found that for the Hainich-Dün region, tree diversity increased with increasing forest management intensity, while for the other regions the trend was slightly negative or neutral, resulting in an overall neutral and nonsignificant trend (Supplementary Figures S11, S12).
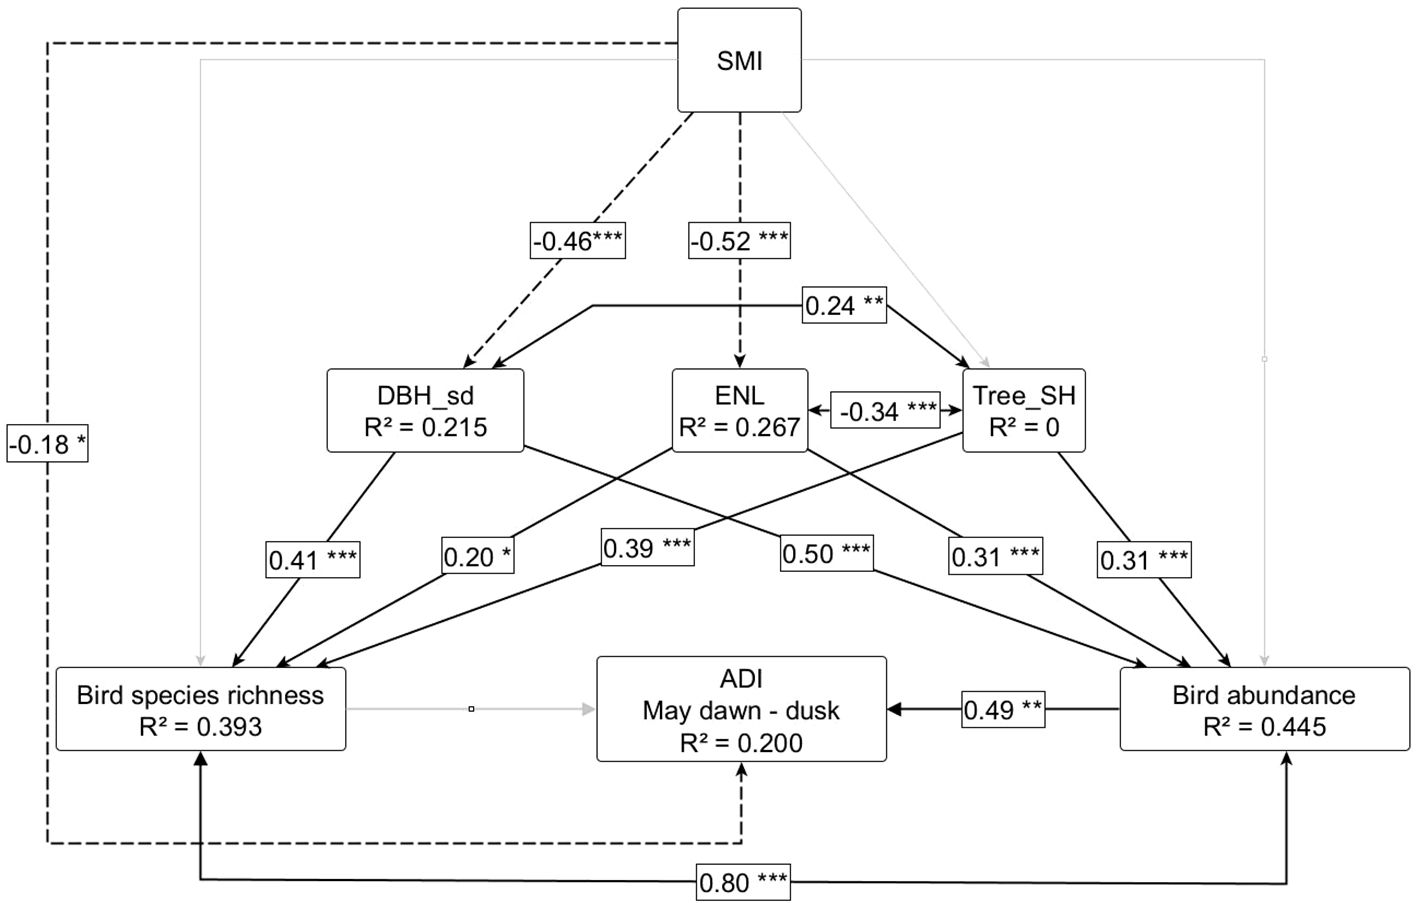
Figure 4. Structural equation model for direct effects of bird species richness and abundance (mean across 2008 – 2012), as well as indirect effects of silvicultural management intensities (SMI) and forest features on acoustic diversity index (ADI). Standardized coefficients are shown. Black lines represent significant relationships (p < 0.05) and trends (p < 0.1). Significant levels are given as: p < 0.001: “***”, p < 0.01: “**”, p < 0.05: “*”, p > 0.1: “.”. Solid lines represent positive relationships and dashed lines represent negative relationships. Grey solid lines represent hypothesized relationships that were included in the final model but were not significant. The double-headed arrows represent significant correlation among variables. Model fit: Chi-square: 5.001, p-value (Chi-square): 0.209, p-value RMSEA <= 0.05: 0.331, number of observations: 109.
Thus, increasing silvicultural management intensity had a negative effect on ADI values from dawn till dusk in May, indirectly via negative effects on forest structural features and on bird species richness and abundance. Table 1 summarizes the total standardized effects of each factor on the acoustic diversity index (ADI) during the different time periods. Bird species abundance is the strongest driver of ADI across all time periods, but particularly during time periods when birds are known to be most active (mean values from April till June from dawn till dusk; cf. Table 1). SMI was the second most important factor. Overall, the explanatory power of the models was low. The strongest relationship among bird abundance and the ADI was found for daylight hours in May, i.e. the period in which most of the variance was explained by the model (standardized coefficient = 0.6, R² = 0.271).
4 Discussion
4.1 Temporal dynamics of acoustic diversity index
The SEM analysis confirmed that birds were the principal driver of ADI patterns. When analyzed separately, both bird species richness and abundance were related to acoustic diversity (Supplementary Figures S9, S10), but the standardized coefficient for the relationship between bird richness and ADI was considerably smaller and of marginal significance (p = 0.067) compared to the bird abundance-ADI relationship. In the joint model (Figure 4), only bird abundance was significant. Both variables are correlated in our study and are only proxies for the actual bird community in the year of the acoustic survey (see methods chapter 2.5 and further discussion in chapter 4.2). Nevertheless, we expect our results to provide some initial useful insights into the true underlying relationships between bird species diversity and acoustic diversity, as both bird abundance and species richness are likely to affect acoustic diversity. If more bird individuals of the same species are present in an area, the acoustic activity increases as, on average, more individuals vocalize closer to an audio sensor, and presumably acoustic activity also increases in response to increased niche exploitation and competition for food, mating, and nesting sites. In addition, the more species are present, the more diverse the acoustic diversity should be, as a broader spectrum of species-specific sound repertoires is recorded. Bird abundance is an often overlooked driver of acoustic diversity patterns (Alcocer et al., 2022) and the appropriate assessment of bird abundance is not trivial. Future studies could test our assumptions by combining point-count and acoustic methods (e.g. Doser et al., 2021) and experimentally disentangling the effects of bird species richness and abundance on the resulting effects on vocal behavior and acoustic diversity patterns.
ADI values increased from March to June and then decreased in July, when the nesting and singing activities of most birds ceased (Catchpole and Slater, 2018). Thus, the temporal patterns of the acoustic diversity index followed known diurnal and seasonal vocal activity patterns of Central European forest birds in spring. In July, related to the onset of orthopteran stridulation activity in July, the decrease in ADI values after sunset was lower (Supplementary Figures S3, S4). A similar pattern was found in another study that analyzed acoustic phenology over a complete year in a French subalpine spruce forest, where the acoustic activity of animals also increased from March till June (Grinfeder et al., 2022). However, in contrast to our study, the bioacoustic activity at the latter site remained at a high level until August before slowly decreasing. It is known that the start of the breeding season is delayed in montane bird populations compared to the same species living at lower altitudes (see species accounts in Südbeck et al., 2005; Boyle et al., 2016; Bründl et al., 2020). This could have led to an extension of singing activities to the summer months. In addition, a recent study in the western Italian Alps has shown that the highest bird diversity and abundance was recorded during the early post-breeding period at the end of August, when migratory birds use the montane habitats to rest and refuel, while the local breeding species are still on their territories (Alba et al., 2023). It is unclear to what extent resting migrant birds and other animal groups, such as orthopterans and terrestrial mammals, also contributed to the soundscapes in the French subalpine forest. However, in general terms the differences between the acoustic activity patterns reported by Grinfeder et al. (2022) and in our study are not unexpected.
In the following, we discuss the monthly acoustic activity patterns in detail, as they are shaped by three different, partly overlapping phases of the breeding season.
(1) In March and April, resident and early arriving migrant birds start to delimitate their territories by intensively singing at dawn, and to a lesser extent, also at dusk. However, the acoustic activity rapidly decreases during late morning hours and reaches a low point in the afternoon hours. Several studies have shown, both conceptually and through field work, that for selected species there is a trade-off between time invested in singing and time spent foraging (McNamara et al., 1987; Thomas, 1999; Thomas and Cuthill, 2002; Thomas et al., 2003; Manica et al., 2014). This is because birds need to build up enough energy reserves during the day to survive the nights. As the nights are long and cold in early spring, the birds’ energy levels may not allow them to sing intensively during the short daylight periods.
(2) As spring progresses, the number of bird species and individuals contributing to the local soundscape increases until around the summer solstice in June, while late long-distance migrants arrive and some resident and early arriving migrant species start multiple breeding attempts. This is likely to increase competition for acoustic space at dawn and lead to greater pressure to spread the acoustic activity throughout the day (Staniewicz et al., 2023). At the same time, nights are getting shorter and less cold, so the ratio between time spent foraging and singing could shift in favor of singing during daylight periods (McNamara et al., 1987). As a result, the decline in the ADI during late morning hours in May and June is much less pronounced than in early spring. However, it is doubtful whether the temporal shift in singing activity alone can conclusively explain the fact that the highest average ADI values were observed in June.
(3) To fully explain the ADI patterns, it must be considered that in May, June, and July, other vocalization types besides birdsong gain in importance: begging calls of nestlings and post-fledged juveniles, alarm calls of adults defending their young, and contact calls of foraging family groups. Particularly, fledglings call incessantly to attract the attention of the adults. We are not aware of any study that specifically analyzed the calling rates of fledglings. The literature on begging calls is confined to nestlings (e.g. Neuenschwander et al., 2003) and publications confirming that post-fledging begging calls influence the territory-selection strategy of conspecifics, underlining their ecological importance as a temporal component of the soundscape (Arlt and Pärt, 2008; Kelly and Schmidt, 2017). There are several studies on parental defense behavior, which generally show that the alarm-call rate in songbirds increases with the age of the nestlings and directly after fledging (Halupka, 1999; Pavel, 2006; Strnadová et al., 2018). During this period, adults vigorously try to defend their offspring against potential predators, which are attracted by the conspicuous food-solicitation behavior of the young. Once the fledglings get stronger and their wings sufficiently-well developed, family groups move greater distances, emitting a wide spectrum of calls. However, for this phase there is only indirect evidence provided by radio-telemetry studies on nine North American songbirds (Jones et al., 2018; Jones and Ward, 2022), showing that all species exhibited a steady increase in movements with post-fledging age, with activity rates levelling off roughly 3 to 4 weeks after fledging, when family groups presumably dissolve. Conclusively, as most juveniles of forest-dwelling species fledge in May and June (cf. Südbeck et al., 2005), the post-fledging phase is of crucial importance for understanding acoustic activity patterns in late spring, particularly the ADI maximum in June, when begging, contact, and alarm calls become a dominant component of the soundscape, while territorial songs of adult birds presumably become less important.
We emphasize that the second and third phase of the breeding season cannot be separated on the basis of monthly ADI patterns alone. This is due to the staggered start of the breeding cycles and the variable durations of the incubation and nestling phase in different species and pairs of the same species. Furthermore, several studies have demonstrated that multi-brooded species changed the size or location of their territories during spring when the food supply and habitat characteristics changed (Brambilla and Rubolini, 2009; McClure and Hill, 2012; Williams and Boyle, 2017; Ceresa et al., 2020). Future analyses could confirm our interpretations by quantifying species-level vocal activity patterns and distinguishing between songs and calls, e.g. by using improved AI-based species-recognition algorithms.
4.2 Cascading effects of forest management on the temporal dynamics of acoustic diversity index
To our knowledge, this is the first study that shows how land use management intensities (indirectly) affects acoustic diversity in temperate forests (but see Burivalova et al., 2018, 2021 for tropical forests; Müller et al., 2022 for temperate grasslands). The intensity of silvicultural management had significant effects on the diurnal ADI patterns in May and June, resulting in ADI values for plots with high SMI values being much lower throughout the day than for extensively managed plots. However, according to the GAMM analysis, SMI explained only a small additional variance in the data. Within a range of SMI values covering the majority of the study plots (see Figure 1), there were only marginal differences between these stands (Figure 3). Substantial differences in ADI values were only found when comparing the highest and lowest forest management intensities. Therefore, the overall reduction in ADI due to forest management impacts in regional landscapes is comparatively small (cf. Le Provost et al., 2023). At the national level, a higher proportion of stands with high management intensities would potentially lead to a greater overall decline in acoustic diversity in the corresponding landscapes (cf. Figure 1, BMEL, 2014). The decrease in ADI from the lowest management intensity to the highest management intensity is comparable to the decrease in ADI values observed from dawn to late afternoon, i.e. the diurnal maximum and minimum of ADI (ΔADI ~0.5, cf. Figure 3). As acoustic indices haven been shown to be well related to the biodiversity perceived by people (Rozario et al., 2024b), such a loss of acoustic diversity could severely reduce the recreational value of landscapes (Ratcliffe et al., 2013; Ferraro et al., 2020; Le Provost et al., 2023; Rozario et al., 2024a). Thus, while forests in general promote human health and well-being (Cheng et al., 2021; Stier-Jarmer et al., 2021; Gillerot et al., 2024; Rozario et al., 2024a), extensively managed forests have a greater potential to achieve this goal through the positive effects of their increased biodiversity (Ratcliffe et al., 2013; Marselle et al., 2021; Methorst et al., 2021; Rozario et al., 2024a). This suggests that managing for greater tree species diversity and structural diversity not only enhances resilience and multifunctionality (Messier et al., 2022; Seidel and Ammer, 2023), but also provides recreational benefits.
To date, we know very little about when the effects of land use on biodiversity are strongest and most detectable in acoustic patterns. In the SEM analysis, the amount of variance explained varied greatly between time periods, as might be expected given the seasonality in bird song. In section 4.1 we already provided important arguments why the difference in ADI values between intensively managed and extensively managed forests was higher during daytime periods than around dawn and dusk. Accordingly, the explained variance in the SEM analysis was highest in May and June during daylight hours, not at dawn and dusk. The only other studies we are aware of that tested land-use effects on diurnal patterns of acoustic activity are from the tropics (Burivalova et al., 2018, 2022). In contrast to our results from temperate forests, the authors reported the strongest effects at dawn, the peak of bird song activity. At other times of the day, these tropical forests were acoustically dominated by insects, either cicadas, which sing in the midday heat, or orthopterans, which are also active during the night. Interestingly, another study from the tropics found that the acoustic activity of birds shifted from dawn to later in the day in response to silvicultural management activities (Campos-Cerqueira et al., 2020). Therefore, to understand how land use affects acoustic dynamics, it is important to examine and quantify the temporal and compositional patterns of acoustic activity over the whole diurnal cycle and season. Other authors (i.a. Bradfer-Lawrence et al., 2023) have previously addressed these aspects, to which we have now contributed more empirical evidence. Future studies should focus on establishing a solid empirical basis for soundscape dynamics across a wide range of habitat types and land-use scenarios - aspects that would also lead to improved experimental design, timing and duration of data collection, and data aggregation.
All structural features and tree species diversity had positive effects on bird species richness and abundance. In our case the effects of horizontal structural heterogeneity (DBHsd) were stronger than the effects of vertical heterogeneity (ENL) and tree diversity. Several studies have emphasized the importance of multi-layered forests for bird species richness, with a high degree of heterogeneity in the vertical structure, age distribution, and tree composition having a particularly positive effect (Tomiałojć and Wesołowski, 2004; Wells et al., 2011; Schulze et al., 2019; Basile et al., 2021). Our results also demonstrated the importance of horizontal heterogeneity within forest stands for biodiversity, which is consistent with findings from Heidrich et al. (2020). By contrast, a study by Shaw et al. (2024) showed that the acoustic index NDSI was negatively correlated with DBHsd, while also being positively correlated with bird species richness. In their case DBHsd was negatively correlated with tree species diversity, whereas in our study the correlation was positive. Apparently, the effects of local forest management practices shape the structural characteristics of the forest and the tree species composition in many ways, which also affects the acoustic communities of forest-dwelling animals and ultimately the acoustic diversity. Thus, the low explanatory power of SMI in our models may be partly due to the fact that we describe the general effect of forest management across different regions and forest types, rather than studying one specific management situation. Actually, the same forest management intensity. i. e. the density component of the SMI can have different effects on stand structure, depending on the forest type. For a detailed analysis on how regional specific management affected bird communities in the study regions see Jung et al. (2024).
Effects of SMI on ADI were both direct and indirect. Ostertag (2015) and Weyhermüller (2015) studied the effect of forest management gradients and tree density on sound attenuation in two of the three regions (Hainich-Dün and Swabian Alb). Both studies confirmed that sound attenuation depended on frequency interacting with stem density and leaf density. Since these effects were small and only relevant for frequencies above 10 kHz and accounting for the large variation in attenuation that would result from daily variations in background noise and weather conditions, we assume these differences to be negligible (cf. Shaw et al., 2021; Haupert et al., 2022). Thus, we also do not consider it likely that differences in detection ranges among plots, e.g. caused by varying structural density, would explain the additional direct effect of forest management. Instead, we suggest the following rationale. In our analyses, we examined the influence of forest management intensity on structural properties and how this affected the mean bird species richness and abundance in the period 2008-2012. The average value of bird richness and abundance over several years describes the “potential” for bird species richness and abundance of the plots under the given forest management and stand characteristics. Since the forest management per plot did not change during the period 2008-2016 (see Supplementary Figure S13), we assumed that this value is a good proxy for the actual bird species richness and abundance in 2016. As this value averages out interannual variation, this partly explains the strong correlation between bird metrics and forest structure and tree diversity on the one hand, and the comparatively low explanatory power of our bird metrics for acoustic diversity on the other.
Beyond this, other factors could come into play that lead to changes in the acoustic activity of birds that are independent of changes in bird species richness and abundance. For example, if reduced forest management intensity leads to an increase in food resources, this could in turn improve the fitness of birds and thus lead to higher levels of vocal activity (McNamara et al., 1987; Thomas, 1999; Ceresa et al., 2020). It could also affect the microclimate (temperature and humidity), which was also shown to influence vocal behavior (Slagsvold, 1977; Liao et al., 2018; Puswal et al., 2021). A shift in bird species composition towards a higher proportion of species with acoustically diverse repertoires of songs and calls could be another reason. Finally, also the presence of another soniferous animal group, such as insects and amphibians, or even sound sources related to forest management could drive these patterns. To get a better understanding of the composition of the soundscapes, we actively listened to a subsample of recordings for each time period and region. Averaged over all months and time periods, the three regions showed a similar soundscape composition (Supplementary Figure S2), with bird vocalizations being the predominant component of the soundscapes (> 50% in the period from dawn to dusk). However, when looking at different periods of the day and month separately, differences between regions could be observed (Supplementary Figures S3, S4).
5 Conclusion
We have shown that acoustic indices - ADI in our case - can reveal valuable insights into the temporal dynamics of the biophony. Our results show that acoustic diversity decreases with increasing intensity of forest management. However, the relationships are weak and, as we discuss, the observed changes in acoustic diversity patterns may also be related to shifts in species’ vocal behavior and community composition, making interpretation challenging. Thus, while acoustic indices can be adapted to effectively describe vocalization patterns of soniferous fauna, the association with changes in species richness is often weak or moderate. Nevertheless, we consider acoustic indices to be a useful tool to support the up-scaling of biodiversity monitoring efforts to national and continental scales while maintaining fine-grained temporal resolution. Changes in acoustic diversity are not only related to changes in biodiversity and ecosystem functions (communication), they can also be interpreted as an ecosystem service, as other studies have shown a strong relationship between acoustic diversity and perceived biodiversity, and through this pathway a link to human well-being. Depending on monitoring goals, acoustic indices are best used in conjunction with other tools to directly assess effects on species composition. For example, improved AI models for species-level sound detection could provide more detailed insights into these dynamics.
Our analysis highlighted the importance of a comprehensive account of the natural history aspects of soundscape composition and dynamics. This is because the effects of environmental factors on the soundscape are non-linear and vary over time. A sound understanding and quantification of phenological patterns and their drivers will provide an essential basis for further ecological research. To that end empirical studies of soundscape composition and dynamics can provide important insights into the habitat use, behavior, and interactions of the acoustic community.
In summary, our analysis highlights the nuanced relationship between land use and acoustic diversity. Acoustic indices can support existing monitoring schemes by extending their spatial and temporal scales. They broaden the perspective on relevant ecological questions and offer the possibility to track acoustic activity patterns of birds in relation to habitat changes and over multiple time scales. Understanding the cascading effects of forest management on acoustic patterns can support management decisions that balance ecological and recreational benefits, thereby supporting multifunctionality in forests.
Data availability statement
The datasets presented in this study can be found in the BExIS repository (https://www.bexis.uni-jena.de/). Accession numbers: 17746 (SMI - silvicultural management index); 17687 (forest stand structure and composition); 27826 (effective number of layers); 21446, 21447, 21448, 21449, 24690 (bird survey data); 27568, 27569, 27570 (acoustic diversity index).
Author contributions
SM: Conceptualization, Data curation, Formal analysis, Investigation, Methodology, Project administration, Visualization, Writing – original draft, Writing – review & editing, Validation. OJ: Writing – review & editing. KJ: Data curation, Writing – review & editing. OM: Formal analysis, Writing – review & editing, Validation. CA: Data curation, Writing – review & editing. SB: Data curation, Writing – review & editing. ME: Data curation, Writing – review & editing. AF: Conceptualization, Funding acquisition, Writing – review & editing. SR: Data curation, Writing – review & editing. NP: Conceptualization, Funding acquisition, Writing – review & editing. PS: Data curation, Writing – review & editing. MT: Data curation, Writing – review & editing. KW: Data curation, Writing – review & editing. MS-L: Funding acquisition, Supervision, Writing – review & editing.
Funding
The author(s) declare financial support was received for the research, authorship, and/or publication of this article. The work has been partly funded by the DFG Priority Program 1374 “Biodiversity-Exploratories” (252306891). SM and OJ also receive financial support via the AkWamo project (2221NR050C): “Feasibility study -integration of (bio)acoustic methods for quantifying biological diversity in forest monitoring”, which is supported on the basis of a resolution of the German Bundestag with funds of the Federal Ministry of Food and Agriculture (BMEL) via the Agency of Renewable Resources (FNR) as project management agency of the BMEL for the funding program Renewable Resources.
Acknowledgments
We thank the managers of the three Exploratories, Sonja Gockel, Kerstin Wiesner, Katrin Lorenzen, Andreas Hemp, Martin Gorke, Miriam Teuscher, and all former managers for their work in maintaining the plot and project infrastructure; Simone Pfeiffer, Maren Gleisberg, Christiane Fischer, and Jule Mangels for giving support through the central office; Jens Nieschulze, Michael Owonibi, and Andreas Ostrowski for managing the central database, and Markus Fischer, Eduard Linsenmair, Dominik Hessenmöller, Daniel Prati, Ingo Schöning, François Buscot, Ernst-Detlef Schulze, Wolfgang W. Weisser and the late Elisabeth Kalko for their role in setting up the Biodiversity Exploratories project. We thank the administrations of the Hainich national park, the UNESCO Biosphere Reserve Swabian Alb and the UNESCO Biosphere Reserve Schorfheide-Chorin, as well as all land owners for the excellent collaboration. Field work permits were issued by the responsible state environmental offices of Baden-Württemberg, Thüringen, and Brandenburg. SM further benefited from the inspirational discussions among the consortium of the Acoucene project supported by the Centre de Synthèse et d’Analyse sur la Biodiversité (CESAB) at the Fondation pour la Recherche sur la Biodiversité. SM would like to personally thank Walter Tilgner for the spark that ignited this research in the first place.
Conflict of interest
The authors declare that the research was conducted in the absence of any commercial or financial relationships that could be construed as a potential conflict of interest.
Publisher’s note
All claims expressed in this article are solely those of the authors and do not necessarily represent those of their affiliated organizations, or those of the publisher, the editors and the reviewers. Any product that may be evaluated in this article, or claim that may be made by its manufacturer, is not guaranteed or endorsed by the publisher.
Supplementary material
The Supplementary Material for this article can be found online at: https://www.frontiersin.org/articles/10.3389/fevo.2024.1392882/full#supplementary-material
References
Alba R., Sander M. M., Rosselli D., Chamberlain D. (2023). High-elevation habitats are important for birds during the post-breeding migration period in the Alps. J. Ornithol. 165, 521–531. doi: 10.1007/s10336-023-02132-1
Alcocer I., Lima H., Sugai L. S. M., Llusia D. (2022). Acoustic indices as proxies for biodiversity: a meta-analysis. Biol. Rev. 97, 2209–2236. doi: 10.1111/brv.12890
Ampoorter E., Barbaro L., Jactel H., Baeten L., Boberg J., Carnol M., et al. (2020). Tree diversity is key for promoting the diversity and abundance of forest-associated taxa in Europe. Oikos 129, 133–146. doi: 10.1111/oik.06290
Arlt D., Pärt T. (2008). Post-breeding information gathering and breeding territory shifts in northern wheatears. J. Anim. Ecol. 77, 211–219. doi: 10.1111/j.1365-2656.2007.01329.x
Barbaro L., Froidevaux J. (2022). Linking acoustic diversity to compositional and configurational heterogeneity in mosaic landscapes. Landsc. Ecol. 37, 1125–1143. doi: 10.1007/s10980-021-01391-8
Barber J. R., Crooks K. R., Fristrup K. M. (2010). The costs of chronic noise exposure for terrestrial organisms. Trends Ecol. Evol. 25, 180–189. doi: 10.1016/j.tree.2009.08.002
Basile M., Storch I., Mikusiński G. (2021). Abundance, species richness and diversity of forest bird assemblages – The relative importance of habitat structures and landscape context. Ecol. Indic. 133, 108402. doi: 10.1016/j.ecolind.2021.108402
Beason R. D., Riesch R., Koricheva J. (2023). Investigating the effects of tree species diversity and relative density on bird species richness with acoustic indices. Ecol. Indic. 154, 110652. doi: 10.1016/j.ecolind.2023.110652
BMEL (2014). Der Wald in Deutschland -Ausgewählte Ergebnisse der dritten Bundeswaldinventur (Berlin: Thünen-Institut für Waldökosysteme). Available online at: https://www.bmel.de/SharedDocs/Downloads/DE/Broschueren/ErgebnisseBWI2012.pdf?:blob=publicationFile&v=4 (Accessed February 13, 2024).
Boecklen W. J. (1986). Effects of habitat heterogeneity on the species-area relationships of forest birds. J. Biogeogr. 13, 59–68. doi: 10.2307/2844849
Boullhesen M., Vaira M., Barquez R. M., Akmentins M. S. (2021). Evaluating the efficacy of visual encounter and automated acoustic survey methods in anuran assemblages of the Yungas Andean forests of Argentina. Ecol. Indic. 127, 107750. doi: 10.1016/j.ecolind.2021.107750
Boyle A. W., Sandercock B. K., Martin K. (2016). Patterns and drivers of intraspecific variation in avian life history along elevational gradients: a meta-analysis. Biol. Rev. 91, 469–482. doi: 10.1111/brv.12180
Bradfer-Lawrence T., Desjonqueres C., Eldridge A., Johnston A., Metcalf O. (2023). Using acoustic indices in ecology: Guidance on study design, analyses and interpretation. Methods Ecol. Evol. 14, 2192–2204. doi: 10.1111/2041-210X.14194
Bradfer-Lawrence T., Gardner N., Bunnefeld L., Bunnefeld N., Willis S. G., Dent D. H. (2019). Guidelines for the use of acoustic indices in environmental research. Methods Ecol. Evol. 10, 1796–1807. doi: 10.1111/2041-210X.13254
Brambilla M., Rubolini D. (2009). Intra-seasonal changes in distribution and habitat associations of a multi-brooded bird species: implications for conservation planning. Anim. Conserv. 12, 71–77. doi: 10.1111/j.1469-1795.2008.00226.x
Brown T. J., Handford P. (2003). Why birds sing at dawn: the role of consistent song transmission. Ibis 145, 120–129. doi: 10.1046/j.1474-919X.2003.00130.x
Bründl A. C., Sallé L., Lejeune L. A., Sorato E., Thiney A. C., Chaine A. S., et al. (2020). Elevational gradients as a model for understanding associations among temperature, breeding phenology and success. Front. Ecol. Evol. 8. doi: 10.3389/fevo.2020.563377
Bruni A., Mennill D. J., Foote J. R. (2014). Dawn chorus start time variation in a temperate bird community: relationships with seasonality, weather, and ambient light. J. Ornithol. 155, 877–890. doi: 10.1007/s10336-014-1071-7
Burivalova Z., Maeda T. M., Purnomo, Rayadin Y., Boucher T., Choksi P., et al. (2022). Loss of temporal structure of tropical soundscapes with intensifying land use in Borneo. Sci. Total Environ. 852, 158268. doi: 10.1016/j.scitotenv.2022.158268
Burivalova Z., Purnomo, Orndorff S., Truskinger A., Roe P., Game E. T. (2021). The sound of logging: Tropical forest soundscape before, during, and after selective timber extraction. Biol. Conserv. 254, 108812. doi: 10.1016/j.biocon.2020.108812
Burivalova Z., Towsey M., Boucher T., Truskinger A., Apelis C., Roe P., et al. (2018). Using soundscapes to detect variable degrees of human influence on tropical forests in Papua New Guinea. Conserv. Biol. 32, 205–215. doi: 10.1111/cobi.12968
Buxton R. T., Brown E., Sharman L., Gabriele C. M., McKenna M. F. (2016). Using bioacoustics to examine shifts in songbird phenology. Ecol. Evol. 6, 4697–4710. doi: 10.1002/ece3.2242
Campos-Cerqueira M., Mena J. L., Tejeda-Gómez V., Aguilar-Amuchastegui N., Gutierrez N., Aide T. M. (2020). How does FSC forest certification affect the acoustically active fauna in Madre de Dios, Peru? Remote Sens. Ecol. Conserv. 6, 274–285. doi: 10.1002/rse2.120
Cardinale B. J., Duffy J. E., Gonzalez A., Hooper D. U., Perrings C., Venail P., et al. (2012). Biodiversity loss and its impact on humanity. Nature 486, 59–67. doi: 10.1038/nature11148
Ceresa F., Brambilla M., Monrós J. S., Rizzolli F., Kranebitter P. (2020). Within-season movements of Alpine songbird distributions are driven by fine-scale environmental characteristics. Sci. Rep. 10, 5747. doi: 10.1038/s41598-020-62661-0
Cheng X., Liu J., Liu H., Lu S. (2021). A systematic review of evidence of additional health benefits from forest exposure. Landsc. Urban Plan. 212, 104123. doi: 10.1016/j.landurbplan.2021.104123
Civitello D. J., Cohen J., Fatima H., Halstead N. T., Liriano J., McMahon T. A., et al. (2015). Biodiversity inhibits parasites: Broad evidence for the dilution effect. Proc. Natl. Acad. Sci. 112, 8667–8671. doi: 10.1073/pnas.1506279112
Czeszczewik D., Zub K., Stanski T., Sahel M., Kapusta A., Walankiewicz W. (2015). Effects of forest management on bird assemblages in the Bialowieza Forest, Poland. IForest - Biogeosciences For. 8, 377. doi: 10.3832/ifor1212-007
Doser J. W., Finley A. O., Weed A. S., Zipkin E. F. (2021). Integrating automated acoustic vocalization data and point count surveys for estimation of bird abundance. Methods Ecol. Evol. 12, 1040–1049. doi: 10.1111/2041-210X.13578
Ehbrecht M., Schall P., Juchheim J., Ammer C., Seidel D. (2016). Effective number of layers: A new measure for quantifying three-dimensional stand structure based on sampling with terrestrial LiDAR. For. Ecol. Manage. 380, 212–223. doi: 10.1016/j.foreco.2016.09.003
Ferraro D. M., Miller Z. D., Ferguson L. A., Taff B. D., Barber J. R., Newman P., et al. (2020). The phantom chorus: birdsong boosts human well-being in protected areas. Proc. R. Soc B Biol. Sci. 287, 20201811. doi: 10.1098/rspb.2020.1811
Fischer M., Bossdorf O., Gockel S., Hansel F., Hemp A., Hessenmoller D., et al. (2010). Implementing large-scale and long-term functional biodiversity research: The Biodiversity Exploratories. Basic Appl. Ecol. 11, 473–485. doi: 10.1016/j.baae.2010.07.009
Francis C. D., Ortega C. P., Cruz A. (2009). Noise pollution changes avian communities and species interactions. Curr. Biol. 19, 1415–1419. doi: 10.1016/j.cub.2009.06.052
Gage S. H., Axel A. C. (2014). Visualization of temporal change in soundscape power of a Michigan lake habitat over a 4-year period. Ecol. Inform. 21, 100–109. doi: 10.1016/j.ecoinf.2013.11.004
Gamfeldt L., Hillebrand H., Jonsson P. R. (2008). Multiple functions increase the importance of biodiversity for overall ecosystem functioning. Ecology 89, 1223–1231. doi: 10.1890/06-2091.1
Gasc A., Pavoine S., Lellouch L., Grandcolas P., Sueur J. (2015). Acoustic indices for biodiversity assessments: Analyses of bias based on simulated bird assemblages and recommendations for field surveys. Biol. Conserv. 191, 306–312. doi: 10.1016/j.biocon.2015.06.018
Gillerot L., Landuyt D., Oh R., Chow W., Haluza D., Ponette Q., et al. (2022). Forest structure and composition alleviate human thermal stress. Glob. Change Biol. 28, 7340–7352. doi: 10.1111/gcb.16419
Gillerot L., Rozario K., de Frenne P., Oh R., Ponette Q., Bonn A., et al. (2024). Forests are chill: The interplay between thermal comfort and mental wellbeing. Landsc. Urban Plan. 242, 104933. doi: 10.1016/j.landurbplan.2023.104933
Grace J. B. (2006). Structural Equation Modeling and Natural Systems (New York: Cambridge University Press).
Grace J. B., Anderson T. M., Olff H., Scheiner S. M. (2010). On the specification of structural equation models for ecological systems. Ecol. Monogr. 80, 67–87. doi: 10.1890/09-0464.1
Grinfeder E., Haupert S., Ducrettet M., Barlet J., Reynet M.-P., Sèbe F., et al. (2022). Soundscape dynamics of a cold protected forest: dominance of aircraft noise. Landsc. Ecol. 37, 567–582. doi: 10.1007/s10980-021-01360-1
Halupka L. (1999). Nest defence in an altricial bird with uniparental care: the influence of offspring age, brood size, stage of the breeding season and predator type. Ornis Fenn. 76, 97–105. https://ornisfennica.journal.fi/article/view/133504.
Haupert S., Sèbe F., Sueur J. (2022). Physics‐based model to predict the acoustic detection distance of terrestrial autonomous recording units over the diel cycle and across seasons: Insights from an Alpine and a Neotropical forest. Methods Ecol. Evol. 14, 614–630. doi: 10.1111/2041-210X.14020
Hedblom M., Heyman E., Antonsson H., Gunnarsson B. (2014). Bird song diversity influences young people’s appreciation of urban landscapes. Urban For. Urban Green. 13, 469–474. doi: 10.1016/j.ufug.2014.04.002
Heidrich L., Bae S., Levick S., Seibold S., Weisser W., Krzystek P., et al. (2020). Heterogeneity–diversity relationships differ between and within trophic levels in temperate forests. Nat. Ecol. Evol. 4, 1204–1212. doi: 10.1038/s41559-020-1245-z
Holmes R. T., Sherry T. W., Sturges F. W. (1986). Bird community dynamics in a temperate deciduous forest: long-term trends at hubbard brook. Ecol. Monogr. 56, 201–220. doi: 10.2307/2937074
Hooper D. U., Adair E. C., Cardinale B. J., Byrnes J. E. K., Hungate B. A., Matulich K. L., et al. (2012). A global synthesis reveals biodiversity loss as a major driver of ecosystem change. Nature 486, 105–U129. doi: 10.1038/Nature11118
Jaureguiberry P., Titeux N., Wiemers M., Bowler D. E., Coscieme L., Golden A. S., et al. (2023). The direct drivers of recent global anthropogenic biodiversity loss. Sci. Adv. 8, eabm9982. doi: 10.1126/sciadv.abm9982
Jones T. M., Brawn J. D., Ward M. P. (2018). Development of activity rates in fledgling songbirds: when do young birds begin to behave like adults? Behaviour 155, 337–350. doi: 10.1163/1568539X-00003492
Jones T. M., Ward M. P. (2022). Post-fledging behavioral ecology of migratory songbirds: how do fledgling activity rates vary across species? Behav. Ecol. 33, 336–342. doi: 10.1093/beheco/arab122
Jung K., Teuscher M., Wells K., Ayasse M., Fischer M., Weisser W. W., et al. (2024). Supporting bird diversity and ecological function in managed grassland and forest systems needs an integrative approach. Front. Environ. Sci. 12. doi: 10.3389/fenvs.2024.1401513
Kelly J. K., Schmidt K. A. (2017). Fledgling calls are a source of social information for conspecific, but not heterospecific, songbird territory selection. Ecosphere 8, e01512. doi: 10.1002/ecs2.1512
Le Provost G., Schenk N. V., Penone C., Thiele J., Westphal C., Allan E., et al. (2023). The supply of multiple ecosystem services requires biodiversity across spatial scales. Nat. Ecol. Evol. 7, 236–249. doi: 10.1038/s41559-022-01918-5
Liao C.-C., Shieh B.-S., Chen C.-C. (2018). Air temperature influenced the vocal activity of birds in a subtropical forest in southern Taiwan. Taiwan J. For. Sci. 33, 291–304. https://www.tfri.gov.tw/en/News_Content2.aspx?n=7589&s=15339.
MacArthur R., MacArthur J. W. (1961). On bird species-diversity. Ecology 42, 594. doi: 10.2307/1932254
Mammides C., Goodale E., Dayananda S. K., Kang L., Chen J. (2017). Do acoustic indices correlate with bird diversity? Insights from two biodiverse regions in Yunnan Province, south China. Ecol. Indic. 82, 470–477. doi: 10.1016/j.ecolind.2017.07.017
Manica L. T., Maia R., Dias A., Podos J., Macedo R. H. (2014). Vocal output predicts territory quality in a Neotropical songbird. Behav. Processes 109, 21–26. doi: 10.1016/j.beproc.2014.07.004
Marselle M. R., Hartig T., Cox D. T. C., de Bell S., Knapp S., Lindley S., et al. (2021). Pathways linking biodiversity to human health: A conceptual framework. Environ. Int. 150, 106420. doi: 10.1016/j.envint.2021.106420
McClure C. J. W., Hill G. E. (2012). Dynamic versus static occupancy: How stable are habitat associations through a breeding season? Ecosphere 3, art60. doi: 10.1890/ES12-00034.1
McNamara J. M., Mace R. H., Houston A. I. (1987). Optimal daily routines of singing and foraging in a bird singing to attract a mate. Behav. Ecol. Sociobiol. 20, 399–405. doi: 10.1007/BF00302982
Messier C., Bauhus J., Sousa-Silva R., Auge H., Baeten L., Barsoum N., et al. (2022). For the sake of resilience and multifunctionality, let’s diversify planted forests! Conserv. Lett. 15, e12829. doi: 10.1111/conl.12829
Metcalf O. C., Barlow J., Devenish C., Marsden S., Berenguer E., Lees A. C. (2020). Acoustic indices perform better when applied at ecologically meaningful time and frequency scales. Methods Ecol. Evol. 12, 421–431. doi: 10.1111/2041-210X.13521
Methorst J., Rehdanz K., Mueller T., Hansjürgens B., Bonn A., Böhning-Gaese K. (2021). The importance of species diversity for human well-being in Europe. Ecol. Econ. 181, 106917. doi: 10.1016/j.ecolecon.2020.106917
Morrison C. A., Auniņš A., Benkő Z., Brotons L., Chodkiewicz T., Chylarecki P., et al. (2021). Bird population declines and species turnover are changing the acoustic properties of spring soundscapes. Nat. Commun. 12, 6217. doi: 10.1038/s41467-021-26488-1
Müller S., Gossner M. M., Penone C., Jung K., Renner S. C., Farina A., et al. (2022). Land-use intensity and landscape structure drive the acoustic composition of grasslands. Agric. Ecosyst. Environ. 328, 107845. doi: 10.1016/j.agee.2021.107845
Müller S., Shaw T., Güntert D., Helmbold L., Schütz N., Thomas L., et al. (2020). Ecoacoustics of small forest patches in agricultural landscapes: acoustic diversity and bird richness increase with patch size. Biodiversity 21, 48–60. doi: 10.1080/14888386.2020.1733086
Mullet T. C., Farina A., Gage S. H. (2017). The acoustic habitat hypothesis: an ecoacoustics perspective on species habitat selection. Biosemiotics 10, 319–336. doi: 10.1007/s12304-017-9288-5
Naguib M., Riebel K. (2014). “Singing in Space and Time: The Biology of Birdsong,” in Biocommunication of Animals. Ed. Witzany G. (Springer Netherlands, Dordrecht), 233–247. doi: 10.1007/978-94-007-7414-8_13
Neuenschwander S., Brinkhof M., Kölliker M., Richner H. (2003). Brood size, sibling competition, and the cost of begging in great tits (Parus major). Behav. Ecol. 14, 457–462. doi: 10.1093/beheco/arg025
Newbold T., Hudson L. N., Hill S. L. L., Contu S., Lysenko I., Senior R. A., et al. (2015). Global effects of land use on local terrestrial biodiversity. Nature 520, 45–50. doi: 10.1038/nature14324
Oliver R. Y., Ellis D. P. W., Chmura H. E., Krause J. S., Pérez J. H., Sweet S. K., et al. (2018). Eavesdropping on the Arctic: Automated bioacoustics reveal dynamics in songbird breeding phenology. Sci. Adv. 4, eaaq1084. doi: 10.1126/sciadv.aaq1084
Ostertag J. (2015). Der Einfluss der Vegetationsstruktur auf die Schalltransmission. Zulassungsarbeit. Freiburg: Albert-Ludwigs-Universität Freiburg.
Pavel V. (2006). When do altricial birds reach maximum of their brood defence intensity? J. Ethol. 24, 175–179. doi: 10.1007/s10164-005-0178-y
Penone C., Allan E., Soliveres S., Felipe-Lucia M. R., Gossner M. M., Seibold S., et al. (2019). Specialisation and diversity of multiple trophic groups are promoted by different forest features. Ecol. Lett. 22, 170–180. doi: 10.1111/ele.13182
Phillips T. B., Wells N. M., Brown A. H., Tralins J. R., Bonter D. N., Tina Phillips C. B. (2023). Nature and well-being: The association of nature engagement and well-being during the SARS-CoV-2 pandemic. People Nat. 5, 607–620. doi: 10.1002/pan3.10433
Pijanowski B. C., Farina A., Gage S. H., Dumyahn S. L., Krause B. L. (2011a). What is soundscape ecology? An introduction and overview of an emerging new science. Landsc. Ecol. 26, 1213–1232. doi: 10.1007/s10980-011-9600-8
Pijanowski B. C., Villanueva-Rivera L. J., Dumyahn S. L., Farina A., Krause B. L., Napoletano B. M., et al. (2011b). Soundscape ecology: the science of sound in the landscape. BioScience 61, 203–216. doi: 10.1525/bio.2011.61.3.6
Purvis A., Molnár Z., Obura D., Ichii K., Willis K., Chettri N., et al. (2021). doi: 10.5281/zenodo.5517457
Puswal S. M., Jinjun M., Liu F. (2021). Effects of temperature and season on birds’ dawn singing behavior in a forest of eastern China. J. Ornithol. 162, 447–459. doi: 10.1007/s10336-020-01848-8
Quinn C. A., Burns P., Hakkenberg C. R., Salas L., Pasch B., Goetz S. J., et al. (2023). Soundscape components inform acoustic index patterns and refine estimates of bird species richness. Front. Remote Sens. 4. doi: 10.3389/frsen.2023.1156837
Ratcliffe E., Gatersleben B., Sowden P. T. (2013). Bird sounds and their contributions to perceived attention restoration and stress recovery. J. Environ. Psychol. 36, 221–228. doi: 10.1016/j.jenvp.2013.08.004
R Core Team (2017). R: A language and environment for statistical computing. Available online at: https://www.r-project.org.
R Core Team (2023). R: A language and environment for statistical computing. Available online at: https://www.r-project.org.
Reise J., Kukulka F., Flade M., Winter S. (2019). Characterising the richness and diversity of forest bird species using National Forest Inventory data in Germany. For. Ecol. Manage. 432, 799–811. doi: 10.1016/j.foreco.2018.10.012
Renner S. C., Gossner M. M., Kahl T., Kalko E. K. V., Weisser W. W., Fischer M., et al. (2014). Temporal changes in randomness of bird communities across central Europe. PloS One 9, e112347. doi: 10.1371/journal.pone.0112347
Renner S., Suarez-Rubio M., Kaiser S., Nieschulze J., Kalko E., Tschapka M., et al. (2018). Divergent response to forest structure of two mobile vertebrate groups. For. Ecol. Manage. 415, 129–138. doi: 10.1016/j.foreco.2018.02.028
Retamosa Izaguirre M., Barrantes-Madrigal J., Segura Sequeira D., Spínola-Parallada M., Ramírez-Alán O. (2021). It is not just about birds: what do acoustic indices reveal about a Costa Rican tropical rainforest? Neotropical Biodivers. 7, 431–442. doi: 10.1080/23766808.2021.1971042
Ross S. R. P.-J., Friedman N. R., Yoshimura M., Yoshida T., Donohue I., Economo E. P. (2021). Utility of acoustic indices for ecological monitoring in complex sonic environments. Ecol. Indic. 121, 107114. doi: 10.1016/j.ecolind.2020.107114
Rosseel Y. (2012). lavaan: an R package for structural equation modeling. J. Stat. Software 48, 1–36. doi: 10.18637/jss.v048.i02
Rozario K., Oh R. R. Y., Marselle M., Schröger E., Gillerot L., Ponette Q., et al. (2024a). The more the merrier? Perceived forest biodiversity promotes short-term mental health and well-being—A multicentre study. People Nat. 6, 180–201. doi: 10.1002/pan3.10564
Rozario K., Shaw T., Marselle M., Oh R. R. Y., Schröger E., Botero M., et al. (2024b). Perceived biodiversity: is what we measure also what we see and hear? doi: 10.1101/2024.04.03.587905
Sánchez-Giraldo C., Bedoya C. L., Morán-Vásquez R. A., Isaza C. V., Daza J. M. (2020). Ecoacoustics in the rain: understanding acoustic indices under the most common geophonic source in tropical rainforests. Remote Sens. Ecol. Conserv. 6, 248–261. doi: 10.1002/rse2.162
Scarpelli M. D. A., Tucker D., Doohan B., Roe P., Fuller S. (2023). Spatial dynamics of soundscapes and biodiversity in a semi-arid landscape. Landsc. Ecol. 38, 463–478. doi: 10.1007/s10980-022-01568-9
Schäfer J. E., Janocha M. M., Klaus S., Tietze D. T. (2017). How weather instead of urbanity measures affects song trait variability in three European passerine bird species. Ecol. Evol. 7, 4868–4880. doi: 10.1002/ece3.3032
Schall P., Ammer C. (2013). How to quantify forest management intensity in Central European forests. Eur. J. For. Res. 132, 379–396. doi: 10.1007/s10342-013-0681-6
Schall P., Gossner M. M., Heinrichs S., Fischer M., Boch S., Prati D., et al. (2018). The impact of even-aged and uneven-aged forest management on regional biodiversity of multiple taxa in European beech forests. J. Appl. Ecol. 55, 267–278. doi: 10.1111/1365-2664.12950
Schulze E. D., Craven D., Durso A. M., Reif J., Guderle M., Kroiher F., et al. (2019). Positive association between forest management, environmental change, and forest bird abundance. For. Ecosyst. 6, 3. doi: 10.1186/s40663-019-0160-8
Seidel D., Ammer C. (2023). Towards a causal understanding of the relationship between structural complexity, productivity, and adaptability of forests based on principles of thermodynamics. For. Ecol. Manage. 544, 121238. doi: 10.1016/j.foreco.2023.121238
Sethi S. S., Bick A., Ewers R. M., Klinck H., Ramesh V., Tuanmu M.-N., et al. (2023). Limits to the accurate and generalizable use of soundscapes to monitor biodiversity. Nat. Ecol. Evol. 7, 1373–1378. doi: 10.1038/s41559-023-02148-z
Shaw T., Müller S., Scherer-Lorenzen M. (2021). Slope does not affect autonomous recorder detection shape: considerations for acoustic monitoring in forested landscapes. Bioacoustics, 1–22. doi: 10.1080/09524622.2021.1925590
Shaw T., Scherer-Lorenzen M., Mueller S. (2023). Forest structural heterogeneity positively affects bird richness and acoustic diversity in a temperate, central European forest. Front. Ecol. Evol. 12. doi: 10.3389/fevo.2024.1387879
Slabbekoorn H., Ellers J., Smith T. B. (2002). Birdsong and sound transmission: the benefits of reverberations. Condor 104, 564–573. doi: 10.1093/condor/104.3.564
Slagsvold T. (1977). Bird song activity in relation to breeding cycle, spring weather, and environmental phenology. Ornis Scand. Scand. J. Ornithol. 8, 197–222. doi: 10.2307/3676105
Staniewicz A., Sokołowska E., Muszyńska A., Budka M. (2023). Competition for acoustic space in a temperate-forest bird community. Behav. Ecol. 34, 1043–1054. doi: 10.1093/beheco/arad075
Steinparzer M., Haluza D., Godbold D. L. (2022). Integrating tree species identity and diversity in particulate matter adsorption. Forests 13, 481. doi: 10.3390/f13030481
Stier-Jarmer M., Throner V., Kirschneck M., Immich G., Frisch D., Schuh A. (2021). The psychological and physical effects of forests on human health: A systematic review of systematic reviews and meta-analyses. Int. J. Environ. Res. Public. Health 18, 1770. doi: 10.3390/ijerph18041770
Strnadová I., Němec M., Strnad M., Veselý P., Fuchs R. (2018). The nest defence by the red-backed shrike Lanius collurio – support for the vulnerability hypothesis. J. Avian Biol. 49, jav–01726. doi: 10.1111/jav.01726
Südbeck P., Andretzke H., Fischer S., Gedeon K., Schikore T., Schröder K., et al. (2005). Methodenstandards zur Erfassung der Brutvögel Deutschlands. Germany: Max-Planck-Inst. für Ornithologie.
Sueur J., Pavoine S., Hamerlynck O., Duvail S. (2008). Rapid acoustic survey for biodiversity appraisal. PloS One 3, e4065. doi: 10.1371/Journal.Pone.0004065
Sugai L. S. M., Silva T. S. F., Ribeiro J. W. Jr., Llusia D. (2018). Terrestrial passive acoustic monitoring: review and perspectives. BioScience 69, 15–25. doi: 10.1093/biosci/biy147
Tews J., Brose U., Grimm V., Tielbörger K., Wichmann M. C., Schwager M., et al. (2004). Animal species diversity driven by habitat heterogeneity/diversity: the importance of keystone structures. J. Biogeogr. 31, 79–92. doi: 10.1046/j.0305-0270.2003.00994.x
Thomas R. J. (1999). The effect of variability in the food supply on the daily singing routines of European robins: a test of a stochastic dynamic programming model. Anim. Behav. 57, 365–369. doi: 10.1006/anbe.1998.0970
Thomas R. J., Cuthill I. C. (2002). Body mass regulation and the daily singing routines of European robins. Anim. Behav. 63, 285–295. doi: 10.1006/anbe.2001.1926
Thomas R., Cuthill I., Goldsmith A., Cosgrove D., Lidgate H., Burdett Proctor S. (2003). The trade-off between singing and mass gain in a daytime-singing bird, the European robin. Behaviour 140, 387–404. doi: 10.1163/156853903321826693
Tomiałojć L., Wesołowski T. (2004). Diversity of the Białowieża Forest avifauna in space and time. J. Ornithol. 145, 81–92. doi: 10.1007/s10336-003-0017-2
Turner A., Fischer M., Tzanopoulos J. (2018). Sound-mapping a coniferous forest-Perspectives for biodiversity monitoring and noise mitigation. PloS One 13, e0189843. doi: 10.1371/journal.pone.0189843
van der Plas F., Manning P., Soliveres S., Allan E., Scherer-Lorenzen M., Verheyen K., et al. (2016). Biotic homogenization can decrease landscape-scale forest multifunctionality. Proc. Natl. Acad. Sci. 113, 3557–3562. doi: 10.1073/pnas.1517903113
van Rij J., Wieling M., Baayen R. H., van Rijn H. (2022). itsadug: interpreting time series and autocorrelated data using GAMMs. Available online at: https://cran.r-project.org/web/packages/itsadug/ (Accessed February 13, 2024).
Villanueva-Rivera L. J., Pijanowski B. C. (2016). R package ‘Soundecology.’. Available online at: https://cran.r-project.org/web/packages/soundecology/index.html.
Villanueva-Rivera L. J., Pijanowski B. C., Doucette J., Pekin B. (2011). A primer of acoustic analysis for landscape ecologists. Landsc. Ecol. 26, 1233–1246. doi: 10.1007/s10980-011-9636-9
Wells K., Böhm S. M., Boch S., Fischer M., Kalko E. K. V. (2011). Local and landscape-scale forest attributes differ in their impact on bird assemblages across years in forest production landscapes. Basic Appl. Ecol. 12, 97–106. doi: 10.1016/j.baae.2011.01.002
Wells K., O’Hara R. B., Böhm S. M., Gockel S., Hemp A., Renner S. C., et al. (2012). Trait-dependent occupancy dynamics of birds in temperate forest landscapes: fine-scale observations in a hierarchical multi-species framework. Anim. Conserv. 15, 626–637. doi: 10.1111/j.1469-1795.2012.00560.x
Weyhermüller K. (2015). Der Einfluss der Vegetationsstruktur auf die Schalldämpfung. Bachelor of Science Thesis. Freiburg: Albert-Ludwigs-Universität Freiburg.
Williams E., Boyle A. (2017). Patterns and correlates of within-season breeding dispersal: A common strategy in a declining grassland songbird. Auk 135, 1–14. doi: 10.1642/AUK-17-69.1
Wood S. N. (2017). Generalized Additive Models: An Introduction with R. 2nd Edn (Boca Raton: Chapman and Hall/CRC). doi: 10.1201/9781315370279
Xu Z., Chen L., Pijanowski B. C., Zhao Z. (2023). A frequency-dependent acoustic diversity index: A revision to a classic acoustic index for soundscape ecological research. Ecol. Indic. 155, 110940. doi: 10.1016/j.ecolind.2023.110940
Zhao Z., Xu Z., Bellisario K., Zeng R., Li N., Zhou W., et al. (2019). How well do acoustic indices measure biodiversity? Computational experiments to determine effect of sound unit shape, vocalization intensity, and frequency of vocalization occurrence on performance of acoustic indices. Ecol. Indic. 107, 105588. doi: 10.1016/j.ecolind.2019.105588
Keywords: acoustic diversity index, acoustic diversity, temporal dynamics, forest management, ecoacoustics, soundscape phenology, soundscape ecology
Citation: Müller S, Jahn O, Jung K, Mitesser O, Ammer C, Böhm S, Ehbrecht M, Farina A, Renner SC, Pieretti N, Schall P, Tschapka M, Wells K and Scherer-Lorenzen M (2024) Temporal dynamics of acoustic diversity in managed forests. Front. Ecol. Evol. 12:1392882. doi: 10.3389/fevo.2024.1392882
Received: 28 February 2024; Accepted: 31 July 2024;
Published: 24 September 2024.
Edited by:
Aurelio F. Malo, University of Alcalá, SpainReviewed by:
Viorel Dan Popescu, Columbia University, United StatesIgnacio Morales-Castilla, University of Alcalá, Spain
Copyright © 2024 Müller, Jahn, Jung, Mitesser, Ammer, Böhm, Ehbrecht, Farina, Renner, Pieretti, Schall, Tschapka, Wells and Scherer-Lorenzen. This is an open-access article distributed under the terms of the Creative Commons Attribution License (CC BY). The use, distribution or reproduction in other forums is permitted, provided the original author(s) and the copyright owner(s) are credited and that the original publication in this journal is cited, in accordance with accepted academic practice. No use, distribution or reproduction is permitted which does not comply with these terms.
*Correspondence: Sandra Müller, c2FuZHJhLm11ZWxsZXJAYmlvbG9naWUudW5pLWZyZWlidXJnLmRl
†ORCID: Sandra Müller, orcid.org/0000-0003-4289-755X
Olaf Jahn, orcid.org/0000-0001-7936-033X
Kirsten Jung, orcid.org/0000-0002-9449-2215
Oliver Mitesser, orcid.org/0000-0002-3607-877X
Christian Ammer, orcid.org/0000-0002-4235-0135
Stefan Böhm, orcid.org/0009-0005-7416-6606
Martin Ehbrecht, orcid.org/0000-0002-1543-3023
Swen C. Renner, orcid.org/0000-0002-6893-4219
Nadia Pieretti, orcid.org/0000-0003-1701-9368
Peter Schall, orcid.org/0000-0003-4808-818X
Marco Tschapka, orcid.org/0000-0001-9511-6775
Konstans Wells, orcid.org/0000-0003-0377-2463
Michael Scherer-Lorenzen, orcid.org/0000-0001-9566-590X