 Tirtha Das Banerjee
 Cédric Finet
 Kwi Shan Seah
 Antónia Monteiro
- Department of Biological Sciences, National University of Singapore, Singapore, Singapore
Previous studies have shown that Optix regulates lower lamina thickness and the type of pigment that is produced in wing scales of a few butterfly species. However, the role of Optix in regulating pigment production across species, and in regulating additional aspects of scale morphology remains to be investigated. By combining microspectrophotometry, scanning electron microscopy, and focused ion beam technology on wild-type and Optix Bicyclus anynana crispants, we show that Optix regulates the production of orange pigments (ommochromes), represses the production of brown pigments (melanins), and regulates the morphology of the lower and upper surface of orange scales. Our findings suggest a conserved role of Optix as a switch gene that activates ommochrome and represses melanin synthesis across butterflies. By comparing these effects with other mutations, where only melanin is removed from scales, we propose that pigmentary changes, alone, affect the way that chitin polymerizes within a scale, changing lower lamina thickness as well as multiple intricate structures of the upper surface.
Introduction
Butterfly wings offer an unrivalled model to study the diversity of biological mechanisms used to produce colors. Butterfly wing colors are predominantly due to pigmented scales (Umebachi, 1985; Nijhout, 1997; Wijnen et al., 2007; Reed et al., 2008; Zhang et al., 2017; Matsuoka and Monteiro, 2018), structurally colored scales (Lloyd and Nadeau, 2021; Thayer and Patel, 2023), or seldom from pigmented or nanostructured wing membranes (Yoshioka and Kinoshita, 2006; Finet et al., 2023; Nishida et al., 2023; Stavenga, 2023). In the last decade, studies have shown that coloration often results from a combination of both pigments and nanostructures present in the same scale (Wilts et al., 2012a, 2012b, 2015; Wasik et al., 2014; Stavenga et al., 2015; Thayer et al., 2020; Prakash et al., 2022b), and have identified genes, such as cortex, yellow, DOPA decarboxylase, Antennapedia, and Optix, that regulate both traits (Zhang et al., 2017; Matsuoka and Monteiro, 2018; Livraghi et al., 2021; Prakash et al., 2022b).
Among these genes, Optix, a member of the sine oculis homolog (six/so) gene family, is the best well-studied. This gene, in addition to patterning eyes (Quiring et al., 1994; Seimiya and Gehring, 2000; Li et al., 2013) and wing veins in Drosophila melanogaster flies (Al Khatib et al., 2017; Martín et al., 2017), plays a role in color pattern development and wing scale morphology in butterflies (Reed et al., 2011; Jiggins et al., 2017). In particular, Optix regulates two pigmentation pathways simultaneously, and acts as a switch gene. It promotes ommochrome synthesis and represses melanin synthesis. Optix crispants in Heliconius erato, Agraulis vanillae, Vanessa cardui, and Junonia coenia result in the loss of red and orange ommochrome pigments and the gain of melanin pigments (Zhang et al., 2017). Alongside these changes there is downregulation of ommochrome pathway genes such as cinnabar and kynurenine formamidase, and the downregulation of tan, ebony, and yellow-d, enzymes affecting the flux of pigment precursors in the melanin pathway (Zhang et al., 2017). In J. coenia, Optix knockouts also develop scales with a thicker lower lamina that become blue and iridescent (Zhang et al., 2017; Thayer et al., 2020).
In Bicyclus anynana, Optix is known to regulate two types of scales, the silver and orange scales. In the silver coupling scales, present at the base of the wing, Optix represses brown pigmentation and promotes the formation of a thin film of cuticle on the upper lamina (Figures 1A, B, D; Supplementary Figure S1) that is essential in producing a silver broadband reflectance (Prakash et al., 2022b). In the orange scales, Optix is expressed and translated in the outer eyespot ring, where it promotes the production of ommochrome pigments, and represses brown pigmentation (Banerjee and Monteiro, 2023; How et al., 2023) (Supplementary Figure S1). The structural and pigmentary basis of the conversion of orange to brown scales in B. anynana, however, has remained unexplored.
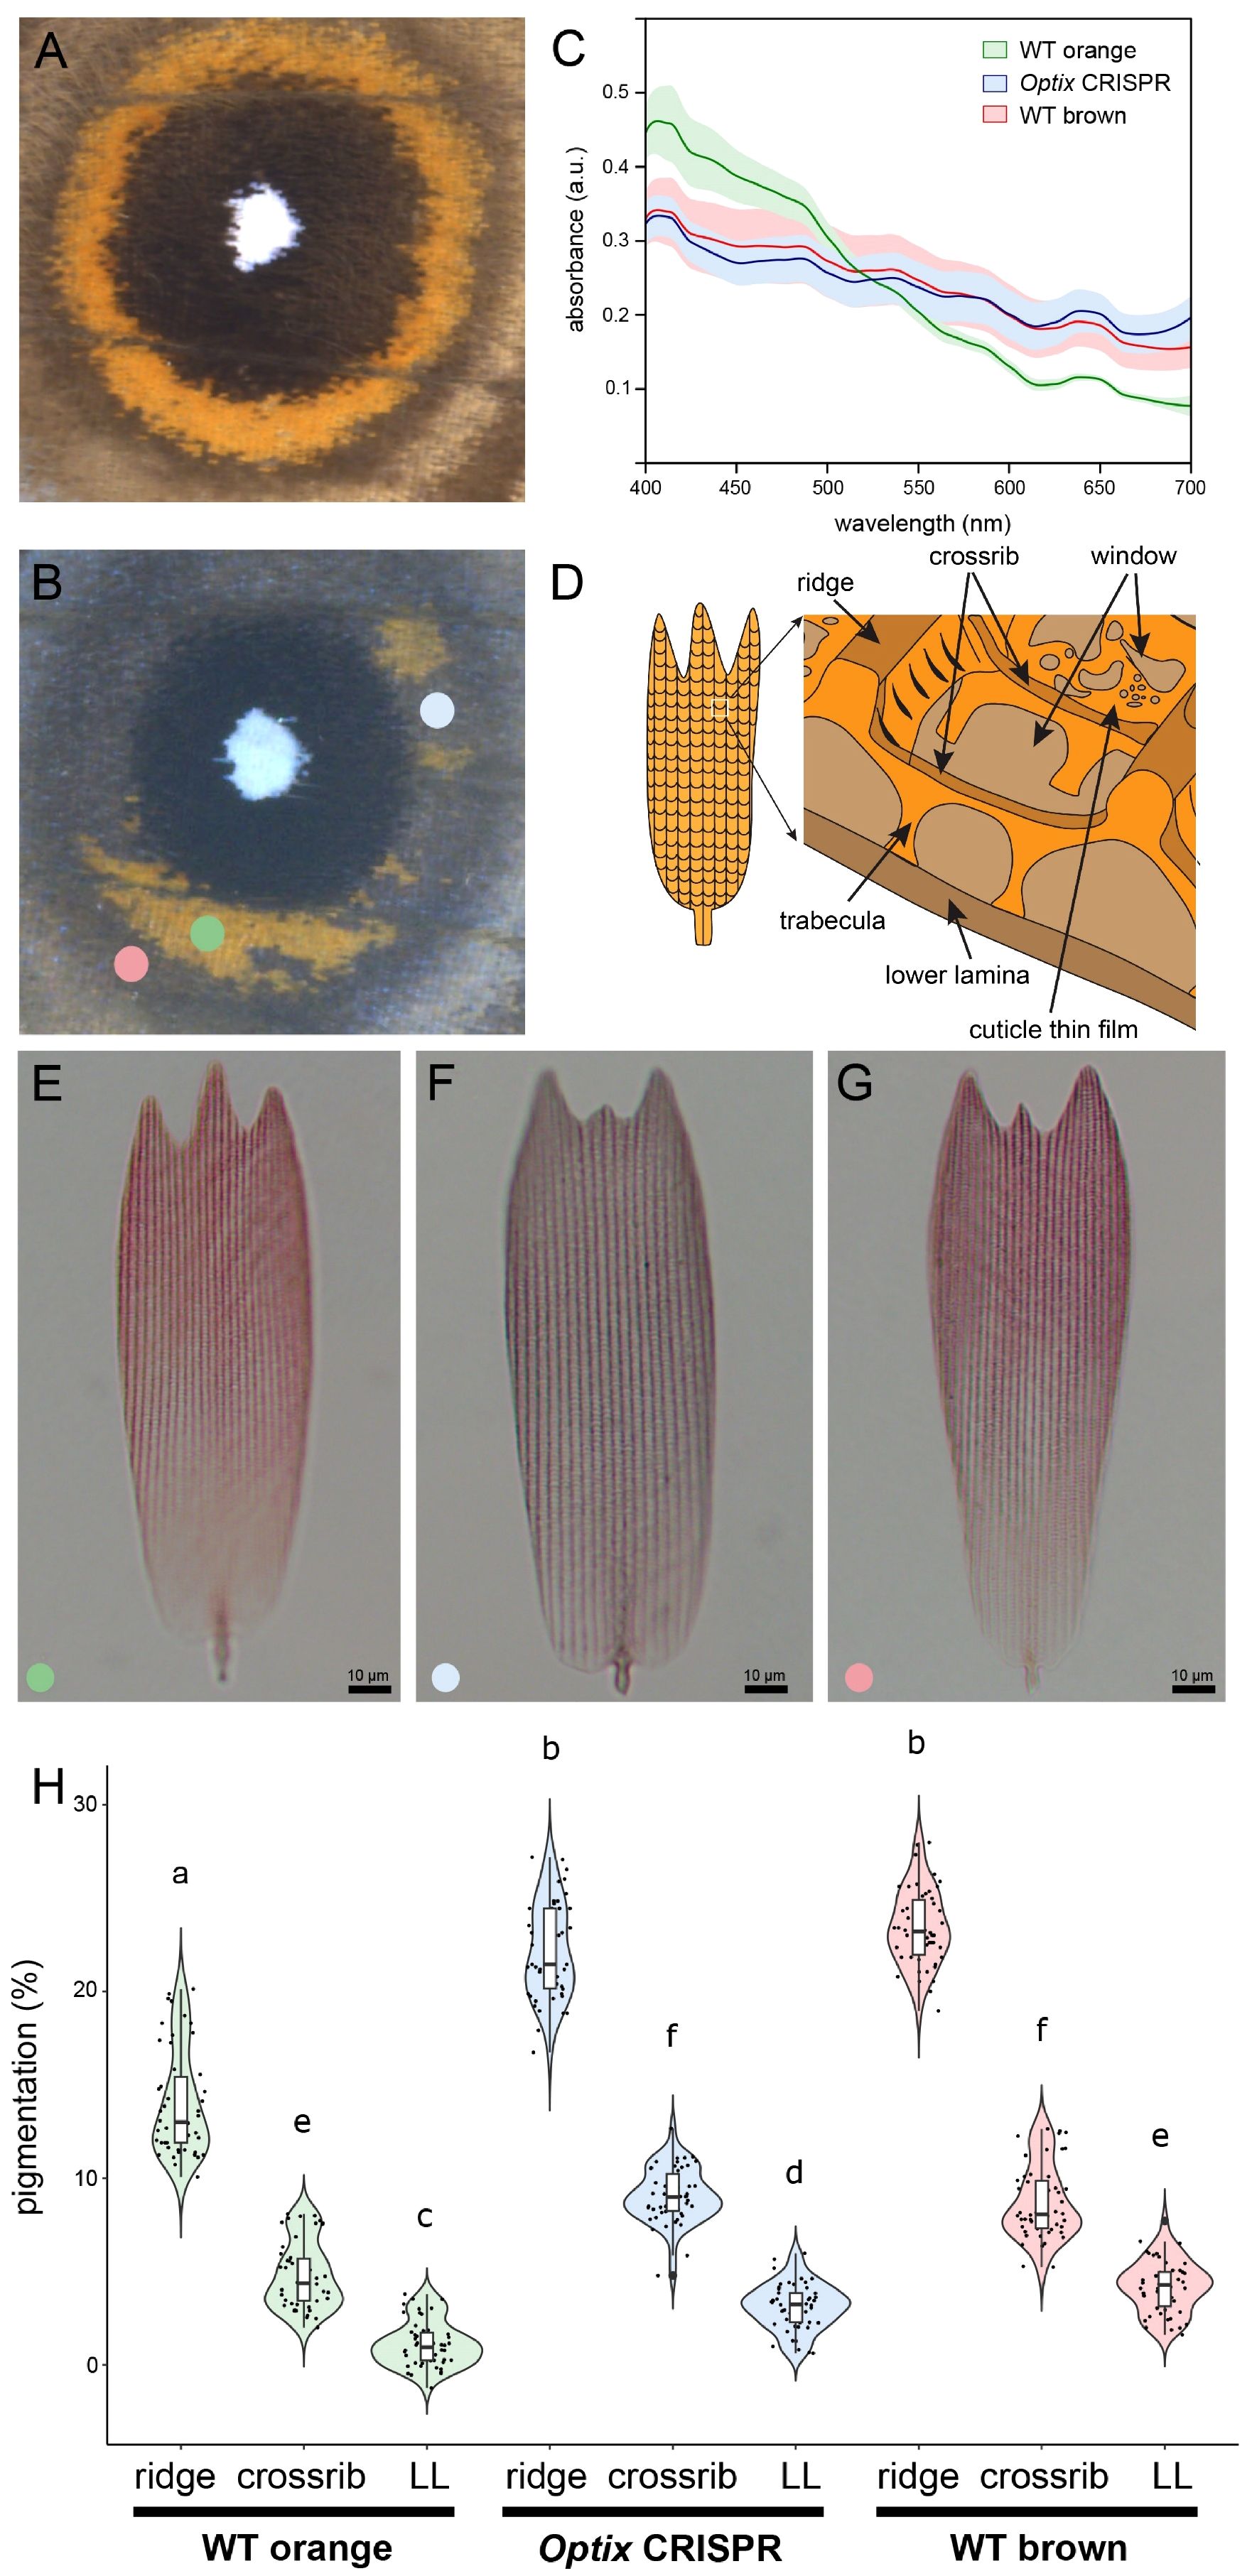
Figure 1 Optix promotes the synthesis of orange pigments and represses brown pigmentation. (A) WT eyespot. (B) An Optix knockout results in the conversion of eyespot orange scales into brown scales. Colored dots represent the areas used for scale sampling. (C) Absorbance spectra of the three scale types showing the Optix knockout scale spectrum resembles the WT brown scale spectrum, indicating a change in pigments (color shading = standard deviation, n=10). (D) Schematic of orange scale ultrastructure. (E-G) Optical microscopy images of WT orange scale (left), Optix CRISPR orange scale (center), and WT brown scale (right) in clove oil. (H) Quantification of pigmentation in the ridges, the crossribs, and lower lamina in the three scale types. Means sharing the same letter are not significantly different (Tukey-adjusted comparisons). The central line in the violin plot indicates the median of the distribution, while the top and bottom of the box represent the third and first quartiles of the data, respectively. The whiskers show up to 1.5 times the inter-quartile range. a.u., arbitrary units; LL, lower lamina.
In order to further explore the role of Optix in orange scale development, we investigated the color and the morphology of wild-type orange scales, wild-type brown scales, and Optix crispant transformed orange-to-brown scales previously produced in the lab (Banerjee and Monteiro, 2023). Our goal is to understand how this transcription factor might control pigmentation and the nanomorphology of butterfly wing scales.
Materials and methods
Butterfly rearing
B. anynana butterflies were raised in lab conditions at 27°C, 60% humidity, and 12-12 hrs day-night cycle. Larvae were fed young corn leaves and adults were fed mashed bananas.
CRISPR-Cas9 genome editing
Optix CRISPR experiments were performed based on the protocol described in Banerjee and Monteiro (2018). Two guide RNAs were synthesised in vitro to target a region of the CDS and 300 ng/ul of both were mixed with Cas9 enzyme and Cas9 buffer, then microinjected into eggs within 3 hours after laying. Adults were frozen at -20° C and imaged using a Leica DMS1000 microscope.
Scanning electron microscopy
A fine metal needle was used to pick scales from adult WT and Optix crispant wings. The scales were then mounted on a carbon tape fixed to a SEM stub, platinum coated using JEOL JFC-1600 Auto Fine Coater, and imaged under a JEOL JSM-6701F Field-Emission SEM (voltage 5 kV) by detecting secondary electrons.
Scale absorbance measurements
Individual scales were placed on a glass slide and immersed in a chitin-matching refractive index liquid (clove oil). The scales were then covered with a coverslip and the absorbance spectrum was measured using an uSight-2000-Ni microspectrophotometer (Technospex Pte. Ltd, Singapore). Spectra with a usable range between 400 and 700 nm were collected using the 20X lens (NA = 0.5) with an integration time of 100 ms and an averaging of 100. Ten samples were measured for each scale type, with measurements taken from three distinct areas on each scale. Measurements were analyzed and plotted using the R package pavo 2 (Maia et al., 2013).
Scale pigmentation measurements
Scales were mounted in clove oil, then imaged using the 20X lens of a uSight-2000-Ni microspectrophotometer (Technospex Pte. Ltd, Singapore) and a Touptek U3CMOS-05 camera. For each scale type, measurements of five scales from one individual were averaged. First, we extracted the grey values along a line, perpendicular to the ridges, for ten ridges, then we did the same for ten crossribs and intercrossrib areas (= proxy for the lower lamina) along a line perpendicular to the crossribs, using the Profile tool in Fiji (Schindelin et al., 2012). Second, we normalized each measurement of grey value against the value of the background, and we converted the grey value in the percent of pigmentation (grey value [white] = 255, grey value [black] = 0).
Focused ion beam scanning electron microscopy
FIB-SEM was used to measure the lower lamina thickness of scales. Lower lamina and crossrib height were exposed by milling with gallium ion beam in FIB-SEM on a FEI Versa 3D microscope with the following parameters: beam voltage 8 kV, beam current 12 pA, tilt 52°. Image acquisition was performed in the same equipment by detecting secondary electrons with the following settings: beam voltage 5 kV, beam current 13 pA, tilt 52°. Thicknesses were measured using the Line tool implemented in Fiji (Schindelin et al., 2012), and corrected for tilted perspective (measured thickness/sin52°) (Villinger et al., 2012). For each scale type, ten measurements were taken per scale with ten scales sampled from one individual.
Measurements and statistical analysis
Measurements of thicknesses and distances were measured from SEM images using the Line tool implemented in Fiji (Schindelin et al., 2012). To calculate the percentage of the area of the open upper lamina, a large region (∼ 750 μm2) was selected in the center of the scale. The image was converted to 8-bits, and thresholding was applied based on the values of the bright (ridges, crossribs, and upper thin film) and dark (windows) areas of the SEM image. A separate region of interest (ROI) was made for each dark region using the Analyze Particles tool implemented in Fiji, and then the area of each ROI was measured. The total combined dark area of the open upper lamina was converted into a percentage.
For all parameters, repeated measurements were taken per scale with ten scales sampled from one individual. Due to the multilevel context of the datasets, we ran linear mixed-effects (LME) models using the R package nlme (Pinheiro et al., 2023) that allows coefficients to vary with respect to one or more grouping variables. The scale type was treated as the fixed factor, and the scale nested within individual as a random factor. The lack of homogeneity of variances among scale types prompted us to use the varIdent() function in the nlme package. Akaike information criterion (AIC) was used to compare different possible models and determine which one is the best fit for the data. Adjusted p-values for different pairwise comparisons were obtained by the Bonferroni post-hoc test with Tukey contrasts using the R package multcomp (Hothorn et al., 2008).
Results
Optix crispants exhibit altered coloration of orange scales
We previously showed that Optix crispants lost the orange color in the eyespot’s outer ring, but we did not characterize the color of the transformed (brownish) scales nor the type of pigments that they contained (Banerjee and Monteiro, 2023). Here we show that orange scales were transformed into brownish scales that strongly resemble the brown scales in more peripheric rings around the eyespots (Figure 1B; Supplementary Figure S1). To quantify this color change, we measured the absorbance spectra of the WT orange, WT brown, and Optix orange-to-brown scales. From 400 to 520 nm, WT orange scales absorbed more light than WT brown scales, whereas brown scales became more absorbent at wavelengths above 520 nm (Figure 1B). The absorbance of the Optix transformed scales was qualitatively and quantitatively similar to the spectrum obtained for WT brown scales (Figure 1B). The absorbance of black and white scales was not significantly affected as expected, as Optix is not expressed in these scales (Supplementary Figure S2). Thus, knocking-out Optix resulted in a change in the nature of the pigments within the orange ring scales, with the brown pigments, likely melanins, replacing the orange pigments, likely ommochromes.
To more precisely determine where the pigment changes localized within the scales, we imaged the three scale types (Figures 1C, E-G; Supplementary Figure S3). We observed that the pigments were predominantly located in the ridges and the crossribs, and we confirmed these observations by quantifying the percent of pigmentation in the ridges, the crossribs, and the lower lamina for the three scale types (Figure 1H). We found that brown scales are more pigmented than WT orange scales, and only slightly more pigmented (and reddish) than Optix transformed scales, indicating some possible mixture of ommochromes and melanins (Figure 1H). Moreover, the disruption of Optix led to an increase in pigmentation in the ridges, the crossribs, and the lower lamina, which became darker (and greyer) than the WT orange scales (Figure 1H).
Optix CRISPR changes the morphology of orange scales to resemble that of brown scales
In addition to color changes, knocking-out Optix resulted in the loss of a thin cuticular film that is present in the orange scales (Figures 2A, B; Supplementary Figure S4). This modification made these scales resemble the morphology of WT brown scales (Figure 2C; Supplementary Figures S4A-F). On average, WT orange scales had 28% percent of their windows closed by this thin film. In Optix transformed scales, only 2% of the windows were closed, resembling WT brown scales (Figure 2D). The structures of black and white scales, however, were not affected (Supplementary Figures S4G-Q). Optix disruptions affect thus, the type of pigments and the morphology of the orange scales in the eyespots.
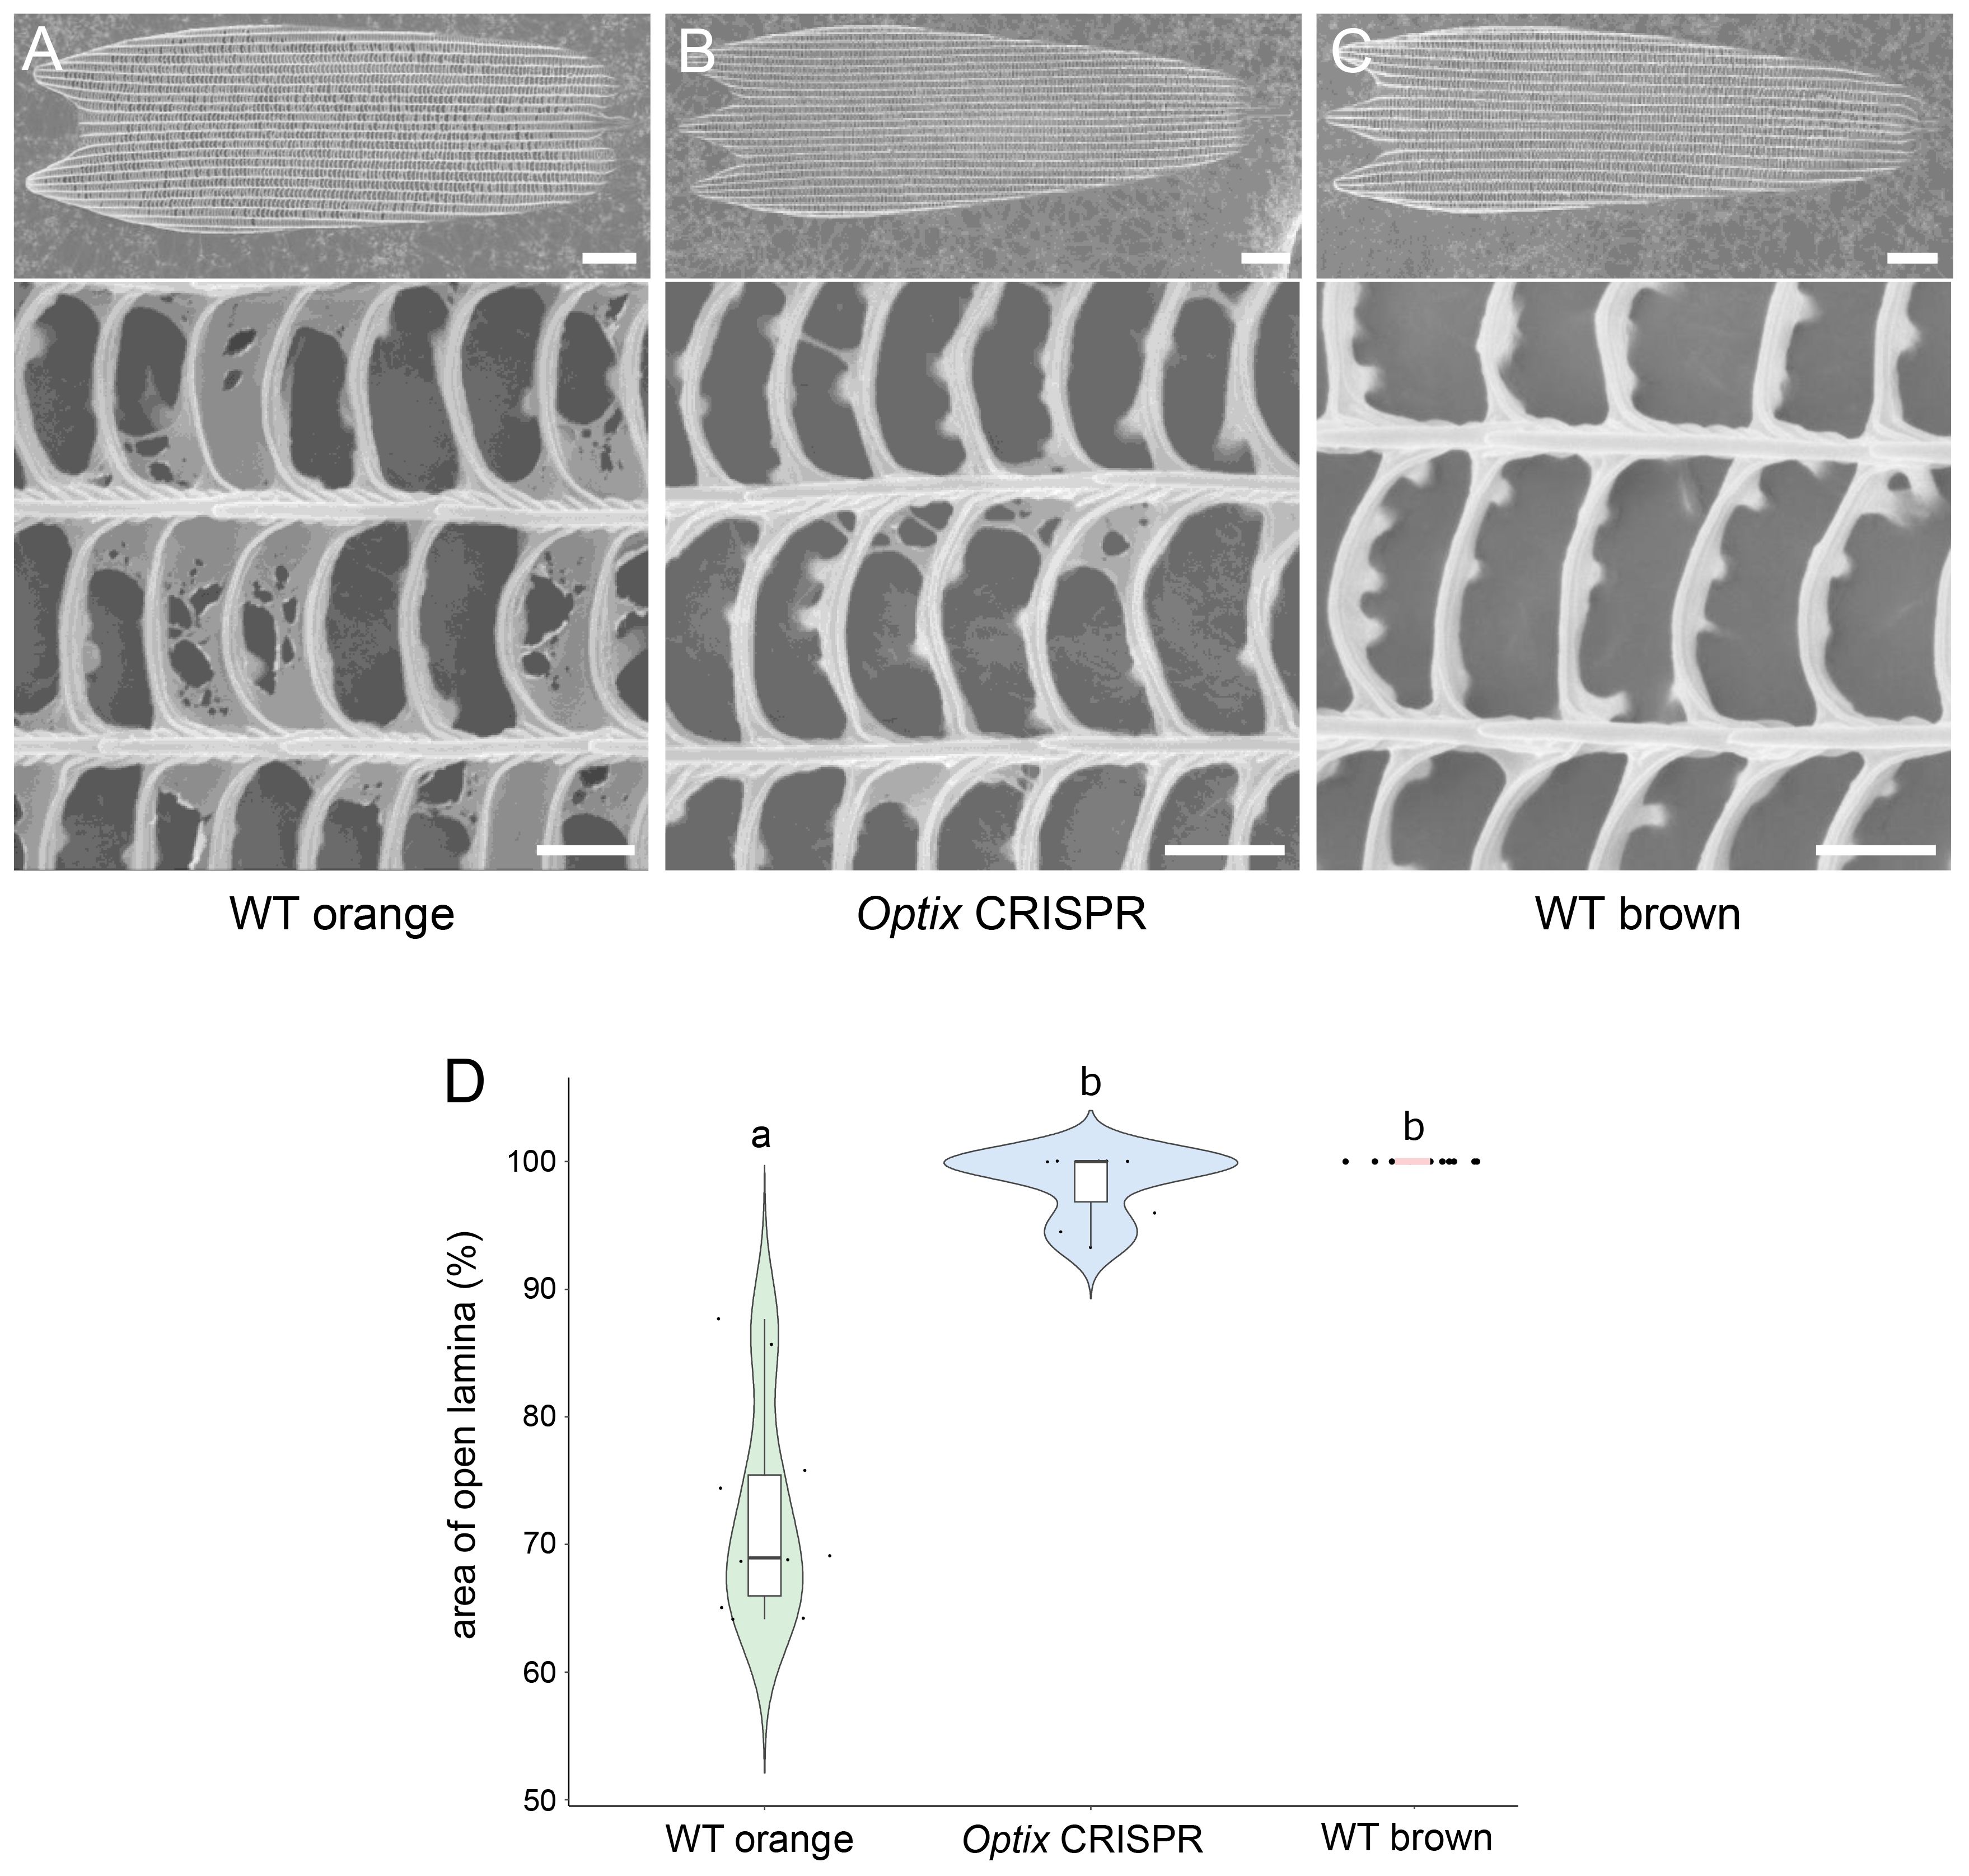
Figure 2 Optix promotes the development of a thin cuticular film in the upper surface of the orange scales. SEM images of (A) an orange scale from the orange ring, (B) an Optix CRISPR modified scale from the same ring, and (C) a brown scale from an outer ring. Knocking-out Optix resulted in the reduction of the thin cuticular film in the upper surface found in orange scales, making these scales resemble the morphology of brown scales. (D) Violin plot of WT orange, Optix CRISPR (orange), and WT brown scale. The central line in the violin plot indicates the median of the distribution, while the top and bottom of the box represent the third and first quartiles of the data, respectively. The whiskers show up to 1.5 times the inter-quartile range. Scale bar (full scale) = 10 μm; scale bar (detail) = 1 μm.
To examine the morphological differences more precisely between the three scale types, we measured a series of parameters in these scales: the distance between ridges, the distance between crossribs, and the area of the windows (the area in between a set of ridges and crossribs) (Figure 3A). The distance between ridges was increased in Optix transformed scales (average dridge-ridge = 2055±84 nm) compared to WT orange scales (average dridge-ridge = 1824± 149 nm) (Figure 3B). The same trend was found for the distance between crossribs with a slightly higher spacing in Optix crispants (average dcrossrib-crossrib = 870±104 nm) compared to WT orange scales (average dcrossrib-crossrib = 734±105 nm) (Figure 3C). The increase in both inter-ridge and inter-crossrib distances led to expanded window areas in Optix transformed scales (Figure 3D), resembling the morphology of WT brown scales.
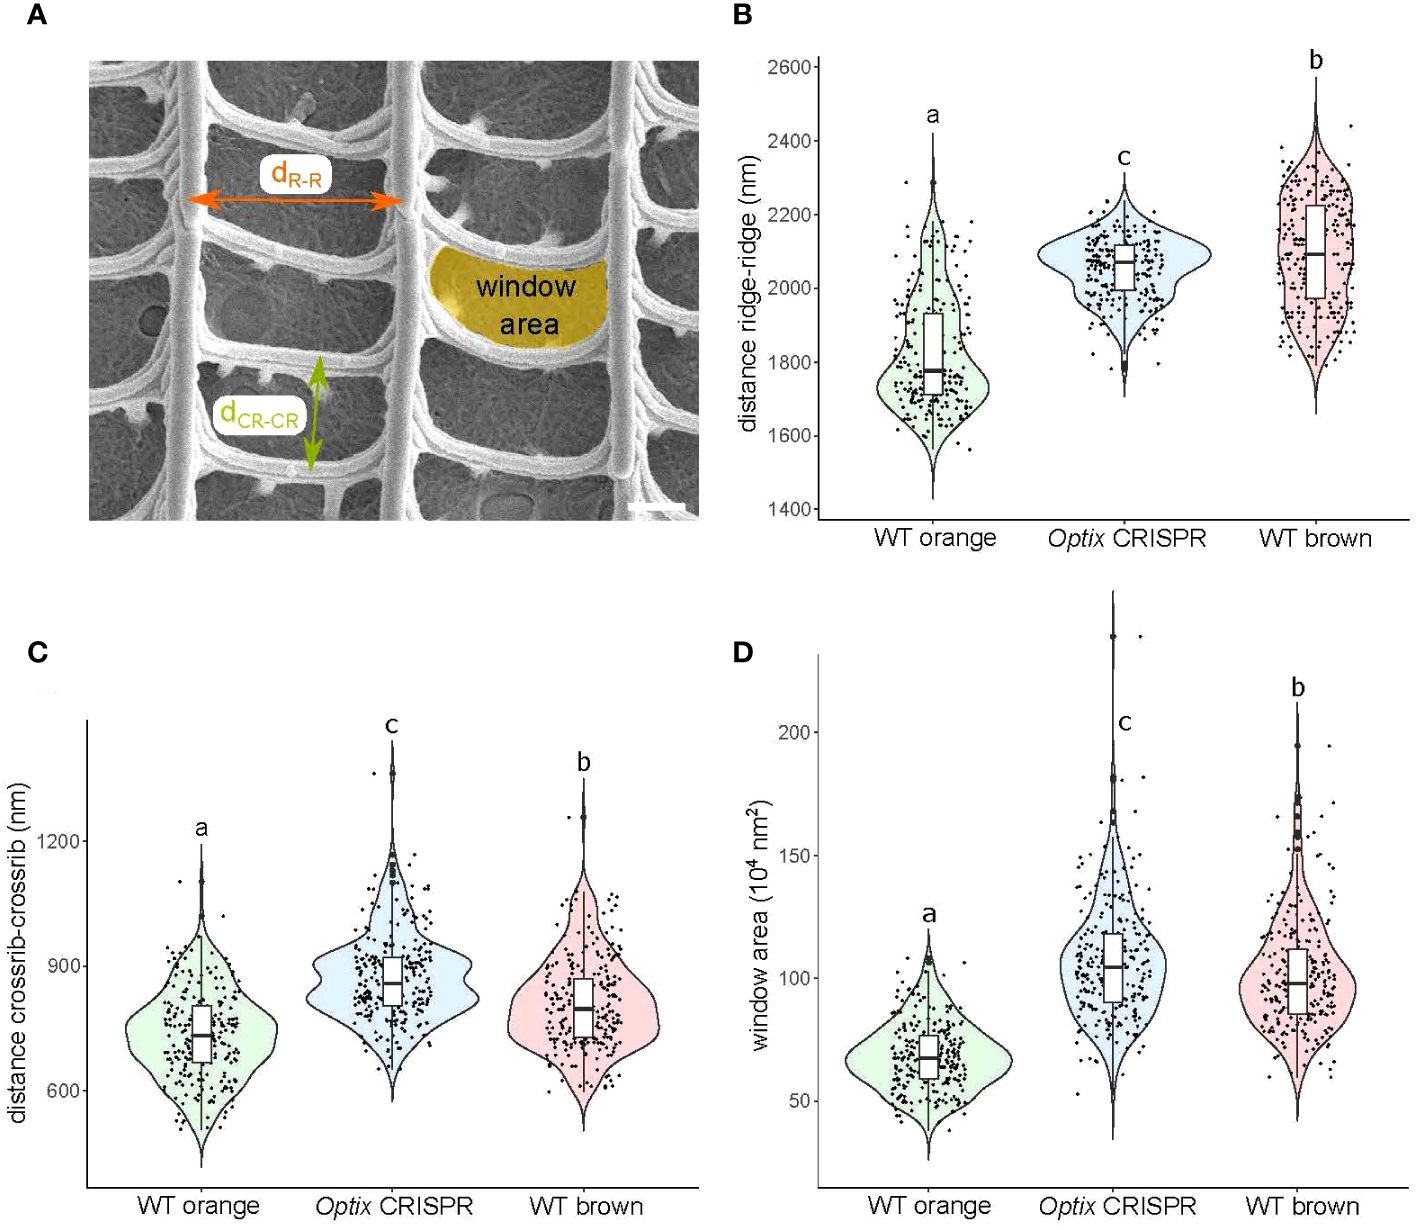
Figure 3 Characterization of upper surface geometries of orange and brown scales in WT and Optix crispants. (A) SEM images of top view of scales were used to measure distances between ridges, between crossribs, and window area. Violin plots of (B) the ridge-ridge distances of the different scale types; (C) the crossrib-crossrib distances of the different scale types; and (D) the window area of the different scale types. Means sharing the same letter are not significantly different (Tukey-adjusted comparisons). The central line in the violin plot indicates the median of the distribution, while the top and bottom of the box represent the third and first quartiles of the data, respectively. The whiskers show up to 1.5 times the inter-quartile range. Scale bar = 500 nm.
We hypothesized that these three distinct scale morphologies could derive solely from variation in the pigment composition between the three scale types (Figure 1C). WT orange and brown scales having both melanins and ommochromes, but in inverse amounts (Matsuoka and Monteiro, 2018; How et al., 2023), and crispant orange scales having primarily melanins, but no ommochromes.
To try and gauge whether specific pigments have specific effects on scale morphology, we 1) examined the morphology of a different scale type, the silver scale, where the function of Optix’ appears to be confined to repressing melanin synthesis, rather than promoting ommochrome synthesis (Prakash et al., 2022b); and 2) examined the morphology of orange scales in previous melanin enzyme mutants, such as yellow, ebony and DDC mutants (Matsuoka and Monteiro, 2018), where ommochromes are expected to be at WT levels, but melanin levels have changed. We examined how specific scale parameters such as inter-ridge and inter-crossrib distances, lower lamina, ridge, and crossrib thicknesses, and window areas, changed across all these scale types with different amounts of each type of pigment. We tested whether the presence of specific pigments (or pigmentation in general) was consistently correlated with specific scale morphologies.
Absence of melanin is associated with sheet-like film in upper laminae, and both melanins and ommochromes are correlated with tighter inter-ridge, and inter-crossrib distances
In B. anynana silver scales, which are almost transparent, Optix is required for repressing melanin pigments, and for closing the windows of the scales. When Optix is disrupted, these coupling scales are transformed into brown scales containing melanin and open windows (Prakash et al., 2022b). In order to investigate how the presence of melanins in these scales affects ridge-ridge distances, we measured and compared this distance between WT silver coupling scales and Optix silver-to-brown transformed scales. In WT silver scales ridge-ridge distance is ~2800nm, but in Optix crispants, with extra melanin, this distance is narrower, ~2100nm (Supplementary Figure S5). This indicates that melanin is associated with tighter inter-ridge distances. In orange scales, where Optix represses melanins but promotes ommochrome synthesis, inter-ridge distances are even narrower ~1800nm (Figure 3B). This suggests that ommochromes are potentially more powerful ridge distance tighteners than melanins. Correspondingly, when Optix is disrupted in orange scales, replacing ommochromes with melanins, windows become the largest (Figure 3D). A similar effect is observed for inter-crossrib distances, which become narrower with increasing ommochrome pigmentation, decreasing window area (Figure 3C, D). In summary, the upper surface of scales becomes a tighter grid when there are more pigments in the scale, and ommochromes appear to have a stronger effect than melanins; the upper cuticular film is retained when melanins are absent, or present in very low amounts (as in the silver and orange scales), or when the grid of the upper lamina is tighter (as in the case for orange WT scales).
Lower lamina thickness increases with melanin content
To examine the effect of Optix on the lower lamina, we measured scale thickness in the three scale types of B. anynana (Figure 4A). We found that WT brown and Optix transformed scales, with the darker lower laminae (Figure 1H), and also with the highest melanin content, have the thickest lower laminae relative to WT orange scales (Figure 4B). This suggests that the presence of melanins, in particular, leads to thicker lower laminae.
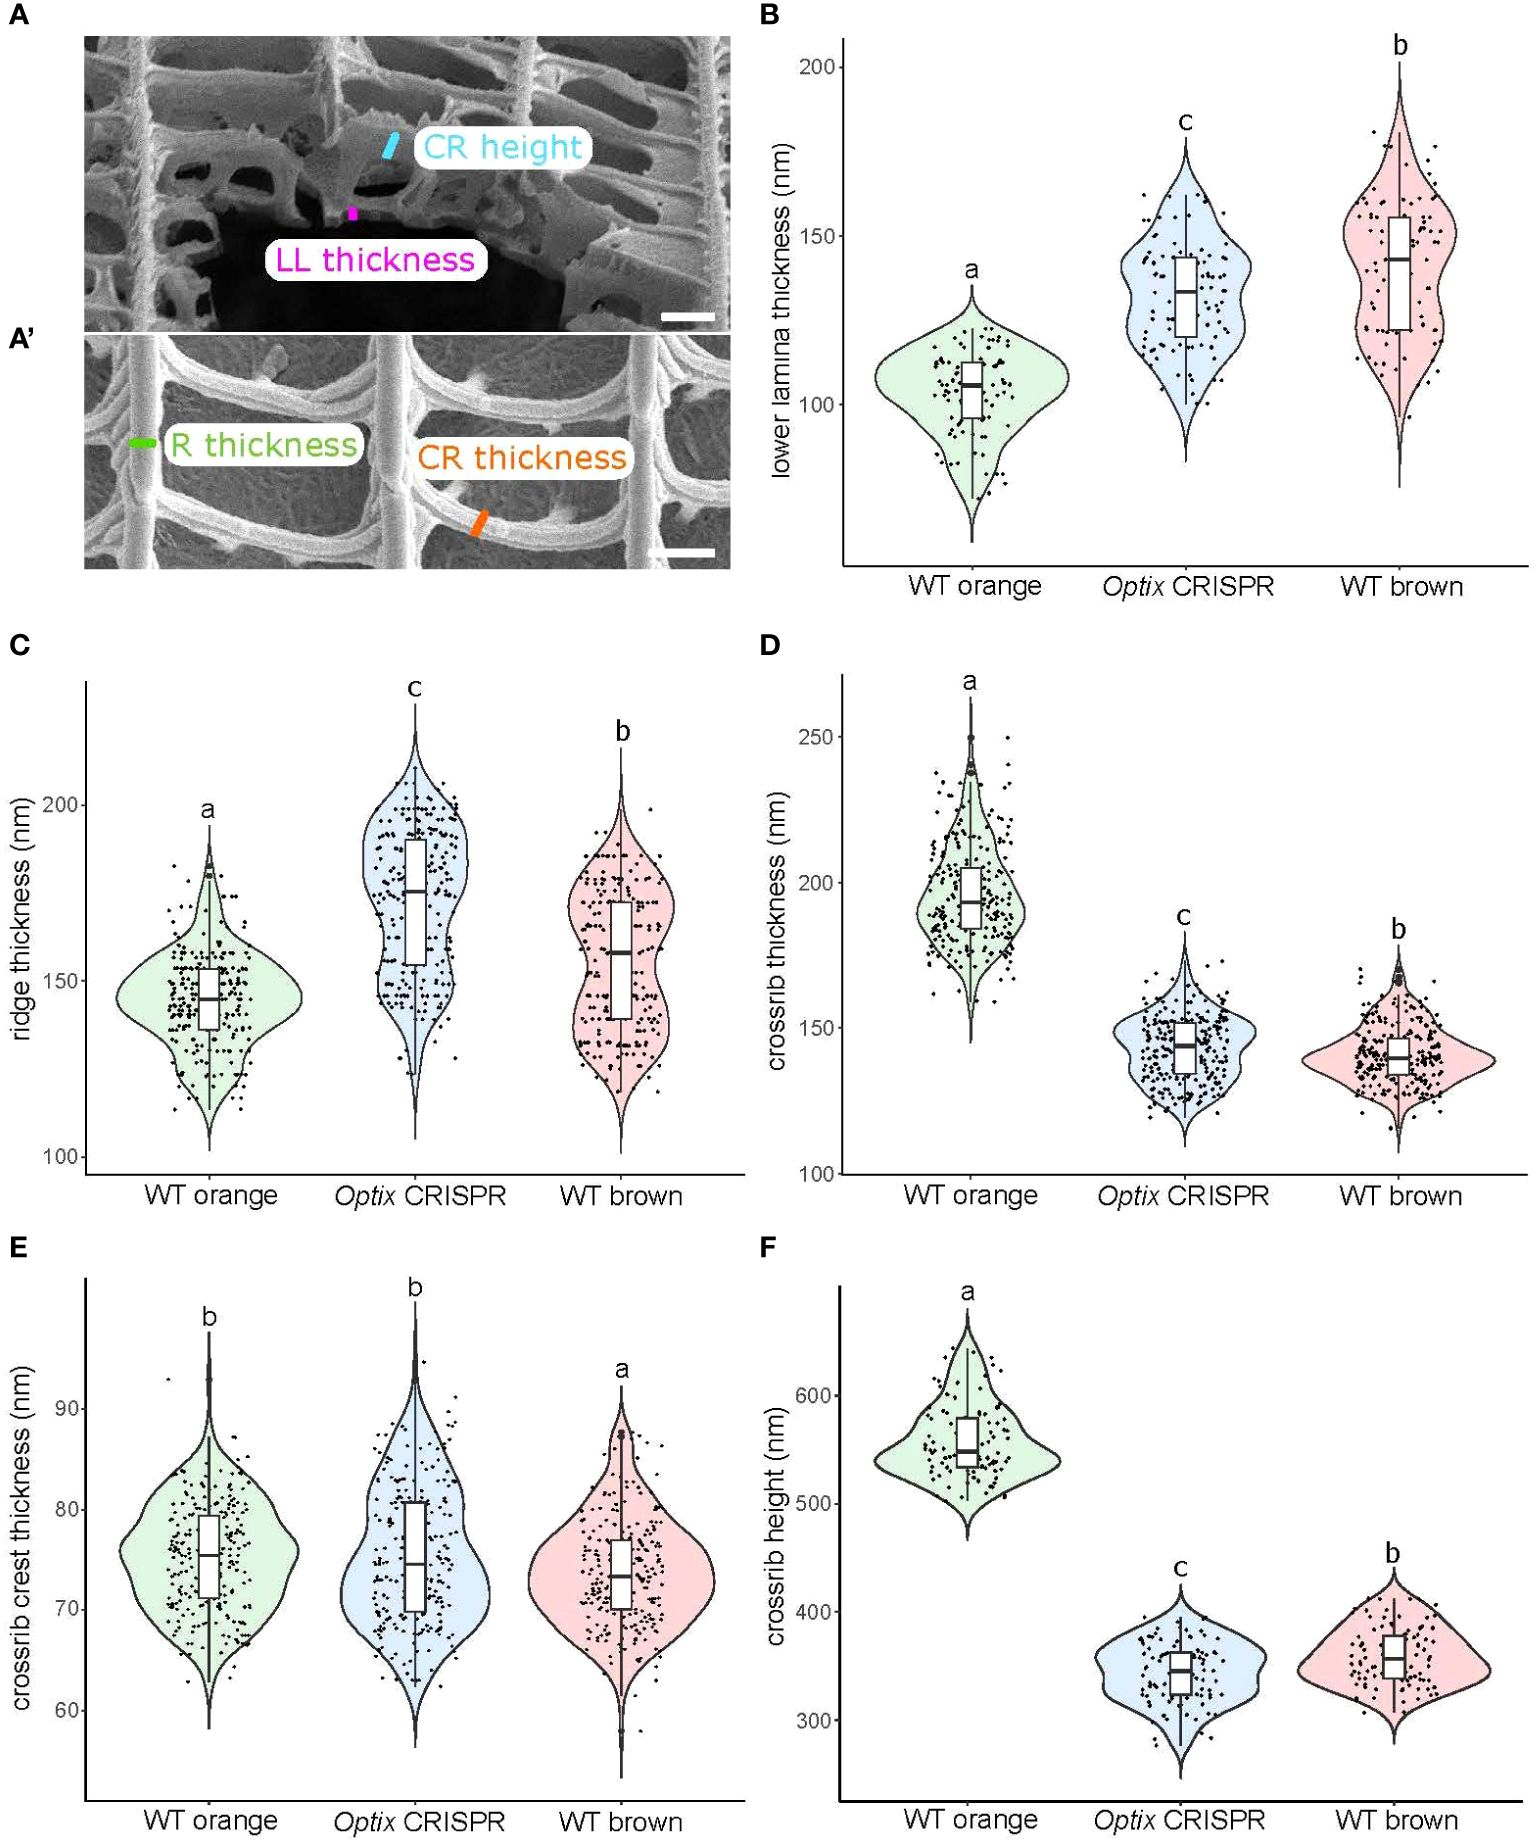
Figure 4 Characterization of nanostructure thicknesses of orange and brown scales in WT and Optix crispants. (A) SEM images acquired in FIB-SEM microscope of transverse section of scales were used to measure lower lamina thickness and crossrib height. A’ SEM images acquired in standard microscope of top view of scales were used to measure ridge and crossrib thicknesses. (B-F) Violin plots of measurements for the different scale types. (B) Lower lamina thickness; (C) Ridge thickness; (D) Crossrib thickness; (E) Crossribs crest thickness; (F) Crossrib height. Means sharing the same letter are not significantly different (Tukey-adjusted comparisons). The central line in the violin plot indicates the median of the distribution, while the top and bottom of the box represent the third and first quartiles of the data, respectively. The whiskers show up to 1.5 times the inter-quartile range. Scale bar = 500 nm.
To test whether similar effects are visible in the context of a disrupted melanin biosynthesis pathway, we measured the thickness of the lower lamina of orange scales in yellow, ebony and DDC loss-of-function mutants generated in a previous study (Matsuoka and Monteiro, 2018). In yellow crispants (with less melanin), the lower lamina is significantly thinner than WT orange scales, whereas the lower lamina is significantly thicker in ebony crispants (with more melanin) (Figure 5A; Supplementary Table S3). We found no significant differences in lower lamina thickness in DDC crispants (Figure 5A; Supplementary Table S3). These results suggest that the thinner lower lamina of orange scales is due, at least in part, to the little melanin present in these scales, relative to the other scales.
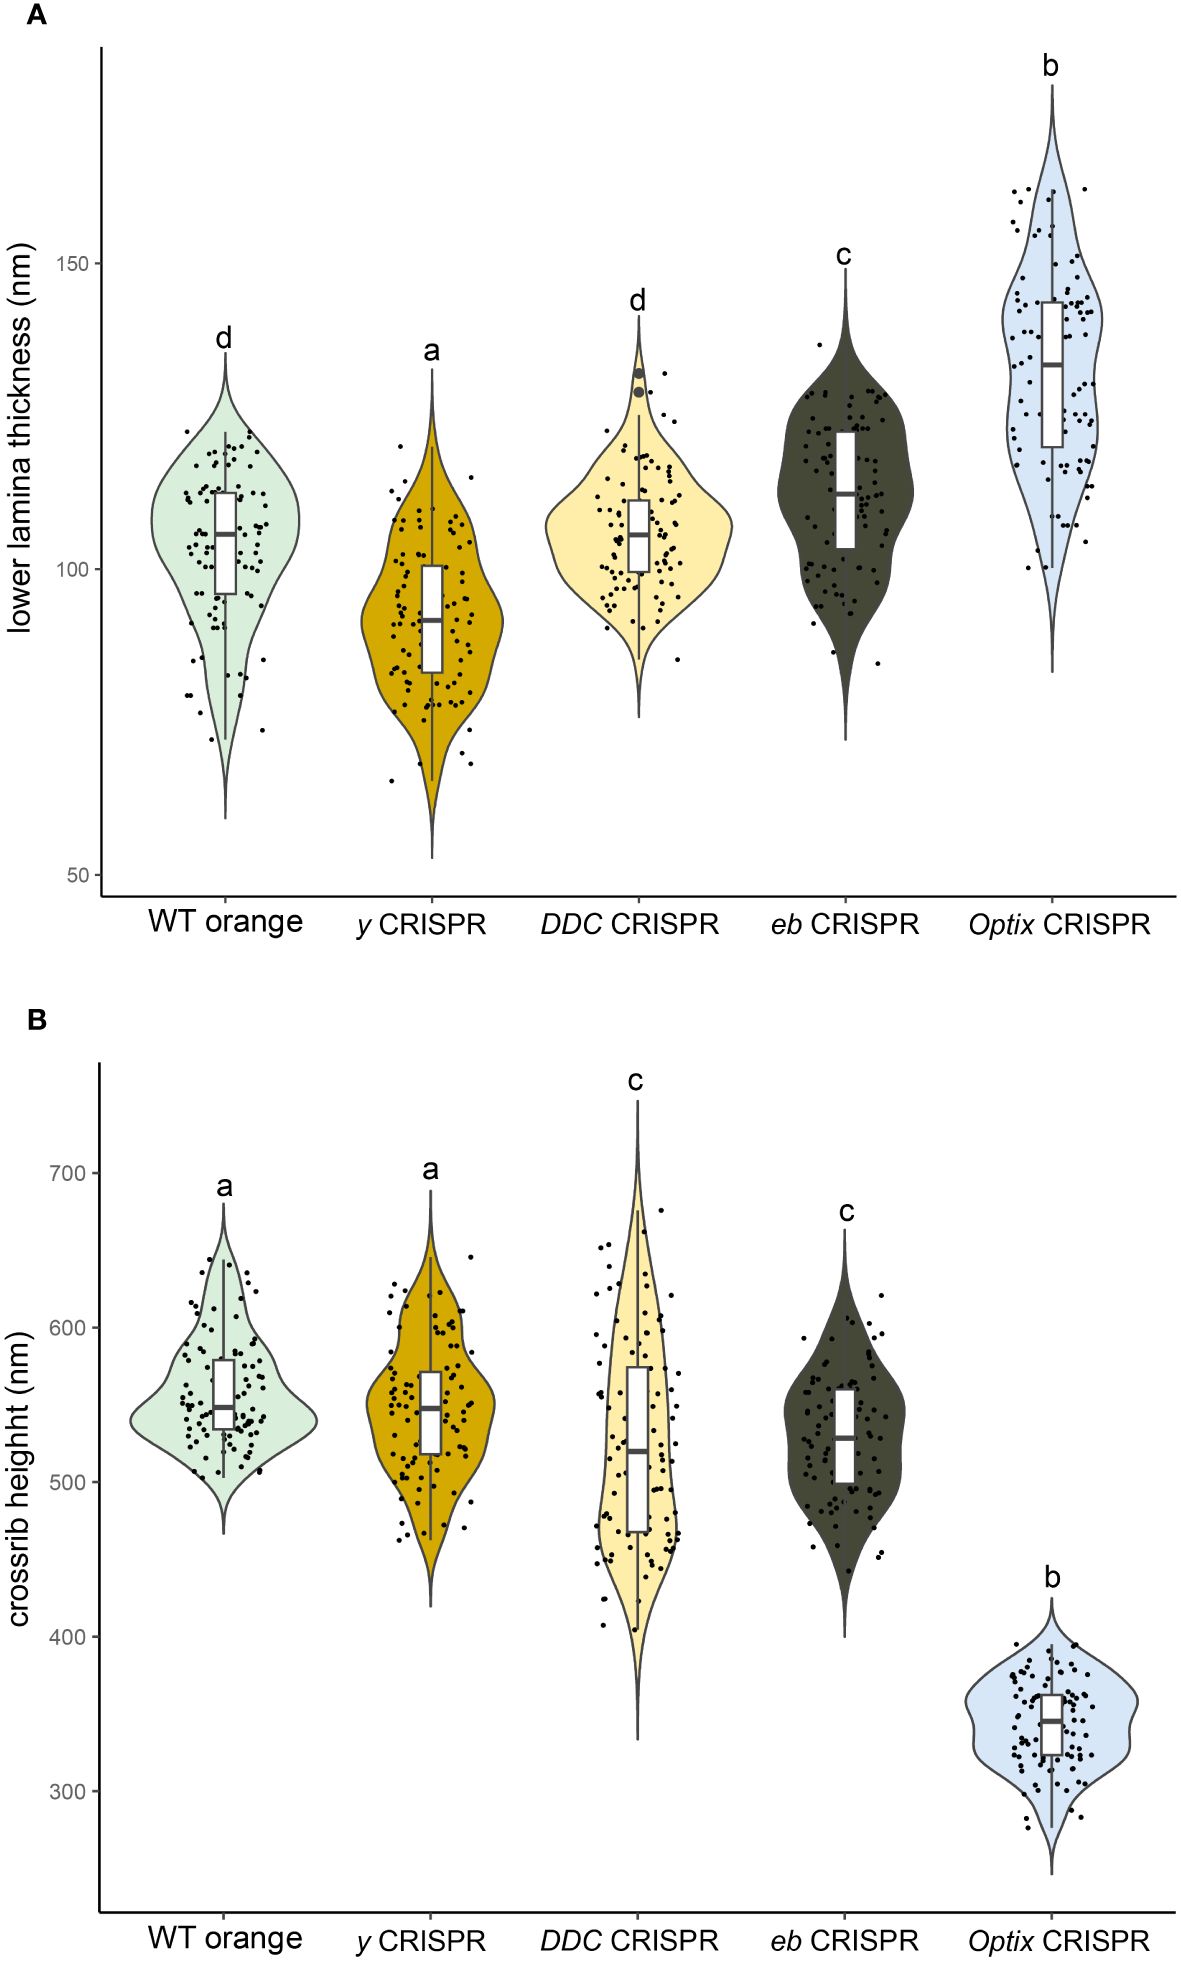
Figure 5 Investigation of geometries in loss-of-function mutants of the melanin biosynthesis pathway. (A) Violin plots of the lower lamina thicknesses of orange scales in yellow, DDC and ebony crispants. (B) Violin plots of the crossrib heights of orange scales in yellow, DDC and ebony crispants. Means sharing the same letter are not significantly different (Tukey-adjusted comparisons). Measurements in Optix mutants were added on the right for comparative purposes.
Melanins make ridges thicker and their absence make crossribs thicker and sheet-like
To examine the effect of Optix on the morphology of finer structures in the upper surface, we measured ridge thickness, crest-thickness (the only part of the ridge that is visible when surrounding windows are closed by an upper lamina), as well as crossrib height, in the three scale types. We found that in the two darker scales, Optix transformed orange scales and WT brown scales, with the largest amount of melanin and smaller amount of ommochromes, the ridges are thicker but the crossribs are narrower than the lighter orange scales (Figure 4C). We found no significant differences in crest-thickness across scale types (Figure 4E), but the lighter orange scales have thicker and deeper crossribs than the darker scales (Figures 4D, F). These results suggest that the presence of melanins in the ridges leads to thicker ridges, whereas the presence of ommochromes, or absence of melanins in the crossribs, leads to sheet-like crossribs.
To test whether removing melanins from the orange scales accentuates the sheet-like crossribs, we measured the height of crossribs in loss-of-function melanin pathway mutants (yellow, ebony, and DDC) generated in a previous study (Matsuoka and Monteiro, 2018). We found that crossrib height was only moderately or not at all affected in these mutants (Figure 5B; Supplementary Table S3). This indicates that little melanin is likely present in the crossribs of orange scales.
To test whether removing ommochromes from the orange scales and/or adding melanins impacts the shape of the crossribs, we measured the height of crossribs in Optix knockouts. We found that crossribs became shorter (Figure 5B; Supplementary Table S3). This indicates that either extra melanin or less ommochromes shortens the crossribs. Given that removing melanins from black scales (with DDC disruptions) leads to very tall sheet-like crossribs (Matsuoka and Monteiro, 2018), we propose that the moderate sheet-like cross-ribs of WT orange scales are primarily due to small amounts of pigments, especially melanin in these scales.
Discussion
Optix-induced changes in scale morphology likely result from changes in pigment composition
In the present study we examined how Optix, a transcription factor that differentiates the ommochrome-bearing orange scales (Banerjee and Monteiro, 2023; How et al., 2023), alters the color and morphology of these scales when disrupted. We show that in Optix knockouts the orange pigment is substituted by a brown pigment, likely melanins (Wasik et al., 2014; Matsuoka and Monteiro, 2018). This result is consistent with the proposed function for Optix as a switch gene, promoting ommochrome synthesis and repressing melanin synthesis, as previously shown in other butterfly species (Zhang et al., 2017). We show that pigments are primarily localized in the ridges and crossribs, but are also present at low levels in the lower lamina. And we show that pigmentation increased in all scale subcompartments, i.e. ridges, crossribs and lower lamina, following Optix disruption in B. anynana orange scales. We propose that the changes in pigmentation driven by Optix are sufficient to alter how chitin is polymerized within the scale, changing its morphology (see summary Figure 6). The observed effects on nanomorphology are summarized below.
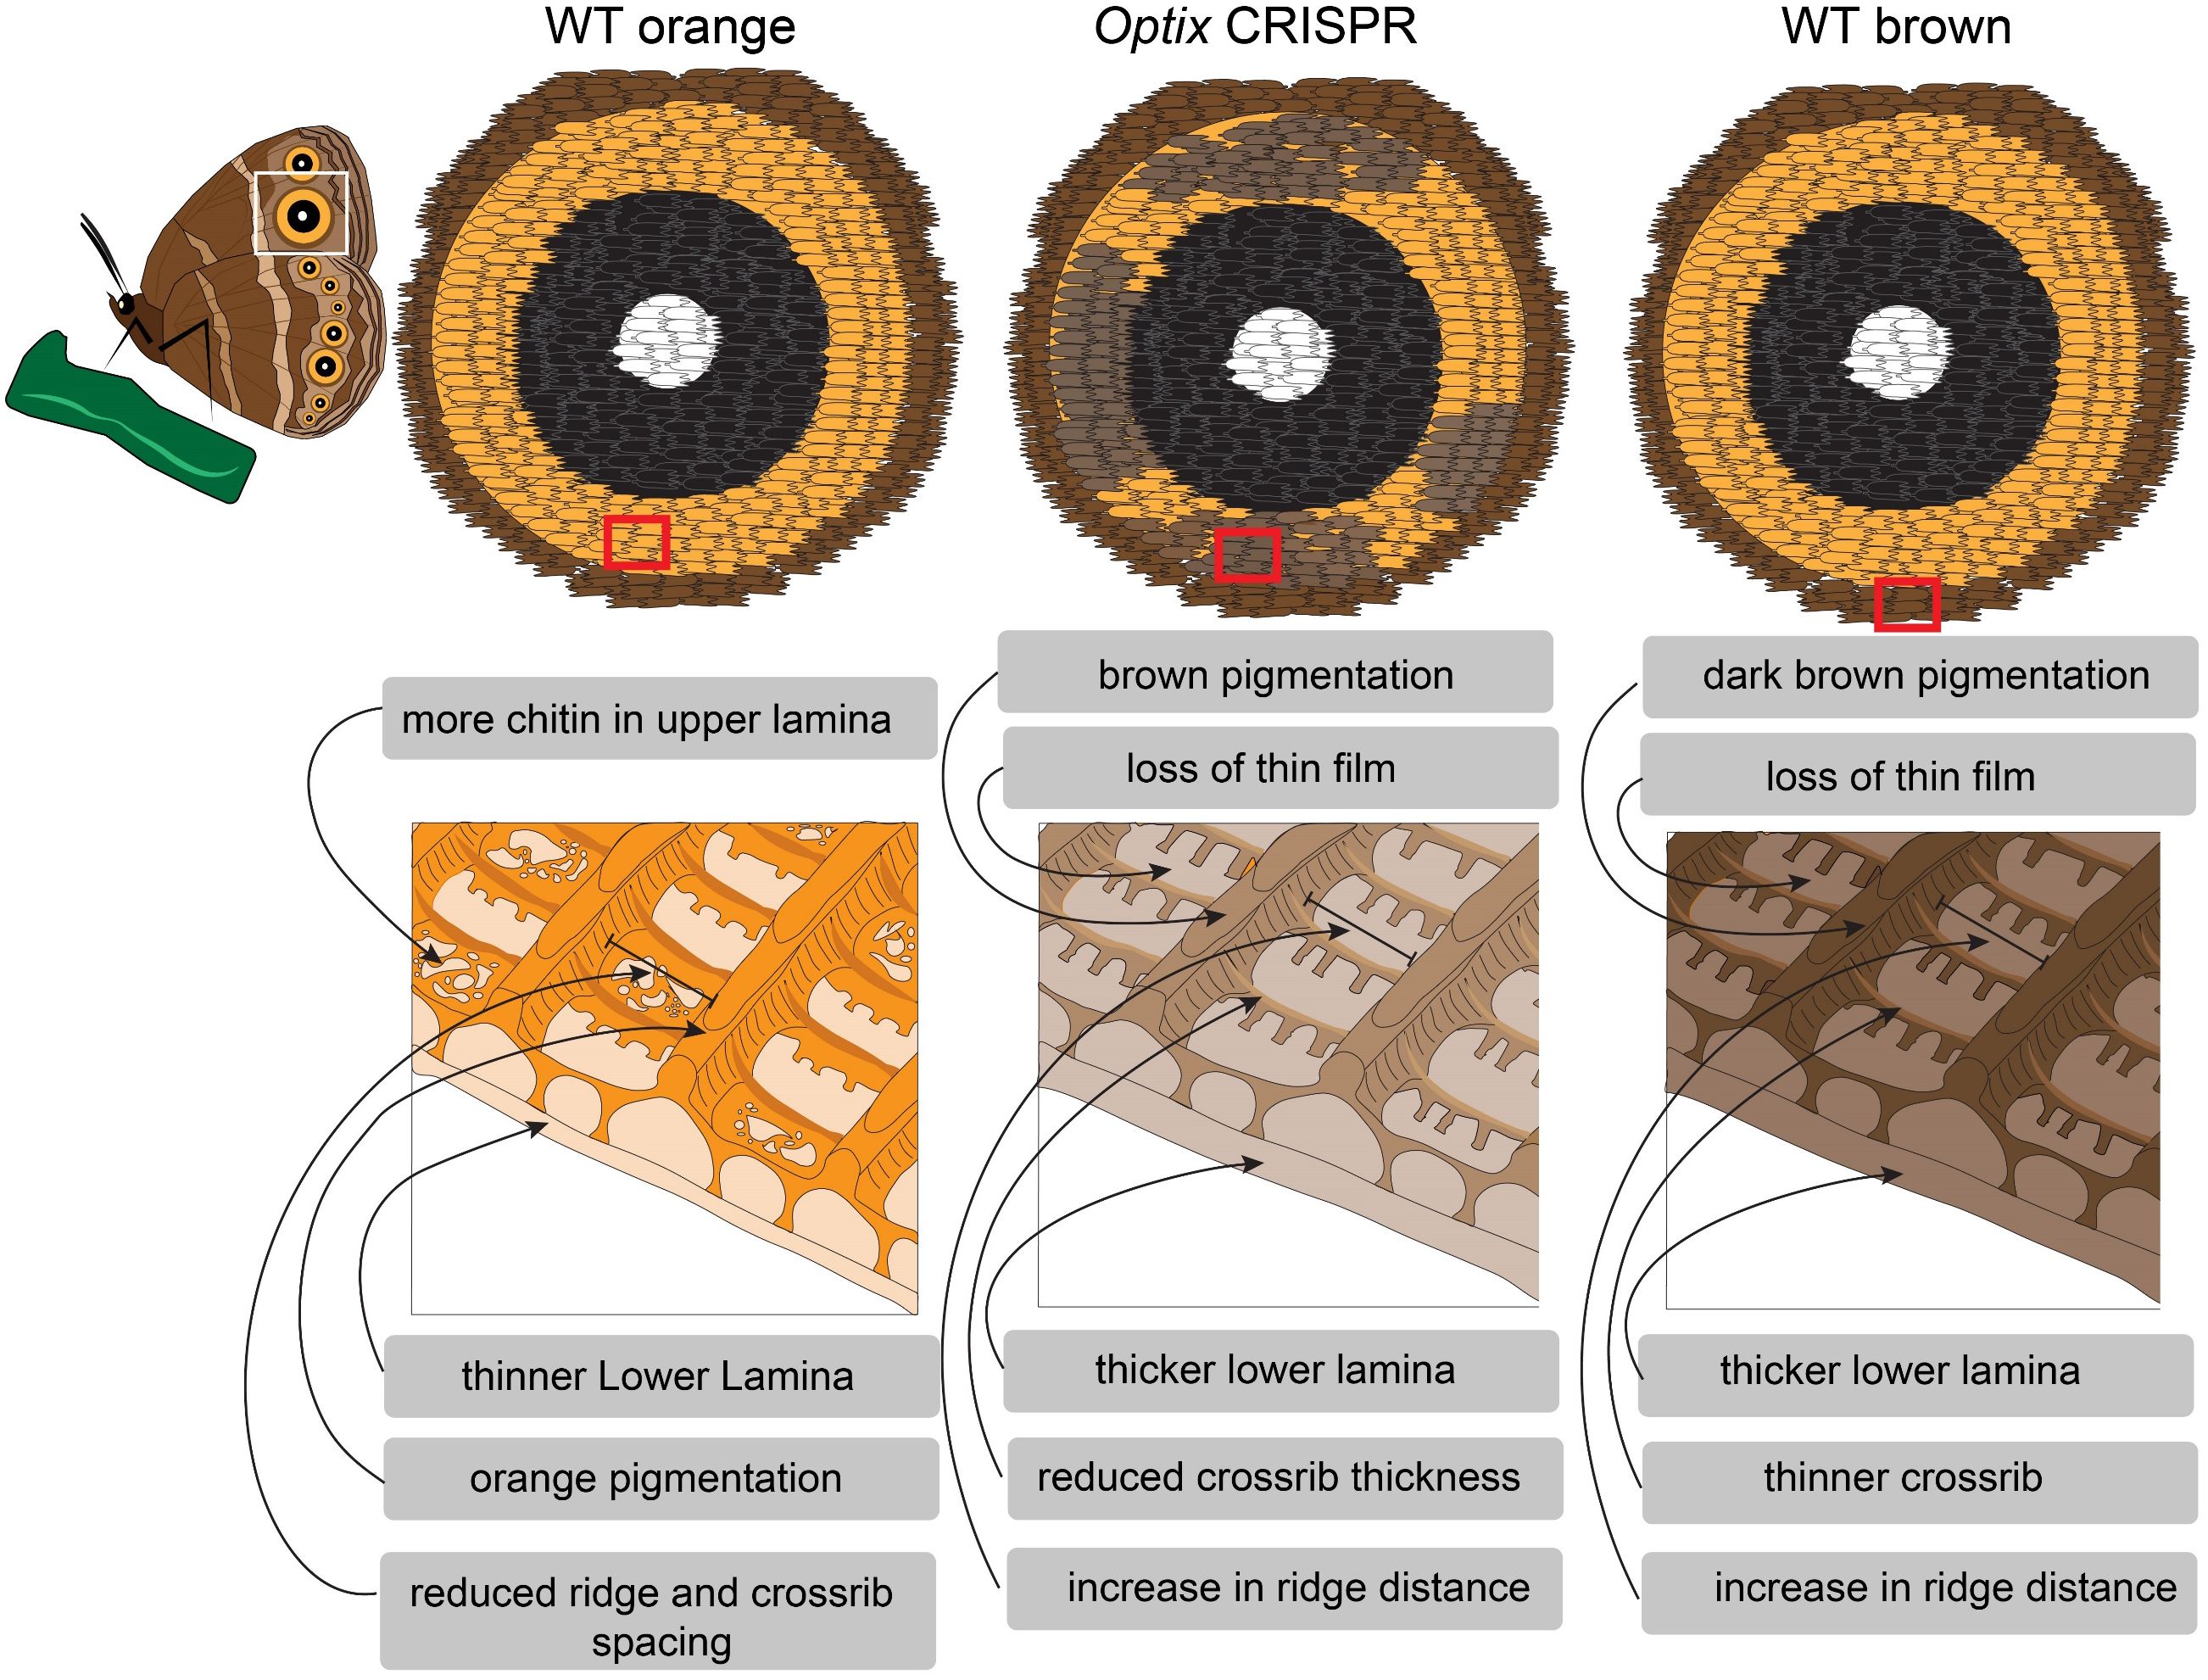
Figure 6 Summary of how Optix, via its effects on pigmentation, plays a role in the establishment of scale ultrastructure in B. anynana orange scales. Loss of Optix in the orange scales of the eyespots of B. anynana results in scales acquiring melanins, loosing ommochromes, increasing inter-ridge and crossrib spacing, thickening the lower lamina and the ridges, and loosing the thin film of the upper surface.
Optix reduces the lower lamina thickness and retains the thin film of the upper lamina
We showed scales that express Optix are characterized by a thin lower lamina and by remnants of a thin cuticular film in the upper surface. Optix knockout scales have thicker lower laminae and lose the thin film in the upper surface. Similar concurrent changes in pigmentation and thickness of the lower lamina were identified in Junonia orange scales, when Optix was disrupted (Thayer et al., 2020). Optix was proposed to be a pleiotropic gene that controls pigmentation pathways, and, separately, chitin deposition in the lower lamina (Thayer et al., 2020). Here we propose that Optix may merely act to promote ommochrome and repress melanin synthesis in scales, and that pigments, by themselves, can alter the way that chitin polymerizes to produce the scale’s skeleton.
Changes in lower lamina thickness, not only in an Optix mutant context but more generally, are often accompanied by changes in pigmentation (Prakash et al., 2022a). In the silver scales of B. anynana, where Optix represses melanins, Optix disruptions increase melanin content. We propose that this increase in melanin content thickens the lower lamina, and disrupts the thin film of the scales, opening windows (Prakash et al., 2022a). In addition, our investigation of melanin pathway mutants in orange scales showed that ebony mutants, with increased melanin content, had even thicker lower laminae, whereas yellow mutants, with less melanin, had thinner laminae. These yellow mutants also retained more of the upper thin film that closed the windows (Matsuoka and Monteiro, 2018). Taken together, these data suggest that the presence of melanins, on their own, are sufficient to promote thicker lower laminae, and disrupt upper thin films.
Optix keeps ridges thin and crossribs more sheet-like, probably via its effects as a melanin repressor
Within the upper surface, we found that Optix keeps ridges thin, but promotes thicker and sheet-like crossribs. We believe that thin ridges and sheet-like crossribs result from the gene’s effect on repressing melanins, whereas the thick crossribs may be due to the gene’s effect on promoting ommochromes. Optix transformed orange scales exhibit thicker ridges, as in WT brown scales, suggesting that the extra melanin in these scales promotes chitin polymerization around the ridges. Melanin pathway mutant orange scales, however, do not show changes in crossrib thickness (Matsuoka and Monteiro, 2018), nor height (this study), compared to WT orange scales, suggesting that little melanin is present in the ridges and crossribs of orange scales. We propose instead that ommochromes promote thicker crossribs, and when ommochromes are missing, via disruptions of Optix, crossribs become thinner.
These results in orange scales support those obtained for black scales, where disruptions of DDC, required for the synthesis of the brown pigment dopamine-melanin, led to melanin loss and to the polymerization of chitin in vertical sheets below crossribs, instead of in round pillars (Matsuoka and Monteiro, 2018).
Optix, likely via its promotion of ommochromes, tightens the upper surface grid
The upper surface of scales becomes a tighter grid when there are more pigments in the mass of the scale, and ommochromes appear to have a stronger effect than melanins in tightening inter-ridge and inter-crossrib distances. Previous disruptions of melanin-promoting genes showed that inter-ridge and inter-crossrib distances were not much affected in orange scales (Matsuoka and Monteiro, 2018). On the other hand, Optix disruptions, with the loss of ommochromes, produced the largest windows. The link between ridge and/or crossrib spacings, and the changes in pigment levels is still unclear. Buckling has been proposed as a plausible mechanism for the formation of ridges, where the growth of the scale surface meets mechanical constraints (Ghiradella, 1974). We propose that adding or removing pigments in the upper surface of scales impacts cuticle mechanical properties, e.g. elasticity, and this might impact buckling and ridge and crossrib spacing.
Melanization has previously been shown to control the mechanical properties of insect cuticles. In D. melanogaster, loss of yellow affects cuticle melanization and this leads to structural changes in bristles (Massey et al., 2019) and in wing shape rigidity (Riedel et al., 2011). In the red flour beetle Tribolium castaneum, changes in melanin pigmentation pathway genes affect both cuticle pigmentation and sclerotization (rigidity) (Arakane et al., 2009; Noh et al., 2016). A link between pigmentation and cuticle rigidity has also been shown in the moth Bombyx mori (Xiong et al., 2017) and Manduca sexta (Xu et al., 1997; Kerwin et al., 1999; Suderman et al., 2006). Future studies focused on the interaction between pigmentation and the structural properties of cuticle are of interest.
Pigments are probably sufficient to explain many features of scale morphology
In addition to previous studies on melanized scales (Matsuoka and Monteiro, 2018) and nearly unpigmented, silver scales (Prakash et al., 2022b), our investigation of ommochrome-containing scales in B. anynana brings further evidence that pigments alone might explain multiple features of scale morphology, as previously proposed by Matsuoka and Monteiro (2018). A recent ptychographic X-ray computed tomography-based analysis showed that low pigmentation correlates with high density cuticle, consisting mostly of crystalline alpha-chitin, in the lower lamina of B. anynana and Junonia orythia scales (Prakash et al., 2022a). The authors proposed that pigments, in addition to absorbing specific wavelengths, affect the way chitin polymerizes into more of less organized/crystalline structures. They also proposed that low pigment levels are associated with sheet-like structures, and high pigment levels are associated with rod-like chitin structures.
Such structural constraints might explain differences in nanostructure heights and thicknesses, where chitin polymerization is likely involved. Future dissection of enzymes downstream of Optix, especially those in the ommochrome pathway, will help confirm several of the inferences from this work. Mutations in these enzymes will have fewer pleiotropic effects relative to regulatory genes such as Optix, and will help pinpoint exactly, which aspect of a scale’s morphology is due to ommochrome pigments being present in the mass of the scale. Future work should also examine the role of cuticular proteins in scale morphology. In B. mori, the silencing of several of these proteins led to malformed ridges and crossribs (Liu et al., 2021). Future studies are needed to reveal the interconnected roles of chitin, pigments, and cuticular proteins in determining scale nano-morphologies.
Data availability statement
The original contributions presented in the study are included in the article/Supplementary Material. Further inquiries can be directed to the corresponding authors.
Author contributions
TDB: Conceptualization, Methodology, Validation, Formal analysis, Data curation, Visualization, Writing – original draft, Writing – review & editing. CF: Conceptualization, Methodology, Validation, Formal analysis, Data curation, Visualization, Writing – original draft, Writing – review & editing. KSS: Methodology, Writing – review & editing. AM: Conceptualization, Resources, Funding acquisition, Writing – review & editing.
Funding
The author(s) declare financial support was received for the research, authorship, and/or publication of this article. This project was supported by the National Research Foundation (NRF) Singapore, under its Investigatorship Program (award NRF-CRP20-2017-0001), NRF-CRP Program (award NRF-CRP25-2020-000), and the Ministry of Education (MOE) Singapore (award MOE-T2EP30222-0017).
Acknowledgments
We would like to thank Robert Reed for the anti-Optix antibody, Lee Ka Yau (SEM facility, Department of Chemistry, NUS) for his help with imaging the SEM samples. We thank Tan Lu Wee for arranging all the lab items on time. We thank DBS-CBIS confocal facility and Tong Yan for access to the Olympus fv3000 confocal microscope.
Conflict of interest
The authors declare that the research was conducted in the absence of any commercial or financial relationships that could be construed as a potential conflict of interest.
Publisher’s note
All claims expressed in this article are solely those of the authors and do not necessarily represent those of their affiliated organizations, or those of the publisher, the editors and the reviewers. Any product that may be evaluated in this article, or claim that may be made by its manufacturer, is not guaranteed or endorsed by the publisher.
Supplementary material
The Supplementary Material for this article can be found online at: https://www.frontiersin.org/articles/10.3389/fevo.2024.1392050/full#supplementary-material
References
Al Khatib A., Siomava N., Iannini A., Posnien N., Casares F. (2017). Specific expression and function of the Six3 optix in Drosophila serially homologous organs. Biol. Open 6, 1155–1164. doi: 10.1242/bio.023606
Arakane Y., Lomakin J., Beeman R. W., Muthukrishnan S., Gehrke S. H., Kanost M. R., et al. (2009). Molecular and functional analyses of amino acid decarboxylases involved in cuticle tanning in Tribolium castaneum. J. Biol. Chem. 284, 16584–16594. doi: 10.1074/jbc.M901629200
Banerjee T. D., Monteiro A. (2018). CRISPR-cas9 mediated genome editing in bicyclus anynana butterflies. Methods Protoc. 99, 155–172. doi: 10.3390/mps1020016
Banerjee T. D., Monteiro A. (2023). Reuse of a wing venation gene-regulatory subnetwork in patterning the eyespot rings of butterflies. bioRxiv. 9. doi: 10.1101/2021.05.22.445259
Finet C., Ruan Q., Bei Y. Y., You En Chan J., Saranathan V., Yang J. K. W., et al. (2023). Multi-scale dissection of wing transparency in the clearwing butterfly Phanus vitreus. J. R. Soc Interface 20, 20230135. doi: 10.1098/rsif.2023.0135
Ghiradella H. (1974). Development of ultraviolet-reflecting butterfly scales: How to make an interference filter. J. Morphol. 142, 395–409. doi: 10.1002/jmor.1051420404
Hothorn T., Bretz F., Westfall P. (2008). Simultaneous inference in general parametric models. Biometrical J. 50, 346–363. doi: 10.1002/bimj.200810425
How S., Banerjee T. D., Monteiro A. (2023). Vermilion and cinnabar are involved in ommochrome pigment biosynthesis in eyes but not wings of Bicyclus anynana butterflies. Sci. Rep. 13, 9368. doi: 10.1038/s41598-023-36491-9
Jiggins C. D., Wallbank R. W. R., Hanly J. J. (2017). Waiting in the wings: What can we learn about gene co-option from the diversification of butterfly wing patterns? Philos. Trans. R. Soc B Biol. Sci. 372, 20150485. doi: 10.1098/rstb.2015.0485
Kerwin J. L., Turecek F., Xu R., Kramer K. J., Hopkins T. L., Gatlin C. L., et al. (1999). Mass spectrometric analysis of catechoi-histidine adducts from insect cuticle. Anal. Biochem. 268, 229–237. doi: 10.1006/abio.1998.3069
Li Y., Jiang Y., Chen Y., Karandikar U., Hoffman K., Chattopadhyay A., et al. (2013). Optix functions as a link between the retinal determination network and the dpp pathway to control morphogenetic furrow progression in Drosophila. Dev. Biol. 381, 50–61. doi: 10.1016/j.ydbio.2013.06.015
Liu J., Chen Z., Xiao Y., Asano T., Li S., Peng L., et al. (2021). Lepidopteran wing scales contain abundant cross-linked film-forming histidine-rich cuticular proteins. Commun. Biol. 4, 491. doi: 10.1038/s42003-021-01996-4
Livraghi L., Hanly J., Van Belleghem S., Montejo-Kovacevich G., van der Heijden E., Loh L. S., et al. (2021). Cortex cis-regulatory switches establish scale colour identity and pattern diversity in Heliconius. Elife 10, e68549. doi: 10.7554/eLife.68549
Lloyd V. J., Nadeau N. J. (2021). The evolution of structural colour in butterflies. Curr. Opin. Genet. Dev. 69, 28–34. doi: 10.1016/j.gde.2021.01.004
Maia R., Eliason C. M., Bitton P. P., Doucet S. M., Shawkey M. D. (2013). pavo: An R package for the analysis, visualization and organization of spectral data. Methods Ecol. Evol. 4, 906–913. doi: 10.1111/2041-210X.12069
Martín M., Ostalé C. M., De Celis J. F. (2017). Patterning of the drosophila L2 vein is driven by regulatory interactions between region-specific transcription factors expressed in response to Dpp signalling. Development 144, 3168–3176. doi: 10.1242/dev.143461
Massey J. H., Chung D., Siwanowicz I., Stern D. L., Wittkopp P. J. (2019). The yellow gene influences drosophila male mating success through sex comb melanization. Elife 8, 1–20. doi: 10.7554/eLife.49388
Matsuoka Y., Monteiro A. (2018). Melanin pathway genes regulate color and morphology of butterfly wing scales. Cell Rep. 24, 56–65. doi: 10.1016/j.celrep.2018.05.092
Nijhout H. F. (1997). Ommochrome Pigmentation of the linea and rosa Seasonal Forms of Precis coenia (Lepidoptera: Nymphalidae). Arch. Insect Biochem. Physiol. 36, 215–222. doi: 10.1002/(SICI)1520-6327(1997)36:3<215::AID-ARCH5>3.0.CO;2-S
Nishida K., Adachi H., Moriyama M., Futahashi R., Hanson P. E., Kondo S. (2023). Butterfly wing color made of pigmented liquid. Cell Rep. 42, 112917. doi: 10.1016/j.celrep.2023.112917
Noh M. Y., Koo B., Kramer K. J., Muthukrishnan S., Arakane Y. (2016). Arylalkylamine N-acetyltransferase 1 gene (TcAANAT1) is required for cuticle morphology and pigmentation of the adult red flour beetle, Tribolium castaneum. Insect Biochem. Mol. Biol. 79, 119–129. doi: 10.1016/j.ibmb.2016.10.013
Pinheiro J., Bates D., DebRoy S., Sarkar D. (2023) nlme: Linear and nonlinear mixed effects models. Available online at: https://cran.r-project.org/package=nlme.
Prakash A., Balakrishnan D., Daurer B. J., Finet C., Lim Y. C., Shen Z., et al. (2022a). Nanoscale cuticle density variations correlate with pigmentation and color in butterfly wing scales. arXiv, 8–13. doi: 10.48550/arXiv.2305.16628
Prakash A., Finet C., Banerjee T.D., Saranathan V., Monteiro A. (2022b). Antennapedia and optix regulate metallic silver wing scale development and cell shape in Bicyclus anynana butterflies Graphical. Cell Rep. 40, 111052. doi: 10.1016/j.celrep.2022.111052
Quiring R., Walldorf U., Kloter U., Gehring W. J. (1994). Homology of the eyeless gene of drosophila to the small eye gene in mice and aniridia in humans. Science. 265, 785–789. doi: 10.1126/science.7914031
Reed R. D., McMillan W. O., Nagy L. M. (2008). Gene expression underlying adaptive variation in Heliconius wing patterns: Non-modular regulation of overlapping cinnabar and vermilion prepatterns. Proc. R. Soc B Biol. Sci. 275, 37–46. doi: 10.1098/rspb.2007.1115
Reed R. D., Papa R., Martin A., Hines H. M., Kronforst M. R., Chen R., et al. (2011). optix drives the repeated convergent evolution of butterfly wing pattern mimicry. Science. 333, 1137–1141. doi: 10.1126/science.1208227
Riedel F., Vorkel D., Eaton S. (2011). Megalin-dependent Yellow endocytosis restricts melanization in the Drosophila cuticle. Development 138, 149–158. doi: 10.1242/dev.056309
Schindelin J., Arganda-Carreras I., Frise E., Kaynig V., Longair M., Pietzsch T., et al. (2012). Fiji: An open-source platform for biological-image analysis. Nat. Methods 9, 676–682. doi: 10.1038/nmeth.2019
Seimiya M., Gehring W. J. (2000). The Drosophila homeobox gene optix is capable of inducing ectopic eyes by an eyeless-independent mechanism. Development 127, 1879–1886. doi: 10.1242/dev.127.9.1879
Stavenga D. G. (2023). Butterfly blues and greens caused by subtractive colour mixing of carotenoids and bile pigments. J. Comp. Physiol. A Neuroethol. Sensory Neural Behav. Physiol. doi: 10.1007/s00359-023-01656-4
Stavenga D. G., Matsushita A., Arikawa K. (2015). Combined pigmentary and structural effects tune wing scale coloration to color vision in the swallowtail butterfly Papilio xuthus. Zool. Lett. 1, 1–10. doi: 10.1186/s40851-015-0015-2
Suderman R. J., Dittmer N. T., Kanost M. R., Kramer K. J. (2006). Model reactions for insect cuticle sclerotization: Cross-linking of recombinant cuticular proteins upon their laccase-catalyzed oxidative conjugation with catechols. Insect Biochem. Mol. Biol. 36, 353–365. doi: 10.1016/j.ibmb.2006.01.012
Thayer R. C., Allen F. I., Patel N. H. (2020). Structural color in Junonia butterflies evolves by tuning scale lamina thickness. Elife 9, e52187. doi: 10.7554/eLife.52187
Thayer R. C., Patel N. H. (2023). A meta-analysis of butterfly structural colors: their color range, distribution and biological production. J. Exp. Biol. 226, jeb246940. doi: 10.1242/jeb.245940
Villinger C., Gregorius H., Kranz C., Höhn K., Münzberg C., Von Wichert G., et al. (2012). FIB/SEM tomography with TEM-like resolution for 3D imaging of high-pressure frozen cells. Histochem. Cell Biol. 138, 549–556. doi: 10.1007/s00418-012-1020-6
Wasik B. R., Liew S. F., Lilien D. A., Dinwiddie A. J., Noh H., Cao H., et al. (2014). Artificial selection for structural color on butterfly wings and comparison with natural evolution. Proc. Natl. Acad. Sci. U. S. A. 111, 12109–12114. doi: 10.1073/PNAS.1402770111/SUPPL_FILE/PNAS.201402770SI.PDF
Wijnen B., Leertouwer H. L., Stavenga D. G. (2007). Colors and pterin pigmentation of pierid butterfly wings. J. Insect Physiol. 53, 1206–1217. doi: 10.1016/j.jinsphys.2007.06.016
Wilts B. D., Matsushita A., Arikawa K., Stavenga D. G. (2015). Spectrally tuned structural and pigmentary coloration of birdwing butterfly wing scales. J. R. Soc Interface 12, 20150717. doi: 10.1098/rsif.2015.0717
Wilts B. D., Michielsen K., De Raedt H., Stavenga D. G. (2012a). Iridescence and spectral filtering of the gyroid-type photonic crystals in parides sesostris wing scales. Interface Focus 2, 681–687. doi: 10.1098/rsfs.2011.0082
Wilts B. D., Trzeciak T. M., Vukusic P., Stavenga D. G. (2012b). Papiliochrome II pigment reduces the angle dependency of structural wing colouration in nireus group papilionids. J. Exp. Biol. 215, 796–805. doi: 10.1242/jeb.060103
Xiong G., Tong X., Gai T., Li C., Qiao L., Monteiro A., et al. (2017). Body shape and coloration of silkworm larvae are influenced by a novel cuticular protein. Genetics 207, 1053–1066. doi: 10.1534/genetics.117.300300
Xu R., Huang X., Hopkins T. L., Kramer K. J. (1997). Catecholamine and histidyl protein cross-linked structures in sclerotized insect cuticle. Insect Biochem. Mol. Biol. 27, 101–108. doi: 10.1016/S0965-1748(96)00083-5
Yoshioka S., Kinoshita S. (2006). Structural or pigmentary? Origin of the distinctive white stripe on the blue wing of a Morpho butterfly. Proc. R. Soc B Biol. Sci. 273, 129–134. doi: 10.1098/rspb.2005.3314
Keywords: Optix, eyespot, ommochrome pigmentation, chitin synthesis, scale nanomorphology, Bicyclus anynana
Citation: Banerjee TD, Finet C, Seah KS and Monteiro A (2024) Optix regulates nanomorphology of butterfly scales primarily via its effects on pigmentation. Front. Ecol. Evol. 12:1392050. doi: 10.3389/fevo.2024.1392050
Received: 26 February 2024; Accepted: 17 April 2024;
Published: 01 May 2024.
Edited by:
Markus Friedrich, Wayne State University, United StatesReviewed by:
Barbora Konopová, Academy of Sciences of the Czech Republic (ASCR), CzechiaMichael Perry, University of California, San Diego, United States
Copyright © 2024 Banerjee, Finet, Seah and Monteiro. This is an open-access article distributed under the terms of the Creative Commons Attribution License (CC BY). The use, distribution or reproduction in other forums is permitted, provided the original author(s) and the copyright owner(s) are credited and that the original publication in this journal is cited, in accordance with accepted academic practice. No use, distribution or reproduction is permitted which does not comply with these terms.
*Correspondence: Tirtha Das Banerjee, ZGJzdGRiQG51cy5lZHUuc2c=; Cédric Finet, Y2VkcmljLmZpbmV0QGVucy1seW9uLm9yZw==; Antónia Monteiro, YW50b25pYS5tb250ZWlyb0BudXMuZWR1LnNn
†These authors have contributed equally to this work