 Anlin Li
 Yehua Yang2
94% of researchers rate our articles as excellent or good
Learn more about the work of our research integrity team to safeguard the quality of each article we publish.
Find out more
ORIGINAL RESEARCH article
Front. Ecol. Evol., 20 February 2024
Sec. Urban Ecology
Volume 12 - 2024 | https://doi.org/10.3389/fevo.2024.1366458
Environmental issues have become one of the important topics affecting China and the world. As the world’s most populous country and the second-largest economy, China’s environmental conditions have significant impacts on global ecosystems and sustainable development. To accurately determine the relationship between economic development and the environment, explore the non-coordination and spatial characteristics between the two, and promote regional sustainable development. This study is based on land-use data from four periods: 1990, 2000, 2010, and 2020. It uses the dynamic measurement and value equivalent method to explore the characteristics of land-use changes and measure the value of ecosystem services in the Central Yunnan Urban Agglomeration. At the same time, the study uses the non-coordination degree model and hotspot analysis tools to identify the non-coordination between Ecosystem Service Value and economic development (Gross Domestic Product), and explore the spatial characteristics between them. The research results show that: (1) The main land-use types include cultivated land, forest land, and grassland, which account for more than 90% of the total proportion. The land types with a small proportion in the region are water areas, construction land, and unused land. (2) The development level of ecosystem service value presents four types of changes: fluctuating increase, fluctuating decrease, continuous increase, and continuous decrease. The regional spatial distribution shows obvious regional heterogeneity, overall presenting a spatial distribution pattern of “low in the middle, high around.” (3) The average index of non-coordination degree from 1990 to 2020 is 0.591, 0.635, 0.584, and 0.565, showing a coordinated non-coordination coupling type. The regional space presents a spatial pattern of “high in the central and western regions, low in the northeastern and southern regions.” (4) The hotspots of non-coordination are mainly concentrated in the central and northwest regions of the Central Yunnan Urban Agglomeration, while the coldspots of non-coordination are mainly distributed in the northeastern, western, and southern regions of the Central Yunnan Urban Agglomeration, showing a regular agglomeration distribution. This study suggests that it is necessary to balance and coordinate the relationship between regional economic development and the environment.
Currently, with the further development of China’s reform and opening-up, the level of economic development continues to rise, but the development of the ecological environment is at odds with the social and economic development direction (Liu et al., 2021). Therefore, when the environment and economic development become a paradox, it is crucial to explore how to maintain steady economic development while coordinating the ecological environment and pursue a path of green and coordinated development (Wang et al., 2022). The 20th National Congress of the Communist Party of China pointed out, “We must firmly establish and practice the concept that green mountains and clear waters are as valuable as mountains of gold and silver, and we should plan development from the perspective of promoting harmony between humans and nature.” In addition, the 14th Five-Year Plan of China calls for “building an ecological civilization system, promoting comprehensive green transformation of economic and social development, and constructing a beautiful China” (Hu et al., 2023). As a pioneer in ecological civilization construction, Yunnan Province has achieved coordinated development between the economy and ecology through various means such as green development, ecological environmental protection and restoration, ecological compensation, and ecotourism. The Central Yunnan Urban Agglomeration, as one of the 19 key urban agglomerations cultivated by the country, relies on the “two horizontals and three verticals” urbanization strategy, the key area of the Western Development, and the important growth pole in the construction of the Yangtze River Economic Belt, which has promoted the rapid development of the regional economy in Central Yunnan (Zhang et al., 2023). However, with the decline in resource and energy self-sufficiency, water resource shortages, and conflicts in land use, environmental pollution has intensified in recent years, leading to significant environmental protection pressures (Yang et al., 2024; Zhang et al., 2024). Therefore, based on this background, taking the Central Yunnan Urban Agglomeration, which is facing increased pressure on resources and the environment, as the study area, this research utilizes land-use data to measure the level of ecosystem services and assess the non-coordination and spatial correlation between ecosystem service value and economic development. This study has important practical significance for promoting the transformation and upgrading of the industrial structure, coordinating regional economic development and ecological protection, and pursuing a path of coordinated and sustainable development (Qian, 2023).
The value of ecosystem services refers to the benefits that humans directly or indirectly derive from ecosystems. It mainly includes the input of useful materials and energy into the economic and social system, the acceptance and transformation of waste from the economic and social system, and the direct provision of services to human society. It involves four categories: provisioning, regulating, supporting, and cultural services (Ran et al., 2023; Vačkářová et al., 2023; Xiao et al., 2023; Xu et al., 2023). The level of ecosystem services plays a crucial role in ensuring human production and development (Willemen et al., 2013). As early as the mid-late 19th century, the Study of Critical Environmental Service (SCEP) introduced the term “Service” to describe ecosystem service functions in the “Report on the Human Impact on the Global Environment.” Thus, the evaluation of ecosystem service value began. Initially, Costanza calculated the ecosystem service value parameters at various scales based on a global perspective (Costanza et al., 1997, 2014). Since then, numerous scholars have conducted assessments of ecosystem service value for different regions based on adjusted parameters. Research on ecosystem service value mainly involves two methods: value equivalency factor and functional price methods (Kareiva and Marvier, 2003; Robertson and Swinton, 2005; Wang et al., 2014; Blumstein and Thompson, 2015). The former method is typically used for ecosystem assessment at larger regional scales, while the latter method is usually applied for assessing individual ecosystem service values (ESVs) at smaller to medium scales. Currently, we are in an era of rapid economic development, and countries are formulating relevant policies to promote economic development and urbanization to meet the growing development demands (Hong et al., 2021; Liu et al., 2023). The rapid development of regions has led to severe imbalances, causing significant damage to the integrity and composition of ecosystems and a reduction or imbalance in ecosystem service values. Faced with the contradiction between ecological crises and economic development, a considerable amount of work has been conducted to explore how to move towards coordinated development between economic development and the ecological environment (Fu et al., 2022; Song et al., 2023; Wyckhuys et al., 2023; Zhu et al., 2023). Kubiszewski et al. (2017) argue that when humans demand various services from ecosystems, they need to consider not only the current economic development needs but also the potential for future economic development. Cao et al. (2021) propose minimizing the cost of land urbanization for achieving the highest economic development level by adjusting urban land use in terms of ecosystem type and pattern to reduce the loss of ecosystem service values. Zhang et al. (2021) took 74 cities and counties in Hubei Province from 2000 to 2020 as an example. Based on the changes in ecosystem service values, they applied a coupled coordination degree model to calculate the Environmental and Economic Coordination (EEC). Through spatial correlation analysis, they detected the spatiotemporal differentiation characteristics of environmental and economic coordination and quantified the impact of driving factors on EEC using a spatial Durbin model. Fu et al. (2022) improved the biomass adjustment factor using normalized vegetation index and net primary productivity data. They constructed social and economic adjustment factors based on the willingness and ability to pay and resource scarcity, using the benefit transfer method and land use data in Hainan Province. Li et al. (2022) used the Haihe River Basin as the study area. They analyzed the relationship between changes in ecosystem service values and land cover type transition patterns in 2000, 2010, and 2020. They explored the potential mechanism of interaction between human activities and natural conditions. Through spatial-temporal analysis and model construction, they analyzed the changing trends of land cover and ecosystem service values in the basin during the respective study periods. They quantitatively evaluated the direct or indirect impacts of natural factors and socio-economic factors on ecosystem service values and their interactions.
Multiple studies have shown (Cheng et al., 2023; Zheng et al., 2023; Macêdo et al., 2024) that scholars have made some progress in exploring the relationship between economic development and the ecological environment. However, most of these studies have focused on short time series and large to medium scales to investigate the coordination between ecosystem service values and economic development. There is a lack of research at the county level to explore the non-coordination between ecosystem service values and economic development over long time series and to uncover the spatial characteristics of non-coordination regions. For the Central Yunnan City Cluster, as the only and most core economic development area in Yunnan Province, it is necessary to balance economic development with environmental protection. Therefore, considering the availability of comprehensive data, the variability of environmental issues, and the rapid economic development, this study aims to identify non-coordination regions between economic development and the ecological environment. Land use data of the Central Yunnan City Cluster from 1990 to 2020, which covers a long time series, are selected. The ecosystem service value is measured using the value equivalency method, and the non-coordination and spatial correlation characteristics between ecosystem service values and economic development are identified. By exploring the relationship between ecology and the economy and identifying non-coordination regions in the Central Yunnan City Cluster, this study can provide insights and references for promoting industrial structure optimization, improving the non-coordinated state of the ecological environment and the economy, and formulating relevant policies and recommendations.
The Central Yunnan City Cluster includes Kunming, Qujing, Yuxi, the entire territory of Chuxiong Yi Autonomous Prefecture, and seven counties and cities in Honghe Hani and Yi Autonomous Prefecture: Mengzi City, Gejiu City, Jianshui County, Kaiyuan County, Mile City, Luxi County, and Shiping County. There are a total of 49 county-level units, as shown in Figure 1. As one of the 19 city clusters that are key areas of national cultivation, the Central Yunnan City Cluster is an important part of the national urbanization strategy known as the “Two Horizontals and Three Verticals.” It is a key area for the Western Development Strategy and an important growth pole for China’s economic development supported by the Yangtze River. With the implementation of the national “Belt and Road Initiative,” the Central Yunnan City Cluster’s advantageous location for opening up to South Asia and Southeast Asia has become more prominent, ushering in a strategic period of rapid development. In 2020, the Central Yunnan City Cluster had a regional area of 114,600 square kilometers, accounting for 29% of the province’s total area. The total population was 21.95 million, accounting for 46.50% of the province’s population. The regional GDP reached 1507,395,000,000 Yuan, accounting for 61.47% of the province’s GDP. It is the core region driving the economic and social development of the entire province. However, with its increasing development pace in recent years, the Central Yunnan City Cluster has faced severe ecological problems such as land desertification, soil erosion, water scarcity, mining pollution, and heavy metal contamination. Protecting the ecological environment while promoting economic development has become a key concern for the Central Yunnan City Cluster (Yang et al., 2024; Zhang et al., 2024).

Figure 1 Overview of the research area. (A) Administrative boundaries of China; (B) Ad ministrative boundaries of Yunnan Province; (C) Regional Boundary of Central Yunnan Urban Agglomeration.
The land use data for the four periods (1990, 2000, 2010, and 2020) used in this study were obtained from the product data by Yang and Huang (2021) of Wuhan University. The overall accuracy of the data was verified to be 80%. The land use was classified into six categories according to the national remote sensing detection land use classification standards, including cropland, forestland, grassland, water bodies, construction land, and other land. Specifically, farmland conversion was categorized as cropland, while forest and shrub conversions were categorized as forestland. Non-permeable surfaces were classified as construction land, and ice, snow, bare land, and wetland conversions were classified as other land. Data for adjusting the coefficients of ecosystem service values were obtained from sources such as the “China Agricultural Product Price Survey Yearbook” and the “Statistical Yearbook of Yunnan Province.” These data included grain production, prices, and crop planting areas. The economic development levels of the counties in the Central Yunnan City Cluster from 1990 to 2020 were sourced from the “Statistical Yearbook of Yunnan Province,” “Statistical Yearbook of Kunming City,” “Statistical Yearbook of Qujing City,” “Statistical Yearbook of Yuxi City,” “Statistical Yearbook of Chuxiong Prefecture,” and “Statistical Yearbook of Honghe Prefecture.” The vector maps of the study area in the Central Yunnan City Cluster were obtained from the National Geographical Information Resource Catalog Service System, as shown in Table 1.
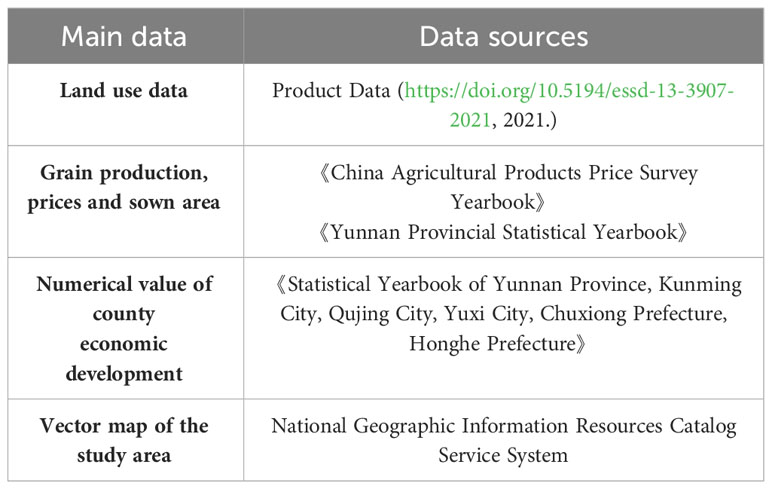
Table 1 Primary data sources.
The value equivalent per unit area method is used to calculate the value of ecosystem services. The method translates the various services provided by ecosystems, such as water retention, soil conservation, air purification, etc., into an economic value, which is measured in the form of a unit area. The value of ecosystem services in the central Yunnan urban agglomeration was estimated based on the value-equivalent method proposed by (GaoDi et al., 2003; GaoDi et al., 2008). The formula is shown below (Equation 1):
where ESV represents the total value of ecosystem services; h is the type of ecosystem, Ah is the area of ecosystem type h (hm2); E is the economic value of food production per unit area (yuan/hm2); and Ehj is the coefficient of ESV of type j for ecosystem type h.
The paper corrected the ecosystem service coefficient by the regional grain production as well as the sown area to correct the ecosystem service value per unit area of the region (Chen et al., 2022; Li et al., 2023). Among them, cultivated land corresponds to farmland, garden land takes the average value of forest and grassland, forest land corresponds to forest, grassland water body land type remains unchanged, other land corresponds to desert, and the index of ecosystem service value of construction land mainly refers to Deng (2012). Through the above calculation method, the correction coefficients of ecosystem value corresponding to the six land use types in the central Yunnan urban agglomeration were derived, and the results are shown in Table 2.
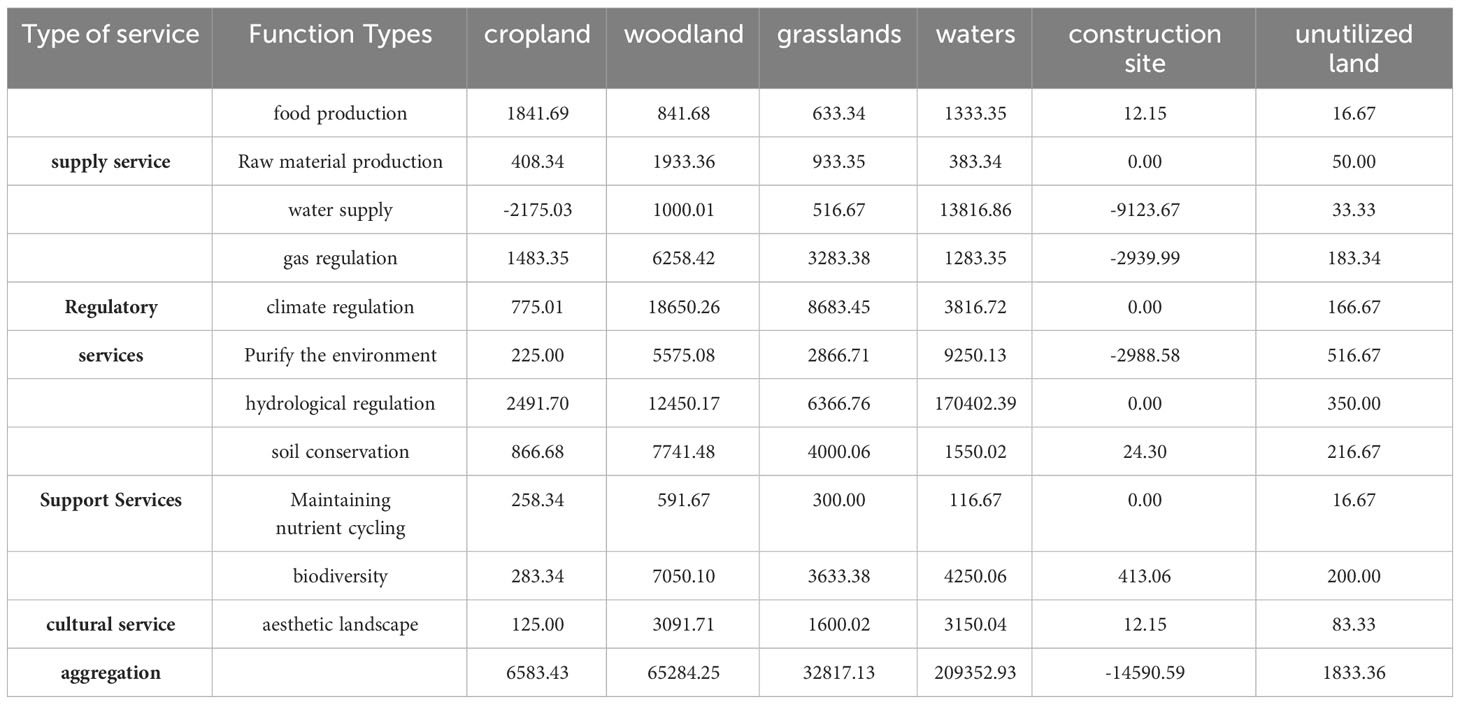
Table 2 Ecological service value coefficients per unit area of central yunnan urban agglomeration (yuan/hm2 · year).
The Coupling Coordination Degree (CCD) model is a comprehensive analytical tool used to study the interactions and coordination relationships among different systems or components. This model considers multiple systems or subsystems as a whole and takes into account their interdependencies and interactive effects to achieve overall coordination and optimization. In order to analyze the degree of non-coordination between regional ecological environment and economic development, this study draws on the Coupling Coordination Degree model proposed by Jiang et al. (2022). By constructing a non-coordination degree model, it quantitatively explores the spatio-temporal differences between ecosystem service values and the distribution of economic development in the Central Yunnan City Cluster. The formula for the non-coordination degree model is as follows (Equations 2–5):
In the formula, C is the coupling degree, D is the coupling coordination degree, ND is the uncoordinated coupling degree, T is the comprehensive coordination index of “ecology-economy”, U1 and U2 represent the comprehensive evaluation value of ecology and economy respectively, a and b are the coefficients to be determined. Regional sustainable development emphasizes the coordinated development of the economy and the environment, without differentiation between the two. Therefore, this study considers both ecological and economic development as equally important, with a value of 0.5 assigned to each. The variables C∈[0,1] and D∈[0,1] represent the degree of coupling and coordination between the two systems, respectively. The closer these values are to 1, the better the quality of coupling and coordination between the systems. Additionally, the variable ND∈[0,1] represents the degree of non-coordination between the systems, with a value closer to 1 indicating poorer quality of coordination. When categorizing the levels of non-coupling coordination, this study refers to previous research findings (Abu-Rayash and Dincer, 2023) and divides them into four levels, as shown in Table 3.
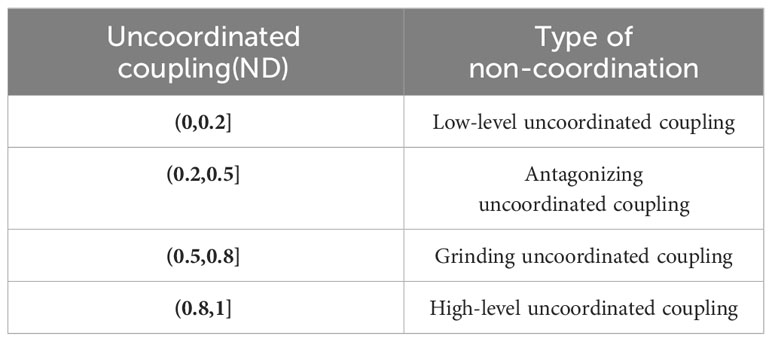
Table 3 Classification of non-coordination types.
Hotspot analysis is constructed based on the idea of null hypothesis testing, which is commonly used in statistical inference, and the hotspot analysis tool can effectively identify the locations where high or low value elements cluster spatially (Mashinini et al., 2020). In order to further reveal the uncoordinated spatial distribution pattern of ecosystem service value and economic development in the city cluster of central Yunnan, the spatial clustering of its uncoordinated high values (hotspots) and low values (coldspots) was explored by the tool of Arcgis 10.3. The formulas are as follows (Equations 6, 7):
where is the agglomeration index of non-coordination; Wij(d) is the weight between non-coordination i and j; xj is the attribute value; and n is the total number of non-coordination. Through the standardized processing of the above formula, the standardized formula is shown below:
In the formula, is the standard deviation of , and and are the variance and mathematical expectation of , respectively. The analysis results are presented in the following two ways: If is negative and passes the significance test, it indicates a spatial clustering with a low value of incoherence (cold spot). On the contrary, if is positive and passes the significance test, it indicates a spatial clustering with a high value of non-coherence (hot spot).
By processing and analyzing the land use raster data, the current status and changes of land use types in the urban agglomeration of central Yunnan from 1990 to 2020 were obtained, as shown in Table 4. In general, the land use types of Central Yunnan Urban Agglomeration mainly include cropland, forest land and grassland. In the past 30 years, the proportion of the three types has exceeded 20%, and the total proportion has reached more than 90%, indicating that cropland, forest land and grassland occupy an important position in the land use structure of the Central Yunnan Urban Agglomeration. On the other hand, the smaller proportion of regional land use area is occupied by the three types of water, construction land and unutilized land, which all account for less than 3% of the land use area from 1990 to 2020, which indicates that Central Yunnan Urban Agglomeration is located in the special topography of plateau and mountainous terrain, which leads to the deformed proportion of its land use types and the large gap in land use area. In addition, in terms of land changes, the land use area of the urban agglomeration in central Yunnan increased from 1990 to 2020 only in terms of construction land and unutilized land. Among them, the area of construction land continues to expand and grows faster, with an increase of 151,800 hm2 during the 30-year period, and the ratio of land use increased by 1.36%. This shows that with the continuous development of society and the improvement of regional economic level, the current status quo is difficult to meet the growing social needs, and constantly improving the modernization and development level to meet the development requirements has become an important goal of the current society. In 2020, the land use area of the four land use types, namely, cropland, forest land, grassland and water area, belongs to the decreasing state compared with 1990, and its area decreases by 82,500 hm2, 31,900 hm2, 6,700 hm2 and 32,100 hm2 respectively, which indicates that the improvement of the level of social development results in the reduction of the area of part of the ecological and production land.
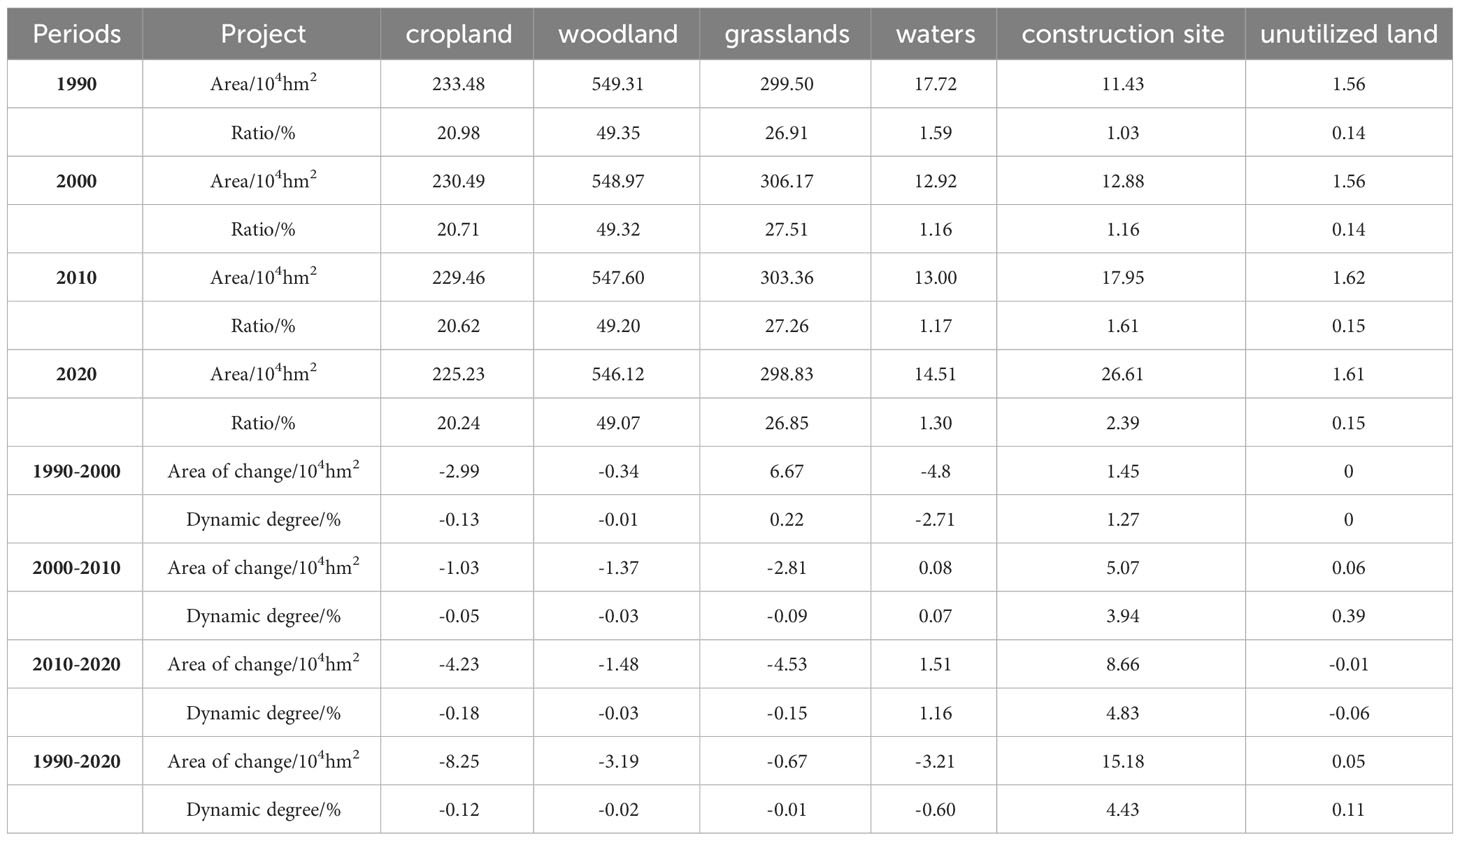
Table 4 Land use transfer matrix of central yunnan urban agglomeration from 1990 to 2020.
The land use dynamics of central Yunnan urban agglomeration was calculated for each year. From the results, it can be learned that the types of land use change include “continuous decline”, “continuous rise” and “fluctuation type”. Among them, the land-use dynamics of cultivated land and forested land belongs to the same type of continuous decline, and the dynamic changes of cultivated land are -0.13%, -0.05% and -0.18% respectively, with the total land-use dynamics of -0.12%; For forest land, it is -0.01%, -0.03% and -0.03%, and the total attitude is -0.02%; grassland, water and unutilized land are of fluctuating type, which are divided into two kinds: “increasing and then decreasing” and “decreasing and then increasing”, and grassland and unutilized land belong to the former, and water land belongs to the latter. Grassland and unutilized land belong to the former, while the water land category belongs to the latter. The land use motivation of grassland is 0.22%, -0.09% and -0.15%, with an overall rate of -0.01%, while that of unutilized land is 0%, 0.39% and -0.06%, with an overall rate of 0.11%. The land use dynamics of the water area land category shows the evolution process of “decreasing and then increasing”, with values of -2.71%, 0.07% and 1.16% respectively, and the total land use dynamics of -0.6%; the land use dynamics of the construction land category is of the “continuously increasing type”, and its dynamics ratio continues to increase, with values of 1.27%, 3.94% and 4.83% respectively, and the overall dynamics rate of 4.43%. The land use dynamics of the construction land category is “continuously rising type”, and its dynamics ratio increases continuously, with values of 1.27%, 3.94% and 4.83% respectively, and the overall dynamics rate is 4.43%.
Based on the coefficient of ecological service value per unit area of central Yunnan urban agglomeration and the current status of land use development, the ecosystem service value of central Yunnan urban agglomeration from 1990 to 2020 was calculated by the value equivalent method, and the results are shown in Figure 2. From the time level, the ecosystem service value of Central Yunnan Urban Agglomeration shows four types of changes, including fluctuating increase, fluctuating decrease, continuous increase and continuous decrease type. Among them, the number of fluctuating upward type is 16, which occupies 32.65% of the whole study area; the number of fluctuating downward type is 21, which occupies 42.86%; the number of sustained upward type is 3, which occupies 6.12%; and the number of sustained downward type is 9, which occupies 18.37% of the samples in the study area. In addition, combining the four types of changes into upward and downward types, the ratio of upward type is 38.77%, while downward type is 61.23%. This indicates that the deepening of reform and opening up and the increasing level of socio-economic development have led to a trend of weakening ecosystem service value in most areas, further weakening of ecological security and degradation of ecological functions. From the spatial level, the ecosystem service value index of the Central Yunnan Urban Agglomeration from 1990 to 2020 has obvious regional differences, generally showing a spatial distribution pattern of “low in the middle and high in the surroundings”. Among them, the areas with low ecosystem service value are mainly concentrated in Xishan District, Anning City, Jinning District, Hongta District, Tonghai County, Huaning County, Jiangchuan District, Shilin County, Luxi County, Luliang County, Kirin District, Malong District, Chongming County, Fuming County, Panlong District, Guandu District, Chengjiang County, Wêncǎo City, and Muding County in the inner part of the Central Yunnan Province. This area is mainly concentrated in the Kunming Municipal Jurisdiction, indicating that the continuous development of the regional economy occupies a large amount of land for ecological resources, and in order to meet the requirements of regional construction and development, part of the land for forests, grasses and watersheds is converted into land for construction, which leads to a rapid decline in the level of regional ecological development and weakening of the ecological function. In addition, areas of high ecosystem service value are mainly located in the peripheral areas of the central Yunnan urban agglomeration, such as Xuanwei City, Huize County, Luquan County, Xundian County, Wuding County, Dayao County, Lufeng County, Chuxiong City, Shuangbai County, Xinping County, Yuanjiang County, Shiping County, Jianshui County, Kailuan County and City, Mengzi City, Mile City, Shizong County, Luoping County, Fuyuan County and Zhanyi District, among other places. The region is mainly concentrated in the fringe areas, where economic development is smooth and ecological damage caused by regional development is relatively weak, and the region is relatively large and has a wide range of land use types, making its ecosystem service value coefficient relatively high.
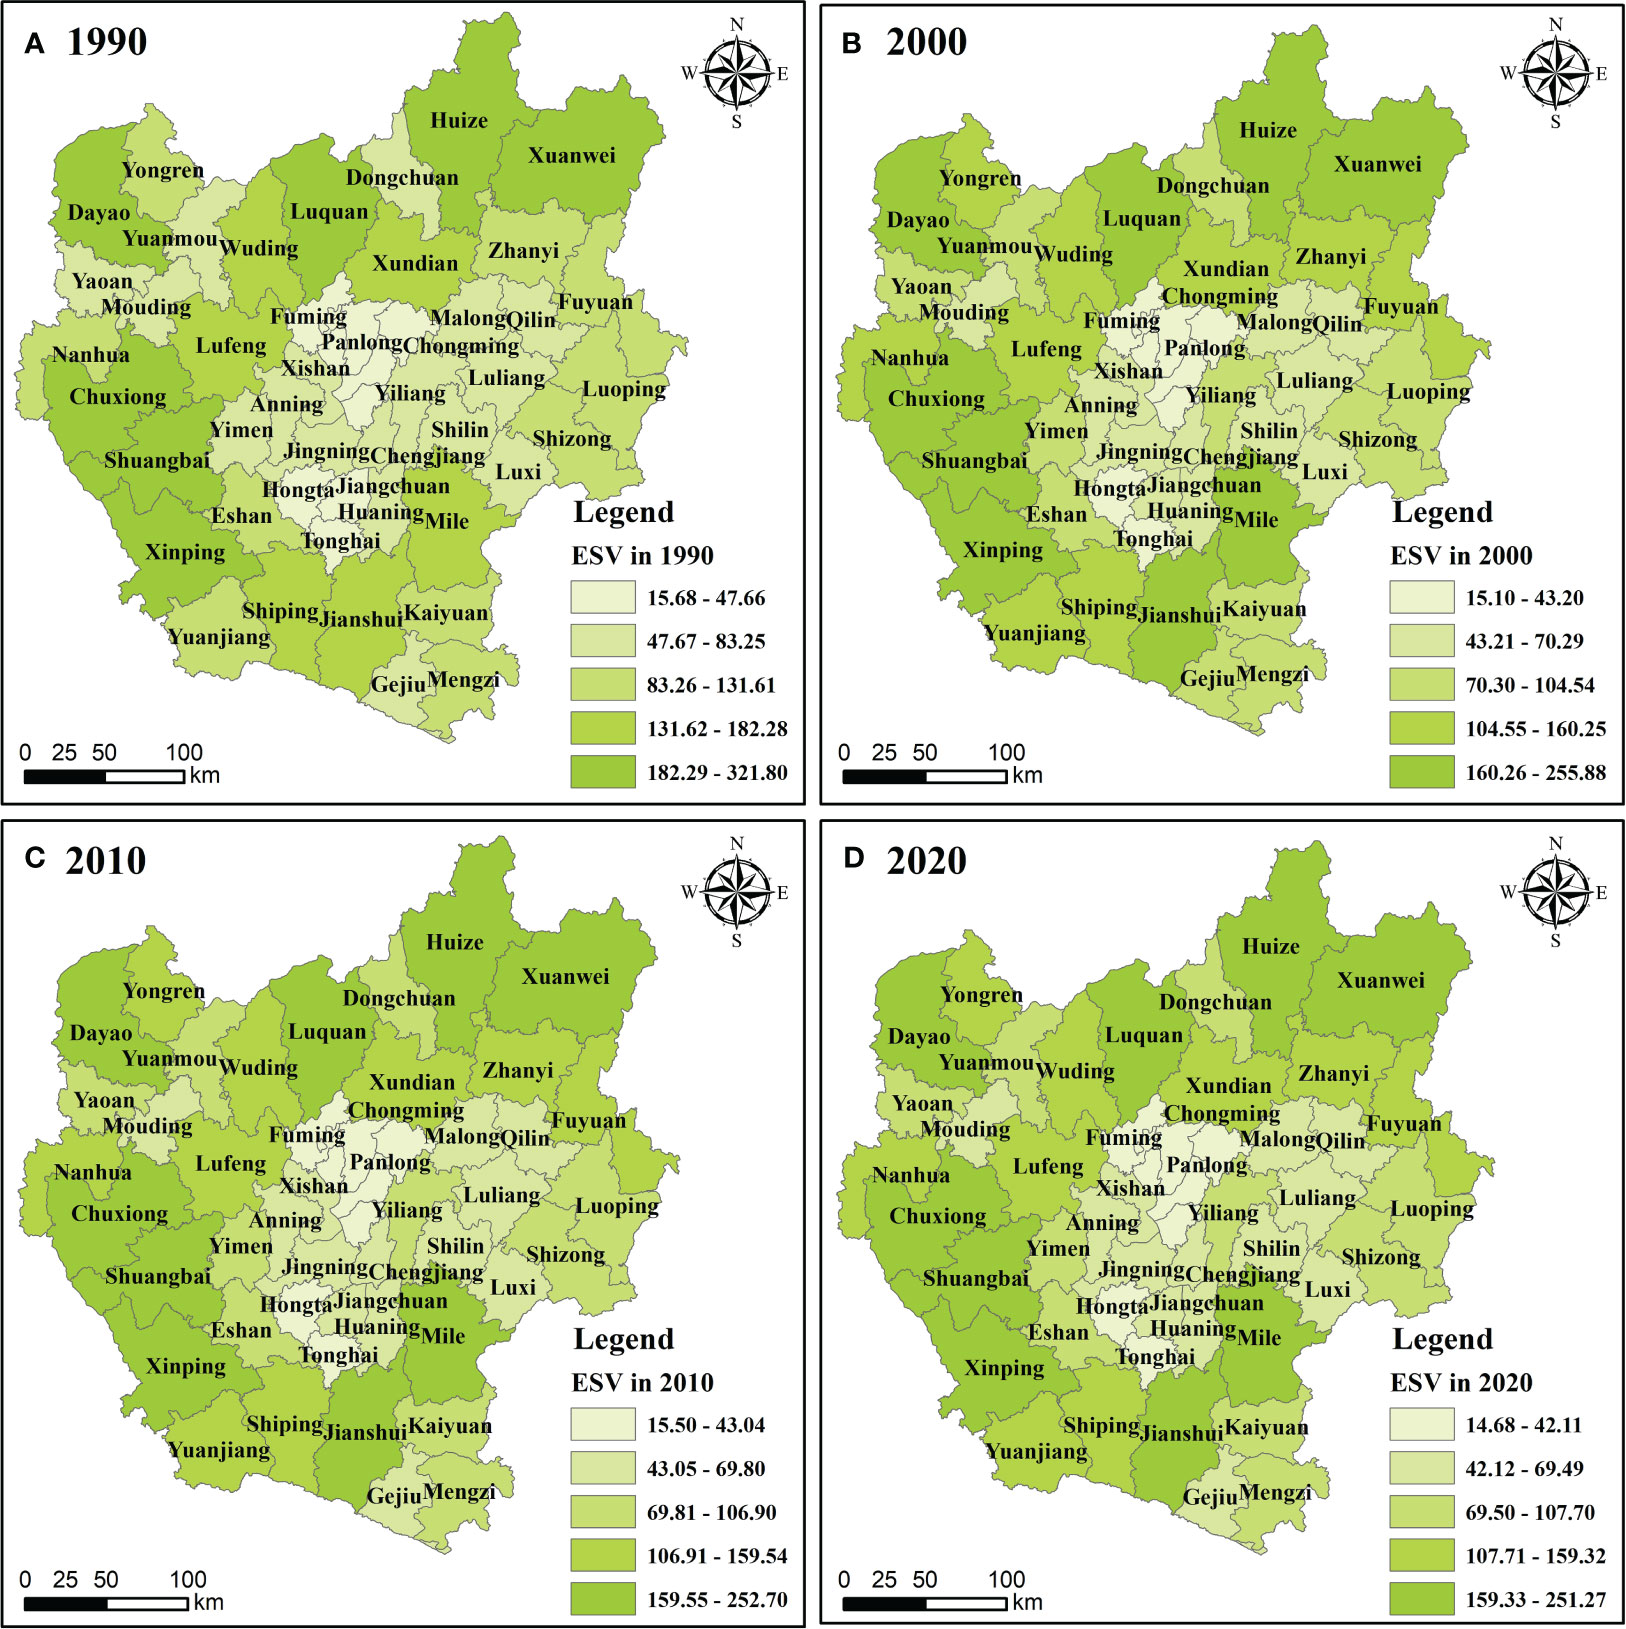
Figure 2 Value of County Ecosystem Services in Central Yunnan Urban Agglomeration from 1990 to 2020. (A) is the value of ecosystem services of counties in the central Yunnan urban agglomeration in 1990; (B) is the value of ecosystem services of counties in the central Yunnan urban agglomeration in 2000; (C) is the value of ecosystem services of counties in the central Yunnan urban agglomeration in 2010; and (D) is the value of ecosystem services of counties in the central Yunnan urban agglomeration in 2020.
By collecting the GDP development status of the counties in the Central Yunnan Urban Agglomeration from 1990 to 2020, as shown in Figure 3. from the time level, its regional development trend shows a steady increase and its development speed is fast. the average value of GDP development level of the Central Yunnan Urban Agglomeration in the years of 1990-2020 is 6.25, 2.066, 9.8, and 30.762 billion yuan, respectively. the average value of GDP development level of the Central Yunnan Urban Agglomeration in the years of 2020 is 30.762 billion yuan. Compared with 1990, the average value of GDP has increased by 30.137 billion yuan, and its growth value is 48.21 times of that of 1990. This indicates that the city cluster in central Yunnan, as the central hinterland of Yunnan’s economic construction, gives full play to the characteristics and advantages of the city economic circle in central Yunnan, forms and strengthens the dominant function of the city economic circle in central Yunnan, clarifies the direction and focus of the coordinated development of the city economic circle in central Yunnan, and further promotes the development of the regional economic level of the city cluster in central Yunnan. From the spatial level, the GDP of Central Yunnan City Cluster shows irregular distribution characteristics. Among them, the high-value areas are mainly concentrated in Qilin District, Hongta District, Xishan District, Guandu District, Chuxiong City, Xuanwei City, Mile City and Anning City, etc., which are mainly used as the “veteran districts” of economic development in the central Yunnan urban agglomeration, and the regional economic development has obvious regional characteristics. And part of the region as county-level cities, economic development conditions are relatively favorable. In addition, the relatively low GDP area of the Central Yunnan Urban Agglomeration is mainly concentrated in the northern, northwestern, southwestern and southern regions, which are far away from the center of economic development and have relatively low regional economic radiation capacity, resulting in the regional economy of most counties and districts lagging behind that of the central region.

Figure 3 Gross Domestic Product of County Areas in the Central Yunnan Urban Agglomeration from 1990 to 2020. (A) Economic development value of counties in central Yunnan urban agglomeration in 1990; (B) Economic development value of counties in central Yunnan urban agglomeration in 2000; (C) Economic development value of counties in central Yunnan urban agglomeration in 2010; and (D) Economic development value of counties in central Yunnan urban agglomeration in 2020.
Using the coupling coordination degree model, the development level of non-coordination degree of ecosystem service value and economic development of the Central Yunnan Urban Agglomeration can be obtained by calculating its non-coordination coupling degree, and the results are shown in Figure 4: At the time level, the non-coordination development indexes of 49 counties in the Central Yunnan Urban Agglomeration also show four types of changes, including fluctuating upward, fluctuating downward, continuously upward, and continuously downward. Among them, compared with the types of changes in the development of ecosystem service value coefficients in the Central Yunnan Urban Agglomeration from 1990 to 2020, the fluctuating upward and fluctuating downward types accounted for an increasing proportion, accounting for 38.78% and 48.98% of the samples in the study area, respectively. On the other hand, the proportion of the continuously rising and continuously declining types decreased significantly, with its proportion only being 10.20% and 2.04%. In addition, from its mean index, the development level index of non-coordination degree of central Yunnan urban agglomeration from 1990 to 2020 is 0.591, 0.635, 0.584 and 0.565, respectively, and its corresponding non-coordination types are all grinding non-coordination coupling, and the development type is fluctuating and decreasing, which shows a tendency of increasing and then decreasing first. This shows that from 1990 to 2000, under the guidance of the social development policy, the city cluster in central Yunnan vigorously promoted the level of economic development and neglected the protection of the ecological environment, which to a certain extent led to the damage of the ecological function, resulting in the enhancement of the index of non-coordination. However, with the continuous development of the society, the concept of economic development and ecological environment is more and more deeply rooted in the people’s mind, and the past damage to the ecology in exchange for economic development has been discarded. 2010 China’s eco-compensation laws and regulations, policies, and practices have been synchronized to promote a large number of eco-protection policies have been implemented. At the same time, through the effective use of economic means, promoting energy conservation and emission reduction and environmental protection, and promoting industrial restructuring, the index of non-coordination between ecological and economic development has decreased rapidly. From the spatial level, the non-coordination between ecosystem service value and economic development in the Central Yunnan Urban Agglomeration from 1990 to 2020 shows a spatial pattern of “high in the central and western part and low in the northeastern and southern part”. Among them, the areas with high and higher values in all four years are Yongren County, Yuanmou County, Yaoan County, Muding County, Haitong County, Huaning County, Jiangchuan County, Shilin County, Luxi County, Malong District, Chongming County and Fuming County. And its low value areas are mainly located in Huize County, Xuanwei City, Mile City, Chuxiong City, Jianshui County, Hongta District, Lufeng County, Zhanyi District, Qilin District and Fuyuan County.
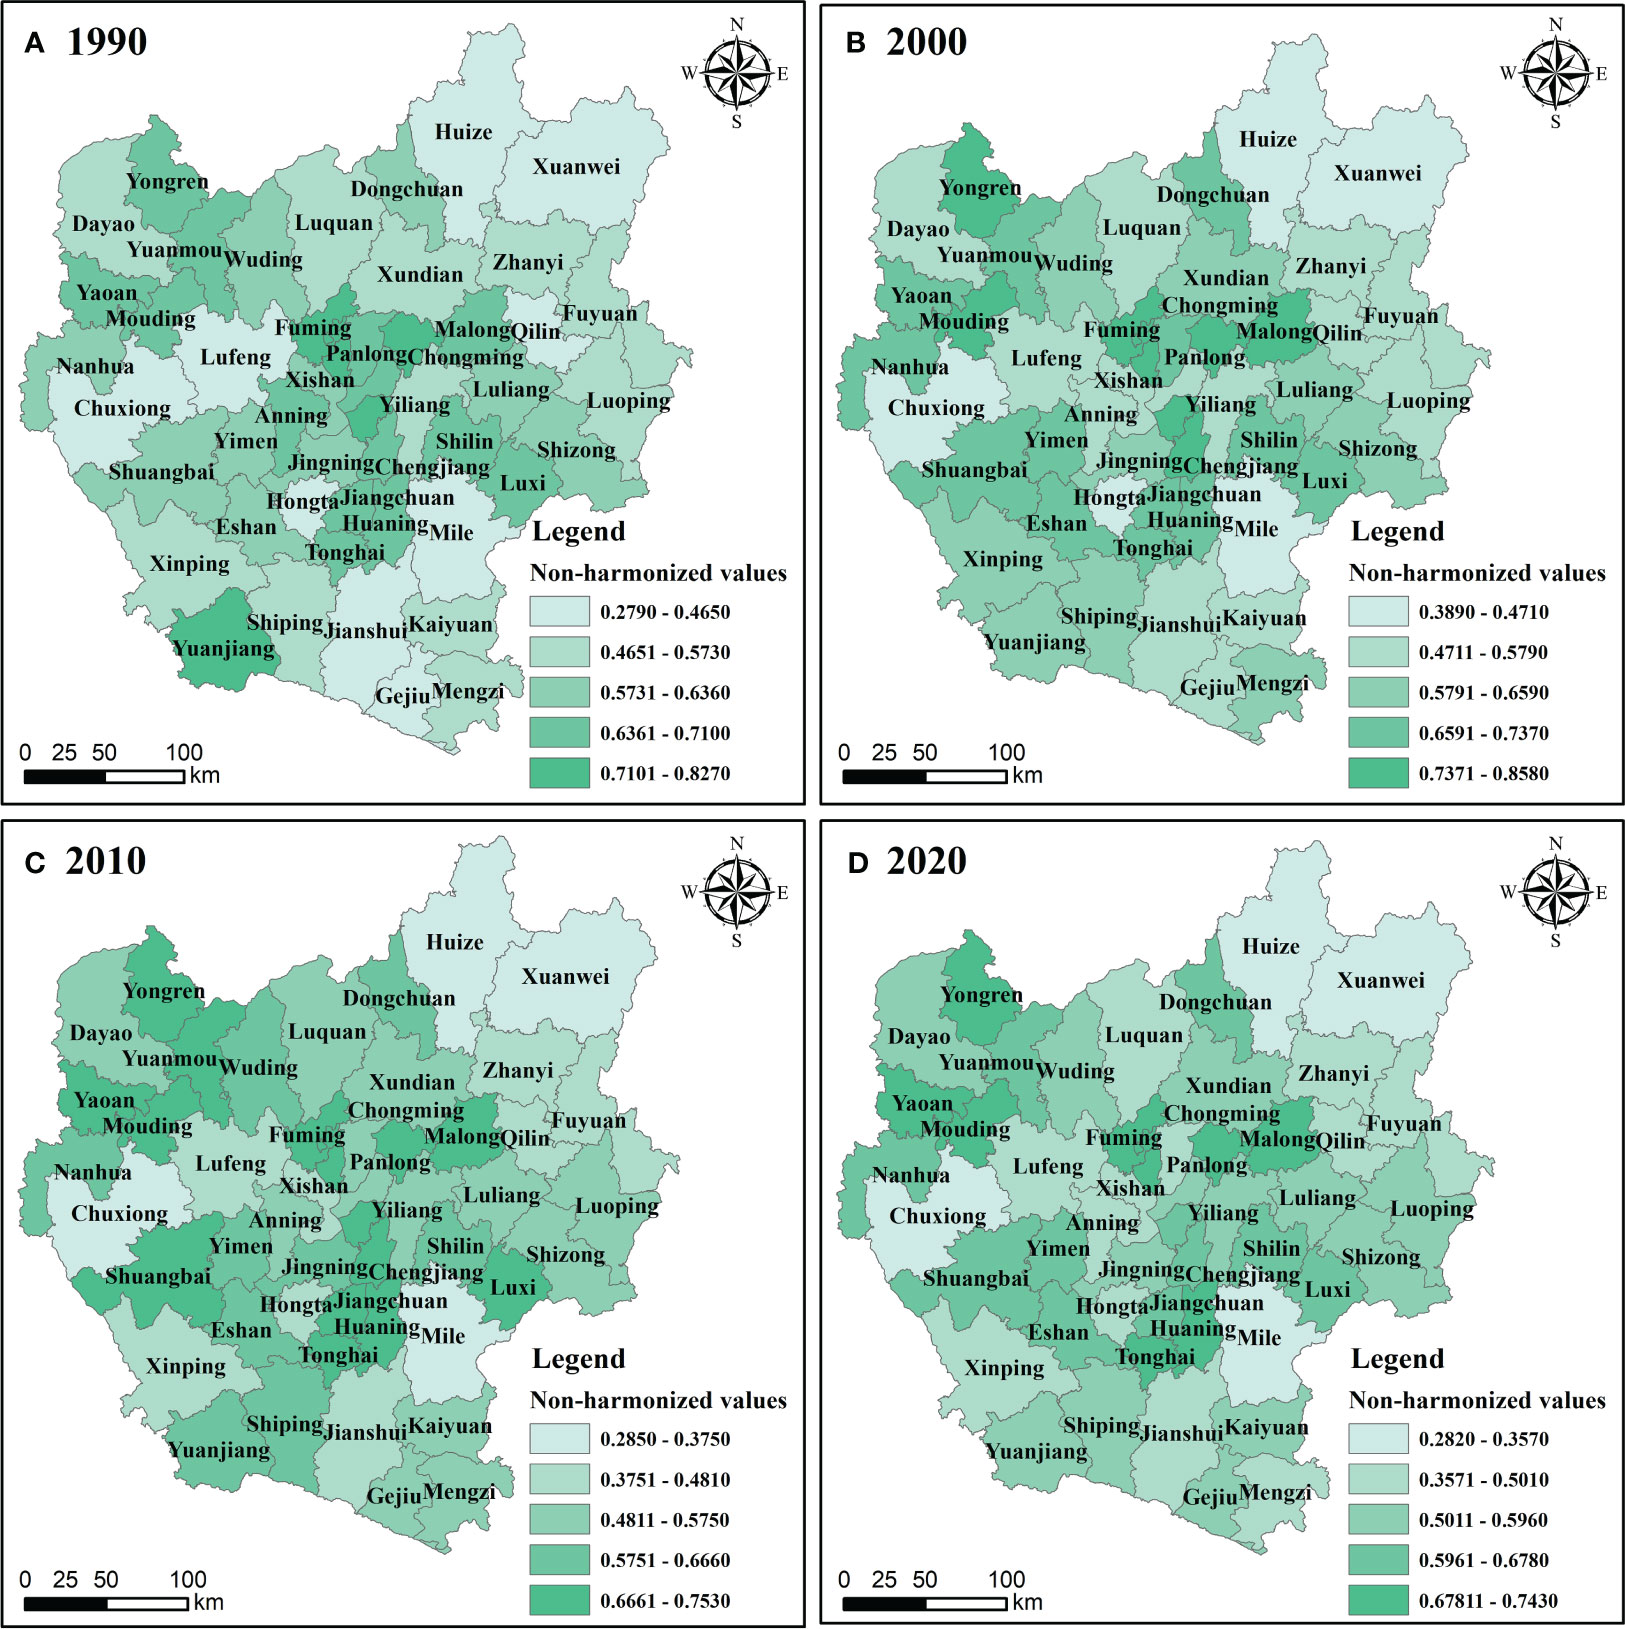
Figure 4 The value of ecosystem services and the level of non-coordinated economic development in the central Yunnan urban agglomeration from 1990 to 2020. (A) is the value of non-coordination of cities in central Yunnan in 1990; (B) is the value of non-coordination of urban agglomerations in central Yunnan in 2000; (C) is the value of non-coordination of urban agglomerations in central Yunnan in 2010; and (D) is the value of non-coordination of urban agglomerations in central Yunnan in 2020.
The results of exploring the hot and cold catchment areas of the value of ecosystem services and the level of non-coordinated development of economic development in the Central Yunnan Urban Agglomeration from 1990 to 2020 with the help of hotspot analysis tool are shown in Fig. As can be seen from Figure 5, the hotspot areas of non-coordination are mainly concentrated in the central and northwestern regions of the central Yunnan urban agglomeration, while the cold spot areas of non-coordination are mainly distributed in the northeastern, western and southern regions of the central Yunnan urban agglomeration. This indicates that the spatial distribution of non-coordination presents obvious regional differences, and both hot spots and cold spots are showing regular clustering distribution. The non-coordinated hotspot agglomeration area can be distinguished into two situations, one is the central region is mainly located in the center of economic development, the rapid development of the economy at the same time, the ecological environment suffered a certain damage, presenting the situation of “ecological low - economic high”; the second is the northwestern region is far away from the economic development area, but the area of the region is large, ecological land use of a variety of types, and with the central area of the opposite situation, presenting the situation of “ecological high - economic low”. In addition, the distribution of non-coordinated cold spot zones has obvious consistency with the distribution of ecosystem service values and economic development, which are either high and high distribution or low and low agglomeration. In comparison, the non-coordinated hotspot agglomeration area has become an important zone of concern for the current sustainable regional development of the city cluster in central Yunnan. Therefore, the promotion of regional sustainable development policies and the implementation of the concept of “green mountains are golden mountains” have become important means of adjusting the non-coordinated areas in the Central Yunnan Urban Agglomeration. At the same time, it implements protection in development and development in protection, promotes the building of ecological civilization and economic development as mutually reinforcing and complementary, adheres to eco-priority and green development, consciously unites economic development with the building of an ecological civilization, and abandons a growth model that damages or even destroys the ecological environment.

Figure 5 Analysis of the non-coordinated cold and hot spots between the ecosystem service value and economic development of the central Yunnan urban agglomeration from 1990 to 2020. (A) Cold hotspot value of central Yunnan urban agglomeration in 1990; (B) Cold hotspot value of central Yunnan urban agglomeration in 2000; (C) Cold hotspot value of central Yunnan urban agglomeration in 2010; (D) Cold hotspot value of central Yunnan urban agglomeration in 2020.
The value of ecosystem services is the benefit that human beings receive directly or indirectly from ecosystems, which is important for maintaining ecological balance and protecting biodiversity (Ran et al., 2023; Xiao et al., 2023). From 1990 to 2020, the value of ecosystem services in the central Yunnan urban agglomeration showed a general decreasing trend, with a decreasing rate of 61.23%. The spatial distribution pattern has obvious regional differences, showing a pattern of “low in the middle and high in the surroundings”, so the ecological “barren” area is mainly located in the core area of the central Yunnan urban agglomeration. This indicates that the deepening of reform and opening up, and the continuous improvement of the level of social and economic development, the ecological land (grassland, forest land, water) has been continuously converted into productive land (construction land), which leads to the weakening of the value of ecosystem services in most of the areas, the ecological security is further weakened, and the ecological function tends to be degraded. Therefore, it is necessary to firmly implement the new development concept in the future development mode, change the economic development mode, and improve the development level of the “barren” ecosystem service value areas (Yang et al., 2023).
Protecting the ecological environment and developing the economy are fundamentally organic and complementary (Tan and Hamid, 2014). Just because economic development encounters a little difficulty, the idea of sacrificing the environment in exchange for economic growth should not be started, or even find ways to break through the red line of ecological protection. The mean values of the coordination index of the central Yunnan urban agglomeration from 1990 to 2020 are 0.409, 0.365, 0.416 and 0.435, respectively. This indicates that the economic development and ecological environment of the urban agglomeration of central Yunnan are moving towards the trend of harmonization, but none of the development level did not exceed its average value of 0.5. To this end, it remains important to strengthen the coordination of regional economic development with the ecological environment. The future approach to economic development should not be aimed at “quantity” but should focus on “quality” in order to achieve sustainable regional development.
In the evaluation of regional sustainable development, we often pay attention to the eco logical-economic coordinated areas and ignore the non-coordinated areas, resulting in the region failing to realize the overall sustainable development. Although the development level index of non-coordination in the city cluster of central Yunnan (0.591, 0.635, 0.584, 0.565) shows a decreasing trend, the proportion of non-coordination is still high, with the proportion (>0.5 or more) reaching 79.59%, 89.80%, 75.51% and 75.51 respectively. This reveals that the economic development and ecological environment of the central Yunnan urban agglomeration still belong to a sub-healthy state, and has not yet reached the coordinated development from the inside out, and only focuses on the overall trend of coordinated development to improve the level of development, while ignoring the non-coordinated still exists a greater threat. For this reason, the central Yunnan urban agglomeration needs to pay more attention to the uncoordinated areas in the way of promoting the coordinated development of the region. Improve the relevant policy system and take the “type area policy” featuring more refinement and differentiation as the development direction of regional policy, so as to reduce the potential threat to the coordinated and sustainable development of the region (He et al., 2023).
This paper measures the value of ecosystem services in the central Yunnan urban agglomeration from 1990 to 2020 based on land use data, measures the non-coordinated development index between ecosystems and economic development with the help of non-coordination degree model, and mines the spatial layout characteristics of non-coordination. The study can accurately determine the non-coordinated area, which provides certain reference and basis for promoting coordinated sustainable development. However, this study still has the following shortcomings: for the ecological coefficient of construction land in the ecosystem service value measurement, it is only through borrowing the research results of the previous research, and the previous research proves that field investigation is a very important work. Therefore, the subsequent research should focus on this issue; moreover, the study of influencing factors can help us to understand the causes and mechanisms of a certain phenomenon, so as to formulate economic policies and measures. The article only explores the non-coordination index and spatial characteristics between the two, and does not explore the deep-level influence factors. For this reason, it is of great significance to explore the influence factors and analyze the external and internal mechanisms to coordinate the ecological and economic development.
This paper calculates the ecosystem service value of 49 counties in the Central Yunnan Urban Agglomeration from 1990 to 2020 based on land use data through the value equivalent method, and at the same time mines their socio-economic development data to explore the level of non-coordination between the ecosystem service value and the economic development with the help of non-coordination degree model and thermal analysis tool, and to analyze their spatial correlation characteristics. It was found that from 1990 to 2020, the land use types in the urban agglomeration in central Yunnan mainly consisted of cropland, forest land and grassland, while water, construction land and unutilized land accounted for a small portion of the total; the ecosystem service value index had obvious regional differences, generally showing a spatial distribution pattern of “low in the middle and high in the surroundings”; The development trend of GDP shows a steady increase and a faster development rate; the uncoordinated coupling degree is roughly moving towards a decreasing trend, while the uncoordinated hotspot areas are mainly concentrated in the central and northwestern regions of the Central Yunnan Urban Agglomeration, and the cold spot areas are mainly distributed in the northeastern, western and southern regions of the Central Yunnan Urban Agglomeration. This study quantitatively and scientifically investigates the current situation of regional economic development and ecosystem service value, and at the same time explores the relationship between the two, and the results of the research provide certain references and bases for promoting the optimization of the industrial structure of the urban agglomeration in central Yunnan and improving the non-coordinated state of the ecological environment and the economy.
The original contributions presented in the study are included in the article/supplementary material. Further inquiries can be directed to the corresponding author.
AL: Writing – original draft, Writing – review & editing, Conceptualization, Data curation, Formal analysis, Investigation, Methodology, Project administration, Software. YY: Conceptualization, Data curation, Formal analysis, Investigation, Methodology, Writing – review & editing, Project administration, Resources. LN: Conceptualization, Data curation, Writing – review & editing, Writing – original draft, Funding acquisition, Methodology. HL: Software, Validation, Visualization, Supervision, Writing – review & editing. HC: Visualization, Software, Supervision, Validation, Writing – review & editing.
The author(s) declare financial support was received for the research, authorship, and/or publication of this article. This work was supported by the National Natural Science Foundation of China (NSFC): NL 42261037; National Natural Science Foundation of China (NSFC): Shuangyun Peng 42261073; Xing Dian Youth Talents Support Program of Yunnan Province: Yan Zhou XDYC-QNRC-2022; General Program of Yunnan Basic Research Program (GPYBR) NL 202201AT070024.
The authors would like to thank all the authors for their hard work in this research.
The authors declare that the research was conducted in the absence of any commercial or financial relationships that could be construed as a potential conflict of interest.
All claims expressed in this article are solely those of the authors and do not necessarily represent those of their affiliated organizations, or those of the publisher, the editors and the reviewers. Any product that may be evaluated in this article, or claim that may be made by its manufacturer, is not guaranteed or endorsed by the publisher.
The Supplementary Material for this article can be found online at: https://www.frontiersin.org/articles/10.3389/fevo.2024.1366458/full#supplementary-material
Abu-Rayash A., Dincer I. (2023). Development of an integrated sustainability model for resilient cities featuring energy, environmental, social, governance and pandemic domains. Sustain. Cities Soc. 92, 104439. doi: 10.1016/j.scs.2023.104439.
Blumstein M., Thompson J. R. (2015). Land-use impacts on the quantity and configuration of ecosystem service provisioning in Massachusetts, USA. J. Appl. Ecol. 52, 1009–1019. doi: 10.1111/1365-2664.12444
Cao Y., Kong L., Zhang L., Ouyang Z. (2021). The balance between economic development and ecosystem service value in the process of land urbanization: A case study of China’s land urbanization from 2000 to 2015. Land Use Policy 108 (2), 105536. doi: 10.1016/j.landusepol.2021.105536
Chen X., Ding W., LI X. (2022). Cross-sensitivity analysis of land use transition and ecosystem service value in urban agglomeration in central Yunnan. Res. Soil Water Conserv. 29, 233–241. doi: 10.13869/j.cnki.rswc.20220826.001
Cheng Z., He J., Xu S., Yang X. (2023). Coupling assessment for the water-economy-ecology nexus in Western China. Ecol. Indic. 154, 110648. doi: 10.1016/j.ecolind.2023.110648
Costanza R., D'Arge R., Groot R. (1997). The value of the world’s ecosystem services and natural capital. Nature 387, 253–260. doi: 10.1038/387253a0
Costanza R., Groot R., Sutton P., van der Ploeg S., Anderson S. J., Kubiszewski I. (2014). Changes in the global value of ecosystem services. Global Environ. Change 26, 152–158. doi: 10.1016/j.gloenvcha.2014.04.002
Deng S. (2012). Study on regional land use change and ecosystem service value dynamics. Zhejiang University.
Fu J., Zhang Q., Wang P., Zhang L., Tian Y., Li X. (2022). Spatio-temporal changes in ecosystem service value and its coordinated development with economy: A case study in Hainan province, China. Remote Sens. 14, 970. doi: 10.3390/rs14040970
GaoDi X., Chunxia L., Yunfa L., Du Z., Shuangcheng L. (2003). Valuation of ecological assets on the Tibetan Plateau. J. Natural Resour. 02, 189–196. doi: 10.3321/j.issn:1000-0933.2003.11.021
GaoDi X., Lin Z., Chunxia L., Yu X., Cao C. (2008). An expert knowledge-based approach to ecosystem service valorization. J. Natural Resour. 05, 911–919. doi: 10.11849/zrzyxb.2008.05.019
He X., Zhang R., Yuan X. (2023). The role of planning policy in the evolution of the spatial structure of the Guangzhou metropolitan area in China. Cities 137, 104284. doi: 10.1016/j.cities.2023.104284
Hong T., Yu N., Mao Z., Zhang S. (2021). Government-driven urbanisation and its impact on regional economic growth in China. Cities 117, 103299. doi: 10.1016/j.cities.2021.103299
Hu J., Wu Y., Irfan M. (2023). Has the ecological civilization pilot promoted the transformation of industrial structure in China? Ecol. Indic. 155, 111053. doi: 10.1016/j.ecolind.2023.111053
Jiang L., Wu Y., He X., Fu Q., Wang Z., Jiang Q. (2022). Dynamic simulation and coupling coordination evaluation of water footprint sustainability system in Heilongjiang province, China: A combined system dynamics and coupled coordination degree model. J. Cleaner Production 380, 135044. doi: 10.1016/j.jclepro.2022.135044
Kareiva P., Marvier M. (2003). Conserving biodiversity coldspots. Americian Scientist 91, 344–351. doi: 10.1511/2003.4.344.
Kubiszewski I., Costanza R., Anderson S., C P. S. (2017). The future value of ecosystem services: Global scenarios and national implications. Ecosystem Serv. 26, 289–301. doi: 10.1016/j.ecoser.2017.05.004
Li W., Wang L., Yang X., Liang T., Zhang Q., Liao X., et al. (2022). Interactive influences of meteorological and socioeconomic factors on ecosystem service values in a river basin with different geomorphic features. Sci. Total Environ. 829, 154595. doi: 10.1016/j.scitotenv.2022.154595.
Li A., Zhou Y., Tang L., Niu L.-D., Pan M. (2023). Land use simulation and ecosystem service valuation in Nujiang Prefecture-A multi-scenario analysis based on the PLUS model. China Agric. Resour. Zoning 44, 140–149. Available at: https://link.cnki.net/urlid/11.3513.S.20220415.1200.006
Liu R., Dong X., Wang X.-C., Zhang P., Liu M., Zhang Y. (2021). Study on the relationship among the urbanization process, ecosystem services and human well-being in an arid region in the context of carbon flow: Taking the Manas river basin as an example. Ecol. Indic. 132, 108248. doi: 10.1016/j.ecolind.2021.108248
Liu H., Wong W.-K., Cong P. T., Nassani A. A., Haffar M., Abu-Rumman A. (2023). Linkage among Urbanization, energy Consumption, economic growth and carbon Emissions. Panel data analysis for China using ARDL model. Fuel 332, 126122. doi: 10.1016/j.fuel.2022.126122
Macêdo R. L., Haubrock P. J., Klippel G. (2024). The economic costs of invasive aquatic plants: A global perspective on ecology and management gaps. Sci. Total Environ. 908, 168217. doi: 10.1016/j.scitotenv.2023.168217
Mashinini D. P., Fogarty K. J., Potter R. C., Berles J. D. (2020). Geographic hot spot analysis of vaccine exemption clustering patterns in Michigan from 2008 to 2017. Vaccine 38, 8116–8120. doi: 10.1016/j.vaccine.2020.10.091.
Qian X. (2023). Research on the coordinated development model of marine ecological environment protection and economic sustainable development. J. Sea Res. 193, 102377. doi: 10.1016/j.seares.2023.102377
Ran R., Hua L., Xiao J., Zhengxing Ni D. (2023). Can poverty alleviation policy enhance ecosystem service value? Evidence from poverty-stricken regions in China. Economic Anal. Policy 80, 1509–1525. doi: 10.1016/j.eap.2023.10.032
Robertson G. P., Swinton S. M. (2005). Reconciling agricultural productivity and environmental integrity: A grand challenge for agriculture. Front. Ecol. Enviroment 3, 38–46. doi: 10.1890/1540-9295(2005)003[0038:RAPAEI]2.0.CO;2
Song S., Chen X., Liu T. (2023). Indicator-based assessments of the coupling coordination degree and correlations of water-energy-food-ecology nexus in Uzbekistan. J. Environ. Manage. 345, 118674. doi: 10.1016/j.jenvman.2023.118674
Tan P. Y., Hamid A. R. b. A. (2014). Urban ecological research in Singapore and its relevance to the advancement of urban ecology and sustainability. Landscape Urban Plann. 125, 271–289. doi: 10.1016/j.landurbplan.2014.01.019
Vačkářová D., Medková H., Krpec P., Weinzettel. (2023). Ecosystem services footprint of international trade: Economic value of ecosystem services lost due to crop production. Ecosystem Serv. 64, 101560. doi: 10.1016/j.ecoser.2023.101560
Wang W., Guo H., Chuai X., Dai C., Lai L., Zhang M. (2014). The impact of land use change on the temporospatial variations of ecosystems services value in China and an optimized land use solution. Environ. Scientist Policy 44, 62–72. doi: 10.1016/j.envsci.2014.07.004
Wang Y., He L. (2022). Can China's carbon emissions trading scheme promote balanced green development? A consideration of efficiency and fairness. J. Cleaner Production 367, 132916. doi: 10.1016/j.jclepro.2022.132916
Willemen L., Drakou E. G., Dunbar M. B., Mayaux P., Egoh B. N. (2013). Safeguarding ecosystem services and livelihoods: Understanding the impact of conservation strategies on benefit flows to society. Ecosystem Serv. 4, 95–103. doi: 10.1016/j.ecoser.2013.02.004
Wyckhuys K. A. G., Zou Y., Wanger T. C., Zhou W., Gc Y. D., Lu Y. (2023). Agro-ecology science relates to economic development but not global pesticide pollution. J. Environ. Manage. 307, 114529. doi: 10.1016/j.jenvman.2022.114529
Xiao J., Song F., Su F. (2023). Exploring the interaction mechanism of natural conditions and human activities on wetland ecosystem services value. J. Cleaner Production 426, 139161. doi: 10.1016/j.jclepro.2023.139161
Xu Y., Xie Y., Wu X. (2023). Evaluating temporal-spatial variations of wetland ecosystem service value in China during 1990–2020 from the donor side based on cosmic exergy. J. Cleaner Production 64, 101560. doi: 10.1016/j.jclepro.2023.137485
Yang H., Gou X., Xue B., Xu J., Ma W. (2023). How to effectively improve the ecosystem provisioning services in traditional agricultural and pastoral areas in China? Ecol. Indic. 150, 110244. doi: 10.1016/j.ecolind.2023.110244
Yang J., Huang X. (2021). The 30 m annual land cover dataset and its dynamics in China from 1990 to 2019. Earth Syst. Sci. Data 13, 3907–3925. doi: 10.5194/essd-13-3907-2021
Yang J., Wang Y., Tang C. (2024). Can digitalization reduce industrial pollution? Roles of environmental investment and green innovation. Environ. Res. 240, 117442. doi: 10.1016/j.envres.2023.117442
Zhang Z., Luo X., Hu H. (2023). Market integration and urban air quality: Evidence from the Yangtze River Economic Belt of China. Economic Anal. Policy 80, 910–928. doi: 10.1016/j.eap.2023.09.021
Zhang H., Wang Y., Wang C. (2022). Coupling analysis of environment and economy based on the changes of ecosystem service value. Ecol. Indic. 144, 109524. doi: 10.1016/j.ecolind.2022.109524.
Zhang M., Yang Y., Du P., Wang J., Wei Y., Qin J., et al. (2024). The effect of public environmental participation on pollution governance in China: The mediating role of local governments' environmental attention. Environ. Impact Assess. Rev. 104, 107345. doi: 10.1016/j.eiar.2023.107345
Zheng J., Xu W., Tao A. (2023). Synergy between coastal ecology and disaster mitigation in China: Policies, practices, and prospects. Ocean Coast. Manage. 245, 106866. doi: 10.1016/j.ocecoaman.2023.106866
Zhu C., Fang C., Zhang L. (2023). Analysis of the coupling coordinated development of the Population–Water–Ecology–Economy system in urban agglomerations and obstacle factors discrimination: A case study of the Tianshan North Slope Urban Agglomeration, China. Sustain. Cities Soc. 90, 104359. doi: 10.1016/j.scs.2022.104359
Keywords: ecosystem service value, economic development, non-coordination, spatial characteristics, central Yunnan urban agglomeration
Citation: Li A, Yang Y, Niu L, Luo H and Chi H (2024) Discriminating the non-coordination between ecosystem service value and economic development and its spatial characteristics in central Yunnan urban agglomeration in the recent 30 years. Front. Ecol. Evol. 12:1366458. doi: 10.3389/fevo.2024.1366458
Received: 06 January 2024; Accepted: 05 February 2024;
Published: 20 February 2024.
Edited by:
Guangqin Li, Anhui University of Finance and Economics, ChinaReviewed by:
Dongmei Wang, Chongqing Technology and Business University, ChinaCopyright © 2024 Li, Yang, Niu, Luo and Chi. This is an open-access article distributed under the terms of the Creative Commons Attribution License (CC BY). The use, distribution or reproduction in other forums is permitted, provided the original author(s) and the copyright owner(s) are credited and that the original publication in this journal is cited, in accordance with accepted academic practice. No use, distribution or reproduction is permitted which does not comply with these terms.
*Correspondence: Lede Niu, bml1bGVkZUAxNjMuY29t
Disclaimer: All claims expressed in this article are solely those of the authors and do not necessarily represent those of their affiliated organizations, or those of the publisher, the editors and the reviewers. Any product that may be evaluated in this article or claim that may be made by its manufacturer is not guaranteed or endorsed by the publisher.
Research integrity at Frontiers
Learn more about the work of our research integrity team to safeguard the quality of each article we publish.