 Jessica Fox
 Kasey Allen2
 Jay E. Diffendorfer
 Laura Lukens
 Wayne E. Thogmartin
 Christian Newman
- 1Sustainability and Environment Sector, Electric Power Research Institute, Palo Alto, CA, United States
- 2Environmental and Planning Division, ICF Jones & Stokes Inc., Sacramento, CA, United States
- 3U.S. Geological Survey, Geosciences and Environmental Change Sciences Center, Denver, CO, United States
- 4Department of Forestry & Rangeland Science, Colorado State University, Fort Collins, CO, United States
- 5U.S. Geological Survey, Upper Midwest Environmental Sciences Center, La Crosse, WI, United States
Returning monarch butterflies (Danaus plexippus) to sustainable levels of abundance will require an array of contributors to protect and restore habitat over broad areas. Due to the diversity and scale of land managed by electric power companies across the monarch range, plus an additional 32 million hectares needed for new solar arrays by 2050 to meet renewable energy goals, the industry may have potential to contribute to monarch conservation. However, it is challenging to clearly understand an individual company’s potential for monarch conservation because of the scale and distribution of their specific land assets (ranging from 4,800 to 240,000 hectares in this study alone), the complexity of monarch science, and the lack of a science-based approach for evaluating large land assets for monarch habitat. With monarchs potentially being protected under the United States Endangered Species Act in the future and thereby limiting land management approaches, there is interest from electric power companies to understand how their lands relate to monarchs. In collaboration with companies, we developed a GIS-based model to identify company landholdings that contain high-quality monarch habitat and applied the model to specific landholdings of eight power companies in the United States. We then facilitated discussions with company teams to balance conservation goals, corporate risk, and social opinion. This paper describes non-confidential results for developing a national GIS-based monarch habitat model and applying it to electric power companies who are considering monarch conservation while simultaneously transitioning to a new clean energy future. The model and applied experience may be useful for other organizations working across large landscapes to manage monarchs.
1 Introduction
Modern society depends on safe, reliable, and affordable electricity systems, and electric power companies cannot impede their ability to meet these regulated responsibilities. However, industry is increasingly considering voluntary biodiversity targets in their daily operations (e.g. Kunming–Montreal Global Biodiversity Framework to slow global biodiversity loss by 2030; Science Based Targets Network intending to transform economic systems and protect the global commons) (United Nations, 2022; Science Based Targets Network, 2024). With the domestic possibility of over 300 more species receiving legal protection under the United States Endangered Species Act (ESA) in addition to the 1600 plants and animals already listed, plus state-specific regulations, there are a plethora of species considerations for land managers (ECOS, 2023).
Among these considerations, the potential ESA listing of the culturally iconic monarch butterfly (Danaus plexippus, hereafter “monarch”) has compelled electric power companies to understand their land’s relevance for monarchs (EPRI, 2019). While the electric power industry is not noted as one of the primary causes of monarch decline (Federal Register, 2020) and, in fact, likely supports monarchs through their integrated vegetation management (IVM) programs, enacting additional conservation measures on these lands might help restore habitat and advance a voluntary “all hands on deck” approach to recovery of the species (Thogmartin et al., 2017). However, if the monarch is ESA listed, companies could face legal liability for operations impacting monarch habitat, including habitat that was voluntarily restored.
Many power companies manage large amounts of diverse landholdings across various asset types, including transmission and distribution lines, substations, power plant sites, offices and facilities, ground-mounted solar arrays, and wind power. Additionally, many companies manage “surplus property”, which is owned and/or managed by the company, but not used for electric power infrastructure. The massive amount of land needed for renewable energy development, estimated at more than 32 million hectares globally by 2050, further complicates biodiversity conservation, even as this land is used to reduce greenhouse gas emissions from electricity generation (see Supplementary Material for calculation). Property management and ownership varies depending on the property type and includes easement, lease, and owned. Further, the land assets themselves can be enormously diverse even within one company, spreading across ecoregions, watersheds, and state lines. With these ecological, ownership, and scale complexities, it can be challenging for companies to catalog their land assets and analyze them against specific species needs, let alone “biodiversity” as a whole.
Whether the monarch is ESA-listed or not, concern for reputational damage for impacting a culturally iconic species is driving companies to consider management plans and how they will communicate those plans to investors, stakeholders, and shareholders. Companies contemplating monarch habitat management strategies typically start with similar questions:
1. Do we have monarch habitat – how much and where?
2. Where do we need to avoid impacts to existing habitat and where are our best opportunities to restore monarch habitat?
3. What should our company’s monarch management approach be to balance risk, liability, and sustainability?
We developed the Monarch Habitat Model (EPRI, 2023a) to better understand the location and extent of monarch habitat in the contiguous United States, which companies can use to identify potential habitat in their landholdings. We applied this model to eight electric power companies across the United States, followed by expert analysis to develop monarch management strategies. This engagement included facilitated discussions with multi-departmental company teams regarding voluntary conservation goals, corporate risk and liability, and current land management operations. While company-specific results are confidential, we identified some overarching insights. This paper summarizes the model, how it was applied, and the confounding realities electric power companies face when considering strategies for managing monarch habitat on their land.
2 Methods
The Electric Power Research Institute (EPRI) report Monarch Habitat Model: Landscape-scale Approach to Identifying Monarch Habitat in the United States (EPRI, 2023a) fully details modeling methods that are summarized below.
The modeling approach for predicting current monarch habitat is vegetation driven. In the absence of a clear definition of how the United States Fish and Wildlife Service (USFWS) defines “monarch habitat”, we combined milkweed suitability (critical for larvae survival) and floral resource suitability (critical for adult survival), equally weighted, to represent overall “monarch habitat suitability”. These two variables were associated with national land cover classifications to generate an overall estimate of monarch habitat suitability. The floral resource suitability methods were applied across all regions, but milkweed resource suitability methods varied by region due to the underlying available data. Therefore, three regional methods were developed to represent monarch habitat suitability across the United States – eastern, western, and Great Plains (Supplementary Table 2-1; Supplementary Figure 2-1).
For floral resource suitability, we assigned relative abundance of floral resources by land cover type using the United States Department of Agriculture (USDA) Cropland Data Layer (CDL) (USDA, 2021). This was done by reusing underlying data from the InVEST® pollinator abundance model (Natural Capital Project, 2021) and a floral resource index showing abundance as an index (0–1) of floral resources for each land cover type in the CDL (Koh et al., 2016). This land cover–based suitability was combined with the 30-meter CDL (USDA, 2021) to generate a raster layer representing floral resource suitability. The index was classified into Low (index <0.25), Medium (index 0.25–0.45), or High (index >0.45) suitability for monarchs for each of 254 land cover types (EPRI, 2023a, Appendix B).
For milkweed resource suitability in the eastern region, estimating milkweed abundance and quality among all land use types and regions is challenging due to a lack of field data and published resources. The few published milkweed estimates that exist for the eastern range do not represent all land cover types and regions. This data gap was addressed with expert opinion – an appropriate approach in data-limited situations. Expert opinion was collected regarding estimated milkweed abundance for each of the 16 land cover types in the 30-meter resolution National Land Cover Data (NLCD) database (Dewitz, 2021) for the eastern region as follows: High (>10 stems), Medium (1 to 10 stems), or Low (<1 stems) per 0.4 hectares (1 acre). Due to absence of milkweed quality data or estimates, abundance estimates were used as a proxy for “suitability”.
For milkweed resource suitability in the Great Plains region, we used an approach similar to the eastern region, except we downgraded milkweed resource suitability of two specific land cover types, Herbaceous and Hay/Pasture, from High (>10 stems per 0.4 hectares) to Medium (1–10 stems per 0.4 hectares) due to lower soil productivity in the Great Plains.
For milkweed resource suitability in the western region, it was possible to rely upon existing research of milkweed occurrence information (Dilts et al., 2019), rather than associating land classes to milkweed abundance. This approach used more than 8,000 observations of adult and juvenile monarchs and more than 20,000 records from 13 milkweed host plant species, covering Arizona, California, Idaho, Nevada, Oregon, Washington, and Utah. We elected to incorporate only native milkweed species, excluding non-native tropical milkweed (Asclepias curassavica), which utilized records from Dilts et al. (2019) of milkweed occurrence in areas >3.6 kilometers away from known occurrences of tropical milkweed. We converted the Dilts et al. (2019) milkweed suitability index from 0 to 95 into Low (0–31), Medium (32–63), or High (64–95) using an equal interval method (equal thirds).
The ArcGIS Combine tool combined two raster datasets representing floral resource suitability and milkweed resource suitability, then assigned a unique value for each raster cell to each combination of input values, producing a 30-meter raster layer representing nine milkweed–floral values, which was then applied across the United States. In the absence of a formal definition of “monarch habitat”, we applied our expert opinion and defined “highly suitable monarch habitat” as having High floral resource suitability and either High or Medium milkweed resource suitability values (Supplementary Table 2-2). High floral resource suitability is assumed to ensure the availability of floral resources across both breeding and migration.
We then ran the landholdings of 8 power companies through the model as part of a collaborative research project created in 2021 by EPRI titled, Evaluating Landholdings for Monarch Habitat. The companies confidentially provided their landholding information for this analysis, ranging from 4850 hectares in one state for one company, to 243,000 hectares across ten states for another. The goal was to identify current highly suitable monarch habitat within each company’s landholdings, then to use expert analysis to develop an appropriate monarch habitat management approach for each company. Included in the analysis was consideration for enrolling in the Nationwide Candidate Conservation Agreement with Assurance (CCAA) for Monarch Butterflies, which could reduce uncertainty related to mitigation requirements if the monarch is ESA-listed. Meetings and emails with company land managers added deeper context to company-specific considerations. Analysis did not prioritize habitat restoration opportunities for each company, as this would have required additional modeling considerations, such as pesticide drift, habitat connectivity, and surrounding land use.
3 Results
Results were categorized as follows:
1. Model outputs
2. Applying the model to company landholdings
3. Expert analysis and decisions.
All company-identifiable information has been anonymized.
3.1 Model outputs
We applied the model at regional and sub-regional scales to develop outputs useful for guiding company decisions. The result was a 30-meter raster layer representing nine regionally specific milkweed–floral values (Figure 1; Supplementary Table 2-3). More than 60% of both the eastern and western regions were deemed of low value for milkweed. However, the fraction of land of high value for milkweed was 3.5 times greater in the eastern compared to the western region. A greater land fraction of high floral value, however, occurred in the western region compared to the eastern region (64% versus 25%).
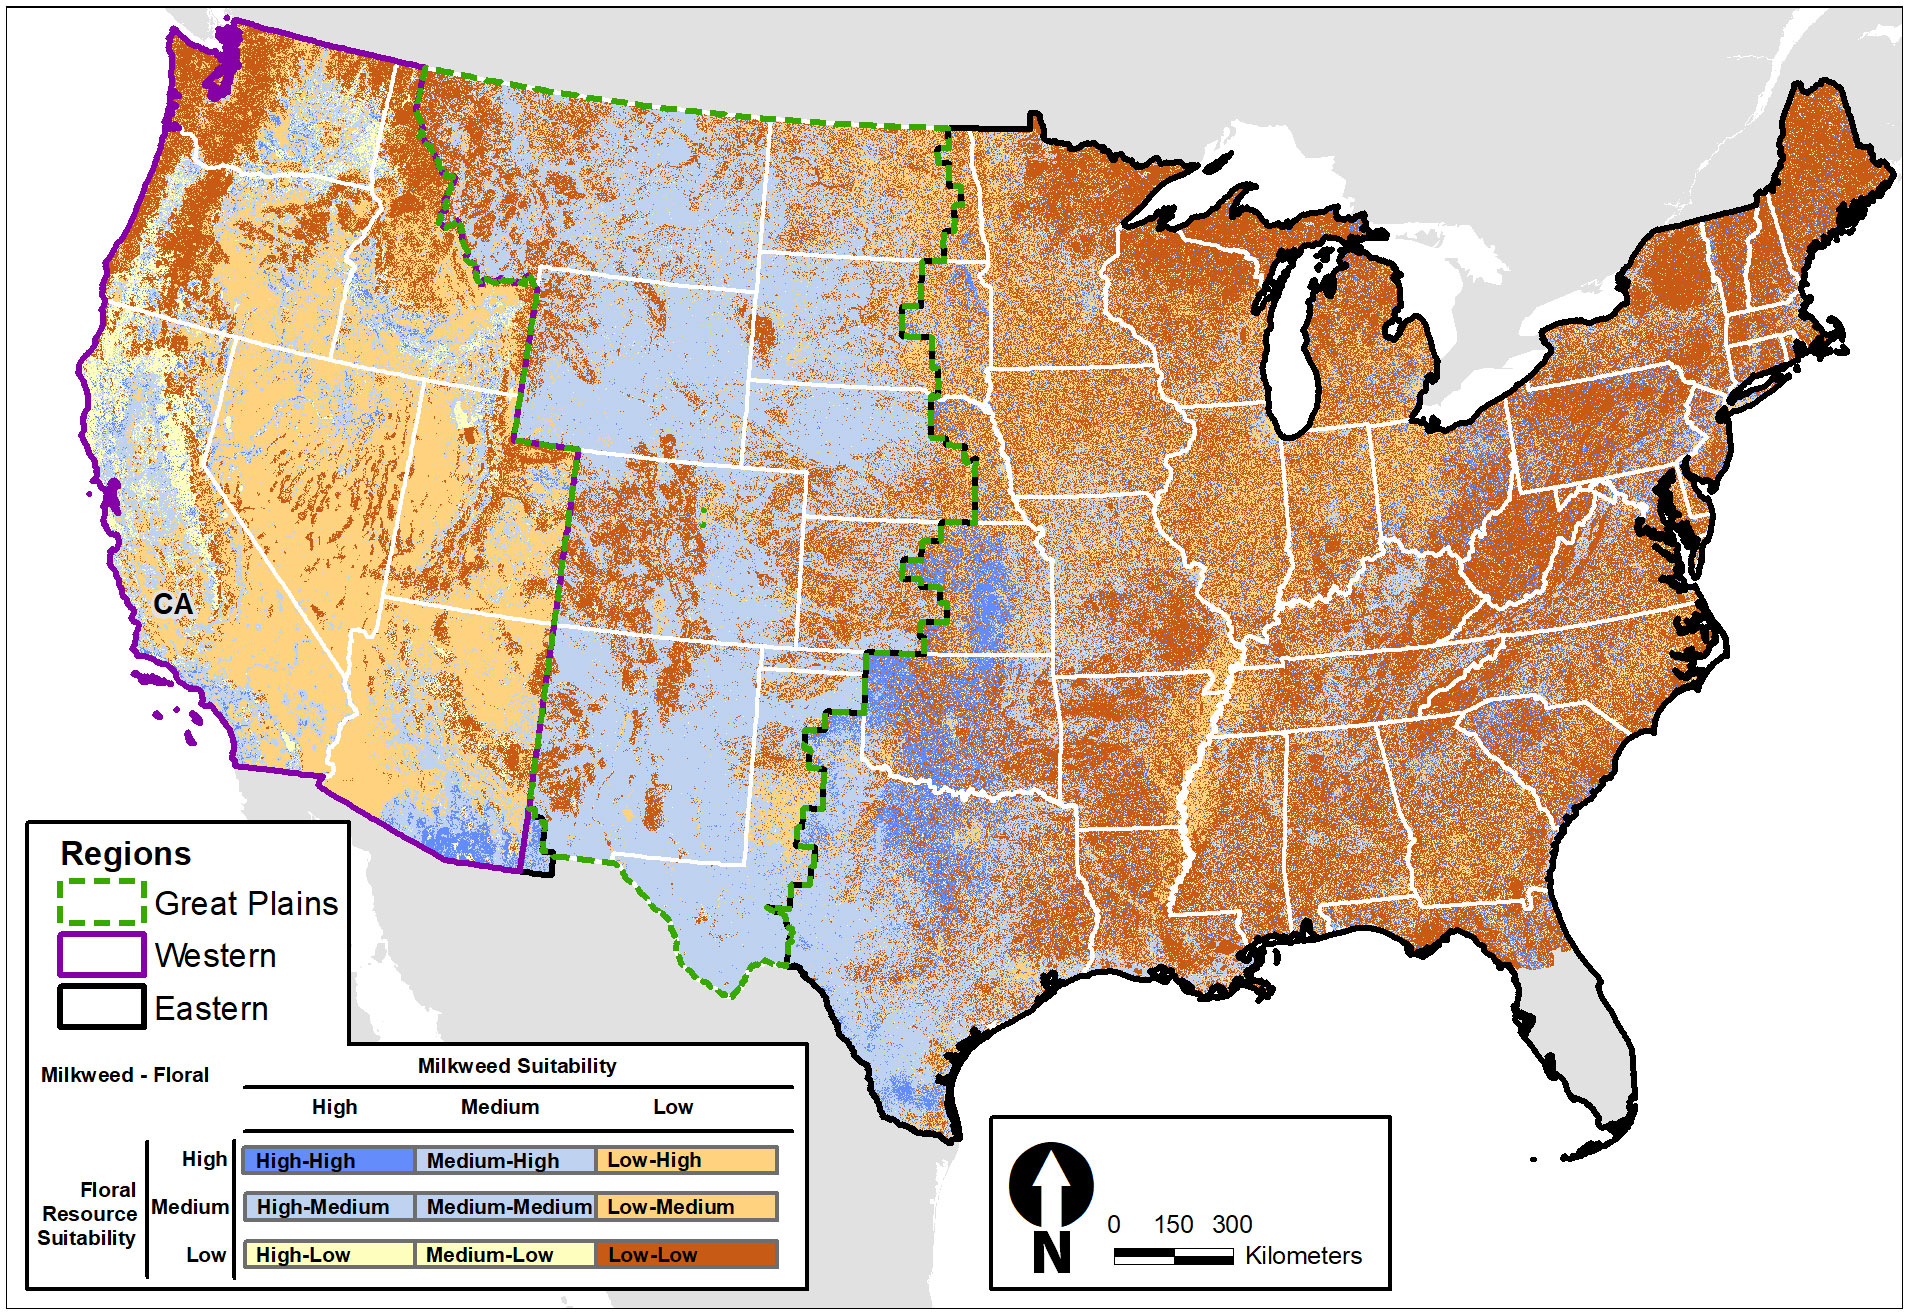
Figure 1 Monarch butterfly habitat suitability in each region (EPRI, 2023a).
During model validation, an issue was discovered specific to rights-of-way (ROWs) in the northeastern United States. One company manager noted that the model was incorrect depicting 20% of ROWs as deciduous forest, based on National Land Cover Database (NLCD). Upon reviewing aerial photographs, it became clear that the approximately 60.5-m wide ROW was too narrow to accurately classify land cover types using the NLCD’s 30-m cell size (Figure 2). When a ROW is surrounded by forest, NLCD’s 30-m cells often classify the ROW as forest. To address this error, and absent any state and national GIS data repositories offering finer than 30-m cell size, we did additional data processing after the modeling by classifying ROW areas using 4-band National Agriculture Imagery Program (NAIP) photographs (NAIP GeoHub, 2023). The most recent NAIP photographs for the region were from 2019 and are a much higher resolution (0.6-m cell size) than NLCD cells. Additionally, we applied a Normalized Difference Vegetation Index (NDVI) to classify the photographs into a small number of land cover types (Esri and USDA Farm Services Agency, 2023a, 2023b). Using the updated land cover within Company A’s ROWs decreased its deciduous forest by 21% (−2000 hectares), with smaller decreases of other land cover types, and increased grassland/herbaceous by 27% (+2560 hectares) and shrub/scrub by 10% (+985 hectares), thereby increasing the predicted amount of suitable monarch habitat in the ROW.
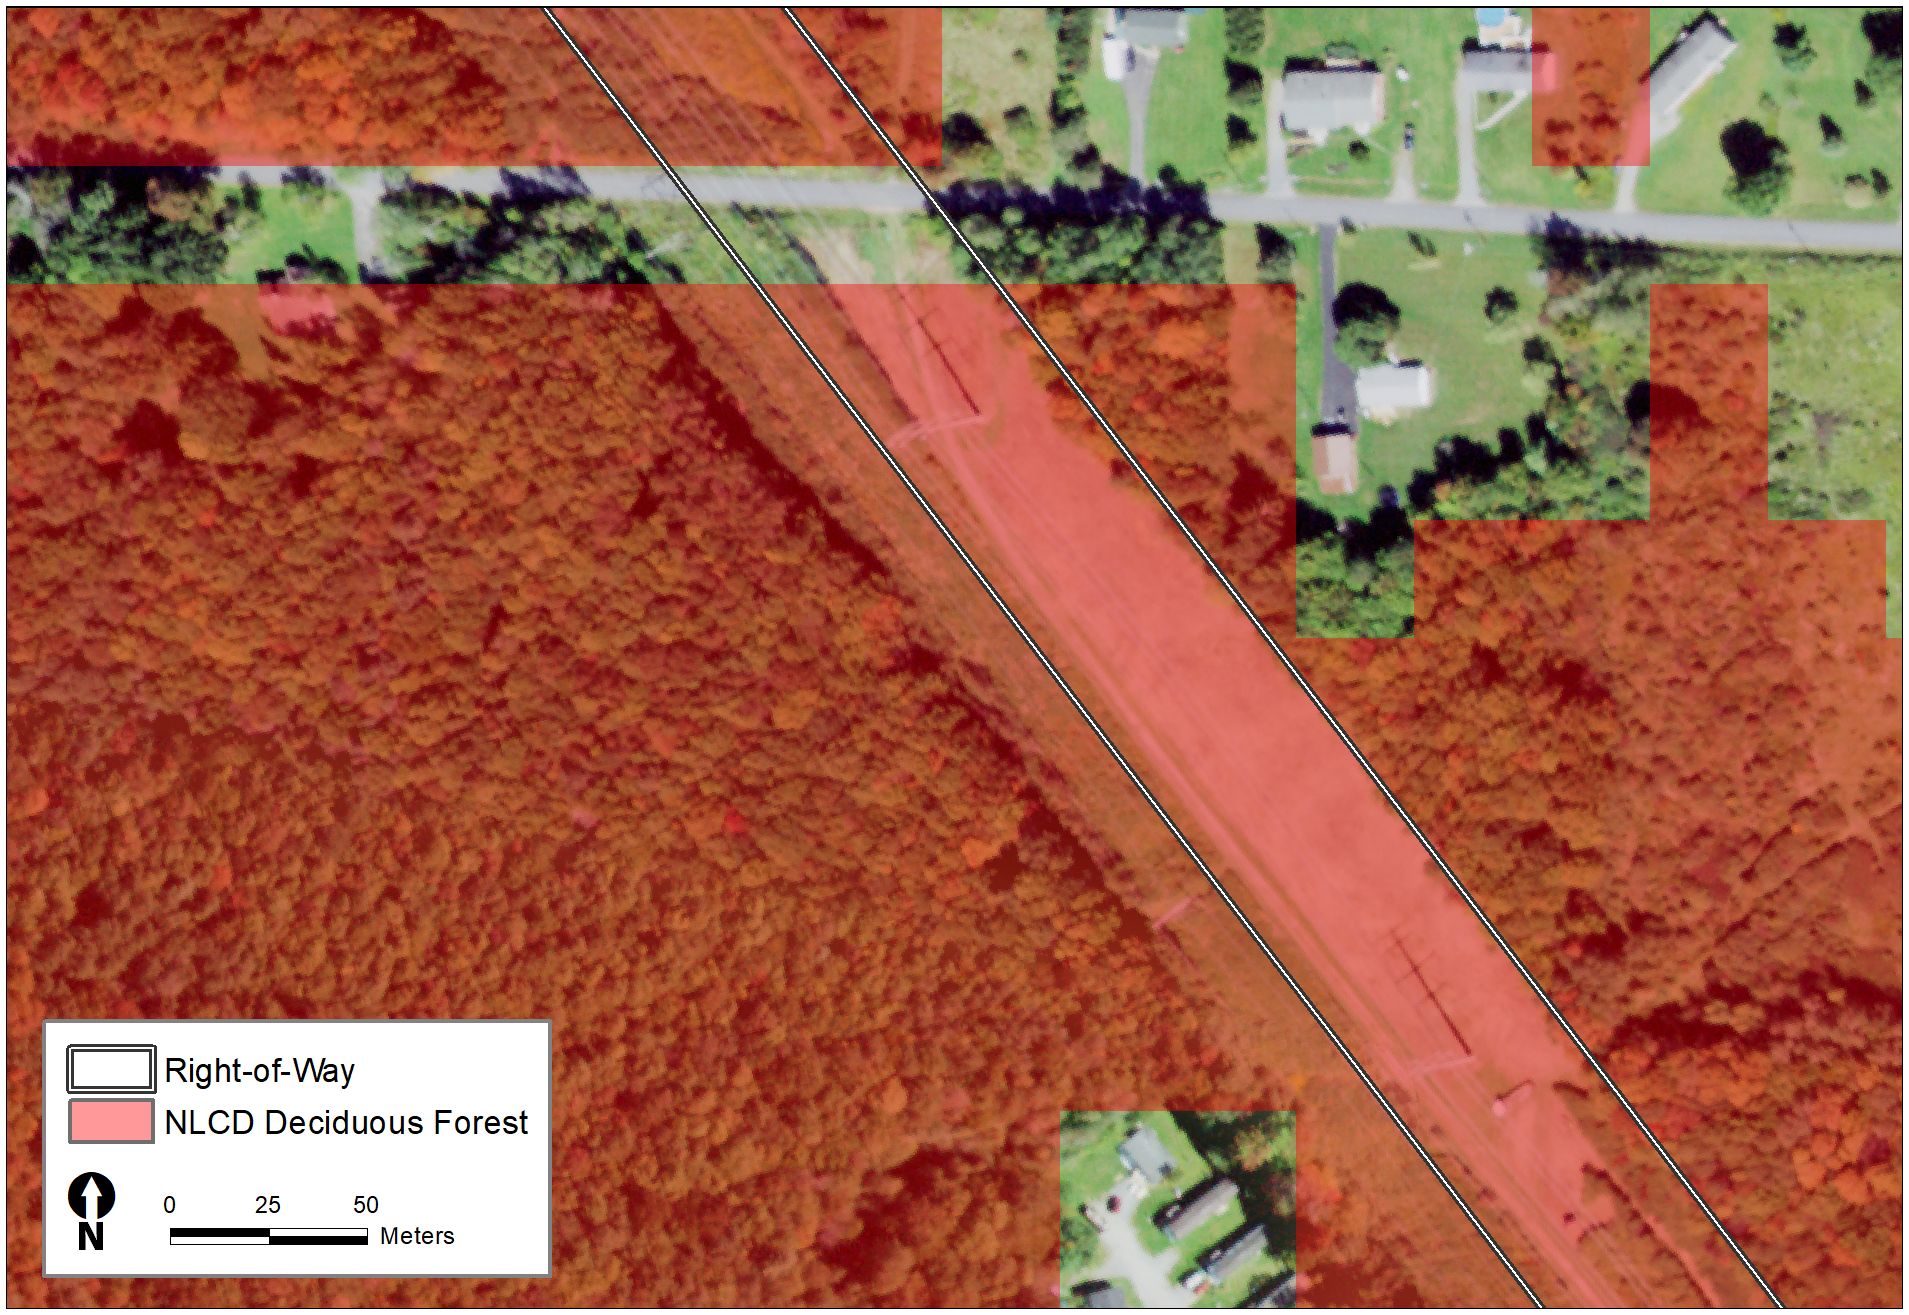
Figure 2 Incorrect classification of deciduous forest in ROW (EPRI, 2023a).
Generally, the model may be inconsistent with actual field conditions under transmission lines when the surrounding land cover type is significantly different than the land managed under the lines. In the Northeast, which is heavily forested, the vegetation under managed transmission lines differs from surrounding vegetation and NLCD information. In the Midwest, however, where agricultural fields of corn and soy are more frequently found under transmission lines, there was less likelihood of inconsistencies between model results and land manager validation. Discrepancies between national datasets and true land cover could be ameliorated by using higher resolution data for the region under consideration, although availability of such data is variable.
3.2 Applying the model to company landholdings
Applying the model to company-provided geographic information system (GIS) landholdings data, we generated for each company summary tables and maps showing the amount and location of monarch habitat (Table 1). Part of this analysis included reviewing regional, subregional, and parcel data to fully understand opportunities and approaches for managing habitat for monarchs. The goal of the analysis was to identify current monarch habitat, not necessarily to identify opportunities for restoration. However, some of the “low” value areas were good candidates for restoration, depending on underlying land cover, soils, surrounding landscape, and vegetation management options (i.e. developed high intensity, and cultivated croplands may not be optimal for monarch restoration). Companies were provided detailed tables showing their lands across 15 different land cover types (Table 1; Supplementary Table 2–4).
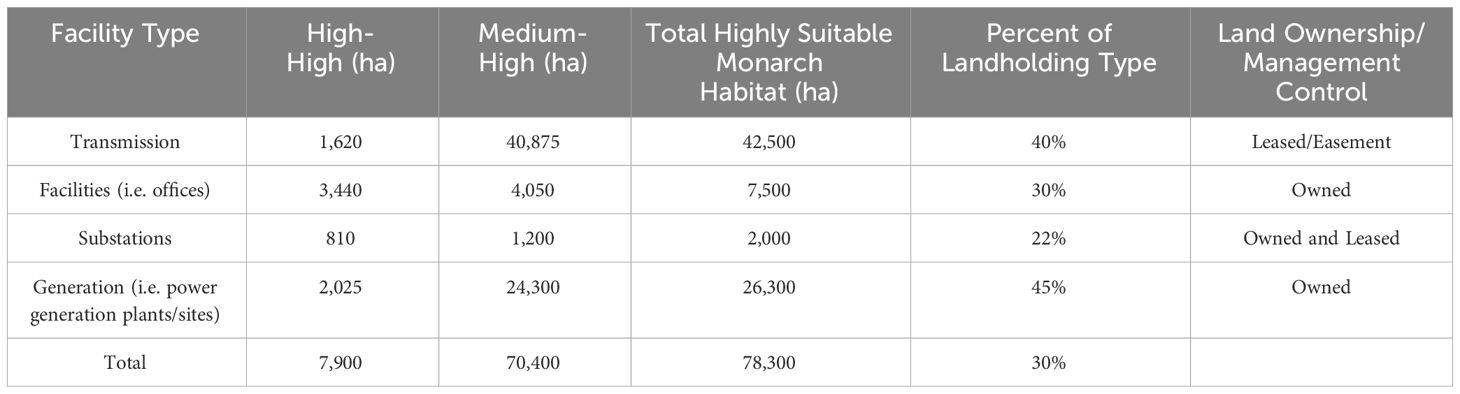
Table 1 Example of company results showing monarch suitability, facility types, size, management control, and degree of suitability for monarch butterflies.
There was wide variation among companies in both the total amount of suitable monarch habitat and where that habitat was likely to be co-located with their facilities. While the eight companies in the study used various approaches for labeling their land asset types, five companies used similar boundaries for classifying facility types. Comparing results of these five companies, the “highly suitable” habitat ranged from 12% to 84% across their landholdings, from 27% to 86% within transmission lines, and from 2% to 34% at substations (Table 2). These companies were located throughout the United States, including all 15 NLCD land cover types considered in this analysis. While there is academic and industry interest in the potential for the power industry to manage land under transmission lines to support monarchs (and other pollinators), in this case, Company 2 had higher predicted monarch suitability across all landholdings compared to transmission lines, suggesting caution in assuming where specific companies have monarch habitat.
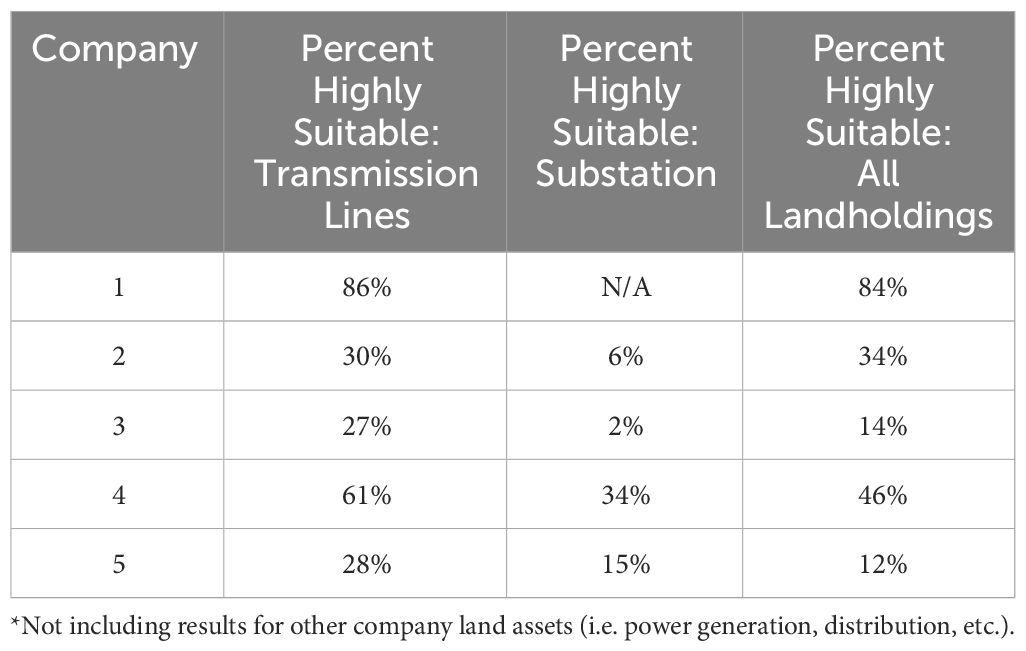
Table 2 Anonymized company results showing percent highly suitable monarch habitat for transmission lines, substations, and all landholdings*.
3.3 Expert analysis and decisions
After executing the model using company-provided GIS landholdings data, additional analysis was needed to support companies to make decisions about their monarch management approach. Three key questions were presented to assist companies in making monarch management strategies (EPRI, 2021):
1. What property do you have authority and control to manage (not necessarily involving ownership) for monarchs, milkweed, or nectar plants?
— Given the various ownership and management authorities for power company land, it is important to evaluate monarch habitat against the ability to manage the land. Power plants and substations, for example, are typically owned, whereas the land under transmission and distribution systems is typically managed via lease and landowner easement agreements. Further, within specific property types, it may not be reasonable to support monarch habitat for various ecological, legal, or operational conditions.
2. What activities do you perform on a property that could impact/benefit monarchs, such as vegetation management practices?
— It is essential to review vegetation management practices to understand if current approaches support or impact monarchs. For some companies that manage large amounts of land (40,000 hectares or more), it can be difficult to compile all vegetation management protocols from multiple business units. Also, the surrounding landscape that may not be conducive to supporting monarchs (i.e. exposed to heavy pesticide application) and other land use priorities may need to be considered (i.e. recreation, stormwater management, carbon-sequestration optimization).
3. What is your overall risk tolerance and liability if the monarch is ESA listed?
— With an understanding of total properties and how current land-management activities relate to monarchs, companies can make organizational decisions about how they will manage monarchs. This decision will differ for each company and balances their liability (legal or reputational) with risk tolerance.
By cross-walking predicted monarch suitability with land cover type, facility type, legal and regulatory obligations, current vegetation management practices, land management control, and even competing environmental goals, companies prioritized where to focus effort conducting site visits, monitoring for monarch habitat, protecting existing habitat, and finding collaboration opportunities with state and federal agencies for monarch habitat management.
4 Discussion
Whether the monarch is listed or not, electric power companies are considering land-management plans and how to communicate those plans to investors, stakeholders, and customers. Consistent with prior findings, it was clear that there was no single way to approach monarch management based only on modeling results; it was necessary to incorporate other business, operational, and sustainability factors along with the modeling results and the GIS characterization of landholdings (EPRI, 2019). Electric power companies share several realities helping to explain why there is not a single “right” answer to monarch management.
4.1 Electric industry realties
4.1.1 Company structure and operations
“Electric power companies” are not all the same. In terms of business structure, companies can be investor owned (IOU), community owned co-ops (nonprofit), public and governed by a board of directors, quasi-governmental, or other variations. In terms of services and operations, some companies deliver electricity and purchase power from others, some generate electricity and sell power, and others are vertically integrated to generate and deliver power. There are additional variations, including shared ownership in a single power plant between many companies (e.g. Palo Verde Nuclear Generating Station). Solar sites can involve the construction company, array owner, landowner, power purchaser and vegetation manager, with the environmental compliance responsibilities shared across groups to varying degrees. In terms of management control, companies may own, lease, or have access to easements on land required for operations. In ROW, which are generally managed via easement agreements, the power company may not have control over the landowner’s actions and there may be legal, regulatory, and operational requirements for managing vegetation. For example, transmission lines have a specific requirement to keep vegetation clear of the electric lines; electrical substations have access and visibility issues that inform the acceptable vegetation options on site; and solar sites need to consider shading and panel damage resulting from vegetation-management equipment. It is necessary to recognize the diversity of business structures, operations, and asset-management realities before an appropriate company-specific monarch habitat management approach can be developed.
4.1.2 Business justification
Electric power companies are obligated by policy, regulation, and customer expectations to provide safe, reliable, and affordable electricity. Commitments beyond what is required to meet this core mandate often fall into the voluntary “sustainability” realm, and need to be justified with a business case, including consideration of tradeoffs (EPRI, 2015; Fox, 2016; Fox and Scott, 2018). It may be socially and economically unacceptable, for example, to prolong an emergency electric power outage to protect monarch habitat. Sometimes supporting monarchs through planting of milkweed and native flowers may be at odds with other conservation or community goals, such as managing forests to increase carbon storage, limiting milkweed encroachment onto farmland, or building community recreation fields, for example.
When companies engage in proactive and voluntary conservation, their business case needs to explain how the action supports customers, investors, and the public, and can vary depending on the organization’s business structure, stakeholder community, and legal requirements (EPRI, 2020b). Companies also need to consider if their voluntary habitat restoration actions might someday become legal and operational liabilities if future construction or maintenance activities impact vulnerable species. While there are some specific legal mechanisms to minimize this concern, such as Safe Harbor Agreements, Candidate Conservation Agreements, and the proposed Conservation Benefit Agreements (Federal Register, 2023), engaging in those programs can be onerous and may not receive executive support due to an inadequate business case.
Any power company activity requires consideration of company legal obligations, balancing competing environmental goals, stakeholder expectations, and organizational reputation. Companies are obligated by law to protect people, then electric service, then species – even if the monarch is federally protected under ESA.
4.1.3 Energy transition
The electric power industry is undergoing an enormous transition as companies manage aging infrastructure, cybersecurity threats, adoption of renewable energy, aggressive end-use energy efficiency programs, and electrification of systems. The retirement of coal-fired power plants and increasing use of wind, solar, and other means of energy generation are changing the associated habitat footprint of these energy resources. While the electric system’s terrestrial footprint has largely been stable for the past three decades, this footprint is expected to change rapidly over the next decade, impacting the underlying habitats involved. For example, ground-mounted solar may have impacts to existing habitats across millions of hectares, in addition to the upgraded and new transmission system needed to move those kilowatts of energy to customers (Denholm et al., 2022). Solar development is driven by carbon reduction goals, and while some solar developers can implement voluntary biodiversity restoration efforts, instances of improving habitat beyond what is required by solar siting permits is variable and influenced by economic, legal, and social factors (EPRI, 2023b).
4.1.4 Regulatory unknowns
The USFWS has determined the monarch is warranted for listing based on the results of a Species Status Assessment (Federal Register, 2020; USFWS, 2020). However, there are unknowns that are central to understanding the potential impact of a listing decision on electric power companies. While the USFWS has determined the species is “warranted for listing,” it is unknown if the monarch will be listed as “Threatened” or “Endangered,” or not listed at all. If it is listed, the specific listing status has various regulatory and legal impacts, including the potential application of a 4(d) Rule, which applies only to Threatened species, which may allow specific land management activities to continue without mitigation requirements (EPRI, 2020a). Further, the novel establishment of the Nationwide Candidate Conservation Agreement for Monarch Butterflies on Energy and Transportation Land (Energy Resources Center, n.d.) provides electric power companies with the opportunity to proactively undertake conservation measures that benefit monarchs and, in turn, to avoid additional mitigation requirements for ongoing land management activities if the monarch is listed (USFWS, 2020). While the agreement does not cover impacts of building new assets, including new solar arrays, as of March 2024, 30 energy companies had applied or enrolled in the agreement (UIC Today, 2024).
4.1.5 Transmission system
Companies’ transmission systems may provide an opportunity to support biodiversity and other ecosystem services (Bramble et al., 1997; Lensu et al., 2011; Wojcik and Buchmann, 2012; EPRI, 2016; Hill and Bartomeus, 2016), including monarchs (Thogmartin et al., 2017). Transmission systems move high voltage electricity across larger areas before transitioning to lower voltage distribution lines. Transmission lines have wider ROW under the lines compared to distribution lines, which tend to run along roadsides. However, there is a lack of definitive estimates of the area and composition of land under transmission lines in the United States; some citations have quoted 3.2 million ha (Johnson et al., 1979), but these are not backed by recent analysis (Goodfellow, 2012). Self-reporting by power companies in the EPRI Power-in-Pollinators Initiative shows pollinator habitat under transmission lines includes 79 entries within forest, agriculture, grassland, urban, barren, and shrubland (EPRI, 2022; Supplementary Figure 2-2), but this is still a small subset of potential land within the United States transmission system. The heterogeneity of the land cover types under transmission lines includes many possible land types and uses (agriculture, desert, mountains, and rangeland), making generalized assumptions about opportunities to support monarchs in ROW difficult.
4.1.6 Implementation realities
The first step in habitat modeling, compiling GIS datasets of all managed properties by a company, can be labor-intensive and involves working across business units, subsidiaries, and the parent company. After applying the model, the company needs to propose actions, acquire executive approval, and identify and direct appropriate funding. Even when these steps are completed, there may still be organizational and technical hurdles to implementation. Some companies report capacity challenges for vegetation management and monitoring (such as time, specific training). Vegetation management activities are often performed by contractors who need course training for monarch-related considerations. These contractors are frequently reassigned, creating an ongoing onboarding and training cost. Additionally, vegetation management typically occurs on a schedule that may not align with the monarch breeding window or milkweed blooming, and it can be difficult to execute conservation actions that rely on milkweed identification.
4.2 Company reactions and model improvements
The model helped focus companies on areas where monarch habitat is predicted to occur, including some parcel-level opportunities for conservation. However, the relatively coarse resolution of the datasets (30-m pixels) limited more precise analysis, particularly in heterogeneous landscapes and on smaller sites (i.e. roadsides, specific parks, etc.). These limitations led to frustration that the modeling results were not refined enough to replace site visits necessary to confirm monarch habitat conditions, which was reported to be onerous. Some of the opportunities identified were eliminated during expert analysis due to a company’s lack of “authority and control” over the properties. Identifying specific opportunities for restoration was not the purpose of the research, which some companies found disappointing, as they wanted to know where to prioritize investments in the restoration of habitat beyond just protecting existing habitat. Most companies will need to take additional steps, even after model results and expert analysis, to make specific decisions about where to protect and restore habitat, including conducting site-specific ground truthing of the model results.
Given the focus on milkweed as a critical habitat element for monarchs, understanding the condition of milkweeds across the United States is crucial. However, in developing the model, the lack of available spatially representative data and scientific publications made estimating milkweed abundance in the eastern range challenging and was estimated by using GIS land cover types. Using GIS land cover types as proxies for estimating milkweed abundance is subject to error. In contrast to the western region, where there was a unique dataset of milkweed occurrences (Dilts et al., 2019), the eastern and Midwest region estimated milkweed by land class. There is also a paucity of research of land cover-specific milkweed density outside the upper Midwest. Southeastern states are particularly bereft of research on milkweed occurrence and density; this area is at the edge of the range for some milkweed species common to midwestern and northeastern states, while solidly inside the range of other milkweed species most commonly found in southern states. The relative differences in milkweed density between the northern and southern breeding regions are not well supported with scientific datasets. This knowledge gap is slowly being addressed; for instance, the Integrated Monarch Monitoring Program (Monarch Joint Venture, n.d.) provides regional and land use-specific insight into floral availability and milkweed density (Cariveau et al., 2019), but even here little information is collected on powerline ROW. It would be helpful to advance a national understanding of milkweed abundance, composition, and quality.
The model approach to use land cover types as proxies for monarch suitability is the current best approach for assessing large landscapes quickly and cost-effectively. Companies were able to identify overall percent of likely monarch habitat on their lands and the locations of this habitat. Understanding limitations of the model is critical to avoid inappropriate conclusions:
• The model does not consider complex aspects of monarch biology, including where monarch butterflies are across space and time, the comparative importance of monarch habitat across regions/states, reproductive and behavior habits, or population dynamics (including, the role of the Mexico overwinter sites).
• There are regional differences in how monarchs use milkweed and nectar resources. The model equally weights nectar and milkweed and does not account for different species of milkweed nor regional differences in how monarchs depend on these resources from north to south or east to west.
• There are embedded scientific limits to interpreting the national maps resulting from the model, as monarchs depend on these resources at varying degrees and at different times of year throughout the country. Application of the modeling results at a national scale for guiding national monarch conservation priorities would be inappropriate.
• As companies develop a monarch management plan, GIS data cannot be used alone. Other factors including local monarch expert opinion, interpretation of the GIS modeling outputs, and broader company goals and responsibilities must be considered.
• An estimate for milkweed quality was not done, only abundance. We used the abundance estimates as a proxy for overall milkweed suitability.
The model can be improved with more field data for milkweed and nectar resources, as well as additional sophistication in considering regional variations in monarch’s reliance on those resources. In the absence of occurrence data, use of higher resolution land classification data for the entire country is theoretically possible and could improve the predictive capacity of using land cover types for monarch habitat, particularly when robust regional milkweed and floral resource occurrence information is lacking. However, efforts to include high-resolution land cover datasets, if available, are labor intensive to apply at landscape scales, and reliable occurrence and quality data for milkweed and floral resources are lacking.
4.3 Summary
The objective of this project was to develop and apply a GIS-based approach to help electric power companies better understand the location and extent of monarch habitat within their landholdings in the contiguous United States. The model and insights may be useful for other organizations working across large landscapes to manage monarchs.
The research suggests that conclusions about how power companies manage for monarch conservation may need to be context specific, given the diversity of company structures, overarching legal mandates, and the broad suite of land cover types managed via various ownership, easements, and lease agreements. This matter is further complicated by the rapid transition to renewable energy to meet climate goals, which has business and ecological considerations, and balancing requirements to maintain operations and emergency response programs during a time of increasing extreme weather events. Indeed, it is a challenge to get more done at once (address climate change, conserve habitat, ensure grid-stable electricity). Monarchs will not be the last protected pollinator – collaboration between scientists, the energy sector, and other experts on creative solutions to protect rare species can help ensure social equity, physical stability, and public safety of our electric power system.
Data availability statement
The original contributions presented in the study are included in the article/Supplementary Material, further inquiries can be directed to the corresponding author.
Author contributions
JF: Conceptualization, Investigation, Methodology, Project administration, Writing – original draft, Writing – review & editing, Formal analysis. KA: Data curation, Formal analysis, Investigation, Methodology, Writing – review & editing, Validation. LL: Conceptualization, Methodology, Writing – review & editing. JD: Conceptualization, Methodology, Writing – review & editing. WT: Conceptualization, Methodology, Writing – review & editing. CN: Conceptualization, Writing – review & editing.
Funding
The author(s) declare financial support was received for the research, authorship, and/or publication of this article. The model development was funded through a collaborative EPRI research project, including a variety of electric power companies in the United States. All other analysis and contributions were provided in-kind.
Acknowledgments
We are grateful to experts who provided input during the development and application of the Monarch Habitat Model, including: Alliant Energy; New York Power Authority; Tennessee Valley Authority; Ameren; Sacramento Municipal Utility District; Dr. Kelly Nail, USFWS; Phil Delphey, USFWS; Ryan Drum, USFWS; Sean Sweeney, USFWS; Dr. Eric Lonsdorf, Emory College; Stephanie Frische, Xerces Society; Dr. David Zaya, University of Illinois; Dr. Ray Moranz, Xerces Society; Dr. Tyler Flockhart, Flockhart Consulting; Dr. Chip Taylor, University of Kansas and Monarch Watch; Emma Pelton, Xerces Society; Dan Salas, Stantec; Iris Caldwell, University of Illinois Chicago; Nick Pilot, EPRI. Any use of trade, firm, or product names is for descriptive purposes only and does not imply endorsement by the United States Government.
Conflict of interest
Author KA was employed by the company ICF Jones & Stokes Inc.
The remaining authors declare that the research was conducted in the absence of any commercial or financial relationships that could be construed as a potential conflict of interest.
The author(s) declared that they were an editorial board member of Frontiers, at the time of submission. This had no impact on the peer review process and the final decision.
The reviewer JP declared a past co-authorship with the author WT. The handling editor MPVDB declared a shared affiliation with the authors JD, WT at the time of review.
Publisher’s note
All claims expressed in this article are solely those of the authors and do not necessarily represent those of their affiliated organizations, or those of the publisher, the editors and the reviewers. Any product that may be evaluated in this article, or claim that may be made by its manufacturer, is not guaranteed or endorsed by the publisher.
Supplementary material
The Supplementary Material for this article can be found online at: https://www.frontiersin.org/articles/10.3389/fevo.2024.1360325/full#supplementary-material
References
Bramble W. C., Yahner R. H., Byrnes W. R. (1997). Effect of herbicides on butterfly populations of an electric transmission right-of-way. J. Arboriculture 23, 196–206. doi: 10.48044/jauf.1997.031
Cariveau A. B., Holt H. L., Ward J. P., Lukens L., Kasten K., Thieme J., et al. (2019). The Integrated Monarch Monitoring Program: from design to implementation. Front. Ecol. Evol. 7. doi: 10.3389/fevo.2019.00167/full
Denholm P., Brown P., Cole W. (2022). Examining supply-side options to achieve 100% Clean electricity by 2035 (Golden, Colorado: National Renewable Energy Laboratory). Available at: https://www.nrel.gov/docs/fy22osti/81644.pdf. NREL/TP6A40-81644.
Dewitz J. (2021). National Land Cover Database (NLCD) 2019 Products Version 2.0. U.S. Geological Survey. doi: 10.5066/P9KZCM54
Dilts T., Steele M., Engler J., Pelton E., Jepsen S., McKnight S., et al. (2019). Host plants and climate structure habitat associations of the western monarch butterfly. Front. Ecol. Evol. 7. doi: 10.3389/fevo.2019.00188
ECOS. (2023). Environmental conservation online system. U.S. Fish and Wildlife Service, species reports. Available at: https://ecos.fws.gov/ecp/species-reports (Accessed December 2023).
Energy Resources Center. (n.d.). Nationwide CCAA for monarch butterfly. Available at: https://rightofway.erc.uic.edu/national-monarch-ccaa/.
EPRI. (2015). The electric power industry business case for sustainability: literature review and executive rationale (Palo Alto, California: EPRI), 3002005759.
EPRI. (2016). Pollinator diversity on powerline corridors in new york and ohio: study initiation (Palo Alto, California: EPRI), 3002008535.
EPRI. (2019). Conservation actions for electric power companies to support monarch butterflies (Palo Alto, California: EPRI), 3002015435.
EPRI. (2020a). Opportunities for electric power utilities to proactively engage on section 4(D) rules for threatened species (Palo Alto, California: EPRI), 3002018984.
EPRI. (2020b). Understanding barriers and incentives to voluntary conservation opportunities under the U.S. Endangered species act (Palo Alto, California: EPRI), 3002018979.
EPRI. (2022). Pollinator stewardship dashboard (PSD) v1.0 (Palo Alto, California: EPRI), 3002025209.
EPRI. (2023a). Monarch habitat model: landscape-scale approach to identifying monarch habitat in the United States (Palo Alto, California: EPRI), 3002026262.
EPRI. (2023b). Land conversion to solar generation: an overview of environmental and social considerations and stakeholder perspectives (Palo Alto, California: EPRI), 3002028346.
Esri and USDA Farm Services Agency. (2023a). NAIP imagery: NDVI. Available at: https://naip.arcgis.com/arcgis/rest/services/NAIP/ImageServer (Accessed December 2023).
Esri, USDA Farm Services Agency. (2023b). Normalized Difference Vegetation Index (NDVI). Available at: https://www.arcgis.com/home/item.html?id=aa9c87d6f17b452296252bd75005f6a4 [Accessed December 2023].
Federal Register. (2020). Endangered and threatened wildlife and plants; 12-month finding for the monarch butterfly (Washington, D.C., United States: Fish and Wildlife Service), 85 FR 81813. Available at: https://www.federalregister.gov/documents/2020/12/17/2020-27523/endangered-and-threatened-wildlife-and-plants-12-month-finding-for-the-monarch-butterfly.
Federal Register. (2023). Endangered and threatened wildlife and plants; enhancement of survival and incidental take permits (Washington, D.C., United States: Fish and Wildlife Service), 88 FR 8380. Available at: https://www.federalregister.gov/documents/2023/02/09/2023-02690/endangered-and-threatened-wildlife-and-plants-enhancement-of-survival-and-incidental-take-permits.
Fox J. (2016). Sustainable electricity: case studies from electric power companies in north america (Switzerland: Springer International Publishing).
Fox J., Scott M. (2018). “The tradeoff conversation for sustainable electricity,” in Sustainable electricity II: A conversation on tradeoffs, eds. J. Fox and M. Scott. (Springer International Publishing, Switzerland).
Goodfellow J. (2012). Setting a standard of excellence in IVM. T&D World. Available at: https://www.tdworld.com/vegetation-management/article/20964547/setting-a-standard-of-excellence-in-ivm.
Hill B., Bartomeus I. (2016). The potential of electricity transmission corridors in forested areas as bumblebee habitat. R. Soc. Open Sci. 3, 160525. doi: 10.1098/rsos.160525
Johnson W. C., Schreiber R. K., Burgess R. L. (1979). Diversity of small mammals in a powerline right-of-way and adjacent forest in east tennessee. Am. Midland Nat. 101, 231–235. doi: 10.2307/2424918
Koh I., Lonsdorf E., Williams N., Brittain C., Isaacs R., Gibbs J., et al. (2016). Modeling the status, trends, and impacts of wild bee abundance in the United States. Ecology 130, 140–145. doi: 10.1073/pnas.1517685113
Lensu T., Komonen A., Hiltula O., Päivinen J., Saari V., Kotiaho J. S. (2011). The role of power line rights-of-way as an alternative habitat for declined mire butterflies. J. Environ. Manage. 92, 2539–2546. doi: 10.1016/j.jenvman.2011.05.019
Monarch Joint Venture. (n.d.). Integrated monarch mentoring program. Available at: https://monarchjointventure.org/mjvprograms/science/integrated-monarch-monitoring-program.
NAIP GeoHub. (2023). National agriculture imagery program (NAIP) (U.S. Department of Agriculture). Available online at: https://naip-usdaonline.hub.arcgis.com/ (Accessed December 2023).
Natural Capital Project. (2021). InVEST, crop pollination – pollinator abundance. Stanford University, University of Minnesota, Chinese Academy of Sciences, The Nature Conservancy, World Wildlife Fund, Stockholm Resilience Centre and the Royal Swedish Academy of Sciences. Available at: http://releases.naturalcapitalproject.org/invest-userguide/latest/en/croppollination.html (Accessed November 2021).
Science Based Targets Network (SBTN). (2024). Available at: https://sciencebasedtargetsnetwork.org/our-mission/ (Accessed December 2023).
Thogmartin W. E., López-Hoffman L., Rohweder J., Diffendorfer J., Drum R., Semmens D., et al. (2017). Restoring Monarch Butterfly Habitat in the Midwestern U.S.: A’ll hands on deck. Environ. Res. Letters Vol 12, 074005. doi: 10.1088/1748-9326/aa7637
UIC Today. (2024). UIC-led effort to protect the monarch butterfly surpasses 50 industry partners (March 23 2024). Chicago, IL: University of Illinois Chicago. Available at: https://today.uic.edu/.
United Nations. (2022). Conference of the parties to the Convention on Biological Diversity, fifteenth meeting – part II (Montreal, Canada). Available at: https://www.cbd.int/conferences/2021-2022/cop-15/documents.
USDA. (2021) CropScape – 2020 cropland data layer. Available at: https://nassgeodata.gmu.edu/CropScape (Accessed May 2021).
USFWS. (2020). U.S. Fish and Wildlife Service Finds Endangered Species Act Listing for Monarch Butterfly Warranted but Precluded. Available at: https://www.fws.gov/press-release/2020-12/endangered-species-act-listing-monarch-butterfly-warranted-precluded.
Keywords: Asclepias, conservation, Danaus plexippus, landholdings, milkweed, monarch, strategy
Citation: Fox J, Allen K, Diffendorfer JE, Lukens L, Thogmartin WE and Newman C (2024) Challenges creating monarch butterfly management strategies for electric power companies in the United States. Front. Ecol. Evol. 12:1360325. doi: 10.3389/fevo.2024.1360325
Received: 22 December 2023; Accepted: 03 April 2024;
Published: 29 April 2024.
Edited by:
Max Post van der Burg, United States Geological Survey (USGS), United States Department of the Interior, United StatesReviewed by:
John Pleasants, Iowa State University, United StatesKristen Welsh, University of The Bahamas, Bahamas
Copyright © 2024 Fox, Allen, Diffendorfer, Lukens, Thogmartin and Newman. This is an open-access article distributed under the terms of the Creative Commons Attribution License (CC BY). The use, distribution or reproduction in other forums is permitted, provided the original author(s) and the copyright owner(s) are credited and that the original publication in this journal is cited, in accordance with accepted academic practice. No use, distribution or reproduction is permitted which does not comply with these terms.
*Correspondence: Jessica Fox, SmZveEBlcHJpLmNvbQ==