 Stephen P. Rubin1*
 Melanie J. Davis2†Eric E. Grossman3
 Isa Woo4
 Susan E. W. De La Cruz4Glynnis Nakai5
 John Y. Takekawa4†
- 1U.S. Geological Survey, Western Fisheries Research Center, Seattle, WA, United States
- 2U. S. Geological Survey, Western Ecological Research Center, Olympia Substation, Olympia, WA, United States
- 3U.S. Geological Survey, Pacific Coastal and Marine Science Center, Santa Cruz, CA, United States
- 4U.S. Geological Survey, Western Ecological Research Center, San Francisco Bay Estuary Field Station, Moffett Field, CA, United States
- 5U.S. Fish and Wildlife Service, Nisqually National Wildlife Refuge Complex, Olympia, WA, United States
Benthic invertebrates play vital roles in estuarine ecosystems, but like other taxa they have been excluded from former marshlands by diking and land use conversion. Dike removal is one way of restoring marsh, but the response of benthic invertebrates has been little studied. Also understudied is variation in benthic invertebrate communities across entire deltas, particularly in the Pacific Northwest of North America where deltas receive high flows and sediment loads for their size. Our goals were to evaluate invertebrate response to large-scale dike removal on the Nisqually River Delta in Puget Sound, Washington, U.S.A., characterize delta-wide invertebrate community variation, and relate invertebrate response and spatial variation to environmental conditions. We sampled invertebrates annually from one year before to three years after dike removal in restoring marsh, previously restored marsh, undisturbed reference marsh, and adjacent tidal flats. Marine taxa immediately colonized the area recently restored to tidal inundation and population size grew exponentially thereafter for several of them. Community composition and diversity recovered completely, and density and biomass were approaching recovery three years later. Invertebrate communities converged between restoring and pre-existing marsh (previously restored and reference), suggesting an influence of reestablished connectivity. Just offshore from the dike line, invertebrates declined one year after dike removal but then rebounded indicating resilience to short-term disturbance. Dike removal effects were not detected farther offshore. Near the offshore edge of the delta, invertebrate biomass and body size were greater than elsewhere and a diverse assemblage of crustaceans, polychaetes, and bivalves was present. Farther inshore, tidal flats were dominated by a few species of small-bodied polychaetes and had higher density but lower biomass and diversity. Facultative detritivores, which can also filter feed, were the dominant feeding guild everywhere on the tidal flats. Density, biomass, diversity, and community composition on the marsh were more similar to the inner than outer tidal flats. Environmental variables most associated with invertebrate community variation were elevation, salinity, and sediment grain size and organic content. Our results are relevant to assessing performance and setting expectations for future restorations and have broad implications for the role of benthic invertebrates in estuarine ecosystems.
1 Introduction
Benthic macroinvertebrates are an important component of estuarine ecosystems. They directly process a significant portion of system-wide primary production (Herman et al., 1999) and allochthonous organic input (Burd et al., 2013), and can have an indirect effect on total sediment metabolism and nutrient cycling by stimulating microbial processing of organic matter through bioturbation and bio irrigation (Kristensen et al., 2014). They interact with primary producers such as microphytobenthos, macroalgae, and seagrass through grazing which can prevent growth or stimulate it through epibiont removal (Duffy et al., 2015). Additionally, benthic invertebrates form the foundation of many estuarine food webs and constitute important prey items for fish and waterbird species (Quammen, 1984; Bottom and Jones, 1990; Placyk and Harrington, 2004; Howe and Simenstad, 2011).
Over the past century, global loss of estuarine habitats to agriculture, industry, and urbanization has been extensive, and as a consequence many important species are depleted (Lotze et al., 2006). Pacific Northwest river deltas provide rearing and feeding habitat for estuarine-dependent fish (Hughes et al., 2014) and waterbirds (Michel et al., 2021) but in developed areas much of this habitat has been lost (Simenstad et al., 2011). Diking, draining, and conversion of highly productive tidal marshes to farmland have been especially detrimental to several species of salmon that are in decline and depend on marsh habitat and the invertebrate prey it provides during outmigration (Simenstad and Cordell, 2000; Fresh, 2006). Recently, attempts have been made to reverse this process and restore marsh through dike removal. Such a project was undertaken on the Nisqually River Delta in southern Puget Sound, Washington, U.S.A. starting in 1996. Restoration efforts culminated in 2009 with the removal of a century-old dike system surrounding over 300 ha of freshwater marsh on the Billy Frank Jr. Nisqually National Wildlife Refuge (hereafter “Refuge”). The primary motivation for restoration was to increase juvenile salmon rearing habitat; however, it was considered whole-ecosystem restoration likely to benefit native species of all types.
Studies evaluating the capacity of restored marsh to support invertebrates (usually in the context of salmonid prey) in other estuaries have found marked post-restoration shifts in prey abundance (Simenstad and Thom, 1996; Gray et al., 2002; Tanner et al., 2002). In the Nisqually estuary, Woo et al. (2018) measured the response of benthic, terrestrial, and pelagic invertebrates during the first three years after dike removal on the Refuge. They compared the 2009 restoration area, nearby emergent marsh in an older restoration area, and undisturbed reference marsh, and found large increases in salmonid prey abundances in the recently restored area and comparability of prey resources there to previously restored and undisturbed marsh for all three invertebrate strata.
Here we focus specifically on benthic invertebrates and expand the scope to include tidal flats extending from the edge of the emergent marsh offshore to the delta front. We build on the results presented by Woo et al. (2018) with a more extensive spatial analysis to evaluate invertebrate response to dike removal from the perspective of the entire delta, which allowed us to address the extent of effects on invertebrates on tidal flats adjacent to restored marsh. We also reexamine colonization of the recently restored area by marine taxa including an assessment of the progression, speed, and completeness of invertebrate recovery. Our focus on benthic invertebrates includes broad consideration of their functional roles in estuarine ecosystems including examining functional feeding guild composition (Macdonald et al., 2012).
In addition to assessing effects of dike removal, we investigated how invertebrate communities varied across an onshore-to-offshore gradient extending from the inner edge of the marsh to the outer edge of the delta. Pacific Northwest deltas are at the terminus of rivers draining steep, rain and snow laden mountains and receive high flow and sediment inputs for their size (Czuba et al., 2011). The Nisqually River Delta fits in this category even though in recent years much of the river-borne sediment has been trapped behind upriver dams and no longer reaches the delta (Curran et al., 2016). Little is known about delta-wide invertebrate variation in systems like these, although it has been studied in a broad range of other systems lacking high flow and sediment inputs in proportion to their size (Mannino and Montagna, 1997; Ysebaert et al., 2003; Giberto et al., 2004; Currie and Small, 2005).
In conjunction with investigating invertebrate response to dike removal and invertebrate community variation across the delta, we examined how the invertebrate community was related to environmental variation. We evaluated relationships with bed elevation; sediment grain size, organic content, and pH; and water column salinity, temperature, and dissolved oxygen. These variables can affect benthic invertebrate abundance and species composition (Ysebaert and Herman, 2002; Hirst, 2004; Dethier and Schoch, 2005; Burd et al., 2008; Dethier et al., 2010; van der Wal et al., 2017). Our analyses include separating temporal effects of environmental changes from spatial differences.
Here we characterize delta-wide spatiotemporal variation in benthic macroinvertebrate communities from one year before to three years after a major dike removal project and establish the environmental basis for this variation. Specifically, we address (1) how benthic invertebrates responded to the return of tidal inundation following dike removal; (2) whether their community composition changed beyond the scope of the restored area, either in nearby pre-existing marsh or on the tidal flats; (3) whether dike removal constituted a short-term disturbance event for invertebrates; and (4) how community composition varied spatially along an environmental gradient extending from emergent marsh to the delta front. Our results are useful as a measure against which to set expectations and evaluate performance of future restorations, and they have broad implications for the role of benthic invertebrates in estuarine ecosystems including trophic support of species of concern. The observed associations with environmental variables are helpful for guiding process-based monitoring and gaining better understanding of the consequences of environmental change for benthic invertebrates.
2 Materials and methods
2.1 Study area
The Nisqually River Delta is located at the southern end of Puget Sound, Washington, USA (Figure 1). The study area included the entire mesohaline (emergent marsh, 490 ha) and adjacent polyhaline [tidal flats, 1470 ha (Simenstad et al., 2011)] zones. Mean annual discharge from the Nisqually River is 59 m3·s-1 with a mean annual sediment load of 109,000 tonnes/yr (Czuba et al., 2011). Daily tides are mixed semidiurnal with a 2.9 m mean range (mean high water-mean low water) and a 4.1 m great diurnal range (mean higher high water-mean lower low water).
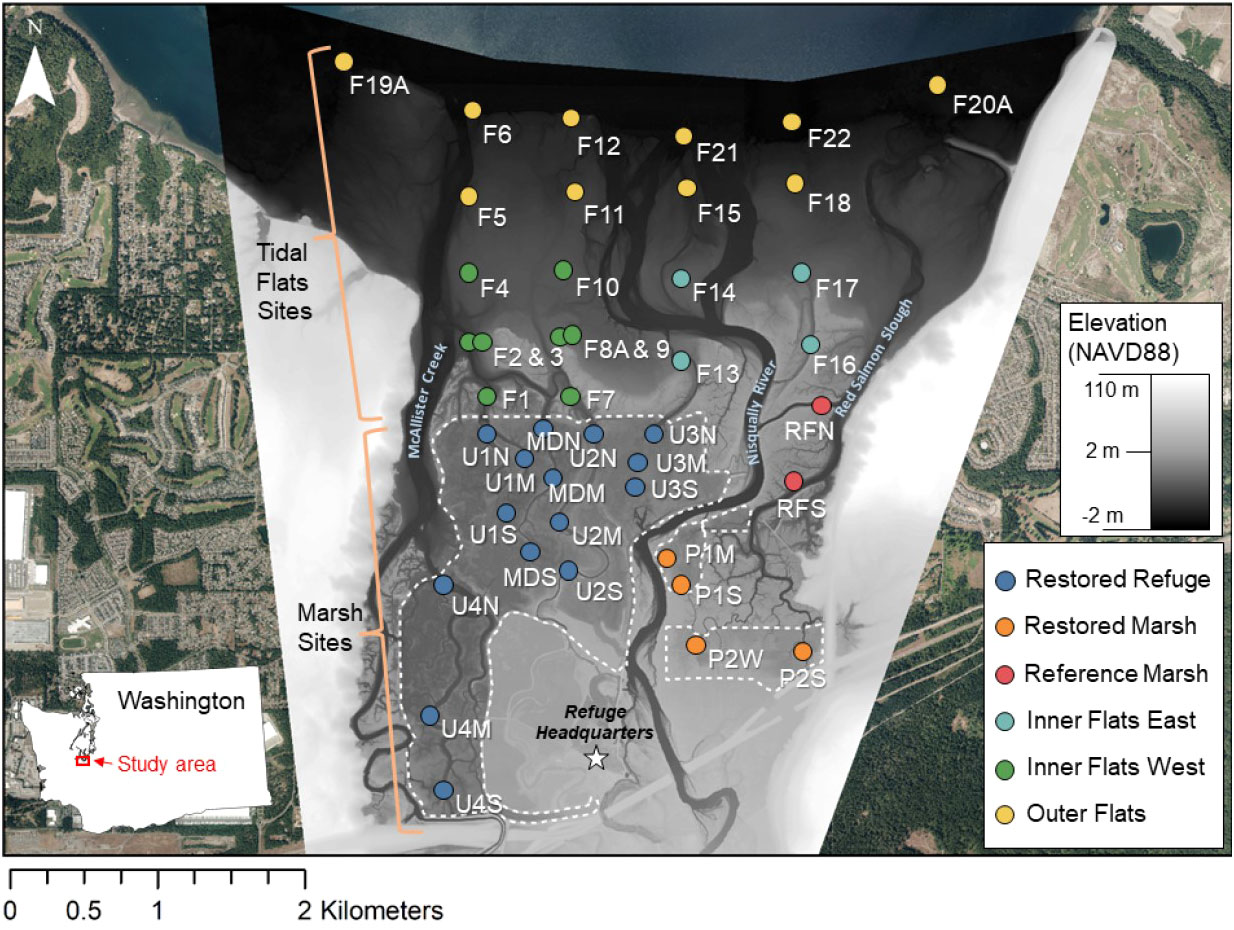
Figure 1 Study area. Sampling sites are color-coded by habitat. White labels indicate site names. Marsh sites: U1, Unit 1; U2, Unit 2; U3, Unit 3; U4, Unit 4; M, Madrone; P1, Phase 1 restoration; P2, Phase 2 restoration; RF, reference. For Marsh sites, the last letter indicates the position along a tidal channel: N, north; M, middle; S, south; W, west. Tidal Flats site names all start with F. Elevation was determined from topobathymetric lidar data collected in 2011. The dashed line shows where dikes were removed. The star shows the location of the Billy Frank Junior National Wildlife Refuge headquarters. Base layer imagery was taken in 2014 by Watershed Sciences, Inc., Corvallis, OR, United States.
Since 1996, the Nisqually Indian Tribe and the Refuge have restored 364 ha of former emergent marsh habitat to tidal inundation through multiple phased dike removal projects: 3.6 ha in 1996 (Pilot), 12.5 ha in 2002 (Phase 1), 40 ha in 2006 (Phase 2), and 308 ha on the Refuge in 2009 (Restored Refuge). Initial restorations (1996-2006) occurred east of the Nisqually River and removed barriers to tidal inundation via Red Salmon Slough (Figure 1). During our study, these initial restorations contained vegetation common to high- and mid-elevation salt marshes of the Pacific Northwest (Belleveau et al., 2015) and were structurally similar to historically unaltered salt marsh along Red Salmon Slough to the northeast. In the fall of 2009, dikes surrounding the subsided, freshwater, and rain-fed wetlands on the Refuge were removed, reestablishing over 44 ha of major tidal channels (Ellings et al., 2016). After dike removal, the freshwater vegetation died back and was gradually replaced by bare ground and halophilic tidal marsh plants (Woo et al., 2018).
The Nisqually Delta tidal flats are entirely within the Refuge except for a commercial shellfish farm northwest of the mouth of McAllister Creek. The flats are mostly unvegetated except for eelgrass meadows along McAllister Creek (Takesue, 2016; Woo et al., 2019), near the delta front offshore from Red Salmon Slough, and at the northwest corner of the delta (Hodgson et al., 2016).
2.2 Site groupings and placement
We merged two concurrent sampling efforts that occurred in the restored and historically undisturbed marshes (Marsh) and on the tidal flats to the north of the marsh boundary (Tidal Flats). Sampling sites were grouped by location (Marsh versus Tidal Flats) and then by habitat within each location (Figure 1).
Marsh sites (n = 21) were grouped into three habitats for consistency with Woo et al. (2018): Restored Refuge, which was restored to tidal inundation by dike removal in fall 2009; Restored Marsh, which was previously restored (Phase 1 in 2002 and Phase 2 in 2006); and undisturbed Reference Marsh (Figure 1). Within the Restored Refuge, sites were positioned along five tidal channels (Units 1-4 and Madrone). Three sites were sampled in each channel: one just inshore from the dike line (north), one near the inshore terminus (south), and one in the middle. Other Marsh sites were also sampled along tidal channels, including Phase 1 (P1M, P1S) and Phase 2 (P2W, P2S) Restored Marsh sites, and Reference Marsh sites along various branches of Red Salmon Slough (RFN, RFS).
Tidal Flats sites (n = 22) were also grouped into three habitats: Inner Flats East offshore from the Reference Marsh, Inner Flats West offshore from the Restored Refuge, and Outer Flats extending from the offshore edge of Inner Flats East and Inner Flats West to the delta front (Figure 1). Outer Flats sites were grouped together as a single habitat based on preliminary analyses suggesting relatively homogenous environmental conditions and invertebrate community structure. Tidal Flats sites were positioned along onshore-to-offshore transects that aligned with the Marsh sites (Figure 1). Sites F1-F6 and F7-F12 extended from the Unit 1 and Unit 2 transects, respectively. Tidal channels were well defined close to the dike line near sites F1-3 and F7-9 but grew more diffuse farther offshore. Site F3 was placed near F2 but at a higher elevation, and the same was true of F8A compared to F9. Sites F13-F15 and F21 extended from the Unit 3 transect, but only F13 was in a tidal channel. Tidal Flats sites east of the Nisqually River were not in channels. Site F19A was positioned west and F20A east of other sites on the outer edge of the delta to encompass the entire delta front. Site F19A was in eelgrass.
2.3 Data collection
We sampled from 2009 to 2012. Each site was sampled once per year in July or August. We maintained site location consistency from year-to-year with a global positioning system unit (± 3 m accuracy). Most sites were sampled in all four years, but on the Marsh the three Madrone sites were not sampled in 2009 and the three Unit 2 sites and RFS were not sampled in 2010. Other instances where sites were not sampled every year are noted in captions of figures presenting results.
2.3.1 Invertebrates
At each Marsh site we collected one medium-sized core (10 cm diameter, 10 cm deep, surface area = 78.54 cm2). Cores were filtered through stacked 1.0 mm and 0.5 mm mesh sieves (size fractions stored separately) in 2009-2010 and through only a 0.5 mm sieve in 2011-2012. Tidal Flats sampling differed between 2009 and later years. In 2009, we collected a Van Veen grab at each site (surface area = 600 cm2; mean ± SD sample depth = 9.3 ± 3.0 cm), and at 12 of the sites we also collected a medium-sized core. Grabs were filtered through a 1.0 mm mesh sieve and cores through stacked 1.0 mm and 0.5 mm mesh sieves. In 2010-2012, one small core (4.7 cm diameter, 10 cm deep, surface area = 18.09 cm2) was collected at each Tidal Flats site and filtered through stacked 1.0 mm and 0.5 mm mesh sieves. Invertebrate samples were stored in 95% ethanol.
We identified invertebrates to the lowest practicable taxonomic level and counted individuals. We determined wet weight biomass of invertebrates in Tidal Flats samples by collectively weighing individuals grouped by phylum (Annelida, Arthropoda, Mollusca, and Other) (Puget Sound Water Quality Authority, 1987). We calculated mean body weight per phylum for each sample as biomass divided by number of individuals weighed. Biomass and body weights were converted from wet to dry weights using the conversion factors in Brey et al. (2010) (Supplementary Table S1). For invertebrates in Marsh samples, we determined dry weight biomass from taxon-specific mean dry body weights from the literature when suitable values were available, or from our phylum-level biomass measurements made in nearby Tidal Flats habitats when they were not which was the case for Annelida, Mollusca, and Other (Supplementary Table S2). For annelids, large sample sizes and consistent spatial patterns of annelid species composition allowed assigning Inner Flats East body weights to the Reference and Restored marsh samples, and Inner Flats West weights to the Restored Refuge. For Mollusca and Other, Inner Flats East and Inner Flats West body weights were pooled and assigned to all three Marsh habitats (Supplementary Table S2).
Counts and biomass for each sample were standardized by unit area (m2) based on sample surface area, and those for samples filtered through stacked sieves were summed over the 1.0 mm and 0.5 mm size fractions before analysis. Because Van Veen grabs were only sieved through 1.0 mm mesh, they were analyzed separately along with the 1.0 mm size fraction of 2009 Marsh cores and 2010 Marsh and Tidal Flats cores.
2.3.2 Environment
We collected environmental samples concurrently with invertebrate samples. At Marsh sites, sediment was collected using a medium-sized core and analyzed for percent organic matter (percent weight loss on ignition); pH (rehydrated and tested with a pH meter); and soil texture (percent sand, silt, and clay following USDA particle size classifications) (A & L Western Agricultural Laboratories, Modesto, CA, USA). Water temperature, salinity, and dissolved oxygen were measured using a handheld YSI Model 85 multi-meter (Yellow Springs Instruments, Yellow Springs, OH, USA).
At Tidal Flats sites, we collected sediment samples but not water quality data. In 2009, sediment was sub-sampled from Van Veen grabs. In 2010-2012, a small sediment core was collected. Samples were analyzed for grain size and total organic carbon. Particles with diameters >2 mm were separated by dry-sieving. Sand and fine particles (0.063 to 2 mm and <0.063 mm, respectively) were separated by wet sieving and quantified by laser particle diffraction counting (Beckman Coulter Life Sciences, Indianapolis, IN, USA). Total carbon (TC) and total inorganic carbon (TIC) were determined coulometrically (UIC, Inc., Joliet, IL, USA). Total organic carbon was calculated as the difference between TC and TIC.
We derived the bed elevation at each Marsh and Tidal Flats site from a bare earth digital elevation model (DEM) developed from topobathymetric lidar data collected in 2011 and referenced to NAVD88 (Ellings et al., 2016). Horizontal and vertical resolution of the DEM was 2 cm in unvegetated areas.
2.4 Analyses
2.4.1 Invertebrate diversity
We used the Simpson Diversity Index to characterize invertebrate diversity because it is not sensitive to differences in sampling effort and therefore is comparable between samples from cores differing in area (Clarke et al., 2014). We used species accumulation curves to compare species richness among habitats that differed in the number of sites sampled (Clarke et al., 2014). We classified species into feeding guilds (Macdonald et al., 2010, 2012) to characterize trophic composition of invertebrate communities. All data used in analyses are publicly available (Rubin et al., 2024).
2.4.2 Spatial and temporal variation in environment or invertebrates
We used linear mixed effects models (LMM) to evaluate differences in environmental variables (e.g., percent organic matter, salinity) or univariate invertebrate metrics (e.g., diversity, total density) among habitats and years (Pinheiro et al., 2019). Predictors were Habitat (fixed), Year (fixed, continuous), their interaction, and Site nested within Habitat (random). The predictor Year tested for linear change (increase or decrease) over the four-year study period. The Habitat*Year interaction tested for differences in slope of change among habitats. Site was dropped if it did not improve model fit according to the Akaike Information Criterion (AIC) (Aho et al., 2014). Plots of residuals against fitted values and each predictor were visually assessed for violations of normality, heterogeneity, and independence assumptions (Zuur et al., 2009). We obtained the mean (over years) and slope (change over years) for each habitat from the fitted model and tested for differences between each pair of means and also between each pair of slopes; P-values were adjusted for multiple comparisons using Tukey multiple comparisons tests (Lenth, 2020). Percent organic matter and invertebrate biomass and body weight were log-transformed before conducting LMMs. We used a generalized linear mixed model to evaluate total invertebrate density (summed over taxa) (Bolker, 2020). Density was modeled as a count using the negative binomial distribution because it fit best among candidate distributions according to AIC. We used geometric means of invertebrate total density and biomass in 2009 and 2012 in the Restored Refuge to evaluate overall change in that habitat during the study period.
We used a multivariate analysis to evaluate differences in sediment grain size distributions among habitats and years (Clarke and Gorley, 2015). For each sample, percentages in each grain size class were cumulated (e.g., if gravel = 10%, sand = 40%, silt = 30%, and clay = 20%, then when cumulated there was 10% gravel, 50% sand, 80% silt, and 100% clay). The resulting data matrix (cumulative percentages of gravel, sand, silt, and clay in columns and samples in rows) was then used to create a resemblance matrix of Euclidian distances between samples, and a multivariate analysis of variance was performed using PERMANOVA (Anderson et al., 2008). Predictors were the same as in univariate LMMs. P-values of multiple paired comparisons were adjusted with the Dunn-Sidak method (Sokal and Rohlf, 1995).
Multivariate analyses of invertebrate community structure were always performed on resemblance matrices of Bray-Curtis similarities between samples (Clarke and Gorley, 2015; Oksanen et al., 2019). Before computing similarities, densities were square-root transformed to reduce the influence of abundant species on results (Clarke et al., 2014).
We used one-way Analysis of Similarities (ANOSIM) to evaluate differences in multivariate invertebrate community structure among habitats and years (Clarke and Gorley, 2015). We conducted separate analyses for community differences among habitats within each year, and community differences among years within each habitat, and we tested for differences between each pair of habitats (or years); P-values were adjusted for multiple comparisons by the Dunn-Sidak method. We used the ANOSIM R statistic as a measure of community similarity among habitats (or years) where R ranges from -1 to 1 with 0 indicating no similarity among groups and 1 indicating maximum similarity (Clarke et al., 2014).
We explored variation in environmental variables or multivariate invertebrate community structure among sites and years with ordination. Environmental variation was visualized by plotting sample (site-year) scores and variable vectors from principal components analysis (PCA) (Clarke and Gorley, 2015). Invertebrate community variation was visualized by plotting sample and species scores from non-metric multidimensional scaling (NMDS) analyses (Oksanen et al., 2019). Species scores are weighted averages of the sample scores where the weights are the abundance (i.e., square root-transformed density) of each species at each site. In the Restored Refuge, sites close to the dike line changed differently across years than sites far from it or in between. To visualize this difference, we computed distances among centroids for sites grouped by position and year (Anderson et al., 2008), and then conducted an NMDS using the resulting matrix of distances.
2.4.3 Associations between invertebrates and environment
We used correlation and regression approaches to evaluate associations between invertebrate and environmental metrics. Separate analyses were conducted for Marsh and Tidal Flats samples when the set of environmental variables differed between those two strata. Sediment grain size was comparable between the strata but sediment organic content was not (organic matter versus organic carbon), and sediment pH and water column measurements were only available for the Marsh, not the Tidal Flats. Data used in analyses were invertebrate and environmental metrics for each sample (site-year); habitat and year were not specified in analyses. We used Spearman rank correlation to evaluate associations between density of individual invertebrate species or univariate metrics of total invertebrates (density, biomass, body weight, or Simpson diversity) and each environmental variable. Percent silt was not included as an environmental variable here or in the regressions described below because of high inverse correlation with percent sand (r < -0.95).
We used distance-based Redundancy Analysis (dbRDA), which is akin to multivariate regression, to evaluate associations between multivariate invertebrate community structure and environmental predictors (Anderson et al., 2008; Oksanen et al., 2019). We chose dbRDA instead of Canonical Correspondence Analysis because preliminary analyses indicated that species abundances varied monotonically, not unimodally (Oksanen et al., 2019). We fit both single and multiple predictor models. For multiple predictor models, we used two different approaches to help separate temporal from spatial effects. First, Site was not included in models but all other environmental predictors were. Temporal effects of predictors could not be separated from spatial effects in the results. Second, Site was included in the models which meant that Site accounted for spatial variation and therefore other environmental predictors accounted primarily for temporal variation. Elevation was not included because Site accounted for elevation differences. Also, sites with only one year of environmental data were excluded because they did not contribute to assessment of temporal effects. Predictors retained in final multiple predictor models were required to be significant at the P<0.1 level. For each predictor, we report delta R2 values which indicate the increase in R2 obtained when the predictor is added to a model already containing all other predictors.
We visualized final multiple-predictor dbRDA models by plotting site and species scores (Oksanen et al., 2019) and predictor vectors (Anderson et al., 2008). Predictor vectors indicated direction and strength of the multiple partial correlation between each predictor and each dbRDA axis. The total number of dbRDA axes (we only plotted the first two axes) is equal to the number of predictors in the model. We report the percentage of fitted community variation and total community variation explained by axes 1 and 2. All axes combined explain 100% of fitted community variation (i.e., the variation explained by the model) and some percentage of total community variation (equal to the model R2 value).
2.4.4 Exponential population growth
In the Restored Refuge, density of several key invertebrate taxa increased more between 2011 and 2012 than between 2010 and 2011. This finding prompted us to test whether the density increases were consistent with exponential growth in population size and to estimate annual rates of increase in density. Data collected from each Restored Refuge site in 2010-2012 (n = 42 site-years) were used to fit exponential growth models: xt = x0ekt, where xt = density at time t, x0 = density at time 0, k = growth constant, ek = annual rate of increase in density, and t = year. Analyses were performed on ln(density + 100) (i.e., log-linear models were fit). We added 100 to each density, which was roughly equivalent to adding one individual to each sample (i.e., before expansion to number of individuals per m2), to preclude undefined results for zero densities. The statistical test we conducted was whether the annual rate of increase in density was significantly >1, where a rate of 1 indicates that density was increasing linearly, not exponentially.
3 Results
3.1 Environment
Elevation of sites ranged from -1.6 m to 2.8 m and was on average lowest in the Outer Flats and highest in the Restored Marsh (Figure 2). Sediment grain size was notably coarser on the Outer Flats (>80% sand; Figure 3C) than in the other five habitats (40-65% sand; P<0.05; Figures 3A, B, D–F). After dike removal, sediments appeared to coarsen more in the Restored Refuge (Figure 3F) and Inner Flats West (Figure 3B) than in the other habitats, even though change in grain size across years did not differ significantly among habitats (P=0.2).
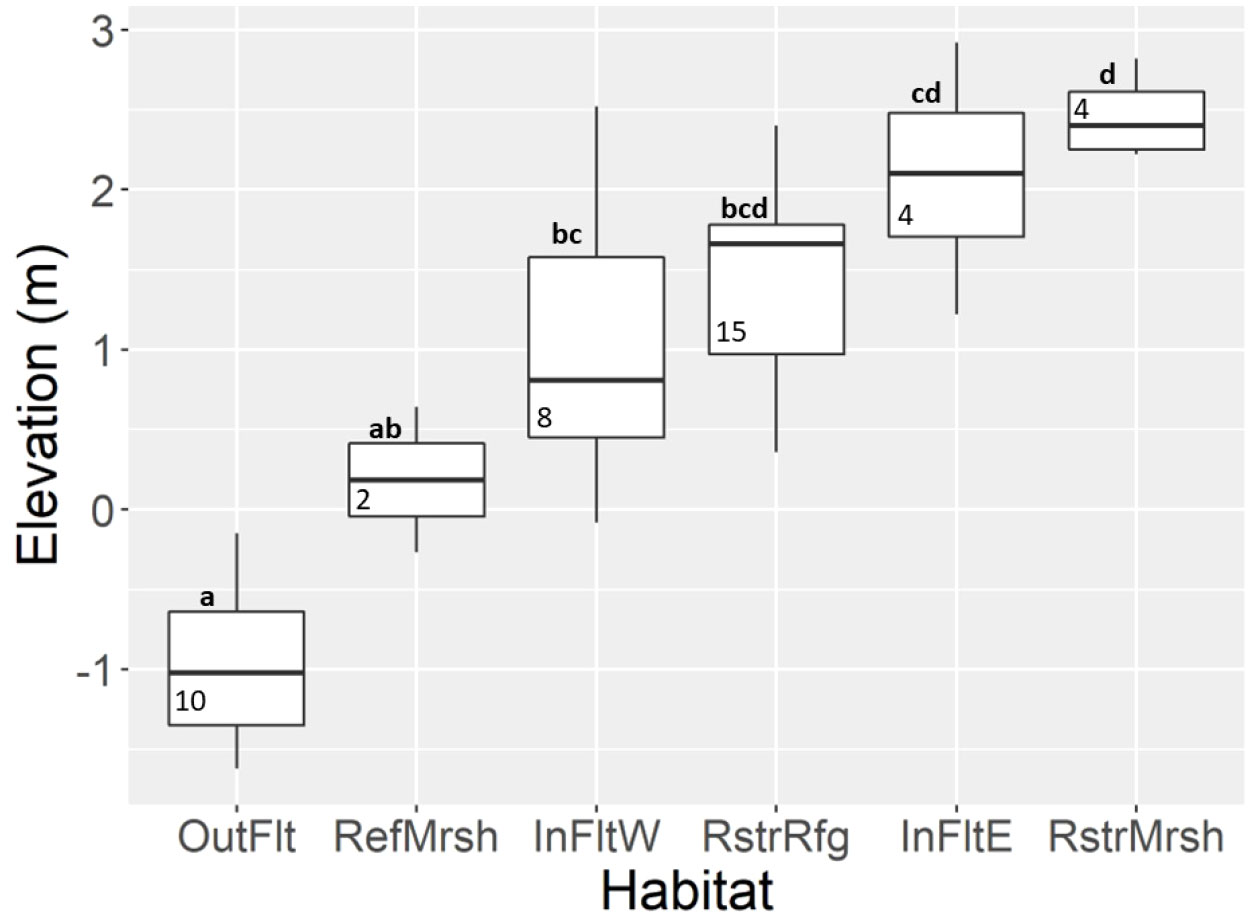
Figure 2 Box plots of bed elevation by habitat. The midline shows the median and the hinges the first and third quartiles; whiskers extend to the largest (or smallest) value no farther than 1.5 times the interquartile range from the hinge which included all values (there were no outliers). Boxes without a letter in common differ (P < 0.05). Numbers in boxes indicate sample size (number of sites). Elevation is referenced to NAVD88. InFltE, Inner Flats East; InFltW, Inner Flats West; OutFlt, Outer Flats; RefMrsh, Reference Marsh; RstrMrsh, Restored Marsh; RstrRfg, Restored Refuge.
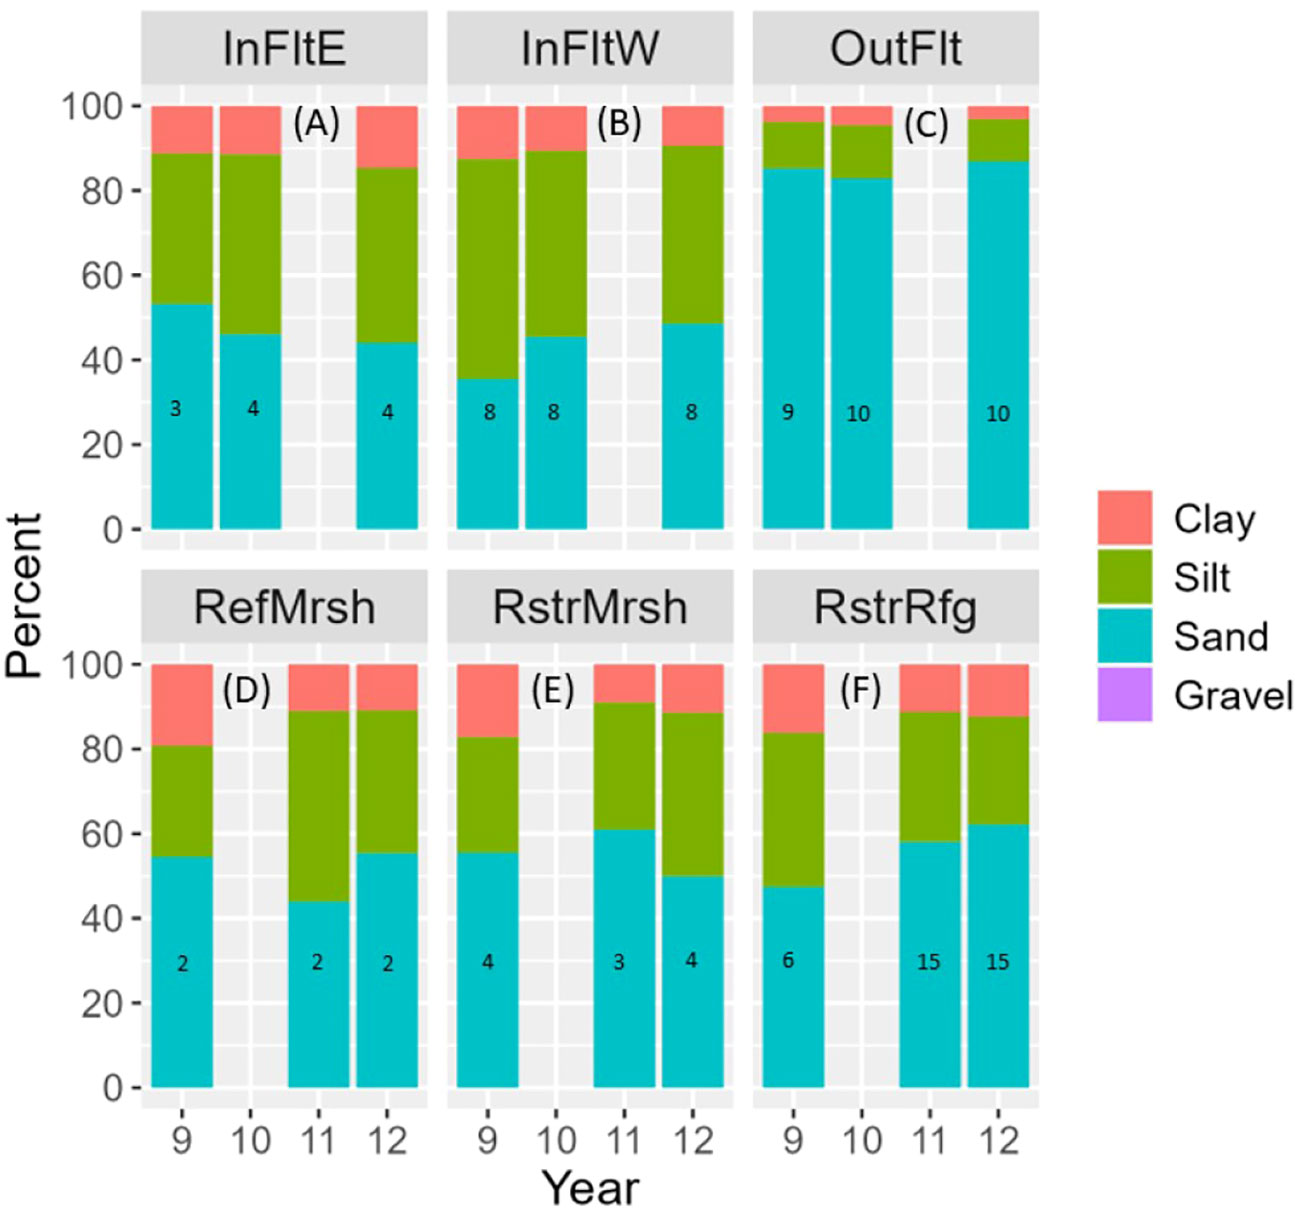
Figure 3 Mean sediment grain size composition by habitat (A–F) and year. Trace amounts (< 0.1%) of gravel were present at some InFltW and OutFlt sites, not enough to be visible on the plots. Numbers in bars indicate sample size (number of sites). Results are not shown for Tidal Flats habitats in 2011 or Marsh habitats in 2010 because data are missing for too many sites. InFltE, Inner Flats East; InFltW, Inner Flats West; OutFlt, Outer Flats; RefMrsh, Reference Marsh; RstrMrsh, Restored Marsh; RstrRfg, Restored Refuge.
In the Marsh, sediment percent organic matter (OM) was roughly 30% in the Restored Refuge before dike removal and then decreased to <10% by 2012, whereas OM was consistently low (<=5%) across years in the Restored and Reference marshes (Figures 4A–C). In contrast, sediment pH changed from slightly to moderately acidic between 2009 and 2012 in Restored and Reference marshes but remained moderately acidic across all four years in the Restored Refuge (Figures 4D–F). Salinity increased from 5 ppt in 2009 to 15 ppt in 2010-2012 in the Restored Refuge, as would be expected from the return of tidal influence, but unexpectedly it decreased from 20 ppt in 2009 to 5-10 ppt in 2012 in the Restored and Reference marshes (Figures 4J–L). Temperature changed little across years but was higher in the Restored Marsh than in the Reference Marsh or Restored Refuge (Figures 4M–O). Dissolved oxygen was 5-10 mg·l-1 in all habitats and years except for being lower (1-4 mg·l-1) in the Restored Refuge in 2009 (Figures 4G–I).
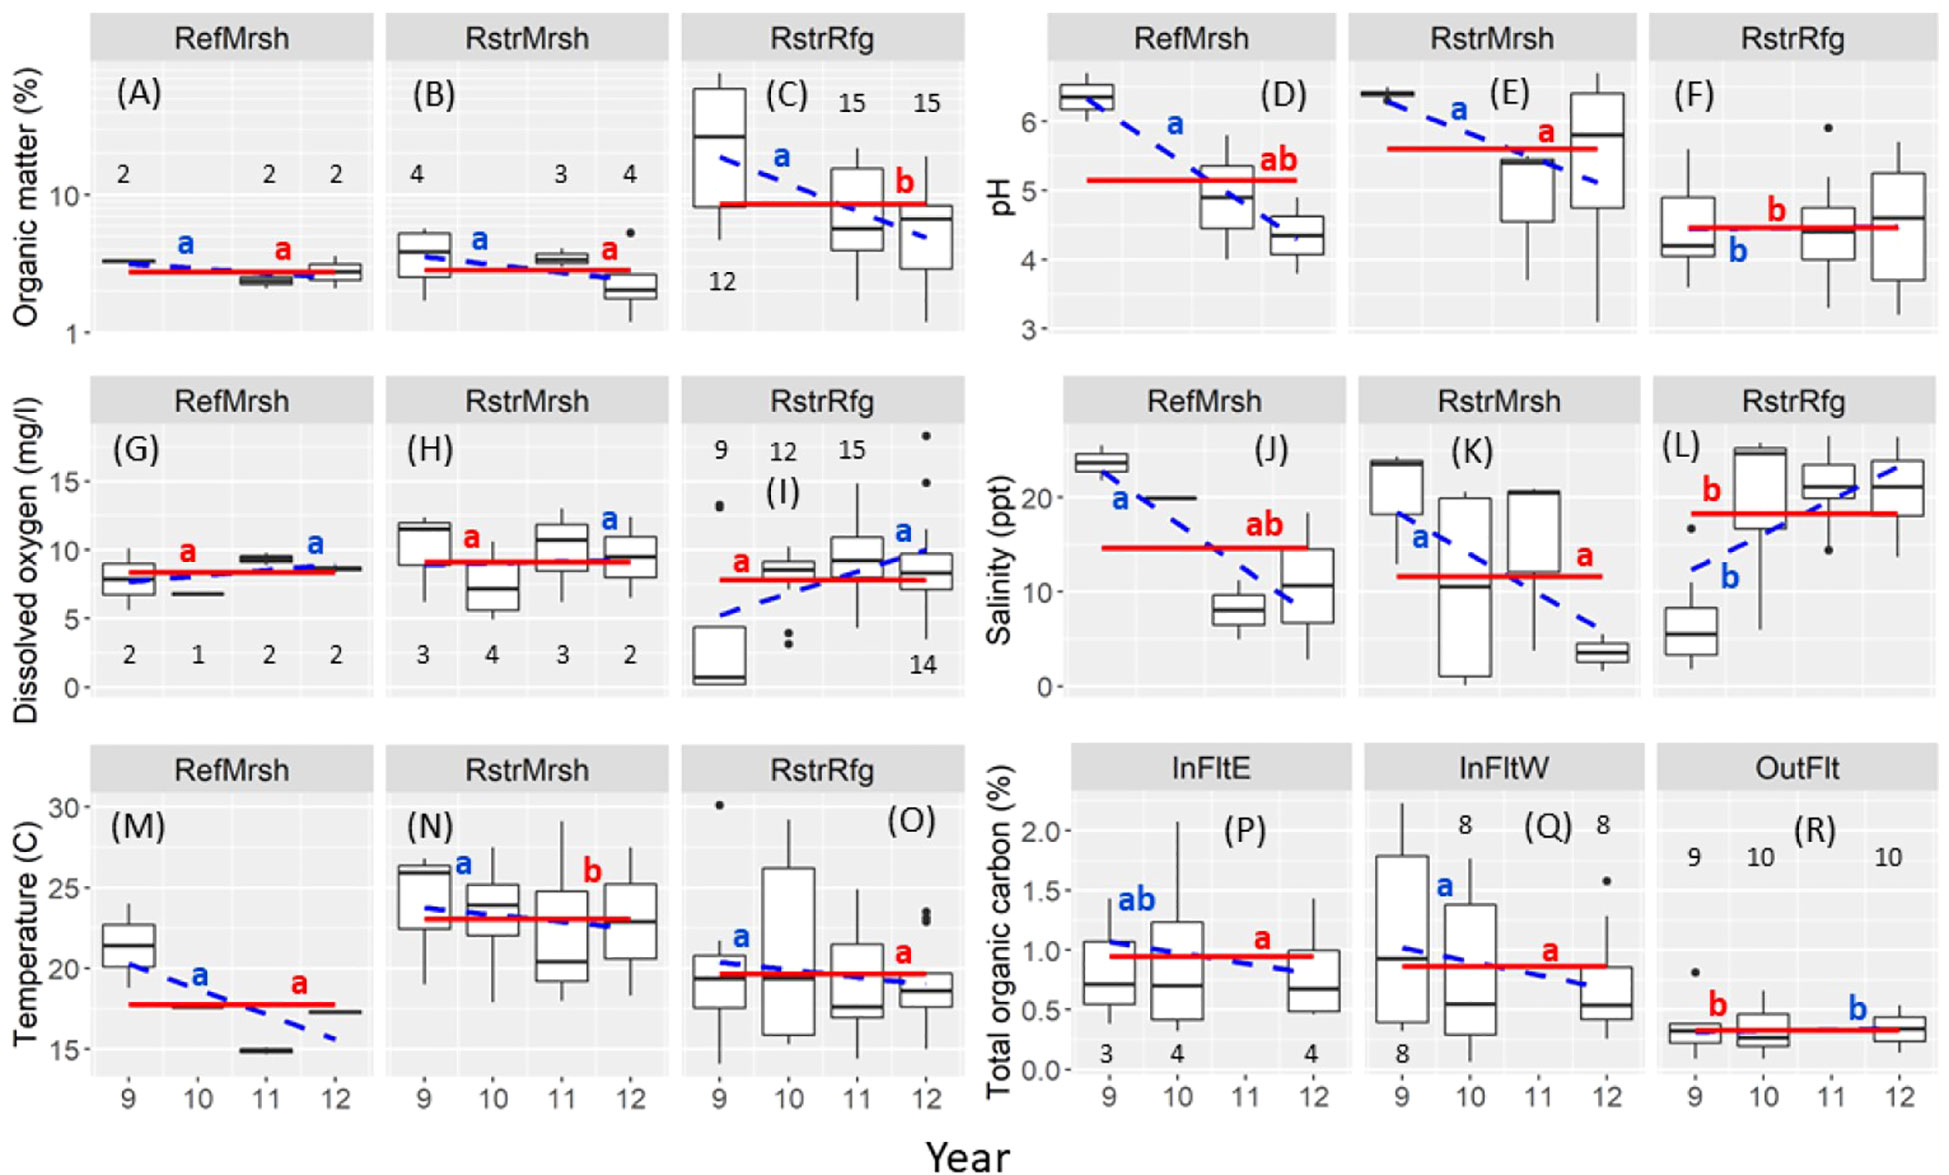
Figure 4 Box plots of environmental variables by habitat (A–C, D–F, G–I, J–L, M–O, P–R) and year. The midline shows the median and the hinges the first and third quartiles; whiskers extend to the largest (or smallest) value no farther than 1.5 times the interquartile range. Solid red lines: habitat mean (i.e., averaged over years); means without a red letter in common differ (P < 0.05). Dashed blue lines: slope of the relation between the environmental variable and year; slopes without a blue letter in common differ (P < 0.05). Black numbers over or under boxes indicate sample size (number of sites); sample sizes are equal between organic matter and pH, and among dissolved oxygen, salinity, and temperature. Results are not shown for organic matter or pH in 2010, or total organic carbon in 2011 because data are missing for too many sites. InFltE, Inner Flats East; InFltW, Inner Flats West; OutFlt, Outer Flats; RefMrsh, Reference Marsh; RstrMrsh, Restored Marsh; RstrRfg, Restored Refuge.
In the Tidal Flats, total organic carbon (TOC) in the Outer Flats was less than half that in the Inner Flats East or Inner Flats West (Figures 4P–R). TOC decreased after dike removal within Inner Flats West habitat concurrently with apparent sediment coarsening there (Figure 3B). Sediment coarsening and decreased TOC were particularly evident at the three southwest-most Inner Flats West sites (F1, F2, and F3; Supplementary Figure S1).
Some environmental variables strongly covaried, especially those related to sediment grain size (Supplementary Table S3). Percent sand and silt were strongly inversely correlated in both the Marsh and Tidal Flats (r < -0.95); correlations between percent sand or silt and percent clay were weaker (|r| < 0.90). TOC was correlated with percent clay in the Tidal Flats (r = 0.88).
3.2 Invertebrate community
Our samples included 11 phyla and at least 153 species of invertebrates (Supplementary Table S5). To be consistent across Marsh and Tidal Flats data sets, we grouped them into 33 taxa (Supplementary Table S6) for all analyses except when analyzing Tidal Flats species richness or qualitatively assessing fine-scale species composition within broader taxonomic groups.
3.2.1 Spatial and temporal community variation
The invertebrate community differed significantly among habitats in each year (Table 1, overall comparisons), although among-habitat differences decreased after dike removal (as indicated by decreased ANOSIM R values). Community differences among years were present in the Restored Refuge, Restored Marsh, and possibly the Reference Marsh as well based on the relatively high ANOSIM R value, but not in Tidal Flats habitats (Table 2, overall comparisons).
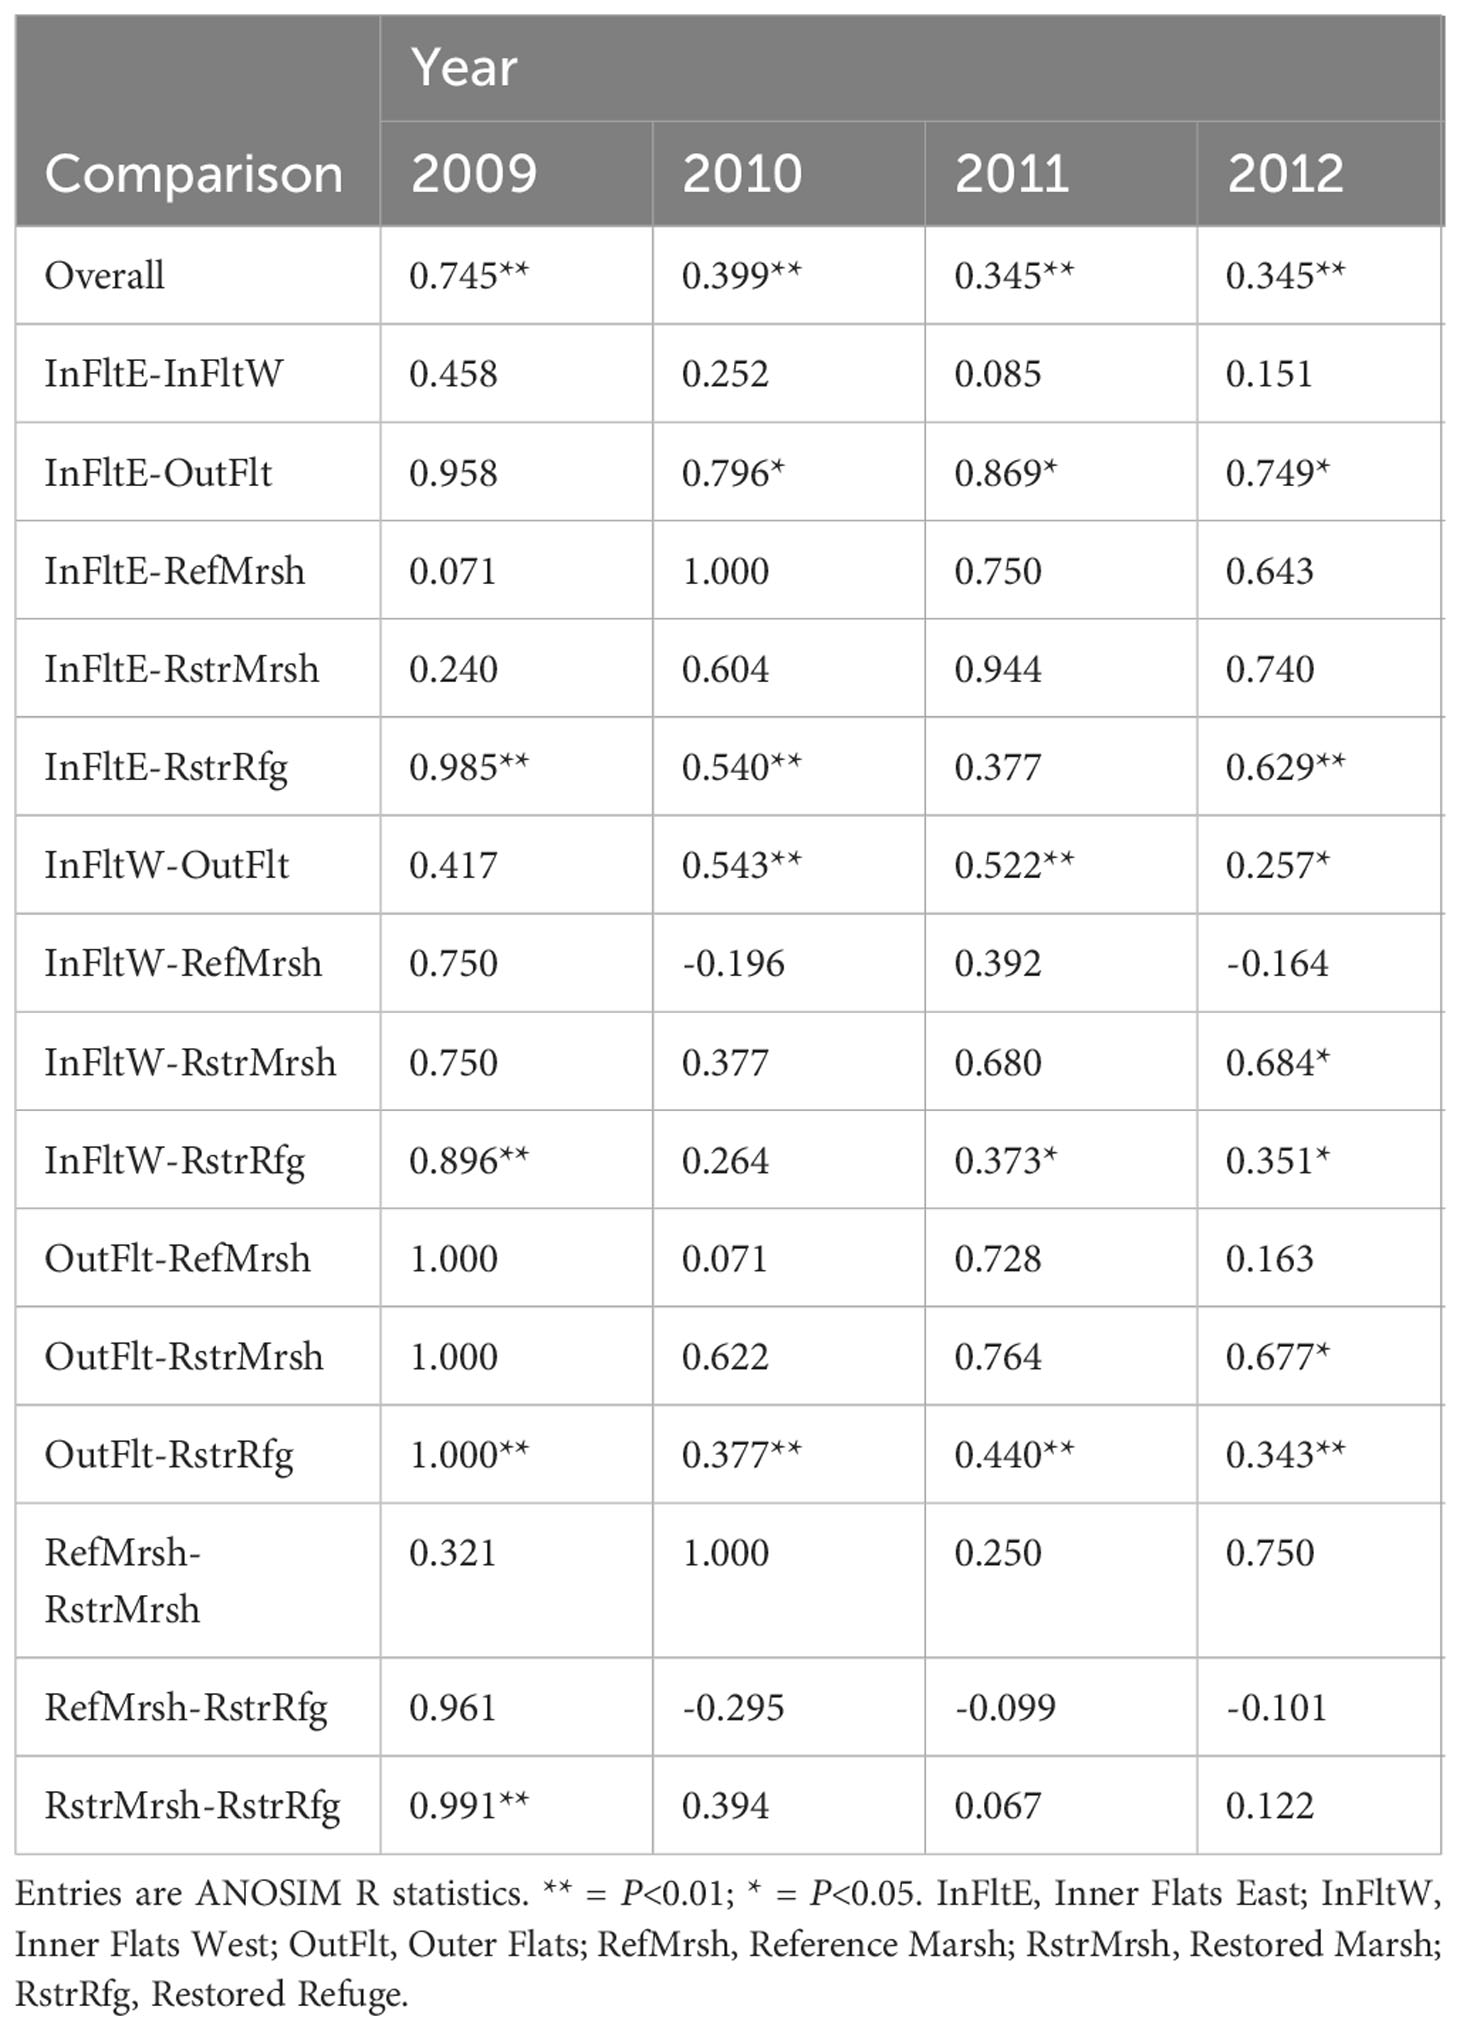
Table 1 Invertebrate community differences among habitats within years.
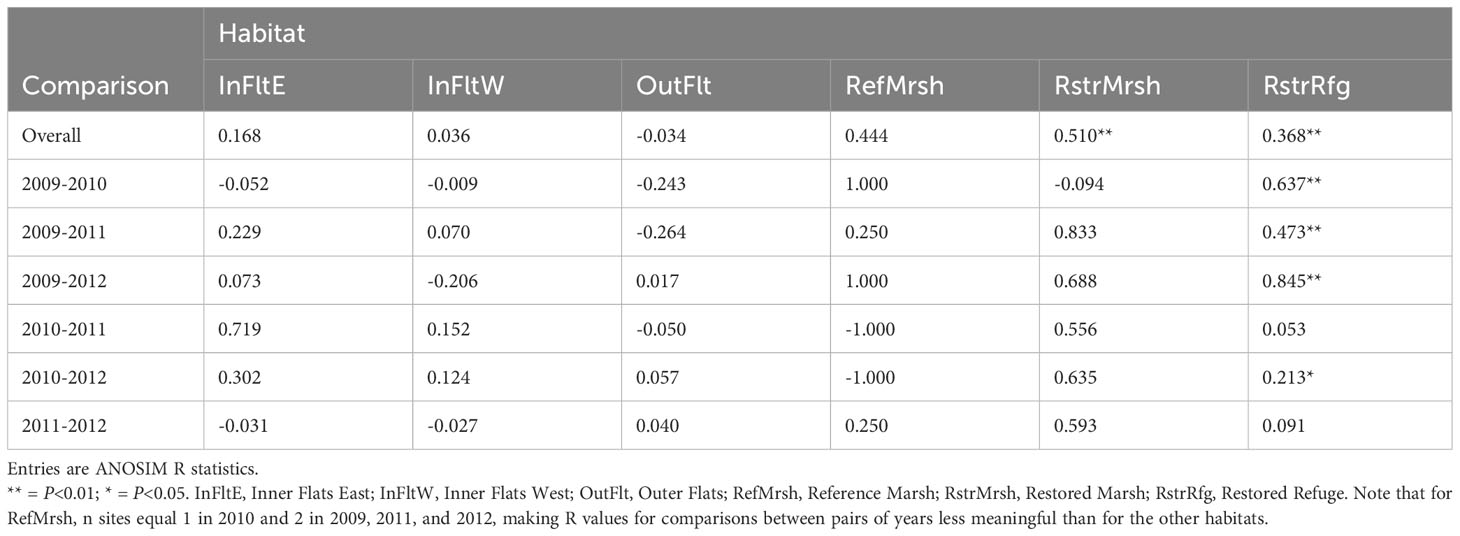
Table 2 Invertebrate community differences among years within habitats.
Invertebrate community differences between the Restored Refuge and the other habitats were substantial before dike removal but decreased in later years (Table 1; Figures 5A–D). Within the Restored Refuge, the community changed more from before to after dike removal than during the years following dike removal (Table 2; Figure 6D). Restored and Reference Marsh communities changed differently from the Restored Refuge community in terms of the magnitude and timing of shifts (Table 2; Figures 6B, C), but Restored and Reference Marsh communities both became increasingly similar to the Restored Refuge community through 2012 (Table 1; Figures 5A–D).
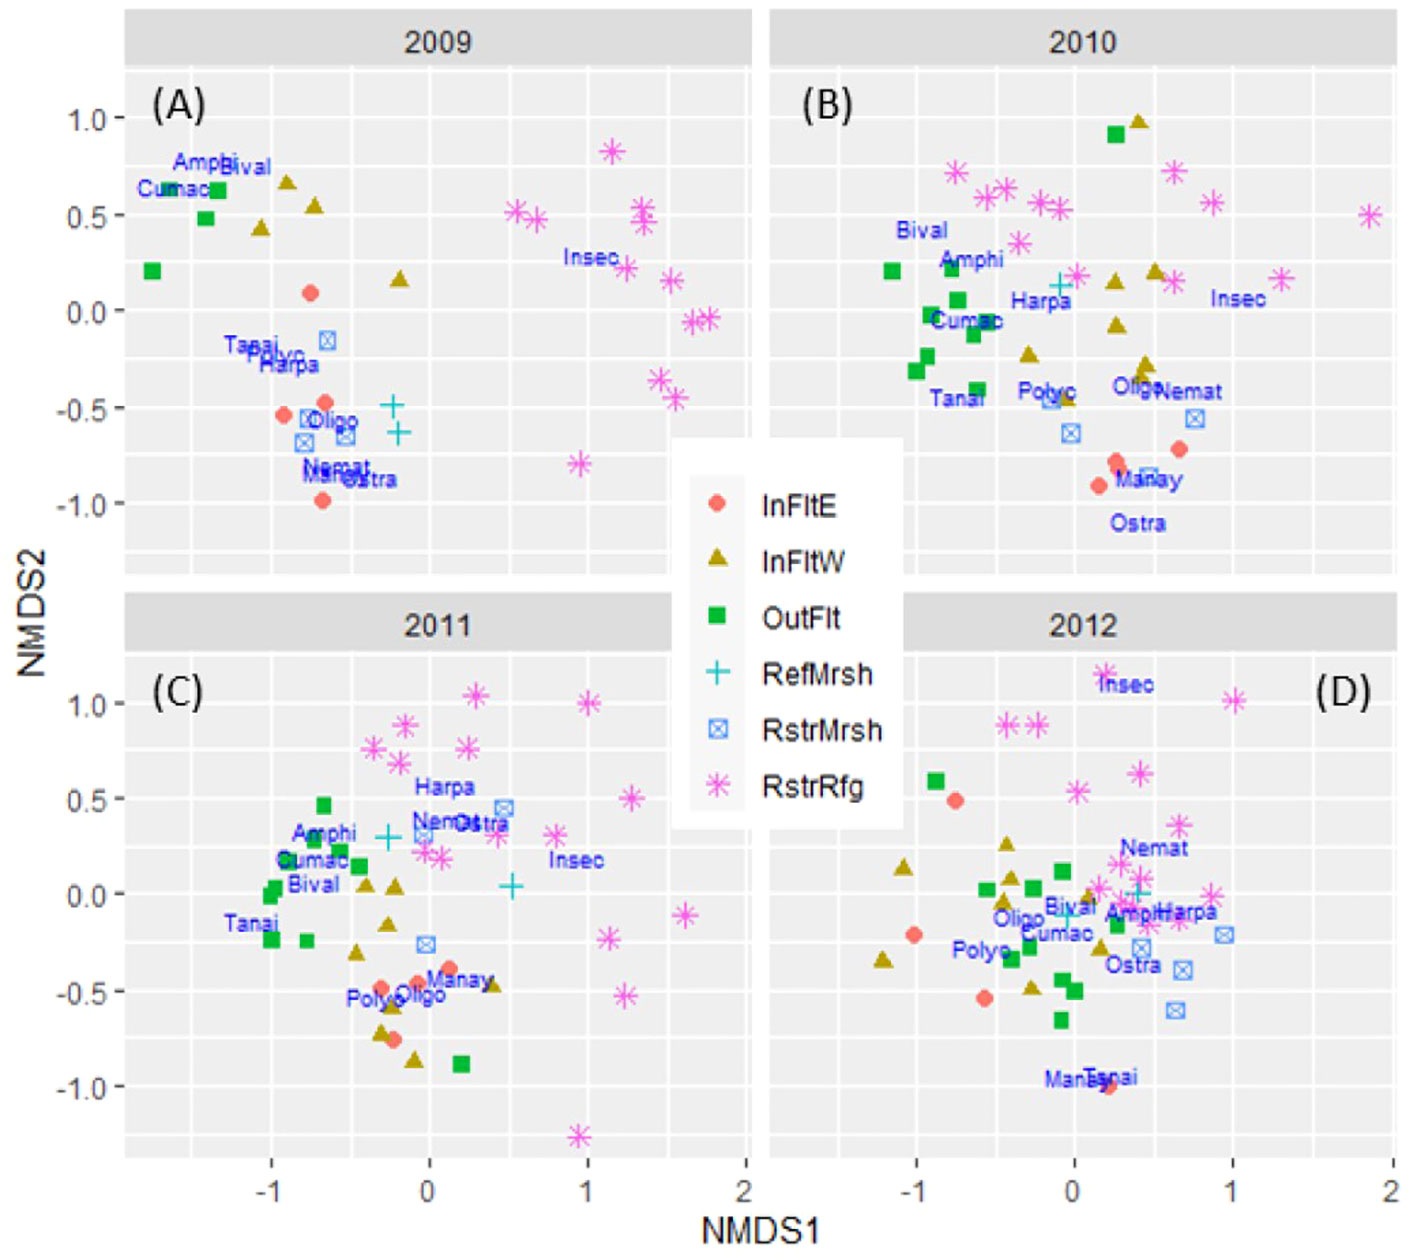
Figure 5 Non-metric multidimensional scaling (NMDS) ordination of invertebrate community similarity among sites by year (A–D). Driver taxon scores are shown in dark blue text: Amphi, Amphipoda; Bival, Bivalvia; Cumac, Cumacea; Harpa, Harpacticoida; Insec, Insecta; Manay, Manayunkia aestaurina; Nemat, Nematoda; Oligo, Oligochaeta; Ostra, Ostracoda; Polyc, Polychaeta Other (other than Manay); Tanai, Tanaidacea; InFltE, Inner Flats East; InFltW, Inner Flats West; OutFlt, Outer Flats; RefMrsh, Reference Marsh; RstrMrsh, Restored Marsh; RstrRfg, Restored Refuge.
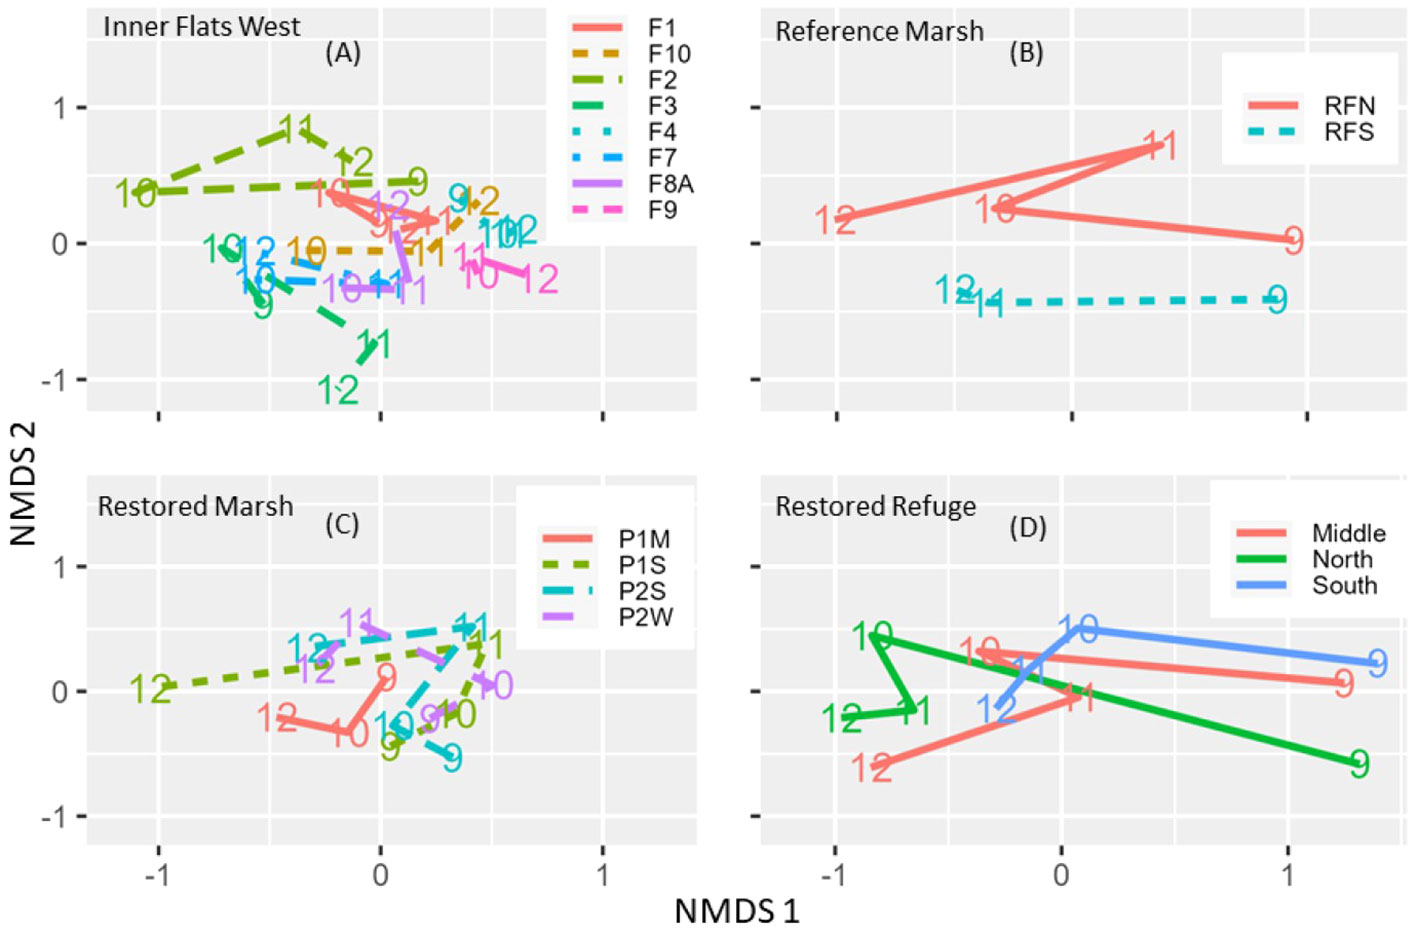
Figure 6 Non-metric multidimensional scaling (NMDS) ordinations of invertebrate community similarity among site-years (A–C) or among site position-by-year combinations where site position indicates the position of the site along a tidal channel (North=close to the dike line, South=far from the dike line, Middle= between North and South) (D). (A–C) Ordinations are based on matrixes of resemblances among site-years; lines are color- and type-coded by site and connect years, and site names are indicated in the legend. (D) The ordination is based on a matrix of distances among centroids of site position-by-year combinations; lines are color coded by site position and connect years.
Invertebrate community differences between the Outer Flats and the rest of the habitats were pronounced before and after dike removal (Table 1; Figures 5A–D). The Outer Flats community differed significantly from Inner Flats East and Inner Flats West communities in 2010-2012 (Table 1), and in 2009 for samples sieved through 1 mm mesh only and therefore available for all sites, not just the subset with samples sieved through stacked 1 mm and 0.5 mm mesh (Supplementary Table S7; Supplementary Figure S2). Community differences between Inner Flats East and Inner Flats West were not significant (Table 1; Supplementary Table S7), even though separation on NMDS plots suggested some level of community difference, especially in 2009-2010 (Figures 5A, B; Supplementary Figure S2).
The degree of invertebrate community change depended on a site’s position relative to the dike line. In the Restored Refuge, sites farthest from the dike line (South sites) changed less after dike removal than sites closer to it (Middle and North sites; Figure 6D). In the Inner Flats West, sites F1, F2, and F3 just offshore from the dike line changed circularly (Figure 6A; most pronounced for F2), initially away from the original community in 2010 and then back to it by 2012.
3.2.2 Driver taxa
Of the 33 taxa we used in analyses, 11 – Amphipoda, Bivalvia, Cumacea, Harpacticoida, Insecta, Manayunkia aestuarina (henceforth referred to as Manayunkia), Nematoda, Oligochaeta, Ostracoda, Polychaeta Other (polychaetes other than Manayunkia), and Tanaidacea – had mean density ≥ 673/m2, occurred in ≥ 30% of the samples (i.e., site-years), contributed ≥ 48% of the individuals in at least one sample, and collectively composed 98.7% of total individuals when all samples were pooled (Supplementary Table S6). Spatial and temporal differences in invertebrate communities were primarily driven by these 11 taxa.
Before dike removal, the Restored Refuge had the highest density of Insecta among habitats but lacked 7 of the other 10 driver taxa (Figure 7). After dike removal those 7 taxa (Amphipoda, Cumacea, Harpacticoida, Manayunkia, Nematoda, Polychaeta Other, and Tanaidacea) colonized the Restored Refuge and all but Manayunkia reached their highest density in 2012 (Figure 7). Densities of Bivalvia and Ostracoda in the Restored Refuge were also highest in 2012 (Figures 7B, I). The convergence of invertebrate communities among the Restored Refuge, Restored Marsh, and Reference Marsh by 2012 (Table 1; Figures 5A–D) was driven in part by increases in Amphipoda and Harpacticoida in all three habitats (Figures 7A, D). The relationship of driver taxa to spatial and temporal variation in invertebrate communities is also indicated by the position of driver taxa on NMDS plots (Figures 5A–D).
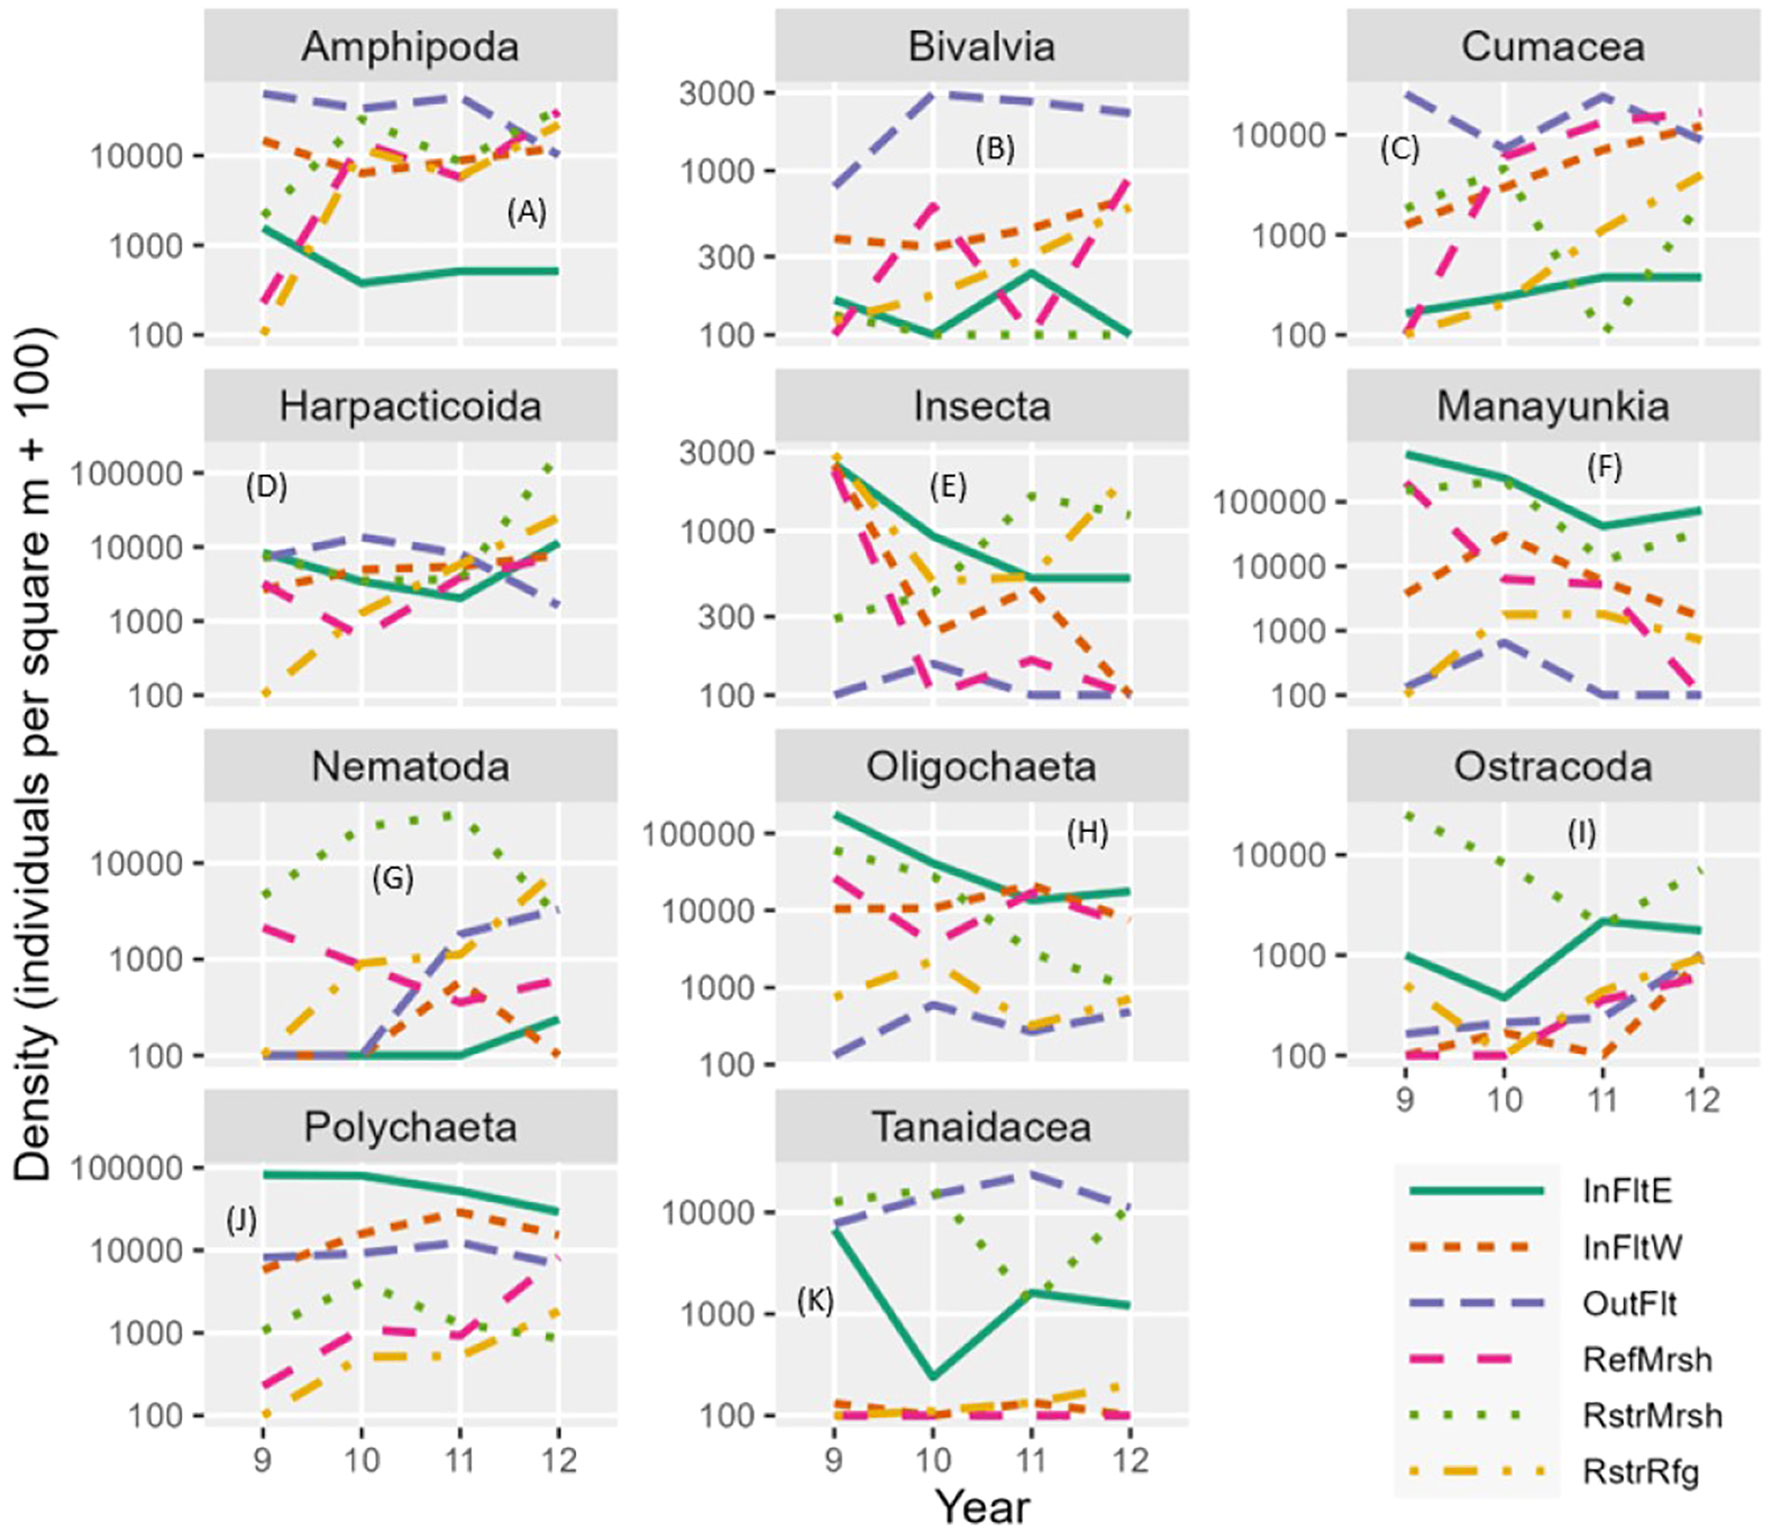
Figure 7 Mean invertebrate density by driver taxon (A–K), habitat, and year. Log scales are shown on the y-axes. Note that 100 was added to each mean density before plotting, so density = 100 means that original density = 0. Manayunkia, Manayunkia aestaurina; Polychaeta, Polychaeta Other (other than Manayunkia); InFltE, Inner Flats East; InFltW, Inner Flats West; OutFlt, Outer Flats; RefMrsh, Reference Marsh; RstrMrsh, Restored Marsh; RstrRfg, Restored Refuge.
In the Restored Refuge, density increased more between 2011 and 2012 than between 2010 and 2011 for all colonizing taxa except Manayunkia (Figure 7). Further, for three colonizing taxa, the increase in density from colonization in 2010 through 2012 significantly fit exponential population growth models (Supplementary Figure S3). The annual rate of increase in density was 2.5 for Cumacea, 3.9 for Harpacticoida, and 3.2 for Nematoda, indicating that annually, density more than doubled for Cumacea and more than tripled for Harpacticoida and Nematoda. Non-significant annual rates of density increases (P>0.05) were 1.5 for Amphipoda, 1.4 for Polychaeta Other, and 1.1 for Tanaidacea. Thus, for most colonizing taxa there was no evidence that rates of density increase were slowing down three years after dike removal.
Differences in community composition among habitats revealed broad spatial patterns (Figure 7). The Outer Flats had moderate to high densities of all driver taxa except Manayunkia, Oligochaeta, and Insecta. Crustaceans (Amphipoda, Harpacticoida, Tanaidacea, and Cumacea) were the most abundant high-level taxonomic group (phylum or class) on the Outer Flats. Inner Flats East had very high densities of annelids (Manayunkia, Oligochaeta, and Polychaeta Other). Inner Flats West had densities intermediate to those of Inner Flats East and Outer Flats for most taxa. The Restored Marsh had higher densities of Nematoda and Ostracoda than the other habitats.
Invertebrate identifications to levels of taxonomic resolution finer than the driver taxa were sometimes comparable between the Marsh and Tidal Flats data sets. They revealed dominant species and spatial or temporal shifts in species composition. On the Outer Flats, nearly all tanaids were from the family Leptocheliidae (species Chondrochelia savignyi) and 92% of the cumaceans were Cumella vulgaris. In contrast, in the Restored Marsh, tanaids were nearly all from the family Tanaididae (species primarily Sinelobus stanfordi) and cumaceans were mostly Nippoleucon hinumensis. Amphipod species composition also differed between the Outer Flats and Marsh habitats. Outer Flats amphipods were 79% Monocorophium sp. (M. acherusicum and M. insidiosum) but < 1% Americorophium sp. (A. salmonis), whereas in the Restored Marsh about 90% of the amphipods were from the family Corophiidae but Americorophium sp. were nearly as abundant as Monocorophium sp which were mostly M. insidiosum. Species of tanaids, cumaceans, and amphipods that colonized the Restored Refuge tended to be the same ones that were abundant in the Reference and Restored marshes. In the Restored Refuge, Insecta density was lower in 2010-2011 than in 2009, then high again in 2012 (Figure 7), but family composition shifted from Anthomyiidae, Ceratopogonidae, Hydrophilidae, Muscidae, Psychodidae, Sciomyzidae, and Tipulidae larvae in 2009 to Chironomidae and Dolichopodidae larvae in 2012. Polychaeta Other (i.e., polychaetes other than Manayunkia aestuarina) in the Inner Flats East were primarily Capitella capitata (39%), Pygospio elegans (52%), and Streblospio benedicti (5%). In contrast, Polychaeta Other in the Outer Flats was composed of C. capitata (6%), Rhynchospio glutaea (49%), and a variety of other species each accounting for no more than 4% of the total. Outer Flats bivalves were about half Kurtiella tumida and the other half primarily a mix of Clinocardium sp., Macoma balthica, M. nasuta, Macoploma yoldiformis, Mytilus sp., Parvilucina tenuisculpta, and Tellina modesta.
3.2.3 Diversity, abundance, biomass, body size, and feeding guilds
The Restored Refuge had the lowest mean diversity of invertebrates (averaged over years) among habitats but the greatest increase in diversity between 2009 and 2012 (Figure 8F). The Outer Flats had the highest mean diversity (Figure 8C). The Restored Refuge also had the lowest mean total density of invertebrates (summed over taxa) among habitats and the greatest increase in total density across years (Figure 8L). Density in the Restored Refuge increased 15-fold, from 2,500 m-2 in 2009 to 36,900 m-2 in 2012. The density increase in the Restored Refuge was greater between 2011 and 2012 than between 2009 and 2010 or 2010 and 2011, reflecting exponential growth by many of the driver taxa that contributed to total density (Supplementary Figure S3). The Restored Marsh had the highest mean total density (243,000 m-2; Figure 8K); Inner Flats East was a close second (229,000 m-2; Figure 8G).
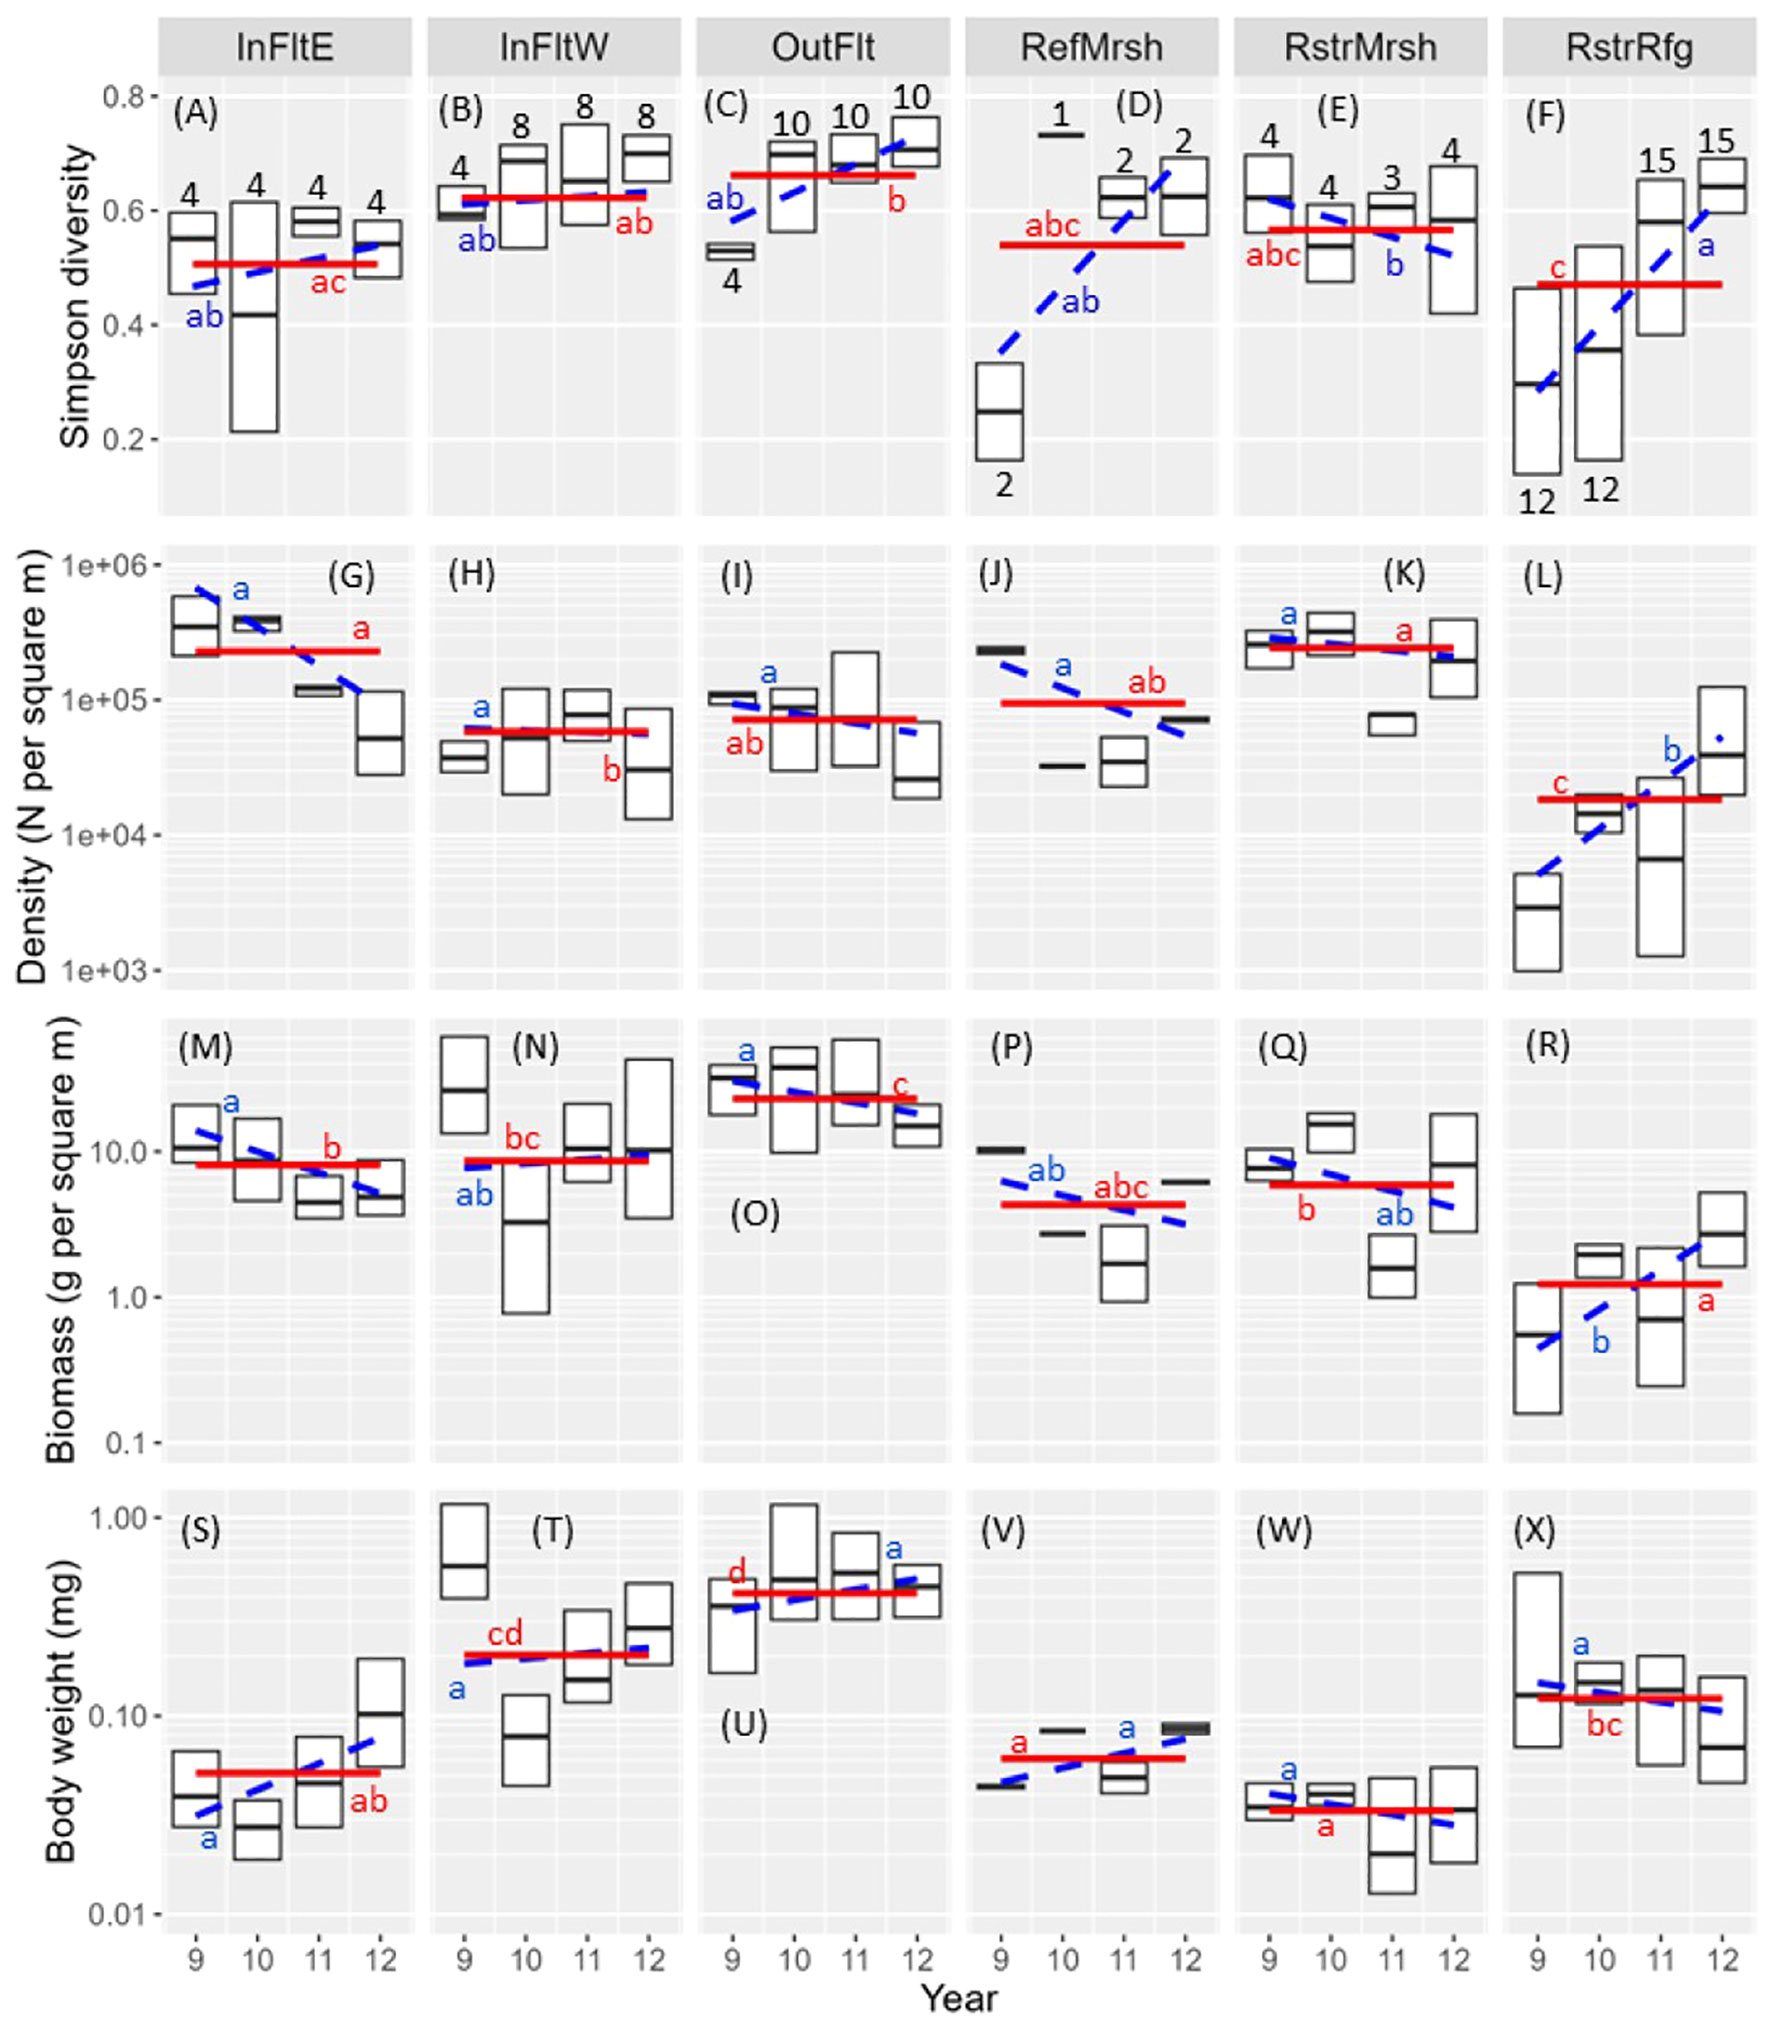
Figure 8 Box plots of invertebrate diversity (A–F), density (G–L), biomass (M-R), and body weight (S–X) by habitat and year. Biomass and body weights are dry weights. Boxes show upper and lower quartiles and medians; whiskers and outliers are not shown. Solid red lines: habitat mean (i.e., averaged over years); means without a red letter in common differ (P < 0.05). Dashed blue lines: slope of the relation between the invertebrate metric and year; slopes without a blue letter in common differ (P < 0.05). Black numbers over or under boxes indicate sample size (number of sites). InFltE, Inner Flats East; InFltW, Inner Flats West; OutFlt, Outer Flats; RefMrsh, Reference Marsh; RstrMrsh, Restored Marsh; RstrRfg, Restored Refuge.
Inner Flats East and the Restored Marsh had the two lowest mean invertebrate body weights among habitats (Figures 8S, W), and the Outer Flats had the highest (Figure 8U). This resulted in biomass ranking differently among habitats than did density: mean biomass was highest in the Outer Flats (23.1 g m-2; Figure 8O) but was third highest in Inner Flats East (8.1 g m-2; Figure 8M) and fourth highest in the Restored Marsh (5.9 g m-2; Figure 8Q). Median body weight was 22 times greater for Outer Flats annelids than for Inner Flats East annelids (Supplementary Table S8). Because annelid species composition differed markedly between the Outer Flats and Inner Flats East, the body weight difference owed to larger bodied species inhabiting the Outer Flats. Body weights were also greater for Outer Flats than for Inner Flats East Arthropoda, Mollusca, and Other invertebrates but the differences were less extreme.
Like for diversity and density, the Restored Refuge had the lowest mean biomass among habitats but the greatest increase in biomass across years (Figure 8R). Biomass in the Restored Refuge increased from 0.4 g m-2 in 2009 to 4.2 g m-2 in 2012, a 12-fold increase. Despite the large increases in biomass and density in the Restored Refuge, neither reached equivalency with the Restored Marsh or Reference Marsh by 2012. Biomass in the Restored Refuge in 2012 was roughly 75% of that in the Reference Marsh and 50% of that in the Restored Marsh (Figure 8P–R). Density in the Restored Refuge in 2012 was roughly 70% of that in the Reference Marsh and 25% of that in the Restored Marsh (Figures 8J–L). Unlike biomass and density, diversity in the Restored Refuge did reach equivalency with the Reference Marsh and Restored Marsh by 2012 (Figures 8D–F).
Resolution of invertebrate identifications in the original Tidal Flats dataset was high enough (142 unique taxa of which 105 were identified to species, 17 to genera, and 20 to broader taxonomic levels) to conduct an analysis of species richness. Further, based on the 33 taxa in the merged Marsh and Tidal Flats dataset, community structure and Simpson diversity were similar among years within each Tidal Flats habitat (Table 2; Figures 8A–C). We therefore used the original Tidal Flats data pooled over years to compare species richness among Tidal Flats habitats. The Outer Flats had the highest, Inner Flats East the lowest, and Inner Flats West an intermediate number of species overall (Figure 9A) and within Amphipoda (Figure 9B), Bivalvia (Figure 9C), and Polychaeta (Figure 9D), the three most speciose taxonomic groups.
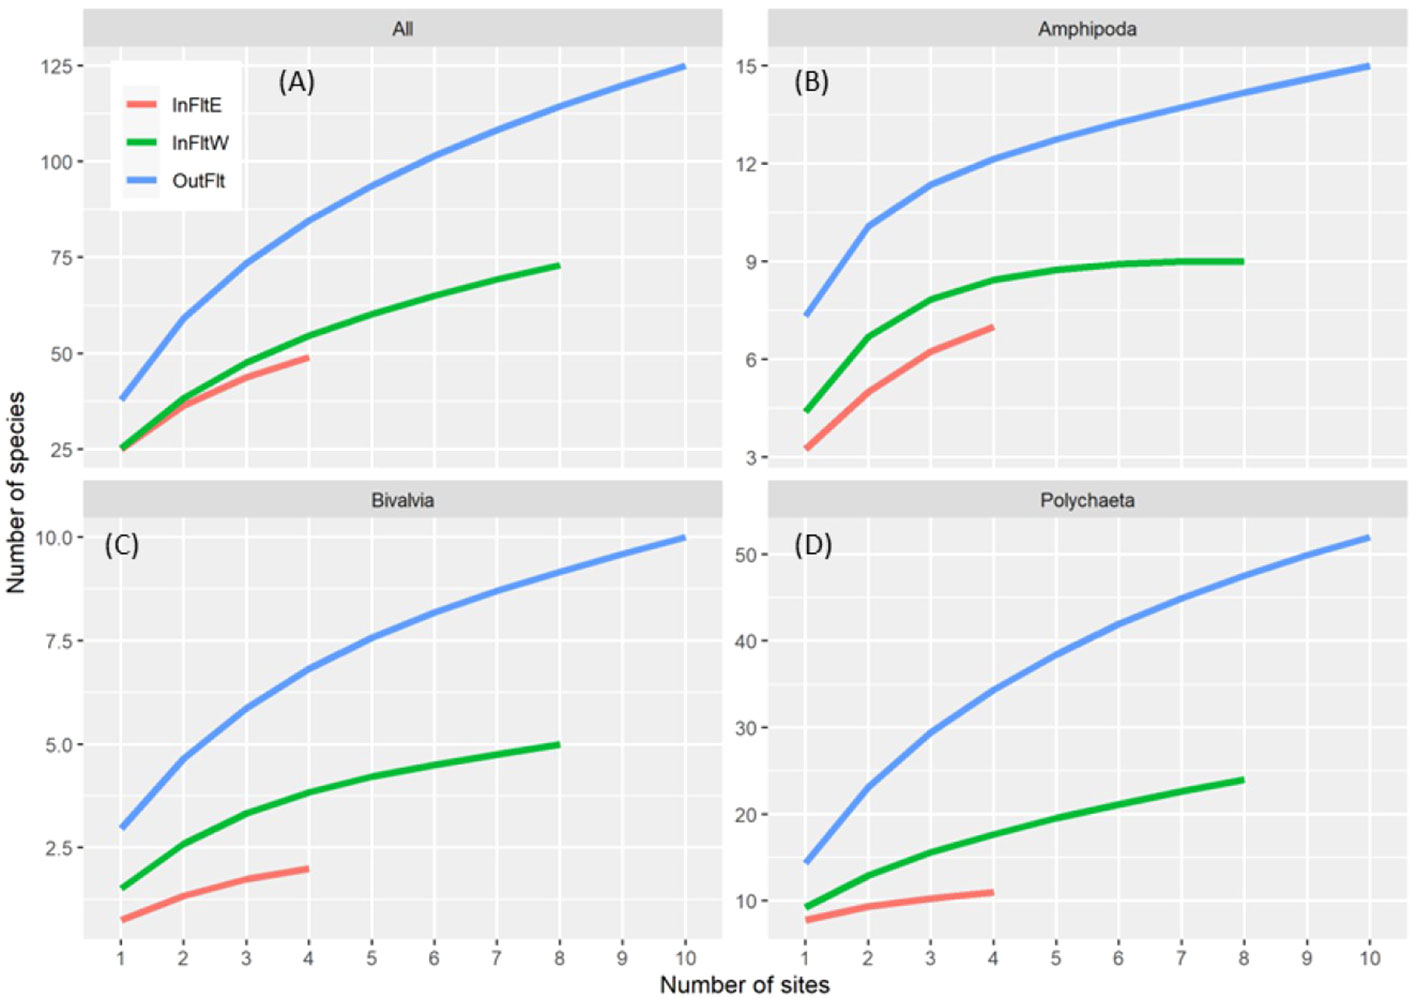
Figure 9 Species accumulation curves by Tidal Flats habitat for all species combined (A) and within Amphipoda (B), Bivalvia (C), and Polychaeta (D). InFltE, Inner Flats East; InFltW, Inner Flats West; OutFlt, Outer Flats.
High resolution of Tidal Flats identifications also allowed classification of species into feeding guilds. As for species richness, we pooled data over years. The guilds were (1) suspensivores, which feed exclusively from the water column; (2) surface deposit feeders, which collect and ingest particles from the sediment surface; (3) subsurface deposit feeders, which feed head-down in the sediments, ingesting particles from below the sediment surface; (4) herbivores, which feed exclusively on microalgae and macroalgae; (5) planktivorous carnivores, which feed on zooplankton; (6) benthic carnivores, which feed on meiofauna or macrofauna; (7) macro-omnivores, which feed on large particulate matter in a raptorial fashion; (8) facultative detritivores, which may feed as suspensivores, surface deposit feeders, or subsurface deposit feeders; and (9) facultative carnivores, which may feed as predators or scavengers on macrofauna or meiofauna, or as deposit feeders (Macdonald et al., 2012).
The percentage of total species in each feeding guild was remarkably similar among Flats habitats (Figure 10A). In all three habitats, the highest percentage of species occurred in the facultative detritivore guild and the next highest in the benthic carnivore guild. In all three habitats, the percentages of species in the facultative carnivore, subsurface deposit feeder, surface deposit feeder, and suspensivore guilds were moderate. Of the three guilds with the lowest percentages of species (herbivores, macro-omnivores, and planktivorous carnivores), the Outer Flats included all three, Inner Flats West lacked macro-omnivores, and Inner Flats East lacked macro-omnivores and herbivores. Because many more species occurred on the Outer Flats than in either Inner Flats habitat (Figure 9A), similarity among habitats in the percentage of total species in each guild meant that there were more species in each guild on the Outer than Inner Flats.
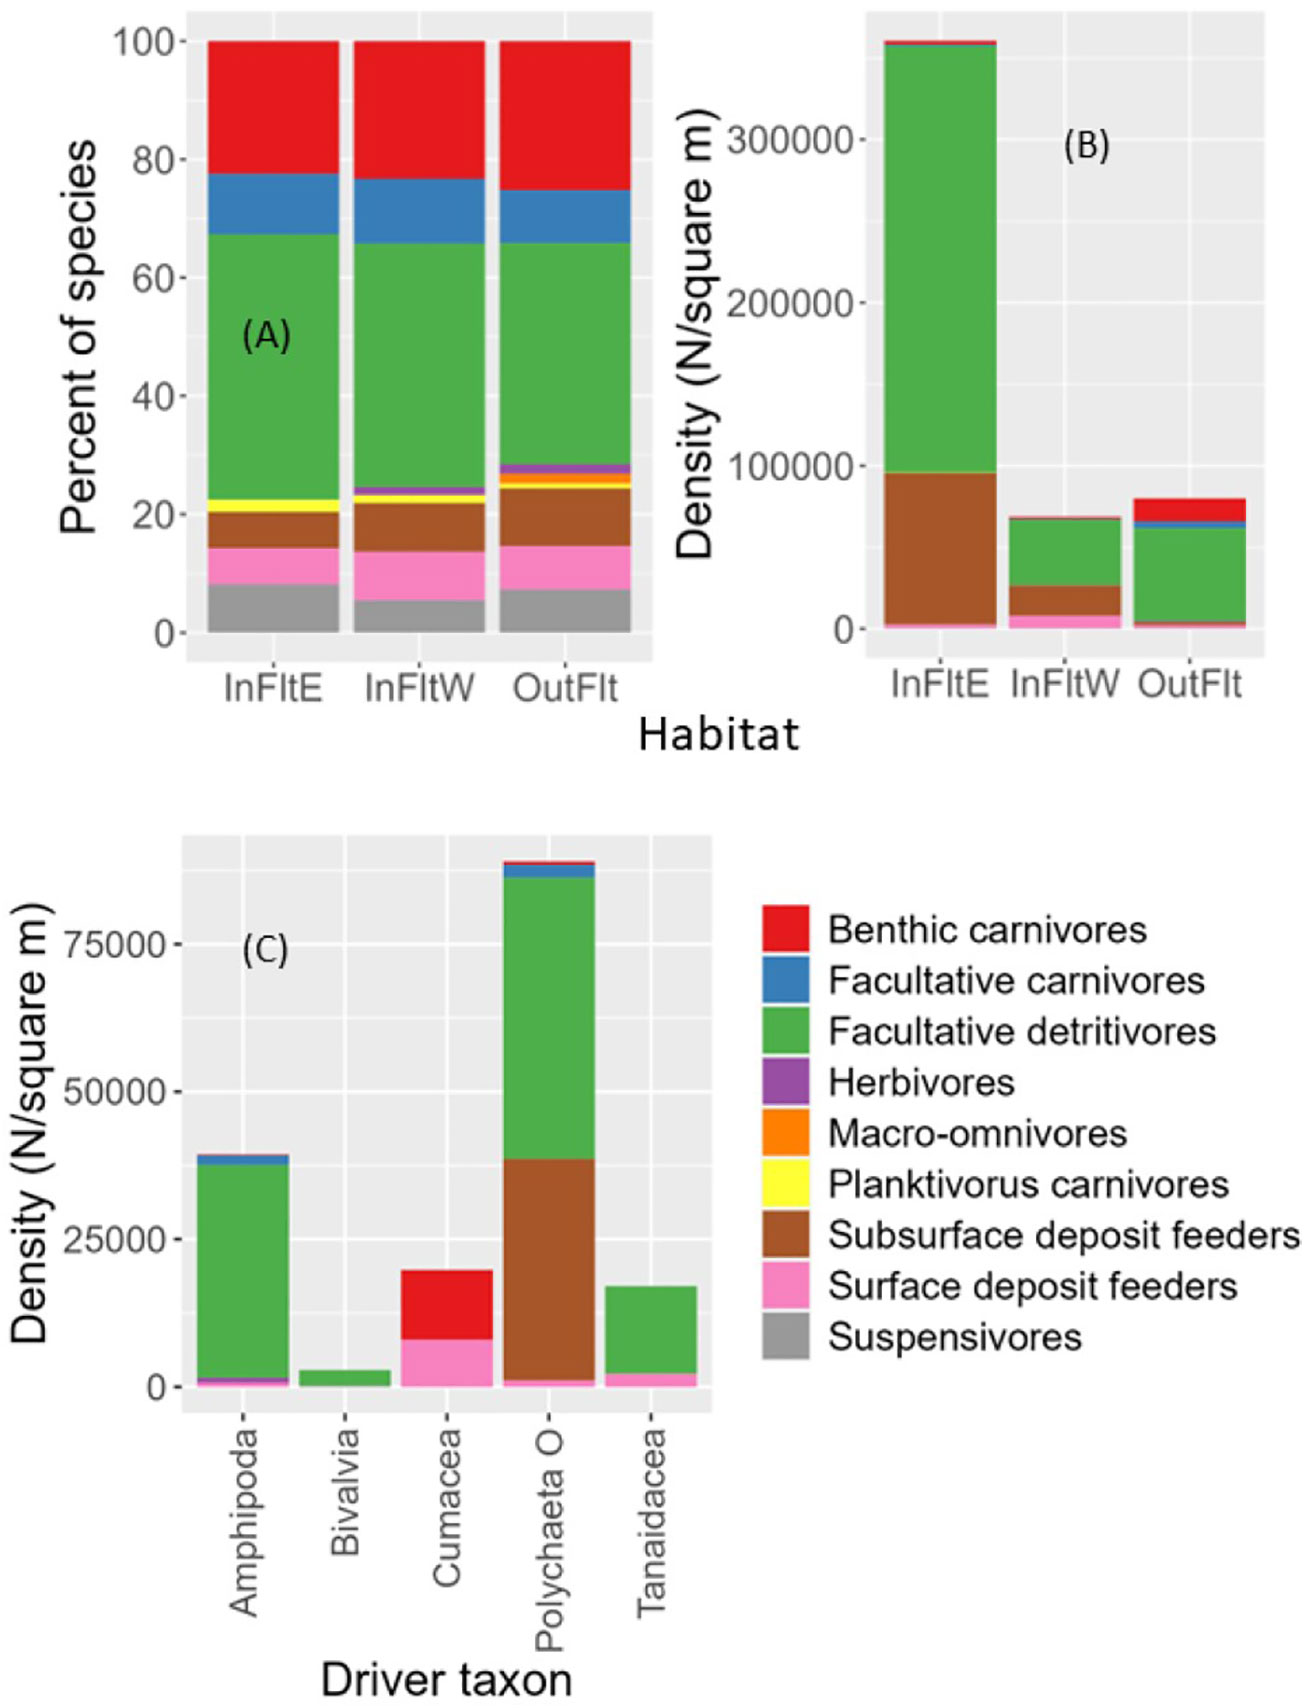
Figure 10 Feeding guild composition. (A) Percentage of species in each guild by Tidal Flats habitat. (B) Mean density of individuals in each guild by Tidal Flats habitat. (C) For the five most abundant driver taxa including >1 guild, mean density of individuals in each guild across all Tidal Flats habitats. See text for description of guild membership criteria. InFltE, Inner Flats East; InFltW, Inner Flats West; OutFlt, Outer Flats. Polychaeta O, Polychaeta Other (other than Manayunkia aestaurina).
In terms of density of individuals, feeding guild composition differed more among habitats (Figure 10B). Inner Flats East was composed almost entirely of facultative detritivores and subsurface deposit feeders, Inner Flats West had moderate densities of surface deposit feeders in addition to high densities of facultative detritivores and subsurface deposit feeders, and the Outer Flats had moderate to high densities of facultative detritivores, benthic carnivores, and facultative carnivores but less surface and subsurface deposit feeders compared to the Flats.
Comparing feeding guild composition among driver taxa is of interest. Figure 10C shows guild composition for abundant driver taxa that included multiple guilds. Guild classifications for other non-insect driver taxa were: Harpacticoida: facultative detritivores; Manayunkia: facultative detritivores; Nematoda: facultative carnivores; Oligochaeta: subsurface deposit feeders; and Ostracoda: almost all benthic carnivores. Facultative detritivores accounted for the majority of individuals in Amphipoda, Bivalvia, Polychaeta Other (polychaetes other than Manayunkia), Harpacticoida, Manayunkia, and Tanaidacea. Polychaeta Other and Oligochaeta were the only driver taxa that included subsurface deposit feeders. Facultative carnivores accounted for moderate numbers of Amphipoda and Polychaeta Other and all nematodes but were absent or scarce for other driver taxa. Only Bivalvia included suspensivores. Cumaceans were either benthic carnivores or surface deposit feeders. Tanaids included some surface deposit feeders. On the Tidal Flats, insects ranked last in abundance among driver taxa, and feeding guild classifications were not provided for insects by Macdonald et al. (2010). We classified all insects (larval Anthomyiidae, Ceratopogonidae, Dolichopodidae, and Ephydridae) as facultative detritivores.
Also of interest are guild affiliations of the dominant species mentioned above (under 3.3.2 Driver Taxa). For Polychaeta Other, Pygospio elegans, Rhynchospio glutaea, and Streblospio benedicti were the most abundant facultative detritovores, and Capitella capitata was the most abundant subsurface deposit feeder. Corophiids were the most abundant facultative detritovores in Amphipoda. Kurtiella tumida was the most abundant facultative detritovore in Bivalvia. For cumaceans, all benthic carnivores were Cumella vulgaris and most surface deposit feeders were Nippoleucon hinumensis. For tanaids, all facultative detritivores were Chondrochelia savignyi and all surface deposit feeders were Sinelobus stanfordi.
Community change in the Restored Refuge was less at sites farthest from the dike line than at sites closer to it (Figure 6D) because total density of the seven taxa that colonized the Restored Refuge after dike removal tended to increase more slowly at the farthest sites (true for all channels except Unit 3; Supplementary Figure S4). Elevation differed between sites farthest from the dike line and sites closest to it, as did dissolved oxygen, salinity, and temperature after dike removal (Supplementary Table S4), environmental gradients which may have contributed to less community change and slower, less complete colonization at the farthest sites.
The community changed circularly at the three southwest-most Inner Flats West sites (F1, F2, and F3; Figure 6A) because species richness and (or) total density decreased in 2010 but then rebounded in 2011-2012 (Supplementary Figure S5; pattern most pronounced for F2). Mean body size also decreased in 2010 but then rebounded. The decrease in species richness, density, and body size in 2010 may have been related to sediment coarsening and decreased TOC (Supplementary Figure S5; grain size change most pronounced at F2).
3.3 Associations between invertebrates and the environment
3.3.1 Invertebrate community associations with the environment
The predictor Site explained a large portion of invertebrate community variation when it was included in dbRDA models (delta R2 = 39-57%; Table 3) indicating large effects of spatial differences among sites. Elevation, which varied spatially but not interannually because it was derived from the 2011 DEM, explained 22% of community variation alone and 11% in a two-predictor model (model All-Elev; Table 3) for the Tidal Flats dataset but was not significant for the Marsh dataset. Sediment and water quality predictors sometimes explained significant but small amounts of community variation alone (R2 = 4-13%) or in multi-predictor models (delta R2 = 2-8%). In models with Site included, variation explained by sediment and water quality predictors was primarily temporal (i.e., across years) rather than spatial.
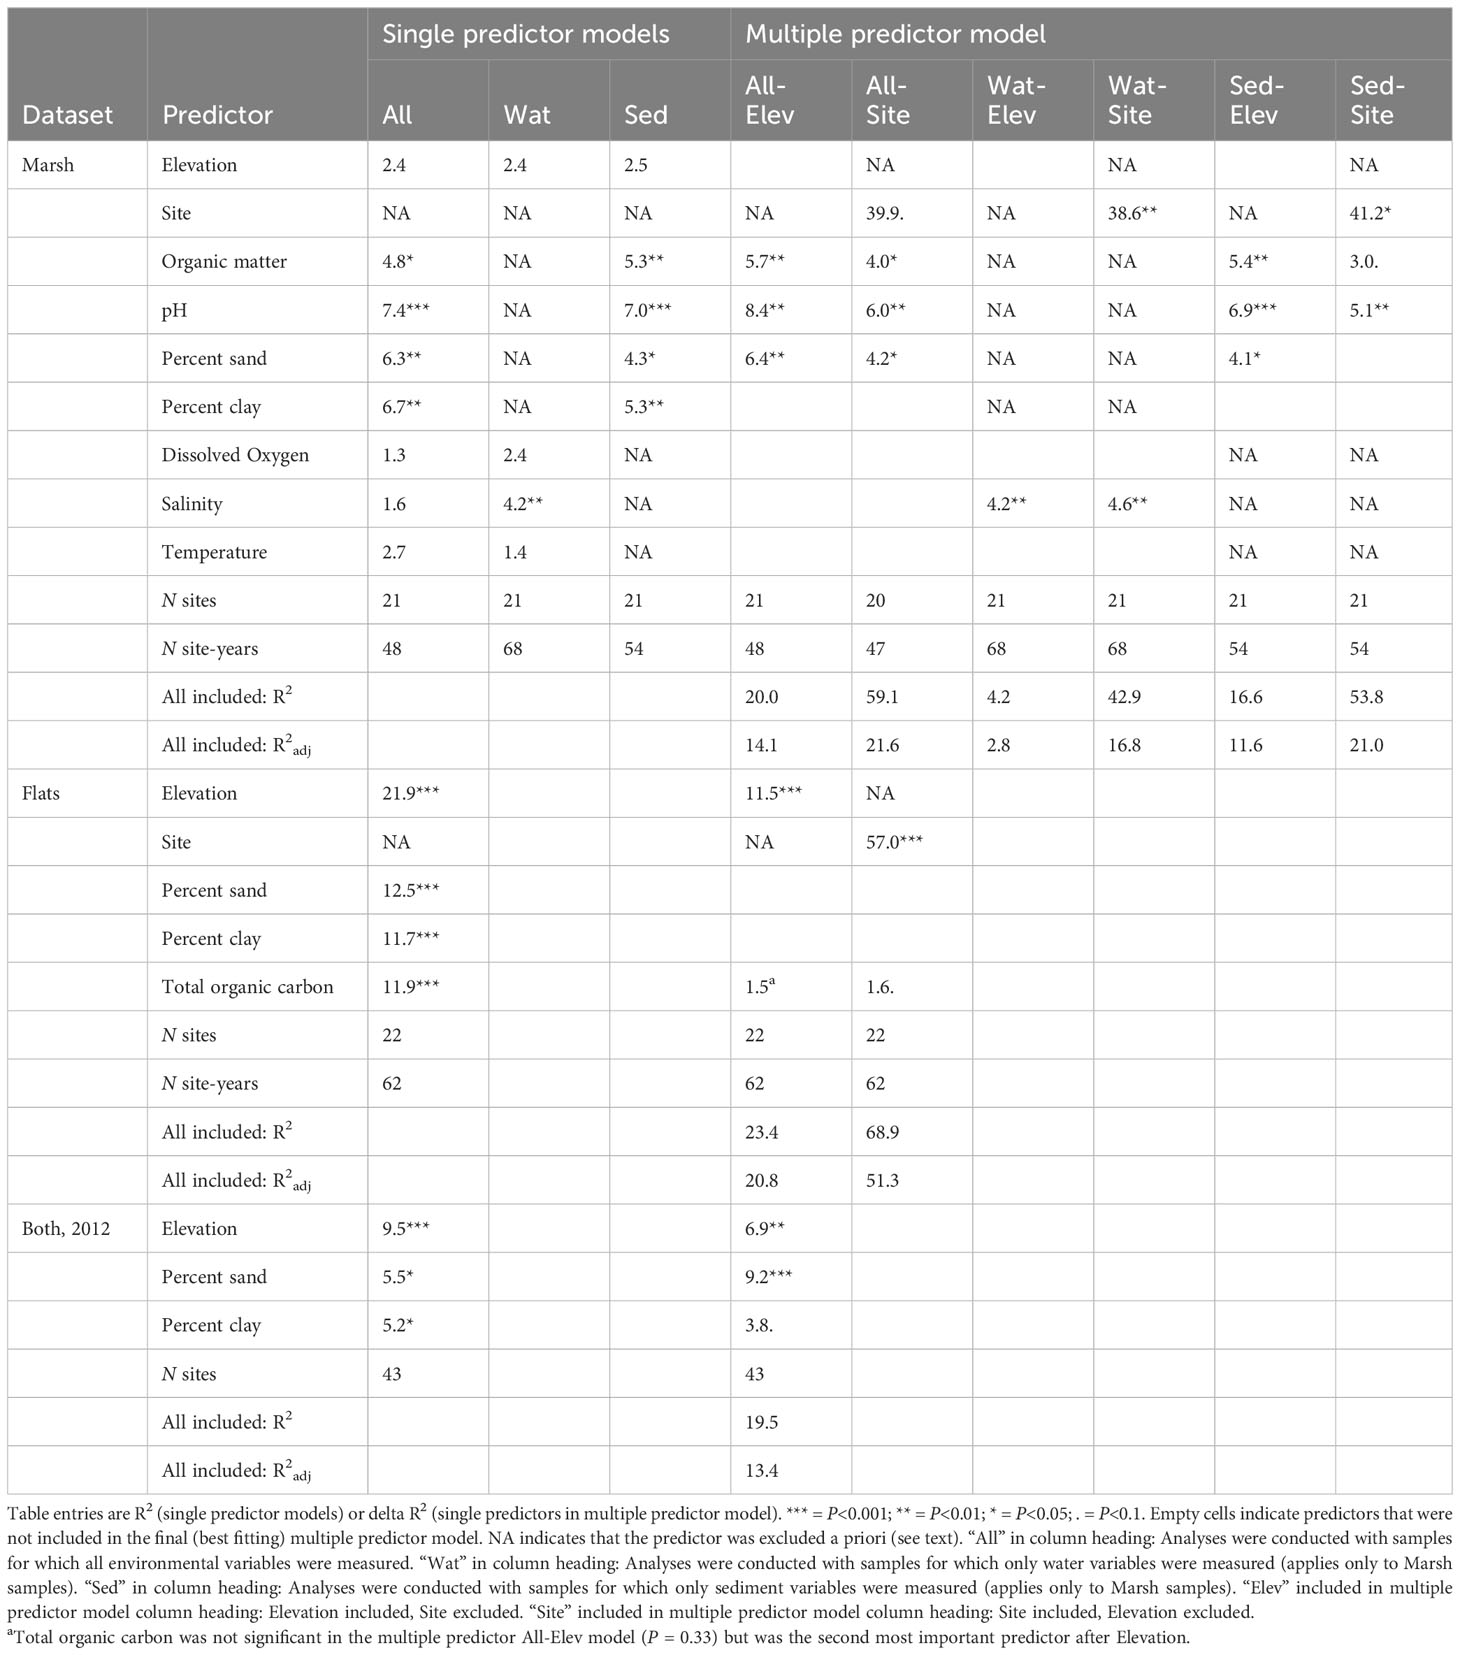
Table 3 Distance-based Redundancy Analysis models relating the invertebrate community to environmental predictors.
For Marsh samples with sediment and water quality variables measured (N=48), OM, pH, percent sand, and percent clay were significant alone, and multi-predictor models retained OM, pH, and percent sand as significant (single predictor models column 1; multi-predictor models All-Elev and All-Site; Table 3). Decreases in OM and pH and increases in percent sand were associated with community change across years (Supplementary Figure S6A).
For 20 additional Marsh samples, only water quality variables were measured (Table 3). In models fit to water quality data using the larger set of samples (N=68), salinity was significant alone and was the only predictor retained, other than Site, in multi-predictor models (Wat-Elev and Wat-Site; Table 3). This was not simply a matter of increased statistical power; R2 is insensitive to sample size and for Salinity it more than doubled between the small and larger set of samples. Salinity change (increase or decrease depending on site) was associated with community change across years (Supplementary Figure S6B). For 6 additional samples, only sediment variables were measured, but using the larger set of sediment samples (N=54) did not change results.
Percent sand, percent clay, and TOC, as well as elevation, alone explained significant variation in the Tidal Flats community (Table 3). Only Elevation was retained as significant when multi-predictor models with Site excluded were fit. TOC became nearly significant (P = 0.053) in the model with Site included, although TOC still explained little community variation (delta R2 = 1.6%). TOC decreases (and concomitant sediment coarsening; Supplementary Figure S1), were associated with community change across years, particularly at sites F2 and F3 (Supplementary Figure S6C).
In 2012, all Marsh and Tidal Flats sites were sampled for sediment grain size composition, allowing an assessment of its effects on delta-wide spatial variation that year. Elevation and percentages of sand and clay were each significant alone and all three were retained in a multi-predictor model (Table 3; Supplementary Figure S6D).
3.3.2 Driver taxon associations with the environment
Manayunkia and Oligochaeta were associated with environmental variables similarly to each other: both were more abundant at high elevations with fine sediment (low percent sand, high percent clay); low OM and high pH on the Marsh; and high TOC on the Tidal Flats (Tables 4, 5). Amphipoda and Cumacea were also associated with environmental variables similarly to each other but were most abundant at low elevations, coarse sediment, low pH, and low TOC. Bivalve abundance increased as conditions changed from onshore to offshore, being highest at low elevations with coarse sediment; high salinity and low temperature on the Marsh; and low TOC on the Tidal Flats. In contrast, insects were more abundant at high elevations with fine sediment; high OM on the Marsh; and high TOC on the Tidal Flats. Differences in tanaid associations between the Marsh and Tidal Flats reflected dominant species differences. Marsh tanaids (mostly Sinelobus stanfordi) were more abundant at high elevation, low OM, high pH, and high temperature, whereas Tidal Flats tanaids (mostly Chondrochelia savignyi) were negatively correlated with elevation. Associations between driver taxa and environmental variables are also suggested by the position of driver taxa on the dbRDA plots (Supplementary Figures S6A–D).
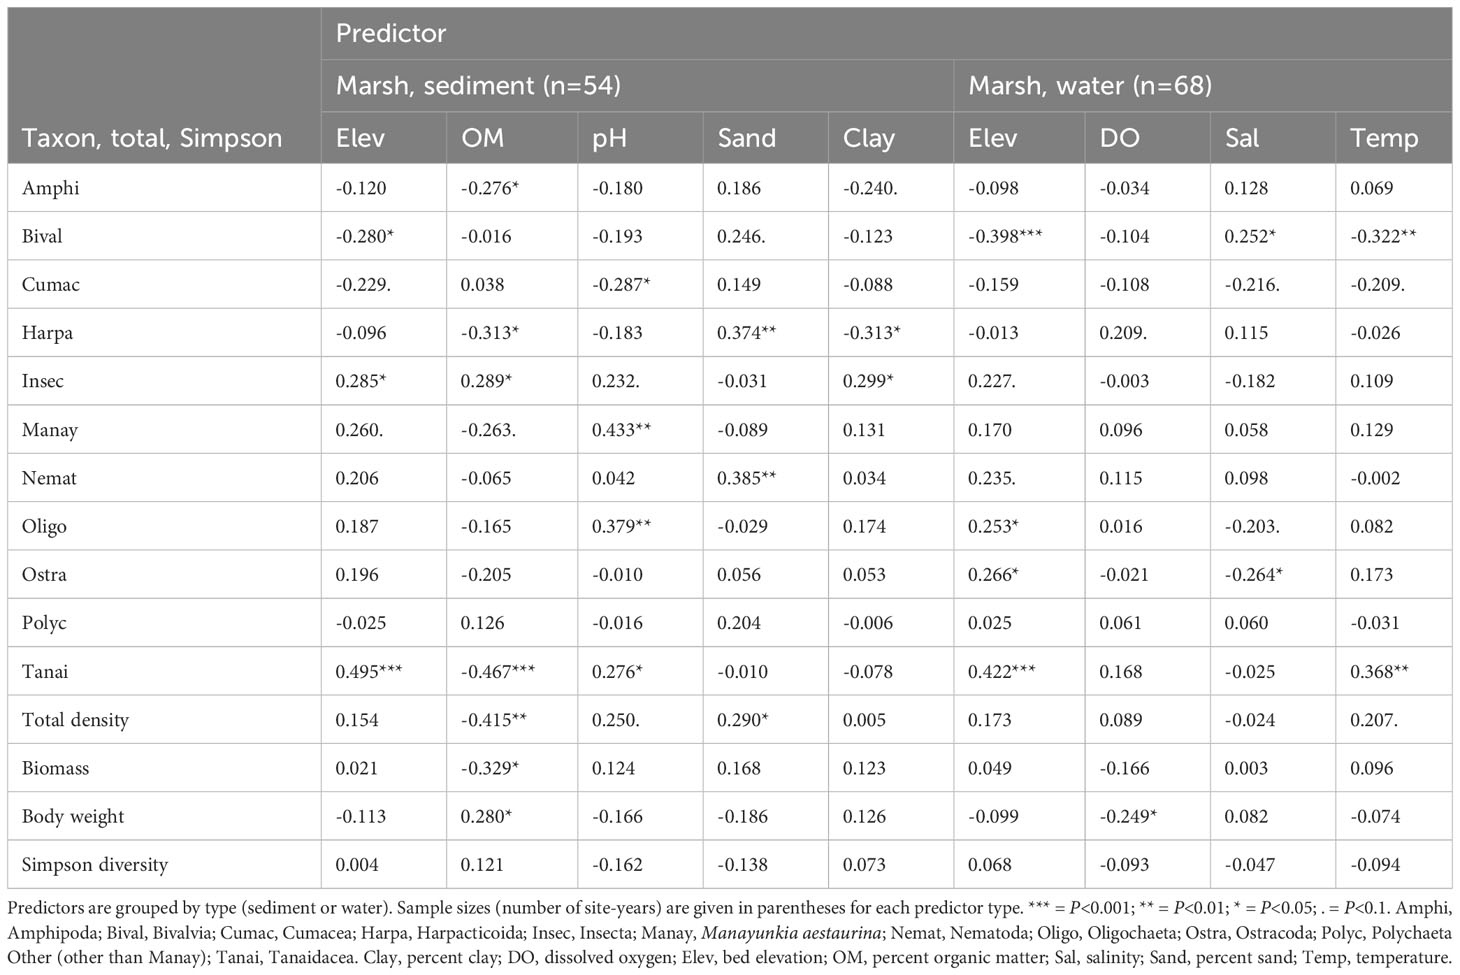
Table 4 Spearman rank correlations between predictors and driver taxon densities; total invertebrate density, biomass, and body weight; and Simpson diversity in the Marsh.
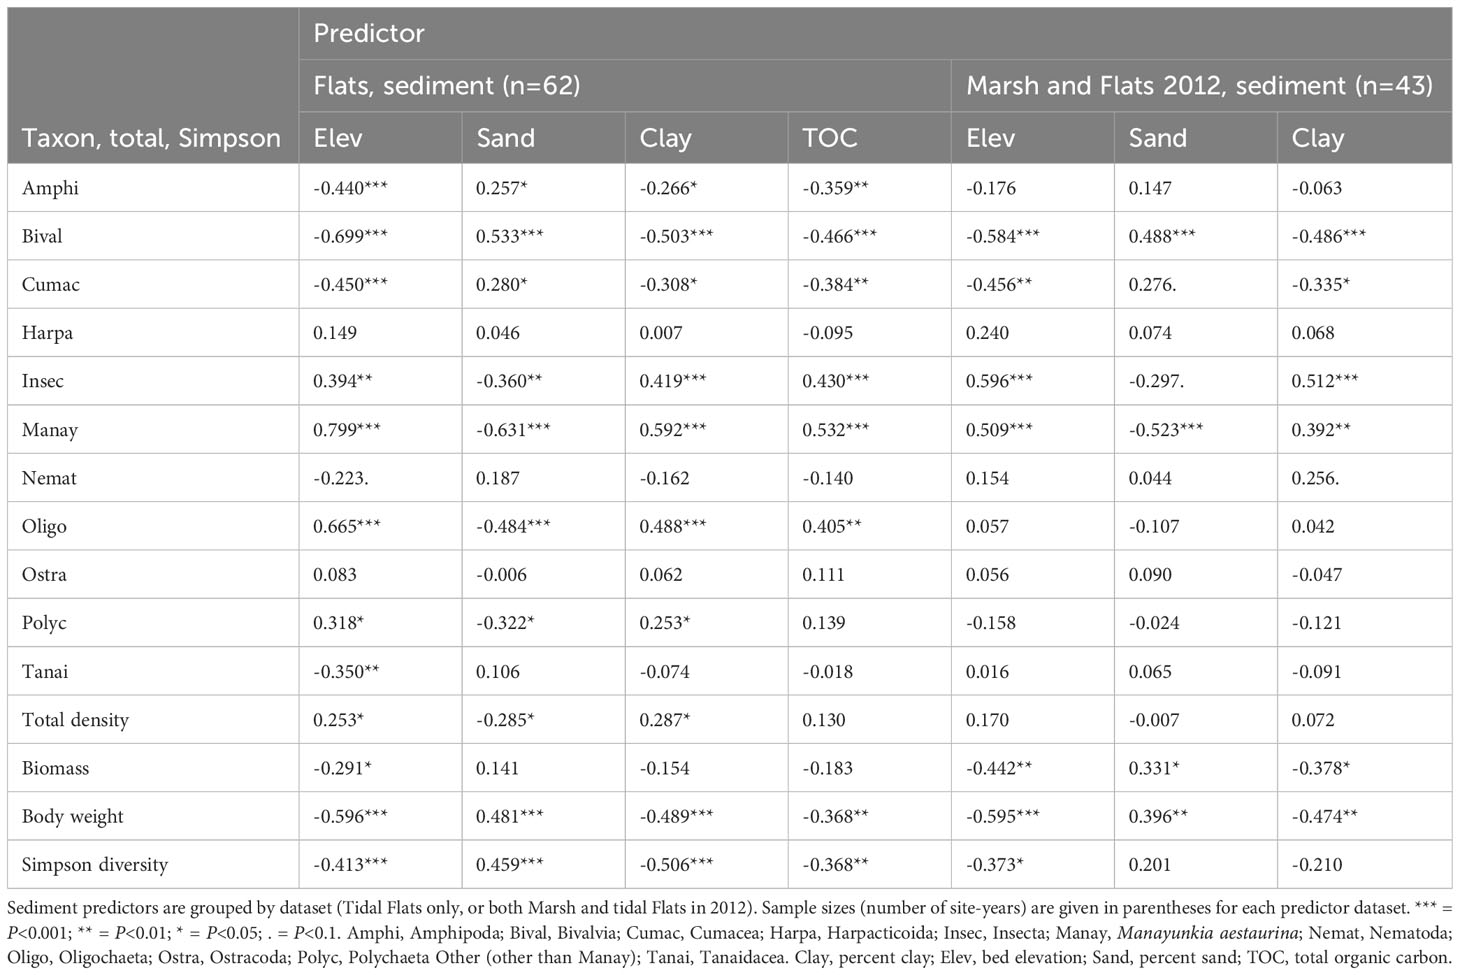
Table 5 Spearman rank correlations between predictors and driver taxon densities; total invertebrate density, biomass, and body weight; and Simpson diversity in the Tidal Flats, and for both the Marsh and Tidal Flats in 2012.
3.3.3 Diversity, abundance, biomass, and body size associations with the environment
In the Marsh, total invertebrate density was negatively related to OM and positively to percent sand (Table 4). The effect of OM was primarily spatial, being driven by lower OM (Figures 4A–C) and higher total density at Restored Marsh and Reference Marsh sites than at Restored Refuge sites (Figures 8J–L), although OM decreased and density increased across years at sites U4S and U1S (Supplementary Figure S7, top). In contrast, the effect of percent sand had a stronger temporal component: percent sand and total density both increased across years at several Restored Refuge sites (Supplementary Figure S7, bottom). Biomass and body weight were less strongly related to sediment predictors than density, and neither density, biomass, nor body weight were strongly related to any water predictors (Table 4). Simpson diversity was unrelated to any sediment or water predictors in the Marsh.
Relations between invertebrate population metrics and the environment were different on the Tidal Flats compared to the Marsh. Total density in the Tidal Flats was related positively to elevation and percent clay and negatively to percent sand (Table 5). Body weight and Simpson diversity were strongly related to all predictors in a manner opposite to that for the Marsh: in the Tidal Flats both were negatively related to elevation, percent clay, and TOC, and positively to percent sand.
4 Discussion
We evaluated the response of benthic macroinvertebrates to an extensive dike removal that restored tidal inundation to historical salt marsh and reconnected the newly restored area with previously restored marsh, undisturbed marsh, and tidal flats in a large, Pacific Northwest river delta. We also characterized how the invertebrate community varied along an onshore-to-offshore gradient extending from emergent marsh to the delta front.
4.1 Response to dike removal
In the recently restored marsh (i.e., the Restored Refuge; Figure 1), diversity increased year-over-year, abundance increased 15-fold, and biomass increased 12-fold from before to three years after dike removal. Several key taxa (Amphipoda, Cumacea, Harpacticoida, Manayunkia, Nematoda, Polychaeta Other, and Tanaidacea) that were absent initially started colonizing in 2010, the year after dike removal, and most reached their highest abundance in 2012 when our study ended. By 2012, invertebrate density and biomass in the Restored Refuge were approaching density and biomass in undisturbed (Reference Marsh) and previously restored salt marsh (Restored Marsh), and invertebrate diversity in the Restored Refuge had achieved equivalency with that in the Reference Marsh and Restored Marsh.
Our results show that species composition recovered more quickly than species abundances. All major marine taxa immediately became established, and species composition, as measured by multivariate community similarity which is sensitive to species composition (Clarke et al., 2014), changed the most one year after dike removal and then more gradually in later years. In contrast, recovery of abundances took longer as evidenced by exponential growth in population sizes of many species through 2012. With respect to status of recovery by 2012, species composition was fully recovered (diversity and community structure similar between the Restored Refuge and pre-existing marsh), but density in the Restored Refuge was still increasing exponentially and had not yet reached levels found in pre-existing marsh (Reference Marsh and Restored Marsh). Our study ended before we could tell whether abundance in the Restored Refuge would fall short of reaching abundance in pre-existing marsh, eventually reach it and then level off, or continue to increase and overshoot it. In a meta-analysis, Moreno-Mateos et al. (2012) found that macroinvertebrate density in restored wetlands quickly increased to 80% of that in reference wetlands but never reached 100% even after 20 years. With respect to speed of recovery, complete recovery of species composition and considerable progress towards recovery of abundance (25-70% of density and 50-75% of biomass in pre-existing marsh) in three years is in line with results of other studies (Simenstad and Thom, 1996; Levin and Talley, 2002; Moreno-Mateos et al., 2012) and faster than for other ecosystem components like plants (Simenstad and Thom, 1996; Moreno-Mateos et al., 2012; Powers and Boyer, 2014).
What environmental changes promoted quick restoration of benthic invertebrates after dike removal? Clearly, restoring tidal inundation permitted access to the Restored Refuge by key taxa. These taxa likely require tidal exchange and connectivity with the larger estuary to maintain their populations. Nevertheless, sediment coarsening, decreased organic matter, and increased salinity after dike removal may have aided invertebrate establishment because many taxa were positively associated with sediment coarsening and salinity, and negatively associated with organic matter (Table 4). Interestingly, sediment fining and decreased salinity resulted in decreased abundance for some taxa in a different Salish Sea estuary (Foley et al., 2017). Following removal of dams from the Elwha River, bed elevation of the estuary increased due to sediment deposition, deposited material was mainly silt, salinity changed from oligohaline (0.5-5 ppt) to freshwater, and amphipods nearly disappeared.
Environmental gradients may also have influenced invertebrate colonization along tidal channels. Colonization was slower and less complete at the distal (south) end of channels in the Restored Refuge, probably at least in part due to higher elevation (i.e., lower inundation frequency), lower salinity, and higher temperature (Supplementary Table S4). Water quality loggers deployed in 2010-2014 showed that temperatures were higher and more variable, and salinities lower, at the landward end of tidal channels compared to those closer to the dike line (Ellings et al., 2016).
Environmental changes in the Restored Refuge were smaller between 2010 and 2012 than from before to immediately after dike removal (Figures 3F, 4C, I, J) and may have been too small to account for the rapid abundance increases exhibited by most taxa from 2010 to 2012. Alternatively, the increases could have been due to interannual differences in delivery of larvae or other life stages from offshore, or recruitment success of local adults once they became established. Some of the marine taxa recruited from planktonic larvae (bivalves, harpacticoids, ostracods, polychaetes) whereas progeny of others developed directly into benthic life stages without a planktonic stage (amphipods, cumaceans, tanaiids) (Ruppert et al., 2004). All taxa had short generation times (¾1 yr) and therefore were capable of increasing their populations quickly. Dipteran larvae and pupae were responsible for the increase in insect abundance in the Restored Refuge in 2012 (Figure 7E). Dipterans are tolerant of disturbance and able to quickly colonize mudflats and floating Ulva algae (Woo et al., 2018).
Diversity, abundance, and body size of benthic invertebrates decreased one year after dike removal in tidal channels just offshore from the Restored Refuge concurrently with sediment coarsening and TOC decreases (Supplementary Figure S5). These sediment changes may represent fine sediment erosion resulting from unimpeded tidal exchange. Channels deepened in the Restored Refuge after dike removal (Ellings et al., 2016; Grossman et al., 2022) and the elevation of the marsh plain increased (Grossman et al., 2022; Davis et al., 2024) suggesting that fine sediment (mud) was eroded from channels and deposited on the marsh plain, leaving coarser sediment (sand) behind in the channels. However, deposition of sediment including sand in the channels immediately seaward of the dike line is also consistent with redistributed sediment largely sourced from within the restored area (Grossman et al., 2022). But whether sediment coarsening was caused by erosion or deposition, either can reduce benthic invertebrate populations (Thrush et al., 2004). Invertebrates rebounded by 2012, even though sediment characteristics mostly remained unchanged after 2010 (Supplementary Figure S5), suggesting invertebrate resilience to this level of disturbance.
In the Restored Refuge, increased abundance overall (summed over taxa) and for some individual taxa was associated with sediment coarsening (Table 4; Supplementary Figure S6), a finding seemingly at odds with the inverse relationship between abundance and sediment coarsening just offshore from the dike line. Extreme substrate change offshore could have contributed to this discrepancy. For example, at the offshore site experiencing the greatest invertebrate decline (F2), sand substrate increased from 60% in 2009 to nearly 100% in 2010. Pre-restoration invertebrate population status may also have contributed. Before dike removal, invertebrates were abundant offshore but there were few invertebrates available to be impacted onshore.
Invertebrate communities changed not only in the Restored Refuge but also in the Restored and Reference marshes (Table 2; Figures 6B, C). Restored and Reference Marsh communities became increasingly similar to the Restored Refuge community through 2012 (Table 1; Figures 5A–D), at least in part because amphipods and harpacticoids increased in all three habitats (Figures 7A, D). This convergence may have been due to increased connectivity among Marsh habitats following dike removal. Invertebrate samples collected for a different study from a variety of habitats in the Nisqually Estuary (riverine, marsh, delta flats) after dike removal each had stable isotope signatures reflecting nourishment from primary producers originating in multiple habitats, which in turn suggests movement by invertebrates and (or) dispersal of primary production, likely in the form of detritus, throughout the estuarine habitat mosaic (Woo et al., 2021). Our study found that populations of amphipods and harpacticoids grew exponentially in the Restored Refuge after establishment in 2010. It may be that reconnection of marshlands through dike removal facilitated population increases for these taxa in all three of the Marsh habitats we studied. Salinity decreases in the Restored and Reference marshes (Figures 4J, K) may have been due to beaver dam construction altering freshwater flow patterns east of the mainstem Nisqually River (Christopher Ellings, Nisqually Indian Tribe, oral communication October 30, 2023) rather than to dike removal, but salinity decreases in the Restored and Reference marshes ran counter to salinity increases in the Restored Refuge and were therefore unlikely to have driven invertebrate community convergence.
Invertebrate communities on the Tidal Flats did not change after dike removal (Table 2), except just offshore from the dike line where invertebrates initially declined in response to sediment coarsening and decreasing organic carbon but then rebounded. Lack of change is consistent with little change in environmental conditions on the Tidal Flats (Figures 3, 4). Restored connectivity did not boost Tidal Flats amphipod or harpacticoid densities (Figure 7A, D), possibly due to habitat differences between the Tidal Flats and Marsh, or greater distance from the Restored Refuge.
4.2 Delta-wide onshore-offshore gradient
We documented a delta-wide onshore-to-offshore spatial gradient in invertebrate communities. Near the delta front (Outer Flats), a diverse assemblage of crustaceans, polychaetes, and bivalves was present (Figures 7, 9), and invertebrate biomass, body size, and diversity were higher than elsewhere on the delta but abundance (density) was only moderate (Figure 8). In contrast, farther inshore on the tidal flats (Inner Flats East), a few species of polychaetes were dominant, and invertebrate abundance was high but body size and diversity were low and biomass was moderate. The Restored and Reference marshes also had high invertebrate abundance but low body size and diversity. Corrophiid amphipods, the cumacean Nippoleucon hinumensis, harpacticoids, insects, nematodes, ostracods, and the tanaiid Sinelobus stanfordi were dominant on the Marsh along with Manayunkia, the most abundant polychaete on the Inner Flats East.
These differences between onshore and offshore invertebrate communities were associated with and likely owed at least in part to environmental differences. Bed elevation decreased onshore to offshore, resulting in less frequent emersion at offshore sites. Although we did not measure temperature and salinity at Tidal Flats sites, they were measured for another study (Hodgson et al., 2016) at six nearby sites (spatial extent roughly congruent to our Tidal Flats sites) during the same time of year (late July-August) and in the same years (2010-2012) as our study was conducted. Mean (SD, N) temperature and salinity near the bottom were 14.2 C (1.1 C, 41) and 26.9 ppt (2.1 ppt), respectively, not spatially specific enough to differentiate among Tidal Flats habitats but demonstrating lower mean temperature and higher mean salinity than in the Marsh (Figures 4J–L, M–O). Lower temperatures and higher salinities during summer were consistent with greater influence of marine water which would also have had relatively constant temperatures and salinities. Less frequent emersion, lower temperatures, higher salinities, and less variable temperatures and salinities were likely tolerable to a greater number of species including those not adapted to more extreme estuarine conditions, thus allowing greater species richness near the delta front (Hirst, 2004; Dethier and Schoch, 2005; Dethier et al., 2010).
Sediment grain size and organic content varied onshore-to-offshore, along with elevation and salinity. Despite this covariation, sediment characteristics likely independently influenced the invertebrate community. Mannino and Montagna (1997) sampled three sediment types in each of four salinity regions and found the highest diversity in the coarsest sediment type, very fine sand (mean = 0.07 mm), with no interactive effect of salinity. Ysebaert et al. (2003) sampled across estuary-wide gradients of grain size, salinity, depth, and current speed, and although grain size effects could not be completely separated from effects of the other variables, the highest species richness was found in fine-very fine sand (mean = 0.11-0.13 mm) which was not the coarsest sediment sampled. Likewise, Currie and Small (2005) sampled estuary-wide and found a unimodal relationship between richness and grain size: highest at 25-75% silt, lower at <25% and >75% silt. Thus, grain size appears to have some effects on diversity and richness independent of salinity and other estuarine gradients, and very fine sand may be a diversity hot spot. Grain sizes coarser than fine sand often support lower diversity because they tend to be associated with faster tidal currents and (or) higher wave energy, making them more mobile and less suitable for many species (Ysebaert et al., 2003; van der Wal et al., 2017).
In our study, there was a relatively sharp difference in grain size and organics between the Outer Flats and all shoreward habitats, with the Outer Flats having coarser sediment (very fine sand, mean = 0.12 mm) and lower organic carbon content (0.3% total organic carbon). Using Inner Flats East (silt, mean = 0.04 mm; 0.9% total organic carbon) as an example of inshore habitats, differences from the Outer Flats in invertebrate abundance, diversity, and feeding guild composition were consistent with sediment differences. Deposits of organically rich, fine sediments in inner estuaries may allow abundance of a few, deposit feeding species to exceed abundance of a more tropically diverse assemblage found farther down-estuary in coarser sediments with lower organic content (Giberto et al., 2004; Dethier et al., 2010). Our data mostly fit this scenario. At Inner Flats East sites, oligochaetes plus four polychaete species accounted for 96% of individuals and they were all facultative detritivores or subsurface deposit feeders, whereas at Outer Flats sites diversity and species richness were much higher (Figures 8–10). The Outer Flats had far fewer subsurface deposit feeders and many more benthic and facultative carnivores compared to Inner Flats East (Figure 10B), which supports less dependence on sediment-associated organics on the Outer Flats. More carnivores on the Outer Flats likely owed in part to coarser sediments with more interstitial spaces to accommodate the most abundant facultative carnivore, nematodes which are meiofauna and eat bacteria, and the most abundant benthic carnivore, the cumacean Cumella vulgaris which eats meiofauna. Both the Outer Flats and Inner Flats East were dominated by facultative detritivores (Figure 10B), but facultative detritovores can also filter feed and may have practiced filter feeding more on the Outer Flats than Inner Flats East. The dominant facultative detritovores were corophiid amphipods on the Outer Flats and several polychaete species on Inner Flats East, but it is unknown whether inclination to filter feed versus collecting detritus from sediment differs between these two types of invertebrates. Greater trophic diversity on the Outer Flats than Inner Flats is not obvious from feeding guild composition (Figure 10) but greater species richness is (Figure 9). Trophic diversity may have been greater on the Outer Flats if feeding guild classifications did not adequately capture subtle trophic differences among species. Marsh vegetation and eelgrass are both available sources of detritus on the Nisqually Tidal Flats (Drexler et al., 2020), providing nutrition to benthic invertebrates living there (Woo et al., 2021), and also supporting deposit and suspension feeders in other Puget Sound estuaries (Howe et al., 2017).
Most of the marine species that were dominant on the Marsh and colonized the Restored Refuge after dike removal were either facultative detritivores (corophiid amphipods, harpacticoids, Manayunkia) or surface deposit feeders (the cumacean Nippoleucon hinumensis, the tanaid Sinelobus stanfordi). Chironomid larvae were the insect taxon showing the greatest abundance increase in the Restored Refuge after dike removal, where they colonized mudflats and mats of Ulva algae (Woo et al., 2018) and probably fed on detritus and decaying plant matter. Thus, it appears that detritus feeders were well adapted to colonizing the restored area in the immediate aftermath of dike removal. It is not clear to us why feeding guild composition was more similar among habitats for percentage of species (Figure 10A) than for density of individuals (Figure 10B). For percentage of species, Partridge et al. (2018) found high similarity in feeding guild composition among 10 sites spread throughout Puget Sound.
Larger body size of invertebrates down-estuary compared to up-estuary may also have owed to differences in sediment characteristics. In soft sediment environments, there is a tendency for invertebrates to be smaller-bodied in fine sediments (mud) with high organics than in coarser sediments (sand) with lower organics (Lenihan and Micheli, 2001). Organically poor sand is often inhabited by large, deep-burrowing, filter-feeding clams (Lenihan and Micheli, 2001), but crustaceans and annelids were much more abundant than clams on the Outer Flats in our study and drove the body size difference.
Species and their environments can have reciprocal relationships that affect ecosystem function. Bioengineering by tube-building polychaetes may have enhanced fine sediment accumulation in the Inner Flats East. Pygospio elegans live in 1 mm diameter tubes and can reach 15 mm in length. In a Scottish estuary they aggregated to form 1-1.5 m2 patches visible as areas of smoothed, raised sediment, within which P. elegans reached densities of 11,000 m-2 (Bolam and Fernandes, 2003). Sediment mud fraction and organic content were higher inside than outside of patches, suggesting that the patches enhanced accumulation of fine sediment and organics by altering hydrodynamics or through other means. It is unknown whether P. elegans aggregated at Inner Flats East sites but their mean density there was 24,000 m-2, more than twice that in the Scottish patches. Manayunkia aestuarina also build tubes. They are much smaller than P. elegans, reaching lengths of 3 mm (Bell, 1982), and we do not know whether they aggregate or can affect sediment conditions, but their mean density at Inner Flats East sites was 224,000 m-2, nearly 10 times that of P. elegans.
It is worth reviewing and adding to the list of possible explanations for higher diversity, and perhaps for greater biomass and body size as well, on the Outer Flats compared to more inshore habitats. Lower elevation meant less emersion time. More marine influence meant higher salinity and less variable salinity and temperature. Very fine sand appeared optimal, possibly because (1) it is indicative of ideal current speeds, not fast enough to mobilize (destabilize) sediments yet fast enough to deliver food to filter feeders, oxygenate sediments, and prevent mud from accumulating; (2) in mud, the oxic layer is thinner and toxic reduced compounds like sulfides are closer to the sediment surface which may be unsuitable for some species (Lenihan and Micheli, 2001); and (3) meiofauna are more abundant in sand, where they provide prey for benthic carnivores like Cumella vulgaris, than in mud (Burd, 2014). Finally, phytoplankton may have been more available to filter feeders near the delta front than inshore (Howe et al., 2017). Whatever the reasons, much greater species diversity, and greater biomass and body size on the Outer Flats compared to farther inshore were striking findings of our study. To give context, biomass of Outer Flats macrovertebrates (23 g m-2 dry weight) is roughly average among macroinvertebrate biomasses measured in estuaries world-wide (Herman et al., 1999).
Onshore-to-offshore differences in dominant taxa were also linked to environmental differences in some cases. The polychaete Manayunkia was the most abundant invertebrate in the Marsh and Inner Flats East but was uncommon on the Outer Flats, probably because of its specializations for mud habitation and feeding on fine detrital particles (Bell, 1982). In contrast, the polychaete Rhynchospio glutaea was the most abundant annelid on the Outer Flats but was absent farther inshore, possibly because it was intolerant of low salinities (Diaz-Jaramillo et al., 2008).
4.3 Study limitations
We sampled only during July-August. Woo et al. (2018) sampled benthic invertebrates from sites within Marsh habitats monthly from April to July and found that community structure did not shift, but polychaete, oligochaete, and nematode densities peaked in April and harpacticoids and dipteran larvae peaked in May and June. Woo et al. (2019) sampled benthic invertebrates from a variety of Nisqually Delta habitats monthly from March to July and found that biomass in estuarine emergent marsh peaked in July. Recruitment of benthic invertebrates to Puget Sound lower intertidal beaches occurred year around but peaked during April-October (Dethier, 2010). Assemblages of San Francisco Estuary benthic invertebrates showed small shifts between wet and dry seasons that were mostly restricted to the edges of salinity zones (e.g., between oligohaline and mesohaline zones) (Thompson et al., 2012), suggesting that salinity changes drove the assemblage shifts (Little et al., 2017). Wet-to-dry season changes in salinity in the Nisqually Marsh were moderate, with a 15 ppt range at most sites and a maximum of 22 and minimum of 2 ppt across all sites (Ellings et al., 2016). Predation by shorebirds can deplete benthic invertebrates (Gabriel L et al., 2006), but shorebirds mostly occupy the Nisqually Delta during fall-spring (Michel et al., 2021). Taken together, these results suggest that sampling during July-August probably captured much of the diversity and abundance present in our study area.
We sampled only one core per site per year, and benthic invertebrate distributions can be patchy. We were able to sample a second core at five Inner Flats West sites (F1-F5) in 2010-2012, and we used these cores to evaluate small-scale spatial variation in community structure in comparison to variation among sites and among years. Replicate cores were about 0.5 m apart. Mean (SD) Brey-Curtis similarity was 59% (14%) between replicates, higher and less variable than among sites within years [24% (16%)] or among years within sites [44% (19%)]. Community change across years differed among sites F1-F5 (Figure 6A), suggesting an interactive effect of Site and Year. We used PERMANOVA to test for this effect, which required replication within site-years as provided by the replicate cores, and found it to be highly significant (P<0.001). Thus, variation in community structure between replicates was sufficiently low to allow detection of differences among sites and years, providing context for our reliance on one core per site per year.
Our cores were too small in surface area (4.7 or 10 cm diameter) and depth (10 cm) to adequately sample large invertebrates or those living deeper in the sediment. Neotrypaea californiensis (ghost shrimp) were present in some Tidal Flats cores but were almost certainly under-sampled due to both their size and depth. Openings to burrows likely made by them were numerous in some areas. Because they are bioengineers that extensively modify sediments (Pillay and Branch, 2011), any effects on them from restoration or spatial differences across the delta may have been reflected in changes to smaller, shallower invertebrates, in which case we may have detected community changes but we would not have known that their source was ghost shrimp changes.
4.4 Management implications
Substantial increases in the abundance, diversity, and biomass of benthic invertebrates following tidal marsh restoration likely enhanced the food supply for a variety of fish and wildlife species, including several species of concern. Many of the invertebrates experiencing increases, especially amphipods, harpacticoids, larval insects, cumaceans, polychaetes, and tanaids, are important prey for outmigrating juvenile salmon, particularly Chinook salmon Oncorhynchus tshawytscha which spend more time in and depend more on estuarine habitats than other salmonid species (Woo et al., 2018; Davis et al., 2018a, Davis et al., 2018b, Davis et al., 2019; Woo et al., 2019, 2021). Increased abundance of invertebrate prey in the Marsh likely benefited other fish as well (Howe and Simenstad, 2011). Invertebrate communities on the Tidal Flats changed little after dike removal; however, it is worth noting that tidal flats invertebrates are an important food source for many fish and bird species, especially shorebirds which have a limited amount of time to feed in areas exposed only at low tide (Page et al., 1999).
Benthic macroinvertebrates contribute to nutrient cycling indirectly by stimulating decomposition through bioturbation and bio-irrigation (Kristensen et al., 2014), but also directly through their consumption, production (tissue elaboration), and respiration which can account for large fractions of the organic carbon delivered to the sediment. Benthic macroinvertebrate annual production at several sites near the mouth of the Fraser River averaged 11% of the organic carbon delivered to the sediment annually (Burd et al., 2013). Drexler et al. (2019) estimated that carbon accumulation rates on the Nisqually Delta near our Inner Flats West sites (their Animal Slough sites) averaged 134 g C m-2 yr-1. Using our measurements of invertebrate biomass and body weight, and empirical models for estimating benthic macroinvertebrate production (Brey, 2012) and respiration (Brey, 2010), we calculated that benthic macroinvertebrate production accounted for 14%, and their respiration for an additional 38% of the carbon that accumulated in that area annually. How the large increase in benthic invertebrates in the restored area affected nutrient cycling is unknown but it probably changed the equation.
Restoration may be expected to take longer for terrestrial invertebrates dependent on marsh vegetation than for benthic invertebrates because terrestrials must wait for vegetation to establish (Woo et al., 2018). In the Refuge, after dike emplacement the land behind the dikes subsided due to reduced drainage and compaction by farming activities (Grossman et al., 2020), and salt marsh was slow to colonize after dike removal because elevation remained low. Greater sediment input would speed elevation increase and vegetation reestablishment. Reconnecting historical distributary channels, which would directly connect the river to the restored area, may improve several vital functions including sediment delivery (Ellings et al., 2016). Efforts are currently underway to evaluate benefits of this action (Grossman et al., 2022). Nevertheless, our study and others demonstrate that restoring tidal inundation to former marshlands can benefit benthic invertebrates and the animals they provide prey for even before increases in elevation and vegetation reestablishment (Woo et al., 2021).
Other management actions and human-caused disturbances affecting sedimentary processes on deltas will also affect benthic invertebrates. River channelization can change sediment routing patterns, in some cases resulting in delta progradation, export of mud beyond the delta, and destabilization of sediments (Grossman et al., 2020). Sea level rise, in conjunction with fine sediment bypassing the marsh due to river channelization, can cause decreased marsh accretion rates and increased marsh erosion (Hood et al., 2016). Climate change is expected to change hydrologic regimes of rivers draining into Puget Sound in a manner that will increase sediment delivery (Lee et al., 2016). These changes in sediment dynamics have consequences for benthic invertebrates inhabiting deltaic soft sediments as our results show. In particular, we found that fine sand promoted high diversity and biomass, and large body size; mud with high organic content was associated with higher density but lower diversity and biomass, and smaller body size; and grain size and organic content modifications from sediment erosion or deposition led to invertebrate community changes.
Data availability statement
The datasets presented in this study can be found in online repositories. The names of the repository/repositories and accession number(s) can be found below: Rubin, S.P., I. Woo, E.E. Grossman, M.J. Davis, J.Y. Takekawa, and S.E.W. De La Cruz. 2024. Data collected in 2009-2012 to assess benthic macroinvertebrate response to dike removal on the Nisqually River delta: U.S. Geological Survey data release, https://doi.org/10.5066/P1NQVWXX.
Ethics statement
Ethical review and approval were not required for the study on animals in accordance with the local legislation and institutional requirements.
Author contributions
SR: Conceptualization, Data curation, Formal Analysis, Funding acquisition, Investigation, Methodology, Project administration, Resources, Supervision, Validation, Visualization, Writing – original draft, Writing – review & editing. MD: Conceptualization, Data curation, Formal Analysis, Investigation, Methodology, Project administration, Resources, Supervision, Validation, Visualization, Writing – original draft, Writing – review & editing. EG: Conceptualization, Funding acquisition, Investigation, Methodology, Project administration, Resources, Supervision, Writing – original draft, Writing – review & editing. IW: Conceptualization, Data curation, Funding acquisition, Investigation, Methodology, Project administration, Resources, Supervision, Validation, Writing – original draft, Writing – review & editing. SD: Conceptualization, Funding acquisition, Project administration, Resources, Supervision, Writing – original draft, Writing – review & editing. GN: Project administration, Resources, Writing – original draft, Writing – review & editing. JT: Conceptualization, Funding acquisition, Investigation, Methodology, Project administration, Resources, Supervision, Writing – original draft, Writing – review & editing.
Funding
The author(s) declare that financial support was received for the research, authorship, and/or publication of this article. Funding was provided by the U.S. Geological Survey (USGS) Coastal Habitats in Puget Sound Program, the U.S. Environmental Protection Agency Tribal Assistance Grant no. PA-00J15001, the USGS and U.S. Fish and Wildlife Service Science Support Program (#2354), and the Washington State Estuary and Salmon Restoration Program (12-1367 to USGS Western Ecological Research Center). The USGS Ecosystems Mission Area partially supported SR, MD, IW, SSD, and JT, and the USGS Natural Hazards Mission Area partially supported E. E. Grossman.
Acknowledgments
We thank partner coordination efforts of the U. S. Fish and Wildlife Service (J. E. Takekawa, J. Barham, D. Roster) and the Nisqually Indian Tribe (C. S. Ellings, S. Hodgson). We thank Daniel Hull of the Nisqually Reach Nature Center for logistical and field support, as well as program and personnel support of Western Washington University Department of Geology. We thank Matthew Ferner, Kim Larsen, and Terence Palmer for providing helpful reviews of the manuscript. Taxonomic identifications of invertebrates were provided by Kathy Welch (Aquamarine Environmental Services), and U.S. Geological Survey Western Ecological Research Center staff: William Chan, Erin Flynn, and Ashley Loveland. M. C. Hayes and K. L. Turner coordinated study implementation, and Chip Applegate, Karl Stenberg, Bob Rosenbauer, Nick Pinel, Anna Davenport, Ben Parker, Meghan Weaver, Alec Barber, Emilee Eilefson, Melissa Young, Cindy Miller, Lisa Belleveau, and Matthew Holt, assisted with field work. Any use of trade, firm, or product names is for descriptive purposes only and does not imply endorsement by the U.S. Government.
Conflict of interest
The authors declare that the research was conducted in the absence of any commercial or financial relationships that could be construed as a potential conflict of interest.
Publisher’s note
All claims expressed in this article are solely those of the authors and do not necessarily represent those of their affiliated organizations, or those of the publisher, the editors and the reviewers. Any product that may be evaluated in this article, or claim that may be made by its manufacturer, is not guaranteed or endorsed by the publisher.
Author disclaimer
Any use of trade, firm, or product names is for descriptive purposes only and does not imply endorsement by the U.S. Government.
Supplementary material
The Supplementary Material for this article can be found online at: https://www.frontiersin.org/articles/10.3389/fevo.2024.1356679/full#supplementary-material
References
Aho K., Derryberry D., Peterson T. (2014). Model selection for ecologists: the worldviews of AIC and BIC. Ecology 95, 631–636. doi: 10.1890/13-1452.1
Anderson M. J., Gorley R. N., Clarke K. R. (2008). PERMANOVA+ for PRIMER: Guide to Software and Statistical Methods (Plymouth, UK: PRIMER-E).
Bell S. S. (1982). On the population biology and meiofaunal characteristics of Manayunkia aestuarina (Polychaeta: Sabellidae: Fabricinae) from a South Carolina salt marsh. Estuar. Coast. Shelf Sci. 14, 215–221. doi: 10.1016/S0302-3524(82)80046-7
Belleveau L. J., Takekawa J. Y., Woo I., Turner K. L., Barham J. B., Takekawa J. E., et al. (2015). Vegetation community response to tidal marsh restoration of a large river estuary. Northwest Sci. 89, 136–147. doi: 10.3955/046.089.0205
Bolam S. G., Fernandes T. F. (2003). Dense aggregations of Pygospio elegans (Claparède): effect on macrofaunal community structure and sediments. J. Sea Res. 49, 171–185. doi: 10.1016/S1385-1101(03)00007-8
Bolker B. (2020). bbmle: Tools for General Maximum Likelihood Estimation. R package version 1.0.23, Available at: https://CRAN.R-project.org/package=bbmle.
Bottom D. L., Jones K. K. (1990). Species composition, distribution, and invertebrate prey of fish assemblages in the Columbia River Estuary. Prog. Oceanogr. 25, 243–270. doi: 10.1016/0079-6611(90)90009-Q
Brey T. (2010). An empirical model for estimating aquatic invertebrate respiration. Methods Ecol. Evol. 1, 92–101. doi: 10.1111/j.2041-210X.2009.00008.x
Brey T. (2012). A multi-parameter artificial neural network model to estimate macrobenthic invertebrate productivity and production. Limnol. Oceanogr.: Methods 10, 581–589. doi: 10.4319/lom.2012.10.581
Brey T., Müller-Wiegmann C., Zittier Z. M. C., Hagen W. (2010). Body composition in aquatic organisms — A global data bank of relationships between mass, elemental composition and energy content. J. Sea Res. 64, 334–340. doi: 10.1016/j.seares.2010.05.002
Burd B. J. (2014). Distribution, inventory and turnover of benthic organic biomass in the Strait of Georgia, Canada, in relation to natural and anthropogenic inputs. Mar. pollut. Bull. 82, 155–166. doi: 10.1016/j.marpolbul.2014.03.004
Burd B., Macdonald T., Bertold S. (2013). The effects of wastewater effluent and river discharge on benthic heterotrophic production, organic biomass and respiration in marine coastal sediments. Mar. pollut. Bull. 74, 351–363. doi: 10.1016/j.marpolbul.2013.06.029
Burd B. J., Macdonald R. W., Johannessen S. C., van Roodselaar A. (2008). Responses of subtidal benthos of the Strait of Georgia, British Columbia, Canada to ambient sediment conditions and natural and anthropogenic depositions. Mar. Environ. Res. 66, S62–S79. doi: 10.1016/j.marenvres.2008.08.009
Clarke K. R., Gorley R. N., Somerfield P. J., Warwick R. M. (2014). Change in marine communities: an approach to statistical analysis and interpretation (Plymouth, UK: PRIMER-E).
Curran C. A., Grossman E. E., Magirl C. S., Foreman J. R. (2016). Suspended Sediment Delivery to Puget Sound from the Lower Nisqually River, Western Washington, July 2010–November 2011. U.S. Geological Survey Scientific Investigations Report 2016-5062, 17 p. doi: 10.3133/sir20165062
Currie D. R., Small K. J. (2005). Macrobenthic community responses to long-term environmental change in an east Australian sub-tropical estuary. Estuar. Coast. Shelf Sci. 63, 315–331. doi: 10.1016/j.ecss.2004.11.023
Czuba J. A., Magirl C. S., Czuba C. R., Grossman E. E., Curran C. A., Gendaszek A. S., et al. (2011). “Sediment load from major rivers into Puget Sound and its adjacent waters,” in U.S. Geological Survey Fact Sheet 2011–3083. doi: 10.3133/fs20113083
Davis M., Ellings C. S., Woo I., Hodgson S., Larsen K. A., Nakai G. (2018a). Gauging resource exploitation by juvenile Chinook salmon (Oncorhynchus tshawytscha) in restoring estuarine habitat. Restor. Ecol 26, 976–986. doi: 10.1111/rec.12643
Davis M. J., Poppe K. L., Rybczyk J. M., Grossman E. E., Woo I., Chamberlin J. W., et al. (2024). Vulnerability to sea-level rise varies among estuaries and habitat types: lessons learned from a network of surface elevation tables in puget sound. Estuaries Coasts. doi: 10.1007/s12237-024-01335-w
Davis M. J., Woo I., Ellings C. S., Hodgson S., Beauchamp D. A., Nakai G., et al. (2018b). Integrated diet analyses reveal contrasting trophic niches for wild and hatchery juvenile chinook salmon in a large river delta. Trans. Am. Fish. Soc. 147, 818–841. doi: 10.1002/tafs.10088
Davis M. J., Woo I., Ellings C. S., Hodgson S., Beauchamp D. A., Nakai G., et al. (2019). Freshwater tidal forests and estuarine wetlands may confer early life growth advantages for delta-reared chinook salmon. Trans. Am. Fish. Soc. 148, 289–307. doi: 10.1002/tafs.10134
Dethier M. N. (2010). Variation in recruitment does not drive the cline in diversity along an estuarine gradient. Mar. Ecol. Prog. Ser. 410, 43–54. doi: 10.3354/meps08636
Dethier M. N., Ruesink J., Berry H., Sprenger A. G., Reeves B. (2010). Restricted ranges in physical factors may constitute subtle stressors for estuarine biota. Mar. Environ. Res. 69, 240–247. doi: 10.1016/j.marenvres.2009.10.015
Dethier M. N., Schoch G. C. (2005). The consequences of scale: assessing the distribution of benthic populations in a complex estuarine fjord. Estuar. Coast. Shelf Sci. 62, 253–270. doi: 10.1016/j.ecss.2004.08.021
Diaz-Jaramillo M., Munoz P., Delgado-Blas V., Bertran C. (2008). Spatio-temporal distribution of spionids (Polychaeta-Spionidae) in an estuarine system in south-central Chile. Rev. Chil. Hist. Natural 81, 501–514. doi: 10.4067/S0716-078X2008000400005
Drexler J. Z., Davis M. J., Woo I., de la Cruz S. (2020). Carbon sources in the sediments of a restoring vs. Historically unaltered salt marsh. Estuaries Coasts 43, 1345–1360. doi: 10.1007/s12237-020-00748-7
Drexler J. Z., Woo I., Fuller C. C., Nakai G. (2019). Carbon accumulation and vertical accretion in a restored versus historic salt marsh in southern Puget Sound, Washington, United States. Restor. Ecol. 27, 1117–1127. doi: 10.1111/rec.12941
Duffy J. E., Reynolds P. L., Bostrom C., Coyer J. A., Cusson M., Donadi S., et al. (2015). Biodiversity mediates top-down control in eelgrass ecosystems: a global comparative-experimental approach. Ecol. Lett. 18, 696–705. doi: 10.1111/ele.12448
Ellings C. S., Davis M. J., Grossman E. E., Woo I., Hodgson S., Turner K. L., et al. (2016). Changes in habitat availability for outmigrating juvenile salmon (Oncorhynchus spp.) following estuary restoration. Restor. Ecol. 24, 415–427. doi: 10.1111/rec.12333
Foley M. M., Warrick J. A., Ritchie A., Stevens A. W., Shafroth P. B., Duda J. J., et al. (2017). Coastal habitat and biological community response to dam removal on the Elwha River. Ecol. Monogr. 0, 1–26. doi: 10.1002/ecm.1268
Fresh K. L. (2006). Juvenile Pacific Salmon in Puget Sound (Seattle, WA: Puget Sound Nearshore Partnership Report No. 2006-06, Seattle District, U.S. Army Corps of Engineers).
Gabriel L H., Edward J H., Jeffrey D B., Patrick W. (2006). MIGRANT SHOREBIRD PREDATION ON BENTHIC INVERTEBRATES ALONG THE ILLINOIS RIVER, ILLINOIS. Wilson J. Ornithol. 118, 152–163. doi: 10.1676/05-024.1
Giberto D. A., Bremec C. S., Acha E. M., Mianzan H. (2004). Large-scale spatial patterns of benthic assemblages in the SW Atlantic: the Río de la Plata estuary and adjacent shelf waters. Estuar. Coast. Shelf Sci. 61, 1–13. doi: 10.1016/j.ecss.2004.03.015
Gray A., Simenstad C. A., Bottom D. L., Cornwell T. J. (2002). Contrasting functional performance of juvenile salmon habitat in recovering wetlands of the Salmon River estuary, Oregon, USA. Restor. Ecol. 10, 514–526. doi: 10.1046/j.1526-100X.2002.01039.x
Grossman E. E., Crosby S. C., Stevens A. W., Nowacki D. J., vanArendonk N. R., Curran C. A. (2022). “Assessment of vulnerabilities and opportunities to restore marsh sediment supply at Nisqually River Delta, west-central Washington,” in U.S. Geological Survey Open-File Report 2022–1088, 50 p. doi: 10.3133/ofr20221088
Grossman E. E., Stevens A. W., Dartnell P., George D., Finlayson D. (2020). Sediment export and impacts associated with river delta channelization compound estuary vulnerability to sea-level rise, Skagit River Delta, Washington, USA. Mar. Geol. 430, 106336. doi: 10.1016/j.margeo.2020.106336
Herman P. M. J., Middelburg J. J., Van de Koppel J., Heip C. H. R. (1999). “Ecology of estuarine macrobenthos,” in Advances in Ecological Research, Vol 29: Estuaries. Eds. Nedwell D. B., Raffaelli D. G., 195–240.
Hirst A. J. (2004). Broad-scale environmental gradients among estuarine benthic macrofaunal assemblages of south-eastern Australia: implications for monitoring estuaries. Mar. Freshw. Res. 55, 79–92. doi: 10.1071/MF03011
Hodgson S., Ellings C. S., Rubin S. P., Hayes M. C., Duval W., Grossman E. E. (2016). “2010-2015 juvenile fish ecology in the Nisqually River Delta and Nisqually Reach Aquatic Reserve,” in Nisqually Indian Tribe (Department of Natural Resources). Salmon Recovery Program Technical Report No. 2016-1.
Hood W. G., Grossman E., Curt V. (2016). Assessing tidal marsh vulnerability to sea-level rise in the Skagit Delta. Northwest Science 90 (1), 79–93.
Howe E. R., Simenstad C. A. (2011). Isotopic determination of food web origins in restoring and ancient estuarine wetlands of the San Francisco Bay and Delta. Estuaries Coasts 34, 597–617. doi: 10.1007/s12237-011-9376-8
Howe E., Simenstad C. A., Ogston A. (2017). Detrital shadows: estuarine food web connectivity depends on fluvial influence and consumer feeding mode. Ecol. Appl. 27, 2170–2193. doi: 10.1002/eap.1600/full
Hughes B. B., Levey M. D., Brown J. A., Fountain M. C., Carlisle A. B., Litvin S. Y., et al. (2014). Nursery functions of US West Coast estuaries: The state of knowledge for juveniles of focal invertebrate and fish species (Arlington, VA: The Nature Conservancy), 168pp.
Kristensen E., Delefosse M., Quintana C. O., Flindt M. R., Valdemarsen T. (2014). Influence of benthic macrofauna community shifts on ecosystem functioning in shallow estuaries. Front. Mar. Sci. 1, 41. doi: 10.3389/fmars.2014.00041
Lee S.-Y., Hamlet A. F., Grossman E. E. (2016). Impacts of climate change on regulated streamflow, hydrologic extremes, hydropower production, and sediment discharge in the Skagit River basin. Northwest Sci. 90, 23–43. doi: 10.3955/046.090.0104
Lenihan H. S., Micheli F. (2001). Soft-sediment communities. Eds. Bertness M. D., Gaines S. D., Hay M. E. Mar. Community Ecol. (Sinauer, Sunderland, MA), 253–287.
Lenth R. (2020). emmeans: Estimated Marginal Means, aka Least-Squares Means. R package version 1.8.6. Available at: https://CRAN.R-project.org/package=emmeans.
Levin L. A., Talley T. S. (2002). Natural and manipulated sources of heterogeneity controlling early faunal development of a salt marsh. Ecol. Appl. 12, 1785–1802. doi: 10.1890/1051-0761(2002)012[1785:NAMSOH]2.0.CO;2
Little S., Wood P. J., Elliott M. (2017). Quantifying salinity-induced changes on estuarine benthic fauna: The potential implications of climate change. Estuar. Coast. Shelf Sci. 198, 610–625. doi: 10.1016/j.ecss.2016.07.020
Lotze H. K., Lenihan H. S., Bourque B. J., Bradbury R. H., Cooke R. G., Kay M. C., et al. (2006). Depletion, degradation, and recovery potential of estuaries and coastal seas. Science 312, 1806–1809. doi: 10.1126/science.1128035
Macdonald T. A., Burd B., Macdonald V. I., van Roodselaar A. (2010). “Taxonomic and feeding guild classification for the marine benthic macroinvertebrates of the Strait of Georgia, British Columbia,” in Canadian Technical Report of Fisheries and Aquatic Sciences 2874:iv + 63 p.
Macdonald T. A., Burd B. J., van Roodselaar A. (2012). Facultative feeding and consistency of trophic structure in marine soft-bottom macrobenthic communities. Mar. Ecol. Prog. Ser. 445, 129–140. doi: 10.3354/meps09478
Mannino A., Montagna P. A. (1997). Small-scale spatial variation of macrobenthic community structure. Estuaries 20, 159–173. doi: 10.2307/1352729
Michel N., Bayard T., Summers A., Slater G., Spragens K. (2021). Avian Habitat Suitability Models for Puget Sound Estuary Birds (Tacoma, WA). Prepared for the Puget Sound Ecosystem MonitoringProgram, Puget Sound Partnership.
Moreno-Mateos D., Power M. E., Comín F. A., Yockteng R. (2012). Structural and functional loss in restored wetland ecosystems. PloS Biol. 10, e1001247. doi: 10.1371/journal.pbio.1001247
Oksanen J., Blanchet F. G., Friendly M., Kindt R., Legendre P., McGlinn D., et al. (2019). vegan: Community Ecology Package. R package version 2.5-6, Available at: https://CRAN.R-project.org/package=vegan.
Page G. W., Stenzel L. E., Kjelmyr J. E. (1999). Overview of shorebird abundance and distribution in wetlands of the pacific coast of the contiguous United States. Condor 101, 461–471. doi: 10.2307/1370176
Partridge V., Weakland S., Dutch M., Burgess D., Eagleston A. (2018). Sediment Quality in Puget Sound: Changes in chemical contaminants and invertebrate communities at 10 sentinel stations 1989–2015. Washington Department of Ecology, Publication No. 18-03-005.
Pillay D., Branch G. (2011). Bioengineering effects of burrowing thalassinidean shrimps on marine soft-bottom ecosystems. Oceanogr. Mar. Biol.: Annu. Rev. 49, 137–192. doi: 10.1201/b11009-5
Pinheiro J., Bates D., DebRoy S., Sarkar D. (2019). nlme: Linear and Nonlinear Mixed Effects Models. R package version 3.1-140.
Placyk J. S. Jr., Harrington B. A. (2004). Prey Abundance and Habitat Use by Migratory Shorebirds at Coastal Stopover Sites in Connecticut / Abundancia de preśas y uso de habitat por playeros migratorios en una parada costanera de connecticut. J. Field Ornithol. 75, 223–231. doi: 10.1648/0273-8570-75.3.223
Powers S. P., Boyer K. E. (2014). “Marine restoration ecology,” in Marine Community Ecology and Conservation. Eds. Bertness M. D., Bruno J. F., Silliman B. R., Stachowicz J. J. (Sinauer, Sunderland, MA).
Puget Sound Water Quality Authority (1987). Recommended protocols for sampling and analyzing subtidal benthic macroinvertebrate assemblages in Puget Sound (Olympia, WA: Puget Sound Water Quality Authority).
Quammen M. L. (1984). PREDATION BY SHOREBIRDS, FISH, AND CRABS ON INVERTEBRATES IN INTERTIDAL MUDFLATS - AN EXPERIMENTAL TEST. Ecology 65, 529–537. doi: 10.2307/1941415
Rubin S. P., Woo I., Grossman E. E., Davis M. J., Takekawa J. Y., De La Cruz S. E. W., et al (2024). Data collected in 2009-2012 to assess benthic macroinvertebrate response to dike removal on the Nisqually River delta. U.S. Geological Survey data release. doi: 10.5066/P1NQVWXX
Ruppert E. E., Fox R. S., Barnes R. D. (2004). Invertebrate zoology: A functional evolutionary approach (Belmont, CA: Thomson-Brooks/Cole).
Simenstad C. A., Cordell J. R. (2000). Ecological assessment criteria for restoring anadromous salmonid habitat in Pacific Northwest estuaries. Ecol. Eng. 15, 283–302. doi: 10.1016/s0925-8574(00)00082-3
Simenstad C., Ramirez M., Burke J., Logsdon M., Shipman H., Tanner C., et al. (2011). “Historical change of Puget Sound shorelines: Puget Sound nearshore ecosystem project change analysis,” Puget Sound Nearshore Report No. 2011-01. Published by Washington Department of Fish and Wildlife, Olympia, Washington, and U.S. Army Corps of Engineers, Seattle, Washington.
Simenstad C. A., Thom R. M. (1996). Functional equivalency trajectories of the restored Gog-Le-Hi-Te estuarine wetland. Ecol. Appl. 6, 38–56. doi: 10.2307/2269551
Sokal R. R., Rohlf F. J. (1995). Biometry; the principles and practice of statistics in biological research (New York: W. H. Freeman and Company).
Takesue R. K. (2016). “Environmental and eelgrass response to dike removal: Nisqually River Delta, (2010–14),” U.S. Geological Survey Open-File Report 2016–1169, 17 p. doi: 10.3133/ofr20161169
Tanner C. D., Cordell J. R., Rubey J., Tear L. M. (2002). Restoration of freshwater intertidal habitat functions at Spencer Island, Everett, Washington. Restor. Ecol. 10, 564–576. doi: 10.1046/j.1526-100X.2002.t01-1-02034.x
Thompson B., Ranasinghe A., Lowe S., Melwani A., Weisberg S. (2012). Benthic macrofaunal assemblages of the San Francisco Estuary and Delta, USA. Environ. Monit. Assess. 185, 2281–2295. doi: 10.1007/s10661-012-2708-8
Thrush S., Hewitt J., Cummings V., Ellis J., Hatton C., Lohrer A., et al. (2004). Muddy waters: elevating sediment input to coastal and estuarine habitats. Front. Ecol. Environ. 2, 299–306. doi: 10.1890/1540-9295(2004)002[0299:MWESIT]2.0.CO;2
van der Wal D., Lambert G. I., Ysebaert T., Plancke Y. M. G., Herman P. M. J. (2017). Hydrodynamic conditioning of diversity and functional traits in subtidal estuarine macrozoobenthic communities. Estuar. Coast. Shelf Sci. 197, 80–92. doi: 10.1016/j.ecss.2017.08.012
Woo I., Davis M. J., de la Cruz S. E. W., Windham-Myers L., Drexler J. Z., Byrd K. B., et al. (2021). “Carbon flux, storage, and wildlife co-benefits in a restoring estuary,” in Wetland Carbon and Environmental Management, Geophysical Monograph 267, First Edition. Edited by Krauss K. W., Zhu Z., Stagg C. L.. American Geophysical Union. John Wiley & Sons, Inc. doi: 10.1002/9781119639305.ch5
Woo I., Davis M. J., Ellings C. S., Hodgson S., Takekawa J. Y., Nakai G., et al. (2019). A mosaic of estuarine habitat types with prey resources from multiple environmental strata supports a diversified foraging portfolio for juvenile Chinook salmon. Estuaries Coasts 42, 1938–1954. doi: 10.1007/s12237-019-00613-2
Woo I., Davis M., Ellings C. S., Nakai G., Takekawa J. Y., de la Cruz S. (2018). Enhanced invertebrate prey production following estuarine restoration supports foraging for multiple species of juvenile salmonids (Oncorhynchus spp.). Restor. Ecol. 26, 964–975. doi: 10.1111/rec.12658
Ysebaert T., Herman P. M. J. (2002). Spatial and temporal variation in benthic macrofauna and relationships with environmental variables in an estuarine, intertidal soft-sediment environment. Mar. Ecol. Prog. Ser. 244, 105–124. doi: 10.3354/meps244105
Ysebaert T., Herman P. M. J., Meire P., Craeymeersch J., Verbeek H., Heip C. H. R. (2003). Large-scale spatial patterns in estuaries: estuarine macrobenthic communities in the Schelde estuary, NW Europe. Estuar. Coast. Shelf Sci. 57, 335–355. doi: 10.1016/s0272-7714(02)00359-1
Keywords: benthic invertebrates, dike removal, Nisqually, restoration, estuaries, marsh, wetlands, tidal flats
Citation: Rubin SP, Davis MJ, Grossman EE, Woo I, De La Cruz SEW, Nakai G and Takekawa JY (2024) Benthic macroinvertebrate response to estuarine emergent marsh restoration across a delta-wide environmental gradient. Front. Ecol. Evol. 12:1356679. doi: 10.3389/fevo.2024.1356679
Received: 12 January 2024; Accepted: 23 April 2024;
Published: 13 May 2024.
Edited by:
Junhong Bai, Beijing Normal University, ChinaReviewed by:
Terence Palmer, Texas A&M University Corpus Christi, United StatesMatthew Ferner, San Francisco State University, United States
Copyright © 2024 Rubin, Davis, Grossman, Woo, De La Cruz, Nakai and Takekawa. This is an open-access article distributed under the terms of the Creative Commons Attribution License (CC BY). The use, distribution or reproduction in other forums is permitted, provided the original author(s) and the copyright owner(s) are credited and that the original publication in this journal is cited, in accordance with accepted academic practice. No use, distribution or reproduction is permitted which does not comply with these terms.
*Correspondence: Stephen P. Rubin, c3J1YmluQHVzZ3MuZ292
†Present address: Melanie J. Davis, U.S. Geological Survey, Oregon Cooperative Fish and Wildlife Research Unit, Corvallis, OR, United States John Y. Takekawa, Suisun Resource Conservation District, Suisun City, CA, United States