 Wei Jiang
 Jingzhou He
- Xi’an Jiaotong University Sports Center, Shaanxi, Xian, China
Introduction: Carbon neutrality has become a key strategy to combat global climate change. However, current methods for predicting carbon emissions are limited and require the development of more effective strategies to meet this challenge. This is especially true in the field of sports and competitions, where the energy intensity of major events and activities means that time series data is crucial for predicting related carbon emissions, as it can detail the emission patterns over a period of time.
Method: In this study, we introduce an artificial intelligence-based method aimed at improving the accuracy and reliability of carbon emission predictions. Specifically, our model integrates an Improved Mahjong Search Algorithm (ISSA) and GRU-Transformer technology, designed to efficiently process and analyze the complex time series data generated by sporting events. These technological components help to capture and parse carbon emission data more accurately.
Results: Experimental results have demonstrated the efficiency of our model, which underwent a comprehensive evaluation involving multiple datasets and was benchmarked against competing models. Our model outperformed others across various performance metrics, including lower RMSE and MAE values and higher R2 scores. This underscores the significant potential of our model in enhancing the accuracy of carbon emission predictions.
Discussion: By introducing this new AI-based method for predicting carbon emissions, this study not only provides more accurate data support for optimizing and implementing carbon neutrality measures in the sports field but also improves the accuracy of time series data predictions. This enables a deeper understanding of carbon emission trends associated with sports activities. It contributes to the development of more effective mitigation strategies, making a significant contribution to global efforts to reduce carbon emissions.
1 Introduction
In the contemporary context, achieving carbon neutrality stands out as a pivotal goal in combatting global climate change. This term denotes the attainment of a state where carbon emissions are balanced or even surpassed by efforts involving removal, reduction, or compensation strategies.The significance of this concept is self-evident, as climate change has profound impacts on the Earth’s environment, society, and economy (Moshari et al., 2023; Keshavarzzadeh et al., 2023). However, achieving carbon neutrality is not an easy task and is accompanied by a series of challenges. One of these challenges lies in the widespread and diverse sources of global carbon emissions, making the tracking, monitoring, and reduction of emissions complex and challenging. Another challenge is ensuring the long-term sustainability of carbon neutrality measures to maintain a state of net-zero carbon emissions. These challenges necessitate innovative approaches for resolution (Zhao et al., 2022; Wu et al., 2022). With the rapid advancement of deep learning technology, researchers have begun to apply it to the field of carbon neutrality. Deep learning is a machine learning technique that mimics the neural network structures of the human brain to process complex data, exhibiting exceptional pattern recognition capabilities (Wang et al., 2021; Yu, 2023). This has made deep learning a powerful tool for exploring solutions to carbon neutrality. Currently, researchers have been utilizing deep learning in various domains to advance carbon neutrality research (Zahedi et al., 2022a; Zahedi et al., 2022b). These domains include monitoring and management of carbon emissions sources, improvements in carbon capture and storage technologies, and optimization of carbon offset projects, among others (Somu et al., 2021). Among the numerous applications of deep learning, time series forecasting holds particular importance in carbon neutrality research. Time series data provides valuable information regarding carbon emissions, energy consumption, weather changes, and more. By analyzing and forecasting this time series data, researchers can gain a better understanding of the effectiveness of carbon neutrality measures and optimize their strategies. For instance, through time series forecasting, one can more accurately predict future energy demands, thus optimizing energy production and distribution while reducing carbon emissions (Amasyali and El-Gohary, 2018; Feng et al., 2023). Additionally, time series analysis can aid in monitoring and predicting weather changes to enhance the efficiency of renewable energy utilization. Therefore, time series forecasting plays an indispensable role in carbon neutrality research, providing robust support for achieving the goal of net-zero carbon emissions (Wang et al., 2021; Yu, 2023).
In recent years, researchers have actively explored various time series forecasting models to address challenges in the field of carbon neutrality. One such model is the ARIMA (Autoregressive Integrated Moving Average) model, a classic method that combines the concepts of autoregression (AR) and moving averages (MA). Widely applied in numerous carbon neutrality studies, especially for predicting carbon emission trends, the ARIMA model, however, has limitations in dealing with nonlinear relationships and complex seasonal variations, leading to potential inaccuracies in practical carbon neutrality scenarios (Sun and Ren, 2021). Additionally, LSTM (Long Short-Term Memory) and GRU (Gated Recurrent Unit) models are two other extensively used models in time series forecasting. These models possess the ability to capture long-term dependencies and are suitable for handling nonlinear and non-stationary time series data. However, due to their complexity, computational expenses, and the often substantial amount of data required, their application in certain carbon neutrality research contexts can be challenging (Shen et al., 2022). On another front, the Transformer model is emerging as a notable contender in the field of time series forecasting. Built on a self-attention mechanism, it can capture relationships between different time steps in a sequence, providing a better understanding of temporal and seasonal variations. Despite its excellent performance in handling time series data, the Transformer model may face challenges in certain carbon neutrality studies, particularly those with high data requirements (Chen et al., 2022).
Based on the aforementioned limitations, this study introduces a comprehensive model that combines ISSA and GRU-Transformer to address the shortcomings of previous models. Leveraging the strengths of the Transformer encoding layers and the GRU model, this model achieves more accurate carbon emission predictions and conducts in-depth exploration of factors influencing carbon neutrality. Firstly, the model utilizes the Transformer encoding layers as feature extractors, delving into various influencing factors in the carbon neutrality process. Subsequently, the extracted features are prepared for the prediction task through a fully connected layer. The model incorporates two layers of GRU models to enhance learning capacity. Secondly, the output of the GRU model is fitted through a fully connected layer to realize predictions of carbon emissions. The optimization process employs the improved Sparrow Search Algorithm, adjusting hyperparameters to enhance model performance and training efficiency.
● This study introduces a time series forecasting approach based on a combination of ISSA and the GRU-Transformer model to enhance the accuracy of carbon emission predictions. By integrating the encoding layers of the Transformer with the GRU model, the model can better capture the temporal and seasonal patterns in carbon emission data, resulting in more precise carbon emission forecasts. This contribution is of paramount importance in guiding the development and implementation of carbon neutrality strategies.
● The research further explores the application of the ISSA method to gain a deeper understanding of the crucial influencing factors during the carbon neutrality process. Through the analysis of timeseries data, we can identify factors related to carbon emissions and incorporate them into the model’s considerations. This approach provides a more comprehensive perspective, aiding in revealing dynamic relationships underlying carbon neutrality and offering decision-makers additional insights to optimize emission reduction strategies.
● Additionally, this study introduces an enhanced Sparrow Search Algorithm to optimize the hyperparameters of the GRU-Transformer model. This optimization process enhances the model’s performance and makes it more versatile, allowing it to adapt to various datasets and problem scenarios. The application of this algorithm contributes to improved model efficiency and applicability.
2 Method
This article proposes a combined model based on ISSA and GRU-Transformer. Firstly, the encoding layers of the Transformer are used as feature extractors to deeply explore the influencing factors of carbon neutrality. Relevant features associated with these influencing factors are expressed and extracted to obtain the most significant features from the training data. Subsequently, the extracted features are passed through a fully connected layer, followed by the use of two layers of GRU models for prediction, which significantly enhances the model’s learning capacity compared to a single-layer GRU. Finally, a single fully connected layer is used to fit the predicted values, achieving predictions of carbon emissions.
Building upon this foundation, an improved Sparrow Search Algorithm is introduced to optimize the GRU-Transformer model. Hyperparameters such as learning rate, batch size, and hidden layer node count within the model are optimized using this algorithm. Figure 1 illustrates the process: Firstly, the original carbon emission data is input into the GRU-Transformer prediction model, with the input layer node count, output layer node count, and other non-ISSA optimized parameters pre-set. Parameters for the ISSA model are determined, including maximum iteration count (epoch), dimensionality (d), threshold (ST), and warning value R2. Subsequently, ISSA is employed to optimize the learning rate, batch size, and hidden layer node count within the GRU-Transformer prediction model. Fitness of the sparrow individuals is calculated, and their best positions are updated accordingly. If the best position is achieved, the algorithm concludes; otherwise, the new position is updated as the best position. Finally, the hyperparameters obtained through ISSA optimization are input into the GRU-Transformer prediction model for forecasting, and the model’s performance is assessed by comparing the error between the actual and predicted values.
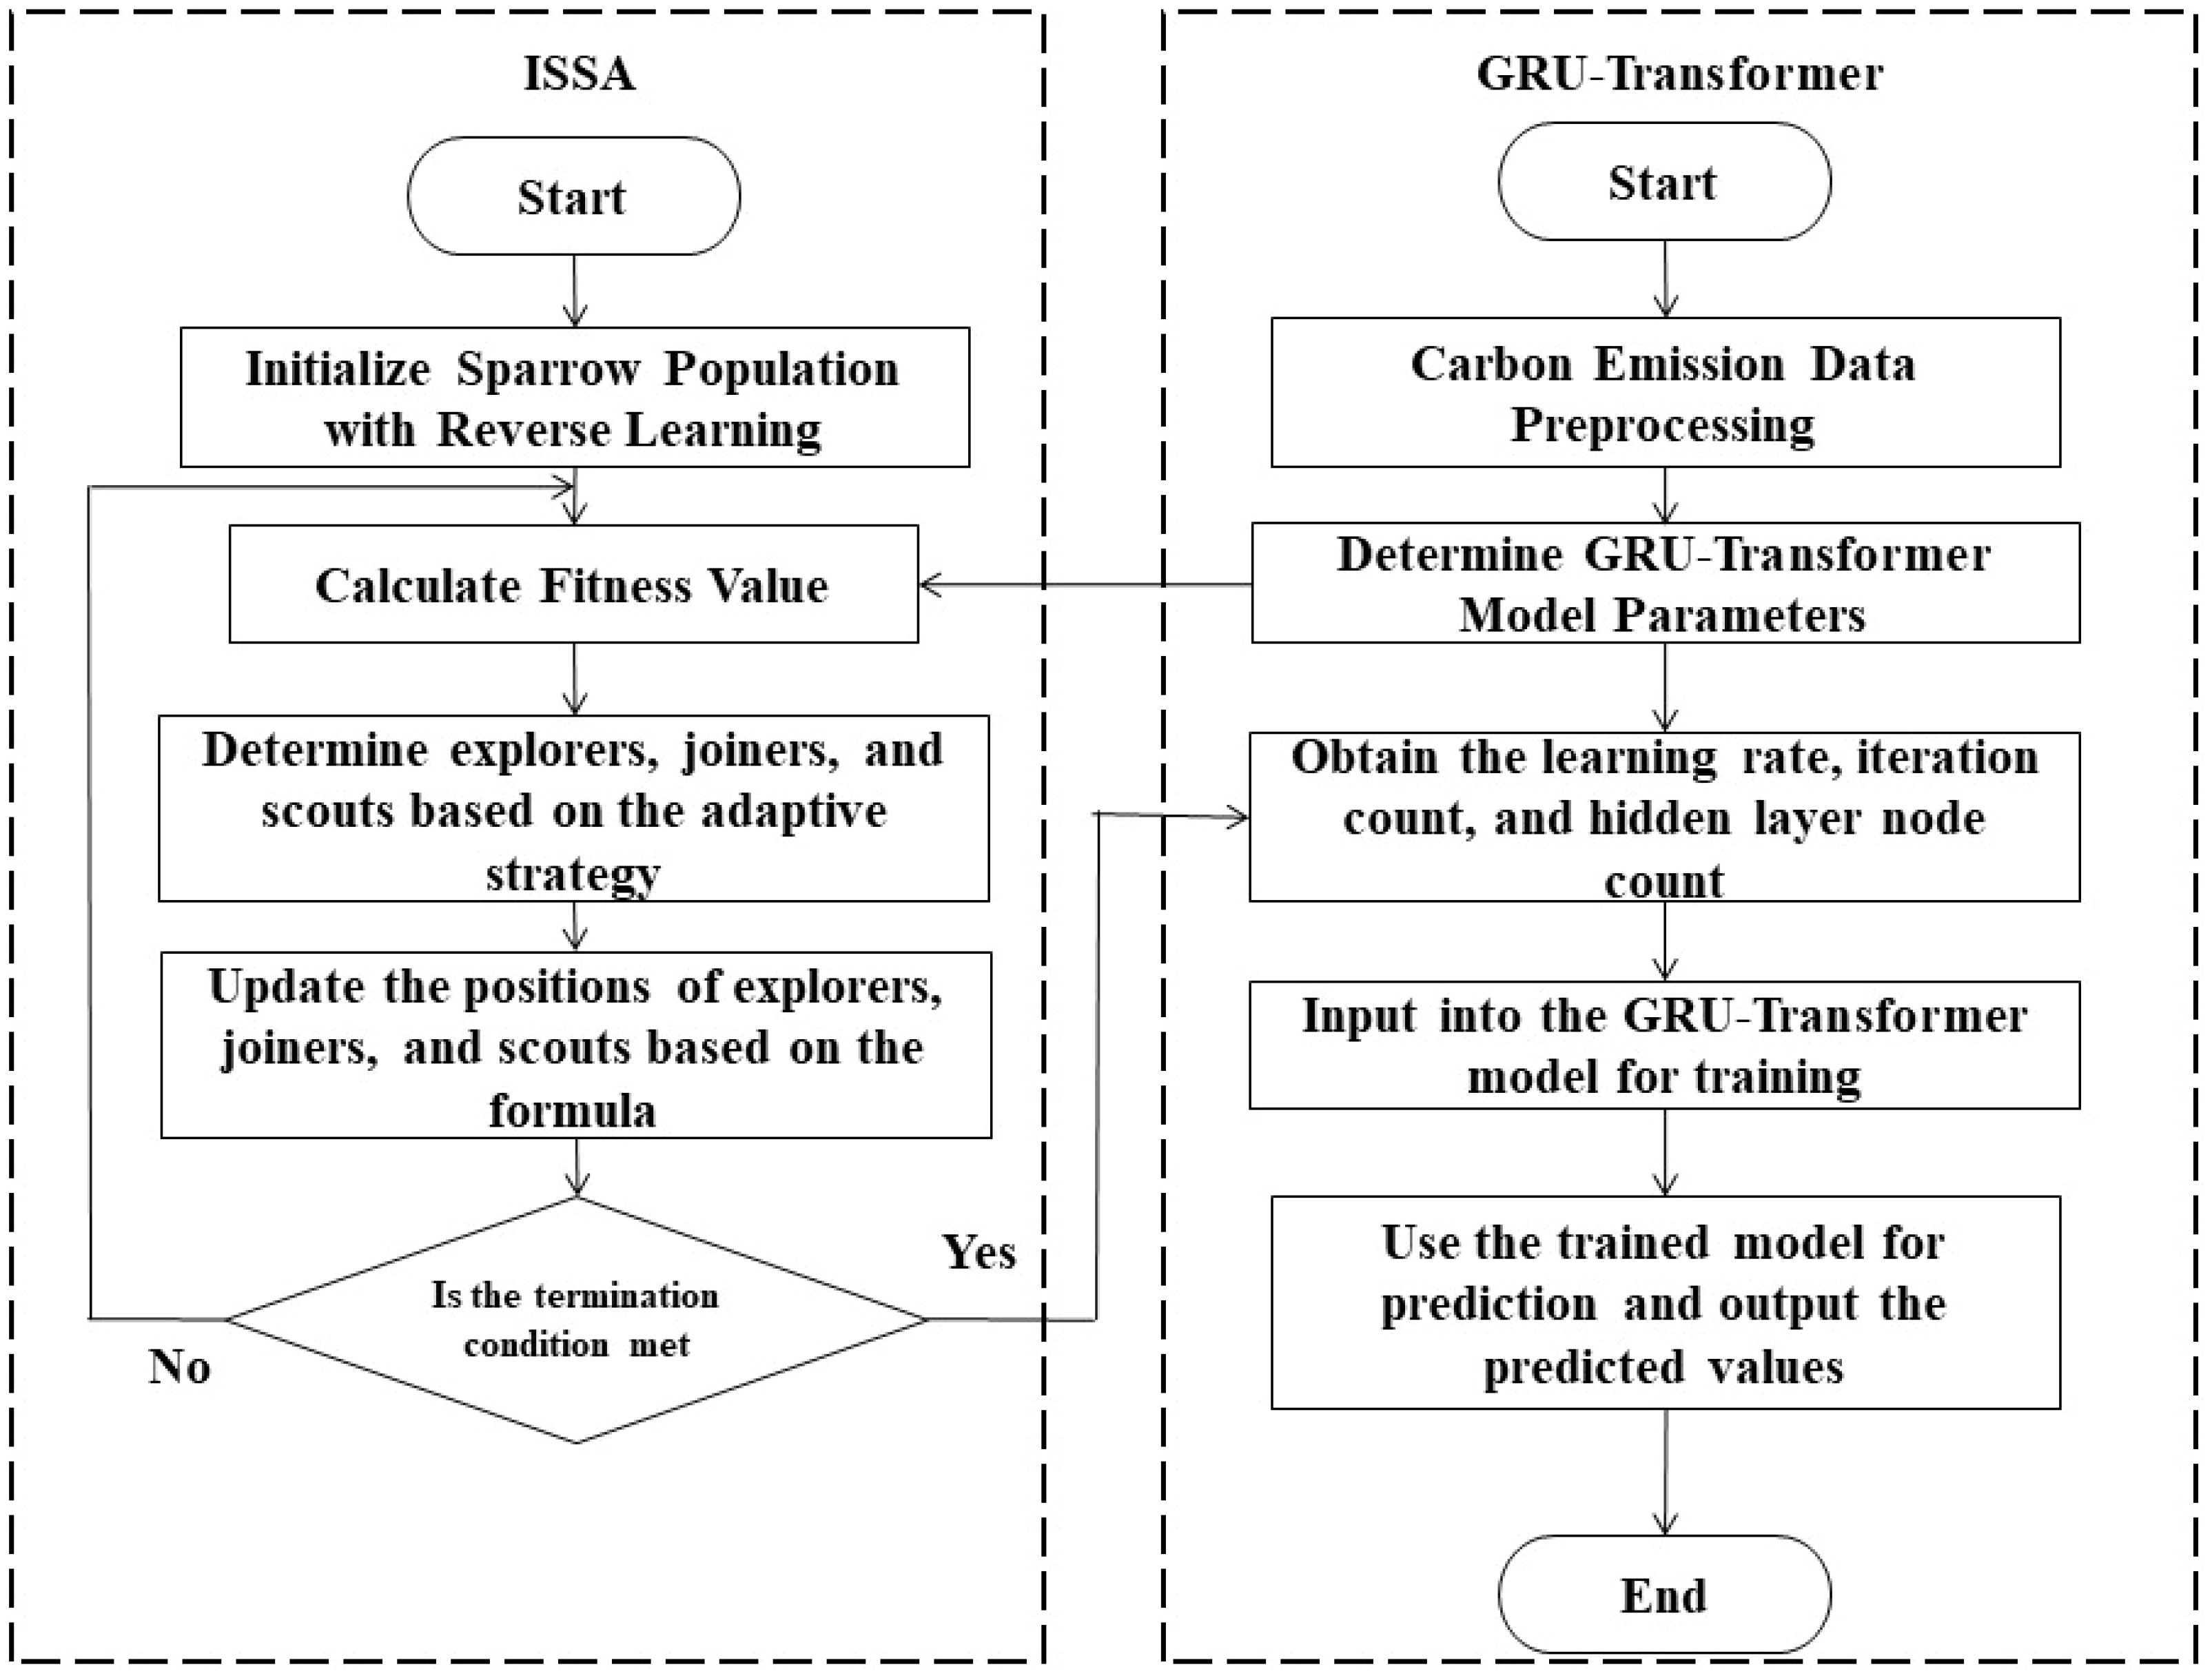
Figure 1 Overall flow chart of the model.
2.1 GRU-Transformer model
The GRU-Transformer model is a powerful deep learning architecture widely applied in domains such as time series forecasting and natural language processing (Chen et al., 2022). As shown in Figure 2, the overall structure of this model integrates both the GRU (Gated Recurrent Unit) network and the Transformer network to efficiently model sequences and extract features. The roles and structures of the GRU network and the Transformer network within this model will be separately explained below.
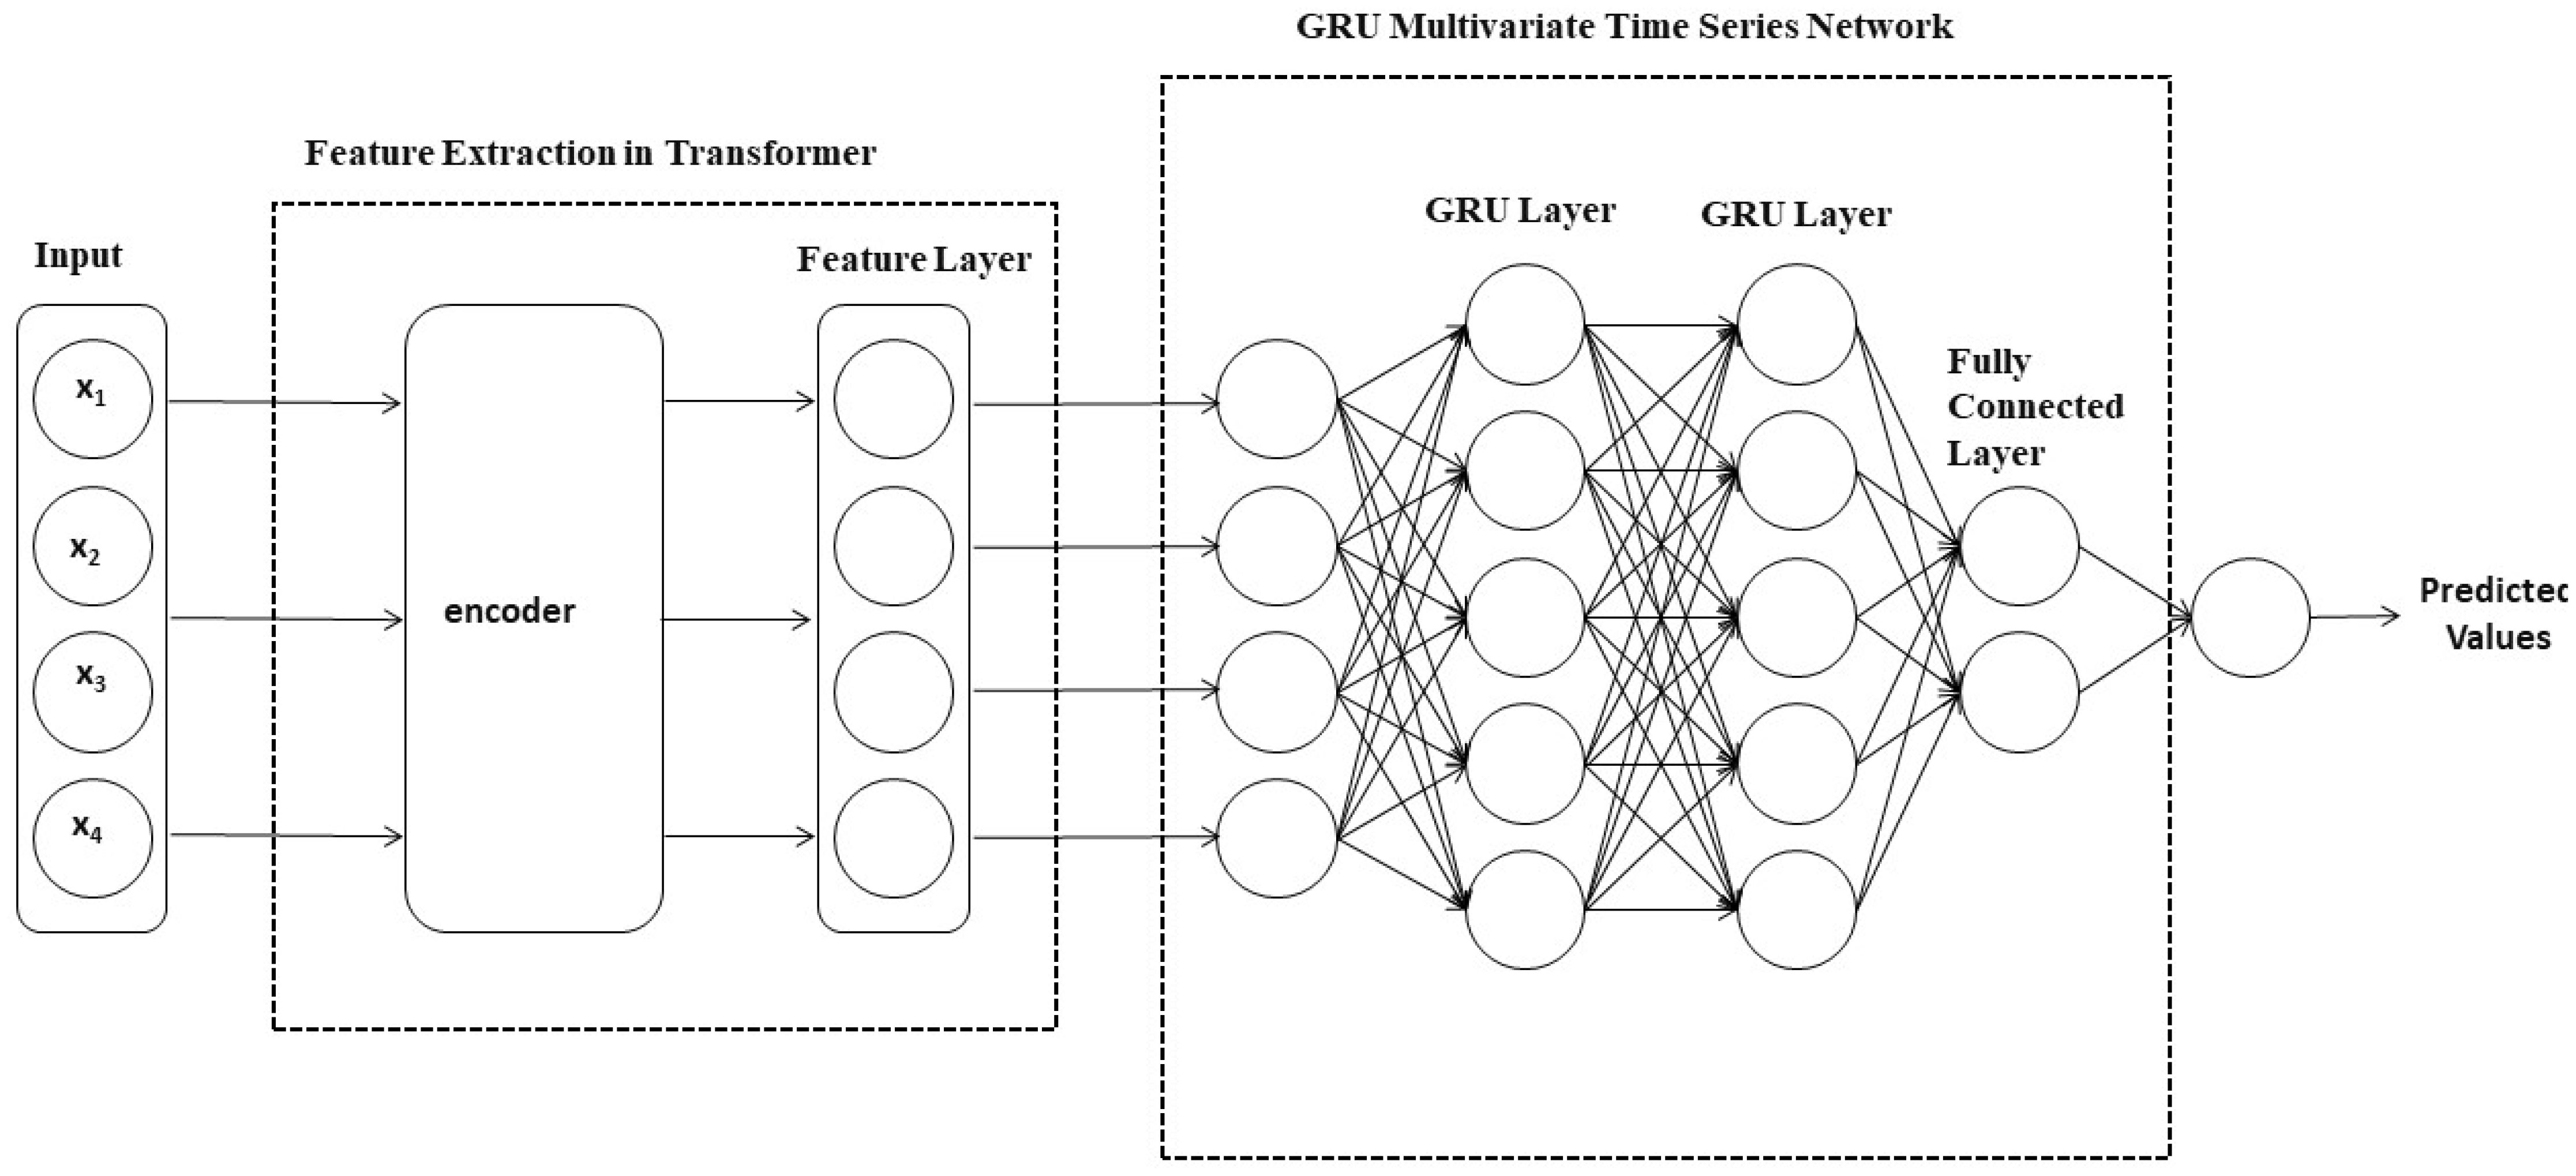
Figure 2 Flow chart of the GRU-Transformer model.
2.1.1 GRU model
GRU (Gated Recurrent Unit) is a variant of recurrent neural networks (RNNs) known for its strong sequence modeling capabilities (Lv et al., 2023; Yang et al., 2022). In the GRU-Transformer model, the GRU network plays a crucial role in handling short-term dependencies within sequential data. As shown in Figure 3, it introduces essential mechanisms, including update gates and reset gates, to effectively control information flow while mitigating the common gradient vanishing issue associated with standard RNNs. The update gate is represented by a sigmoid activation function and selectively determines which information from the previous time step should be propagated to the current time step. Similarly, the reset gate, also controlled by a sigmoid function, determines which information should be discarded (Liu et al., 2023). These gates collaborate to capture and propagate relevant temporal patterns, making the GRU network adept at understanding dynamic changes and patterns in the data, particularly suitable for time series analysis. Below are the key reasoning steps for GRU:
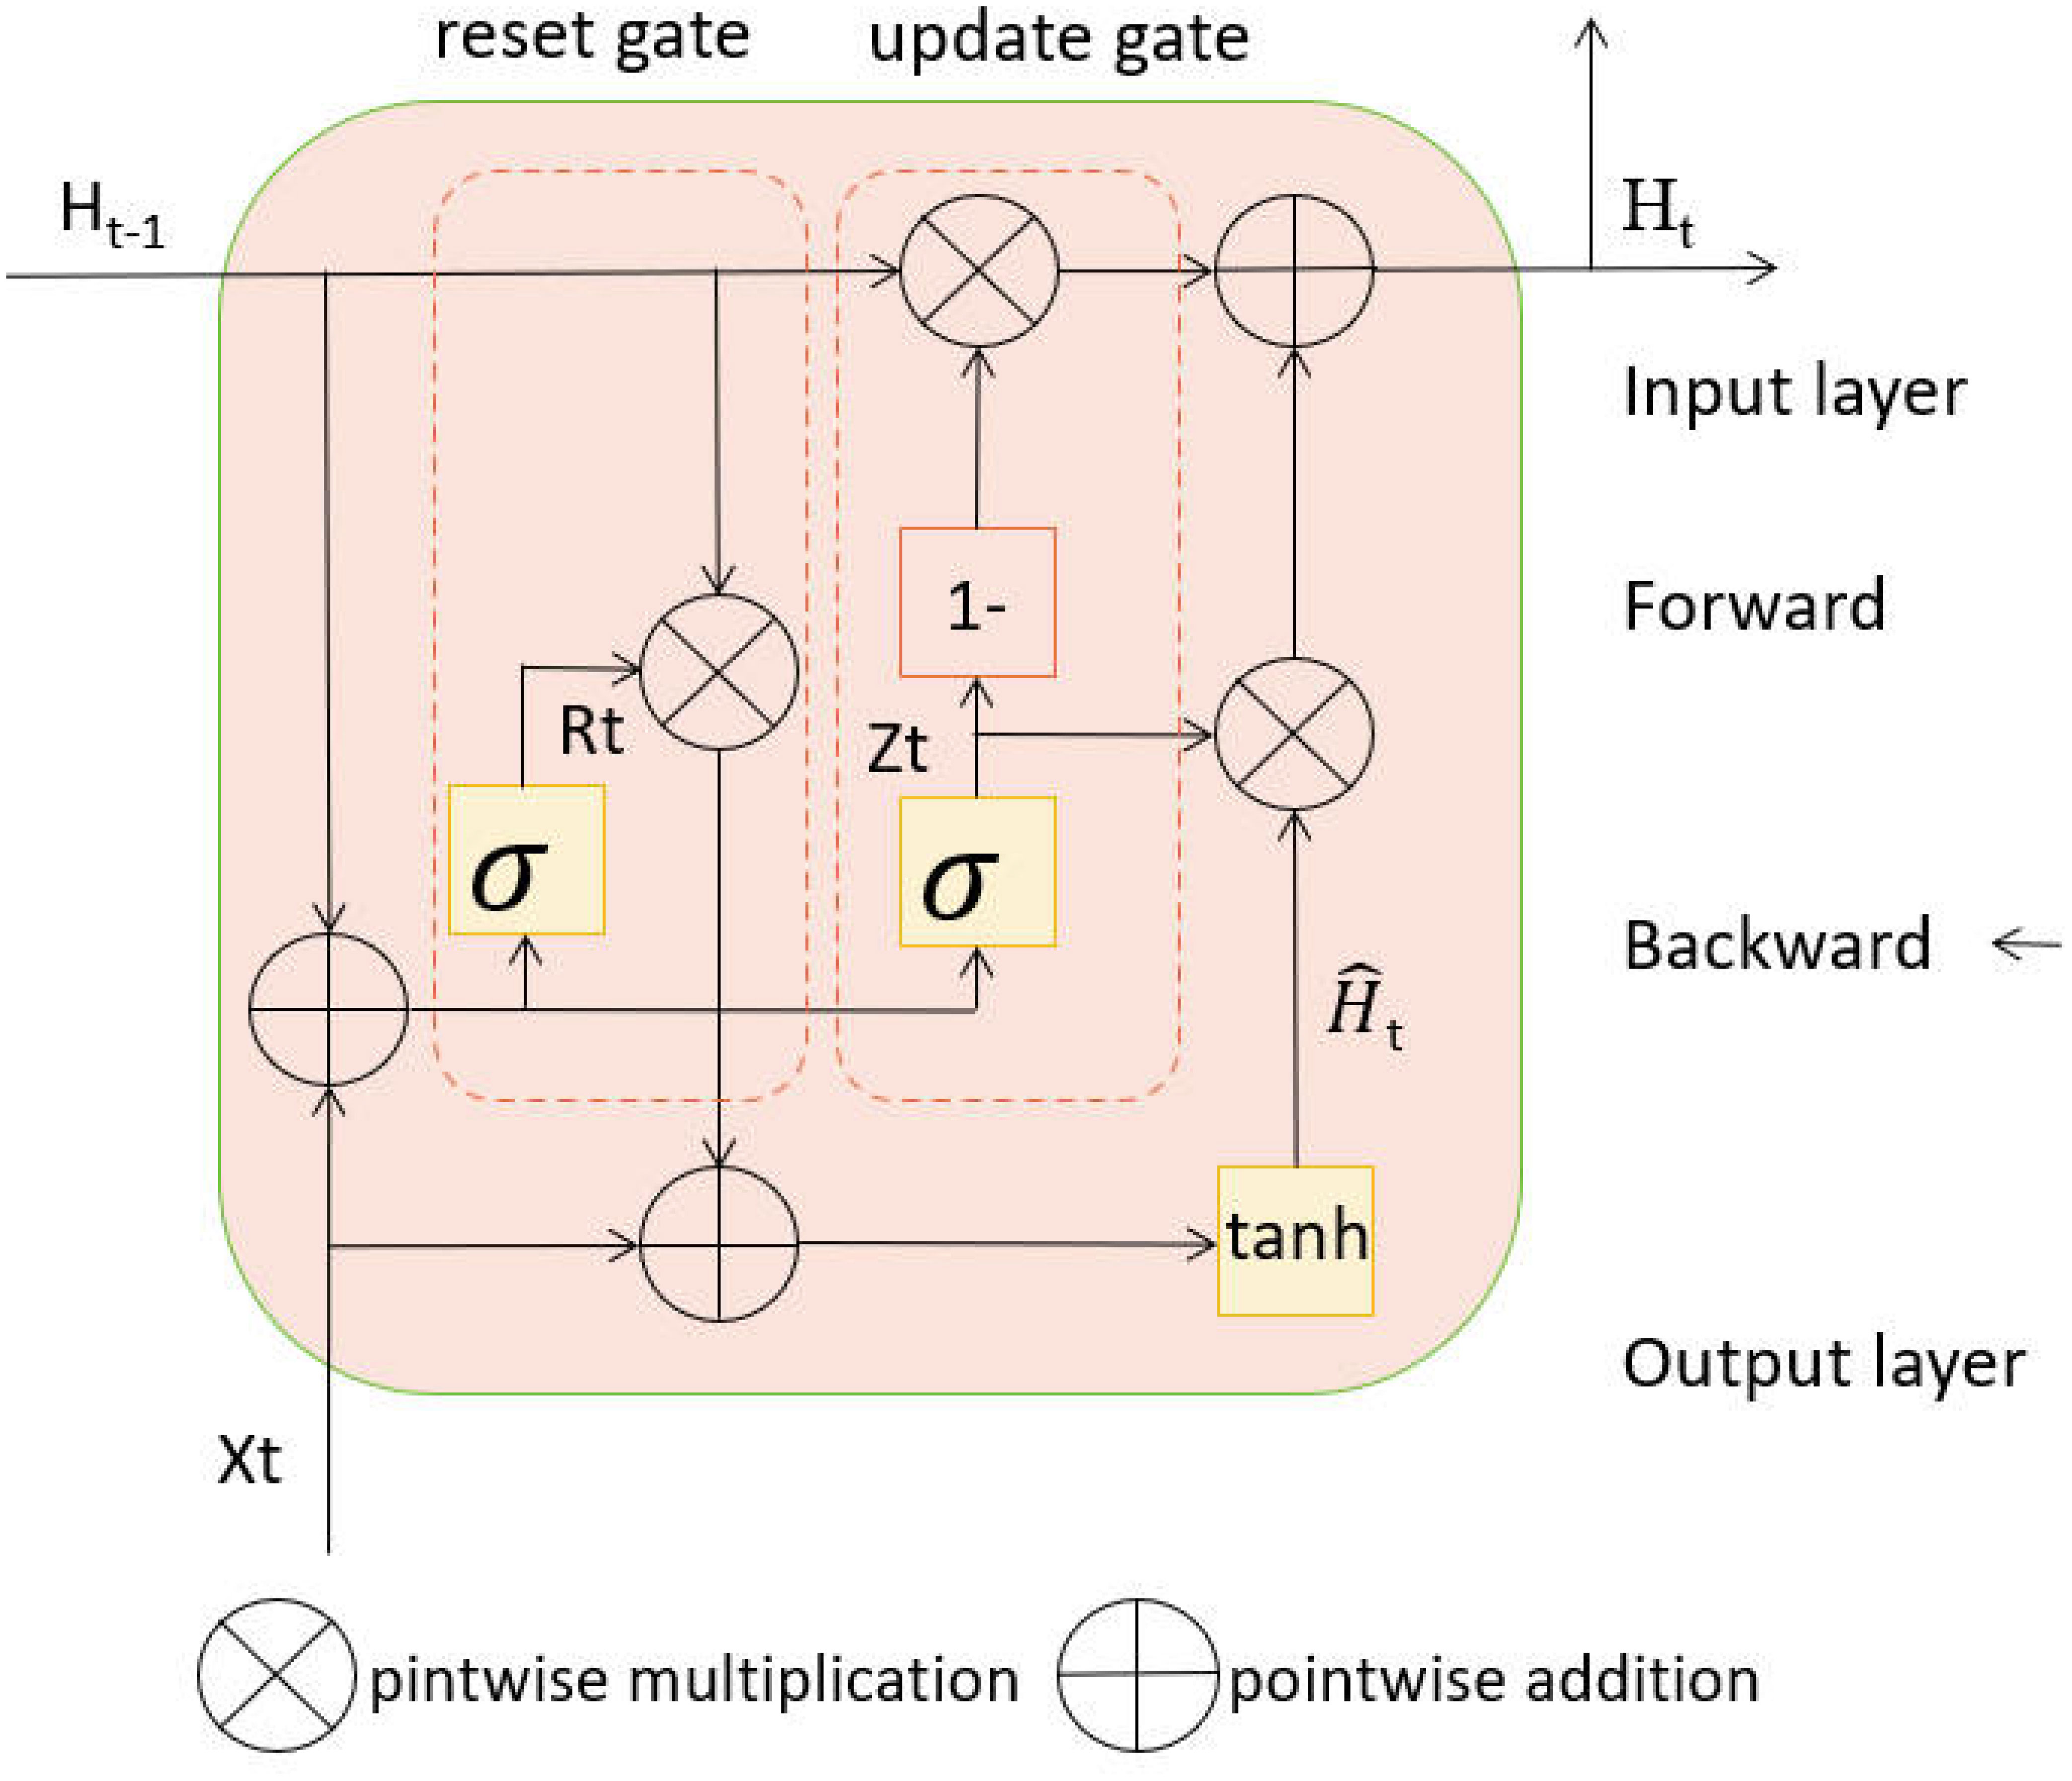
Figure 3 Flow chart of the GRU model.
Equation (1) can be used to quantify and assess the extent to which carbon-neutral actions taken at each time step contribute to the reduction of greenhouse gas emissions. This can help the sport community to develop more effective carbon neutral strategies to reduce the impact of sport on climate change.
where: zt: Output of the Update Gate. σ: Sigmoid activation function. Wz: Weight matrix of the Update Gate. ht−1: Previous time step’s hidden state. xt: Input at the current time step.
Equation (2) is a GRU update rule. It works by updating the hidden state of the current time step based on the hidden state of the previous time step and the inputs of the current time step, thus enabling modelling and prediction of sequence data. For example, time series data is used in sports to predict the performance of athletes. By collecting athletes' training, physical state, game results, etc., and then using recurrent neural networks to learn the patterns and trends of these data, the performance of the athlete at future time steps can eventually be predicted.
where: rt: Output of the Reset Gate. σ: Sigmoid activation function. Wr: Weight matrix of the Reset Gate. ht−1: Previous time step’s hidden state. xt: Input at the current time step.
Equation (3) allows us to better understand and assess the impact of actions taken in carbon neutral and sport on reducing carbon emissions and promoting sustainable development.
where: : Candidate hidden state. tanh: Hyperbolic tangent activation function. W: Weight matrix used to calculate the candidate hidden state. rt: Output of the Reset Gate. ht−1: Previous time step’s hidden state. xt: Input at the current time step.
In the field of carbon neutrality and sport, Equation (4) is more effective in updating and maintaining the state of the model, leading to a better understanding and assessment of the impact of different actions on carbon emissions and sport performance.
where: ht: Current time step’s hidden state. zt: Output of the Update Gate. : Candidate hidden state. ht−1: Previous time step’s hidden state.
2.1.2 Transformer model
The Transformer is a neural network architecture based on self-attention mechanisms, particularly adept at handling long-range dependencies and parallelized computation (Oyando et al., 2023; Zhang et al., 2023). In the GRU-Transformer model, the Transformer network is employed to extract long-term dependencies and global associations within sequence data. Its encoder layers enable the model to autonomously learn crucial relationships between different time steps within the sequence, without relying on traditional sliding window approaches. As illustrated in Figure 4, the Transformer’s self-attention mechanism assists the model in adaptively focusing on critical features, thereby enhancing sequence modeling performance.
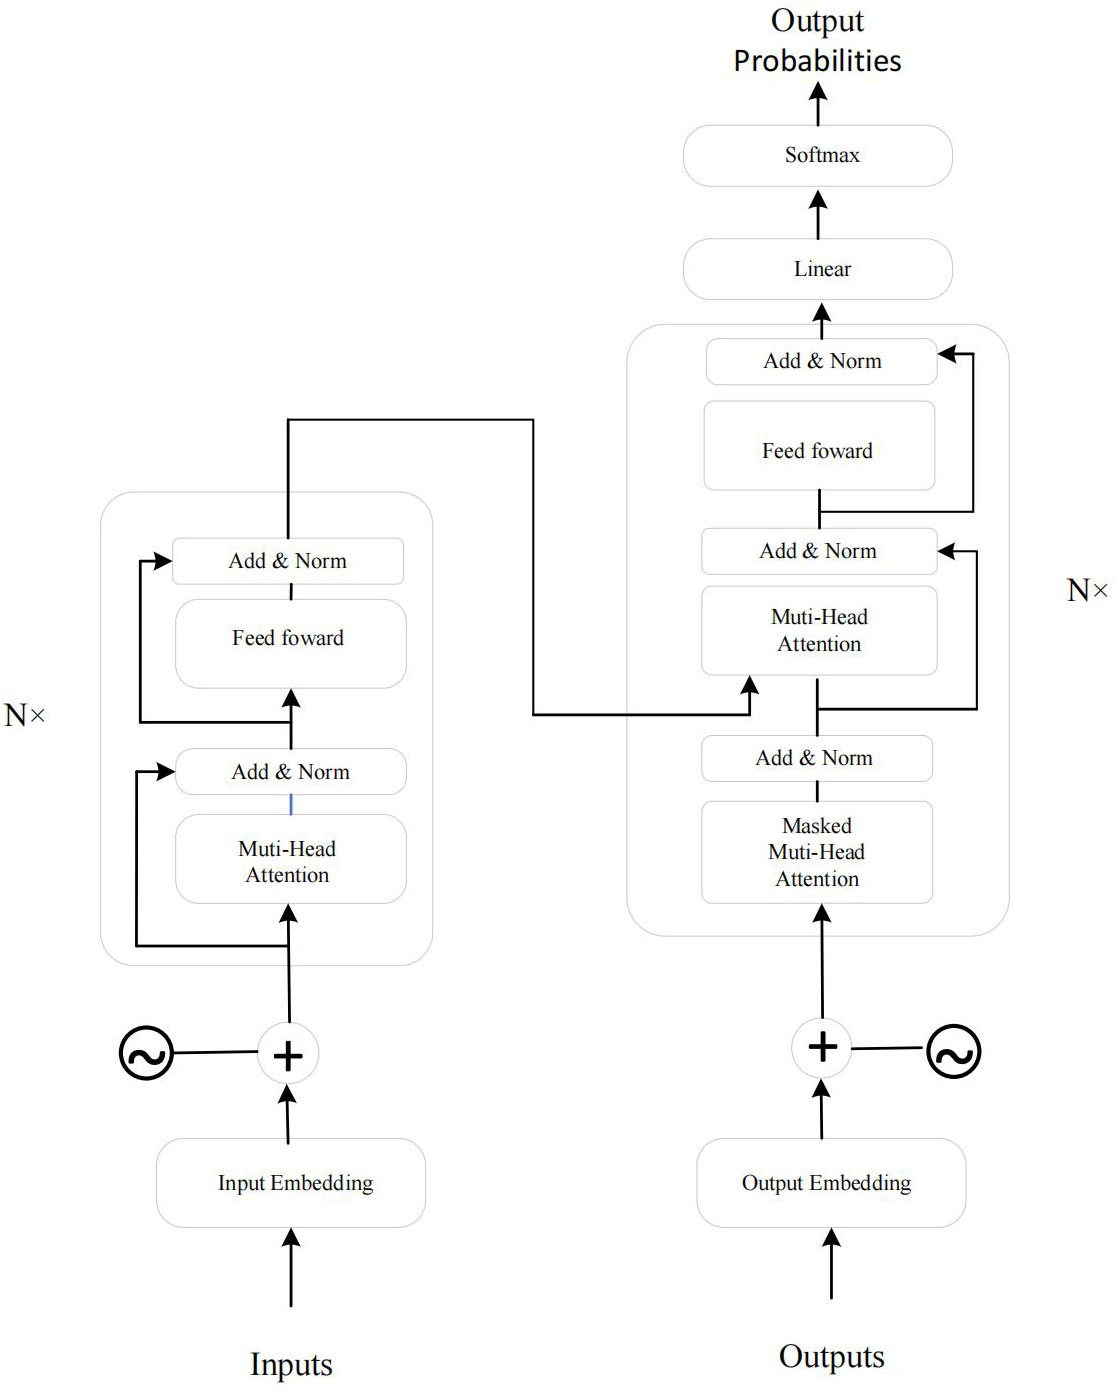
Figure 4 The Transformer model architecture. Left: Encoder with N = 6 identical layers, each containing two sub-layers - a multi-head self-attention mechanism and a position-wise fully connected feed-forward network. Right: Decoder with N = 6 identical layers, including the two sub-layers from each encoder layer and an additional sub-layer performing multi-head attention over the encoder stack’s output.
Here, we introduce the key mathematical principles of the Transformer model:
Equation (5) represents the Multi-Head Attention mechanism, which is an extension of the Self-Attention mechanism for learning the dependencies between positions in an input sequence. We can apply the Multi-Head Attention mechanism to the need or concern for carbon neutral and sports related information.
where: MultiHead(Q,K,V): Output of multi-head attention. headi: Individual attention head. WO: Weight matrix for the output projection.
In Equation (6), PositionwiseFFN(x): Output of the position-wise feed-forward network. W1, b1, W2, b2: Weight matrices and bias terms.
In Equation (7), LayerNorm(x): Layer normalization of x. µ: Mean of x. σ: Standard deviation of x.
2.2 ISSA
Nature inspires solutions to complex problems, with collective behaviors in bird flocks and insect swarms offering valuable insights. The Sparrow Search Algorithm (SSA), inspired by sparrow foraging patterns, addresses optimization challenges. However, SSA’s limited communication among group members hinders solution quality. In this paper, we enhance SSA by introducing reverse learning, Levy flight, and adaptive learning strategies to improve convergence speed and solution quality.
2.2.1 Levy flight strategy
By employing the Levy flight strategy to update individual parameters in the formula, we enhance the algorithm’s global optimization capabilities, thus preventing the Sparrow Search Algorithm from getting trapped in local optima.
In Equations (8–10) γ represents the gamma function, and τ is a hyperparameter, which is set to 1 in this paper. δ and v follow normal distributions N(0,σ2) and N(0,1), respectively. Here, m represents a random number, and s represents the step size, which is set to 0.001. Pbest,j denotes the value of the globally best position in dimension j from the previous iteration.
2.2.2 Adaptive learning strategy
During the SSA search process, some individuals in the population may become trapped in local optima, and their positions remain unchanged over several consecutive iterations (Sun et al., 2022). These individuals are considered to lack search capability and should be updated in subsequent search processes to enhance convergence speed and accuracy. We have improved SSA using the Equation (11):
where: f(Xi) represents the objective function of the minimization problem. When a sparrow’s fitness is greater than 0.9, it will be considered as a discoverer. When the sparrow’s fitness value is greater than 0.7 and less than 0.9, the sparrow will be considered as a joiner. It will immediately leave its current position and approach the best discoverer. When the sparrow’s fitness value is less than 0.7, the sparrow will become a joiner but will not approach the best discoverer.
3 Experiment
3.1 Datasets
To comprehensively validate our model, this experiment utilizes four distinct datasets: MLCO2 dataset, GCA dataset, GHGI dataset, and CCKP dataset.
MLCO2 (Mauna Loa Carbon Dioxide): This dataset is based on atmospheric carbon dioxide concentration data collected at the Mauna Loa Observatory in Hawaii and is one of the crucial datasets in climate science. It records global atmospheric carbon dioxide concentrations since 1958, making it widely used for researching climate change and greenhouse gas emissions (Tveter, 2020).
GCA (Global Carbon Atlas): The GCA is a comprehensive global carbon dataset that provides detailed information on global carbon dioxide emissions and absorption. It includes carbon emission data from various sources, including energy production, transportation, industry, and land-use changes (Franzen and Mader, 2019).
GHGI (Greenhouse Gas Inventory): GHGI is an international greenhouse gas inventory compiled and published by governments and international organizations. It encompasses various greenhouse gas emission data, such as carbon dioxide, methane, and nitrous oxide, categorized by sources and industries (Shi et al., 2021).
CCKP (Climate Change Knowledge Portal): The CCKP is a data platform provided by the World Bank, which aggregates various data related to climate change, greenhouse gas emissions, and adaptation measures. It includes data from various countries, covering climate indicators, risk assessments, and adaptability data (Leal Filho et al., 2023).
3.2 Experimental environment
This article’s experimental platform server configuration is shown in Table 1.
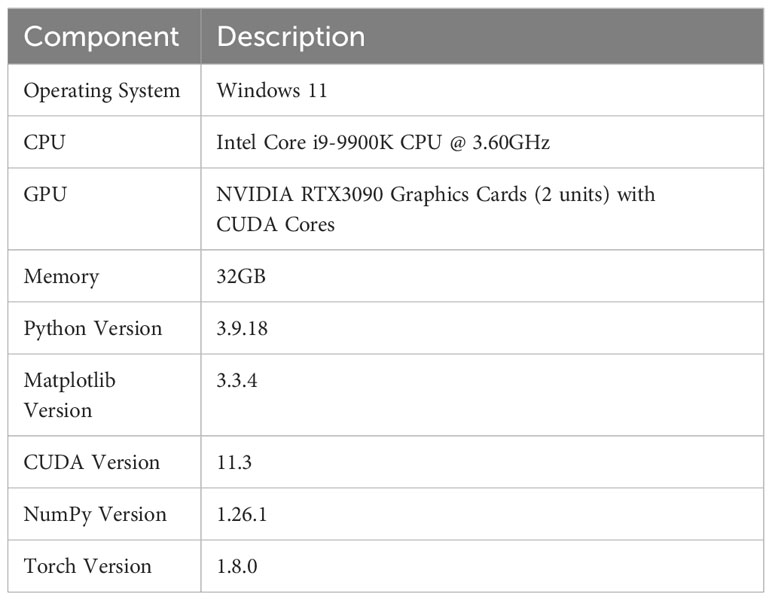
Table 1 Experiment environment.
3.3 Experimental details
3.3.1 Step 1: Data preprocessing
● Data Cleaning: In this step, we thoroughly cleaned the raw data. Regarding the handling of missing values, if the missing values in a column exceed 10%, we choose to remove the entire column; otherwise, we fill the missing values with the mean of that column.
● Data Standardization: To ensure data consistency and comparability, we standardized all data features. This involves transforming numerical features into a form with a mean of 0 and a standard deviation of 1. This process helps eliminate scale-related issues that may arise during the modeling process.
● The dataset is divided into three subsets: the training set, validation set, and test set. Specifically, approximately 70% of the data sample is allocated to the training set, 15% to the validation set, and the remaining 15% to the test set. After removing missing data, the final dataset selection resulted in 63,788 data samples for the MLCO2 dataset, 72,345 for the GCA dataset, 56,920 for the GHGI dataset, and 67,213 for the CCKP dataset. The specific dataset distribution is shown in Table 2:
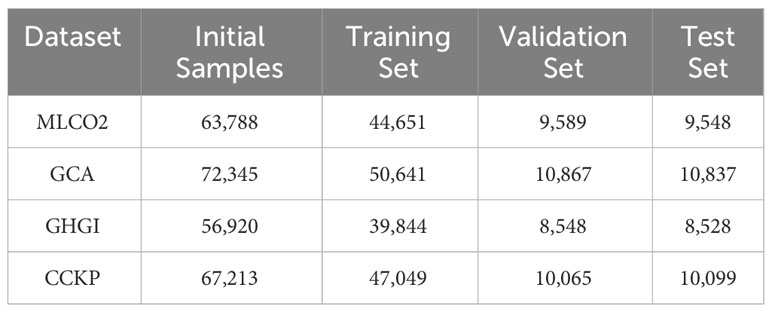
Table 2 Dataset splitting.
3.3.2 Step 2: Model training
● Begin by preprocessing the carbon emission data and feeding it into the GRU-Transformer prediction model. Set the model’s input layer nodes, output layer nodes, and other parameters that don’t require optimization via ISSA in advance. Determine key parameters for the ISSA model, such as the maximum iteration count (epoch), dimension (d), threshold (ST), and warning value (R2).
● Apply the ISSA algorithm to optimize hyperparameters within the GRU-Transformer prediction model, including learning rate, batch size, and hidden layer node count. Calculate the fitness of each sparrow and subsequently update their best positions. Inject these optimized hyperparameters into the GRUTransformer prediction model, compute corresponding fitness values, and assess whether there is a need to update the best positions. The algorithm will terminate if the best positions are achieved; otherwise, new positions will replace the best.
● Input the finely tuned hyperparameters, obtained through ISSA optimization, into the GRU-Transformer prediction model for forecasting. Evaluate the model’s performance by comparing errors between actual and predicted values.
3.3.3 Step 3: Model evaluation
● Model Performance Metrics: In this step, the evaluation of the developed model is conducted through the application of various performance metrics. These metrics include but are not limited to Mean Absolute Error (MAE), Root Mean Square Error (RMSE), Mean Absolute Percentage Error (MAPE), and R-squared (R2) statistics. These metrics provide a comprehensive overview of how well the model performs in predicting carbon emissions. The chosen metrics help in assessing the accuracy, precision, and reliability of the model’s predictions.
● Cross-Validation: Cross-validation is an essential technique employed to validate the model’s performance and assess its generalization capabilities. In this step, the dataset is divided into multiple subsets or folds. The model is trained on a portion of the data and tested on another. This process is repeated multiple times, with different subsets serving as both training and testing data. The results from each iteration are then averaged to provide a more robust evaluation of the model’s performance. Cross-validation helps to mitigate overfitting and ensures that the model can make accurate predictions on unseen data, enhancing its reliability and applicability.
Below, we will introduce the evaluation metrics used in this study:
Equation (12): Root Mean Squared Error (RMSE):
where: n is the number of observations. yi is the actual value. is the predicted value.
Equation (13): Symmetric Mean Absolute Percentage Error (SMAPE):
where: n is the number of observations. yi is the actual value. is the predicted value.
Equation (14): Coefficient of Determination (R-squared, R2):
where: n is the number of observations. yi is the actual value. is the predicted value. is the mean of the actual values.
Equation (15): Mean Absolute Error (MAE):
where: n is the number of observations. yi is the actual value. is the predicted value.
Equation (16): Mean Absolute Percentage Error (MAPE):
where: n is the number of observations. yi is the actual value. is the predicted value.
3.4 Experimental results and analysis
Table 3 provides a comprehensive comparison of various models on the MLCO2, GCA, GHGI, and CCKP datasets across different performance indicators. Among all evaluated models, our approach consistently outperforms others across multiple metrics. Specifically, on the MLCO2, GCA, GHGI, and CCKP datasets, our model demonstrates significant advantages in terms of RMSE, MAE, SMAPE, and R2. In comparison to competing models such as BIGRU-Transformer, GRU-Transformer, CNN-GRU, Attention-GRU, SSAGRU-Transformer, and SSA-CNN-GRU, our approach achieves lower RMSE and MAE values, as well as higher R2 scores. This underscores the universality and reliability of our method, indicating that our model exhibits higher accuracy and reliability in carbon-related prediction tasks.
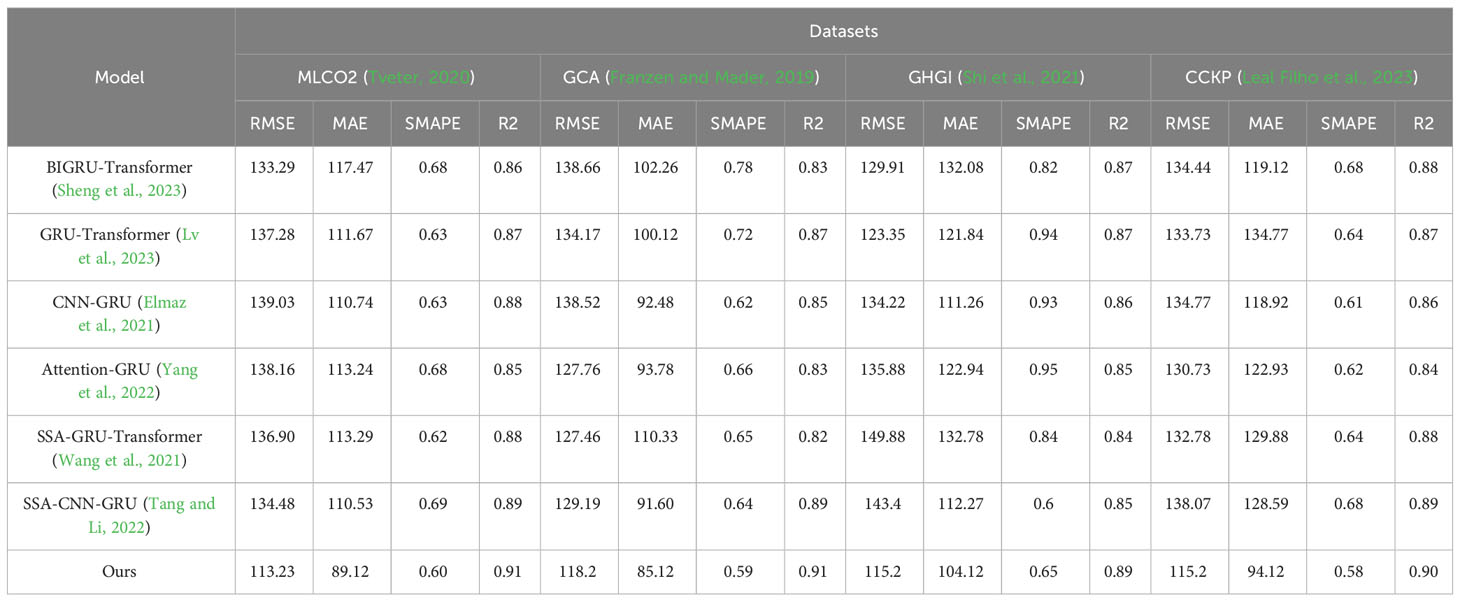
Table 3 Comparison of different models in different indicators comes from the MLCO2 dataset, GCA dataset, GHGI dataset, and CCKP dataset.
As shown in Table 4, we conducted a detailed comparison of performance metrics for different models on multiple datasets. Specifically, our model outperforms competitors consistently in terms of parameter count and computational complexity on MLCO2, GCA, GHGI, and CCKP datasets. For instance, on the MLCO2 dataset, our model exhibits a significant advantage, with only 416.45 million parameters and a computational complexity of 55.28 billion floating-point operations (Flops), much lower than other models.
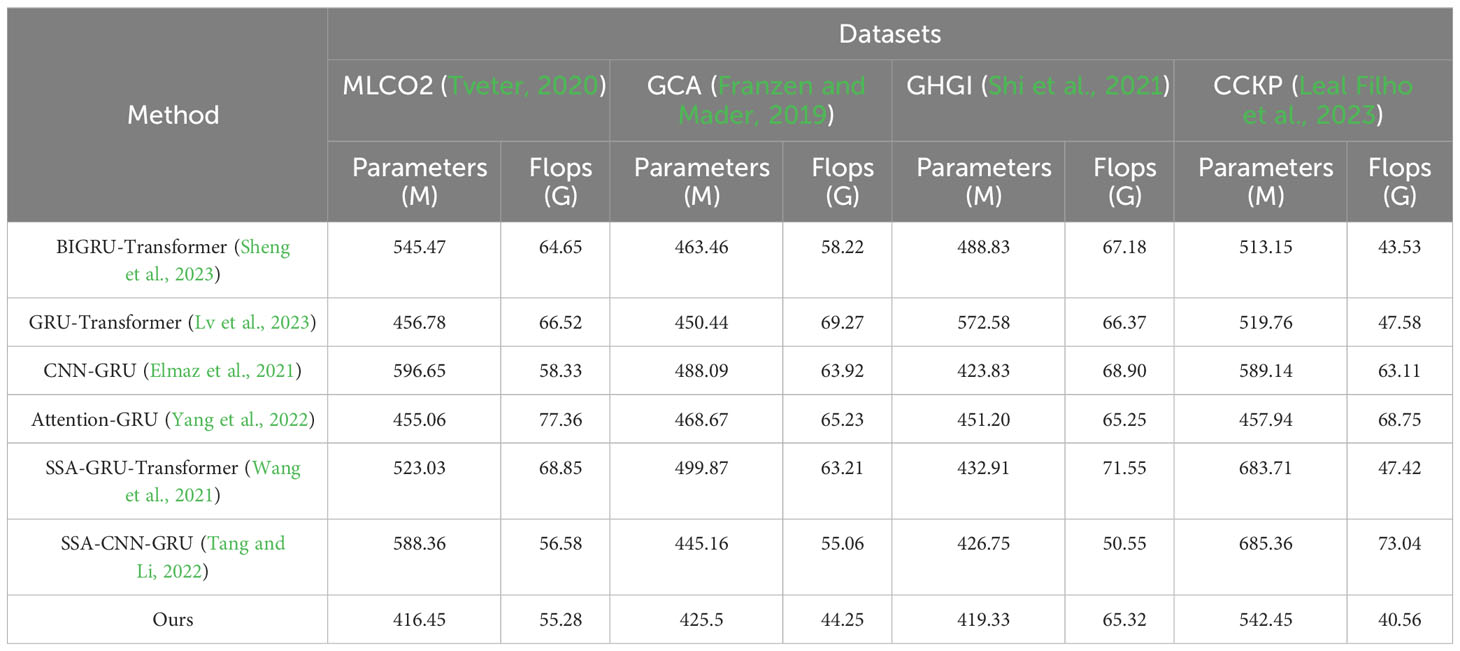
Table 4 The comparison of different models in different indicators comes from the MLCO2 dataset, GCA dataset, GHGI dataset, and CCKP dataset.
The design of our model structure takes into account the characteristics of the tasks it handles. Through the customization of the GRU-Transformer, we targetedly simplified the model structure, retaining only the essential components for the task and avoiding unnecessary complexity. Our model exclusively utilizes the encoder part of the Transformer structure, omitting the decoder. Since the decoder, in sequence generation, needs to consider previously generated parts, it is typically more complex than the encoder. Omitting the decoder contributes to reducing computational complexity, enhancing inference speed, especially in scenarios where inference efficiency is crucial. We implemented the Information Separation and Self-Attention (ISSA) mechanism to achieve effective fusion of information. This mechanism maintains model performance while more efficiently processing information, reducing the amount of information representation required in the parameter space. This method of information fusion contributes to lowering the model’s parameter count.
3.5 Ablation experiments
In Table 5, we conducted experiments by removing the ISSA module to validate its effectiveness. For instance, on the MLCO2 dataset, our model outperformed SSA, PSO, QPSO, and WOA in terms of RMSE. Specifically, our model achieved a reduction of approximately 10.16 in RMSE compared to SSA, about 13.05 compared to PSO, roughly 11.1 compared to QPSO, and approximately 15.93 compared to WOA. Similarly, on the GCA, GHGI, and CCKP datasets, our model demonstrated superior performance in various performance metrics.
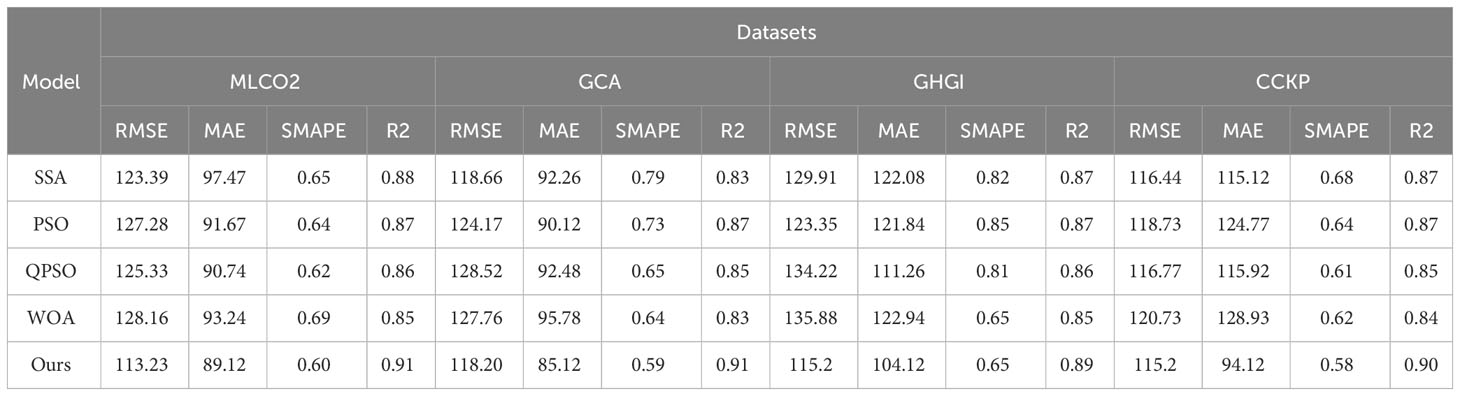
Table 5 Ablation experiments on the ISSA module come from the MLCO2 dataset, GCA dataset, GHGI dataset, and CCKP dataset.
The main reason for this significant performance advantage lies in the introduction of the Levy Flight strategy by ISSA. By employing a random step-length movement, ISSA enables the algorithm to explore the search space more extensively. Compared to SSA, PSO, QPSO, and WOA, ISSA possesses enhanced global search capabilities, effectively avoiding being trapped in local optima. Furthermore, ISSA enhances inter-individual information interaction and integration through information separation and self-attention mechanisms. Compared to other algorithms, ISSA maximizes the utilization of internal information within the group, thereby improving the algorithm’s adaptability to complex problems. On the other hand, ISSA introduces an adaptive learning strategy, facilitating timely updates for individuals trapped in local optima to accelerate convergence speed. Compared to other methods, ISSA demonstrates dynamic individual adjustment capabilities, enhancing the accuracy of solutions. These series of experimental results indicate that the introduction of the ISSA module has a significantly positive impact on algorithm performance, showcasing outstanding performance across multiple datasets.
In Table 6, we conducted further experiments involving the removal of the GRU module, revealing significant advantages of our GRU model over competing models (LSTM, BILSTM, RNN, BIGRU) across four datasets (MLCO2, GCA, GHGI, CCKP) in terms of RMSE, MAE, SMAPE, and R2. For instance, on the MLCO2 dataset, our GRU model demonstrated outstanding performance in RMSE. Compared to LSTM, BILSTM, RNN, and BIGRU, our model achieved reductions of approximately 20.08, 13.97, 22.1, and 15.93, respectively.
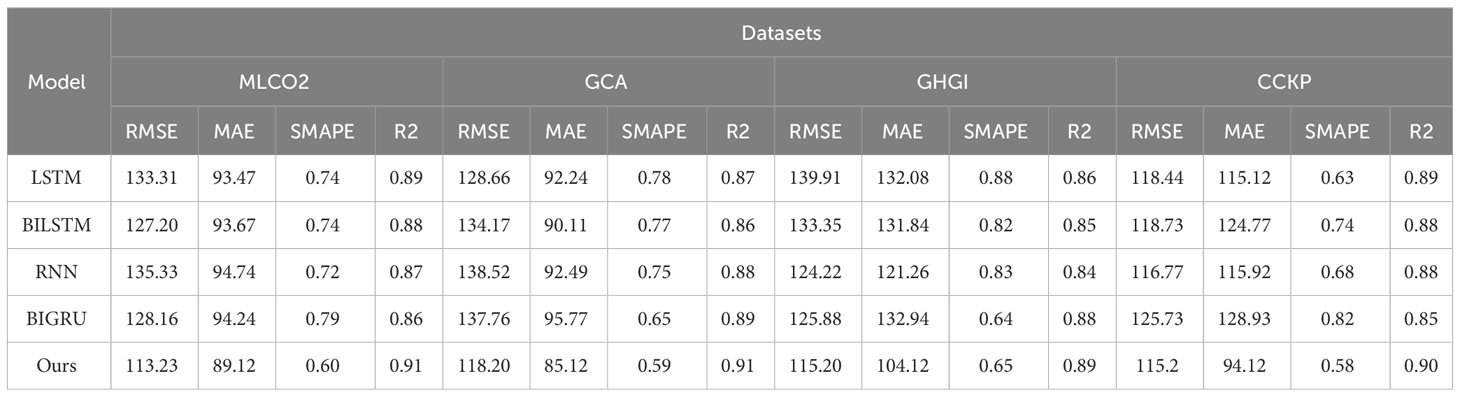
Table 6 Ablation experiments on the GRU module come from the MLCO2 dataset, GCA dataset, GHGI dataset, and CCKP dataset.
This notable performance advantage can be attributed to the relatively lightweight design of the GRU module, featuring fewer parameters and higher computational efficiency. The gate mechanism in the GRU module provides increased flexibility, enabling better capture of long-term dependencies in sequences and consequently enhancing sequence modeling performance. Additionally, the GRU module’s efficient information processing contributes to improved learning and representation of sequence features. Finally, the design of the GRU module facilitates the capturing of patterns in the data during the training process, enhancing the model’s generalization performance. The effective modeling of sequential data by our GRU model enables more accurate predictions across multiple datasets.
4 Conclusion
In this study, we proposed an approach based on the combination of ISSA and GRU-Transformer models for time series prediction in the field of carbon neutrality. Through experiments, we conducted a thorough evaluation of the model on multiple datasets and compared its performance with competing models. The experimental results show that our model excels in various performance metrics, including lower RMSE and MAE values, as well as higher R2 scores. This indicates the potential and application prospects of our model in the carbon neutrality domain.
Despite achieving satisfactory results in time series prediction tasks, there are still some shortcomings in our model. Firstly, the robustness of our model in handling extreme cases needs improvement. In certain situations, such as sudden events or anomalies, the model’s performance may degrade. Secondly, the training and optimization of the model still require significant computational resources and time, limiting its scalability and applicability. Therefore, future work needs to address these issues, further enhance the model’s robustness, and optimize the training and tuning processes to make it more practical and scalable.
Looking ahead, carbon neutrality remains a crucial strategy in addressing global climate change. Our research provides a novel deep learning-based time series prediction method for the carbon neutrality domain, offering a powerful tool for better understanding and optimizing carbon neutrality measures. Future work can explore further applications of the model, including monitoring and management of carbon emissions sources, improvements in carbon capture and storage technologies, and optimization of carbon offset projects, among others. Additionally, further research and performance enhancements can be pursued to meet the requirements of different fields and applications. The combination model based on ISSA and GRU-Transformer presented in this study offers a new approach to time series prediction in the carbon neutrality domain, achieving a series of encouraging results. Despite the challenges and limitations, this research lays a solid foundation for future exploration and innovation in the carbon neutrality field, promising to provide more powerful tools and support for addressing global climate change issues.
Data availability statement
The original contributions presented in the study are included in the article/supplementary material. Further inquiries can be directed to the corresponding authors.
Author contributions
WJ: Investigation, Writing – review & editing. CL: Conceptualization, Writing – review & editing. QQ: Methodology, Writing – review & editing. ZW: Formal Analysis, Writing – original draft. LH: Project administration, Writing – original draft. ZX: Project administration, Writing – review & editing. BZ: Resources, Writing – original draft. JH: Investigation, Methodology, Validation, Visualization, Writing – original draft, Writing – review & editing.
Funding
The author(s) declare financial support was received for the research, authorship, and/or publication of this article. Shaanxi Social Science Foundation Project, Research on the Construction and Operation Mechanism of the PPP Mode for Sports Events in Shaanxi Province (2020Q012). Xi’an Jiaotong University Basic Research Business Fee Special Research Project (Liberal exploration and independent innovation project in humanities and social sciences), A Study on the Related Factors and Intervention Measures for Students Who Fail to Meet the Physical Health Standards at Our School (SK2021032).
Acknowledgments
We sincerely appreciate the support and funding provided by the Shaanxi Social Science Fund Project and the Special Research Project on Basic Research Business Fees of Xi’an Jiaotong University. It is thanks to the generous support of these projects that we are able to engage in meaningful research and contribute to the development of relevant fields. Once again, we express our gratitude for the valuable support provided by these funds!
Conflict of interest
The authors declare that the research was conducted in the absence of any commercial or financial relationships that could be construed as a potential conflict of interest.
Publisher’s note
All claims expressed in this article are solely those of the authors and do not necessarily represent those of their affiliated organizations, or those of the publisher, the editors and the reviewers. Any product that may be evaluated in this article, or claim that may be made by its manufacturer, is not guaranteed or endorsed by the publisher.
References
Amasyali K., El-Gohary N. M. (2018). A review of data-driven building energy consumption prediction studies. Renewable Sustain. Energy Rev. 81, 1192–1205. doi: 10.1016/j.rser.2017.04.095
Chen Y., Chen X., Xu A., Sun Q., Peng X. (2022). A hybrid cnn-transformer model for ozone concentration prediction. Air Quality Atmosphere Health 15, 1533–1546. doi: 10.1007/s11869-022-01197-w
Elmaz F., Eyckerman R., Casteels W., Latre´ S., Hellinckx P. (2021). Cnn-lstm architecture for predictive indoor temperature modeling. Building Environ. 206, 108327. doi: 10.1016/j.buildenv.2021.108327
Feng H., Hu Y. J., Li C., Wang H. (2023). Rolling horizon optimisation strategy and initial carbon allowance allocation model to reduce carbon emissions in the power industry: Case of China. Energy 277, 127659. doi: 10.1016/j.energy.2023.127659
Franzen A., Mader S. (2019). Reply to the comment by zhang and fang (2019) on consumption-based versus production-based accounting of co2 emissions. SSRN 3496792. doi: 10.2139/ssrn.3496792
Keshavarzzadeh M., Zahedi R., Eskandarpanah R., Qezelbigloo S., Gitifar S., Farahani O. N., et al. (2023). Estimation of nox pollutants in a spark engine fueled by mixed methane and hydrogen using neural networks and genetic algorithm. Heliyon 9. doi: 10.1016/j.heliyon.2023.e15304
Leal Filho W., May J., May M., Nagy G. J. (2023). Climate change and malaria: some recent trends of malaria incidence rates and average annual temperature in selected sub-saharan african countries from 2000 to 2018. Malaria J. 22, 1–14. doi: 10.1186/s12936-023-04682-4
Liu B., Wang S., Liang X., Han Z. (2023). Carbon emission reduction prediction of new energy vehicles in China based on gra-bilstm model. Atmospheric pollut. Res. 14, 101865. doi: 10.1016/j.apr.2023.101865
Lv Z., Wang N., Lou R., Tian Y., Guizani M. (2023). Towards carbon neutrality: Prediction of wave energy based on improved gru in maritime transportation. Appl. Energy 331, 120394. doi: 10.1016/j.apenergy.2022.120394
Moshari A., Aslani A., Zolfaghari Z., Malekli M., Zahedi R. (2023). Forecasting and gap analysis of renewable energy integration in zero energy-carbon buildings: A comprehensive bibliometric and machine learning approach. Environ. Sci. pollut. Res., 1–17. doi: 10.1007/s11356-023-28669-5
Oyando H. C., Kanyolo T. N., Chang C. k. (2023). Rnn-based main transformer oltc control for smr integration into a high renewable energy penetrated grid. J. Electrical Eng. Technol., 1–13. doi: 10.1007/s42835-022-01354-2
Shen Z., Wu Q., Qian J., Gu C., Sun F., Tan J. (2022). “Federated learning for long-term forecasting of electricity consumption towards a carbon-neutral future,” in 2022 7th International Conference on Intelligent Computing and Signal Processing (ICSP). (IEEE) 789–793
Sheng Y., Wang H., Yan J., Liu Y., Han S. (2023). Short-term wind power prediction method based on deep clustering-improved temporal convolutional network. Energy Rep. 9, 2118–2129. doi: 10.1016/j.egyr.2023.01.015
Shi Y., Lou Y., Zhang Y., Xu Z. (2021). Quantitative contributions of climate change, new cultivars adoption, and management practices to yield and global warming potential in rice-winter wheat rotation ecosystems. Agric. Syst. 190, 103087. doi: 10.1016/j.agsy.2021.103087
Somu N., GR M. R., Ramamritham K. (2021). A deep learning framework for building energy consumption forecast. Renewable Sustain. Energy Rev. 137, 110591. doi: 10.1016/j.rser.2020.110591
Sun Y., Hu W., Liu F., Huang F., Wang Y. (2022). “Ssa: A content-based sparse attention mechanism,” in International Conference on Knowledge Science, Engineering and Management (Springer), 669–680.
Sun W., Ren C. (2021). Short-term prediction of carbon emissions based on the eemd-psobp model. Environ. Sci. pollut. Res. 28, 56580–56594. doi: 10.1007/s11356-021-14591-1
Tang J., Li J. (2022). Carbon risk and return prediction: Evidence from the multi-cnn method. Front. Environ. Sci. 10, 2160. doi: 10.3389/fenvs.2022.1035809
Tveter F. T. (2020). A note on the potential of carbon dioxide measurements as temperature precursors in numerical weather prediction. Preprints 2020, 2020060313.
Wang J., Sun X., Cheng Q., Cui Q. (2021). An innovative random forest-based nonlinear ensemble paradigm of improved feature extraction and deep learning for carbon price forecasting. Sci. Total Environ. 762, 143099. doi: 10.1016/j.scitotenv.2020.143099
Wu X., Tian Z., Guo J. (2022). A review of the theoretical research and practical progress of carbon neutrality. Sustain. Operations Comput. 3, 54–66. doi: 10.1016/j.susoc.2021.10.001
Yang W., Huang B., Zhang A., Li Q., Li J., Xue X. (2022). Condition prediction of submarine cable based on cnn-bigru integrating attention mechanism. Front. Energy Res. 10, 1023822. doi: 10.3389/fenrg.2022.1023822
Yu X. (2023). The influence of regional tourism economy development on carbon neutrality for environmental protection using improved recurrent neural network. Front. Ecol. Evol. 11, 1146887. doi: 10.3389/fevo.2023.1146887
Zahedi R., Aslani A., Seraji M. A. N., Zolfaghari Z. (2022a). Advanced bibliometric analysis on the coupling of energetic dark greenhouse with natural gas combined cycle power plant for co2 capture. Korean J. Chem. Eng. 39, 3021–3031. doi: 10.1007/s11814-022-1233-x
Zahedi R., Ayazi M., Aslani A. (2022b). Comparison of amine adsorbents and strong hydroxides soluble for direct air co2 capture by life cycle assessment method. Environ. Technol. Innovation 28, 102854. doi: 10.1016/j.eti.2022.102854
Zhang K., Yang X., Wang T., The´ J., Tan Z., Yu H. (2023). Multi-step carbon price forecasting using a hybrid model based on multivariate decomposition strategy and deep learning algorithms. J. Cleaner Production 405, 136959. doi: 10.1016/j.jclepro.2023.136959
Keywords: sustainable development, carbon neutrality, time-series data, ISSA, GRU-transformer
Citation: Jiang W, Liu C, Qu Q, Wang Z, Hu L, Xie Z, Zhang B and He J (2024) ISSA-enhanced GRU-Transformer: integrating sports wisdom into the frontier exploration of carbon emission prediction. Front. Ecol. Evol. 12:1355492. doi: 10.3389/fevo.2024.1355492
Received: 14 December 2023; Accepted: 19 February 2024;
Published: 18 March 2024.
Edited by:
Chuanbao Wu, Shandong University of Science and Technology, ChinaReviewed by:
Licheng Liu, University of Minnesota Twin Cities, United StatesJianjun Wang, North China Electric Power University, China
Copyright © 2024 Jiang, Liu, Qu, Wang, Hu, Xie, Zhang and He. This is an open-access article distributed under the terms of the Creative Commons Attribution License (CC BY). The use, distribution or reproduction in other forums is permitted, provided the original author(s) and the copyright owner(s) are credited and that the original publication in this journal is cited, in accordance with accepted academic practice. No use, distribution or reproduction is permitted which does not comply with these terms.
*Correspondence: Jingzhou He, amZlbmcwODEwQDE2My5jb20=