 Silvia Fontana1
 Wei-Lung Wang2
 Kuang-Yu Tseng1
 Stefano G. A. Draisma3
 Richard V. Dumilag4
 Zi-Min Hu5Jing-Jing Li6Pei-Husan Lai2Lydiane Mattio7
 Alison R. Sherwood8
 Sung Min Boo9
 Shao-Lun Liu1*
- 1Department of Life Science and Center for Ecology and Environment, Tunghai University, Taichung, Taiwan
- 2Department of Biology, Changhua University of Education, Changhua, Taiwan
- 3Excellence Center for Biodiversity of Peninsular Thailand, Faculty of Science, Prince of Songkla University, Songkhla, Thailand
- 4School of Graduate Studies, Sorsogon State University, Sorsogon City, Philippines
- 5Ocean School, Yantai University, Yantai, China
- 6Key Laboratory of Marine Hazards Forecasting, Ministry of Natural Resources, Hohai University, Nanjing, China
- 7University of Cape Town, Rondebosch, South Africa
- 8School of Life Sciences, University of Hawai’i, Honolulu, HI, United States
- 9Department of Biology, Chungnam National University, Daejeon, Republic of Korea
Ocean currents play a role in both facilitating and impeding connectivity of marine organisms’ populations, serving as key drivers and potential barriers. The emergence of Taiwan around five million years ago (Mya) impacted the Kuroshio Current which later shaped the distribution of marine organisms. In this study, we examined how the Kuroshio Current influenced the distribution and population divergence of the marine red alga Dichotomaria elegans (Galaxauraceae, Nemaliales). Through phylogenetic analysis, species delimitation, and morphological comparison of Taiwanese species, we determined its phylogenetic position relative to other species within the D. marginata complex of the genus Dichotomaria. We uncovered the hidden cryptic diversity within the D. marginata complex in Taiwan and proposed the new combinations D. elegans and D. latifolia based on Galaxaura elegans and G. latifolia. Genetic analysis based on three loci (mitochondrial cox2-3 and cox1, and plastid rbcL) from 32 locations across the Philippines, Taiwan, and Japan revealed three allopatric lineages within D. elegans. The first lineage is restricted to the northern Philippines and southern Taiwan, while the second has a broader latitudinal range along the Kuroshio Current. The third lineage is found in southeast Luzon, Philippines, close to the bifurcation of the North Equatorial Current, near the start of the Kuroshio Current. The divergence of the first two lineages during the mid-Pliocene (~3.7 Mya) coincided with the emergence of Taiwan, with the current dynamics accentuating their separation. The Kuroshio Current exhibited a dual impact on the biogeography of D. elegans: promoting the dispersal of the second lineage towards higher latitudes and preventing the first lineage from moving northward. Principal component analysis showed that habitat conditions and morphologies differed between the two D. elegans lineages. This study provides insights into the cryptic diversity of Dichotomaria in Taiwan, as well as the genetic divergence, biogeographical patterns, and ecological associations of D. elegans, highlighting the interplay of island formation and currents shaping the diversification of seaweeds in the Northwest Pacific Ocean.
1 Introduction
Identifying the processes underlying population structures and diversification in marine organisms presents challenges, as oceans are highly interconnected environments (Faria et al., 2021). Nevertheless, studies on population differentiation in marine environments have revealed numerous cases of allopatric speciation, suggesting the presence of more spatial barriers than previously suspected (Miglietta et al., 2011). Ocean currents, in particular, are known for driving the connectivity of marine organisms; yet, they can also act as potential barriers (Faria et al., 2021).
The Kuroshio Current originates from the bifurcation of the North Equatorial Current, which splits East of Luzon to form the northbound Kuroshio Current and the southbound Mindanao Current (Figure 1). The precise location of this bifurcation exhibits seasonal and annual latitudinal shifts, typically averaging around 13.4°N at the surface annually (Wang and Hu, 2006). Subsequently, the northward flow of the Kuroshio Current through the Luzon Strait, situated between the Philippines and Taiwan, facilitates the redistribution of water across the Ryukyu Arc into higher latitudes in Japan (Qu and Lukas, 2003). This process facilitates the dispersal of marine organisms from the Philippines to Taiwan and the Ryukyu Islands (Chen and Keshavmurthy, 2009; Hsiao et al., 2011; Kuriiwa et al., 2014; Arriesgado et al., 2016). Kuroshio Current branches intrude at approximately 25.5–26.4°N off Northeast Taiwan and around 20°–21°N, leading to the formation of eddies and upwelling cold domes in both northern and southern Taiwan (Lee et al., 1999; Nan et al., 2011; Wu et al., 2017). Hence, the Kuroshio Current can also act as a barrier through differential water velocities, upwelling cold domes, and eddies between inner and open seas. For instance, studies show that the Kuroshio Current can act as a physical barrier for Blacktip grouper fish populations from the East China Sea and the south of mainland Japan, isolating them from their southern counterparts as they cannot cross the strong Kuroshio Current (Kuriiwa et al., 2014). An upwelling cold dome created by the Kuroshio Current branch in Northeast Taiwan has isolated coral populations between the southern Ryukyus and the East China Sea (Suzuki et al., 2016; Kuo et al., 2023), leading to the presence of cryptic coral species in Northern Taiwan, Ryukyu Island, and the East China Sea. While the effects of the Kuroshio Current on marine organism diversification are well-studied in northern Taiwan and Japan, research on the southern Taiwan and Philippines regions is scarce (Lee et al., 1999; Nan et al., 2011). Further studies are needed to explore the potential barriers (i.e., eddies and local upwelling domes) to marine organisms’ dispersal generated by the Kuroshio Current in southern Taiwan.
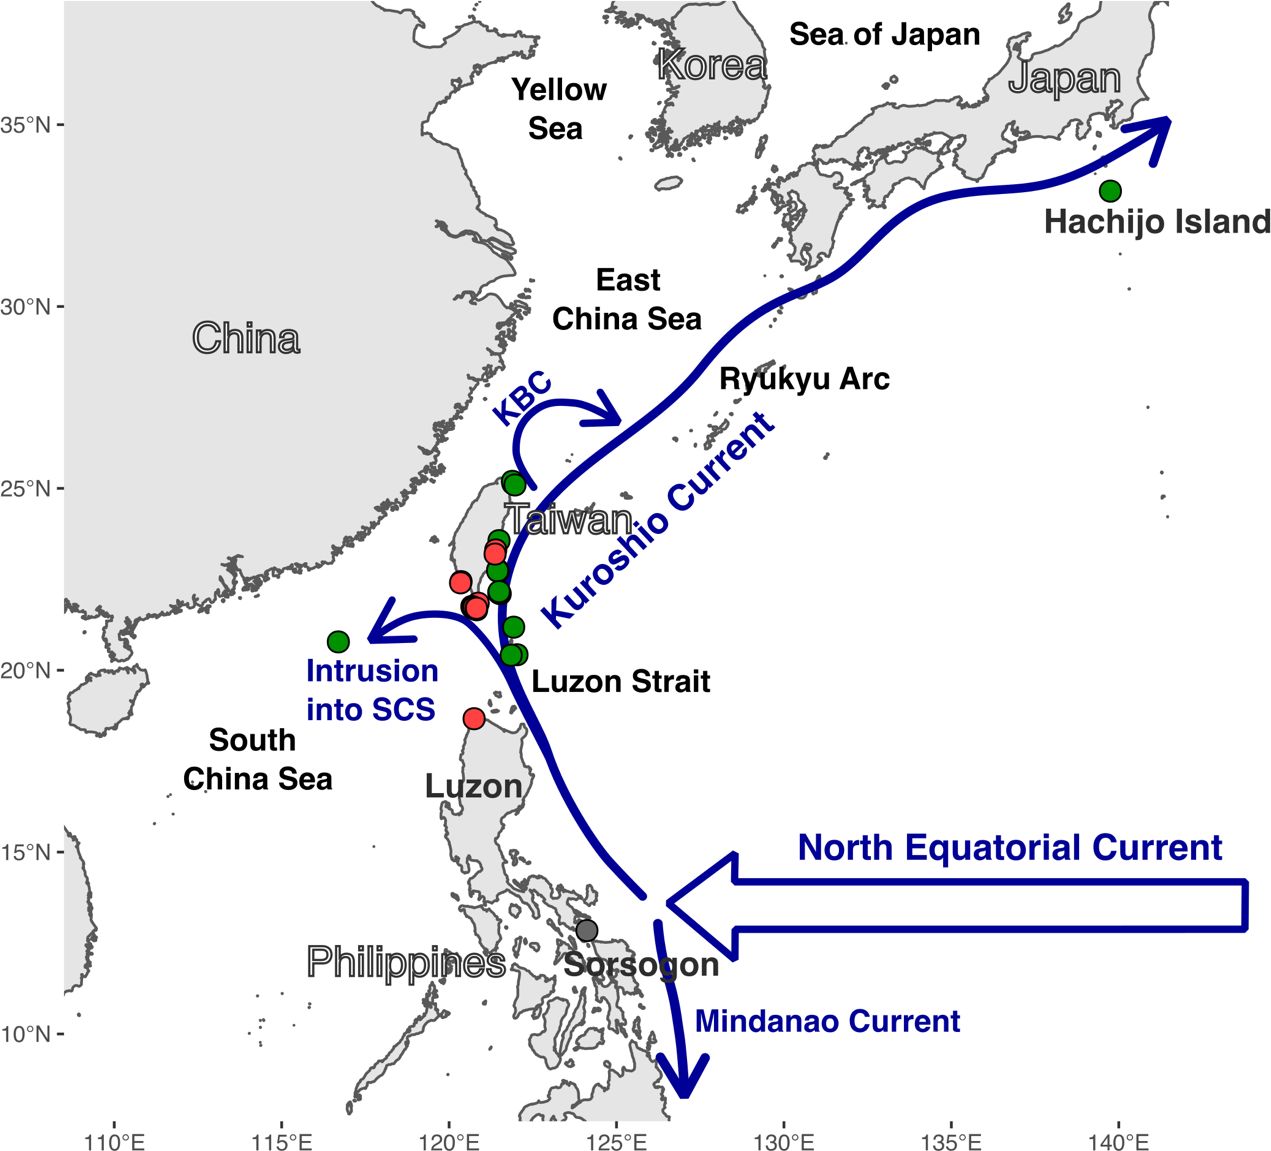
Figure 1 Overview of D. elegans sampling area. The North Equatorial Current and its bifurcation into Kuroshio Current and Mindanao Current, and the intrusion of the Kuroshio Current into the South China Sea (SCS), and the Kuroshio Branch Current (KBC) are depicted as blue arrows. The sampling locations for D. elegans lineages 1, 2, and 3 are shown as red, green, and grey dots, respectively.
The geological emergence of Taiwan from the collision of the Philippine plates and the Eurasian plate, which was completed around five million years ago (Mya) (Hall, 2002; Sibuet and Hsu, 2004), and the emergence of the islands along the Luzon Volcanic Arc, between 3.5 and 6.3 Mya (Lai and Song, 2013), impacted the marine coastal organisms and their subsequent geographical distribution in the area. Studies on planktonic foraminifera and various fossil assemblages (Gallagher et al., 2015; Wang et al., 2020) have shown that the Kuroshio Current reached its present impact and latitudinal range around 3 to 3.5 Mya. Therefore, we hypothesize that the emergence of Taiwan and the Luzon Arc, along with the establishment of the modern Kuroshio Current, impacted the current distribution pattern of coastal marine organisms. Such a scenario could be further complicated by the sea level fluctuations of the late Pleistocene (1.8 Mya-11,000 years BP) caused by glaciations and inter-glacial periods (Shen et al., 2011; Lee et al., 2021), modern connectivity, and barriers created by the Kuroshio Current, as well as environmental selection.
Red algae are good models to test these hypotheses as they have limited dispersal. Unlike brown algae like Sargassum, which have air bladders providing positive buoyancy, or free-floating green algae such as Ulva, red algae do not rely on their vegetative structure for dispersal (Graham et al., 2008; Fu et al., 2019). Additionally, red algae lack flagella during their entire life cycle, relying mainly on water currents and the attachment and growth of spores on various substrates to spread and colonize new areas (Cole and Sheath, 1990). Hence, their populations are highly influenced by potential marine barriers and easily subjected to the impacts of local environments. Among red algae, we focus on the genus Dichotomaria, due to its common occurrence in tropical and subtropical oceans. Dichotomaria species are characterized by either terete or flattened thallus forms exhibiting a dimorphic life history with different cortical structures between gametophyte and sporophyte. Initially, Dichotomaria proposed by Lamarck (1816) was dismissed, with its species placed under Galaxaura by Kjellman (1900). Subsequent studies suggest shifting these Galaxaura species back to Dichotomaria (Huisman et al., 2004b; Wang et al., 2005). All the species examined in this study are part of a taxonomic group within Dichotomaria, called the D. marginata complex. Dichotomaria marginata (J.Ellis & Solander) Lamarck, 1816, a tropical and sub-tropical species with a flattened gross morphology (Huisman and Borowitzka, 1990), was historically grouped with several other species forming the D. marginata complex (Huisman and Borowitzka, 1990; Huisman et al., 2004b). However, subsequent molecular and morphological analyses (Schneider et al., 2016; Santos et al., 2020) have identified distinct species within this complex. Hence, the D. marginata complex species diversity is not well characterized, with new species continually being discovered (Sherwood et al., 2010; Liu et al., 2013; Wiriyadamrikul et al., 2014; Schneider et al., 2016; Santos et al., 2020). In addition, regionally endemic lineages have been observed, including D. tenera (Kjellman) Huisman et al. in South Africa and D. viridis G.N.Santos et al. in Brazil (Huisman et al., 2004b; Santos et al., 2020). For these reasons, members of the D. marginata complex are promising candidates for studies exploring the effects of ocean currents on diversification and biogeographical patterns.
Possibly three species from the D. marginata complex are found in Taiwan. Previous studies show the presence of D. marginata (Liu et al., 2013). Two species, Galaxaura elegans T.Tanaka, identified in the lower littoral zone in Kenting National Park, South Taiwan, and G. latifolia T.Tanaka, discovered growing on rocks near the low tide mark in North East Taiwan, were described by Tanaka in 1935 and tentatively linked with D. marginata in more recent studies (Wang et al., 2005).
Here we unraveled the species diversity of the D. marginata complex, with emphasis on the Taiwan species, using genetic analysis of three loci (plastid rbcL, mitochondrial cox1 and cox2-3) and morphological analysis of thallus and cortical structures. In addition, we examined contemporary and historical factors, with attention to the influence of the Kuroshio Current, influencing the distribution and lineage divergence of G. elegans. We explored the hypothesis that the formation of Taiwan, in conjunction with the current system (i.e., the presence of the Kuroshio Current, generating eddies, and upwelling in the South of Taiwan) led to the separation of distinct lineages between south Taiwan and the eastern offshore islands. Our findings not only highlight the pivotal role of island formation and the Kuroshio Current in driving the lineage divergence and ecological differentiation of seaweeds in the Northwest Pacific Ocean but also underscore the previously underappreciated cryptic diversity of Dichotomaria species in Taiwan.
2 Materials and methods
2.1 Sample collection, morphological examination, and DNA sequencing
A total of 161 individuals of “D. elegans” from 32 different locations in the Philippines, Taiwan, and Japan, were included in this analysis (Supplementary Tables 1, 2). Additionally, 64 samples of other Dichotomaria species were included for phylogenetic analysis and species delimitation (Supplementary Table 1). Specimens were collected from shallow waters at least 5 m apart. These thalli were subsequently identified via DNA barcoding using the mitochondrial intergenic spacer between the cytochrome oxidase subunit 2 and subunit 3 genes (cox2-3). For each individual, a portion of the thallus was preserved in silica gel for DNA analysis. For morphological observations, another portion was preserved in 10-15% formalin in seawater. Genomic DNA was extracted from the dried thalli using a DNeasy Plant Mini Kit (Qiagen, Hilden, Germany) according to the manufacturer’s instructions. Gene amplification was performed for six genetic markers: two nuclear genes, i.e., the large subunit (LSU) of the ribosomal cistron and the elongation factor 2 gene (EF2); two plastid genes, i.e., the large subunit of the ribulose-1,5-bisphosphate carboxylase gene (rbcL) and the RNA polymerase gene beta subunit (rpoC1); and two mitochondrial regions, i.e., the cytochrome oxidase subunit 1 gene (cox1) and the intergenic spacer between the cytochrome oxidase subunit 2 and subunit 3 genes (cox2-3), under the PCR conditions described in Lin et al. (2001) and Wang et al. (2005). The primer pairs used to amplify the six regions were the following: for LSU, T01 (Harper and Saunders, 2001)/nu28SR (Conklin et al., 2009), for EF2, EF2L1Pey/Mang48 (Saunders and Moore, 2013), for rpoC1, F2/R2 (Zhan et al., 2020), for cox1, cox143F (Geraldino et al., 2006)/C880R (Yang et al., 2008), and for cox2-3, cox2-for/cox2-rev (Zuccarello et al., 1999). To amplify the rbcL gene, multiple sets of primers were used: F7/R753, F492/R1150, and F993/Rsst (Freshwater and Rueness, 1994). Additionally, we used internal-sequencing primers designed for the Galaxauraceae: rbcL-F85, rbcLF476, and rbcLR562 (Wang et al., 2005). The Sanger sequencing was conducted using an ABI 3730 DNA Sequencer (Applied Biosystems, Foster, California) by Mission Biotech Company (Taipei, Taiwan). While PCR amplification was successful for three of the amplified markers (rbcL, cox1, and cox2-3), only a small percentage of specimens yielded amplification for the two nuclear markers (LSU and EF2) and the plastid marker rpoC1. Consequently, the following analyses primarily focus on rbcL, cox1, and cox2-3, with results pertaining to LSU, EF2, and rpoC1 briefly discussed. Voucher specimens were deposited at the Department of Life Science, Tunghai University, Taichung, Taiwan and at Herbarium of Biodiversity Research Center, Academia Sinica, Taipei (HAST), Taiwan. Collections from Sorsogon, the Philippines, were lodged at the Herbarium Sorsogonense (HS).
2.2 Phylogenetic analysis and species delimitation
In order to determine the diversity within the D. marginata complex in Taiwan, and to assess the phylogenetic placement of “D. elegans”, 44 rbcL and 52 cox1 sequences, corresponding to 64 specimens of Dichotomaria were aligned with 20 rbcL and 19 cox1 “D. elegans” sequences (Supplementary Table 1). These sequences were obtained from GenBank or produced as part of this study, as described previously. Our dataset included sequences from all known species in the D. marginata complex (i.e., D. huismanii C.W.Schneider et al., D. intermedia (R.C.Y.Chou) J.Wiriyadamrikul et al., D. marginata, D. sibogae (Weber Bosse) Huisman et al., D. tenera, and D. viridis, and G. elegans and G. latifolia (for which we will propose the new combinations “D. elegans” and “D. latifolia”, respectively) as the ingroup and two closely related species to the D. marginata complex, terete D. obtusata (J.Ellis & Solander) Lamarck (rbcL and cox1) and flattened D. spathulata (Kjellman) A.Kurihara & Huisman (rbcL only), as outgroups. To avoid bias in using single-locus species delimitation methods, our dataset comprised representative samples distributed across key taxonomic groups (Puillandre et al., 2012). Two separate sequence matrices, rbcL, and cox1, of 1,306 bp and 517 bp, respectively, were aligned using MEGA X version 10.1.7 (Kumar et al., 2018). The Tamura-Nei (1993) model +G +I and the Hasegawa-Kishino-Yano (1985) model +G+I were selected for rbcL and cox1, respectively, using jModelTest 2 (Darriba et al., 2012), and utilized for the phylogenetic analyses.
A concatenated alignment was generated from rbcL and cox1 sequence matrices using MEGA X version 10.1.7 (Kumar et al., 2018). The Bayesian Inference (BI) method was used to reconstruct a phylogenetic tree using MrBayes v.3.2.7a (Ronquist et al., 2012). Statistical support for each node of the BI tree was based on two Markov Chain Monte Carlo (MCMC) runs (nchains = 4) for 350,000,000 generations with sampling every 200,000 generations, after discarding 75% of the resulting trees (i.e. the trees below the convergence, with a standard deviation of split frequencies above 0.01) as ‘burn-in’. Given the presence of several nodes with low support, we presented a consensus phylogeny in which these poorly supported nodes are collapsed (Figure 2). The original fully dichotomous tree is displayed in Supplementary Figure 1. In addition, maximum likelihood (ML) single-locus phylogenies were generated using MEGA X version 10.1.7 (Kumar et al., 2018) (Supplementary Figures 2, 3). The phylogenetic trees were visualized using FigTree.v1.4.4 (http://tree.bio.ed.ac.uk/software/figtree/).
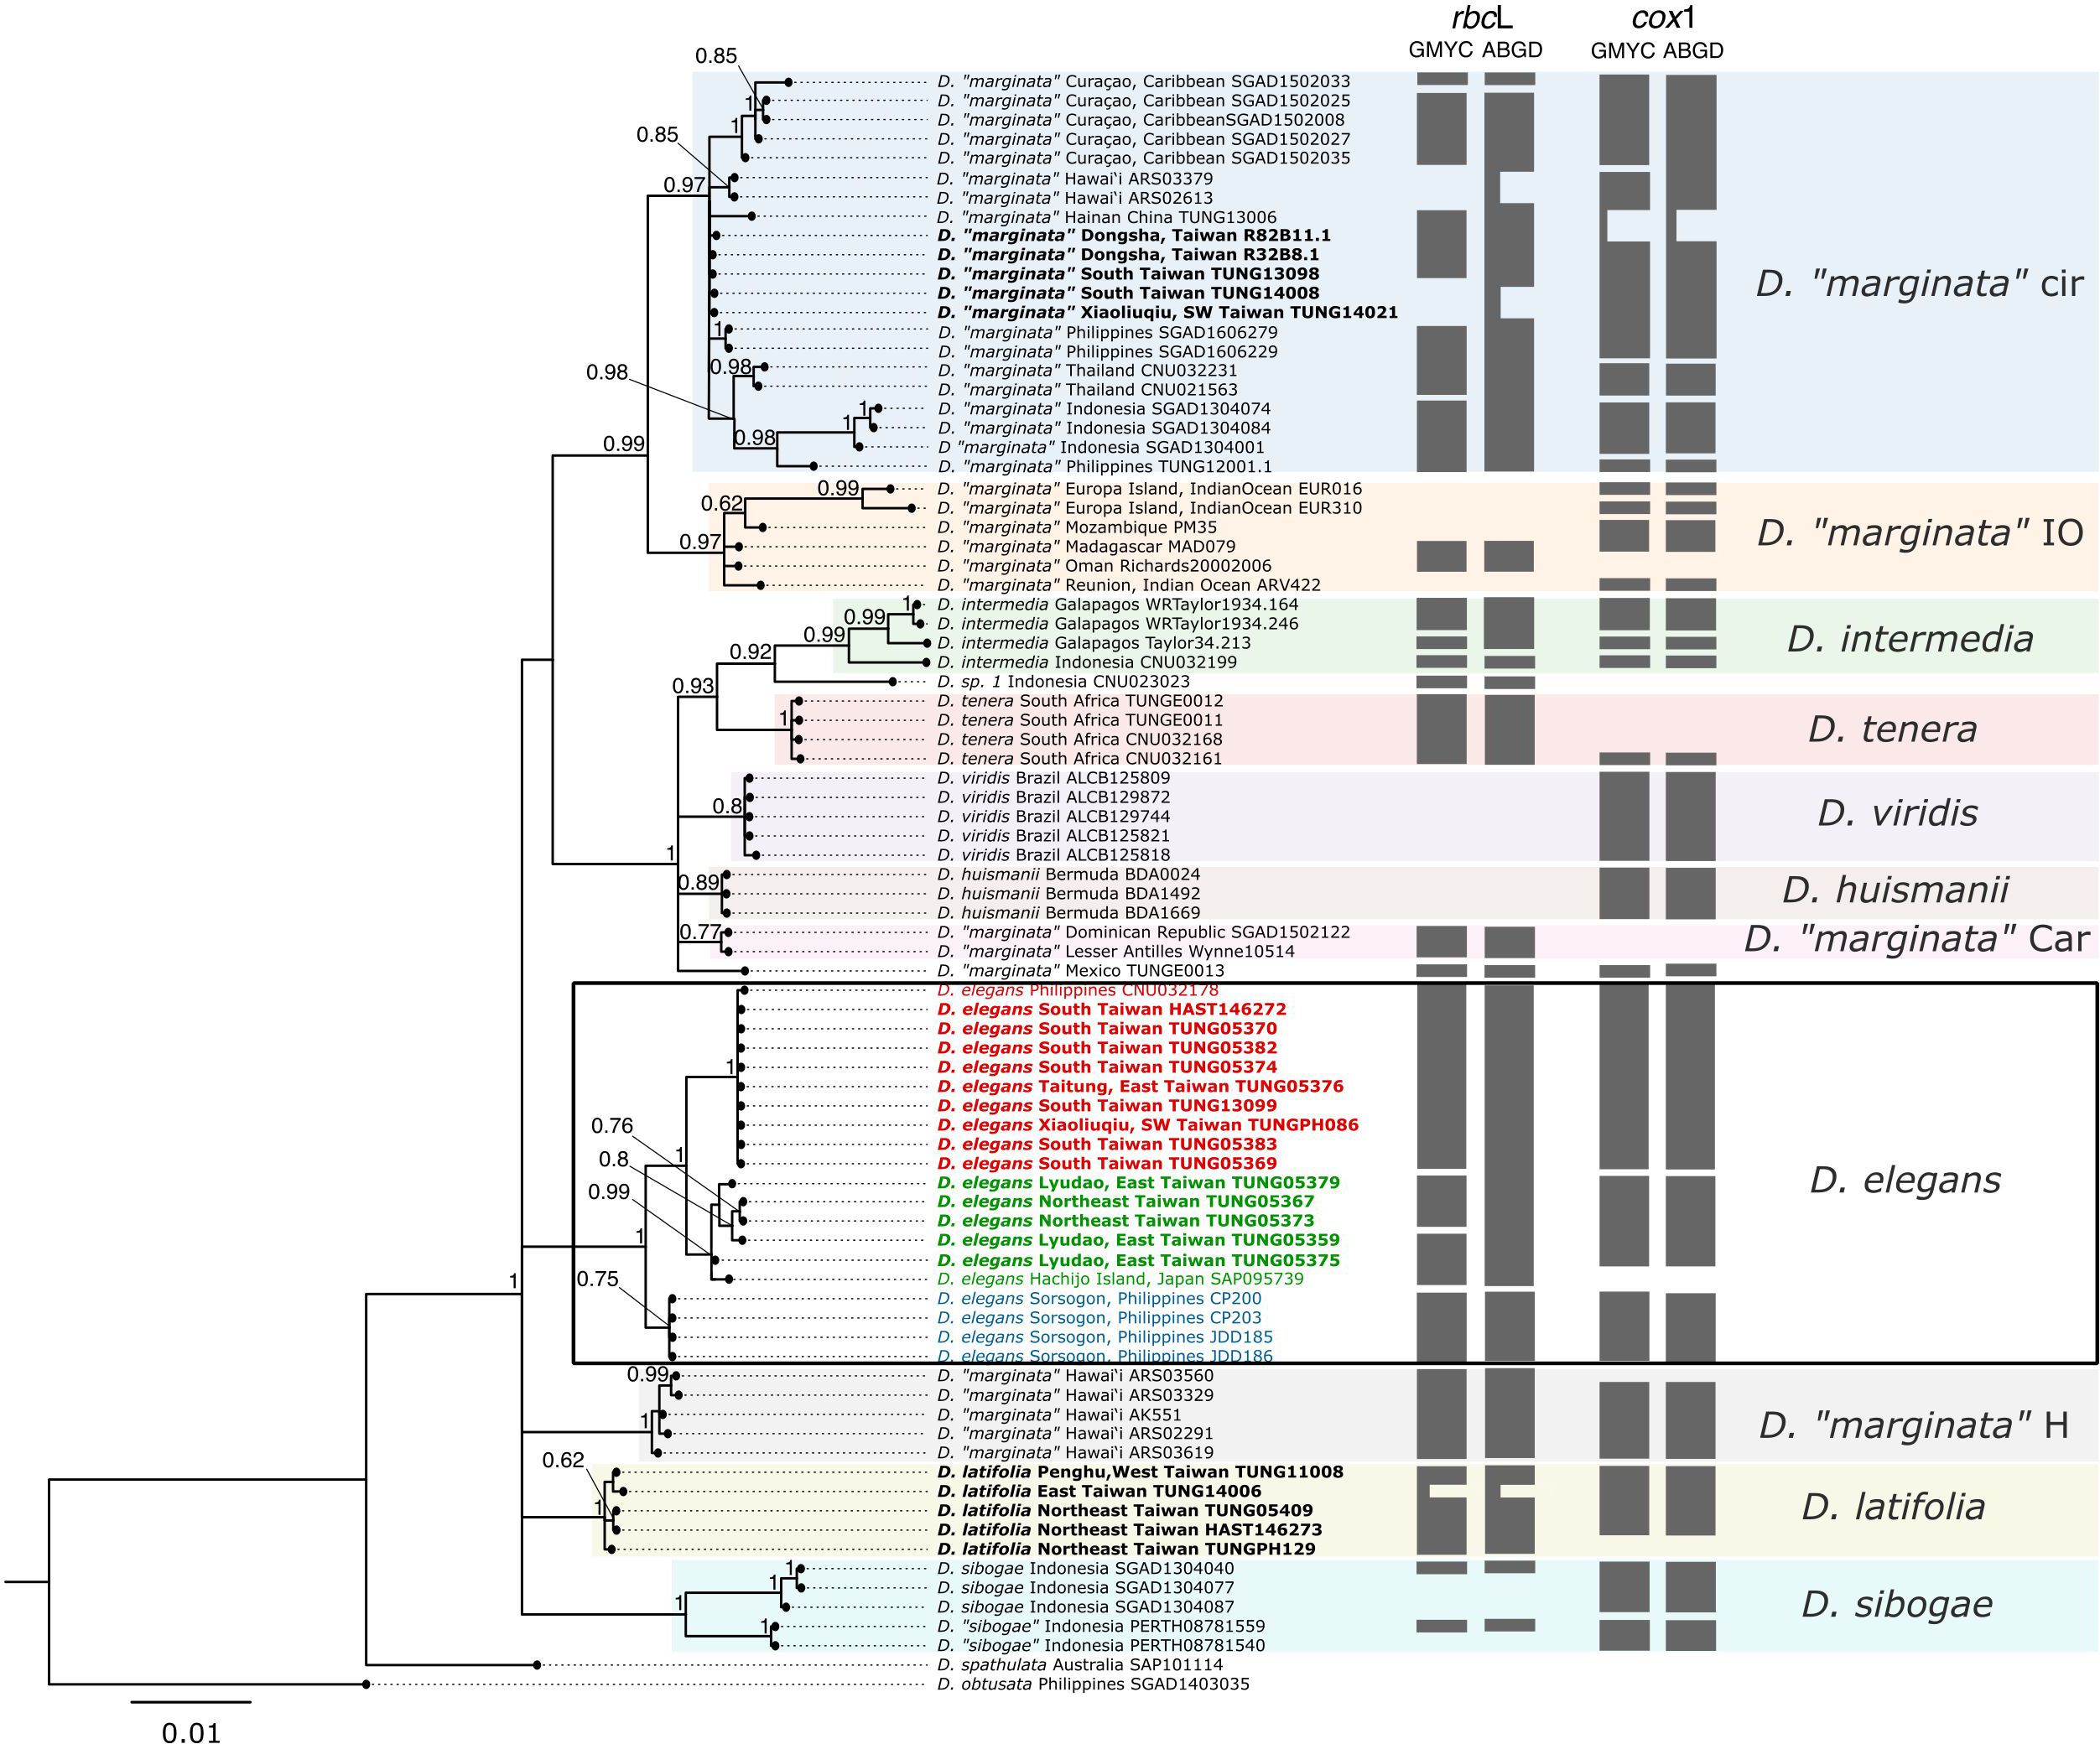
Figure 2 Bayesian Inference (BI) phylogeny of the Dichotomaria marginata complex based on a rbcL and cox1 concatenated alignment (left panel) and single locus species delimitation analyses using Generalized Mixed Yule-Coalescent (GMYC) and Automatic Barcode Gap Discovery (ABGD) methods, indicated by grey blocks to the right of the tree. The phylogeny includes the outgroups D. spathulata and D. obtusata. The main clades shown in the phylogeny are indicated on the right. Specimens from Taiwan shown in bold, D. elegans lineages 1, 2, and 3 are highlighted in red, green, and blue, respectively. Nodal support is presented as posterior probabilities from BI. Only posterior probabilities ≥ 0.5 are shown. H, Hawai’i; Cir, circumtropical; IO, Indian Ocean; Car, Caribbean.
Two algorithmic species delimitation methods were applied to the rbcL and cox1 alignments, excluding the outgroup sequences: the Generalized Mixed Yule-Coalescent model (GMYC) (Pons et al., 2006) and the Automated Barcode Gap Discovery (ABGD) (Puillandre et al., 2012). For the GMYC analyses, ultrametric phylogenetic trees were first generated using BEAST2 v.2.6.7 (Bouckaert et al., 2019), with the substitution models previously determined, a gamma distribution for four rate categories, and a Birth-Death model as the tree priors. Four MCMC chains were run for 30,000,000 generations with sampling every 30,000 generations. 50% of the resulting Bayesian trees (i.e. the trees below the convergence) were discarded as ‘burn-in’. GMYC analyses were performed using the software R v.4.2.3 (R Core Team, 2021) package splits v1.0.2.0 (Monaghan et al., 2009). The species boundaries were identified by detecting shifts in branching rates within the ultrametric phylogenetic tree, using a single threshold. The ABGD analyses were performed using an online analysis web tool (https://bioinfo.mnhn.fr/abi/public/abgd/abgdweb.html). The putative number of species in the datasets was determined based on pairwise genetic distance matrices calculated using MEGA X version 10.1.7 (Kumar et al., 2018). The relative gap width was set to 1, and only the initial partitions were considered, as suggested by Kekkonen and Hebert (2014). The pairwise and overall diversity in the D. marginata complex and among “D. elegans” lineages was assessed with MEGA X version 10.1.7 (Kumar et al., 2018).
2.3 Haplotype network analysis
To explore the diversity within “D. elegans”, we utilize an extensive dataset exclusive for this species (Supplementary Table 1). The alignments of rbcL, cox1 and cox2-3 used for this analysis were 1,306, 517, and 297 bp in length, respectively. The number of haplotypes (Nh), haplotype diversity (h), and nucleotide diversity (π) were calculated for each locus with the R package pegas (Paradis, 2010). Concatenation of the rbcL, cox1, and cox2-3 alignments was performed using MEGA X version 10.1.7 (Kumar et al., 2018), resulting in 2,120 bp multi-locus alignment. Twenty-three “D. elegans” specimens (those with available sequences for all three loci) were included. The Kimura (1981) 3-parameter substitution model was selected for the multi-locus dataset using jModelTest 2 (Darriba et al., 2012). The phylogenetic network was estimated from the multi-locus alignment with SplitTree v4.19.2 (Huson and Bryant, 2006), using the neighbor network method with 1,000 bootstrap replicates.
Next, we constructed single-locus networks with an increased sample size. A total of 27 rbcL, 43 cox1, and 160 cox2-3 sequences of “D. elegans”, were aligned using MEGA X version 10.1.7 (Kumar et al., 2018). To ensure non-redundancy, a custom Python script was used to retain unique sequences for each alignment. Unrooted haplotype networks were constructed using the median joining method, implemented in PopART version 1.7 (Leigh and Bryant, 2015). The cox2-3 haplotype diversity for each location was visualized on a map created using the R package ggmap (Kahle and Wickham, 2013). Note that the map represents only 31 out of the 32 locations of “D. elegans”, as a cox2-3 sequence was not available for the northernmost location (i.e., Hachijo Island, Japan).
2.4 Lineages' divergence time and gene flow
To assess gene flow and divergence timing between two cryptic lineages of “D. elegans”, we conducted an isolation-with-migration (IM) analysis implemented in Ima2 (Nielsen and Wakeley, 2001). This analysis requires data from individual loci displaying polymorphic variation within or between populations (Nielsen and Wakeley, 2001), consequently, we excluded rbcL, due to the lack of multiple haplotypes in lineage 1, and we excluded lineage 3 (Sorsogon lineage), comprising a single haplotype for all three loci. Therefore, the analysis was performed to estimate divergence time (t) and migration rate (m) between lineages 1 and 2, based on the two mitochondrial markers cox1 and cox2-3, run independently. Several runs were conducted to determine the most efficient search parameters that maximized mixing. The final runs included 40 coupled Markov chains, a burn-in period of 100,000 steps, and a geometric heating model, with the first and second heating parameters of 0.99 and 0.80 for individual chains. A total of 100,000 genealogies were sampled to estimate the joint posterior probability distributions of the migration parameters. Based on previous studies, the mutation rates of cox1 and cox2-3 were set to be 3.4×10⁻⁹ (Hu et al., 2015) and 5.5×10⁻⁹ (Li et al., 2015) substitutions per site per year, respectively.
2.5 Demographic history
Tajima’s D (Tajima, 1989) and Fu’s Fs (Fu, 1997) were calculated to test departure from neutrality, using the R package pegas (Paradis, 2010) and DnaSP version 6.12.03 (Rozas et al., 2017), respectively. To estimate the shape of population growth over time, Extended Bayesian Skyline Plots were produced in BEAST v1.7.4 (Drummond and Rambaut, 2007). As for the IM analysis, we excluded rbcL and lineage 3, due to the lack of multiple haplotypes. We estimated demographic histories of lineages 1 and 2, based on mitochondrial loci cox1 and cox2-3 (run as independent loci), using the HKY substitution model, with constant Bayesian skyline tree priors. We chose to use a strict molecular clock with a substitution rate of 0.0034 and 0.0055 Myr-1 for cox1 and cox2–3, respectively (Hu et al., 2015; Li et al., 2015). The MCMC parameters were set as follows: 1×10⁸ iterations, sampling every 3,000 iterations, and the first 1×10⁷ iterations discarded as burn-in.
2.6 Environmental analysis
To investigate a potential environmental influence on the separation of lineages 1 and 2, we compared the environmental features of the locations hosting each lineage. Lineage 3 was not included in this analysis since it was represented by a single location. We selected seven sea surface environmental parameters with long-term average maximum and minimum values, sourced from BIO-ORACLE v2.2 (Assis et al., 2018): current speed, oxygen concentration, iron concentration, nitrate concentration, phosphate concentration, salinity, and temperature. The environmental features were retrieved by using the latitude and longitude coordinates of each sampling location with ArcGIS v10.4 (Supplementary Table 2) and were standardized before statistical analysis. To reduce the dimensionality of the environmental data, a principal component analysis (PCAs), was applied. To assess the disparity in environmental features between the areas hosting lineages 1 and 2, we conducted a PERMANOVA analysis. To avoid possible collinearity between environmental features, PERMANOVA was performed based on principal components (PCs) derived from the PCA analysis, which are the linear combination of original environmental factors (Gotelli and Ellison, 2013). PCs were assigned as the independent variables for the PERMANOVA. All statistical analyses were carried out using the R package vegan (Oksanen et al., 2007). The PCA results were visually represented using the R package ggplot2 (Wickham, 2011).
2.7 Morphological examination
Morphological examinations of thalli of both tetrasporophytic and gametophytic plants were carried out for the three species within the D. marginata complex found in Taiwan: D. “marginata”, “D. latifolia”, and “D. elegans”. We selected the following traits: gross morphology, color, habitat preference, external branch width, as well as specific characteristics of the gametophyte (epidermal cells and spine cells width and height) and tetrasporophyte (stalk cells height, outer cortical cells width and height, and the presence of apiculate tips), based on their established taxonomic relevance in previous Dichotomaria studies (Tanaka, 1935; Kurihara et al., 2005; Wang et al., 2005; Liu et al., 2013; Wiriyadamrikul et al., 2014; Schneider et al., 2016). The majority of stalk cells of the tetrasporophyte were dichotomous, attached to two outer cortical cells; therefore, to avoid bias, we only measured their height. Subcortical cells of the tetrasporophyte were also not included in the analysis as their size appeared to be too variable within a single specimen. Formalin preserved materials were decalcified using 45% acetic acid and pre-stained with hematoxylin. Measurements were carried out using a Leica DM 750 microscope (Leica Microsystems, Wetzlar, Germany), and photos were taken on a mounted Canon EOS600D (Canon, Tokyo, Japan) digital camera. Measurements were carried out using imageJ (Schneider et al., 2012). An ANOVA was applied followed by a Tukey post-hoc test using R, and the data were visualized using the R package ggplot2 (Wickham, 2011).
To assess possible morphological differences between lineages 1 and 2 of “D. elegans”, morphological traits were quantitatively analyzed. Lineage 3 was not included due to its low sample size. Traits were selected based on the above morphological comparisons among the three Dichotomaria species, with a particular emphasis on the traits that were most informative. We focused solely on tetrasporophytic material due to its higher prevalence and informative value. Gametophytes were less common, resulting in a smaller sample size for analysis. The tetrasporophytic cortex features analyzed were the width and height of outer cortical cells, and the height of stalk cells in the middle cortex. Measurements were performed on the second and third internode. Additionally, the width of nodes and internodes were measured from the thallus. A PERMANOVA analysis was applied using the R package vegan (Oksanen et al., 2007), and a PCA was applied and visualized using the R package ggplot2 (Wickham, 2011). All specimens subjected to morphological examination are included in Supplementary Table 1.
3 Results
3.1 Phylogenetic analysis and species delimitation
The phylogenetic tree based on concatenated rbcL and cox1 data shows 11 well-supported clades. Among these, seven corresponded to established species: “D. elegans”, D. huismanii, D. intermedia, “D. latifolia”, D. sibogae, D. tenera, and D. viridis. Notably, “D. elegans” showed three distinct lineages (lineages 1, 2, and 3) with strong statistical support (Figure 2). The remaining four clades consisted of: 1) a circumtropical D. “marginata” clade, represented in the Caribbean; noteworthy is the absence of a D. marginata type specimens and unavailability of specimens from the original type locality, the Bahamas; 2) D. “marginata” from the Indian Ocean, closely associated with the circumtropical D. “marginata”; 3) a second D. “marginata” clade, circumscribed to the Caribbean; and 4) a Hawaiian species, most probably corresponding to the species formerly categorized as G. infirma, a subterete variation of D. marginata (Huisman et al., 2004a). Indeed, we observed these specimens to be subterete in gross morphology. Presently, G. infirma has been invalidated and merged into D. marginata, thus necessitating further clarification regarding the species status of this clade. Additionally, two sequenced specimens did not belong to any of the clades: 1) a specimen from Indonesia designated as D. sp. 1 by Wiriyadamrikul et al. (2014); and 2) a specimen from Mexico, tentatively designated as D. “marginata”. After collapsing the low-supported nodes, the resulting phylogeny exhibited polytomy, indicating unresolved phylogenetic relationships among clades, with the exceptions of D. “marginata” circumtropical and Indian Ocean clades, which were resolved as sister taxa, and a monophyletic group consisting of D. huismanii, D. intermedia, D. “marginata” from Mexico, D. sp. 1, D. tenera, and D. viridis. Single-locus ML phylogenies (Supplementary Figures 2, 3) showed the same clades with high bootstrap support, while the relationships among clades remained ambiguous, with low support. When considering cox1-based phylogeny (Supplementary Figure 3), “D. elegans” lineage 2 and 3 appeared to be more closely related to each other than to “D. elegans” lineage 1.
The analyses of species delimitation using the rbcL and cox1 genes with the GMYC and ABGD methods yielded some inconsistencies (Figure 2). In the rbcL analysis (Figure 2), GMYC and ABGD determined 21 and 15 species, respectively. In the cox1 analysis (Figure 2), GMYC and ABGD identified 23 and 22 species, respectively. Of the 11 clades shown by the phylogenetic analysis, six were recognized as single species by species delimitation analyses: D. huismanii, D. latifolia, D. “marginata” Caribbean clade, D. “marginata” Hawaiian clade, D. tenera, and D. viridis. The two sequences, D. “marginata” from Mexico and D. sp. 1, which did not belong to any clades, were also identified as separate species. The D. sibogae clade included two species, possibly the sequences from Indonesia belong to a separate species. The circumtropical and Indian Ocean clades of D. “marginata”, as well as D. intermedia, instead, exhibited significant diversity, possibly indicating the presence of multiple species within them. The species delimitation results regarding “D. elegans” were inconsistent among markers and methods: while cox1 indicates each lineage as a separate species, rbcL shows more inconsistency. The GMYC method suggests four species (with lineage 2 comprising two separate species), whereas ABGD indicates two species (with lineage 1 and 2 grouped as a single species) (Figure 2).
The overall diversity (as p-distance) in the D. marginata complex was 0.02 for rbcL and 0.05 for the cox1. The inter-lineage distance in “D. elegans” was 0.004-0.005 and 0.019-0.027 (rbcL and cox1). This was lower than the smallest inter-specific distance within the D. marginata complex: 0.009 (between D. intermedia and D. tenera, based on rbcL) and 0.029 (between D. huismanii and D. “marginata” Caribbean clade, based on cox1). The highest inter-species distance was detected between D. “marginata” Hawaiian clade and D. sp. 1 based on rbcL (0.027) and between D. sibogae and D. intermedia based on cox1 (0.081) (Supplementary Tables 3, 4).
Additional DNA barcodes, consisting of two nuclear markers (LSU and EF2) and one plastid marker (rpoC1), had notably small sample sizes: six samples for LSU (four from lineage 1 and two from lineage 2 of “D. elegans”), three for EF2 (two from lineage 1 and one from lineage 2 of “D. elegans”), and only two for rpoC1 (both from lineage 1 of “D. elegans”) were successfully amplified. These sequences span 597 bp for LSU, 331 bp for EF2, and 721 bp for rpoC1. LSU exhibited no diversity (Supplementary Table 5), EF2 showed very limited differentiation between lineages (i.e., 1 bp difference) (Supplementary Table 6), while rpoC1 displayed no diversity in lineage 1 (Supplementary Table 7). Nevertheless, we provide these sequences for public access (Supplementary Table 1).
3.2 Dichotomaria species in Taiwan
After molecularly identifying “D. elegans”, “D. latifolia”, and D. “marginata” from Taiwan, we investigated their differentiation based on external morphology, vegetative anatomical traits, and habitats. Externally, “D. elegans” stands out with its orange-red color, commonly found on reefs or worm tubes in the rocky intertidal and shallower subtidal areas, while D. “marginata” and “D. latifolia” exhibit a pink to dark red color and are typically found in the deeper subtidal regions (Figures 3A–D). Additionally, “D. elegans” features narrower branches (1.79 ± 0.55 mm, range: 1.22-3.05 mm) in contrast to D. “marginata” (2.61 ± 0.56 mm, range: 1.63-3.48 mm) and “D. latifolia” (2.77 ± 0.63 mm, range: 1.66-4.14 mm) (Figures 3E–H; Supplementary Table 8). This is concordant with the finding of Tanaka (1935), who distinguished G. elegans from G. latifolia by having a narrower branch width (1-3 vs. 3-5 mm). ANOVA results show that “D. elegans” branch width is significantly smaller compared to D. “marginata” and “D. latifolia” (Supplementary Figure 4). In the gametophyte stage, D. “marginata” possesses significantly wider epidermal cells (22.75 ± 4.40 μm, range: 15.94-29.08 μm) compared to “D. elegans” (16.22 ± 2.28 μm, range: 11.76-19.66 μm) and “D. latifolia” (15.67 ± 1.52 μm, range: 13.54-17.92 μm) (Figures 3I–K; Supplementary Table 8; Supplementary Figure 4). The spine cells of the three species exhibit similar dimensions (Figures 3I–K; Supplementary Table 8; Supplementary Figure 4). In the tetrasporophyte stage, D. “marginata” exhibit rounder outer cortical cells (average height/width ratio: 0.97 -middle of the branch- 1.13 -edge of the branch; Figures 3L, O; Supplementary Figure 4) compared to the one of “D. latifolia” (average height/width ratio: 1.29 -middle of the branch- 1.86 -edge of the branch-; Figures 3M, P; Supplementary Figure 4) and “D. elegans” (average height/width ratio: 1.59 -middle of the branch- 1.98 -edge of the branch-; Figures 3N, Q), that progressively appeared more elongated. Notably, the side of thallus branch outer cortical cells in D. “marginata” and “D. latifolia” appear apiculate, unlike “D. elegans” (Figures 3O–Q). Furthermore, stalk cells of D. “marginata” are significantly shorter (up to 25.54 μm) than those of “D. latifolia” (up to 38.68 μm) and “D. elegans” (up to 37.94 μm) (Supplementary Table 8; Supplementary Figure 4). While D. “marginata” has a circumtropical distribution, the other two are geographically limited. “D. latifolia” is exclusive to Taiwan, and “D. elegans” is found in the Philippines, Taiwan, and Japan. In summary, a combination of geographical location, habitat preference, and branch width proves useful in differentiating these three species in situ. Further analyses of cortical anatomy data are useful to further identify these species before molecular analysis.
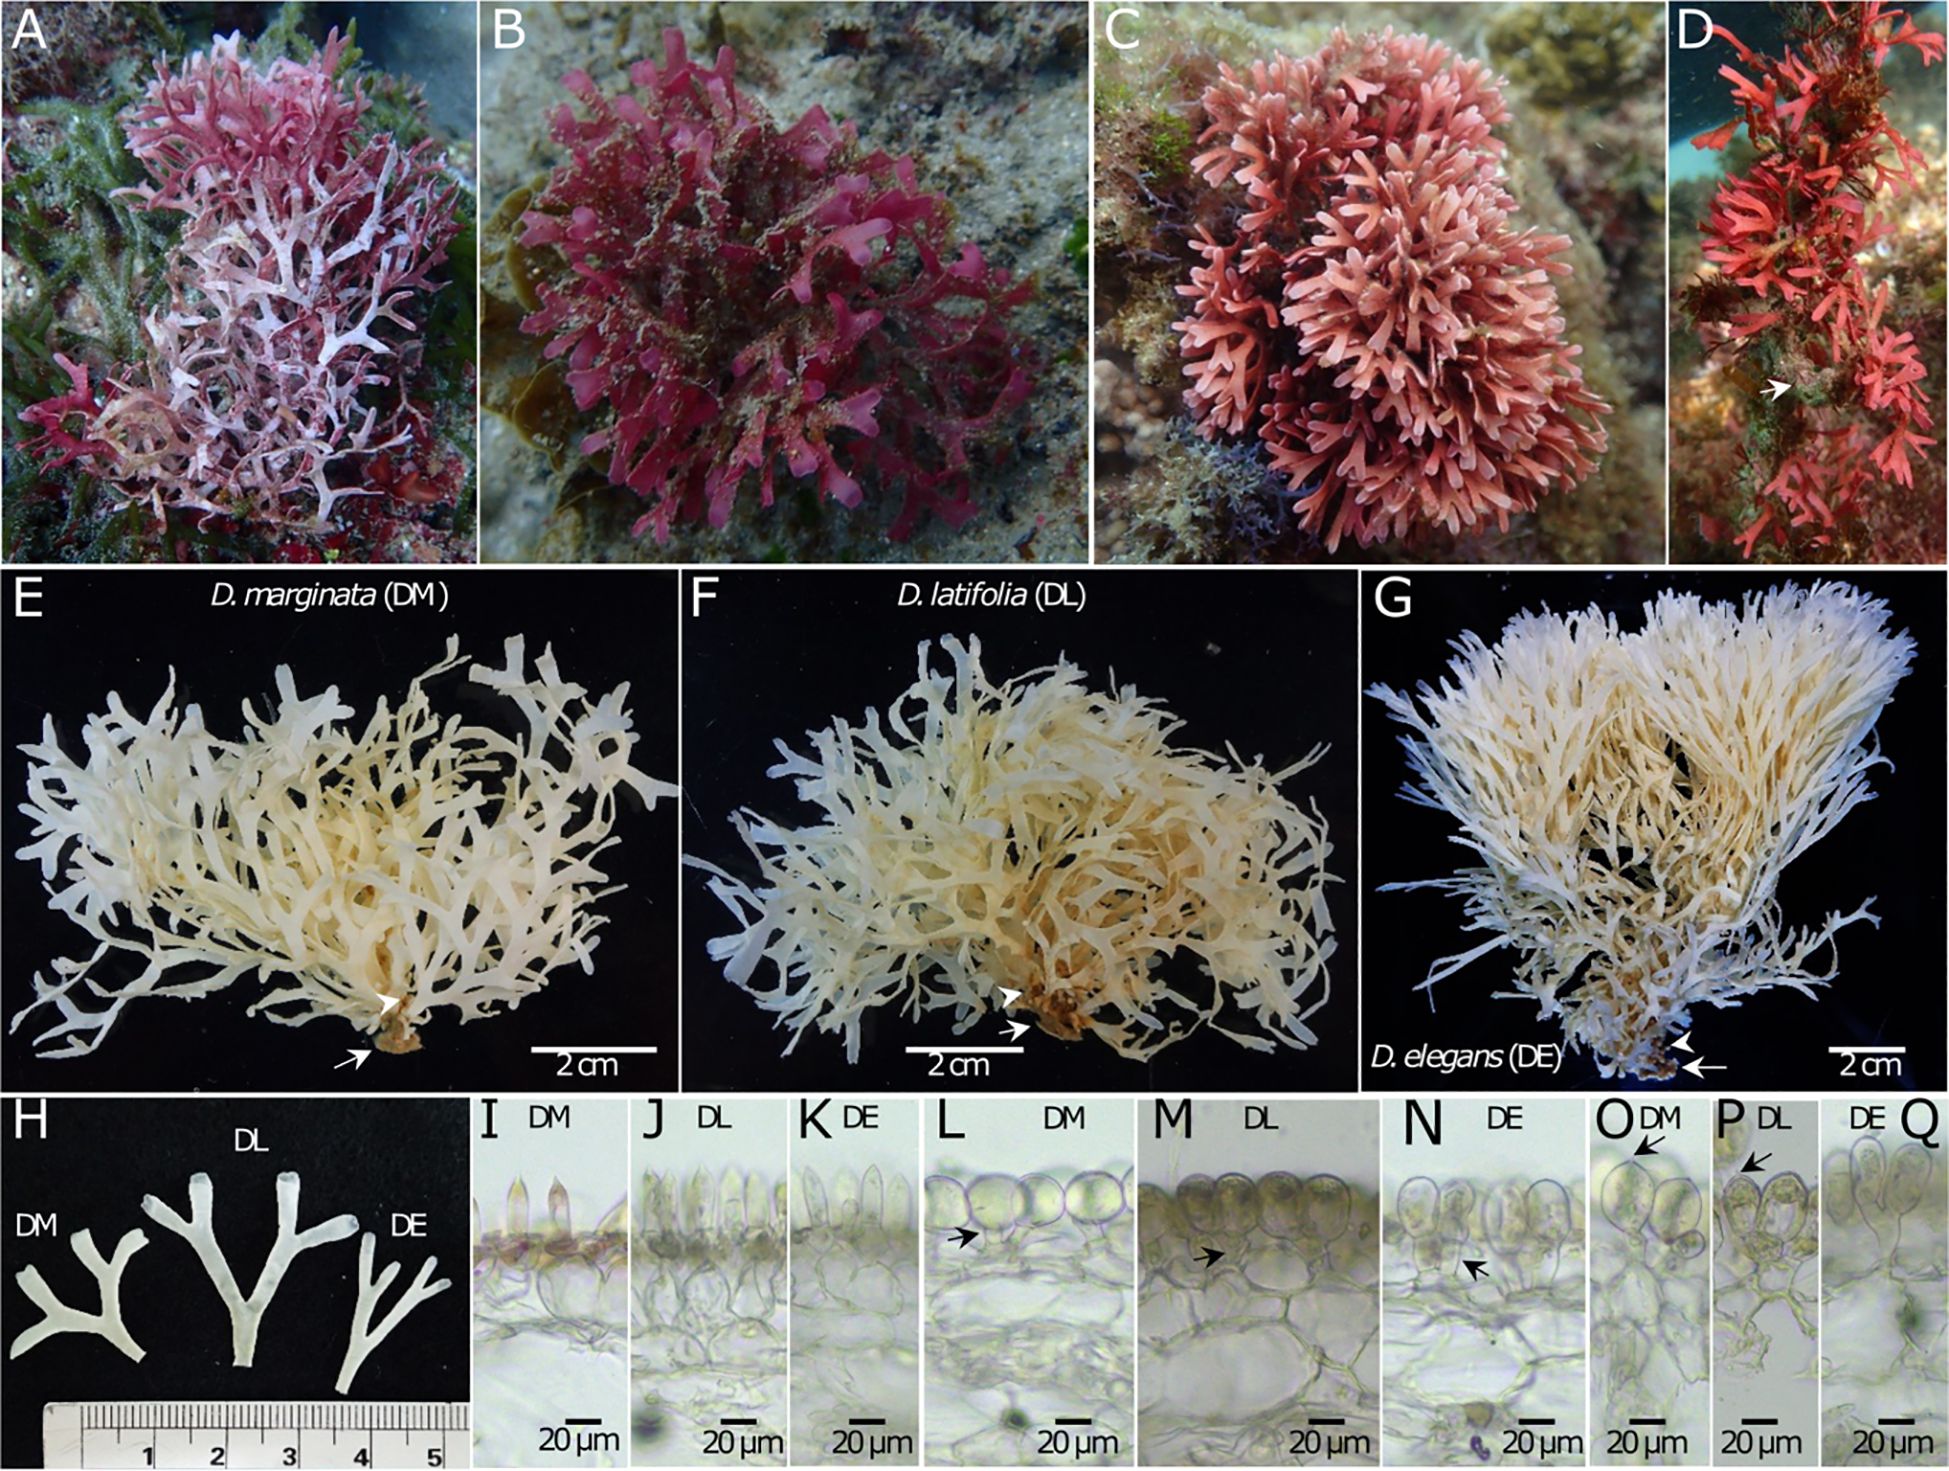
Figure 3 Morphological comparison between the three Dichotomaria species found in Taiwan. (A–D) In situ photos of D. “marginata” (A), D. latifolia (B), and D. elegans growing on a rock (C), and a worm tube, indicated by the arrow (D). (E–G) Habit. Arrows indicate holdfast and arrowheads indicate cylindrical hairy branch. (H) Branch. (I–K) Gametophytic cortex. Arrows indicate epidermal cells and arrowheads indicate spine cells. (L–N) Tetrasporophytic cortex from the middle part of the branch. Arrows indicate stalk cells and arrowheads indicate outer cortical cells. (O–Q) Tetrasporophytic cortex from the side of the branch. Arrows indicate apiculate tip on the outer cortical cells (notice that only the outer cortical cells from the side of the branch show the apiculate tip when present). Specimens examined are listed as follows: D. “marginata” [(A) #KTR40B08, Kenting National Park, Eluanbi Peninsula, South Taiwan; (E, H) #TUNG13098, XiangJiaoWan, Kenting Nartional Park, Eluanbi Peninsula, South Taiwan; (I) #SGAD1606279*, Barangay Project, Biri Is., North Samar, Philippines; (L, O) TUNG14109.4, 3rd Nuclear Outlet, Kenting Nartional Park, South Taiwan], D. latifolia [(B) #KTR31E08, 3rd Nuclear Outlet, Kenting Nartional Park, South Taiwan; (F, H, J) #HAST146273, Dahsianglan, Northeast Taiwan; (M, P) #TUNG05409, Longdong, Northeast Taiwan], and D. elegans [(C) #TUNG14245.2, WanLiTong, Kenting National Park, South Taiwan; (D) #TUNG14010.11, WanLiTong, Kenting National Park, South Taiwan; (G, H, N, Q) #HAST146272, XiaoGangKau, Kenting National Park, Eluanbi Peninsula, South Taiwan; (K) #TUNG14023.5, HuaPingYan, Xiaoliuqiu Island, Southwestern Taiwan].* Due to the absence of a well-conserved gametophytic representative of D. “marginata” from Taiwan, a specimen collected in the Philippines was analyzed instead.
The two species G. elegans and G. latifolia (Tanaka, 1935) are currently associated with the genus Galaxaura. Given that our research findings indicate their affiliation with the D. marginata complex, we propose two new combinations: D. elegans (T.Tanaka) S.Fontana et al. comb. nov. and D. latifolia (T.Tanaka) S.Fontana et al. comb. nov. Details are as follow:
Dichotomaria elegans (T.Tanaka) S.Fontana, W.-L.Wang & S.-L.Liu comb. nov.
BASIONYM: Galaxaura elegans T.Tanaka, 1935.
TYPE LOCALITY: Garanbi (Formosa) (Tanaka, 1935). The name “Garanbi” refers to the Eluanbi Peninsula, Kenting National Park, South Taiwan.
GEOGRAPHIC DISTRIBUTION: Southeast and North Luzon, Philippines; Dongsha Atoll, South China Sea; Luzon Strait; South, East, and Northeast Taiwan; Hachijo Island, Japan.
TOPOTYPE: HAST146272, collected from XiaoGangKau, Eluanbi Peninsula, Kenting National Park, South Taiwan (21°54’15.3”N 120°50’49.9”E); deposited at the Herbarium of Biodiversity Research Center, Academia Sinica, Taipei (HAST), Taiwan; GenBank accession: rbcL PP003463, cox1 PP003682, cox2-3 PP003559.
SPECIMENS EXAMINED: HAST146272 (topotype), TUNG14245.2 (WanLiTong, Kenting National Park, South Taiwan), TUNG14010.11 (WanLiTong, Kenting National Park, South Taiwan), TUNG14023.5 (HuaPingYan, Xiaoliuqiu Island, Southwest Taiwan).
Dichotomaria latifolia (T.Tanaka) S.Fontana, W.-L.Wang & S.-L.Liu comb. nov.
BASIONYM: Galaxaura latifolia T.Tanaka, 1935.
TYPE LOCALITY: Kelung, Dairi (Formosa) (Tanaka, 1935). “Kelung” refers to the area surrounding Keelung city, in Northeast Taiwan.
GEOGRAPHIC DISTRIBUTION: Northeast Taiwan, East Taiwan (Taitung), Penghu Islands, South Taiwan.
TOPOTYPE: HAST146273, collected from Dahsianglan, Northeast Taiwan (25°01’37.1”N 121°58’39.6”E); deposited at Herbarium of Biodiversity Research Center, Academia Sinica, Taipei (HAST), Taiwan; GenBank accession: rbcL AY688021, cox1 PP003717.
SPECIMENS EXAMINED: HAST146273 (topotype), TUNG05409 (Longdong, Northern Taiwan), KTR31E08 (3rd Nuclear Outlet, Kenting National Park, Southern Taiwan).
3.3 Haplotype network analysis
We expanded our investigation on D. elegans to encompass a more comprehensive geographic distribution. This involved an extensive sampling effort, employing multi-locus and single-locus haplotype networks. The unrooted multi-locus network tree confirmed the separation of D. elegans in the three monophyletic lineages 1, 2, and 3, the latter corresponding to specimens from Sorsogon, southeast Luzon, Philippines. Lineage 2 appears to have the highest diversity (Figure 4A). The relationships between the three lineages are not resolved from this analysis, as depicted by the central quadrilateral. Consistent with the multi-locus analysis, the rbcL network showed the three lineages converging into a single “missing haplotype” (Figure 4B). The rbcL gene displayed a low haplotype diversity compared to mitochondrial genes, as all specimens from lineage 1 shared identical haplotypes, while specimens from lineage 2 exhibited five different haplotypes. It should be noted that the haplotype H6 of rbcL, exclusive to Hachijo Island, Japan, the northernmost location for D. elegans, was supported by a single sequence retrieved from GenBank, therefore cox1 and cox2-3 were not determined for this specimen (Figure 4B).
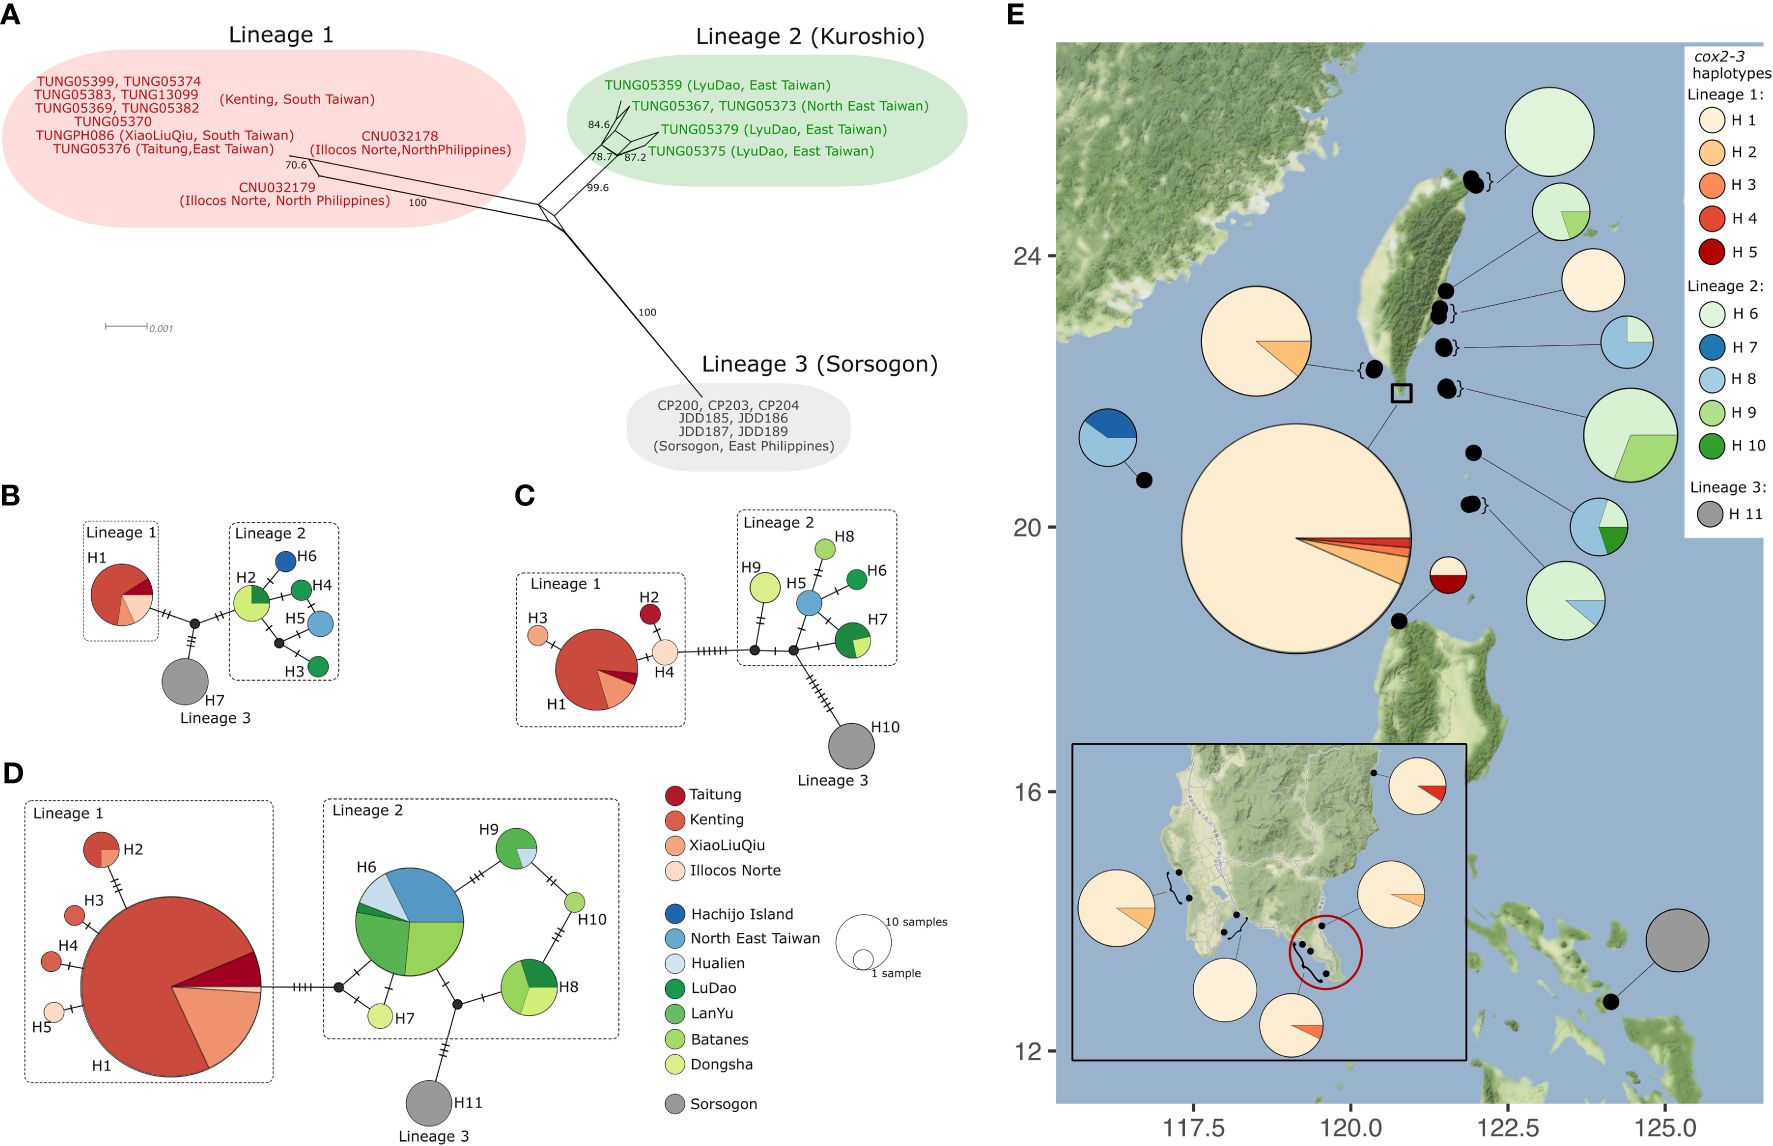
Figure 4 Haplotype network of Dichotomaria elegans. (A) Phylogenetic network of Dichotomaria elegans based on a multi-locus alignment (rbcL, cox1, and cox2-3, n=23), obtained with SplitTree v4.19.2, using the neighbor network method. Numbers along edges are bootstrap values from 1,000 replicates. Only bootstrap support values >70% are shown. (B–D) Median-joining haplotype network based on rbcL (n=27) (B), cox1 (n=43) (C), and cox2-3 (n=169) (D), constructed in PopART. Each circle represents a single haplotype, with the size of the circle proportional to its frequency in the sample size. Haplotypes are color-coded according to their respective collection locations, as indicated in the legend. Hatch marks indicate mutational steps. Small black circles indicate missing haplotypes. (E) Geographic distribution of cox2-3 haplotypes of D. elegans from 16 locations (31 coordinates, grouped together when geographically close). The pie charts represent the proportion of haplotypes in each location, as indicated in the legend. Black circles denote the 31 sampling coordinates. The red circle marks the type locality of D. elegans, Eluanbi Peninsula (Tanaka, 1935).
The haplotype networks of cox1 (Figure 4C) and cox2-3 (Figure 4D) showed that lineage 3 (Sorsogon, cox1 H10 and cox2-3 H10) possibly grouped with lineage 2, yet distantly related. In lineage 1, cox1 H1 and cox2-3 H1 were the predominant haplotypes and closely related to rare haplotypes H2, H3, H4 (cox1), and H2, H3, H4, H5 (cox2-3), differing by a maximum of three mutations (Figures 4C, D). For cox1, samples from each location displayed distinct and unique haplotypes in lineage 2, except for cox1 H7 which was shared by Lyudao and Batanes islands (Figure 4C). The dominant cox2-3 haplotype in lineage 2, i.e., H6, was found at all locations with lineage 2, except at Dongsha Atoll (Figure 4D). One haplotype (cox1 H9 and cox2-3 H7) is unique to Dongsha Atoll and showed a greater genetic distance compared to other haplotypes for cox1 and cox2-3 (Figures 4C, D). Of all the cox1 and cox2-3 haplotypes in lineage 2, it appeared closest related to lineage 1. Notably, samples from Sorsogon, Philippines always exhibited an exclusive haplotype (rbcL H7, cox1 H10, cox2-3 H11) that greatly differs from lineages 1 and 2 (Figures 4C, D). Therefore, we treated the Sorsogon haplotypes as a third lineage. Overall, lineage 2 showed higher haplotype and nucleotide diversity than lineage 1 (Table 1).
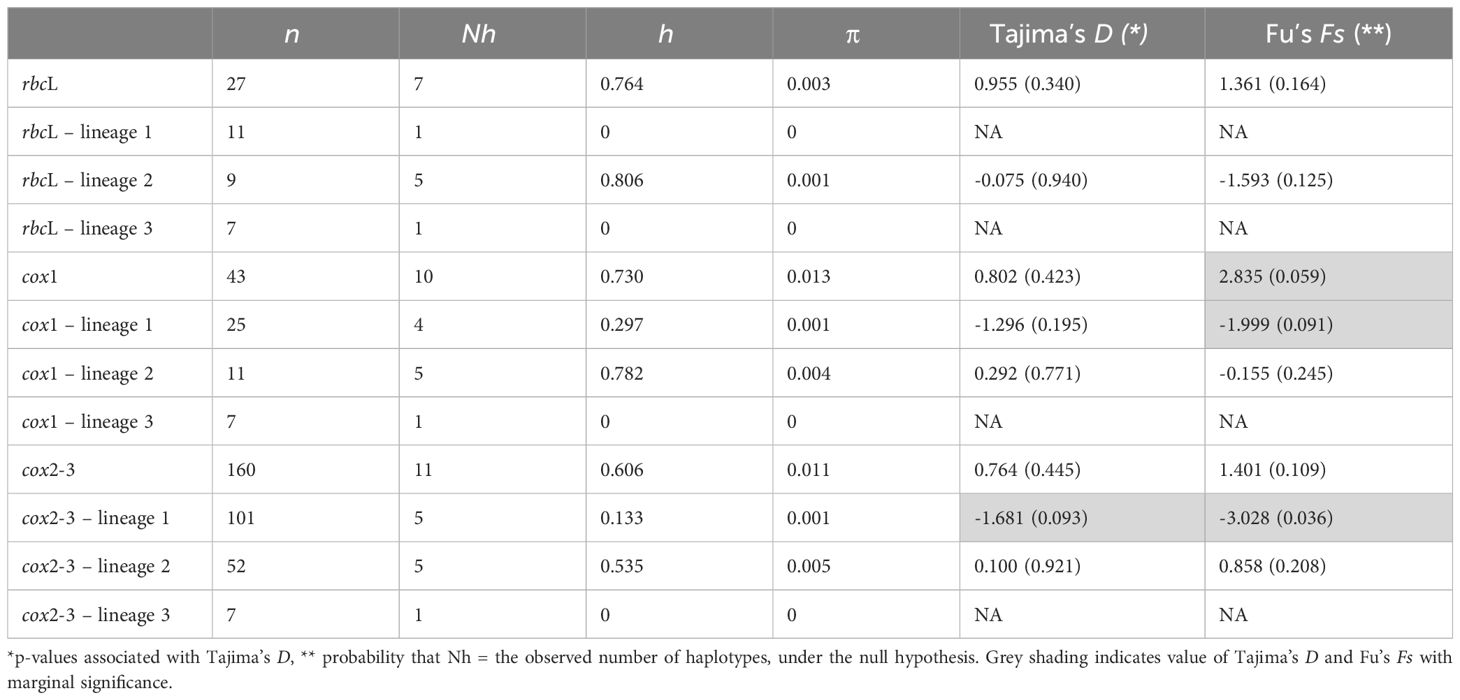
Table 1 Sample size (n), number of haplotypes (Nh), haplotype diversity (h), nucleotide diversity (π), Tajima’s D and Fu’s Fs of Dichotomaria elegans lineages.
The geographical distribution of D. elegans showed a distinct distribution pattern of the three lineages (Figure 4E). Lineage 1 was predominantly observed in the Northern Philippines and the southern region of Taiwan, including the type locality of D. elegans, the Eluanbi Peninsula within Kenting National Park (Tanaka, 1935). This location hosted the most common haplotype of lineage 1 (cox2-3 H1) with high frequency, along with the cox2-3 haplotypes H2 and H3. In Ilocos Norte, North Philippines, the southernmost location of lineage 1, the most common cox2-3 haplotype H1 was found, along with the unique cox2-3 haplotype H5 exclusive to this location. In contrast, lineage 2 exhibited a broader latitudinal range along the Kuroshio Current (Figure 4E). The most common cox2-3 haplotype within lineage 2, H6, along with a combination of other cox2-3 haplotypes H8, H9, and H10, was distributed across multiple islands in the Luzon Strait (Batanes) and east of Taiwan (Lanyu, Lyudao), as well as on the east and northeast coasts of Taiwan. Additionally, specimens of lineage 2 were found in Dongsha Atoll, in the South China Sea, exhibiting a distinct cox2-3 haplotype H7 that was solely found in this location. Lineage 3 was found at the southernmost D. elegans location, i.e., Sorsogon, southeast Luzon, Philippines. Lineage 3 consists of a single cox2-3 haplotype H11, which links to lineage 2.
3.4 Divergence time, gene flow, and demographic history
The IM results indicated that the estimated divergence time between lineages 1 and 2 is approximately 3.7 Mya (95% HPD: 1.924–6.036 Mya) (Figure 5A). The posterior distribution of m1 (lineage 1 to lineage 2) and m2 (lineage 2 to lineage 1) shows no clear peaks, with a probability of migration approaching zero (Figures 5B, C), indicating the absence of gene flow from both directions. The neutrality tests (Tajima’s D and Fu’s Fs) were non-significant for all the loci analyzed (Table 1). A marginally significant negative value was shown for lineage 1 (p < 0.1, Table 1), suggesting a possible demographic expansion. The Extended Bayesian Skyline Plots revealed that both lineages 1 and 2 underwent gradual, long-term slight population growth, followed by more substantial expansion occurring at around 0.265 Mya for lineage 1 and 0.581 Mya for lineage 2 (Figures 5D, E).
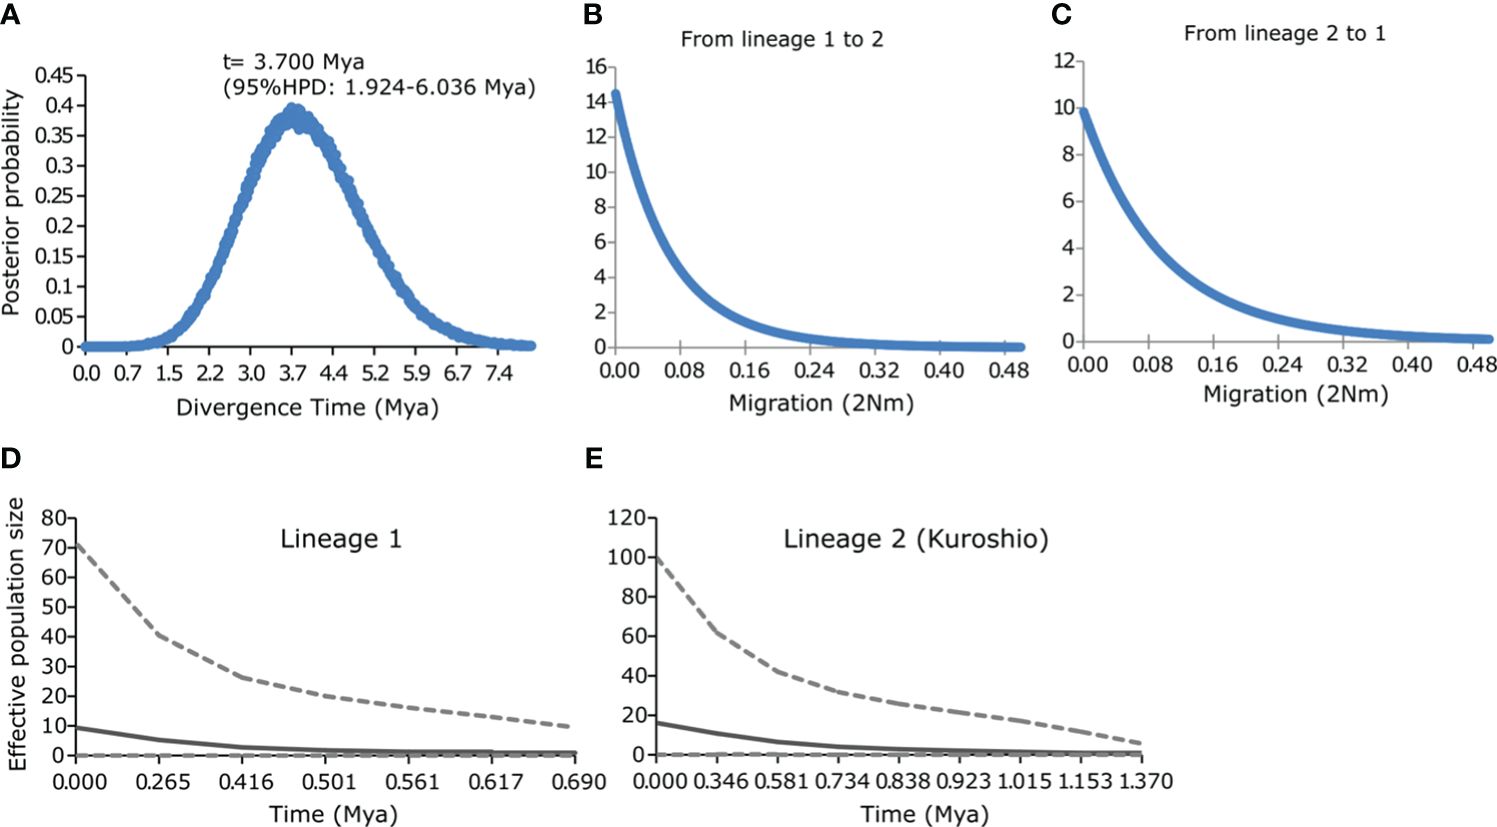
Figure 5 (A–C) Estimated marginal posterior density distributions for the pairwise divergence time (A) and migration rates (2Nm) (B, C) of Dichotomaria elegans lineages 1 and 2, inferred from cox1 and cox2-3 loci. (D, E) Extended Bayesian skyline plots of lineage 1 (D) and lineage 2 (E) of D. elegans, inferred from inferred from cox1 and cox2-3 loci. The upper and lower dashed gray lines represent the 95% highest posterior density intervals.
3.5 Environmental and morphological comparison of lineages 1 and 2 of D. elegans
We examined the ecological and morphological data to assess whether there was any significant difference between lineages 1 and 2. The PCA analysis, based on 14 environmental parameters (seven parameters with long-term maximum and minimum values each), showed that the first component (PC1) accounted for 23.9% of the variance in the data, while the second component (PC2) accounted for 19.7% of the variance (Figure 6). The top three environmental parameters for PC1, based on the eigenvector, were minimum and maximum temperature and minimum oxygen concentration (Table 2). The sampling locations of lineage 2 exhibited lower temperature (min and max), but higher oxygen (min and max), nitrate (min and max), and phosphate concentration (max), as well as higher current speed (min), and salinity (min), compared to those of lineage 1 (Table 2). For PC2, the top three environmental parameters were maximum salinity, maximum current speed, and minimum phosphate concentration, all of which were higher in the locations of lineage 2 compared to lineage 1 (Table 2). The first five PCs, which can explain over 80% of the variance in environmental data, were assigned as independent variables for the PERMANOVA analysis. PERMANOVA revealed a significant difference between the locations of lineages 1 and 2 (Table 3, F1,29 = 3.795, p = 0.002). Despite these differences, the PCA analysis showed overlapping areas for the locations of lineages 1 and 2, indicating similar environmental properties, particularly in geographically proximate regions. The most notable variations were attributed to the southernmost location of lineage 1 (Ilocos Norte, Philippines) and the northern location of lineage 2 (Hachijo Island, Japan) (Figure 6). Current speed and direction in summer and winter are visualized in Supplementary Figure 5.
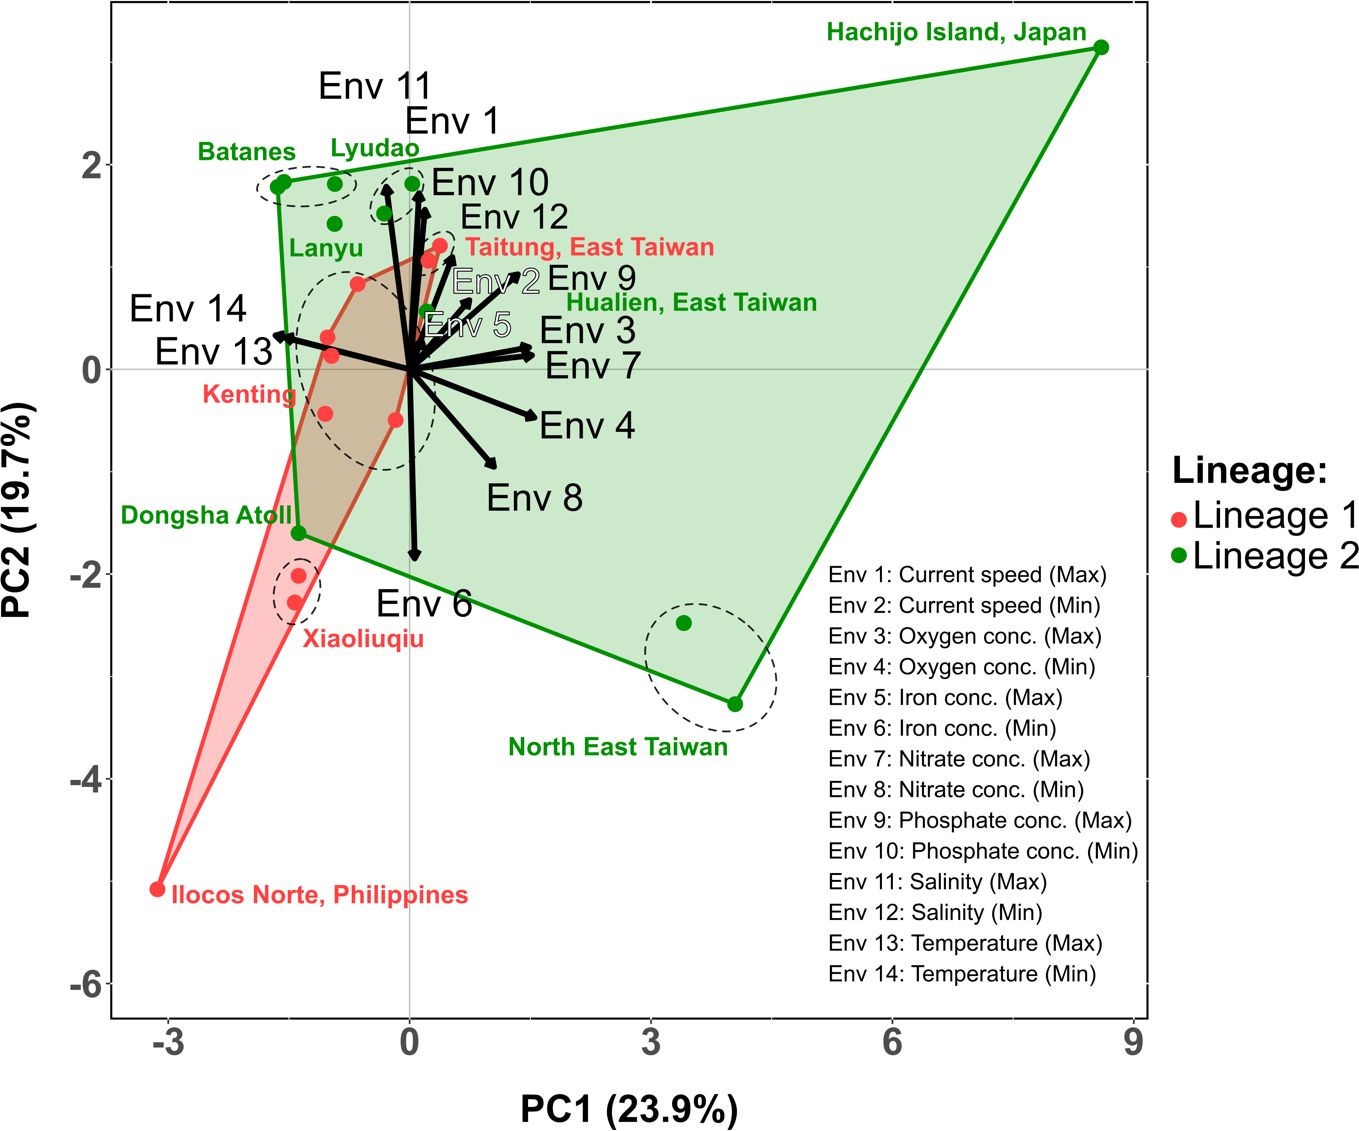
Figure 6 Principal component analysis plot of sea surface environmental parameters associated with the location of Dichotomaria elegans lineages 1 and 2. Each point represents a location, categorized by the presence of either lineage 1 or lineage 2. Arrows indicate the degree of correlation between the environmental parameters and two principal components (PC1 and PC2). Direction and length of the arrows signify the strength and direction of the correlation, respectively.
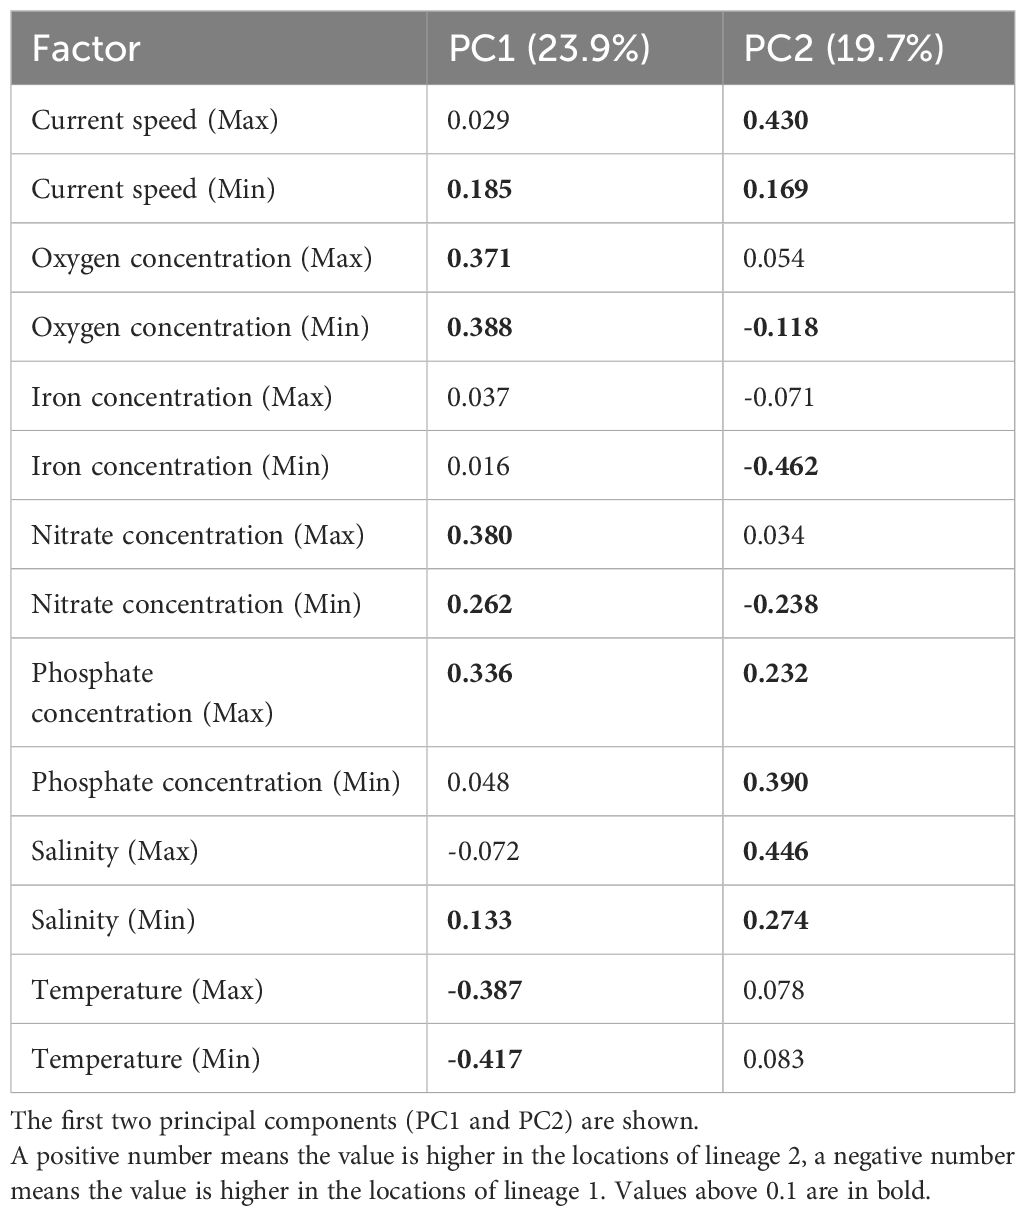
Table 2 Principal component analysis loadings showing the difference of the location of Dichotomaria elegans lineages 1 and 2.
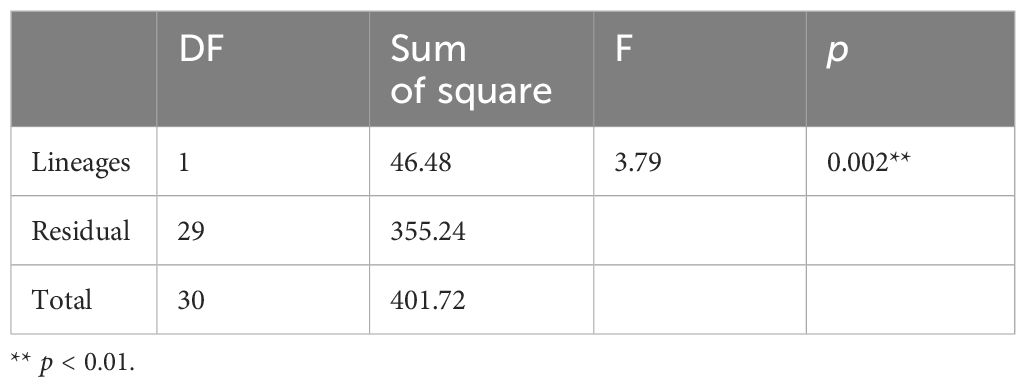
Table 3 Results of PERMANOVA analysis comparing the differences in principal components (derived from environmental parameters) between the locations of Dichotomaria elegans lineages 1 and 2.
PERMANOVA showed a significant difference between the tetrasporophyte of lineages 1 and 2, both for cortex cell measurements (Supplementary Table 9, F1,141 = 7.084, p = 0.001), and thallus width (nodes and internodes) measurements (Supplementary Table 10, F1,32 = 4.625, p = 0.002). The PCA analysis of cortex cells showed that the first component (PC1) accounted for 30.2% of the variance in the data, while the second component (PC2) accounted for 24.3% of the variance (Supplementary Table 11; Figure 7A), while for the thallus width measurements, PC1 and PC2 accounted for 61.8% and 13.5% of the variability, respectively (Figure 7B; Supplementary Table 12). Despite these differences, there is a clear overlap between the area occupied by lineages 1 and 2 (Figure 7). Overall, lineage 1 cortex cells and thallus exhibited larger dimensions in comparison to lineage 2, although both lineages still fell within a similar size range (Supplementary Tables 13, 14).
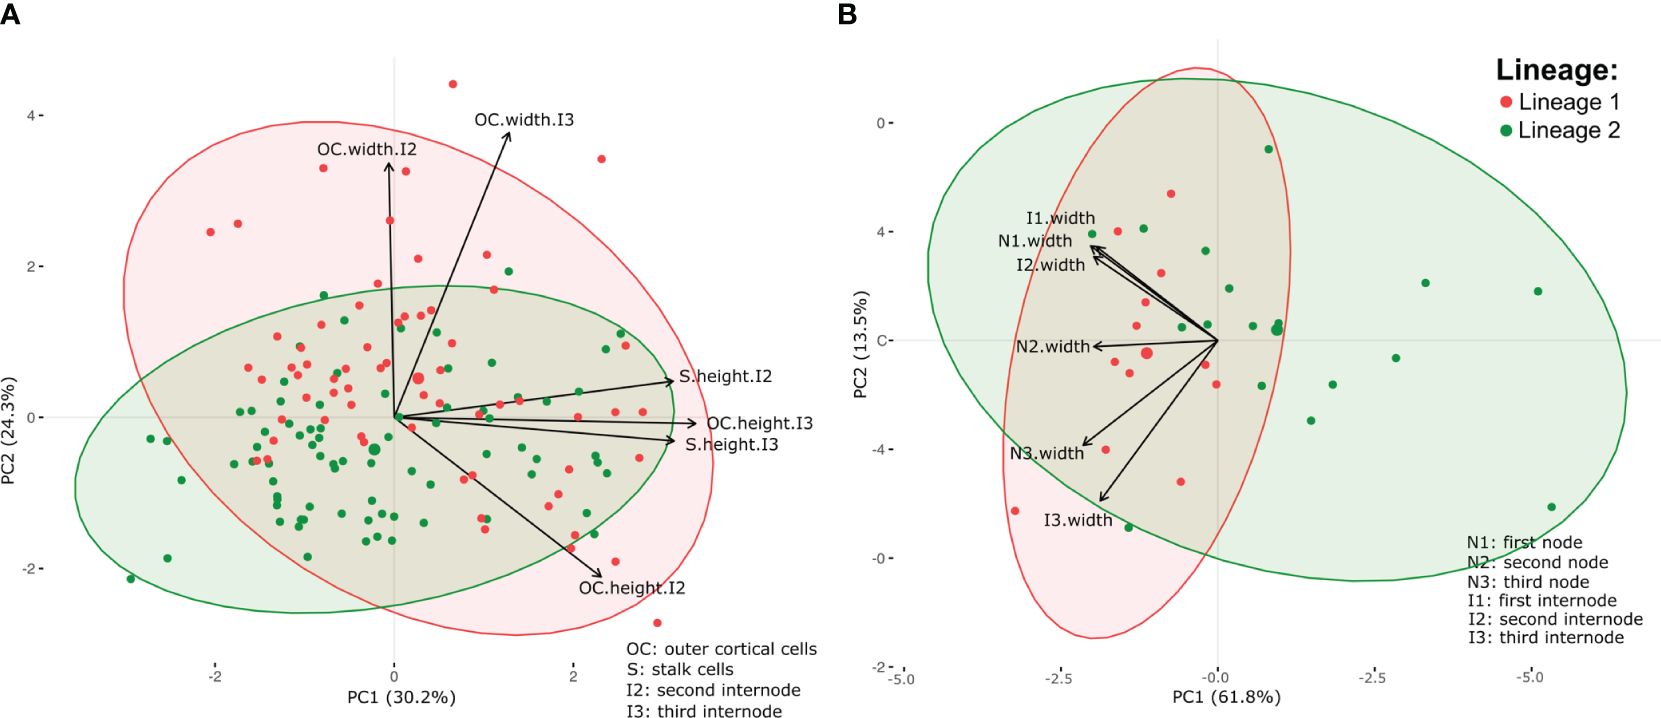
Figure 7 Principal component analysis plot of the cortex cell measurements (A), and thallus width measurements (B) of the tetrasporophyte of Dichotomaria elegans lineages 1 and 2. Arrows indicate the degree of correlation between the measurements and two principal components (PC1 and PC2). Direction and length of the arrows signify the strength and direction of the correlation, respectively.
4 Discussion
Our research on the D. marginata complex revealed that the majority of the clades and/or species within the complex have unresolved relationships with each other, resulting in polytomies or nodes with low support in the phylogeny. Several factors may contribute to this ambiguity, including hybridization or introgression between lineages, potential gaps in evolutionary links within our dataset, or possibly a recent radiation event. However, as of now, we remain uncertain as to which factor is primarily responsible for these observations. Nonetheless, we identified three distinct species in Taiwan: D. elegans and D. latifolia, originally classified as two Galaxaura species in southern and northern Taiwan (Tanaka, 1935), alongside a circumtropical species, tentatively identified as D. “marginata”. The uncertainty concerning D. marginata stems from our discovery of two distinct clades close to the type locality, in the Caribbean (specifically the Bahamas), namely the circumtropical clade and an exclusive Caribbean clade. Consequently, we are unable to determine which of the two clades identified in the same geographic region accurately represents D. marginata. Dichotomaria elegans, while initially considered endemic to Taiwan, has been found to have a broader range, spanning the Philippines, the South China Sea, and Japan. Before this study, D. latifolia was only known from Northeast Taiwan, however, we expanded its record to Northeast, East, and South Taiwan, as well as Penghu Islands (West Taiwan). Consistent with observations made in other studies (Huisman et al., 2004a; Liu et al., 2013; Santos et al., 2020), our study provides further evidence for the presence of locally endemic species within the D. marginata complex. However, the circumtropical species D. “marginata” appears to deviate from the observed trend of endemism. Two potential reasons could explain this deviation. First, our analysis revealed distinct clades within the circumtropical D. “marginata”; consequently, future investigations might challenge the notion of a circumtropical species by unveiling cryptic species. Secondly, recent human activities, such as introductions through aquaculture or ballast water release could have played a role in introducing D. “marginata” from the Caribbean to the West Pacific or vice versa (Liu et al., 2013).
The conflicting results obtained for rbcL and cox1 in our species delimitation analyses are consistent with cases of relatively recent speciation and less divergent loci. In the broader context of red algae research, it is a common trend that cox1 evolves at a faster rate than rbcL (Montecinos et al., 2012; Muangmai et al., 2014; Boo et al., 2022), which is consistent with our observations for the overall diversity within the D. marginata complex. Indeed, cox1 displayed a greater level of genetic divergence (p-distance = 0.05) than rbcL (p-distance = 0.02). D. elegans exhibits three distinguishable lineages. However, analyses based on rbcL and cox1 yield conflicting results: the concatenated phylogeny places lineage 3 as basal; however, D. elegans lacks a clear sister species to definitively confirm this placement; conversely, mitochondrial analyses position lineage 3 within lineage 2. These disparities suggest it is premature to conclude whether they represent distinct species. Additionally, the p-distance among D. elegans lineages is lower compared to that among other recognized species within the D. marginata complex. Nonetheless, our species delimitation analysis, while not definitive regarding the potential number of species within D. elegans, does underscore cryptic diversity within this species.
A body of compelling evidence suggests that the Kuroshio Current serves as an essential vector of propagules transportation from the Philippines to higher latitudes areas such as Taiwan and Japan. This phenomenon has been consistently observed across various organisms, including fish, corals, copepods, and seagrass, as evidenced by studies conducted by Chen and Keshavmurthy (2009), Hsiao et al. (2011), Shen et al. (2011), and Arriesgado et al. (2016). In line with these observations, our research reveals a similar biogeographical pattern within lineage 2 of D. elegans, further confirming its dispersion by the Kuroshio Current. This conclusion gains additional support from our findings of the presence of lineage 2 in Dongsha Atoll, given that the Kuroshio Current has been shown to periodically intrude into the South China Sea (Wu et al., 2017). Over the course of the latitudinal transportation by the Kuroshio Current, populations exhibit isolation-by-distance, showing the presence of genetic differentiation around 35°N between the northern peripheral populations compared to the southern populations. These variations are often attributed to differences in thermal tolerance between the northern and southern parts of populations along the Kuroshio Current (Yasuda et al., 2014; Ackiss et al., 2018; Boo et al., 2019). In line with this, we observed a unique haplotype corresponding to the northernmost specimens of D. elegans, located at 33.09°N (Hachijo Island, Japan). Additionally, we identified an isolated lineage (lineage 3) located in Sorsogon, Philippines, at 12.76°N, which is located close to the bifurcation of the North Equatorial Current. Since the latitude of the bifurcation is seasonally and annually variable, spanning from 12.9°N and 14.1°N, with an annual average of 13.4°N (Wang and Hu, 2006) it is possible that lineage 3 resides at the start of the Kuroshio Current and, therefore upstream of lineage 2. Alternatively, Sorsogon may be separated from the Kuroshio Current, which would account for the distinct lineage 3. To further explore and validate these observations, a more comprehensive sampling effort along the Kuroshio Current is required, particularly around the Ryukyu archipelago to test for isolation-by-distance within lineage 2 and along the east coast of the Philippines, spanning from Sorsogon to the northern regions, to understand the relationship between lineage 3 and other D. elegans populations.
Beyond the transportation facilitated by the Kuroshio Current, another prominent pattern in biogeography within the Northwest Pacific Ocean area relates to the population structure found in species inhabiting peripheral seas. These peripheral seas include the Yellow Sea, East China Sea, Sea of Japan, and South China Sea. The population structure observed in these areas is primarily attributed to their isolation during the Pleistocene glaciation periods when lower water levels resulted in regional separation. Various organisms, including fish, crustaceans, mussels, gastropods, and algae, exhibit this genetic signature, reflecting historical isolation (Shen et al., 2011; He et al., 2015; Cheng and Sha, 2017; Lee et al., 2021). Our study revealed that lineage 1 of D. elegans exhibits a split distribution, found along the southern coast of Taiwan and in the Northern Philippines. Although lineage 1 is not confined to a peripheral sea, it is present in areas that remained inundated during the Pleistocene glaciations. Hence, lineage 1 possibly showed a limited dispersal while persisting in glacial refugia.
The formation of the Taiwan landmass completed around 5 Mya (Hall, 2002), and the establishment of the present path of the Kuroshio Current is estimated at around 3 to 3.5 Mya (Gallagher et al., 2015; Wang et al., 2020). This timeframe coincides with the divergence time of lineages 1 and 2 of D. elegans, around 3.7 Mya (mid-Pliocene period). The separation time and geographical location of the three D. elegans lineages suggest a colonization of lineage 2 from South to North, followed by the later appearance of lineage 1. We were unable to determine the divergence time of lineage 3 due to insufficient multiple haplotypes. Nevertheless, considering its geographical position and its basal position to lineages 1 and 2 in the phylogenetic analysis, albeit contradictory result of the mitochondrial haplotype networks, we hypothesize that lineage 3 may have originated from a common ancestor shared with lineage 2. This divergence might have occurred due to subsequent isolation resulting from the absence of interaction with the Kuroshio Current. This scenario is also supported by the absence of gene flow between lineages 1 and 2 and the steady independent demographic expansion of lineages 1 and 2.
Several factors may have influenced the separation between lineage 1 and 2 of D. elegans. First, the population in the south of Taiwan (lineage 1) was possibly left isolated due to impassable strong currents and lower dispersal capabilities, as they lack flagella or floating thalli. At the same time, lineage 2 dispersal through the Kuroshio Current can explain its higher genetic diversity and wider range. Second, the eddies created by the current intrusion in the waters of Southwest Taiwan may have further isolated lineage 1. These eddies are variable in direction and strength, and it was shown that they never reach the Dongsha Atoll (Nan et al., 2011). This is concordant with the finding of lineage 1 in the South of Taiwan but not in Dongsha Atoll, despite the two locations being geographically closer. Lineage 1 was also identified in northern Luzon (18°35’16.1”N, 120°46’14.8”E). However, the Kuroshio Current intrusion into the South China Sea, putatively responsible for the dispersal of lineage 2 in the Dongsha Atoll, does not directly affect North Luzon (Nan et al., 2015 and Figure 1). This observation further elucidates why lineage 1 is absent from the Dongsha Atoll. These data suggest that the influence of the Kuroshio Current on the South and Southwest coasts of Taiwan and North Luzon is more complex compared to its direct impact on offshore islands such as Lanyu and Lyudao. Here, the current systems can act as a barrier that isolates populations, particularly for species with limited dispersal capabilities such as D. elegans. A third factor may have contributed to the geographical separation of lineages 1 and 2 despite the close proximity. On the East Coast of Taiwan, at around 23.47°N, is an eastward-facing cliff. Moreover, at this latitude lies the Xiuguluan River, connected to an underwater canyon, known as the Chimei Canyon (Chiang and Yu, 2022). Interestingly, specimens from lineages 1 and 2 were discovered south and north of this location, respectively, only 40 km apart. Lineage 1 was found at 23.115°N and 23.228°N (to the south), while lineage 2 was located at 23.484°N (to the north). The geographical configuration, both on land and underwater, may have influenced the separation of populations. On the East Coast of Taiwan, lineage 1 is connected to the southern region of Taiwan, while lineage 2 likely arrived via the Kuroshio Current. Lastly, environmental differences may have enhanced the separation of the lineages. The Kuroshio Current is fast-flowing and is responsible for transporting salt and heat to higher latitudes (Qu and Lukas, 2003). While the Kuroshio Current is oligotrophic, it has been shown to produce upwelling and vertical mixing, leading to higher nutrient input on the surface (Chen et al., 2022). As expected, we have found that the locations hosting lineage 2, hence the Kuroshio lineage, exhibit environmental characteristics (i.e., higher concentrations of oxygen, nitrate, and phosphate, elevated salinity, and higher current speeds) that are markers for the presence of the Kuroshio Current. On the other hand, the locations hosting lineage 1 experience overall higher temperatures, primarily attributable to its positioning on the southern side of the D. elegans range. It is possible that these two lineages have already adapted to these differences; however, we hypothesize that, at the present stage, they remain separated more by dispersal barriers than by environmental factors.
Red algal species are morphologically differentiated by the gross morphology of the thallus, including overall in situ appearance, thallus size, and branch length, as well as the characteristics of the sporophyte cortex, such as the size and shape of the different layers of cells composing the cortex. Previous studies comparing the morphology of Dichotomaria species have also relied on these traits (Tanaka, 1935; Kurihara et al., 2005; Wang et al., 2005; Liu et al., 2013; Wiriyadamrikul et al., 2014; Schneider et al., 2016). Building upon these diagnostic traits used for red algae, we have expanded the existing original account of D. elegans and D. latifolia (Tanaka, 1935) by providing newly generated morphological descriptions, micromorphology plates, and corresponding molecular data. These additions extend to three species within the D. marginata complex - D. elegans, D. latifolia, and D. “marginata”, found in Taiwan. This record serves as a valuable resource for future biodiversity studies, aiding in the comparative analysis and identification of these three species. Additionally, we have observed that distinguishing between the lineages of D. elegans based solely on morphological analyses is a substantial challenge. While lineages 1 and 2 do exhibit statistically significant disparities in size, with lineage 1 generally displaying larger size characteristics, there is a substantial overlap in size between them. Hence, our findings strongly advocate for the necessity of employing molecular analysis techniques to accurately determine the lineage of a given sample.
5 Conclusions
In this study, we proposed the two taxonomic combinations D. elegans and D. latifolia. We also provided molecular and morphological tools to differentiate between these two species and the circumtropical D. “marginata”. The three species occur in Taiwan. In addition, we deciphered the biogeographic pattern of the shallow-water red seaweed D. elegans. This species displays three distinct lineages. Lineage 1 is located in south and southwest Taiwan and in the northern Philippines; lineage 2 occurs along the Kuroshio Current and intrudes into the South China Sea; and lineage 3 is located near the bifurcation of the North Equatorial Current. These differences in biogeographic patterns are attributed to dispersal capabilities and evolutionary histories. We hypothesize that lineages 2 and 3 shared a common ancestor, with lineage 3 remaining isolated due to its position South of the Kuroshio Current. Given that lineages 1 and 2 diverged around 3.7 Mya, their divergence and biogeographical pattern were likely influenced by the Taiwan landmass formation and the establishment of the Kuroshio Current. The Kuroshio Current acts as a significant geographic barrier by both eddies and local cold upwelling domes, particularly between south Taiwan and the eastern offshore islands. This study highlights hidden cryptic red algal diversity in Taiwan, stressing the importance of distinguishing understudied species to unveil biogeographic patterns and identify trends and barriers in biogeography.
Data availability statement
The original contributions presented in the study are included in the article/Supplementary Files, further inquiries can be directed to the corresponding author/s.
Author contributions
SF: Conceptualization, Data curation, Formal analysis, Project administration, Software, Validation, Visualization, Writing – original draft, Writing – review & editing. W-LW: Data curation, Writing – review & editing. K-YT: Formal analysis, Investigation, Methodology, Software, Validation, Visualization, Writing – review & editing. SGAD: Investigation, Writing – review & editing. RVD: Investigation, Writing – review & editing. Z-MH: Formal analysis, Investigation, Methodology, Software, Visualization, Writing – review & editing. J-JL: Formal analysis, Investigation, Methodology, Software, Visualization, Writing – review & editing. P-HL: Investigation, Writing – review & editing. LM: Investigation, Writing – review & editing. ARS: Investigation, Writing – review & editing. SMB: Investigation, Writing – review & editing. S-LL: Conceptualization, Data curation, Funding acquisition, Project administration, Resources, Supervision, Validation, Visualization, Writing – original draft, Writing – review & editing.
Funding
The author(s) declare financial support was received for the research, authorship, and/or publication of this article. This study was supported mainly by the National Science and Technology Council of Taiwan to S-LL (NSTC 111-2621-B-029-002-MY3) and SF (NSTC 112-2811-B-029-001), and partially by the National Natural Science Foundation of China (32371697) to Z-MH. Additional funds were awarded to RVD by the Department of Science and Technology, the Philippine Council for Agriculture, Aquatic, and Natural Resources Research and Development (DOST-PCAARRD) and the Commission on Higher Education (LAKAS 2021-035).
Acknowledgments
We thank Mr. Wun-Ruei Chang, Dr. Akira Kurihara, Dr. Mayalen Zubia, Ms. Kristen Rohrer, Mr. Jomari Dig, and Mr. Clister V. Pangantihon for their assistance in molecular analyses and the provision of sequences and samples.
Conflict of interest
The authors declare that the research was conducted in the absence of any commercial or financial relationships that could be construed as a potential conflict of interest.
The reviewer MLG declared a past co-authorship with the author RVD to the handling editor.
Publisher’s note
All claims expressed in this article are solely those of the authors and do not necessarily represent those of their affiliated organizations, or those of the publisher, the editors and the reviewers. Any product that may be evaluated in this article, or claim that may be made by its manufacturer, is not guaranteed or endorsed by the publisher.
Supplementary material
The Supplementary Material for this article can be found online at: https://www.frontiersin.org/articles/10.3389/fevo.2024.1346199/full#supplementary-material
References
Ackiss A. S., Bird C. E., Akita Y., Santos M. D., Tachihara K., Carpenter K. E. (2018). Genetic patterns in peripheral marine populations of the fusilier fish Caesio cuning within the Kuroshio Current. Ecol. Evol. 8, 11875–11886. doi: 10.1002/ece3.4644
Arriesgado D. M., Kurokochi H., Nakajima Y., Matsuki Y., Uy W. H., Fortes M. D., et al. (2016). Population genetic diversity and structure of a dominant tropical seagrass, Cymodocea rotundata, in the Western Pacific region. Mar. Ecol. 37, 786–800. doi: 10.1111/maec.12350
Assis J., Tyberghein L., Bosch S., Verbruggen H., Serrão E. A., Clerck O. D., et al. (2018). Bio-ORACLE v2.0: Extending marine data layers for bioclimatic modelling. Global Ecol. Biogeogr. 27, 277–284. doi: 10.1111/geb.12693
Boo G. H., Leliaert F., Gall L. L., Coppejans E., Clerck O. D., Nguyen T. V., et al. (2022). Ancient Tethyan vicariance and long-distance dispersal drive global diversification and cryptic speciation in the red seaweed Pterocladiella. Front. Plant Sci. 13. doi: 10.3389/fpls.2022.849476
Boo G. H., Qiu Y., Kim J. Y., Ang P. O., Bosch S., Clerck O. D., et al. (2019). Contrasting patterns of genetic structure and phylogeography in the marine agarophytes Gelidiophycus divaricatus and G. freshwateri (Gelidiales, Rhodophyta) from East Asia. J. Phycol. 55, 1319–1334. doi: 10.1111/jpy.12910
Bouckaert R., Vaughan T. G., Barido-Sottani J., Duchêne S., Fourment M., Gavryushkina A., et al. (2019). BEAST 2.5: An advanced software platform for Bayesian evolutionary analysis. PloS Comput. Biol. 15, e1006650. doi: 10.1371/journal.pcbi.1006650
Chen C. A., Keshavmurthy S. (2009). Taiwan as a connective stepping-stone in the Kuroshio Triangle and the conservation of coral ecosystems under the impacts of climate change. Kuroshio Sci. 1, 15–22.
Chen C.-C., Lu C.-Y., Jan S., Hsieh C.-H., Chung C.-C. (2022). Effects of the Coastal Uplift on the Kuroshio Ecosystem, Eastern Taiwan, the Western Boundary Current of the North Pacific Ocean. Front. Mar. Sci. 9:796187. doi: 10.3389/fmars.2022.796187
Cheng J., Sha Z. (2017). Cryptic diversity in the Japanese mantis shrimp Oratosquilla oratoria (Crustacea: Squillidae): Allopatric diversification, secondary contact and hybridization. Sci. Rep-uk 7, 1972. doi: 10.1038/s41598-017-02059-7
Chiang C.-S., Yu H.-S. (2022). Controls of submarine canyons connected to shore during the LGM sea-level rise: Examples from Taiwan. J. Mar. Sci. Eng. 10, 494. doi: 10.3390/jmse10040494
Cole K. M., Sheath R. G. (1990). Biology of the red algae (Cambridge, New York, Port Chester, Melbourne, Sydney: Cambridge University Press). 517 pp.
Conklin K. Y., Kurihara A., Sherwood A. R. (2009). A molecular method for identification of the morphologically plastic invasive algal genera Eucheuma and Kappaphycus (Rhodophyta, Gigartinales) in Hawaii. J. Appl. Phycol. 21, 691. doi: 10.1007/s10811-009-9404-2
Darriba D., Taboada G. L., Doallo R., Posada D. (2012). jModelTest 2: more models, new heuristics and parallel computing. Nat. Methods 9, 772–772. doi: 10.1038/nmeth.2109
Drummond A. J., Rambaut A. (2007). BEAST: Bayesian evolutionary analysis by sampling trees. BMC Evol. Biol. 7, 214. doi: 10.1186/1471-2148-7-214
Faria R., Johannesson K., Stankowski S. (2021). Speciation in marine environments: Diving under the surface. J. Evol. Biol. 34, 4–15. doi: 10.1111/jeb.13756
Freshwater D. W., Rueness J. (1994). Phylogenetic relationships of some European Gelidium (Gelidiales, Rhodophyta) species, based on rbcL nucleotide sequence analysis. Phycologia 33, 187–194. doi: 10.2216/i0031-8884-33-3-187.1
Fu Y.-X. (1997). Statistical tests of neutrality of mutations against population growth, hitchhiking and background selection. Genetics 147, 915–925. doi: 10.1093/genetics/147.2.915
Fu M., Fan S., Wang Z., Song W., Sun K., Han H., et al. (2019). Buoyancy potential of dominant green macroalgal species in the Yellow Sea’s green tides, China. Mar. pollut. Bull. 140, 301–307. doi: 10.1016/j.marpolbul.2019.01.056
Gallagher S. J., Kitamura A., Iryu Y., Itaki T., Koizumi I., Hoiles P. W. (2015). The Pliocene to recent history of the Kuroshio and Tsushima Currents: a multi-proxy approach. Prog. Earth Planet Sci. 2, 17. doi: 10.1186/s40645-015-0045-6
Geraldino P. J. L., Yang E.-C., Boo S.-M. (2006). Morphology and molecular phylogeny of Hypnea flexicaulis (Gigartinales, Rhodophyta) from Korea. Algae 21, 417–423. doi: 10.4490/ALGAE.2006.21.4.417
Gotelli N. J., Ellison A. M. (2013). A primer of ecological statistics. 2nd ed. (MA, U.S.A: Sinauer Association, Inc).
Hall R. (2002). Cenozoic geological and plate tectonic evolution of SE Asia and the SW Pacific: computer-based reconstructions, model and animations. J. Asian Earth Sci. 20, 353–431. doi: 10.1016/S1367-9120(01)00069-4
Harper J. T., Saunders G. W. (2001). The application of sequences of the ribosomal cistron to the systematics and classification of the florideophyte red algae (Florideophyceae, Rhodophyta). Cahiers Biol. Mar. 42 (1), 25–38.
Hasegawa M., Kishino H., Yano T.-A. (1985). Dating of the human-ape splitting by a molecular clock of mitochondrial DNA. J. Mol. Evol. 22, 160–174. doi: 10.1007/BF02101694
He L., Mukai T., Chu K. H., Ma Q., Zhang J. (2015). Biogeographical role of the Kuroshio Current in the amphibious mudskipper Periophthalmus modestus indicated by mitochondrial DNA data. Sci. Rep-uk 5, 15645. doi: 10.1038/srep15645
Hsiao S. H., Fang T.-H., Shih C., Hwang J.-S. (2011). Effects of the Kuroshio current on copepod assemblages in Taiwan. Zool. Stud. 50 (4), 475–490.
Hu Z., Li J., Sun Z., Oak J., Zhang J., Fresia P., et al. (2015). Phylogeographic structure and deep lineage diversification of the red alga Chondrus ocellatus Holmes in the Northwest Pacific. Mol. Ecol. 24, 5020–5033. doi: 10.1111/mec.13367
Huisman J. M., Borowitzka M. A. (1990). A revision of the Australian species of Galaxaura (Rhodophyta, Galaxauraceae), with a description of Tricleocarpa gen. nov. Phycologia 29, 150–172. doi: 10.2216/i0031-8884-29-2-150.1
Huisman J. M., Harper J. T., Saunders G. W. (2004b). Phylogenetic study of the Nemaliales (Rhodophyta) based on large-subunit ribosomal DNA sequences supports segregation of the Scinaiaceae fam. nov. and resurrection of Dichotomaria Lamarck. Phycol. Res. 52, 224–234. doi: 10.1111/j.1440-183.2004.00344.x
Huisman J. M., Sherwood A. R., Abbott I. A. (2004a). Studies of Hawaiian Galaxauraceae (Nemaliales, Rhodophyta): Large subunit rDNA gene sequences support conspecificity of Galaxaura rugosa and G. subverticillata. J. Phycol. 20, 402–409.
Huson D. H., Bryant D. (2006). Application of phylogenetic networks in evolutionary studies. Mol. Biol. Evol. 23, 254–267. doi: 10.1093/molbev/msj030
Kahle D., Wickham H. (2013). ggmap: spatial visualization with ggplot2. R J. 5, 144. doi: 10.32614/RJ-2013-014
Kekkonen M., Hebert P. D. N. (2014). DNA barcode-based delineation of putative species: efficient start for taxonomic workflows. Mol. Ecol. Resour. 14, 706–715. doi: 10.1111/1755-0998.12233
Kimura M. (1981). Estimation of evolutionary distances between homologous nucleotide sequences. PNAS. 78(1), 454–458. doi: 10.1073/pnas.78.1.454
Kjellman F. R. (1900). Om Floridé-släget Galaxaura, dess organografi och systematik. Kl. Svenska Vetensk-akad. Handl. (Series 4) 33, 1–109.
Kumar S., Stecher G., Li M., Knyaz C., Tamura K. (2018). MEGA X: molecular evolutionary genetics analysis across computing platforms. Mol. Biol. Evol. 35, 1547–1549. doi: 10.1093/molbev/msy096
Kuo C.-Y., Keshavmurthy S., Huang Y.-Y., Ho M.-J., Hsieh H. J., Hsiao A.-T., et al. (2023). “Transitional Coral Ecosystem of TAIWAN in the Era of Changing Climate,” in Coral Reefs of Eastern Asia under Anthropogenic Impacts. Eds. Takeuchi I., Yamashiro H. (Springer Nature Switzerland AG: Coral Reefs World), 7–35. doi: 10.1007/978-3-031-27560-9_2
Kurihara A., Arai S., Shimada S., Masuda M. (2005). The conspecificity of Galaxaura apiculata and G. hystrix (Nemaliales, Rhodophyta) inferred from comparative morphology and rbcL and ITS1 sequences. Eur. J. Phycol. 40, 39–52. doi: 10.1080/09670260400005542
Kuriiwa K., Chiba S. N., Motomura H., Matsuura K. (2014). Phylogeography of Blacktip Grouper, Epinephelus fasciatus (Perciformes: Serranidae), and influence of the Kuroshio Current on cryptic lineages and genetic population structure. Ichthyol. Res. 61, 361–374. doi: 10.1007/s10228-014-0408-9
Lai Y.-M., Song S.-R. (2013). The volcanoes of an oceanic arc from origin to destruction: A case from the northern Luzon Arc. J. Asian Earth Sci. 74, 97–112. doi: 10.1016/j.jseaes.2013.03.021
Lamarck J. B. (1816). Histoire naturelle des animaux sans vertèbres Vol. 2 (Déterville, Paris). 568 pp.
Lee H.-J., Chao S.-Y., Fan K.-L., Kuo T.-Y. (1999). Tide-induced eddies and upwelling in a semi-enclosed basin: nan wan. Estuar. Coast. Shelf Sci. 49, 775–787. doi: 10.1006/ecss.1999.0524
Lee Y., Ni G., Shin J., Kim T., Kern E. M. A., Kim Y., et al. (2021). Phylogeography of Mytilisepta virgata (Mytilidae: Bivalvia) in the northwestern Pacific: Cryptic mitochondrial lineages and mito-nuclear discordance. Mol. Phylogenet. Evol. 157, 107037. doi: 10.1016/j.ympev.2020.107037
Leigh J. W., Bryant D. (2015). popart: full-feature software for haplotype network construction. Methods Ecol. Evol. 6, 1110–1116. doi: 10.1111/2041-210X.12410
Li J., Hu Z., Duan D. (2015). Genetic data from the red alga Palmaria palmata reveal a mid-Pleistocene deep genetic split in the North Atlantic. J. Biogeogr. 42, 902–913. doi: 10.1111/jbi.12464
Lin S., Fredericq S., Hommersand M. H. (2001). Systematics of the Delesseriaceae (Ceramiales, Rhodophyta) based on large subunit rDNA and rbcL sequences, including the Phycodryoideae, subfam. nov. J. Phycol. 37, 881–899. doi: 10.1046/j.1529-8817.2001.01012.x
Liu S.-L., Lin S.-M., Wang W.-L. (2013). Molecular phylogeny of the genus Dichotomaria (Galaxauraceae, Rhodophyta) from the Indo-Pacific region, including a new species D. hommersandii from South Africa. Eur. J. Phycol. 48, 221–234. doi: 10.1080/09670262.2013.797110
Miglietta M. P., Faucci A., Santini F. (2011). Speciation in the sea: Overview of the symposium and discussion of future directions. Integr. Comp. Biol. 51, 449–455. doi: 10.1093/icb/icr024
Monaghan M. T., Wild R., Elliot M., Fujisawa T., Balke M., Inward D. J. G., et al. (2009). Accelerated species inventory on Madagascar using Coalescent-Based Models of species delineation. Syst. Biol. 58, 298–311. doi: 10.1093/sysbio/syp027
Montecinos A., Broitman B. R., Faugeron S., Haye P. A., Tellier F., Guillemin M.-L. (2012). Species replacement along a linear coastal habitat: phylogeography and speciation in the red alga Mazzaella laminarioides along the south east pacific. BMC Evol. Biol. 12, 97–97. doi: 10.1186/1471-2148-12-97
Muangmai N., West J. A., Zuccarello G. C. (2014). Evolution of four Southern Hemisphere Bostrychia (Rhodomelaceae, Rhodophyta) species: phylogeny, species delimitation and divergence times. Phycologia 53, 593–601. doi: 10.2216/14-044.1
Nan F., Xue H., Xiu P., Chai F., Shi M., Guo P. (2011). Oceanic eddy formation and propagation southwest of Taiwan. J. Geophys. Res. Oceans 116, C12045. doi: 10.1029/2011JC007386
Nan F., Xue H., Yu F. (2015). Review Kuroshio intrusion into the South China Sea: A review. Prog. Oceanogr. 137, 314–333. doi: 10.1016/j.pocean.2014.05.012
Nielsen R., Wakeley J. (2001). Distinguishing migration from isolation: A Markov Chain Monte Carlo approach. Genetics 158, 885–896. doi: 10.1093/genetics/158.2.885
Oksanen J., Kindt R., Legendre P., O’Hara B., Stevens M. H. H., Oksanen M. J., et al. (2007). The vegan package. Community Ecol. Package. Available at: https://CRAN.R-project.org/package=vegan.
Paradis E. (2010). pegas: an R package for population genetics with an integrated–modular approach. Bioinformatics 26, 419–420. doi: 10.1093/bioinformatics/btp696
Pons J., Barraclough T. G., Gomez-Zurita J., Cardoso A., Duran D. P., Hazell S., et al. (2006). Sequence-based species delimitation for the DNA taxonomy of undescribed insects. Syst. Biol. 55, 595–609. doi: 10.1080/10635150600852011
Puillandre N., Lambert A., Broullet S., Achaz G. (2012). ABGD, Automatic Barcode Gap Discovery for primary species delimitation. Mol. Ecol. 21, 1864–1877. doi: 10.1111/j.1365-294X.2011.05239.x
Qu T., Lukas R. (2003). The bifurcation of the north equatorial current in the Pacific. J. Phys. Oceanogr. 33, 5–18. doi: 10.1175/1520-0485(2003)033<0005:tbotne>2.0.co;2
R Core Team (2021). R: A language and environment for statistical computing (Vienna, Austria: R Foundation for Statistical Computing). Available at: http://www.R-project.org/.
Ronquist F., Teslenko M., van der Mark P., Ayres D. L., Darling A., Höhna S., et al. (2012). Mrbayes 3.2: efficient Bayesian phylogenetic inference and model choice across a large model space. Syst. Biol. 61, 539–542. doi: 10.1093/sysbio/sys029
Rozas J., Ferrer-Mata A., Sánchez-DelBarrio J. C., Guirao-Rico S., Librado P., Ramos-Onsins S. E., et al. (2017). DnaSP 6: DNA sequence polymorphism analysis of large data sets. Mol. Biol. Evol. 34, 3299–3302. doi: 10.1093/molbev/msx248
Santos G. D. N., Pestana E. M. D. S., Santos C. C. D., Cassano V., Nunes J. M. D. C. (2020). Diversity of Galaxauraceae (Nemaliales, Rhodophyta) in northeastern Brazil: new record and two new species, Dichotomaria viridis sp. nov. and Tricleocarpa laxa sp. nov. Phytotaxa 454, 73–103. doi: 10.11646/phytotaxa.454.2.1
Saunders G. W., Moore T. E. (2013). Refinements for the amplification and sequencing of red algal DNA barcode and RedToL phylogenetic markers: a summary of current primers, profiles and strategies. Algae 28, 31–43. doi: 10.4490/algae.2013.28.1.031
Schneider C. W., Popolizio T. R., Spagnuolo D. S., Lane C. E. (2016). Notes on the marine algae of the Bermudas. 15. Dichotomaria huismanii (Galaxauraceae, Rhodophyta), a new species in the D. marginata complex from the western Atlantic. Bot. Mar. 59, 13–29. doi: 10.1515/bot-2015-0068
Schneider C. A., Rasband W. S., Eliceiri K. W. (2012). NIH Image to ImageJ: 25 years of image analysis. Nat. Methods 9, 671–675. doi: 10.1038/nmeth.2089
Shen K.-N., Jamandre B. W., Hsu C.-C., Tzeng W.-N., Durand J.-D. (2011). Plio-Pleistocene sea level and temperature fluctuations in the northwestern Pacific promoted speciation in the globally-distributed flathead mullet Mugil cephalus. BMC Evol. Biol. 11, 83. doi: 10.1186/1471-2148-11-83
Sherwood A. R., Kurihara A., Conklin K. Y., Sauvage T., Presting G. G. (2010). The Hawaiian Rhodophyta Biodiversity Survey, (2006-2010): a summary of principal findings. BMC Plant Biol. 10, 258. doi: 10.1186/1471-2229-10-258
Sibuet J.-C., Hsu S.-K. (2004). How was Taiwan created? Tectonophysics 379, 159–181. doi: 10.1016/j.tecto.2003.10.022
Suzuki G., Keshavmurthy S., Hayashibara T., Wallace C. C., Shirayama Y., Chen C. A., et al. (2016). Genetic evidence of peripheral isolation and low diversity in marginal populations of the Acropora hyacinthus complex. Coral Reefs 35, 1419–1432. doi: 10.1007/s00338-016-1484-2
Tajima F. (1989). Statistical method for testing the neutral mutation hypothesis by DNA polymorphism. Genetics 123, 585–595. doi: 10.1093/genetics/123.3.585
Tamura K., Nei M. (1993). Estimation of the number of nucleotide substitutions in the control region of mitochondrial DNA in humans and chimpanzees. Mol Biol Evol. 10 (3), 512–26. doi: 10.1093/oxfordjournals.molbev.a040023
Wang J., Chang F., Li T., Sun H., Cui Y., Liu T. (2020). The evolution of the Kuroshio Current over the last 5 million years since the Pliocene: Evidence from planktonic foraminiferal faunas. Sci. China Earth Sci. 63, 1714–1729. doi: 10.1007/s11430-019-9641-9
Wang Q.-Y., Hu D.-X. (2006). Bifurcation of the north equatorial current derived from altimetry in the Pacific Ocean. J. Hydrodynam. Ser. B 18, 620–626. doi: 10.1016/S1001-6058(06)60144-3
Wang W., Liu S., Lin S. (2005). Systematics of the calcified genera of the Galaxauraceae (Nemaliales, Rhodophyta) with an emphasis on Taiwan species. J. Phycol. 41, 685–703. doi: 10.1111/j.1529-8817.2005.00089.x
Wickham H. (2011). ggplot2. Wiley Interdiscip. Rev.: Comput. Stat. 3 (2), 180–185. doi: 10.1002/wics.147
Wiriyadamrikul J., Wynne M. J., Boo S. M. (2014). Phylogenetic relationships of Dichotomaria (Nemaliales, Rhodophyta) with the proposal of Dichotomaria intermedia (R.C.Y. Chou) comb. nov. Bot. Mar. 57, 27–40. doi: 10.1515/bot-2013-0101
Wu C.-R., Wang Y.-L., Lin Y.-F., Chao S.-Y. (2017). Intrusion of the kuroshio into the south and east China seas. Sci. Rep. 7, 7895. doi: 10.1038/s41598-017-08206-4
Yang E. C., Kim M. S., Geraldino P. J. L., Sahoo D., Shin J.-A., Boo S. M. (2008). Mitochondrial cox1 and plastid rbcL genes of Gracilaria vermiculophylla (Gracilariaceae, Rhodophyta). J. Appl. Phycol. 20, 161–168. doi: 10.1007/s10811-007-9201-8
Yasuda N., Taquet C., Nagai S., Fortes M., Fan T.-Y., Phongsuwan N., et al. (2014). Genetic structure and cryptic speciation in the threatened reef-building coral Heliopora coerulea along Kuroshio Current. B Mar. Sci. 90, 233–255. doi: 10.5343/bms.2012.1105
Zhan S. H., Shih C., Liu S. (2020). Reappraising plastid markers of the red algae for phylogenetic community ecology in the genomic era. Ecol. Evol. 10, 1299–1310. doi: 10.1002/ece3.5984
Keywords: Dichotomaria, Galaxauraceae, geographical barrier, incipient speciation, Kuroshio Current, phylogeography, Rhodophyta, Taiwan
Citation: Fontana S, Wang W-L, Tseng K-Y, Draisma SGA, Dumilag RV, Hu Z-M, Li J-J, Lai P-H, Mattio L, Sherwood AR, Boo SM and Liu S-L (2024) Seaweed diversification driven by Taiwan’s emergence and the Kuroshio Current: insights from the cryptic diversity and phylogeography of Dichotomaria (Galaxauraceae, Rhodophyta). Front. Ecol. Evol. 12:1346199. doi: 10.3389/fevo.2024.1346199
Received: 29 November 2023; Accepted: 04 April 2024;
Published: 24 April 2024.
Edited by:
Renchao Zhou, Sun Yat-sen University, ChinaReviewed by:
Narongrit Muangmai, Kasetsart University, ThailandMarie-Laure Guillemin, Austral University of Chile, Chile
Copyright © 2024 Fontana, Wang, Tseng, Draisma, Dumilag, Hu, Li, Lai, Mattio, Sherwood, Boo and Liu. This is an open-access article distributed under the terms of the Creative Commons Attribution License (CC BY). The use, distribution or reproduction in other forums is permitted, provided the original author(s) and the copyright owner(s) are credited and that the original publication in this journal is cited, in accordance with accepted academic practice. No use, distribution or reproduction is permitted which does not comply with these terms.
*Correspondence: Shao-Lun Liu, c2hhb2x1bmxpdUBnbWFpbC5jb20=