
94% of researchers rate our articles as excellent or good
Learn more about the work of our research integrity team to safeguard the quality of each article we publish.
Find out more
ORIGINAL RESEARCH article
Front. Ecol. Evol., 13 February 2024
Sec. Urban Ecology
Volume 12 - 2024 | https://doi.org/10.3389/fevo.2024.1344343
 Hai-Li Zhang1,2†
 Mir Muhammad Nizamani3†
 Lin-Yuan Guo1
 Jianpeng Cui1
 Josep Padullés Cubino4
 Alice C. Hughes5*
 Hua-Feng Wang1,2*
Urban environments are dynamic landscapes shaped by a multitude of factors, including environmental conditions and socio-economic influences. This study systematically investigates how various factors shape urban plant diversity in Haikou City, Hainan Province, China, focusing on 30 key drivers including socio-economic aspects, biophysical conditions, landscape elements, and management practices. Our research methodology involved a comprehensive analysis of these factors’ impact on six types of urban plant species: spontaneous, native spontaneous, exotic spontaneous, cultivated, native cultivated, and exotic cultivated. Conducted in urban areas with varying population densities and landscape features, our sampling approach aimed to understand the species’ distribution patterns. We discovered significant correlations between plant species diversity and specific environmental and socio-economic variables. Our results indicate that spontaneous species are prevalent in densely populated areas with strong social ties, whereas areas rich in tree and shrub cover see fewer such species. Native cultivated species favor more serene, less urbanized landscapes, while exotic cultivated species are predominantly found in economically affluent areas with diverse vegetation. These findings offer valuable insights for urban planning and biodiversity conservation, emphasizing the need for customized greening strategies that align with local environmental and social contexts. By adopting such tailored approaches, urban planners can more effectively manage landscapes, enrich green spaces, and foster biodiverse, sustainable ecosystems. This research not only enhances our understanding of urban plant biodiversity but also lays the groundwork for future studies and policy-making, promoting harmonious integration of diverse plant life within urban settings.
Urban Plant Diversity (UPD) critically enhances ecosystem services and improves urban residents’ quality of life. It contributes to local climate regulation, mitigates the urban heat island effect, reduces noise and air pollution, and provides habitats for diverse wildlife (Nowak et al., 2006; Zhou et al., 2011; Cohen et al., 2014; Hobbie and Grimm, 2020; Wang et al., 2020; Pathak et al., 2011). UPD is influenced by a combination of natural factors, such as climate, soil, and topography, and anthropogenic factors, including economic prosperity, urban site history, and land use patterns (Clarke et al., 2013; Nizamani et al., 2023).
The ‘Luxury Effect’ hypothesis, proposed by Hope et al. (2003), suggests that increased wealth in urban areas leads to greater investment in urban plant landscapes, including more frequent use of irrigation, fertilization, and pesticide application, which can, in turn, enhance plant diversity (Padullés Cubino et al., 2019a). In contrast, the ‘Legacy Effect’ hypothesis highlights the impact of an urban site’s historical use on the composition and configuration of current urban green spaces. This effect arises from the varied accumulation of plant species over time, divergent growth patterns, and past management practices (Clarke et al., 2013). Land use in urban areas, reflecting economic and social functions, significantly impacts UPD. Types of land use, such as roads, parks, residential areas, educational institutions, and government properties, have distinct effects on plant diversity (Dow, 2000; Nielsen et al., 2014; Nizamani et al., 2021).
Urban Green Spaces (UGS) accommodate a diverse range of species, encompassing spontaneous, native spontaneous, exotic spontaneous, cultivated, native cultivated, and exotic cultivated species. Spontaneous species are plants that proliferate naturally in urban environments without requiring human intervention (Nowak et al., 2006). Within this group, native spontaneous species are indigenous plants that flourish naturally in urban landscapes (Padullés Cubino et al., 2019b), whereas exotic spontaneous species refer to non-native plants that have become naturalized in urban settings (Del Tredici, 2010). Conversely, cultivated species necessitate human management and care for their growth and significantly contribute to urban greening and horticulture. Native cultivated species, which are indigenous, are cultivated and managed by humans (Hobbie and Grimm, 2020), in contrast to exotic cultivated species that are introduced from other regions and require human intervention to adapt and thrive in new environments.
These varied types of urban plants each play distinct roles in providing ecosystem services, conserving biodiversity, and enhancing urban aesthetics. The simultaneous presence of spontaneous and cultivated species underscores the complexity and dynamism inherent in urban ecosystems (Clarke et al., 2013). Comprehending these plant categories and their respective roles in urban areas is imperative for effective urban planning, green space management, and biodiversity conservation (Wang et al., 2020). Such understanding enables more informed design and maintenance of urban green spaces, thereby elevating the quality of life for urban inhabitants and fostering the health and sustainability of ecosystems (Cohen et al., 2014). However, academic studies often lack a clear distinction in the factors influencing the distribution of both spontaneous and cultivated species within urban contexts.
In this study we aim to understand the drivers of spontaneous and cultivated species diversity within the tropical coastal city of Haikou, China, a significant regional port and the provincial capital of Hainan. We conducted surveys across 190 urban functional units within Haikou to (1) assess the patterns of diversity among native spontaneous, exotic spontaneous, cultivated, native cultivated, and exotic cultivated species in the city, and discern how these patterns diverge for native and exotic species, and (2) identify the principal drivers for diversity among urban spontaneous, native spontaneous, exotic spontaneous, cultivated, native cultivated, and exotic cultivated species. This study will improve our understanding of the factors influencing UPD in tropical coastal cities and provide insights for the refinement of UGS planning strategies.
Located at 110°07′–110°42′E and 19°31′–20°04′N, Haikou is characterized by a tropical climate and encompasses a total land area of 3,126.83 km2 (Figure 1). Within this expanse, a densely urbanized area spans 2,284.49 km2, as stated by official city records (http://www.haikou.gov.cn). With a stable population of approximately 2.87 million, Haikou recorded a Gross Domestic Product (GDP) of around 1,791.58 billion Yuan (RMB) for the year 2020 (http://www.haikou.gov.cn). The city is notable for its considerable green coverage, which constitutes 43.5% of its total area (http://www.haikou.gov.cn). In recognition of its environmental achievements, Haikou has been honored with the titles of “National Environmental Protection Model City“ and “National Garden City“ within China. It also gained international acknowledgement in 2018 as one of the inaugural “International Wetland Cities” by the United Nations International Wetland Convention Organization. For the purpose of our study, the urban core of Haikou was specifically delineated from its surrounding suburban and rural areas. This distinction ensures that the area under study exemplifies a typical urban landscape, corroborating the findings of Wang et al. (2020). Geographically, the demarcation of urban Haikou is bound by the Qiongzhou Strait to the North, the Haikou Ring Expressway to the South, the Haikou Nandu River to the East, and Huoshankou Road to the West (Zhang et al., 2022a; Zhang et al., 2022b).
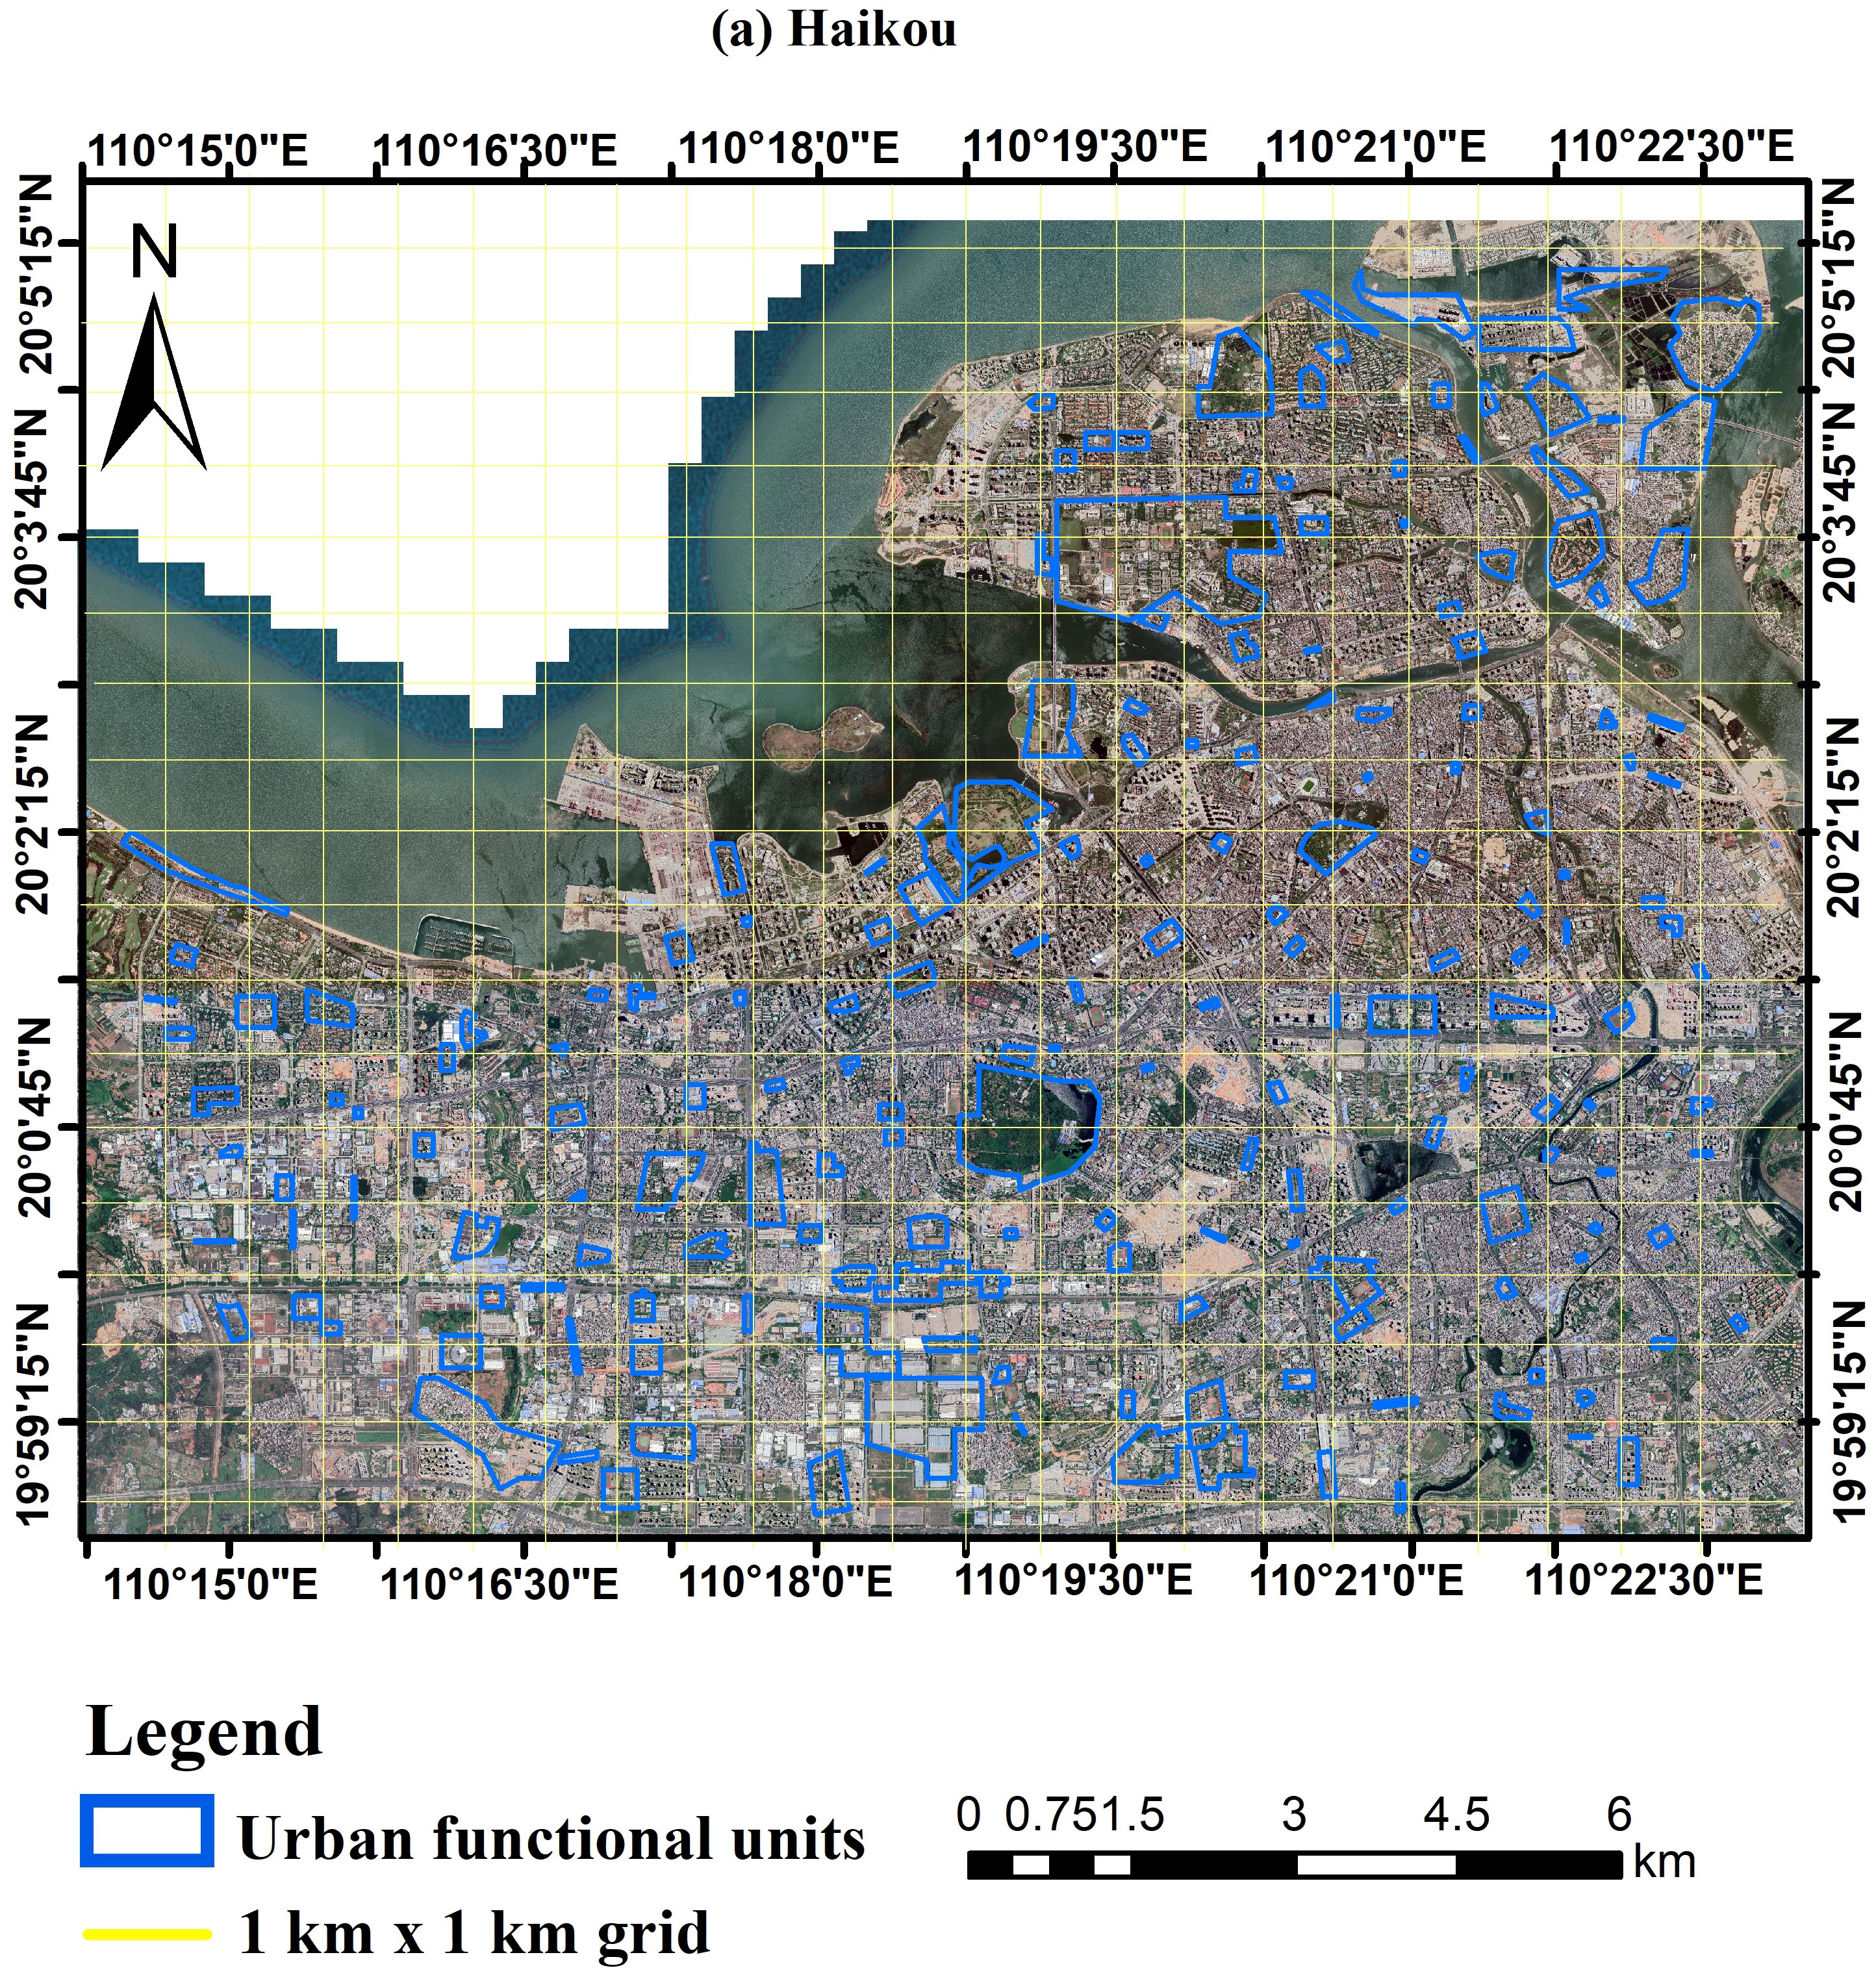
Figure 1 Geographic location of the study area Haikou. The Google satellite map of the main urban area of Haikou (https://www.google.com/maps) with red boundaries delineating the 190 Urban Functional Units (UFUs) surveyed in this study.
Urban Functional Units (UFUs) are distinct segments within urban areas, often serving as key units for measurement and analysis in urban green space research. These units represent various land use types and implement different strategies for establishing and maintaining green spaces, catering to the needs of diverse stakeholders such as residents, government officials, business owners, and tourists. In this study, we examined a total of 190 UFUs, as initially defined and proposed by Table 1. This involved 297 squares, each 1 km by 1 km, within which the 190 distinct UFUs were identified. For each functional unit, we randomly selected three plots, measuring 20m x 20m, for tree surveys. If a plot’s shape did not conform to the 20m x 20m dimension, we surveyed all green spaces within it. At each corner and the center of the 20m x 20m plot, a 5m x 5m area was designated to assess the presence of shrubs. Due to the uneven distribution of urban green space, some locations might lack shrubs or have shrub areas smaller than 5m x 5m. Within each shrub area, a 1m x 1m section was randomly chosen for herb analysis (Supplementary Figure S1).
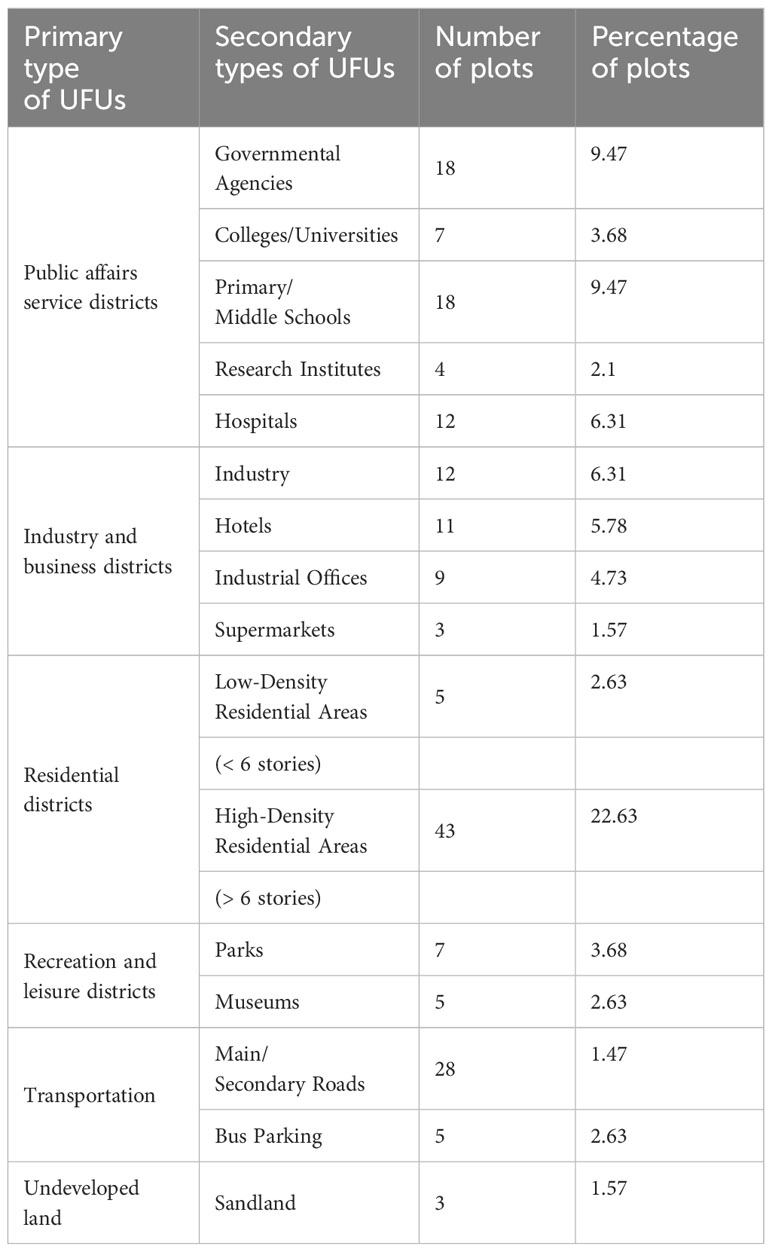
Table 1 Sampling of types of land uses in Haikou according to the primary and secondary urban function units (UFUs) represented by 190 20m x 20m grid cells.
Field plot surveys were conducted from June to August 2020. Within each plot, taxonomic nomenclatures were standardized in accordance with the “Chinese Flora” and “The Plant List” (http://www.theplantlist.org/) (Francisco-Ortega et al., 2010). Species were categorized as spontaneous (Figure 2), native spontaneous (Figure 3), exotic spontaneous (Supplementary Figure S2), cultivated (Supplementary Figure S3), native cultivated (Supplementary Figure S4), and exotic cultivated (Supplementary Figure S5) based on the “Hainan Flora”. For unidentified species, identification was facilitated through the Huabanlv software (http://www.aiplants.net/), supplemented by consultations with botanical experts from Hainan University for precise species identification and classification (Figure 4).
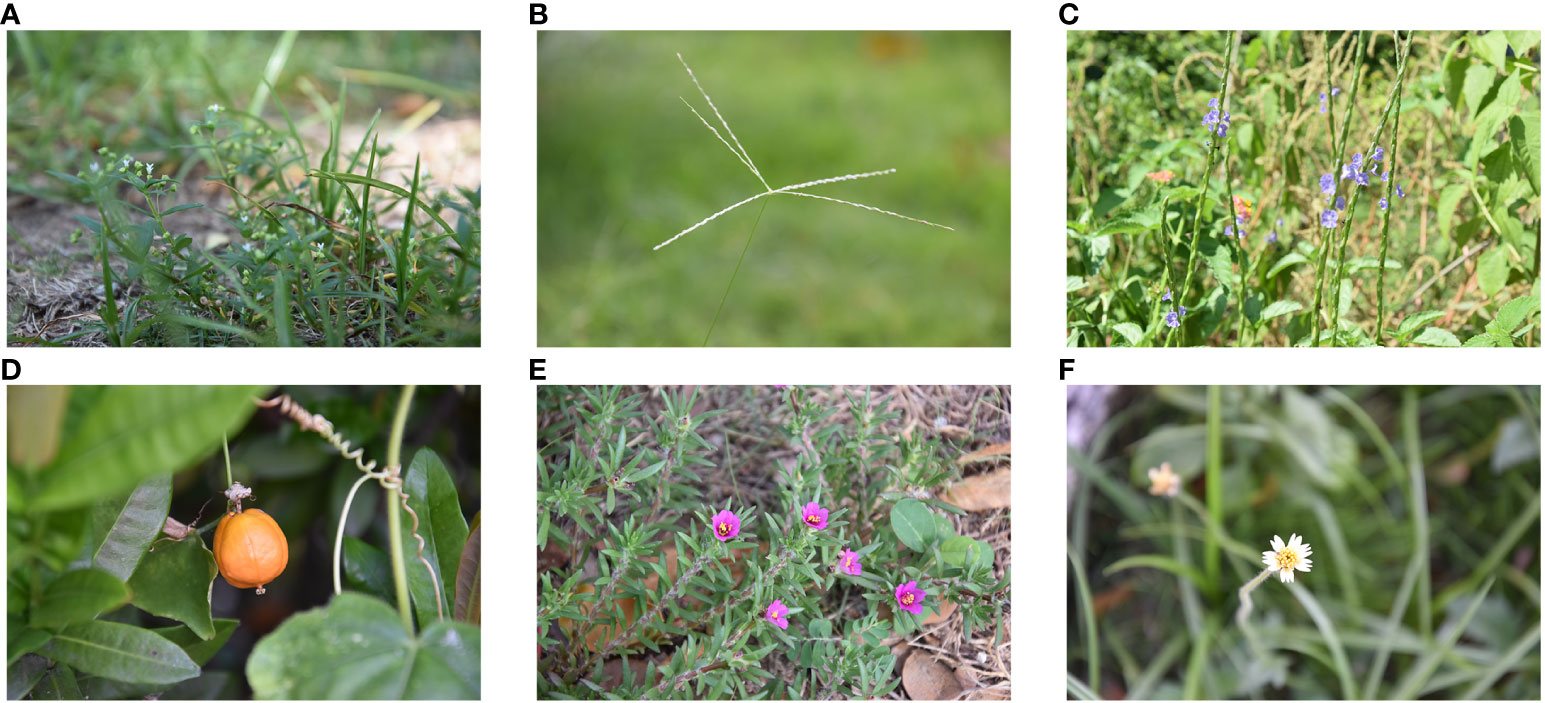
Figure 2 Examples of spontaneous species within different urban functional units. (A) Hedyotis corymbosa (Linn.) Lam. (B) Cynodon dactylon (Linn.) Pers. (C) Stachytarpheta jamaicensis (Linn.) Vahl (D) Passiflora foetida L. (E) Portulaca pilosa Linn. (F) Galinsoga pariflora Cav.
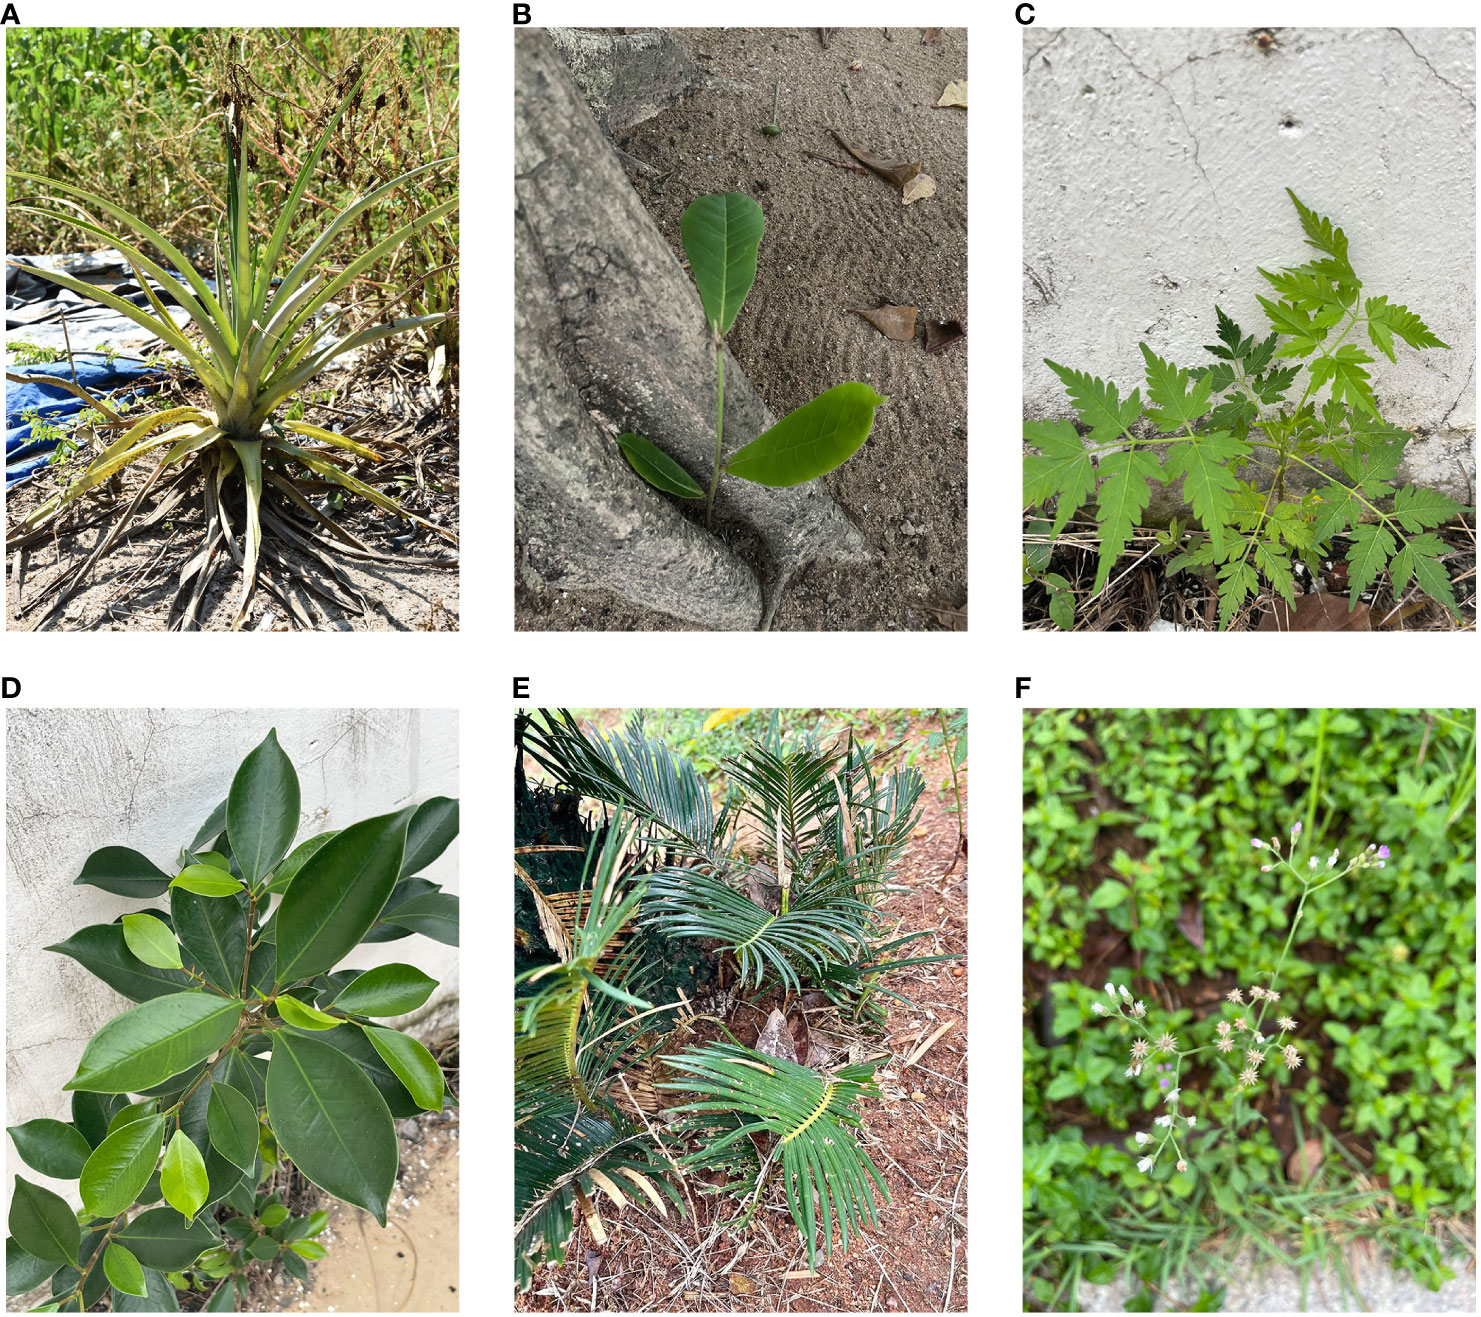
Figure 3 Examples of native spontaneous species within different urban functional units. (A) Ananas comosus. (B) Terminalia catappa Linn. (C) Cardiospermum halicacabum L. (D) Euphorbia hirta Linn. (E) Ficus microcarpa L. f. (F) Sphagneticola calendulacea (L.) Pruski.
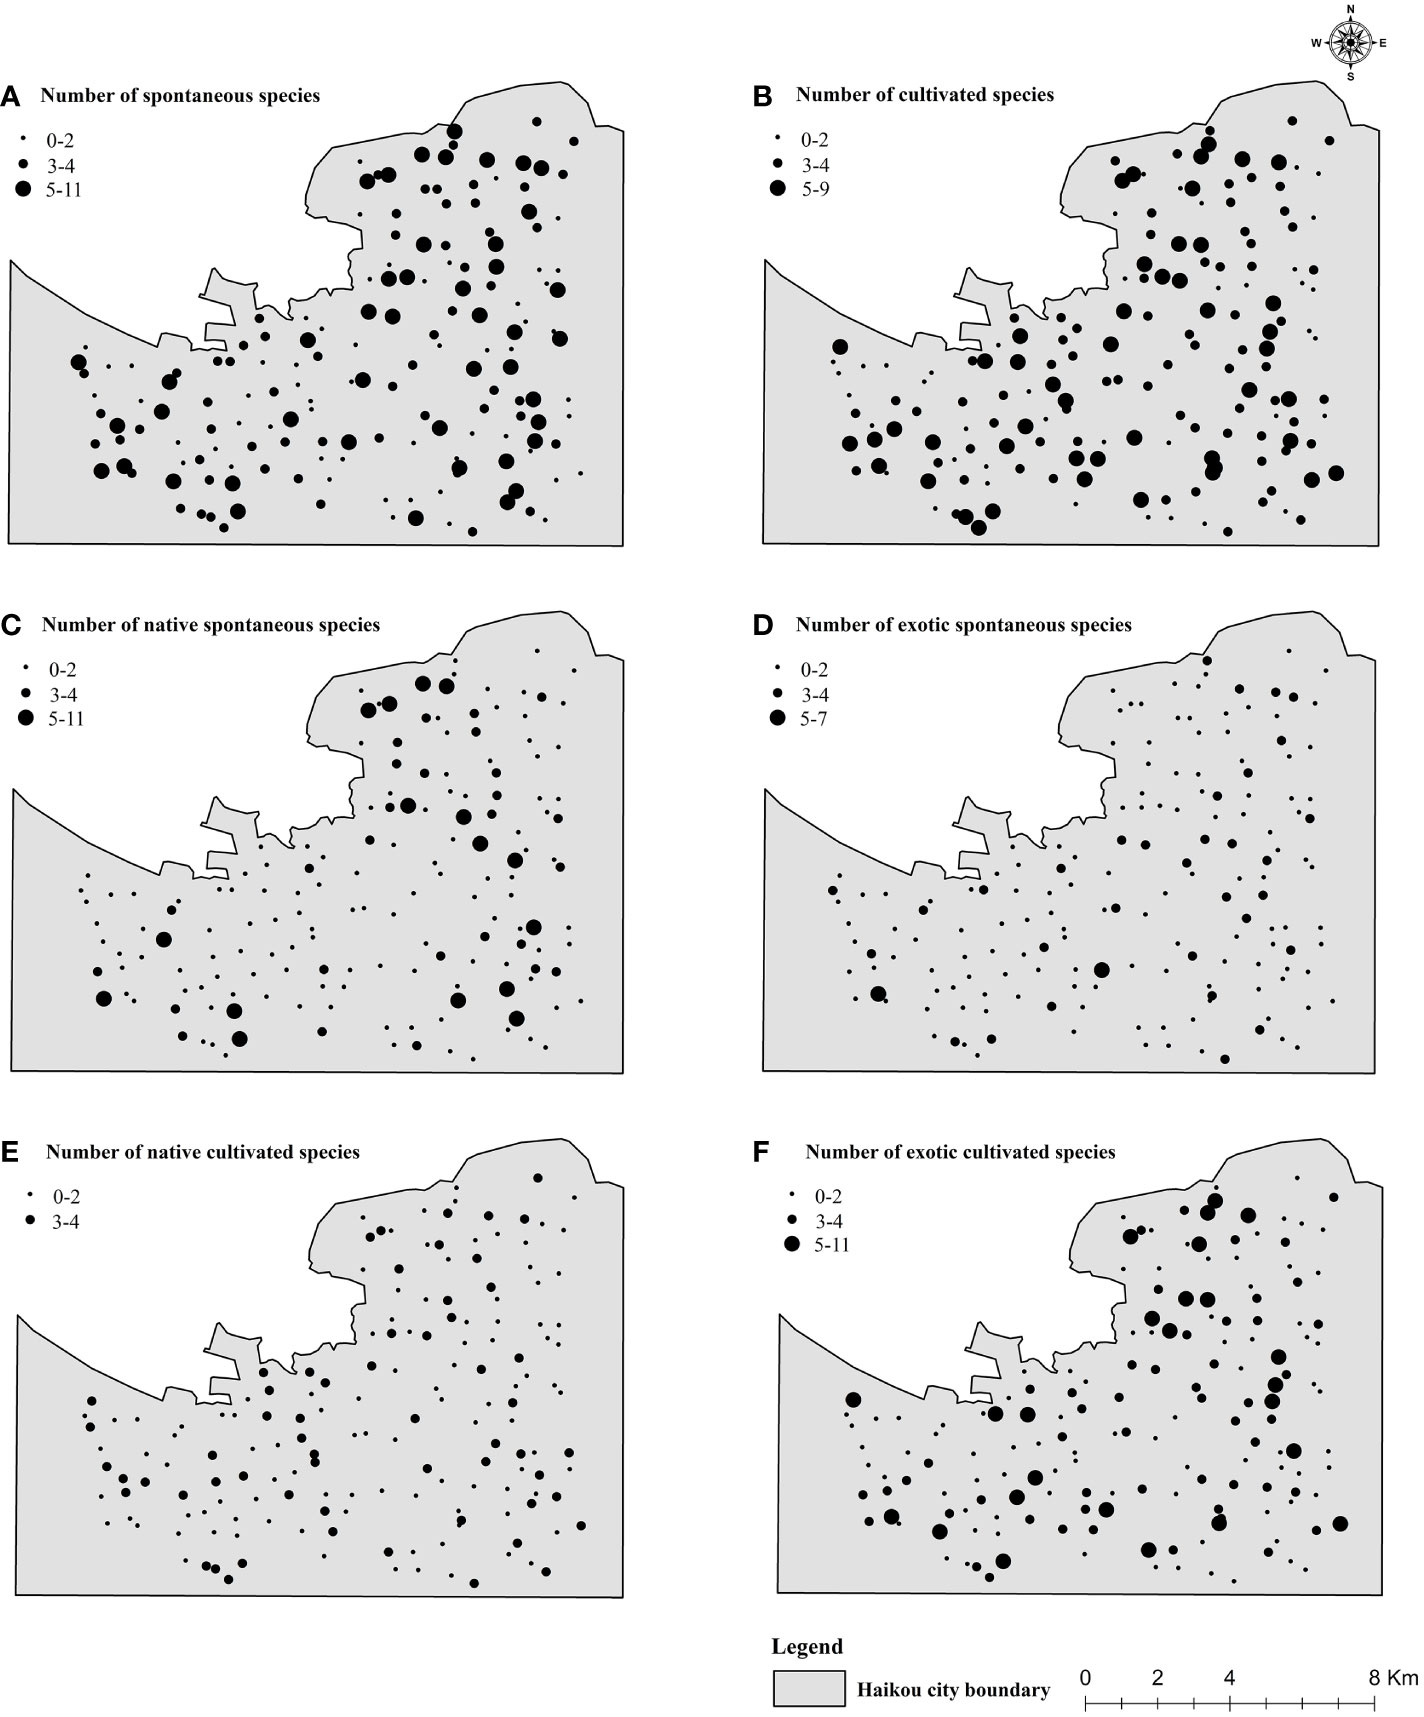
Figure 4 Distributions (A) spontaneous species, (B) cultivated species, (C) native spontaneous species, (D) exotic spontaneous species, (E) native cultivated species, and (F) exotic cultivated species within Haikou in the 190 UFUs investigated in this study.
For each of the 190 grid cells, we conducted an assessment of the land cover types using remote sensing. Utilizing a 30-meter spatial resolution remote sensing imagery dated June 23, 2020, sourced from Landsat 8, we implemented a supervised classification within the Environment for Visualizing Images 5.3 (ENVI 5.3; L3Harris Geospatial, Colorado, United States) to categorize Haikou’s land cover into distinct classes: built-up area, herbaceous (herb) area, tree and shrub area, water area, and undeveloped land (i.e., barren or open land), achieving an overall classification accuracy of 81%. Upon completion of this process, the classified map was utilized as input for FRAGSTATS 4.2.1, adhering to the methodology delineated by Cheng and Nizamani (2020), to compute nine pattern indicators of landscape organization, which are detailed in Table 2. Subsequently, we delved into examining the impact of these indices on broader vegetational patterns of the landscape, particularly in association with spontaneous, cultivated, native, and exotic species.
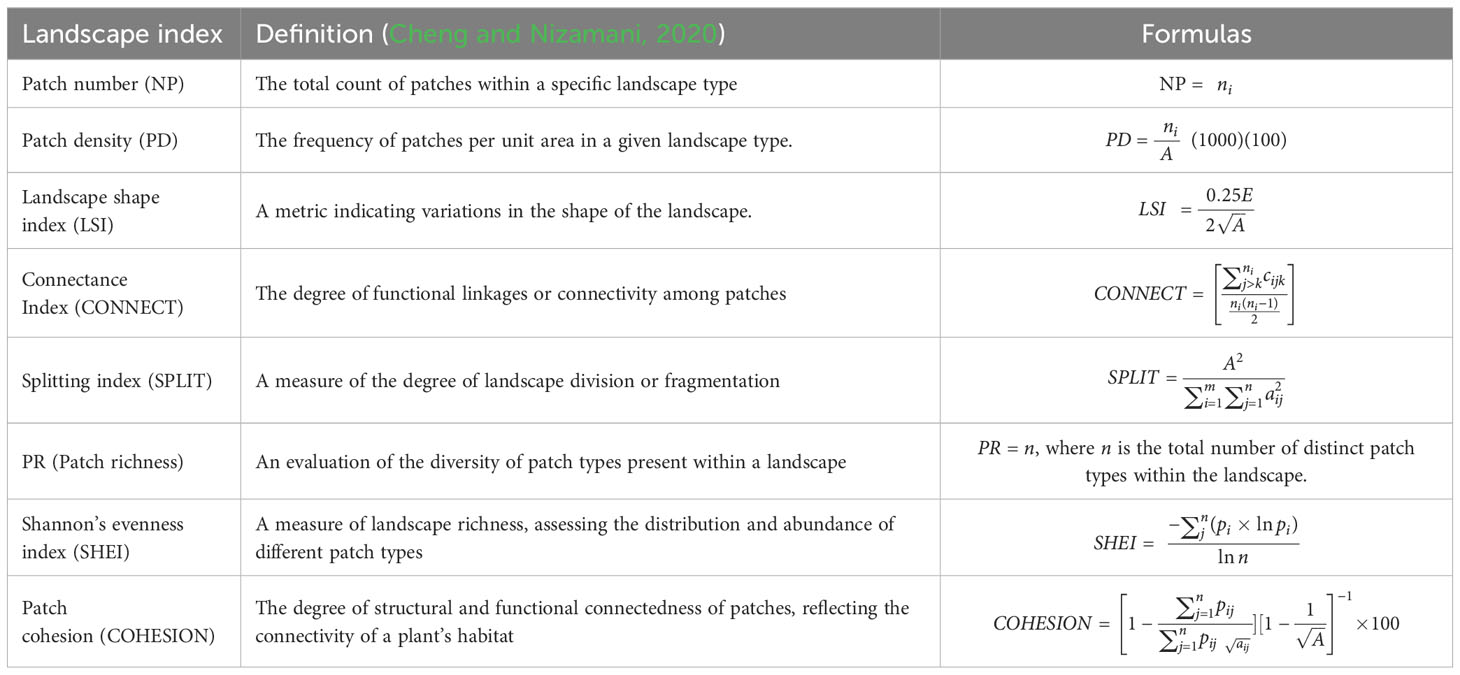
Table 2 Descriptions of metrics of patterns in landscape organization used in this study.
We measured socio-economic, biophysical, and urban green space management factors as proxies for drivers of diversity under the luxury effect, legacy effect, land use effect hypotheses. The socio-economic variables that we measured comprised housing price, construction age, and human population density, all of which we obtained through the official national website of China (http://www.stats.gov.cn/tjsj/). For biophysical factors, we used GPS to determine the latitude and longitude of each grid cell centroid. ENVI 5.3 to determine the distance between species and the nearest main road and freshwater source. The traffic flow rate is calculated by measuring the number of vehicles in the area per minute. The urban management factors comprised the annual frequency of fertilization, maintenance (average annual cleaning rates, pulling up weeds, trimming), and watering. To obtain these measures, we interviewed maintenance workers and, if possible, the owner of the green space containing the vegetation plot (Supplementary Table S1). If the plot represented wasteland, we recorded the absence of maintenance work as zero.
In this study, we examined various potential predictors that influence species diversity. These predictors include landscape organization, socio-economic factors, biophysical variables, and maintenance variables. The species diversity under study is categorized into six different types: spontaneous, cultivated, native spontaneous, exotic spontaneous, native cultivated, and exotic cultivated species. Each of these categories serves as a separate response variable (Supplementary Table S1).
Initially, all predictor variables were standardized using the z-score method. Outliers, identified as those with a z-score greater than 3.0 or less than -3.0, were removed in accordance with the guidelines provided.
For data analysis, we employed a two-step linear model (LM) approach. In the first step, simple LMs were constructed pairing each predictor with each response variable. In the second step, multiple LMs were executed, including only those predictor variables that had p-values less than 0.05 in the simple LMs. The best-fitting model was then selected based on the Akaike Information Criterion (AIC). All statistical analyses were conducted using R version 4.1.0 (R Foundation for Statistical Computing, Vienna, AT). This was followed by Fisher’s Least Significant Difference (LSD) test to make pairwise comparisons among secondary land use types.
In the secondary UFUs, the largest distributions of both native and cultivated species were found in research institutions (within the public affairs service districts primary type of UFU) (Figure 5). The largest distributions of spontaneous species, and native spontaneous species were found in hospitals (within the public affairs service districts primary type of UFU). The largest number of exotic species, and exotic spontaneous species, were found in colleges/universities (within the public affairs service districts primary type of UFU), while the largest distribution of native species was found in research institutions.
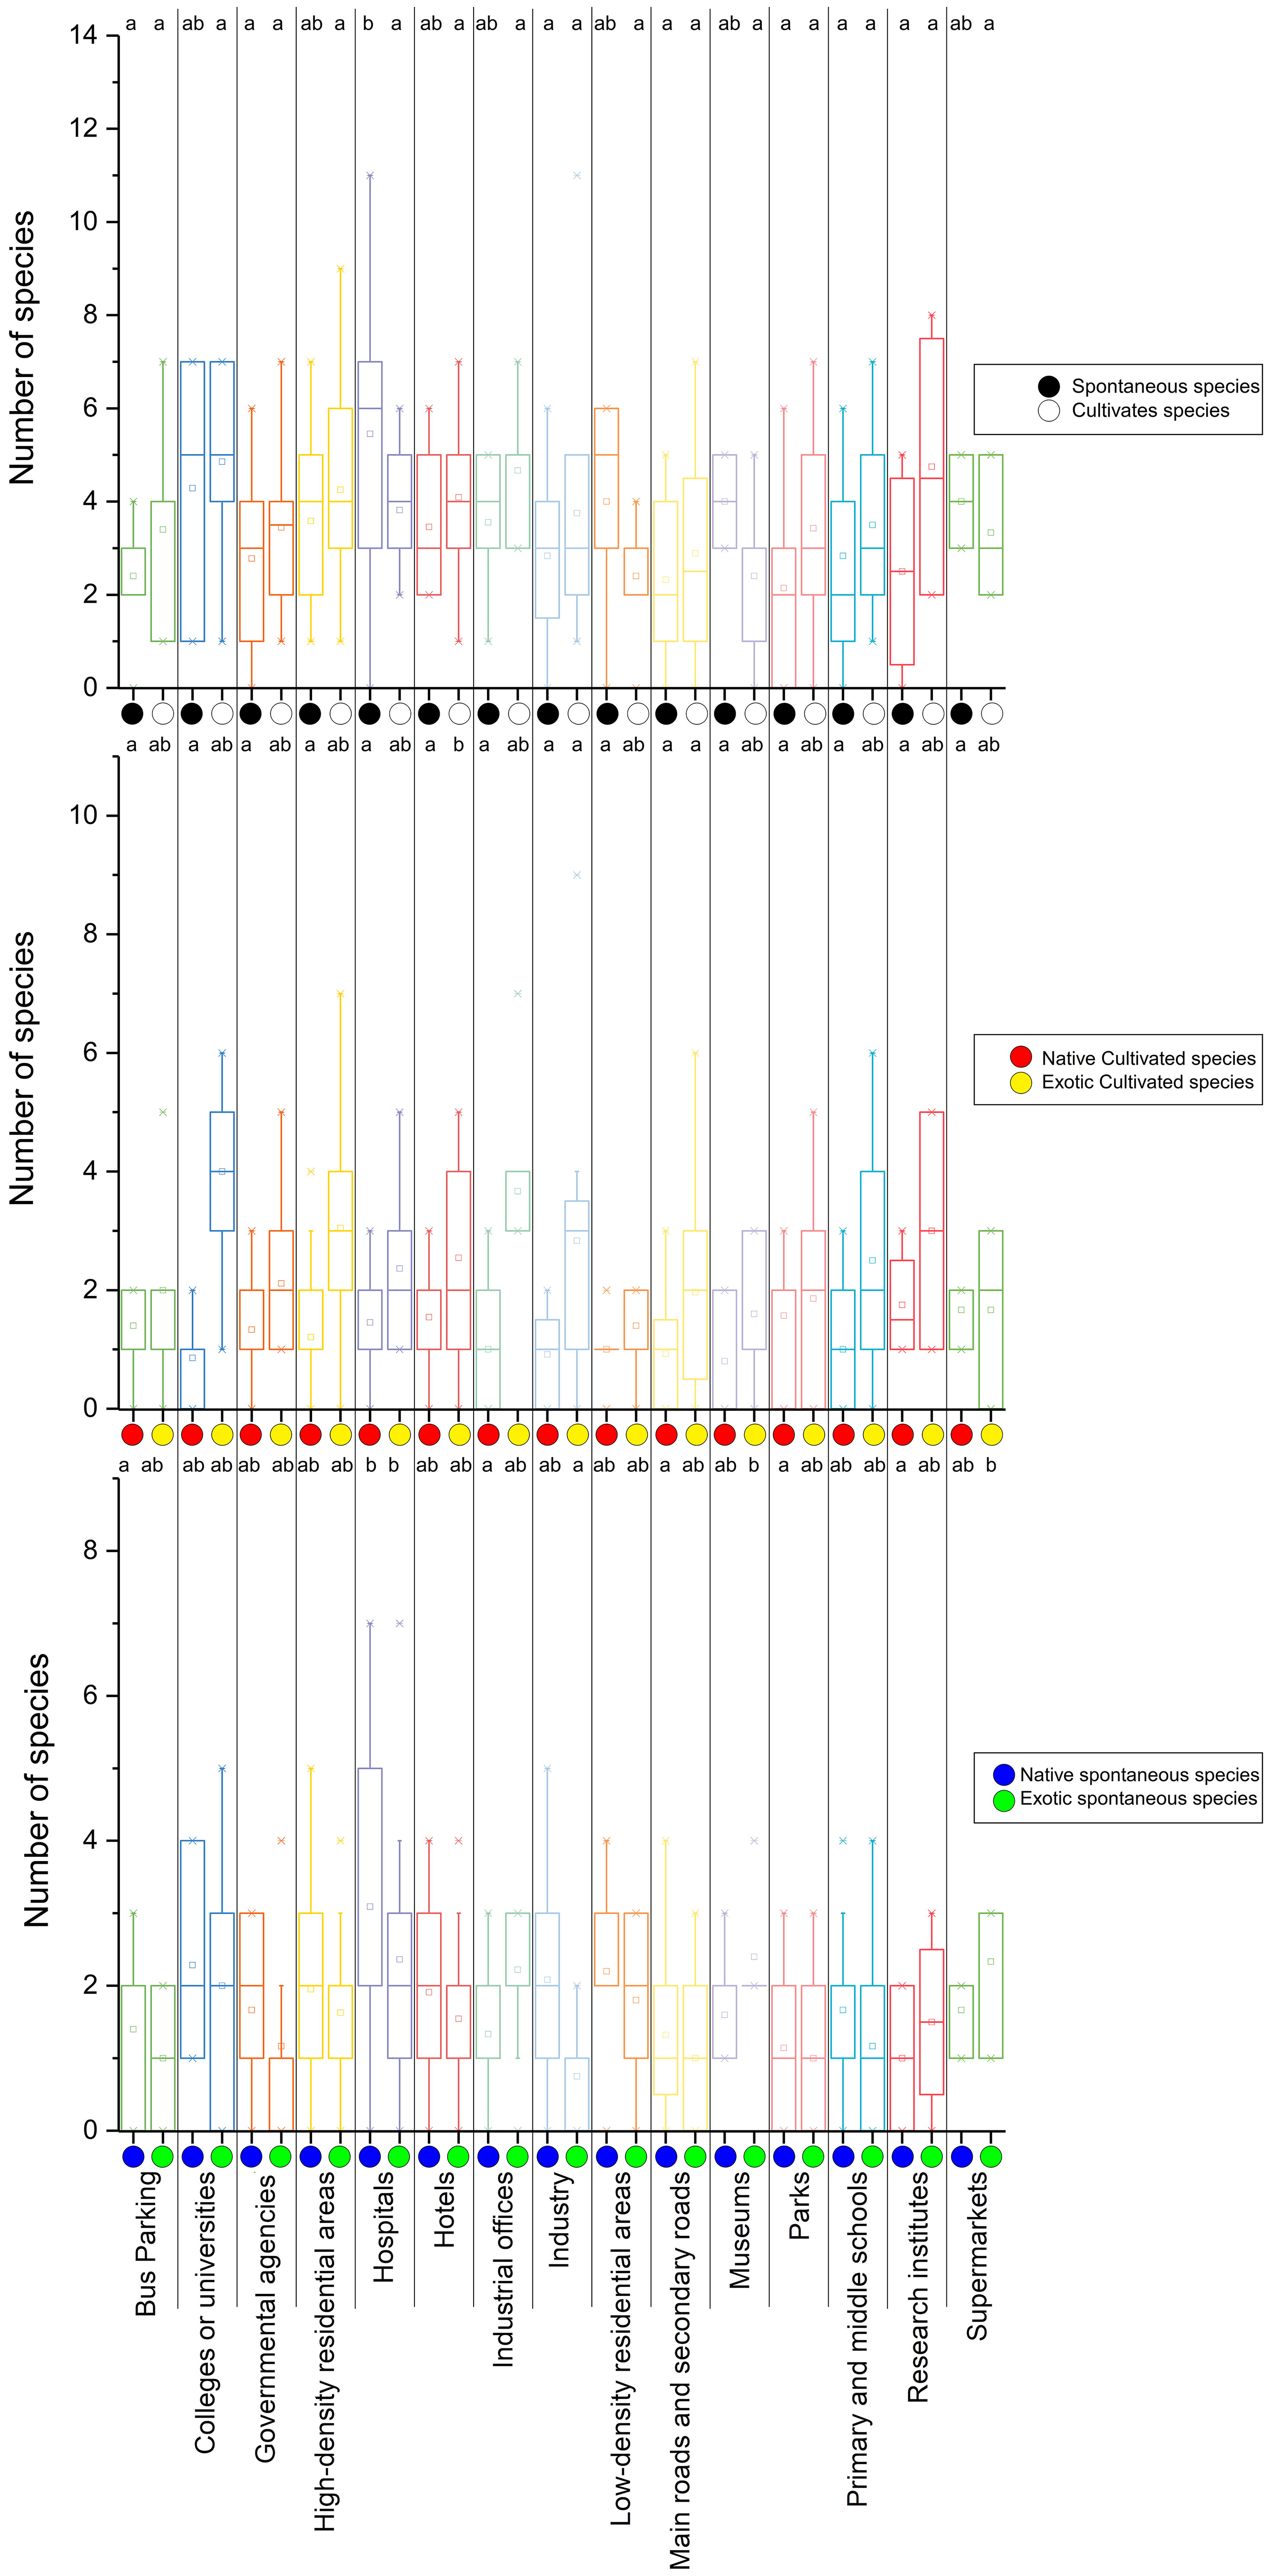
Figure 5 The distribution of different plant species in secondary UFUs. (a, b) represent significant differences determined by Fisher’s least significant differences (LSD) test at the α= 0.05 level.
Industry and business districts (β=3.120***), LSI (β= 1.267**), Tree species (β= 1.030***), Shrub species (β= 0.565**) and Herb species (β= 0.685***) were significantly positively correlated with the number of spontaneous species. The number of the spontaneous species was negatively correlated to NP (β= -0.975*), COHESION (β= -0.765**), Trees and shrubs area (β= -3.359***) (Table 3).
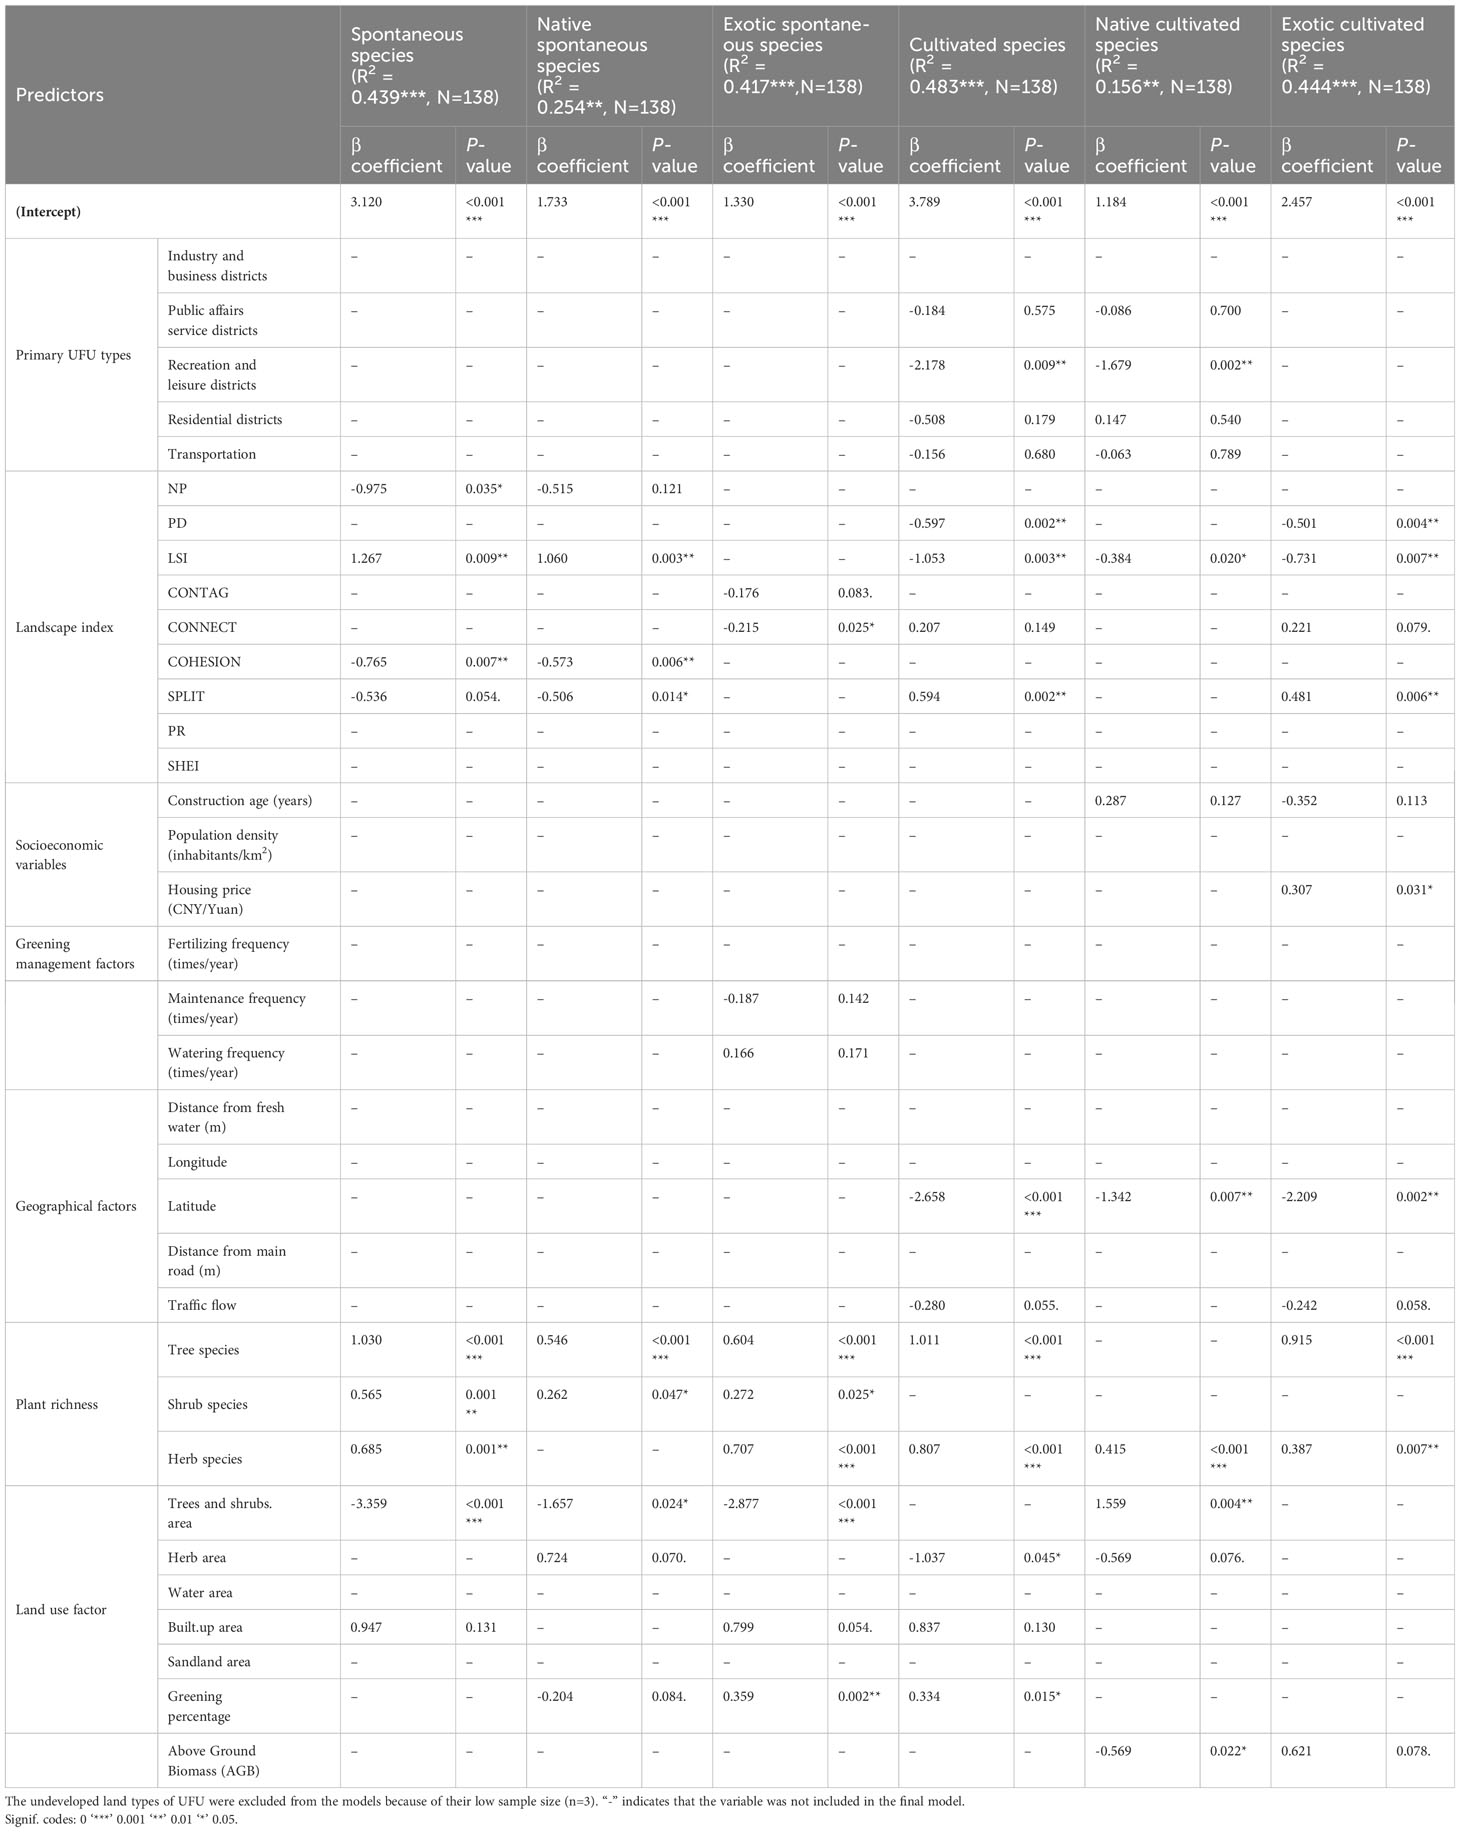
Table 3 Results from regression models predicting the number of spontaneous and cultivated plants.
Industry and business districts (β= 1.733***), LSI (β= 1.060**), Tree species (β= 0.546***) and Shrub species (β= 0.262*) were significantly positively correlated with the number of native spontaneous species. The number of native spontaneous species was negatively correlated to COHESION (β= -0.573**), SPLIT (β= -0.506*) and Trees and shrubs area (β= -1.657 *) (Table 3).
Industry and business districts (β= 1.330***), Tree species (β= 0.604***), Shrub species (β= 0.272*), Herb species (β=0.707***) and Greening percentage (β=0.359**) were significantly positively correlated with the number of exotic spontaneous species. The number of exotic spontaneous species was negatively correlated to CONNECT (β= -0.215*) and Trees and shrubs area (β= -2.877***).
Industry and business districts (β=3.789***), SPLIT (β= 0.594**), Tree species (β= 1.011***), Herb species (β= 0.807***) and Greening percentage (β=0.334*) were significantly positively correlated with the number of cultivated species. The number of the cultivated species was negatively correlated to Recreation and leisure districts (β= -2.178**), PD (β= -0.597**), LSI (β= -1.053**),Latitude (β< -0.001***) and Herb area (β= -1.037*) (Table 3).
Industry and business districts (β=1.184***), Herb species (β= 0.415***) and Trees and shrubs area (β=1.559**) were significantly positively correlated with the number of native cultivated species. The number of the native cultivated species was negatively correlated to Recreation and leisure districts (β= -1.679**), LSI (β= -0.384 *), Latitude (β= -1.342 **) and AGB (β= -0.569 *).
Industry and business districts (β=2.457***), Split (β=0.481**), Housing price (β= 0.307*), Tree species (β=0.915***) and Herb species (β=0.387**) were significantly positively correlated with the number of exotic cultivated species. The number of the exotic cultivated species was negatively correlated to PD (β= -0.501**), LSI (β= -0.731**) and Latitude (β= -2.200 **).
The number of the spontaneous species was significantly positively correlated to PD (β = 2.706**), COHESION (β = 2.171*), Tree species (β = 1.344***), and Shrub species (β = 1.064*) in Public affairs service districts (Tables 4, 5). The number of the spontaneous species was significantly positively correlated to SPLIT (β = 3.521**), PR (β = 3.401*), Distance from main road (β = 1.593**), Fertilizing frequency (β = 2.613**), Distance from fresh water (β = 1.682**), Tree species (β = 2.726**) and Built-up area (β = 6.828*) in Residential districts.
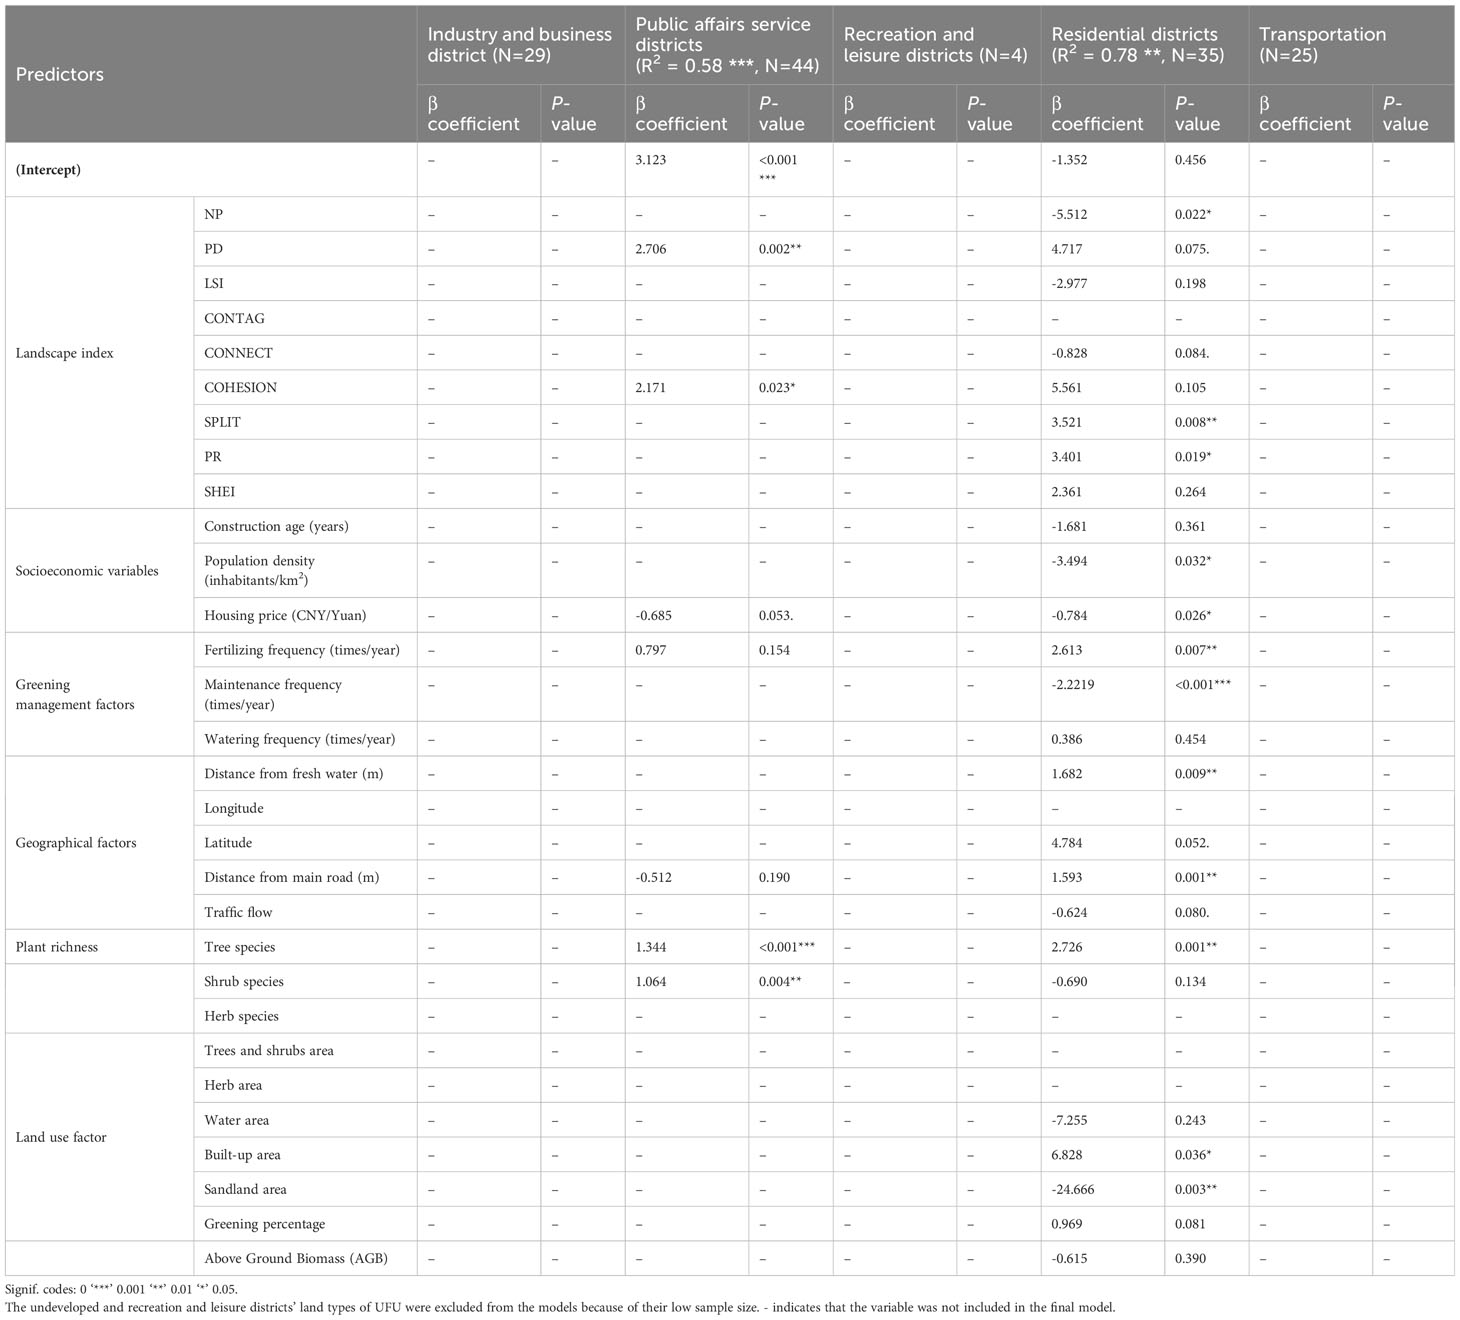
Table 4 Results from regression models predicting the number of spontaneous species.
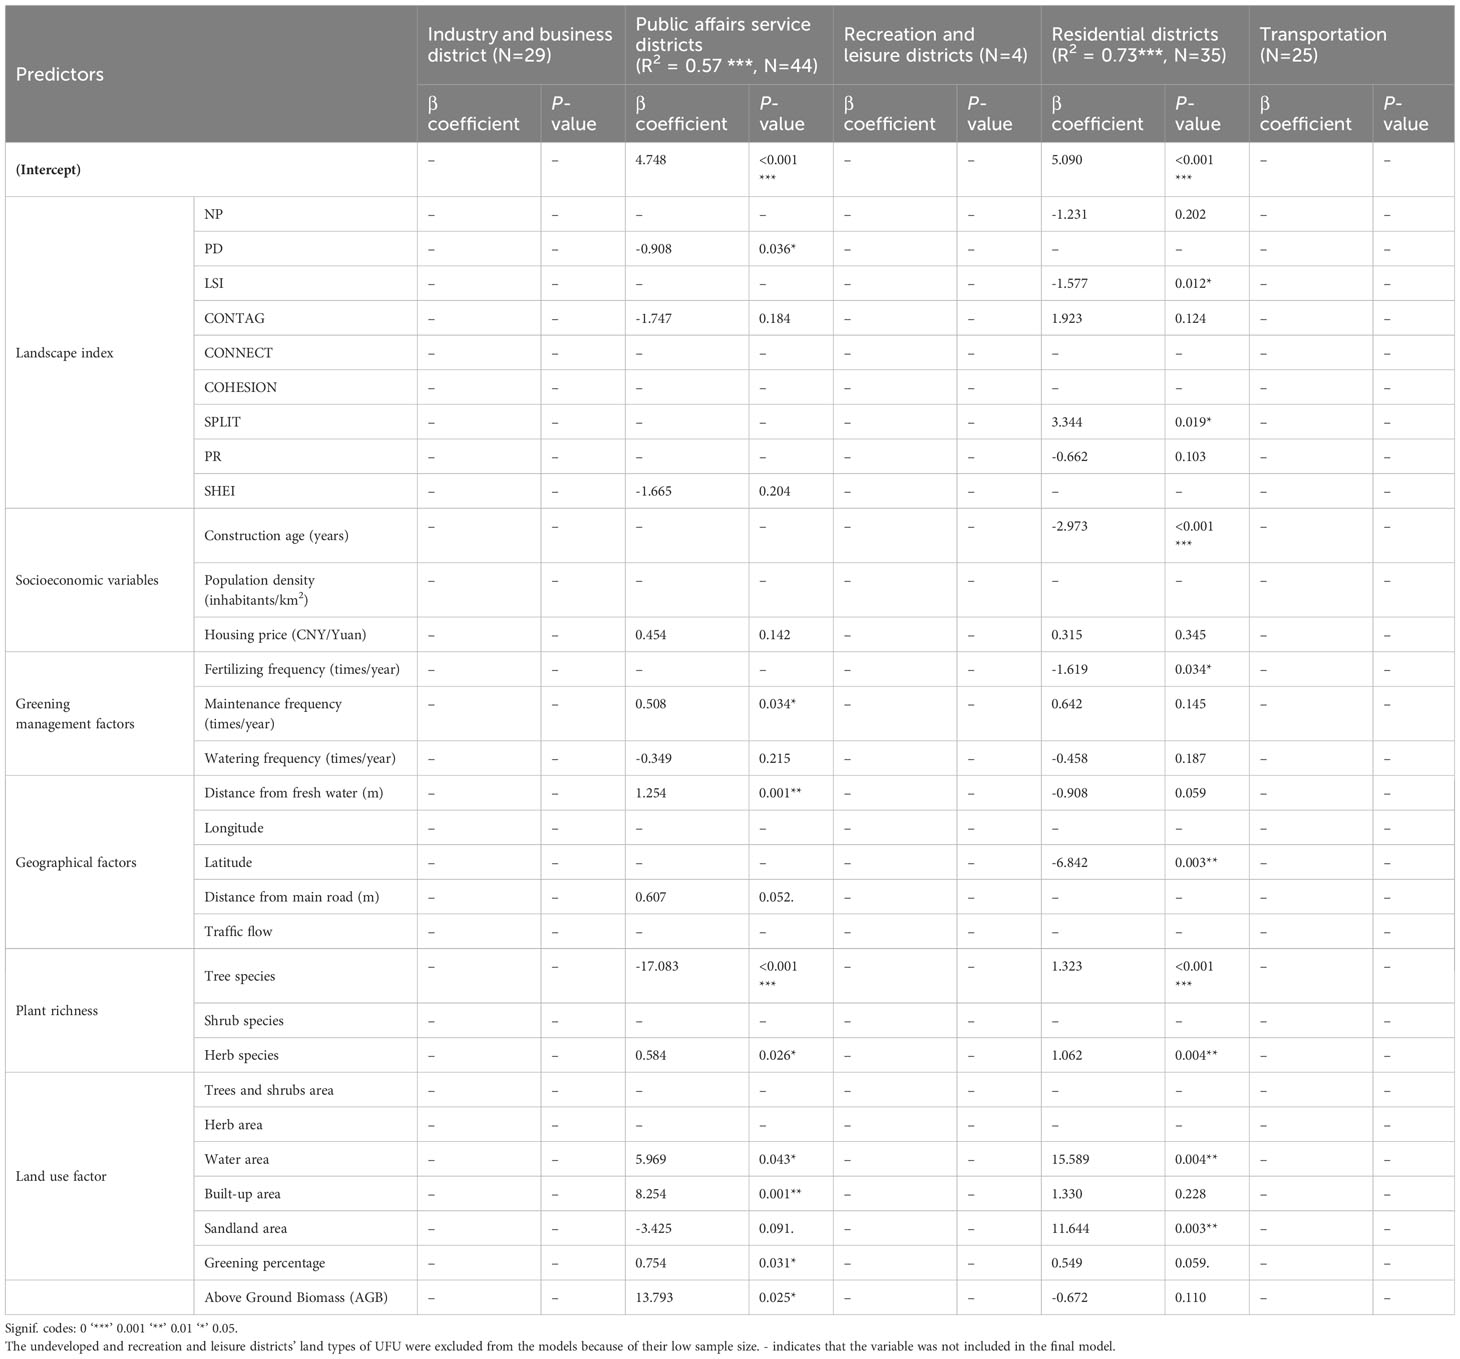
Table 5 Results from regression models predicting the number of cultivated species.
In Residential districts, the number of the spontaneous species was negatively correlated to NP (β= -5.512*), Housing price (β = -0.784*), Population.density (β = -3.494*), Maintenance frequency (β = -2.221***), and Sandland area (β = -24.666**).
The number of cultivated species was significantly positively correlated to Maintenance frequency (β = 0.034*), Distance from fresh water (β = 1.254**), Herb species (β = 0.584 *), Water area (β = 5.969*), Built-up area (β = 8.254**), Greening percentage (β = 0.754*, and AGB (β = 13.793*) in Public affairs service districts. In Public affairs service districts, the number of the cultivated species was negatively correlated to PD (β = -0.908*), and Trees and shrubs area (β = -17.083***).
The number of the cultivated species was significantly positively correlated to SHEI (β = 3.344*), Tree species (β = 1.323***), Herb species (β = 1.062**), Water area (β = 15.589**), and Sandland area (β = 11.644**) in Residential districts. In Residential districts, the number of the cultivated species was negatively correlated to LSI (β = -1.577*), Construction age (β = -2.973***), Latitude (β = -6.842**), and Fertilizing frequency (β = -1.619*).
The number of native spontaneous species in Public Affairs Service districts showed a significant positive correlation with Traffic Flow (β = 0.892*) (Supplementary Table S2). Conversely, in these districts, the number of native spontaneous displayed a negative correlation with both Population Density (β = -1.115*) and Greening Percentage (β = -0.929**).
In Residential districts, the number of native spontaneous species exhibited a significant positive correlation with PR (β = 2.205*), SHEI (β = 5.646*), Distance from Main Road (β = 0.818*), and Tree Species (β = 1.493*). Conversely, the number of native spontaneous species was negatively correlated with NP (β = -4.317*), CONNECT (β = -1.506*), Construction Age (β = -3.831*), and AGB (β = -1.465*).
The number of exotic spontaneous species in Public Affairs Service districts showed a significant positive correlation with PD (β = 2.183*) and Shrub species (β = 0.800**) (Supplementary Table S3). Conversely, in these districts, the number of exotic spontaneous displayed a negative correlation with Traffic Flow (β = -0.705*).
In Residential districts, the number of exotic spontaneous species exhibited a significant positive correlation with CONNECT (β = 0.124**), SPLIT (β = 1.952***), Construction Age (β = 3.220***), Distance from Main Road (β = 0.703*), Fertilizing frequency (β =2.040**), Watering frequency (β =0.644*), and AGB (β =1.168*), Tree Species (β = 0.768***), Herb Species (β = 0.768***). Conversely, the number of exotic spontaneous species was negatively correlated with SHEI (β = -4.319**), Housing price (β = -0.600*), Traffic flow (β = -0.676**), Maintenance frequency (β = -1.985***), Shrub species (β = -1.418***), and Sandland area (β = -15.484***).
The number of native cultivated species in Public Affairs Service districts showed a significant positive correlation with PR (β =0.795**), SHEI (β =1.758*), Construction age (β =0.886***), Distance from Main Road (β = 0.632***), Distance from fresh water (β = 0.915***), Greening percentage (β = 0.504**), and AGB (β = 12.462***) (Supplementary Table S4). Conversely, in these districts, the number of native cultivated displayed a negative correlation with both Population Density (β = -0.022*), Watering frequency (β = -0.688***), Tree species (β = -0.595***), Trees and shrubs area (β = -3.478*), and Water area (β = -5.040***).
In Residential districts, the number of native cultivated species exhibited a significant positive correlation with NP (β = 2.889*), Construction age (β =2.312*), Population density (β = 1.986*), and Herb Species (β = 0.748**). Conversely, the number of native cultivated species was negatively correlated with PD (β = -2.197*), COHESION (β = -2.200*), PR (β = -1.405*), and SHEI (β = -1.658*).
The number of exotic cultivated species in Public Affairs Service districts showed a significant positive correlation with Housing price (β =0458*), Tree species (β = 0.960***), Herb Species (β = 0.509*), Water area (β = 4.960*), and Built-up area (β = 4.175*) (Supplementary Table S5). Conversely, in these districts, the number of native cultivated displayed a negative correlation with both PD (β = -2.467*), CONTAG (β = -2.365*), COHESION (β = -2.043*), PR (β = -0.726*), SHEI (β = -2.797*), Construction age (β = -0.977**), and Latitude (β = -2.572*).
In Residential districts, the number of exotic cultivated species exhibited a significant positive correlation with SHEI (β = 2.938*), Tree Species (β = 0.953***), Shrub Species (β = 0.710*), and Sandland area (β = 2.938*). Conversely, the number of exotic cultivated species was negatively correlated with NP (β = -1.615**), and Construction age (β = -3.421***).
Major differences existed in the plant diversity in different UFUs. Public affairs service districts and research institutions host high abundance of both native and cultivated species. This prevalence could be attributed to a multifaceted approach to landscaping that aims to fulfil both aesthetic and research-oriented objectives. Unlike other UFUs, research institutions often have specialized botanical gardens or green spaces (Wolch et al., 2014).
Hospitals also hosted high species richness, possibly as these spaces may also include areas for resting and restoration (Anderson and Minor, 2019; Zhang et al., 2023a; Zhang et al., 2023b).
Colleges and universities host the highest number of exotic and exotic spontaneous species. This phenomenon can be primarily attributed to the educational and research missions of these institutions. The management of exotic species in educational settings requires a balanced approach that accounts for both their educational value and their ecological impact.
Spontaneously growing species are more diverse in industrial and business districts (Zhang et al., 2023a). Conversely, these species appear to be less prevalent in wealthy neighborhoods, likely because of increased management investment (active removal and use of agrochemical sprays).
Both native and exotic cultivated species are common in business and industrial contexts, they show a negative relationship with areas designed for recreation and with regions of high population density, possibly due to high competition for space. Exotic cultivated species also show a positive correlation with higher housing prices. Wealthier neighborhoods may have the resources to invest in exotic and potentially more expensive plant varieties (Zhang et al., 2022a). them ideal habitats for various kinds of spontaneous plant growth (Salinitro et al., 2018). In residential districts spontaneously growing species are less common in areas where housing prices are high (Hope et al., 2003).
Native cultivated species in Public Affairs Service Districts showed a significant positive correlation with parks and recreation areas, socio-economic health index, and construction age, among other factors). In residential districts, native cultivated species are positively correlated with vegetation cover, and construction age. Exotic cultivated species in Public Affairs Service Districts displayed a positive correlation with factors like housing price and species diversity (both trees and herbs), but a negative correlation with social cohesion and construction age. This could suggest that these species are often found in more affluent areas that have been deliberately landscaped to include a variety of plant life. However, they seem less compatible with older, more socially cohesive environments, perhaps due to different landscape management priorities in such areas (With, 2002).
For residential districts, exotic cultivated species were positively correlated with the socio-economic health index (SHEI) and a diversity of tree and shrub species. This suggests that wealthier neighborhoods may have more resources to invest in diverse and exotic landscaping. However, these species are less likely to be found in older or natural landscapes, possibly indicating that they are more dependent on human-mediated landscaping practices for their survival and propagation (Hope et al., 2003; Cheng and Nizamani, 2020). This trend highlights the influence of human activities on urban biodiversity and underscores the importance of considering ecological factors in urban planning and landscape management.
This comprehensive study highlights the crucial role of various UFUs and urban factors in shaping urban biodiversity. It underscores the need for a nuanced approach in urban planning and biodiversity conservation, emphasizing the importance of considering the unique environmental conditions and socio-economic factors of each UFU. Urban planners are thus encouraged to integrate these insights into designing urban spaces that support diverse ecosystems and contribute to human well-being. The findings advocate for a holistic approach that considers the intricate interplay of natural and anthropogenic factors in urban biodiversity (Elmqvist et al., 2013). This approach is essential for developing sustainable urban landscapes that are both ecologically rich and socially inclusive.
1. Encourage the development of a range of urban environments, from business districts to public service areas, with diverse landscaping practices. This approach should cater to different species’ needs, supporting a variety of native, exotic, spontaneous, and cultivated plants.
2. Urban planning policies should mandate the inclusion of green spaces in both new and existing urban developments. These spaces, as shown in your study, are crucial for supporting biodiversity, especially in industry and business districts.
3. Develop urban design standards that focus on biodiversity conservation. This includes planting native species, creating habitats for spontaneous species, and ensuring a balance between built-up and green areas. This policy should consider the different requirements of residential and public affairs service districts.
4. Establish ecological corridors and networks to connect various green spaces and habitats within the city. This connectivity is vital for the movement and health of urban biodiversity, especially in areas negatively correlated with biodiversity, such as those with high building density.
5. Adjust zoning regulations to promote biodiversity. This could involve restrictions on the extent of impervious surfaces, requirements for tree and shrub planting in new developments, and preservation of existing natural habitats.
6. Foster community participation in urban greening initiatives. Communities can play a crucial role in maintaining urban biodiversity, especially in residential areas where private gardens and community green spaces can significantly contribute to local ecosystems.
7. Establish monitoring programs to track changes in urban biodiversity, focusing on the species distribution across different UFUs. This data can inform adaptive management strategies and policy adjustments as needed.
8. Implement educational programs for stakeholders, including urban planners, developers, and the general public, about the importance of biodiversity in urban areas and the role they can play in its conservation.
9. Encourage collaboration between researchers, policymakers, and urban planners. The complex nature of urban ecosystems requires interdisciplinary approaches to develop effective biodiversity conservation strategies.
10. Ensure that urban biodiversity conservation is an integral part of broader urban sustainability and climate resilience goals. This integrated approach will help in addressing multiple environmental challenges concurrently.
The study offers valuable insights into the intricate relationships between various plant species and an array of environmental and socio-economic factors in both Public Affairs Service Districts and Residential Districts. Understanding these relationships is not merely an academic exercise; it has real-world implications for urban planning and biodiversity conservation. The findings could be leveraged to enhance urban green spaces in a way that is both socially beneficial and ecologically sustainable. This nuanced understanding of plant species distribution based on localized conditions is crucial for crafting effective conservation policies.
The original contributions presented in the study are included in the article/Supplementary Material. Further inquiries can be directed to the corresponding authors.
H-FW: Conceptualization, Funding acquisition, Methodology, Writing – original draft. H-LZ: Conceptualization, Data curation, Formal analysis, Investigation, Methodology, Project administration, Software, Validation, Writing – original draft, Writing – review & editing. MN: Conceptualization, Formal analysis, Project administration, Writing – original draft. L-YG: Formal analysis, Investigation, Methodology, Writing – review & editing. JC: Data curation, Methodology, Software, Writing – original draft. JPC: Writing – review & editing. AH: Conceptualization, Data curation, Formal analysis, Writing – original draft, Writing – review & editing.
The author(s) declare financial support was received for the research, authorship, and/or publication of this article. This study was supported by National Natural Science Fundation of China (32160273), the Project of Sanya Yazhou Bay Science and Technology City (SCKJ-JYRC-2022-83). Supported by the PhD Scientific Research and Innovation Foundation of Sanya Yazhou Bay Science and Technology City (HSPHDSRF-2023-12-010). An open funding from Huadong Normal University (SHUES2021A08, SHUES2022A06) and funding from Collaborative Innovation Center of Nanfan and High-Efficiency Tropical Agriculture, Hainan University (XTCX2022NYB09).
The authors declare that the research was conducted in the absence of any commercial or financial relationships that could be construed as a potential conflict of interest.
All claims expressed in this article are solely those of the authors and do not necessarily represent those of their affiliated organizations, or those of the publisher, the editors and the reviewers. Any product that may be evaluated in this article, or claim that may be made by its manufacturer, is not guaranteed or endorsed by the publisher.
The Supplementary Material for this article can be found online at: https://www.frontiersin.org/articles/10.3389/fevo.2024.1344343/full#supplementary-material
Anderson E. C., Minor E. S. (2019). Assessing social and biophysical drivers of spontaneous plant diversity and structure in urban vacant lots. Sci. Total Environ. 653, 1272–1281. doi: 10.1016/j.scitotenv.2018.11.006
Cheng X.-L., Nizamani M. M. (2020). Using SPOT data and FRAGSTAS to analyze the relationship between plant diversity and green space landscape patterns in the tropical coastal city of Zhanjiang, China. Remote Sens. doi: 10.3390/rs12213477
Clarke L. W., Jenerette G. D., Davila A. (2013). The luxury of vegetation and the legacy of tree biodiversity in Los Angeles, CA. Landscape Urban Plann. 116, 48–59. doi: 10.1016/j.landurbplan.2013.04.006
Cohen P., Potchter O., Schnell I. (2014). The impact of an urban park on air pollution and noise levels in the Mediterranean city of Tel-Aviv, Israel. Environ. pollut. 195, 73–83. doi: 10.1016/j.envpol.2014.08.015
Del Tredici P. (2010). Spontaneous urban vegetation: reflections of change in a globalized world. Nat. Culture 5 (3), 299–315. doi: 10.3167/nc.2010.050305
Dow K. (2000). Social dimensions of gradients in urban ecosystems. Urban Ecosyst. 4, 255–275. doi: 10.1023/A:1015767231137
Elmqvist T., Fragkias M., Goodness J., Güneralp B., Marcotullio P. J., McDonald R. I., et al. (2013). Urbanization, biodiversity and ecosystem services: challenges and opportunities: a global assessment (Springer Nature), 755.
Francisco-Ortega J., Wang F. G., Wang Z. S., Xing F. W., Liu H., Xu H., et al. (2010). Endemic seed plant species from Hainan Island: a checklist. Bot. Rev. 76 (3), 295–345. doi: 10.1007/s12229-010-9054-8
Hobbie S. E., Grimm N. B. (2020). Nature-based approaches to managing climate change impacts in cities. Philos. Trans. R. Soc. B 375 (1794), 20190124. doi: 10.1098/rstb.2019.0124
Hope D., Gries C., Zhu W., Fagan W. F., Redman C. L., Grimm N. B., et al. (2003). Socioeconomics drive urban plant diversity. Proc. Natl. Acad. Sci. 100, 8788–8792. doi: 10.1073/pnas.1537557100
Nielsen A. B., van den Bosch M., Maruthaveeran S., et al. (2014). Species richness in urban parks and its drivers: A review of empirical evidence. Urban Ecosyst. 17, 305–327. doi: 10.1007/s11252-013-0316-1
Nizamani M. M., Bhatti U. A., Cheng X. L., Nizamani F. G., Rind R. A., Khokhar A. A., et al. (2021). The connections between above-ground biomass and plant diversity of roadside trees, density and diversity on different types of roads in Karachi. Polish J. Environ. Stud. 30 (3), 2691–2700. doi: 10.15244/pjoes/128581
Nizamani M. M., Cubino J. P., Harris A. J., Guo L. Y., Wang H. F. (2023). Spatial patterns and drivers of plant diversity in the tropical city of Sanya, China. Urban Forestry Urban Greening 79, 127818. doi: 10.1016/j.ufug.2022.127818
Nowak D. J., Crane D. E., Stevens J. C. (2006). Air pollution removal by urban trees and shrubs in the United States. Urban forestry urban greening 4 (3-4), 115–123. doi: 10.1016/j.ufug.2006.01.007
Padullés Cubino J., Cavender-Bares J., Hobbie S. E., Pataki D. E., Avolio M. L., Darling L. E., et al. (2019a). Drivers of plant species richness and phylogenetic composition in urban yards at the continental scale. Landscape Ecol. 34 (1), 63–77. doi: 10.1007/s10980-018-0744-7
Padullés Cubino J., Jeannine C. B., Sarah E. H., Sharon J. H., Tara L. E., Trammell C. N., et al. (2019b). Contribution of non-native plants to the phylogenetic homogenization of U.S. yard floras. Ecosphere 10 (3), e02638. doi: 10.1002/ecs2.2638
Pathak V., Tripathi B. D., Mishra V. K. (2011). Evaluation of Anticipated Performance Index of some tree species for green belt development to mitigate traffic generated noise. Urban Forestry Urban Greening 10 (1), 61–66. doi: 10.1016/j.ufug.2010.06.008
Salinitro M., Alessandrini A., Zappi A., Melucci D., Tassoni A. (2018). Floristic diversity in different urban ecological niches of a southern European city. Sci. Rep. 8 (1), 15110. doi: 10.24266/0738-2898.30.3.161
Wang H.-F., Cheng X.-L., Nizamani M. M., Balfour K., Da L.-J., Zhu Z. X., et al. (2020). An Integrated approach to study spatial patterns and drivers of land cover within urban functional units: A multi-citycomparative study in China. Remote Sens 7, 2201. doi: 10.3390/rs12142201
With K. A. (2002). The landscape ecology of invasive spread. Conserv. Biol. 16 (5), 1192–1203. doi: 10.1046/j.1523-1739.2002.01064.x
Wolch J. R., Byrne J., Newell J. P. (2014). Urban green space, public health, and environmental justice: The challenge of making cities ‘just green enough’. Landscape urban Plann. 125, 234–244. doi: 10.1016/j.landurbplan.2014.01.017
Zhang H. L., Cubino J. P., Nizamani M. M., Harris A. J., Cheng X. L., Da L., et al. (2022a). Wealth and land use drive the distribution of urban green space in the tropical coastal city of Haikou, China. Urban Forestry Urban Greening 71, 127554. doi: 10.1016/j.ufug.2022.127554
Zhang H. L., Guo L. Y., Nizamani M. M., Wang H. F. (2023b). Distribution patterns and drivers of urban green space and plant diversity in Haikou, China. Front. Plant Sci. 14. doi: 10.3389/fpls.2023.1202115
Zhang H. L., Nizamani M. M., Cubino J. P., Guo L. Y., Zhou J. J., Wang H. F. (2022b). Spatiotemporal variation of urban plant diversity and above ground biomass in Haikou, China. Biology 11 (12), 1824. doi: 10.3390/biology11121824
Zhang H. L., Nizamani M. M., Cubino J. P., Harris A. J., Guo L. Y., Zhou J. J., et al. (2023a). Habitat heterogeneity explains cultivated and spontaneous plant richness in Haikou City, China. Ecol. Indic. 154, 110713. doi: 10.1016/j.ecolind.2023.110713
Keywords: urban plant diversity, socio-economic factors, biophysical conditions, landscape management, biodiversity conservation, urban planning, environmental influences
Citation: Zhang H-L, Nizamani MM, Guo L-Y, Cui J, Padullés Cubino J, Hughes AC and Wang H-F (2024) Interplay of socio-economic and environmental factors in shaping urban plant biodiversity: a comprehensive analysis. Front. Ecol. Evol. 12:1344343. doi: 10.3389/fevo.2024.1344343
Received: 27 November 2023; Accepted: 09 January 2024;
Published: 13 February 2024.
Edited by:
Paloma Cariñanos, University of Granada, SpainReviewed by:
Muhammad Imran Ghani, Northwest A&F University, ChinaCopyright © 2024 Zhang, Nizamani, Guo, Cui, Padullés Cubino, Hughes and Wang. This is an open-access article distributed under the terms of the Creative Commons Attribution License (CC BY). The use, distribution or reproduction in other forums is permitted, provided the original author(s) and the copyright owner(s) are credited and that the original publication in this journal is cited, in accordance with accepted academic practice. No use, distribution or reproduction is permitted which does not comply with these terms.
*Correspondence: Hua-Feng Wang, aGZ3YW5nQGhhaW5hbnUuZWR1LmNu; Alice C. Hughes, YWNodWdoZXNAaGt1Lmhr
†These authors share first authorship
Disclaimer: All claims expressed in this article are solely those of the authors and do not necessarily represent those of their affiliated organizations, or those of the publisher, the editors and the reviewers. Any product that may be evaluated in this article or claim that may be made by its manufacturer is not guaranteed or endorsed by the publisher.
Research integrity at Frontiers
Learn more about the work of our research integrity team to safeguard the quality of each article we publish.