 Chunbo Huang
 Xintao Gan1
 Yunshan Wan
 Lin Jin
94% of researchers rate our articles as excellent or good
Learn more about the work of our research integrity team to safeguard the quality of each article we publish.
Find out more
ORIGINAL RESEARCH article
Front. Ecol. Evol., 20 February 2024
Sec. Interdisciplinary Climate Studies
Volume 12 - 2024 | https://doi.org/10.3389/fevo.2024.1338742
Introduction: Population expansion and economic development increased global greenhouse gas emissions, leading to serious environmental degradation. China, the world's largest developing country and promoter of the “Belt and Road Initiative” (BRI), accounts for 28.8% of the world"s total energy carbon emissions. How to reduce energy consumption to achieve the “double carbon” target (i.e., carbon peaking and carbon neutrality) and promote the implementation of Green BRI is still a serious challenge that China needs to face.
Methods: We evaluated China's carbon emissions using three indicators (i.e., total carbon emission, carbon intensity, and carbon emissions effect), and used spatial analysis to reveal the spatial and temporal trends of China's carbon emissions. In addition, the LMDI model was adopted to explore the driving mechanism of carbon emissions, so as to seek a path that can achieve harmonious economic and environmental development, as well as the “double carbon” target.
Results: China's total carbon emission increased at a rate of 226.12% from 2000 to 2019, while the carbon intensity decreased at a rate of 48.84%. Carbon emission showed a trend of increasing and then decreasing from southwest to northeast. From 2000 to 2019, the total carbon emission, Gross Domestic Product (GDP), population size and total energy consumption are growing in synergy. Economic and population effects are positively related to carbon emissions, while technology effects are negatively related to it, indicating technological innovations contribute to the reduction of carbon emissions.
Discussion: Some suggestions were proposed to control carbon emissions with a view to helping policy makers to formulate relevant policies. The findings provide a scientific basis and reference for the country to achieve the “double carbon” target and the low-carbon sustainable development of BRI.
The increase in population expansion and economic development has led to a rise in global greenhouse gas emissions, contributing to the increasing global temperature (Rehman et al., 2022). The sixth report of the United Nations Intergovernmental Panel on Climate Change (IPCC) stated that the global average temperature in 2022 has increased by 1.1°C compared to 1850-1900, especially in terrestrial ecosystems and high latitudes of the northern hemisphere. Increased global warming has led to melting polar glaciers, rising sea levels and frequent extreme weather events (Mattingly et al., 2023), seriously accelerating species extinction and threatening human survival and development (Marzeion et al., 2018; Mardani et al., 2019). Global carbon dioxide (CO2) emissions have reached 38 billion tons in 2019 (Mattingly et al., 2023). Anthropogenic greenhouse gas emissions, such as fossil fuel combustion and land use change, have a significant impact on global warming (Rehman et al., 2022; Mattingly et al., 2023). In 1992, the world adopted the United Nations Framework Convention on Climate Change (UNFCCC), which agreed to “control the concentration of greenhouse gases in the atmosphere and avoid dangerous interference with the climate system” in order to effectively address the adverse effects of global warming on human society. The United Nations Framework Convention on Climate Change Subsequently, in the 1997 Kyoto Protocol, the Parties further proposed the magnitude of greenhouse gas emission reductions and short-term reduction targets at the global level (Jackson et al., 2016). However, it remains a challenge to balance regional and national interests for reducing carbon emissions in the Kyoto Protocol's “top-to-down” responsibility. How to tackle global warming has also changed from an environmental issue to an inter-regional and inter-ethnic political issue.
As the world's largest developing country and promoter of the Belt and Road Initiative (BRI) with a vast territory and a large population (Huang et al., 2022a), China joined the United Nations Framework Convention on Climate Change in 1992 to address climate change. This framework has proposed many policies and measures to control carbon emission and established a national coordination mechanism to address climate change (Yang et al., 2019). In 2007, it issued China's National Climate Change Program, which is the first comprehensive policy and a national plan for climate change in China (Liu et al., 2022). In June 2015, China submitted its report “Enhanced Actions on Climate Change: China's Intended Nationally Determined Contributions” to the Convention Secretariat, clearly stating that China will achieve controllable total carbon emissions in an autonomous manner and peak by 2030, which is called “Peak carbon dioxide emissions” (Zhou, 2015). In this plan, carbon intensity, the CO2 emissions per unit of GDP, will fall by 60~65% in 2030 compared to 2005, primary energy consumption will decrease around 20%, and forest stock volume will increase by 4.5 billion m3, all of which indicate that China has made significant progress in risk assessment and optimal governance (Yang et al., 2019; Liu et al., 2022). Meanwhile, China has made great efforts to achieve the goals of the United Nations Framework Convention on Climate Change and has been appreciated by the international community (Yang et al., 2019; Pettorelli et al., 2021). Additionally, China has also promoted the green development of BRI, creating important opportunities for global carbon reduction and effective response to climate change (Huang et al., 2022a). However, China has recently remained the world"s largest carbon emitter, accounting for 28.8% of the world"s total carbon emissions from energy sources. China is still facing significant pressure to reduce its emissions.
How to reduce carbon emissions and achieve the “double carbon” target is a hot topic, and some progress has been made to achieve carbon neutralization (Liu et al., 2022; Wang et al., 2023). Some studies (such as Cai et al., 2020; Qian et al., 2021) pointed out that the Chinese industry has already achieved an intensive transformation, driven by technology, energy and capital. Energy saving is a key solution for controlling carbon emissions. Some studies (such as Tian et al., 2019; Zhang et al., 2021; Zheng et al., 2021) documented the effects of economic scale, industrial structure, and technology on carbon intensity change, and proposed that the low-carbon development is the fundamental way to reduce carbon emissions (Wang et al., 2023). However, while these studies often concentrate on one particular aspect of emission reduction or a regional scale of emission reduction, there are relatively few that systematically assess China's existing contribution to reducing emissions, and much variation in the extent and direction of the impact of various drivers on carbon emissions (Liu et al., 2022). Therefore, it is urgent to fill this gap and provide a scientific basis and reference for relevant policy formulation.
The Logarithmic Mean Divisia Index (LMDI) model is widely adopted to demonstrate the carbon emission driving mechanism and forecast carbon emission (Ang and Liu, 2006). The LMDI decomposition method is usually used to decompose the CO2 emission growth rate (Zhang et al., 2020). It was to decuple the China's energy consumption into 11 drivers during 1995-2007, demonstrated their spatial and temporal variations and calculated the relative contributions of these drivers to carbon emission (Wang et al., 2010). Meanwhile, the LMDI model was used to decompose carbon emissions and found that the economic effect was the main positive driver, while the energy effect was the main negative driver (Zhang et al., 2020). It was used to demonstrate the relationship between lower per capita emission and higher energy consumption in India (Ramachandra and Shwetmala, 2012), indicating the main factors of increasing total carbon emissions were lower energy efficiency and emission reduction policies. Moreover, a stochastic special form was derived from the LMDI model and could realize the analysis of the induvial effects of wealth, population, technology and other variables on the environment by eliminating the impacts caused by the changes in these independent variables (Wang et al., 2010; Zhang et al., 2020).
The new economic development model applies the low carbon economic theory to various human activities and transforms the traditional economic development model into a new low-carbon economic model (Wang et al., 2010; Liu et al., 2022). Although there are more studies on carbon emissions concerning low-carbon development models, the data analysis is relatively homogenous and the carbon emission driving mechanism remains unclear. In this paper, we collected carbon emission data in China from 2000-2019 to analyze the spatial and temporal variations by the hotspot analysis. Meanwhile, the LMDI model analysis was used to demonstrate the driving mechanism of carbon emissions, and then suggestions were proposed for China's low carbon development model.
In this paper, the mainland area of China, excluding Hong Kong, Macao and Taiwan, was selected as the study area (Figure 1). China is a vast country with many plains in the east and many plateaus and mountains in the west. The eastern part of China has a monsoon climate (which can also be divided into subtropical monsoon climate, temperate monsoon climate and tropical monsoon climate), the northwestern part has a temperate continental climate, and the Qinghai-Tibet Plateau has an alpine climate. From south to north, there are tropical, subtropical, warm temperate, middle temperate, cold temperate and Qinghai-Tibet Plateau zones. The population is becoming increasingly sparse from the southeast coast to the northwest interior. The population distribution is extremely unbalanced, with the population mostly concentrated in the southeastern region and sparsely scattered in the northwest. Due to the variations in climate, economy and population, we divided the study area into eight sub-regions (Table 1).

Figure 1 The study area and sub-regions.

Table 1 Sub-regions for analyzing the spatial difference of carbon emission.
Carbon emission data in China from 2000-2019 was obtained from the China Carbon Accounting Database (CEADs). Meanwhile, total energy consumption, population, nominal GDP, the consumer price index (CPI), forest area, energy processing and conversion efficiency, industrial structure and energy structure data were obtained from the China Statistical Yearbook (2001-2020).
Considering inflation, real GDP was generated by using the CPI to adjust the nominal GDP. GDP of 2000 was used as a calibration, and we set the CPI of 2000 to 100, then applied the Equation 1 to calculate the real GDP from 2001 to 2019.
Where GDPi is real GDP in the i-th year, the nominal GDPi and CPIi both are collected from the statistical yearbooks in the i-th year. The CPI2000 is the CPI in 2000 and equals 100.
We used three carbon emission indicators, namely total carbon emission, carbon intensity (the ratio of carbon emission to real GDP, t/10000 yuan) and carbon emission effect, to comprehensively and systematically evaluate carbon emission in China.
The LMDI model proposed by Ang (2005), has the following advantages: (i) avoiding the effects of residual terms in the factor decomposition of the LMDI; (ii) the additive properties for the factor decomposition, i.e. ; (iii) correspondence relationship between the additive and multiplicative decompositions, which can be converted to each other, i.e. for all k, there is ; (iv) the additive decomposition model is more suitable for quantitative indicators and the multiplicative decomposition model is more suitable for intensity indicators (Ang, 2005).
In these equations, V is the decomposed quantity, and n denotes the influencing factor of V. The exponential decomposition can be defined as , i.e. The change in V in period 0 is and the change in V in period t is , and the additive model is more suitable for quantitative indicators Using the additive decomposition model, the change difference can be decomposed as Equation 2.
According to the above equations, the effect of the k-th factor can be expressed as Equation 3.
According to the LMDI decomposition model, the total carbon emissions can be decomposed into Ci by Equations 4 and 5.
And the is defined as Gi, which is the carbon emissions from the average energy consumption, depending on the energy structure. The is defined as Ti, which is the amount of energy consumed by the average real GDP, depending on the level of technology. The GDPi/Pi is defined as Yi, which is the amount of real GDP per capita, depending on the level of the economy. And Pi denotes the total population at the end of the year, depending on the level of population.
The carbon emissions in the t-th period can be expressed as Equation 6 according to Equation 5.
Where ΔCG is the structural effect, reflecting the contribution of the energy consumption structure to the carbon emissions; ΔCT is the technological effect, reflecting the contribution of the intensity of energy use to the carbon emissions; ΔCY is the economic effect, reflecting the contribution of the level of the economy to the carbon emissions; and ΔCP is the population effect, reflecting the contribution of population size to the carbon emissions.
Moreover, we defined , and then generated , , (a) and
Referring to the empirical analysis of carbon emission models (Tang et al., 2011), we constructed the following conceptual models by Equations 7, 8 and 9.
where Ci denotes the total carbon emissions in the i-th year, using carbon emissions data from the CEADs China Carbon Accounting Database from 2000-2019. CIi denotes the carbon intensity in the i-th year, using the ratio of carbon emission to real GDP. ΔCi denotes the carbon emission effect in the i-th year. Ei denotes energy consumption in the i-th year, using data on total national energy consumption. Si denotes the industrial structure in the i-th year, using the share of secondary and tertiary real GDP in total real GDP. Ni denotes the energy mix in the i-th year, using the share of non-fossil energy consumption in total energy consumption. Fi indicates forest resource endowment in the i-th year, using the national forest area data. Eti denotes the energy processing conversion efficiency in the i-th year. Yi denotes the level of economic development in the i-th year, using real GDP per capita data. Ti denotes the level of technology in the i-th year, using the average real GDP energy consumption measure. Gi indicates the level of energy mix in the i-th year, using carbon emissions per unit of energy consumption. Pi indicates the population level in the i-th year, using national year-end population data.
The spatial variation of carbon emission was analyzed by spatial analysis for 31 provinces, and the temporal variations carbon emissions was analyzed through trend analysis for the carbon emission data from 2000 to 2019. Spatial hotspot analysis is a common method for measuring spatial relationships (Hou et al., 2019; Cheng et al., 2023), and could indicate the clustering of locations and intensities. It was used to investigate the regional spatial dependence of carbon emission changes from 2000 to 2019. Spatial clustering relationships are measured by z scores and p values (Cheng et al., 2023). Higher (or lower) z scores indicate stronger clustering, while z scores close to zero indicate no significant spatial clustering, which is recorded as insignificant clustering. Hot spots, which denote spatial clustering, indicates high values with higher z scores and smaller p values. In contrast, cold points, which are also spatially clustered, indicate low values with lower z scores and smaller p values.
In this study, we adopted ordinary least squares model (OLS), spatial lag model (SLM), spatial dubin model (SDM) and spatial error model (SEM) to conduct spatial regression analysis based on Equations 10 and 11 (Huang et al., 2022b). The OLS is widely used, but it ignores the potential spatial effects, which could lead to an incomplete explanation of the regression results (Beale et al., 2010). The SDM is a combined extension of the spatial lag model and the spatial error model, which can be set up by adding corresponding constraints to the spatial lag model and the spatial error model. The SLM assumes that spatial autocorrelation occurs in the dependent variable (Wang et al., 2019). It not only emphasizes the neighborhood effect, but also considers the phenomenon of spatial diffusion (the spillover effect) in the dependent variable across geographical units. The SEM mainly considers the neglected and unobserved spatial interdependencies between variables (Wang et al., 2019).
where is the first-order posterior variable of the variable ; denotes the spatial lag of the independent variable; is the row i of the relative spatial weight matrix D; denotes the time effect; is the row i of the spatial weight matrix M in the interference error term, and is the interference error term. t denotes a temporal cross section, and Subscript i refers to a cross section in the panel data. The above formula is a general form of spatial regression modeling: the spatial panel model, but since the spatial panel model is not representative, the following cases are usually considered.
If λ = 0, then the model is spatial dubin model (SDM).
If τ = 0, δ = 0, then the model is spatial autocorrelation model (SAC).
If λ = 0, δ = 0, then the model is spatial lag model (SLM).
If τ = ρ = 0, and δ = 0, then the model is spatial error model (SEM).
China's total carbon emissions increased from 3003.43 Mt in 2000 to 9794.76 Mt in 2019 (Figure 2). The increase rate of carbon emission between 2000 and 2019 was 226.12%, which can be broadly divided into three stages. The first is the rapid growth stage during 2000-2013, when carbon emissions increased by more than 5%/yr. The second is the short-rebound stage during 2014-2015, with carbon emissions showing a decrease in the range of 1% to 2%/yr. The third is the slow growth stage during 2016-2019, when carbon emissions increase by around 1.5%/yr. In terms of sub-regions, All sub-regions show an increasing trend in carbon emissions, the contribution rate of carbon emissions during 2000-2019 is the highest in the North Coastal Region, followed by the Middle Yellow River Region, and the lowest in the Great Northwest Region. Carbon emissions from all regions increased from 2000 to 2019, but the increase rate decreased over the years.

Figure 2 Carbon emissions of China from 2000 to 2019.
However, China's carbon intensity decreased from 2.98 t/10,000 yuan in 2000 to 1.53 t/10,000 yuan in 2019, with a decrease rate of 48.84%. The change in carbon intensity also could be divided into two stages: the first stage is the fluctuating change during 2000-2005; the second stage is the stable decline stage during 2006-2019, with a decrease rate around 5%/yr. In terms of sub-regions (Figure 3), the carbon intensity of all regions shows a decreasing trend excluding Great Northwest Region. The Northeast Region, the Great Northwest Region and the Middle Yellow River Region are the three regions with the higher average carbon intensity, while the Eastern Coastal Region is the region with the lowest average carbon intensity. Regarding the decline, except for the Great Northwest Region where the carbon intensity has changed significantly, the decline of carbon intensity in other sub-regions has gradually stabilized, among which the Middle Yellow River Region and the Southwest Region have experienced the largest decline in carbon intensity.

Figure 3 Carbon intensity of China and sub-regions from 2000-2019.
The spatial distribution of China's carbon emissions in 2019 (Figure 4) presented increasing first and then decreasing from southwest to northeast, with Hebei, Shandong, Jiangsu and Inner Mongolia as representatives of heavy emitting regions, all with carbon emissions exceeding 750 Mt carbon, followed by Shanxi, Henan, Guangdong, Liaoning and Xinjiang, which are medium emitting regions. Compared with the carbon emissions of sub-regions in 2019, Liaoning Province in the Northeast Region emitted 533 Mt carbon, making it the largest carbon emitter in the Northeast Region. In the Northern Coastal Region, Shandong Province and Hebei Province are the main carbon sources, emitting more than 900 Mt carbon. In the Eastern Coastal Region, Jiangsu Province emitted more than 800 Mt carbon. In the Southern Coastal Region, Guangdong Province is the main emitter, with more than 500 Mt carbon. In the Middle Yellow River Region, Inner Mongolia is the main carbon emission source, emitting nearly 800 Mt carbon. In the Middle Yangtze River Region, all provinces emitted about 300 Mt carbon. In the Southwest Region, all provinces emitted a small amount of carbon, with the highest value being 315 Mt in Sichuan. In the Great Northwest Region, the main source of carbon is the Xinjiang Uyghur Autonomous Region, emitting 455 Mt carbon.
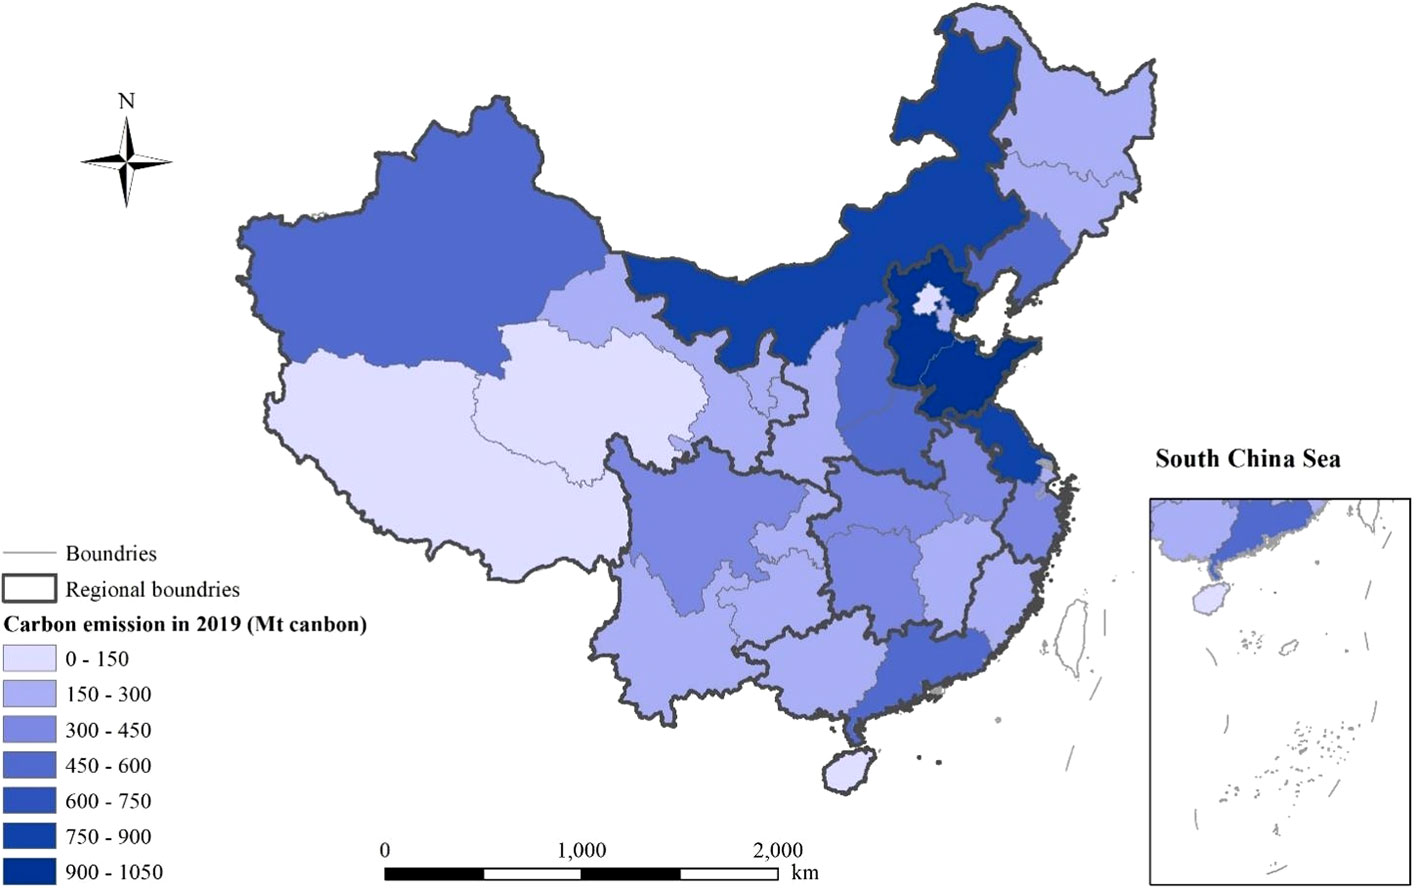
Figure 4 Spatial distribution of carbon emissions in 2019 in China.
Carbon emission change from 2000 to 2019 was divided into four stages: 2000-2005, 2005-2010, 2010-2015 and 2015-2019, and the spatial hotspot analysis was performed (Figure 5). From 2000 to 2005, the carbon emission change rate was higher in northern China (Figure 5A1). And the corresponding hotspots were clustered in North Coastal Region and Middle Yellow River Region (Figure 5B1), indicating a significant increasing trend of carbon emissions, and a significant spatial clustering in the North Coastal Region and Middle Yellow River Region. From 2005 to 2010, carbon emissions in Inner Mongolia, Shandong, Henan and Liaoning changed significantly, and the hotspots shrank towards the center of the North Coastal Region (Figures 5A2, B2). During 2010-2015, only Xinjiang and Jiangsu Province showed a sharp increase in carbon emissions, while Henan and Hubei showed a negative growth trend, with insignificant change in other regions, and the hotspot analysis results also showed an insignificant spatial clustering effect (Figures 5A3, B3). From 2015 to 2020, the carbon emission did not change obviously except for Inner Mongolia and Hebei (Figures 5A4, B4). Sichuan, Chongqing, Henan and Heilongjiang showed a negative increase, and the hotspot map exhibited a significant spatial aggregation. The hotspots still concentrated in Inner Mongolia and Liaoning and spread to northern China, while the cold spots concentrated in Sichuan, Jiangxi and Hunan, showing obvious spatial aggregation, while other regions did not present a significant aggregation effect.
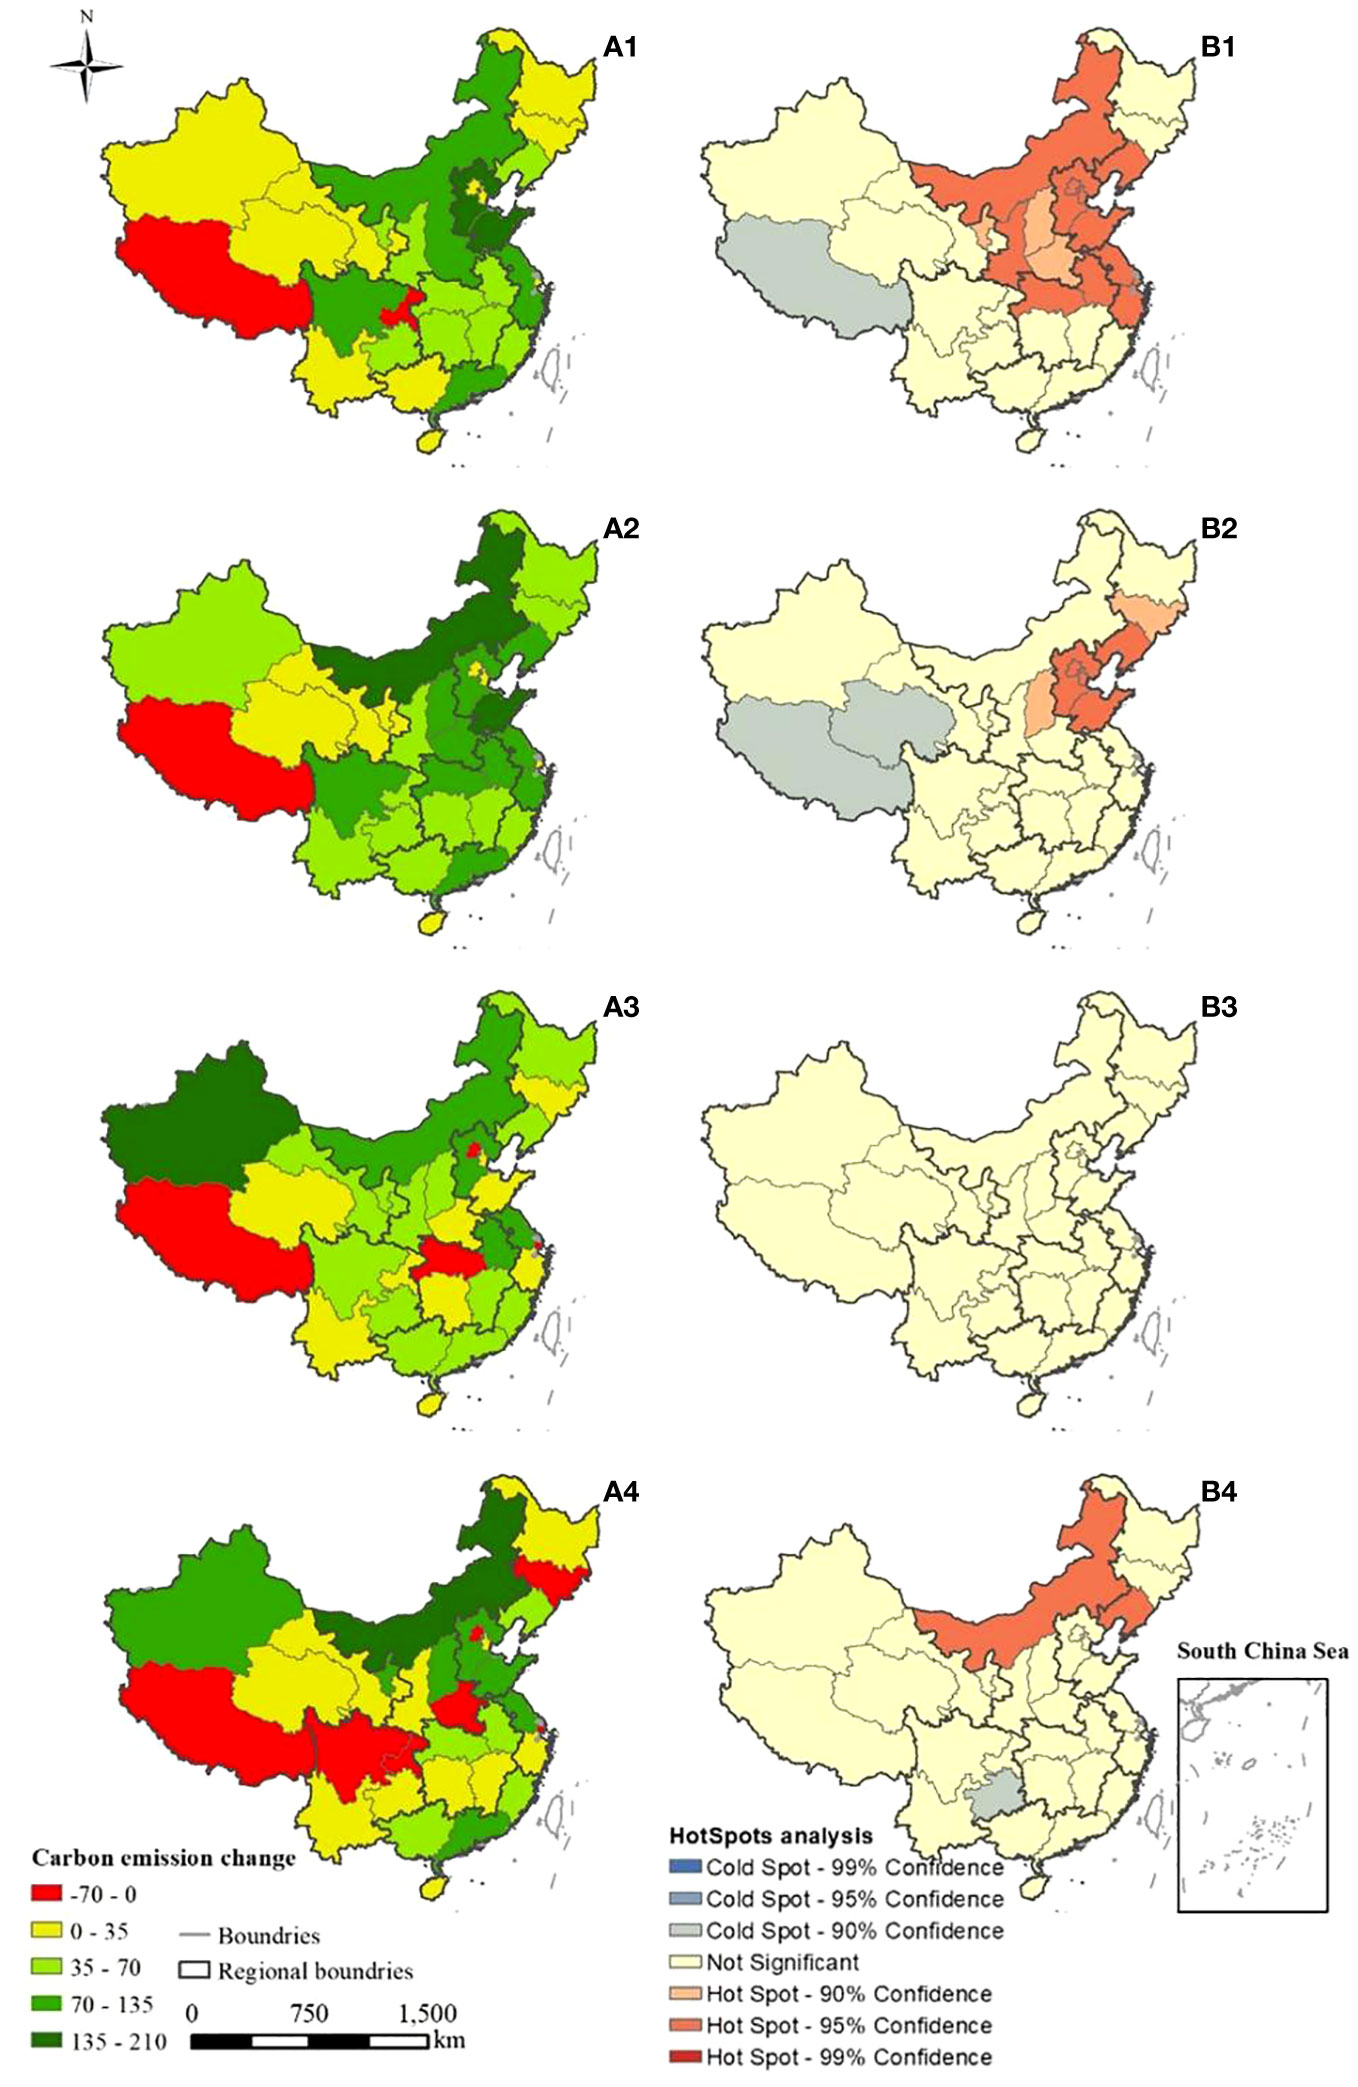
Figure 5 Spatial maps of carbon emission change during 2000-2005 (A1), 2005-2010 (A2), 2010-2015 (A3), 2015-2019 (A4), and their hotspot analysis during 2000-2005 (B1), 2005-2010 (B2), 2010-2015 (B3), 2015-2019 (B4).
Spatial regression analysis was conducted to determine the spatial effects of carbon emission changes from 2000 to 2019 (Table 2). The spatial autocorrelation test of carbon emissions showed that the Moran’I was 0.211. And the spatial autoregressive coefficients rho for both SDM and SLM were negative, with p-values close to 0.1. Therefore, carbon emissions have a negative spatial spillover effect at the 90% significant level. According to R2 and AIC (the information criterion of Akaike), the SLM and SEM are more suitable than the SDM. Among these spatial regression models, the fitness is the highest and the AIC is the lowest for the SEM. The coefficients of the total energy consumption and real GDP are statistically significant at the 99% significant level, and their estimated value are 0.134 and 0,025, respectively. Meanwhile, the relationship between carbon emission change and the population is significantly negative with a regression coefficient value of -0.022 (p< 0.05).
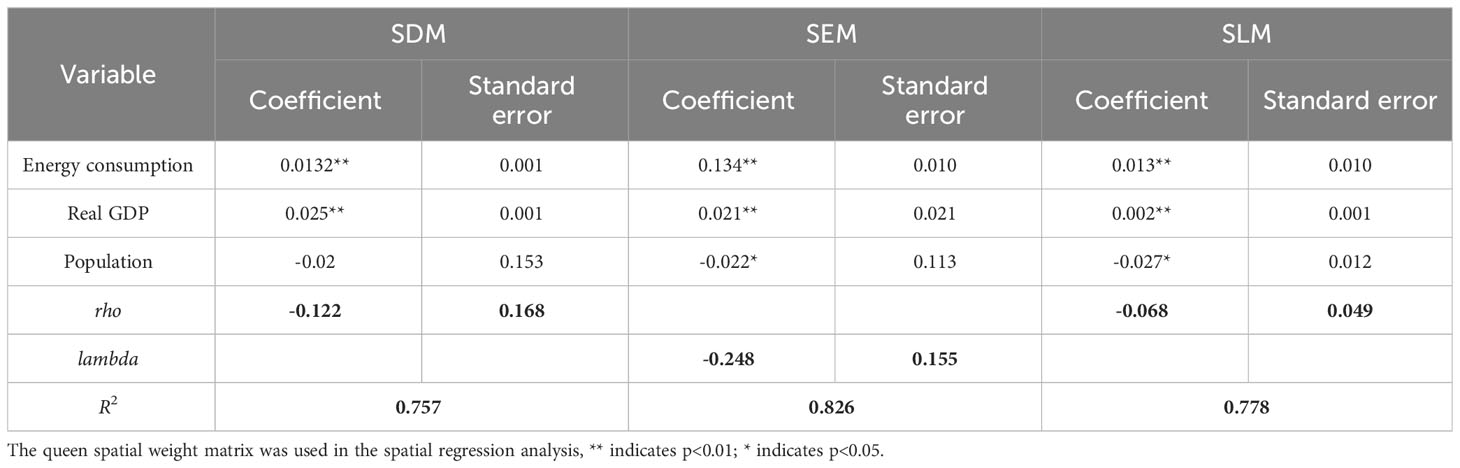
Table 2 Spatial regression analysis of carbon emission change between 2000 and 2019 by using SDM, SEM and SLM.
China's total carbon emissions, real GDP, population size and total energy consumption are growing in synergy from 2000 to 2019 (Figure 6). In particular, the real GDP increase could be divided into two stages, with 2004 as the folding point. The average annual growth rate of real GDP remained at around 3% during 2000-2003 and 2011-2019, and was about 10% during 2004-2010. The growth of total energy consumption can be divided into two phases, the first phase during 2000-2011 with an average annual growth rate of around 9%, and the second phase during 2012-2019 with an average annual growth rate of around 3%. Combined with total carbon emissions from 2000 to 2019, China's economy grew rapidly and the average annual growth rate of real GDP was higher than the growth rate of total carbon emissions.

Figure 6 Temporal variations of China's total carbon emissions, population, total energy consumption, and real GDP from 2000 to 2019.
The energy emission factor, energy intensity and real GDP per capita from 2000 to 2019 were calculated (Figure 7). Real GDP per capita has continued to grow and the interannual growth rate has also been rising, indicating that China's social living standard is constantly improving. Meanwhile, energy emission factor is relatively stable, fluctuating around a factor of 2.1. Energy intensity was generally on a downward trend, and the reduction rate increased significantly after 2005, and was less than 1 in 2008, indicating that China's energy conservation and emission reduction work is still effective and the level of energy-saving technologies is improving.
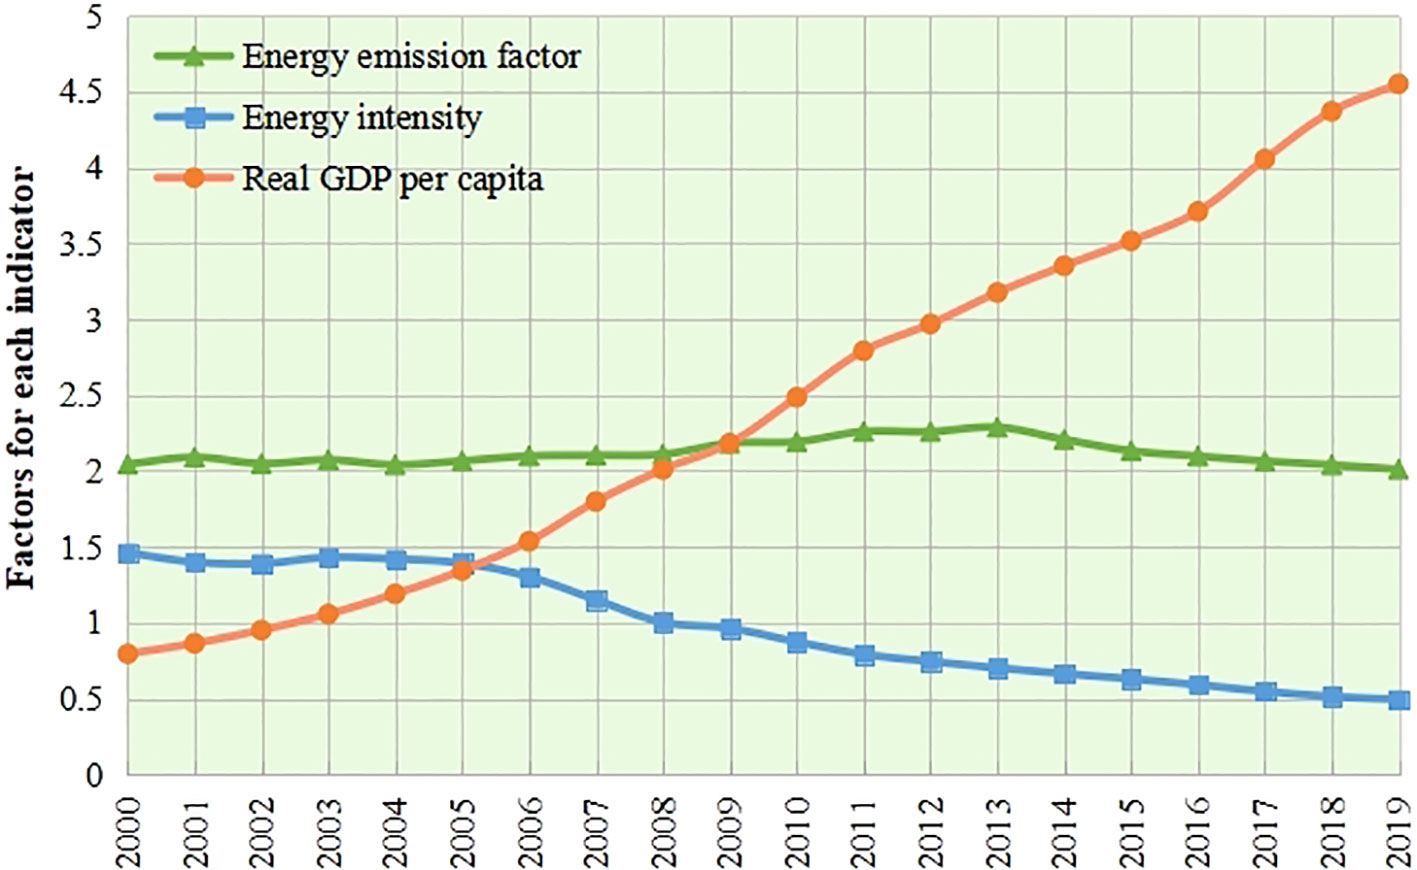
Figure 7 Temporal variations of energy emission factor, energy intensity and real GDP per capita from 2000 to 2019 in China.
China's carbon emission continued to grow from 2001 to2013, reaching a peak in 2011 with an increase of 837.01 Mt compared to the previous year (Table 3). Subsequently, from 2014 to 2016, there was a reduction in the magnitude of carbon emissions, with the maximum decrease occurring during 2014-2016 at 197.78 Mt carbon. From 2017 to 2019, the carbon emissions increased at an annual rate of 197.5 Mt. In total, carbon emissions have increased by 6791.33 million tons over these two decades. China's total carbon emissions were impacted by structural effect, technological effect, economic effect and population effect. The effect values from 2000 to 2019 were decomposed by the LMDI model (Table 3). The economic effect, structural effect and population effect all contributed to the increase of carbon emissions from 2000 to 2019. Among them, the economic effect that the growth of economic development level, contributed 8530.49 Mt carbon, accounting for 91.41% of the growth of carbon emissions. And the structural effect that the adjustment of energy structure, contributed 382.12 Mt carbon, accounting for 4.10% of the growth of carbon emissions. Population effect, namely population growth, contributed 419.17 million tons of carbon emissions, or 4.49%. The technological effect, namely the change in energy intensity, reduced carbon emissions by 2540.46 Mt from 2000 to 2019, indicating that the technological innovation would impact carbon emission significantly and is a negative driver of carbon emissions growth in China.
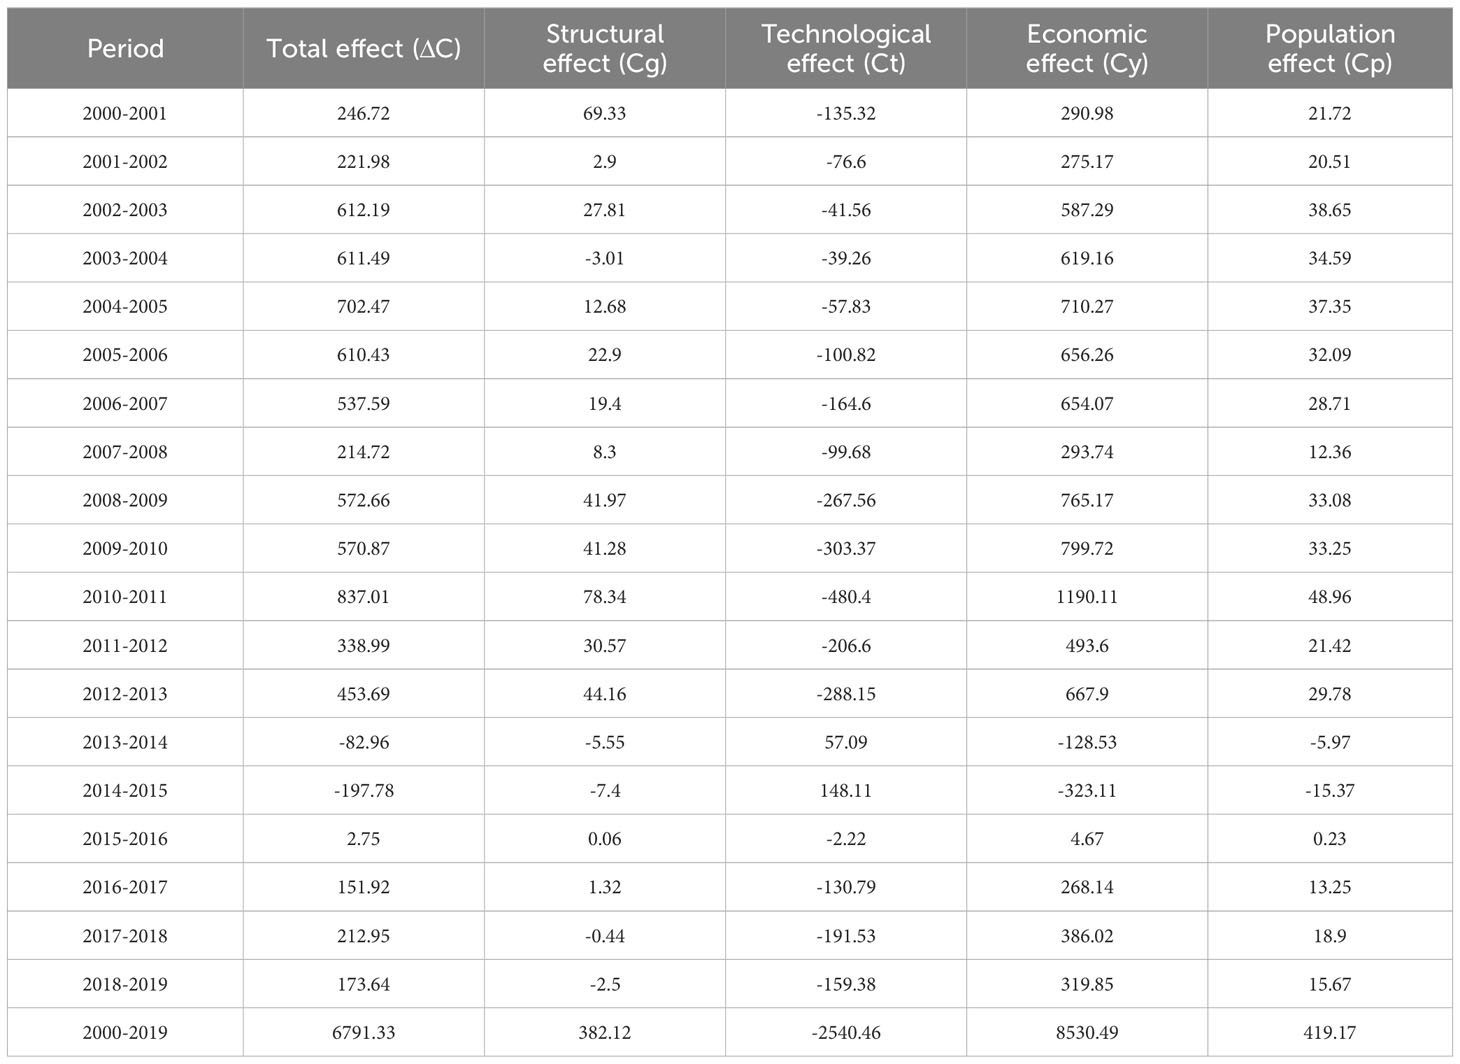
Table 3 Additive decomposition results of LMDI.
The fluctuation in carbon emission rates from 2000 to 2019 highlights the manifold driving forces behind these changes. Economic development emerges as a major contributor, with real GDP growth correlating with heightened energy consumption, consequently elevating emissions. Population dynamics also play a pivotal role; expanding populations drive up energy and resource demands, thereby accelerating carbon emissions. Moreover, technological innovations play a crucial role in curbing carbon emissions by moderating emissions per unit of energy utilized. In summary, the impacts of technological, structural, economic, and demographic factors on carbon emissions are intricate. Technological influence manifests through the adoption of innovative technologies, directly impacting energy efficiency and the adoption of cleaner energy sources. Structural factors primarily involve shifts in economic paradigms, where different industry developments may either amplify or alleviate carbon emissions. Economic aspects significantly influence carbon emissions, given the typical correspondence between economic growth and heightened energy needs. Population dynamics exert a profound influence on resource and energy requisites, potentially heightening consumption and emissions due to population growth. These factors intricately interweave, collectively shaping the fluctuations observed in carbon emissions.
The energy intensity presented an overall decreasing trend from 2000 to 2019 in China (Figure 6), indicating a continuous improvement in energy use efficiency due to technological advances. Energy intensity is a key indicator for measuring the input-output characteristics of energy system (Faridzad et al., 2020), and the overall efficiency of energy and economic activities is reflected by energy consumption per unit of GDP, with lower intensity values indicating more efficient energy use (Wang et al., 2019; Xu et al., 2019). The energy intensity could reduce carbon emissions during 2000-2014 and 2017-2019 (Table 3). Therefore, the technological progress is the key measure to curb carbon emissions, and the efficient use of clean energy such as solar, hydro, wind, geothermal, tidal, bio, and nuclear energy is also an effective way to reduce carbon emissions (Xu et al., 2019).
In terms of structural effects, the change in carbon emissions caused by the adjustment of energy consumption structure is not significant (Table 3). The restructuring of energy consumption contributed to 382.12 MT of carbon emissions from 2000-2019. After 2015, there are several years that carbon emissions have a negative driving effect. The energy emission factor in 2000 and 2019 was stable (Figure 7), indicating that energy consumption and carbon emissions generated by China's rapid urbanization and industrialization have been effectively curbed (Wang et al., 2019).
GDP per capita is an important indicator for measuring the macroeconomic development of a country or region, reflecting the average level of production and living services (Huang et al., 2022a). Economic strength is the basis of a country's development. Meanwhile, developing production is an important way to improve the economy (Cai et al., 2020). The development of production requires the use of energy, which inevitably leads to an increase in carbon emissions (Haberl et al., 2020). The economic effect contributes 8530.49 Mt of carbon emissions (Table 2), accounting for 91.41% of the total effects. It shows that the trends in the economic and carbon effects are generally consistent (Figure 7), suggesting that the economic effect is a key driver of carbon emissions.
Economic development increases the total amount of carbon emissions, while technological advances and clean energy development require strong economic strength to support (Qian et al., 2021; Liu et al., 2022). How to reconcile the relationship between national economic development and environmental protection has always been a hot topic (Huang et al., 2022a; Cheng et al., 2023). Therefore, many papers (such as Mardani et al., 2019; Wang et al., 2019; Xu et al., 2019) supported that carbon intensity is an important indicator to reveal the degree of coordination between the economic development capacity and CO2 emissions in a certain country or region.
China is the most populous country in the world, and the impact of population growth on carbon emissions cannot be ignored (Tang et al., 2011; Huang et al., 2022a). China's population growth contributes a smaller portion of carbon emissions and plays a positive driving role (Table 2), which may be caused by urbanization, urban population expansion, and the popularity of transport in China (Yang et al., 2019; Cai et al., 2020). Due to the introduction of relevant environmental protection policies in China after 2014 (Liu et al., 2022), its contribution to carbon emissions has decreased slightly. To maintain this good effect, the government should strengthen its publicity on environmental protection, raise the awareness of environmental protection of the whole population and build a green and harmonious society (Wang et al., 2019; Qian et al., 2021).
Given current energy structure and consumption patterns, Chinese carbon emissions are expected to continue rising (Yang et al., 2019). Achieving the “double carbon” target and fostering high-quality development for the Green BRI places a significant responsibility on China to reduce energy consumption (Huang et al., 2022a). It is crucial to strike a balance between economic development and environmental protection (Tian et al., 2019; Huang et al., 2022b). Here, specific measures are outlined to help build ecological civilization and promote green and sustainable development.
(1) Area allocation
Currently, carbon emissions are unevenly distributed (Figure 4). It requires a rational allocation of carbon emission rights (Figure 8A). In addition, the income of developing regions and low and middle-income households could be increased through inter-regional and inter-household trading of carbon emission rights (Yang et al., 2019). It can not only be conducive to better control of greenhouse gas emissions (Xu et al., 2019), but also fill the gap between developed and developing regions, as well as high-income and low and middle-income households, contributing to achieving the goal of common prosperity (Wang et al., 2019; Zhang et al., 2021). However, the complexity of calculating the historical carbon emissions makes it difficult to allocate the limited carbon credits fairly and reasonably among regions and households (Mattingly et al., 2023), as well as to establish a market mechanism for carbon emissions trading between regions and households (Huang et al., 2019). This paper is still at the conceptual or initial stage of exploring the above issues, and research on related issues still needs to be further advanced (Cheng et al., 2023). Some areas are ecological barrier areas and some are ecological beneficiary areas (Cai et al., 2020). The principle of compensation is that provinces whose carbon sources are greater than their carbon sinks buy carbon credits from provinces whose carbon sources are smaller than their carbon sinks at a certain price (negotiated by both sides or set by the state), thus ensuring a relative balance of the economic and ecological benefits for each province (Faridzad et al., 2020; Cheng et al., 2023).
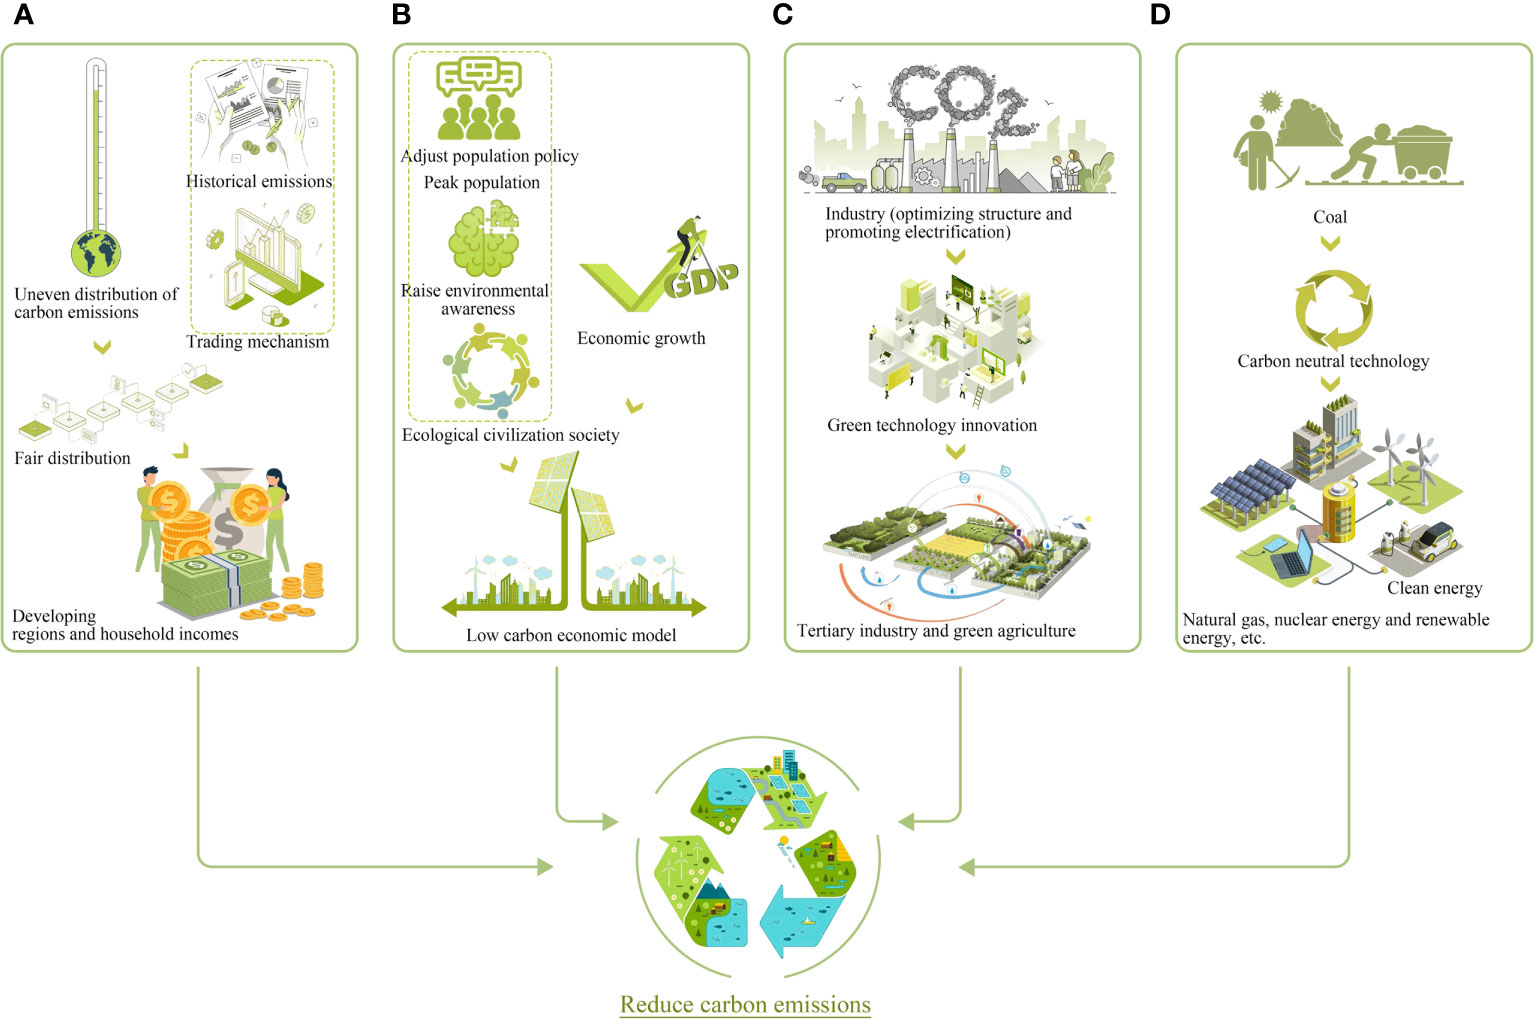
Figure 8 Suggestions for constructing ecological civilization and promoting green and sustainable development. (A) Area allocation optimization suggestions. (B) Economic development optimization suggestions. (C) Energy structure optimization suggestions. (D) Energy consumption reducing suggestions.
(2) Economic development
Economic level plays a major role in carbon emission growth, and is also the lifeblood of national development (Mardani et al., 2019). Without compromising the rate of economic development, it is necessary to accelerate the transformation of the economic model based on fossil energy consumption, as well as develop a green low-carbon economy and achieve a low-carbon economic development model (Figure 8B). Meanwhile, the population policy should be reasonably adjusted under national conditions, so as to achieve a population peak at an early date on the premise of ensuring an adequate labor force and a good population structure (Rehman et al., 2022), which will in turn promote a carbon peak. On the one hand, it is necessary to strengthen publicity on the low-carbon environment, and promote low-carbon travel and green living (Li et al., 2021). On the other hand, citizens' awareness of environmental protection needs to be improved to create an ecologically civilized society (Qian et al., 2021; Rehman et al., 2022). This entails more economic output through less natural resource consumption and environmental pollution (Jackson et al., 2016), and a low-carbon economy is an advisable way to create higher standards of living and a better life quality.
The role of industrial structure on carbon emissions should not be underestimated. Industry accounts for more than 85% of carbon emissions across all sectors (Wang et al., 2023). The industrial sector is the main object of energy saving and emission reduction, which is also an important participant in reducing carbon emissions (Tang et al., 2011). The structure of China's three major industries should be constantly optimized (Figure 8C). We can strengthen the electrification of industry and construction, vigorously develop low energy consumption and high value-added tertiary industries, as well as green agriculture with the primary industry as the foundation (Rehman et al., 2022). Moreover, the innovation in green technologies is rapidly evolving, and examination of emerging technologies such as next-generation solar cells, bioenergy with carbon capture and storage (BECCS), and the integration of renewable energy sources into the existing grid could provide new pathways for carbon reduction (Tan et al., 2021).
(3) Energy structure suggestions
Energy consumption also plays an important role in carbon emissions, and it is necessary to promote the transition to cleaner energy and electrification (Tan et al., 2021). The use of non-fossil energy is also increasing at the same time (Rehman et al., 2022). It is necessary to develop new renewable energy sources, and improve the efficiency of green and clean energy use to continue to reduce energy intensity (Figure 8D). China's fossil energy resources are characterized as “coal-rich, oil-poor, and gas-poor”, which determines that coal is the main source of energy consumption (Tan et al., 2021; Zuo et al., 2021). The current share of coal in total energy consumption is nearly 70%, significantly higher than the international average. The proportion of oil has increased, but it has not completely replaced coal (Tong, 2021). The coal-based energy consumption structure is unlikely to change radically in the next decade, requiring carbon-neutral technologies to reduce carbon emissions during the combustion process by decarbonizing coal before consumption (Yang et al., 2019; Pettorelli et al., 2021). In this pattern, it is necessary to accelerate the development of natural gas and develop nuclear power appropriately. Additionally, the active development of hydropower and in-depth development of wind, solar, hydro, geothermal and biomass, and other renewable energy sources is also necessary. It will be the main direction of a low-carbon economy to reduce the proportion of coal in the energy consumption structure (Zuo et al., 2021).
Overall, it is complex and multifaceted for the relationship between economic growth and environmental protection. Historically, economic growth has been closely associated with resource consumption, energy demand, and environmental impacts. In some cases, an excessive pursuit of economic growth may lead to overexploitation of natural resources, environmental pollution, and ecological degradation. However, moderate economic growth can also promote environmental protection and sustainable development. When countries or regions implement environmentally friendly policies and invest in clean technologies and renewable energy, economic development and environmental protection can complement each other. Effective environmental protection measures can enhance ecosystem stability, reduce waste of natural resources, and foster long-term economic sustainability. In today"s world, an increasing number of countries and regions recognize the synergies between economic growth and environmental protection. The concept of sustainable development emphasizes the protection of environmental resources while fostering economic growth to ensure the survival and development of future generations. Thus, achieving a proper balance between economic growth and environmental protection is a crucial issue in global sustainable development today.
While our findings offer valuable insights into the carbon emission dynamics in China and the effectiveness of various interventions, there are still some limitations and uncertainties inherent. First, the LMDI model, while robust, has its own set of limitations. It assumes that the influence of the decomposed factors is independent and linear, which may not fully capture the complex, non-linear interdependencies between economic growth, energy consumption, and carbon emissions (Ang, 2005; Ang and Liu, 2006). Second, our carbon emission data is obtained from CEADs, and any inaccuracies in the database directly affect the findings. Additionally, the lack of data granularity, especially in sector-specific emissions and regional energy consumption, can limit the depth of analysis. Third, this study assumes a constant rate of technological innovation over the study period, which does not account for the potential acceleration or deceleration in technological advancements that could significantly influence energy intensity and emission factors (Tian et al., 2019). Last, the spatial analysis is based on provincial-level data, which may mask sub-regional disparities, and the temporal analysis does not account for future changes in regional development patterns that might arise from urbanization trends or economic shifts (Pettorelli et al., 2021).
The future low-carbon development and carbon emission reduction in China holds multiple dimensions that need to be explored to enrich understanding and improve practical applications (Faridzad et al., 2020; Cheng et al., 2023). First, it should aim to refine the existing models, incorporate more detailed and higher-quality data, and consider a broader range of factors to enhance the understanding of carbon emission dynamics in China and beyond (Wang et al., 2019). Second, an interdisciplinary approach combining economics, environmental science, and technology studies is essential to grasp the full scope of factors influencing carbon emissions (Mattingly et al., 2023). Some advanced econometric models and machine learning algorithms could integrate to unravel the complex non-linear relationships between economic growth, energy consumption, and carbon emissions. Third, sector-specific studies should delve deeper into industrial, agricultural, and service sectors to tailor carbon reduction strategies effectively (Rehman et al., 2022), which could involve examining the potential for carbon capture and storage technologies in heavy industries (Paltsev et al., 2021), sustainable agricultural practices, and energy efficiency in the service sector. Last, future research should focus on provincial and local levels considering regional disparities, where policies can be more targeted and the impact of interventions can be measured more accurately. Case studies of cities or regions that have successfully implemented low-carbon initiatives can provide valuable blueprints for others (Cheng et al., 2023). Moreover, future research need aim to be predictive, prescriptive, and proactive, providing guidance that policymakers and stakeholders can rely on to navigate the challenges of achieving carbon neutrality while fostering economic growth and social development.
As the world's largest developing country and the promoter of BRI, China accounts for 28.8% of the world's total energy carbon emissions, threatening regional economic development and environmental security. To be specific, China faces an urgent task of addressing climate change and reducing carbon emissions. Some primary challenges include the transformation of energy structures and pressures related to economic growth. We evaluated China's carbon emissions during 2000-2019 using three carbon emission indicators: total carbon emission, carbon intensity and carbon emission effect. The results showed that China's total carbon emissions increased from 3003.43 Mt in 2000 to 9794.76 Mt in 2019, while China's carbon intensity decreased from 2.98 t/10000yuan in 2000 to 1.53 t/10000yuan. China's carbon emissions show a trend of increasing and then decreasing from southwest to northeast. The heavy emission areas represented by Hebei, Shandong, Jiangsu and Inner Mongolia all emit more than 7.5 million tons of carbon, followed by Shanxi, Henan, Guangdong, Liaoning and Xinjiang. Moreover, the LMDI model revealed that China's total carbon emissions were influenced by structural, technological, economic, and demographic effects. Among them, economic, structural and demographic effects exacerbate the increase of carbon emissions, while technological innovation contributes to reduce carbon emissions. Based on our study findings, we have formulated specific recommendations aimed at curbing energy consumption and attaining the “double carbon” target. These results are pivotal in aiding policymakers across China and BRI nations in fortifying emission reduction strategies within high-emission sectors and regions, thereby significantly reducing carbon emissions. This initiative involves fostering technological innovation, embracing clean energy solutions, and accounting for the influence of economic, structural, and demographic shifts on carbon emissions to mitigate the pace of emission escalation. Strengthening these conclusions through a more integrated synthesis consolidates the intricate relationship between economic advancement, technological innovation, and environmental preservation, thereby augmenting the depth and impact of our study.
The original contributions presented in the study are included in the article/supplementary material. Further inquiries can be directed to the corresponding author.
CH: Conceptualization, Writing – review & editing, Project administration, Supervision, Validation. XG: Formal analysis, Methodology, Resources, Software, Writing – original draft. YW: Conceptualization, Validation, Writing – review & editing. LJ: Conceptualization, Writing – review & editing, Funding acquisition, Project administration, Supervision. JT: Investigation, Resources, Validation, Visualization, Writing – original draft. ZL: Conceptualization, Validation, Writing – review & editing.
The author(s) declare financial support was received for the research, authorship, and/or publication of this article. This work is financially supported by the Korea Ministry of Land, Infrastructure and Transport (MOLIT) as “Innovative Talent Education Program for Smart City”, State Key Laboratory of Soil Erosion and Dryland Farming on the Loess Plateau (No. F2010121002-202413), the General Project of Hubei Social Science Fund (Grant number: HBSKJJ20233269, HBSK2022YB357, 2021211), and Programme de bourses d’excellence pour étudiants étrangers -Bourses postdoctorales Québec-Chine (Grant number: 322576).
Author JT was employed by the company Wuhan Yilin Environmental Engineering Co., Ltd. Author ZL was employed by the company Wuhan Forestry lnvestigation, Planning and Design Institute Co., Ltd.
The remaining authors declare that the research was conducted in the absence of any commercial or financial relationships that could be construed as a potential conflict of interest.
All claims expressed in this article are solely those of the authors and do not necessarily represent those of their affiliated organizations, or those of the publisher, the editors and the reviewers. Any product that may be evaluated in this article, or claim that may be made by its manufacturer, is not guaranteed or endorsed by the publisher.
Ang B. W. (2005). The LMDI approach to decomposition analysis: a practical guide. Energy Policy 33 (7), 867–871. doi: 10.1016/j.enpol.2003.10.010
Ang B. W., Liu N. (2006). A cross-country analysis of aggregate energy and carbon intensities. Energy Policy 34 (15), 2398–2404. doi: 10.1016/j.enpol.2005.04.007
Beale C. M., Lennon J. J., Yearsley J. M., Brewer M. J., Elston D. A. (2010). Regression analysis of spatial data. Ecol. Lett. 13 (2), 246–264. doi: 10.1111/j.1461-0248.2009.01422.x
Cai X., Zhu B., Zhang H., Li L., Xie M. (2020). Can direct environmental regulation promote green technology innovation in heavily polluting industries? Evidence from Chinese listed companies. Sci. Total Environ. 746, 140810. doi: 10.1016/j.scitotenv.2020.140810
Cheng J., Huang C., Gan X., Peng C., Deng L. (2023). Can forest carbon sequestration offset industrial CO2 emissions? A case study of Hubei Province, China. J. Cleaner Production 426, 139147. doi: 10.1016/j.jclepro.2023.139147
Faridzad A., Banouei A. A., Banouei J., Golestan Z. (2020). Identifying energy-intensive key sectors in Iran: Evidence from decomposed input-output multipliers. J. Cleaner Production 243, 118653. doi: 10.1016/j.jclepro.2019.118653
Haberl H., Wiedenhofer D., Virág D., Kalt G., Plank B., Brockway P., et al. (2020). A systematic review of the evidence on decoupling of GDP, resource use and GHG emissions, part II: synthesizing the insights. Environ. Res. Lett. 15 (6), 065003. doi: 10.1088/1748-9326/ab842a
Hou Q., Zhang X., Li B., Zhang X. Q., Wang W. H. (2019). Identification of low-carbon travel block based on GIS hotspot analysis using spatial distribution learning algorithm. Neural Computing Appl. 31 (9), 4703–4713. doi: 10.1007/s00521-018-3447-8
Huang C., Qin Y., Du X., He J., Fan X. (2022a). Ecosystem health and environmental geography in the belt and road regions. Int. J. Environ. Res. Public Health 19 (10), 5843. doi: 10.3390/ijerph19105843
Huang H., Roland-Holst D., Springer C., Lin J., Cai W., Wang C. (2019). Emissions trading systems and social equity: a CGE assessment for China. Appl. Energy 235, 1254–1265. doi: 10.1016/j.apenergy.2018.11.056
Huang C., Zhao D., Fan X., Liu C., Zhao G. (2022b). Landscape dynamics facilitated non-point source pollution control and regional water security of the Three Gorges Reservoir area, China. Environ. Impact Assess. Rev. 92, 106696. doi: 10.1016/j.eiar.2021.106696
Jackson R. B., Canadell J. G., Le Quéré C., Andrew R. M., Korsbakken J. I., Peters G. P., et al. (2016). Reaching peak emissions. Nat. Climate Change 6 (1), 7–10. doi: 10.1038/nclimate2892
Li T., Shi Z., Han D. (2021). Does renewable energy consumption contribute to the development of low-carbon economy? Evidence from China. Environ. Sci. pollut. Res. 28 (39), 54891–54908. doi: 10.1007/s11356-021-14468-3
Liu Z., Deng Z., He G., Wang H., Zhang X., Lin J., et al. (2022). Challenges and opportunities for carbon neutrality in China. Nat. Rev. Earth Environ. 3 (2), 141–155. doi: 10.1038/s43017-021-00244-x
Mardani A., Streimikiene D., Cavallaro F., Loganathan N., Khoshnoudi M. (2019). Carbon dioxide (CO2) emissions and economic growth: A systematic review of two decades of research from 1995 to 2017. Sci. Total Environ. 649, 31–49. doi: 10.1016/j.scitotenv.2018.08.229
Marzeion B., Kaser G., Maussion F., Champollion N. (2018). Limited influence of climate change mitigation on short-term glacier mass loss. Nat. Climate Change 8 (4), 305–308. doi: 10.1038/s41558-018-0093-1
Mattingly K. S., Turton J. V., Wille J. D., Noël B., Fettweis X., Rennermalm Å.K., et al. (2023). Increasing extreme melt in northeast Greenland linked to foehn winds and atmospheric rivers. Nat. Commun. 14 (1), 1743. doi: 10.1038/s41467-023-37434-8
Paltsev S., Morris J., Kheshgi H., Herzog H. (2021). Hard-to-Abate Sectors: The role of industrial carbon capture and storage (CCS) in emission mitigation. Appl. Energy 300, 117322. doi: 10.1016/j.apenergy.2021.117322
Pettorelli N., Graham N. A., Seddon N., Maria da Cunha Bustamante M., Lowton M. J., Sutherland W. J., et al. (2021). Time to integrate global climate change and biodiversity science-policy agendas. J. Appl. Ecol. 58 (11), 2384–2393. doi: 10.1111/1365-2664.13985
Qian X., Wang D., Wang J., Chen S. (2021). Resource curse, environmental regulation and transformation of coal-mining cities in China. Resour. Policy 74, 101447. doi: 10.1016/j.resourpol.2019.101447
Ramachandra T. V., Shwetmala (2012). Decentralised carbon footprint analysis for opting climate change mitigation strategies in India. Renewable Sustain. Energy Rev. 16 (8), 5820–5833. doi: 10.1016/j.rser.2012.05.035
Rehman A., Ma H., Ozturk I., Ulucak R. (2022). Sustainable development and pollution: The effects of CO 2 emission on population growth, food production, economic development, and energy consumption in Pakistan. Environ. Sci. Pollut. Res. 29, 17319–17330. doi: 10.1007/s11356-021-16998-2
Tan H., Li J., He M., Li J., Zhi D., Qin F., et al. (2021). Global evolution of research on green energy and environmental technologies: A bibliometric study. J. Environ. Manage. 297, 113382. doi: 10.1016/j.jenvman.2021.113382
Tang J. R., Zhang B. Y., Wang Y. H. (2011). Study on the drivers of carbon emissions in China based on LMDI. Stat Inf. Forum 26 (11), 19–25. doi: 10.3969/j.issn.1007-3116.2011.11.004
Tian X., Bai F., Jia J., Liu Y., Shi F. (2019). Realizing low-carbon development in a developing and industrializing region: Impacts of industrial structure change on CO2 emissions in southwest China. J. Environ. Manage. 233, 728–738. doi: 10.1016/j.jenvman.2018.11.078
Tong G. Y. (2021). Construction of smart energy system based on dual carbon goal. Smart Power 49 (05), 1–6. doi: 10.3969/j.issn.1673-7598.2021.05.002
Wang Z., Li S., Jin Z., Li Z., Liu Q., Zhang K. (2023). Oil and gas pathway to net-zero: Review and outlook. Energy Strategy Rev. 45, 101048. doi: 10.1016/j.esr.2022.101048
Wang F., Wu L. H., Yang C. (2010). Driving factors for growth of carbon dioxide emissions during economic development in China. Economic Res. 45 (02), 123–136. doi: CNKI:SUN:JJYJ.0.2010-02-011
Wang Y., Zhao T., Wang J., Guo F., Kan X., Yuan R. (2019). Spatial analysis on carbon emission abatement capacity at provincial level in China from 1997 to 2014: An empirical study based on SDM model. Atmospheric pollut. Res. 10 (1), 97–104. doi: 10.1016/j.apr.2018.06.003
Xu B., Chen Y. F., Shen X. B. (2019). Clean energy development, carbon dioxide emission reduction and regional economic growth. Economic Res. 54 (07), 188–202.
Yang W., Zhao R., Chuai X., Xiao L., Cao L., Zhang Z., et al. (2019). China's pathway to a low carbon economy. Carbon balance Manage. 14, 1–12. doi: 10.1186/s13021-019-0130-z
Zhang W., Tang X., Yang G., Zha D. (2020). Decomposition of CO2 emission intensity in Chinese MIs through a development mode extended LMDI method combined with a production-theoretical approach. Sci. Total Environ. 702, 134787. doi: 10.1016/j.scitotenv.2019.134787
Zhang W., You J., Lin W. (2021). Internet plus and China industrial system's low-carbon development. Renewable Sustain. Energy Rev. 151, 111499. doi: 10.1016/j.rser.2021.111499
Zheng J., Shao X., Liu W., Kong J., Zuo G. (2021). The impact of the pilot program on industrial structure upgrading in low-carbon cities. J. Cleaner Production 290, 125868. doi: 10.1016/j.jclepro.2021.125868
Zhou D. (2015). China submits enhanced actions on climate change: china’s intended nationally determined contributions. Sino-Global Energy 20 (08), 17. doi: CNKI:SUN:SYZW.0.2015-08-007
Keywords: climate change, carbon emission, LMDI model, hotspot analysis, low carbon economy
Citation: Huang C, Gan X, Wan Y, Jin L, Teng J and Li Z (2024) China contributed to low-carbon development: carbon emission increased but carbon intensity decreased. Front. Ecol. Evol. 12:1338742. doi: 10.3389/fevo.2024.1338742
Received: 15 November 2023; Accepted: 10 January 2024;
Published: 20 February 2024.
Edited by:
Nir Krakauer, City College of New York (CUNY), United StatesReviewed by:
Zelin Liu, Hunan Normal University, ChinaCopyright © 2024 Huang, Gan, Wan, Jin, Teng and Li. This is an open-access article distributed under the terms of the Creative Commons Attribution License (CC BY). The use, distribution or reproduction in other forums is permitted, provided the original author(s) and the copyright owner(s) are credited and that the original publication in this journal is cited, in accordance with accepted academic practice. No use, distribution or reproduction is permitted which does not comply with these terms.
*Correspondence: Lin Jin, amlubGluNzc3MDcwQGdtYWlsLmNvbQ==
Disclaimer: All claims expressed in this article are solely those of the authors and do not necessarily represent those of their affiliated organizations, or those of the publisher, the editors and the reviewers. Any product that may be evaluated in this article or claim that may be made by its manufacturer is not guaranteed or endorsed by the publisher.
Research integrity at Frontiers
Learn more about the work of our research integrity team to safeguard the quality of each article we publish.