 Jiangying Wei
 Ridong Hu
 Yanhua Li
 Yang Shen
- 1Institute of Quantitative Economics, Huaqiao University, Xiamen, China
- 2School of Economics, Xiamen University, Xiamen, China
Objective: This study recalculates the carbon emissions of urban and rural residents in China, analyzing the dynamic evolution trends of urban and rural carbon emissions. It explores the spatial spillover effects centered around the inequality in carbon emissions between urban and rural areas.
Methods: The study calculates the carbon emissions of urban and rural residents in each province based on the IPCC method. Non-parametric kernel density estimation is employed to depict the dynamic evolution characteristics of national, urban, and rural carbon emissions. The Theil Index is used to measure the disparities in urban and rural carbon emissions in major strategic regions, further applying the Theil Index to evaluate the inequality of urban and rural carbon emissions across provinces. This helps identify the driving factors affecting the inequality of urban and rural carbon emissions and their spatio-temporal effects.
Finding: Carbon emissions from urban and rural residents in China present a divergent development pattern. Urban emissions have increased, with inter-provincial disparities widening; rural emissions tend to stabilize, with slight growth in inter-provincial gaps. The overall inequality of carbon emissions in various regions of China experiences a three-phase journey of rise, decline, and stabilization. Urban inequality first increases then decreases, while rural inequality gradually lessens, showing clear regional and urban-rural differences. Market and government factors significantly impact the inequality of urban and rural carbon emissions. The development of the digital economy aids in reducing inequality and generates significant spatial spillover effects. The relationship between economic development level and carbon emission inequality is U-shaped. Industrial structure optimization can reduce urban-rural inequality, but its spatial spillover effect is not significant. Government intervention has limited effects, while environmental regulations may increase inequality. Opening up to the outside world helps reduce inequality, and the impact of population density is complex.
1 Introduction
Over the past few decades, global warming has escalated into a severe worldwide issue, exerting profound impacts on the environment, economy, and society (Shen et al., 2023; Liu et al., 2024). Since the 1980s, the trend of global warming has notably accelerated, leading to consequences including glacier melting, rising sea levels, increased frequency of extreme weather events, and significant biodiversity loss (Hansen et al., 2010; Hu, 2023). According to the World Meteorological Organization, the global average temperature in 2022 was approximately 1.15°C higher than pre-industrial levels. A report from NASA stated that the global mean surface temperature in 2022 equaled that of 2015, making it the fifth hottest year on record, with temperatures about 1.11°C above the late 19th century average. Early research had not universally accepted the greenhouse effect as the primary cause of global warming. However, further studies have led the academic community to widely recognize that the substantial emissions of greenhouse gases, such as carbon dioxide and methane, are key contributors to global warming (Liu and Li, 2014; Wu et al., 2023; Ielpi et al., 2023). To address this global challenge, the international community has undertaken various initiatives, including the signing of the United Nations Framework Convention on Climate Change, the Kyoto Protocol, and the Paris Agreement, aimed at limiting greenhouse gas emissions through global cooperation.
Despite these international agreements and efforts, global greenhouse gas emissions continue to rise, particularly in rapidly developing countries (Chien et al., 2023; Du et al., 2023; Jahanger et al., 2023). According to estimates by the International Energy Agency, global energy-related greenhouse gas emissions reached a record high of 41.3 billion tons of carbon dioxide equivalent in 2022. Of this total, carbon dioxide emissions from energy combustion and industrial processes accounted for 89% of energy-related greenhouse gas emissions. These increasing trends are evident not only on a global scale but also at regional and local levels. In China, one of the world’s largest greenhouse gas emitters, there is a significant disparity in carbon emissions between urban and rural areas (Luo et al., 2023; Xu C., 2023; Guo et al., 2023). This inequality reflects China’s economic development and urbanization process and impacts global strategies for addressing climate change.
The key to achieving the “dual carbon” goals lies in emission reduction and carbon sequestration, with the former being fundamental (Hu et al., 2023; Li et al., 2022; Shen et al., 2023). In China, significant disparities exist between urban and rural areas in terms of economic growth, resource allocation, and infrastructure development. These disparities are also reflected in the consumption patterns of residents, with structural differences between urban and rural areas being particularly pronounced. As urbanization progresses and the level of consumer spending increases, the lifestyles of urban and rural residents in China have undergone substantial changes, leading to increased demand for energy consumption. To effectively reduce carbon emissions caused by consumer consumption and promote a transition to low-carbon consumption, a comprehensive analysis of carbon emissions from Chinese residents’ consumption is imperative (Liu et al., 2024; Qi et al., 2022). This involves understanding the current level of carbon emissions from urban and rural resident consumption, the degree of inequality in these emissions, and investigating the factors that influence this inequality. Developing targeted strategies to address these issues is crucial not only for promoting low-carbon consumption behaviors among urban and rural residents but also for further exploring the ecological value of urban and rural areas.
In this context, this paper investigates the carbon emissions from consumption activities of urban and rural residents in China, distinguished by these two dimensions. Firstly, the CO2 emissions from direct energy consumption of urban and rural households at the provincial level are measured using the IPCC carbon emission calculation method. Secondly, the dynamic evolution characteristics of carbon emissions from urban and rural residents are explored using the kernel density estimation method. Thirdly, the regional differences in carbon emissions between urban and rural areas across China’s eight major regions are studied using the Theil Index, and the degree of inequality in carbon emissions among urban and rural residents is quantified. Finally, key factors influencing the degree of inequality in carbon emissions between urban and rural residents in China are analyzed based on provincial-level panel data, and the potential spatial spillover effects are discussed.
2 Literature review
Due to the absence of authoritative official agencies directly publishing carbon dioxide emission data in China, initiating research on carbon emission intensity necessitates the verification and calculation of carbon emission The measurement of carbon emissions in urban and rural areas primarily encompasses chemical mass balance and inventory methods, eddy covariance and micrometeorological methods, as well as remote sensing and geospatial technologies. In the realm of chemical mass balance and inventory methods, Blanchard et al. (2013) utilized the chemical mass balance method and the U.S. EPA’s National Emission Inventory to identify emission sources of particulates and gases in urban and rural areas. Heinonen and Junnila (2011) explored a consumption-based approach, linking the climate effects of urban-level development with global emission production. Björkegren and Grimmond (2018) assessed urban carbon emission using an inventory approach, summarizing all known CO2 emissions and sequestrations within a specific area. In terms of eddy covariance and micrometeorological methods, Christen et al. (2011) validated urban neighborhood carbon emission models using direct eddy-covariance flux measurements. Ueyama and Ando (2016) employed continuous CO2 flux measurements with the eddy covariance method to evaluate urban area carbon emissions. Crawford and Christen (2015) discussed the challenges of eddy covariance CO2 flux measurements in urban areas and proposed solutions. Regarding remote sensing and geospatial technologies, Soegaard and Møller-Jensen (2003) used texture classification of Landsat-TM satellite images as a proxy for CO2 emissions from urban land use and activities. Dietrich et al. (2021) introduced the Munich Urban Carbon Column Network (MUCCnet), which uses differential column measurements (DCMs) for greenhouse gas measurement, suitable for quantifying urban greenhouse gas emissions.
Accurately accounting for carbon dioxide emissions enables research into the current characteristics and influencing factors of carbon emission inequality. At the global and national levels, Padilla and Serrano (2006) highlighted the carbon emission inequality among countries due to differences in per capita income, revealing a slight decrease in carbon emission inequality from 1971 to 1999. The study by Sarkodie et al. (2020) extended to the impact of urban expansion, industrialization, trade, and economic development on global emissions, covering multiple scales from national to household levels. At the regional and urban agglomeration levels, Zhang et al. (2021) focused on the spatial carbon inequality in China’s Yangtze River Economic Belt, finding that this inequality was primarily driven by economic factors, industrial structures, and final demand structures. The research by Chen et al. (2019) observed a downward trend in the per capita industrial carbon emissions inequality within the Pearl River Delta urban agglomeration, with industrial energy intensity being a major contributing factor. Regarding the relationship between income inequality and carbon emissions, Liu et al. (2019) found that higher income inequality in the United States increased carbon emissions in the short term, but led to carbon emission reduction in the long term. Wu and Xie (2020) noted that higher income inequality in OECD countries and high-income non-OECD countries led to a reduction in emissions, but its impact was not significant in low-income non-OECD countries. The study by Belaïd et al. (2020) discovered that greater income inequality led to environmental degradation, thereby negatively impacting carbon emissions. Hailemariam et al. (2020) also pointed out that an increase in top-level income inequality was positively correlated with carbon emissions. In terms of spatial spillover effects, Sun and Sun (2020) found positive spatial correlation in carbon emissions among Chinese provinces, with population and economic urbanization being the main factors directly affecting regional carbon emission levels. Xu X. (2023) observed significant spatial spillover effects in carbon emissions, particularly in Western China compared to the Eastern and Central regions. Liu and Liu (2019) indicated that urbanization, technology, wealth, and population levels had different spatial interaction effects on carbon emissions in various regions of China.
Existing literature suggests that while research on carbon emission intensity has been increasing annually, there remains substantial room for expansion in this field. First, research on carbon emissions has mainly focused on the industrial sector, with limited studies addressing household sector emissions from domestic energy consumption. However, with advancing urbanization and improved living standards in urban and rural areas, emissions from domestic energy consumption cannot be overlooked. Second, studies on carbon emissions from household energy consumption have been primarily concentrated in specific regions or rural households. There is a need for more in-depth research on urban and rural households in China under a unified measurement method and analytical framework. Third, there is a lack of systematic and comprehensive analysis of the current state and characteristics of urban and rural carbon emissions in China, with few scholars analyzing the spatial spillover effects of factors influencing the inequality of carbon emissions among urban and rural residents.
3 Research methodology and data sources
3.1 Research methodology
3.1.1 Urban and rural residents’ carbon emission calculation
The Intergovernmental Panel on Climate Change (IPCC) introduced a methodology and guiding principles for measuring carbon emissions in 2006, designed for estimating and reporting greenhouse gas emissions. The IPCC approach focuses on estimating emissions from three primary sources: the combustion of fossil fuels, industrial processes and product usage, and agricultural activities (Cheng et al., 2013; Chen and Li, 2023). Carbon emission is calculated as follows:
In Equation 1, i represents the category of consumed energy, where the final energy consumption is denoted by E, and NCV refers to the average lower heating value of the energy. CEF stands for the carbon emission factor per unit of heating value. COF is the carbon oxidation factor. Additionally, 44 and 12 are the molecular weights of carbon dioxide and carbon, respectively.
3.1.2 Kernel density analysis method
The kernel density estimation method is an efficient non-parametric statistical technique aimed at estimating the probability density function of a random variable. This method involves applying a smooth kernel function around data points to generate a continuous density estimate, thereby revealing the distribution characteristics of the data. The application of the kernel density analysis method is instrumental in clarifying the dynamic evolution trends of carbon emissions at the national, urban, and rural levels. It unveils the distribution and changing trends of carbon emission data across different geographical areas without the need for any presupposed assumptions about the data’s distribution (Zhang et al., 2022). This approach enables a more detailed and intuitive representation of the spatial distribution and temporal evolution of carbon emissions, providing policymakers and researchers with a more accurate tool to identify and evaluate the effectiveness and differences in carbon emission reduction strategies among various regions. Additionally, the kernel density analysis method has unique advantages in revealing the multimodality and skewness of emission data, which is crucial for understanding complex emission patterns. The formula for this method is as follows:
In Equation 2, f(x) represents the estimated density at point x. n denotes the number of observational samples, while xi refers to an individual sample point. The bandwidth, h (where h>0), determines the width of the kernel function. K(·) symbolizes the kernel density, a non-negative function that integrates to one and is used to smooth the data around each data point.
The key to kernel density estimation lies in the selection of the kernel function and the determination of the bandwidth h. Common choices for the kernel function include the Gaussian kernel, uniform kernel, triangular kernel, among others. The selection of the bandwidth significantly impacts the smoothness of the estimated density. The optimal expression for h is shown in Equation 3:
In this paper, building upon the foundation laid by Tian and Yin (2021), the Gaussian kernel is selected as the kernel function. Its function expression is shown in Equation 4:
3.1.3 Spatial econometric analysis
(1) Global Spatial Autocorrelation. To better delineate the spatial autocorrelation of urban-rural carbon emission inequality and its influencing factors, this paper employs the Global Moran’s Index for measurement. The calculation formula is as follows:
In Equation 5, n represents the total number of observation points, while xi and xj denote the observed values at locations i and j, respectively. is the mean of all observed values. The spatial weight between locations i and j, denoted as wij, reflects the spatial relationship between these two locations. The value range of the Global Moran’s Index typically lies between -1 and +1, where +1 indicates perfect positive correlation, -1 denotes perfect negative correlation, and 0 represents a random distribution.
In the study of urban and rural carbon emissions and their influencing factors, the Global Moran’s Index is utilized to quantify spatial autocorrelation. It aids in identifying the presence of spatial clustering of carbon emissions and how these clusters vary with geographical location. This provides a spatial analytical perspective for understanding and addressing urban and rural carbon emission issues.
(2) Spatial Durbin Model: This paper employs the Spatial Durbin Model (SDM) based on spatio-temporal dimensions to investigate the impact of various factors on urban-rural carbon emission inequality and to examine their respective spatial spillover effects. The SDM not only considers the spatial lag effects of the dependent variable but also accounts for the spatial lag effects of the explanatory variables. This enables the SDM to capture spatial dependencies and the spillover effects of explanatory variables, thereby offering a more comprehensive analysis of spatial correlations (Han and Yang, 2020). The basic formula is shown in Equation 6:
In the Spatial Durbin Model (SDM), W represents the spatial weight matrix. In subsequent analyses, besides utilizing the geographic distance spatial weight matrix for baseline analysis, this paper also introduces the contiguity spatial weight matrix and the inverse distance spatial weight matrix for robustness checks to mitigate potential errors in the spatial weight matrix setting (Tian and Yin, 2021; Yuan et al., 2019). ρ is the spatial autoregressive coefficient, indicating the degree of spatial dependency of the dependent variable. β and γ are coefficient vectors, representing the coefficients of direct effects and spatial spillover effects, respectively. μi and ξt denote regional and temporal fixed effects, while εit is the random error term.
Urban-rural carbon emission inequality (URC) serves as the dependent variable Y, with the explanatory variables X encompassing aspects of both market and government factors (Zhou and Jiang, 2020; Guo and Zhang, 2023; Zeng et al., 2023). Firstly, market-level factors include the digital economy (DT), level of economic development (AGDP), and industrial structure (IS). Currently, the measurement of the digital economy is based on the provincial digital economy evaluation index system in China, constructed from three dimensions: information development, internet development, and digital transaction development, following Liu et al. (2020). The level of economic development is represented by the per capita GDP index, price-adjusted, and to examine the potential nonlinear relationship between economic development level and urban-rural carbon emission inequality, a quadratic term of the economic development level (AGDP2) is included as an explanatory variable. The industrial structure is represented by the ratio of the tertiary industry output to the secondary industry output; industrial agglomeration is defined as the number of employed persons per unit administrative area.
Secondly, government-level factors include environmental regulation (ER) and the degree of government intervention (GI). Environmental regulation (ER) is measured by the ratio of industrial pollution control investment to industrial added value; the degree of government intervention (GI) is calculated as fiscal expenditure relative to regional GDP. Additionally, the degree of openness to the outside world (FI) and population density (PP) are included. Foreign direct investment (FI) is determined by the total value of imports and exports multiplied by the USD to RMB exchange rate, divided by regional GDP, while population density (PP) is the total population of the region divided by its administrative area.
3.2 Data sources and processing
The data on urban and rural carbon emissions, encompassing various types of energy consumption, were derived from the “China Energy Statistical Yearbook.” Other influencing factor variables primarily originated from the “China Finance Yearbook,” the “China Fixed Asset Investment Statistical Yearbook,” and the statistical yearbooks or bulletins of individual provinces. Missing data were addressed using methods such as linear interpolation and mean imputation. Descriptive statistics for each variable are presented in Table 1, as shown.

Table 1 Descriptive statistics.
4 Dynamic evolution of urban-rural carbon emissions
This paper, in addition to examining the overall national situation, also delves into separate discussions of urban and rural carbon emissions. The kernel density analysis results of the dynamic evolution of national, urban, and rural carbon emissions are illustrated in Figure 1.
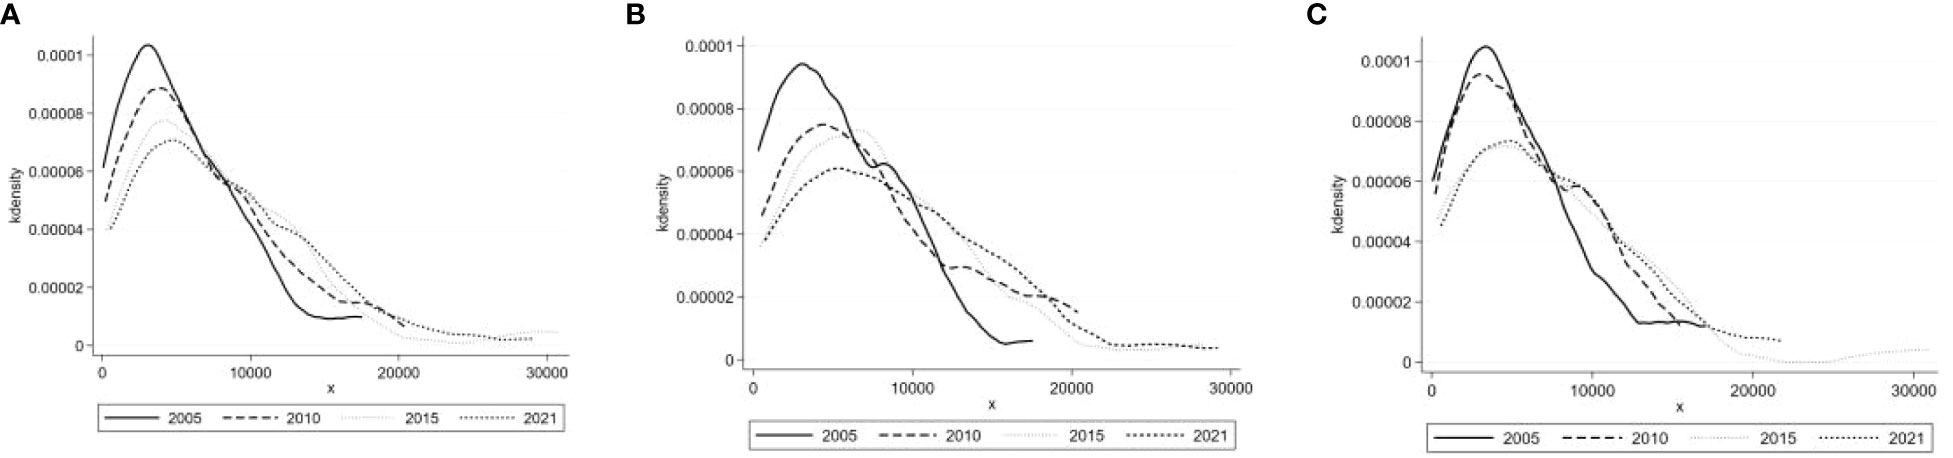
Figure 1 Kernel density analysis results of carbon emissions in national, urban, and rural areas. (A) National; (B) Urban; (C) Rural.
Figure 1A depicts the overall evolution of national residential carbon emissions during the study period. Overall, the center of the density function shifts from left to right, with the peak in 2021 being higher than in 2005, evolving from a more concentrated unimodal pattern to a broader distribution with an expanded range. Initially, compared to 2005, the peak of the curve in 2010 slightly decreases, but the center of the density function moves rightward, expanding the range. This indicates an overall increase in national residential carbon emissions during this phase, with an increase in emission variability. Subsequently, compared to 2010, the center of the density function in 2015 continues to move rightward, the peak becomes flatter, and the range further expands, revealing a continued growth in the average emissions and an increase in variability among individuals. Furthermore, compared to 2015, the density function in 2021 remains in a higher emission range, with a relatively lower peak and continued widening of the distribution. This suggests that although the proportion of residents with high emissions has decreased, the overall emissions and variability among individuals are still increasing. Finally, compared to 2005, the center of the density function in 2021 shifts significantly rightward, with a notably expanded range, indicating a clear increase in the average carbon emissions of national residents and a widening provincial gap during the study period. The likely explanation is the changes in energy consumption patterns among residents across provinces, influenced by economic development and improved living standards, which in turn affect lifestyles and carbon emission intensity, thereby exacerbating provincial disparities in emissions.
Figure 1B overall portrays the evolution of urban residential carbon emissions during the study period. In general, the center of the density function moves rightward, the peak experiences fluctuations but ultimately remains relatively unchanged, and the range expands. Initially, compared to 2005, the 2010 curve shows little change in shape, but the center of the density function moves rightward with a slightly lower peak, and the range expands. This indicates an increase in urban residential carbon emission intensity and a widening provincial gap during this phase. Subsequently, compared to 2010, the peak in 2015 evolves from a unimodal to a smoother shape, and the range further expands, revealing continued growth in urban residential carbon emission intensity and an ongoing expansion of the provincial gap. Finally, compared to 2005, the center of the density function in 2021 shifts significantly rightward, with a lower main peak, a significantly expanded range, and a display of multimodality. This indicates an increase in the average carbon emissions of urban residents and a significant widening of the provincial gap during the study period.
Figure 1C overall depicts the dynamic evolution trend of rural residential carbon emissions. In general, the center of the density function slightly moves rightward, the peak fluctuates and is slightly lower in 2021 compared to 2005, and the range expands. Initially, compared to 2005, the center of the density function in 2010 shifts slightly rightward, the peak slightly decreases, and the range expands. This suggests a slight increase in rural residential carbon emission intensity during this phase, with no evident reduction in the provincial gap. Subsequently, compared to 2010, the center of the density function in 2015 further shifts rightward, the peak slightly decreases and becomes smoother, and the range continues to expand, indicating a continued slight increase in rural residential carbon emission intensity and a possible expansion of the provincial gap. Again, compared to 2015, the center of the density function in 2021 shows little change, the peak further decreases and becomes smoother, displaying a certain multimodal tendency, and the range maintains an increasing trend. This implies that the average level of rural residential carbon emission intensity might have slightly decreased or stabilized during this phase, with the provincial gap remaining or slightly increasing. Lastly, compared to 2005, the center of the density function in 2021 overall remains unchanged, the peak decreases, and the range expands, showing a certain multimodality. This suggests that the average level of rural residential carbon emission intensity remains relatively stable during the study period, but the provincial gap might have increased.
5 Regional disparities in urban-rural carbon emission inequality
Regarding the overall carbon emissions as illustrated in Figure 2, the national Theil Index demonstrated a fluctuating trend, decreasing from 0.1056 in 2005 to 0.0598 in 2021. This trend signifies a gradual narrowing of the variance in carbon emission intensity across the country over time. Regionally, a notable increase in the Theil Index was observed in the Northeast, escalating from 0.0099 in 2005 to 0.0621 in 2021, indicating a rise in the imbalance of carbon emission intensity within the area. Conversely, coastal regions such as the Northeastern Coastal, Northern Coastal, and Southern Coastal areas exhibited relatively stable Theil Index trends. While the Northwest and Southwest regions experienced some fluctuations, their overall trends remained stable. On the other hand, the Theil Index for the Yangtze River Midstream and Yellow River Midstream regions showed more significant variations, particularly in the Yellow River Midstream region where the index increased from 0.0757 in 2005 to 0.0854 in 2021, suggesting that the disparity in carbon emission intensity in these areas is widening.
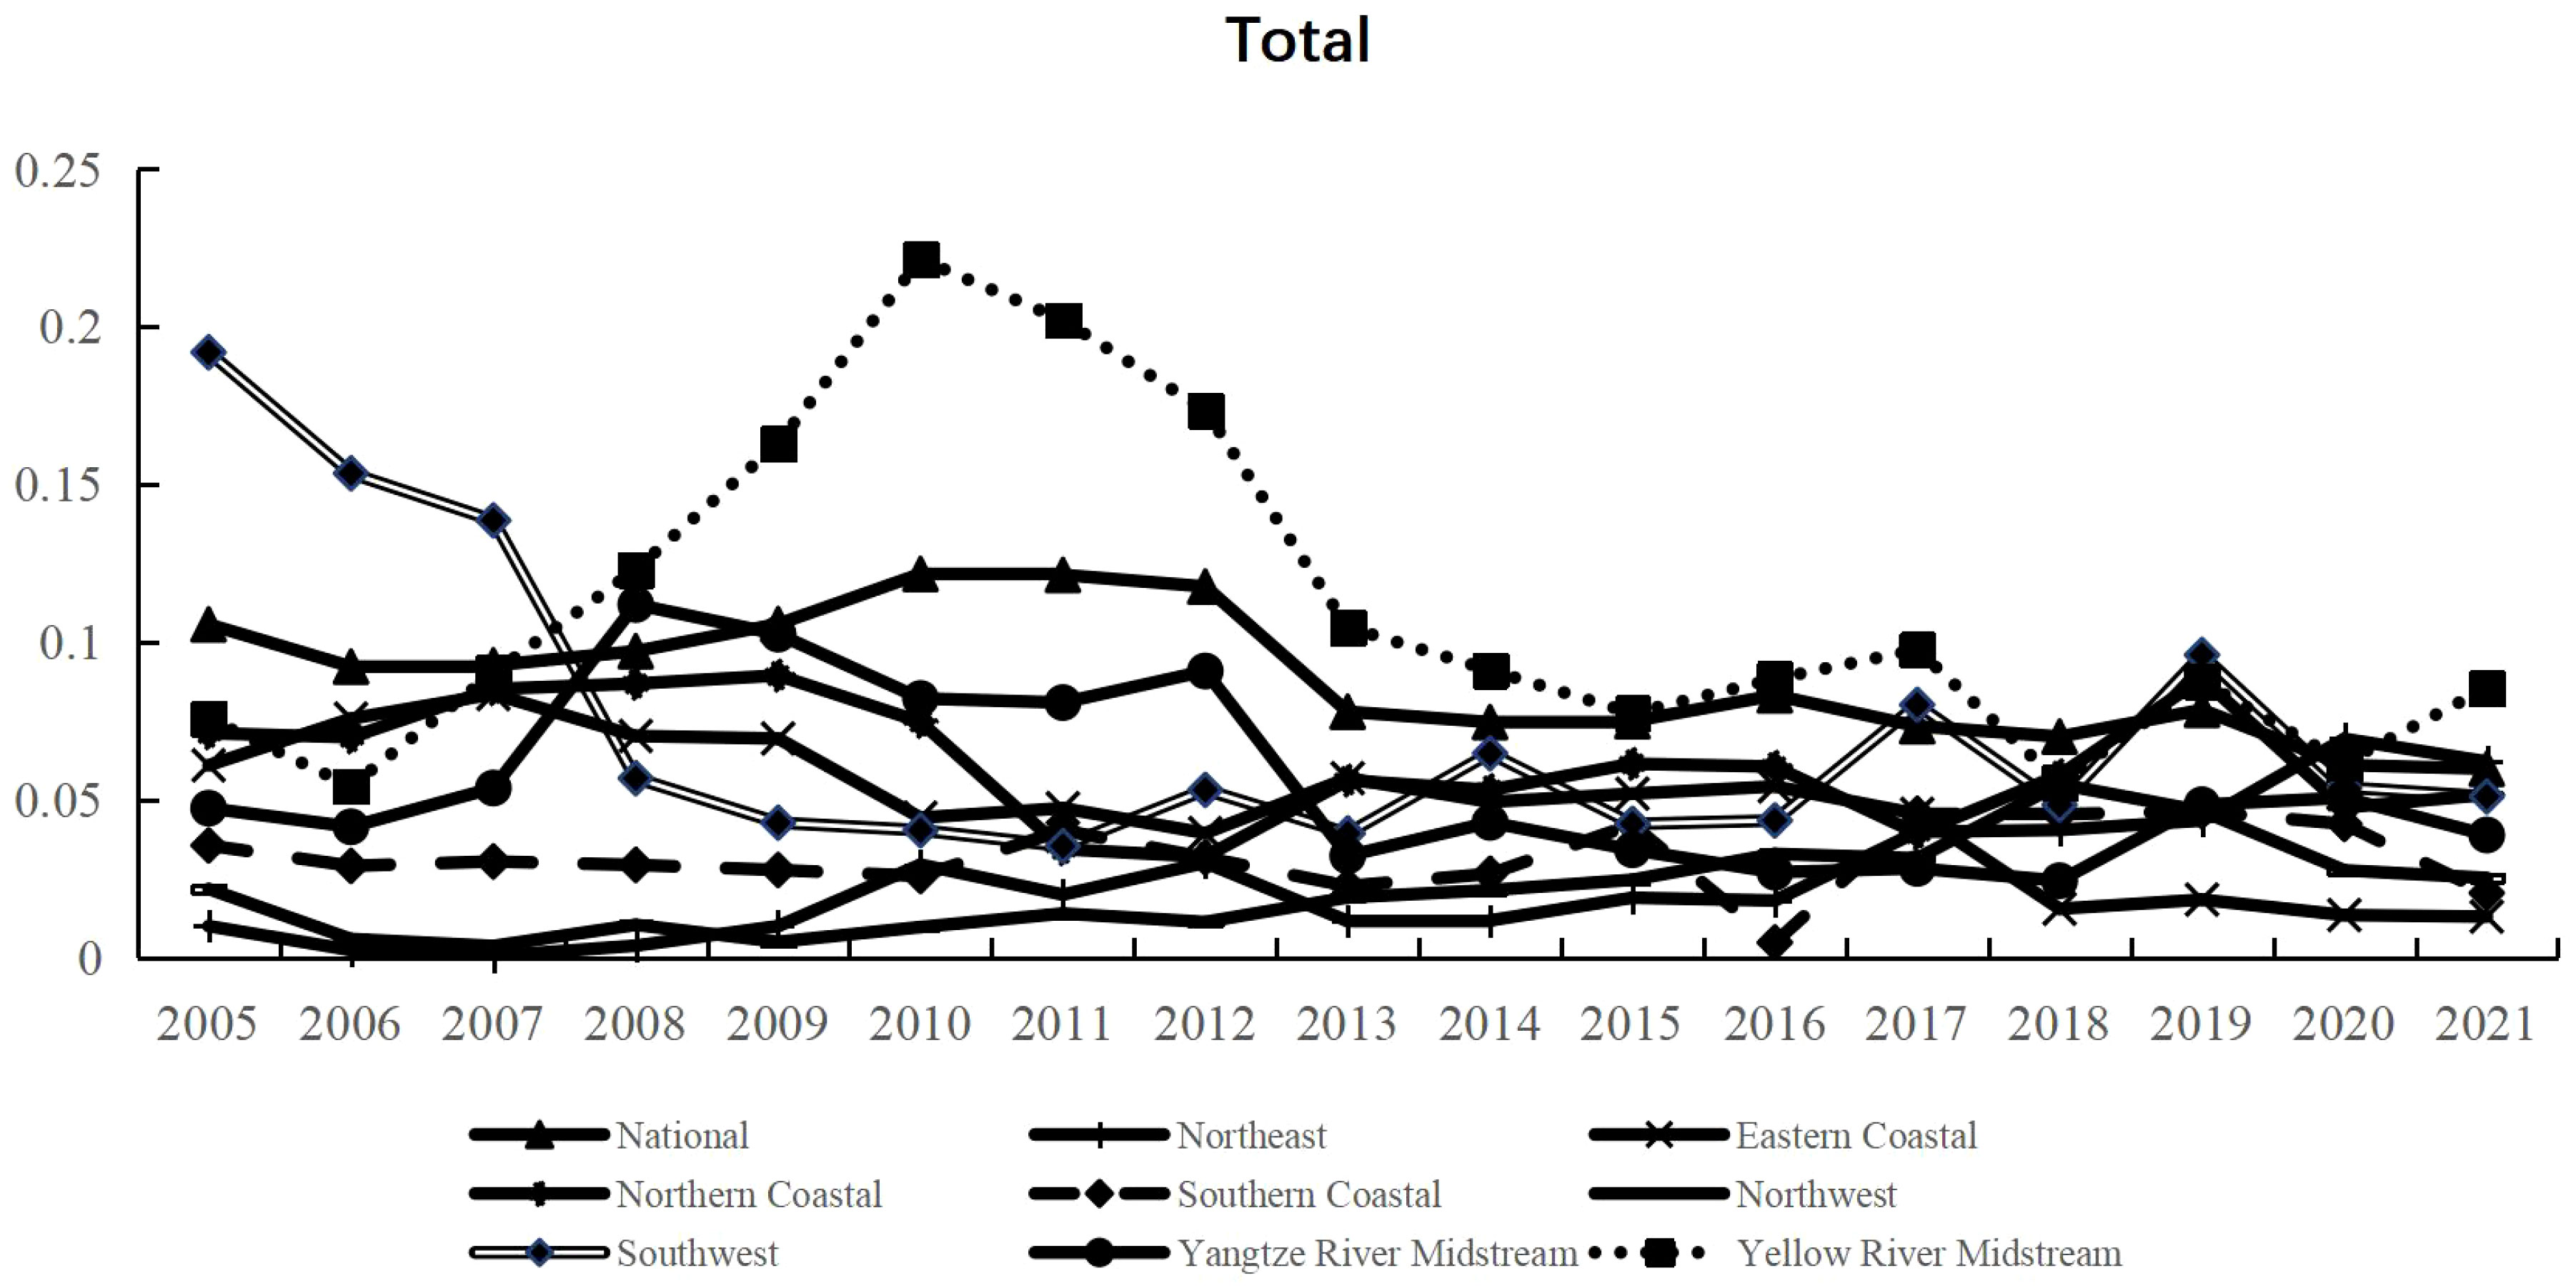
Figure 2 Dynamic trends in the overall distribution of carbon emissions in China.
In terms of urban carbon emissions, as shown in Figure 3, the national Theil Index decreased from 0.177 in 2005 to 0.1124 in 2021, indicating a reduction in the variance of urban carbon emission intensity across the country. The Theil Index for the Northeast region increased significantly from 0.0007 in 2005 to 0.1214 in 2021, reflecting a rise in the imbalance of urban carbon emission intensity in this area. Coastal regions such as the Northeastern Coastal, Northern Coastal, and Southern Coastal areas showed minor fluctuations in their Theil Index, indicating relatively stable differences in carbon emission intensity. The Northwest and Southwest regions also exhibited some variability, but without significant overall changes. The Yangtze River Midstream and Yellow River Midstream regions experienced more notable changes in their Theil Index, especially in the Yellow River Midstream area, where the index was significantly higher than other regions during 2008 to 2011, suggesting an increasing disparity in urban carbon emission intensity in these areas.
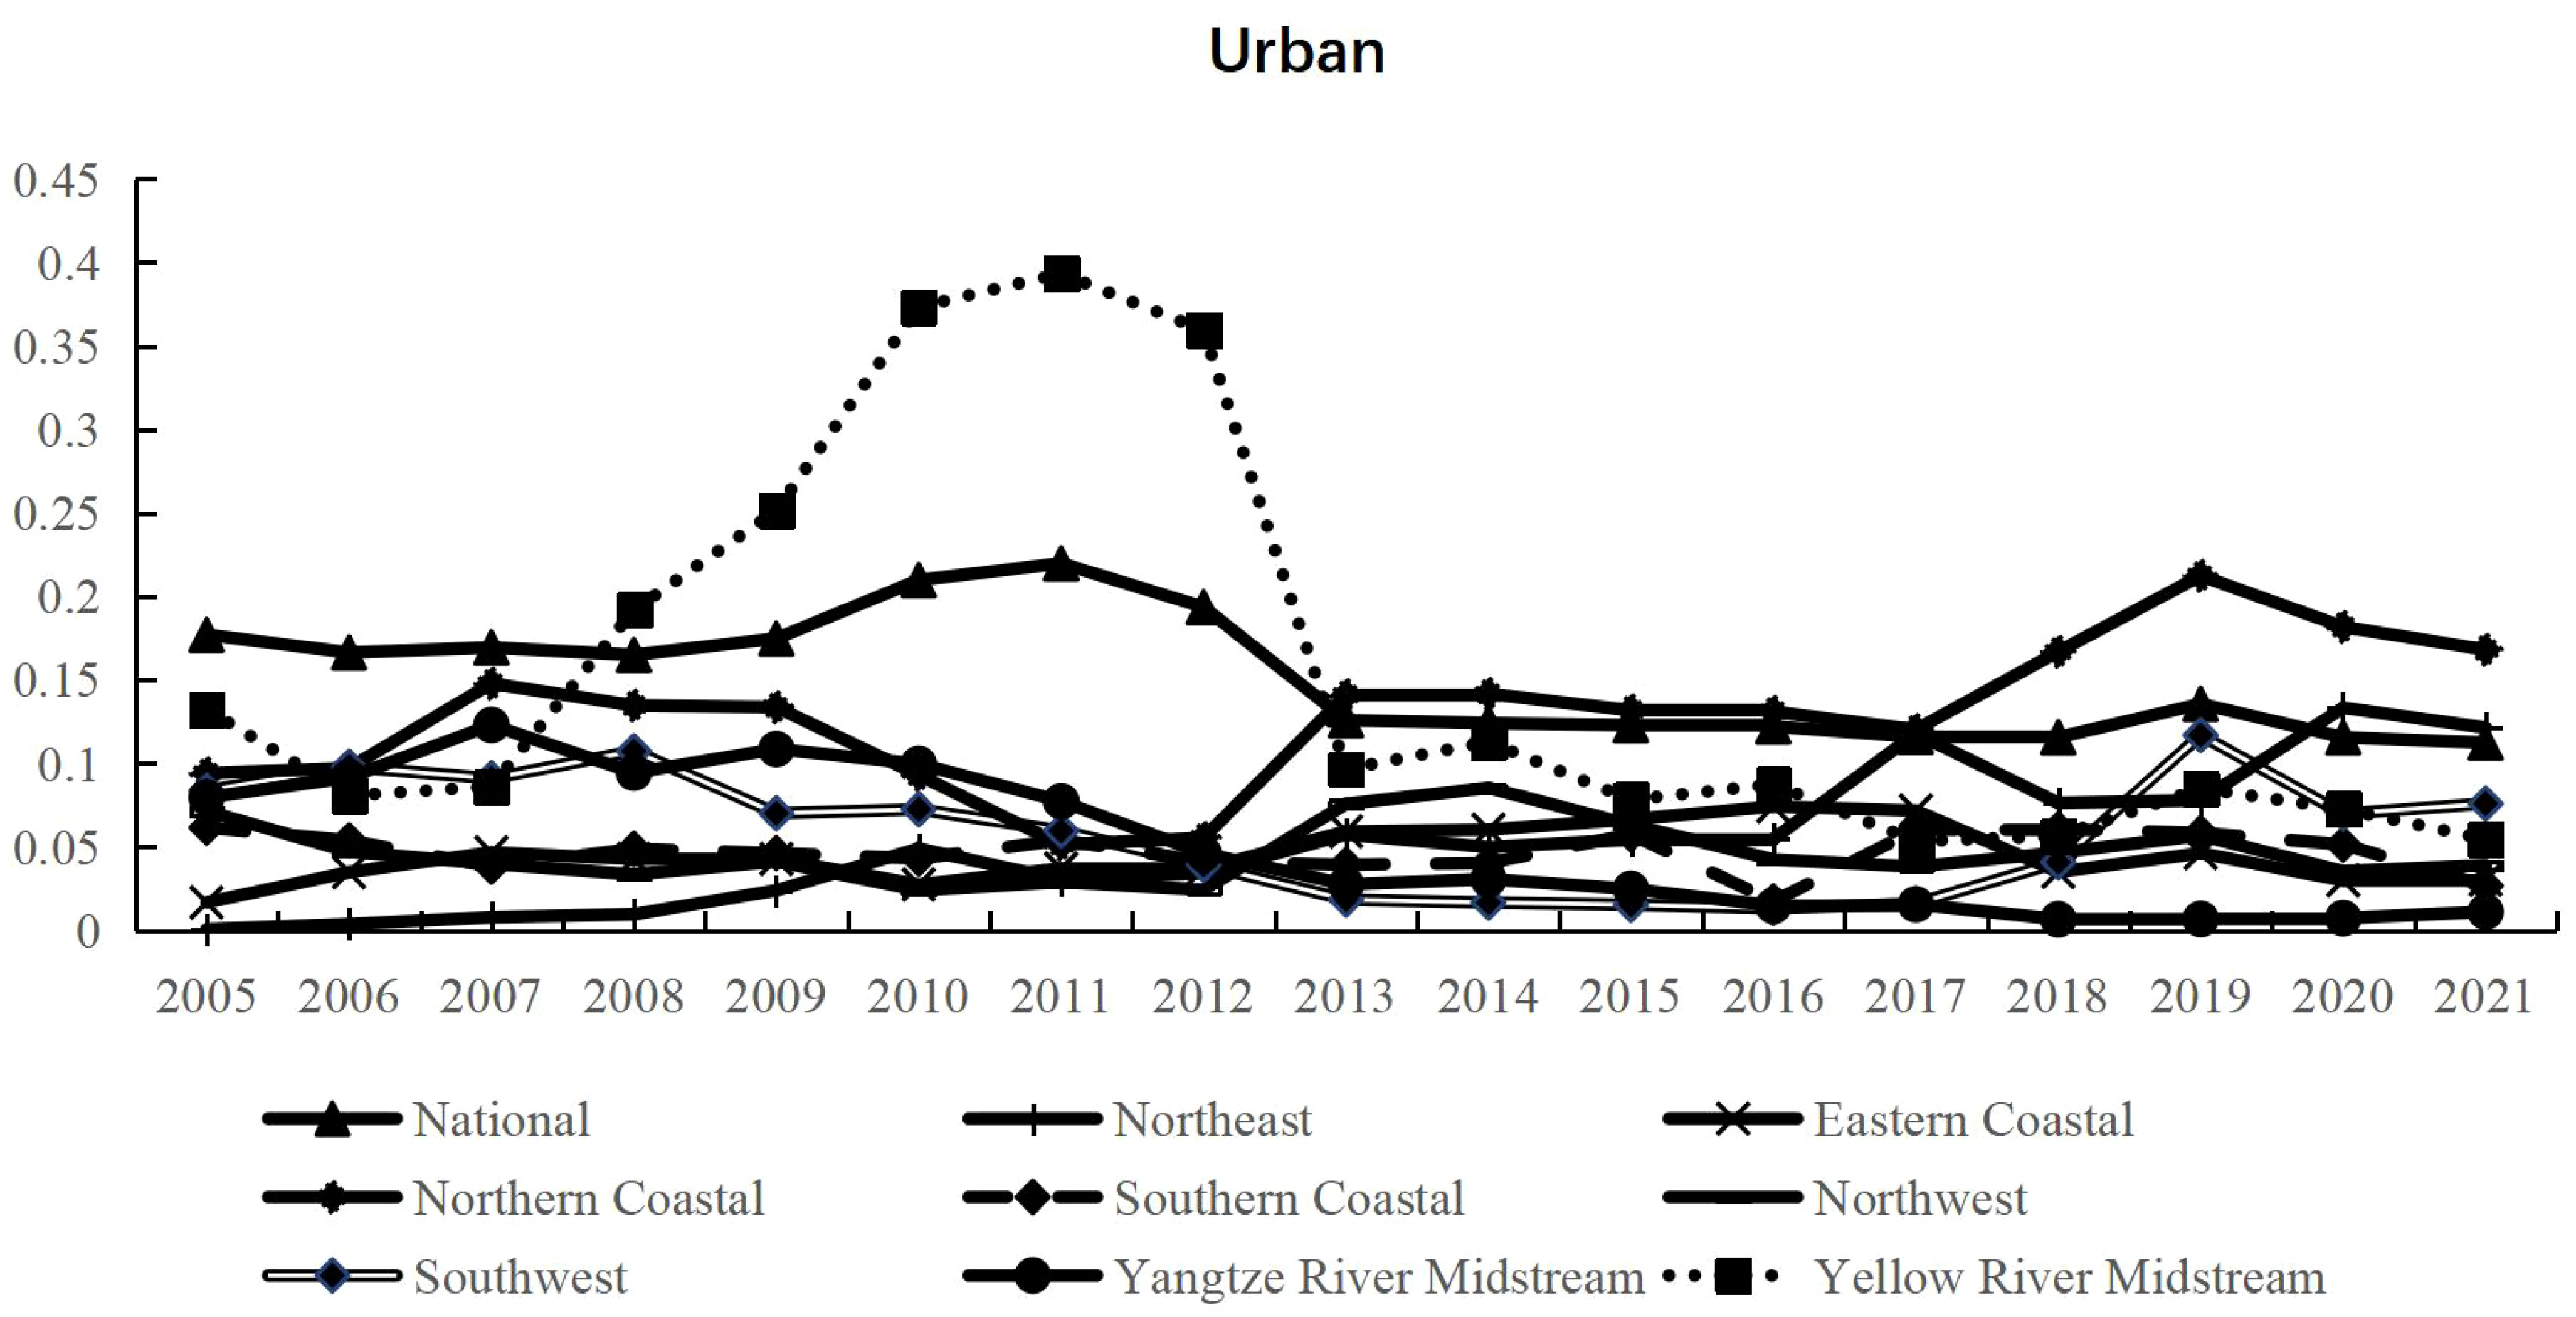
Figure 3 Dynamic trends in the distribution of urban carbon emissions in China.
Regarding rural carbon emissions, as depicted in Figure 4, the national Theil Index decreased from 0.2275 in 2005 to 0.1136 in 2021, showing a reduction in the variance of rural carbon emission intensity across the country and reflecting a trend towards uniformity in carbon emission intensity in rural China. The Theil Index in the Northeast region also displayed a decreasing trend, from 0.165 in 2005 to 0.0427 in 2021, indicating a reduction in the disparity of rural carbon emission intensity in this area. Coastal regions such as the Northeastern Coastal, Northern Coastal, and Southern Coastal areas experienced larger fluctuations in their Theil Index, but without a clear long-term trend, suggesting diversity in agricultural production methods and energy use patterns in these regions. The Northwest and Southwest regions showed relatively minor fluctuations in their Theil Index, indicating more stable differences in rural carbon emission intensity. The Theil Index in the Yangtze River Midstream and Yellow River Midstream regions underwent more complex changes, with the Yangtze River Midstream area showing fluctuating indices from 2005 to 2021 and the Yellow River Midstream area displaying a downward trend from 2008 onwards, particularly notable from 2008, reflecting structural changes in agricultural production and energy consumption in this region.
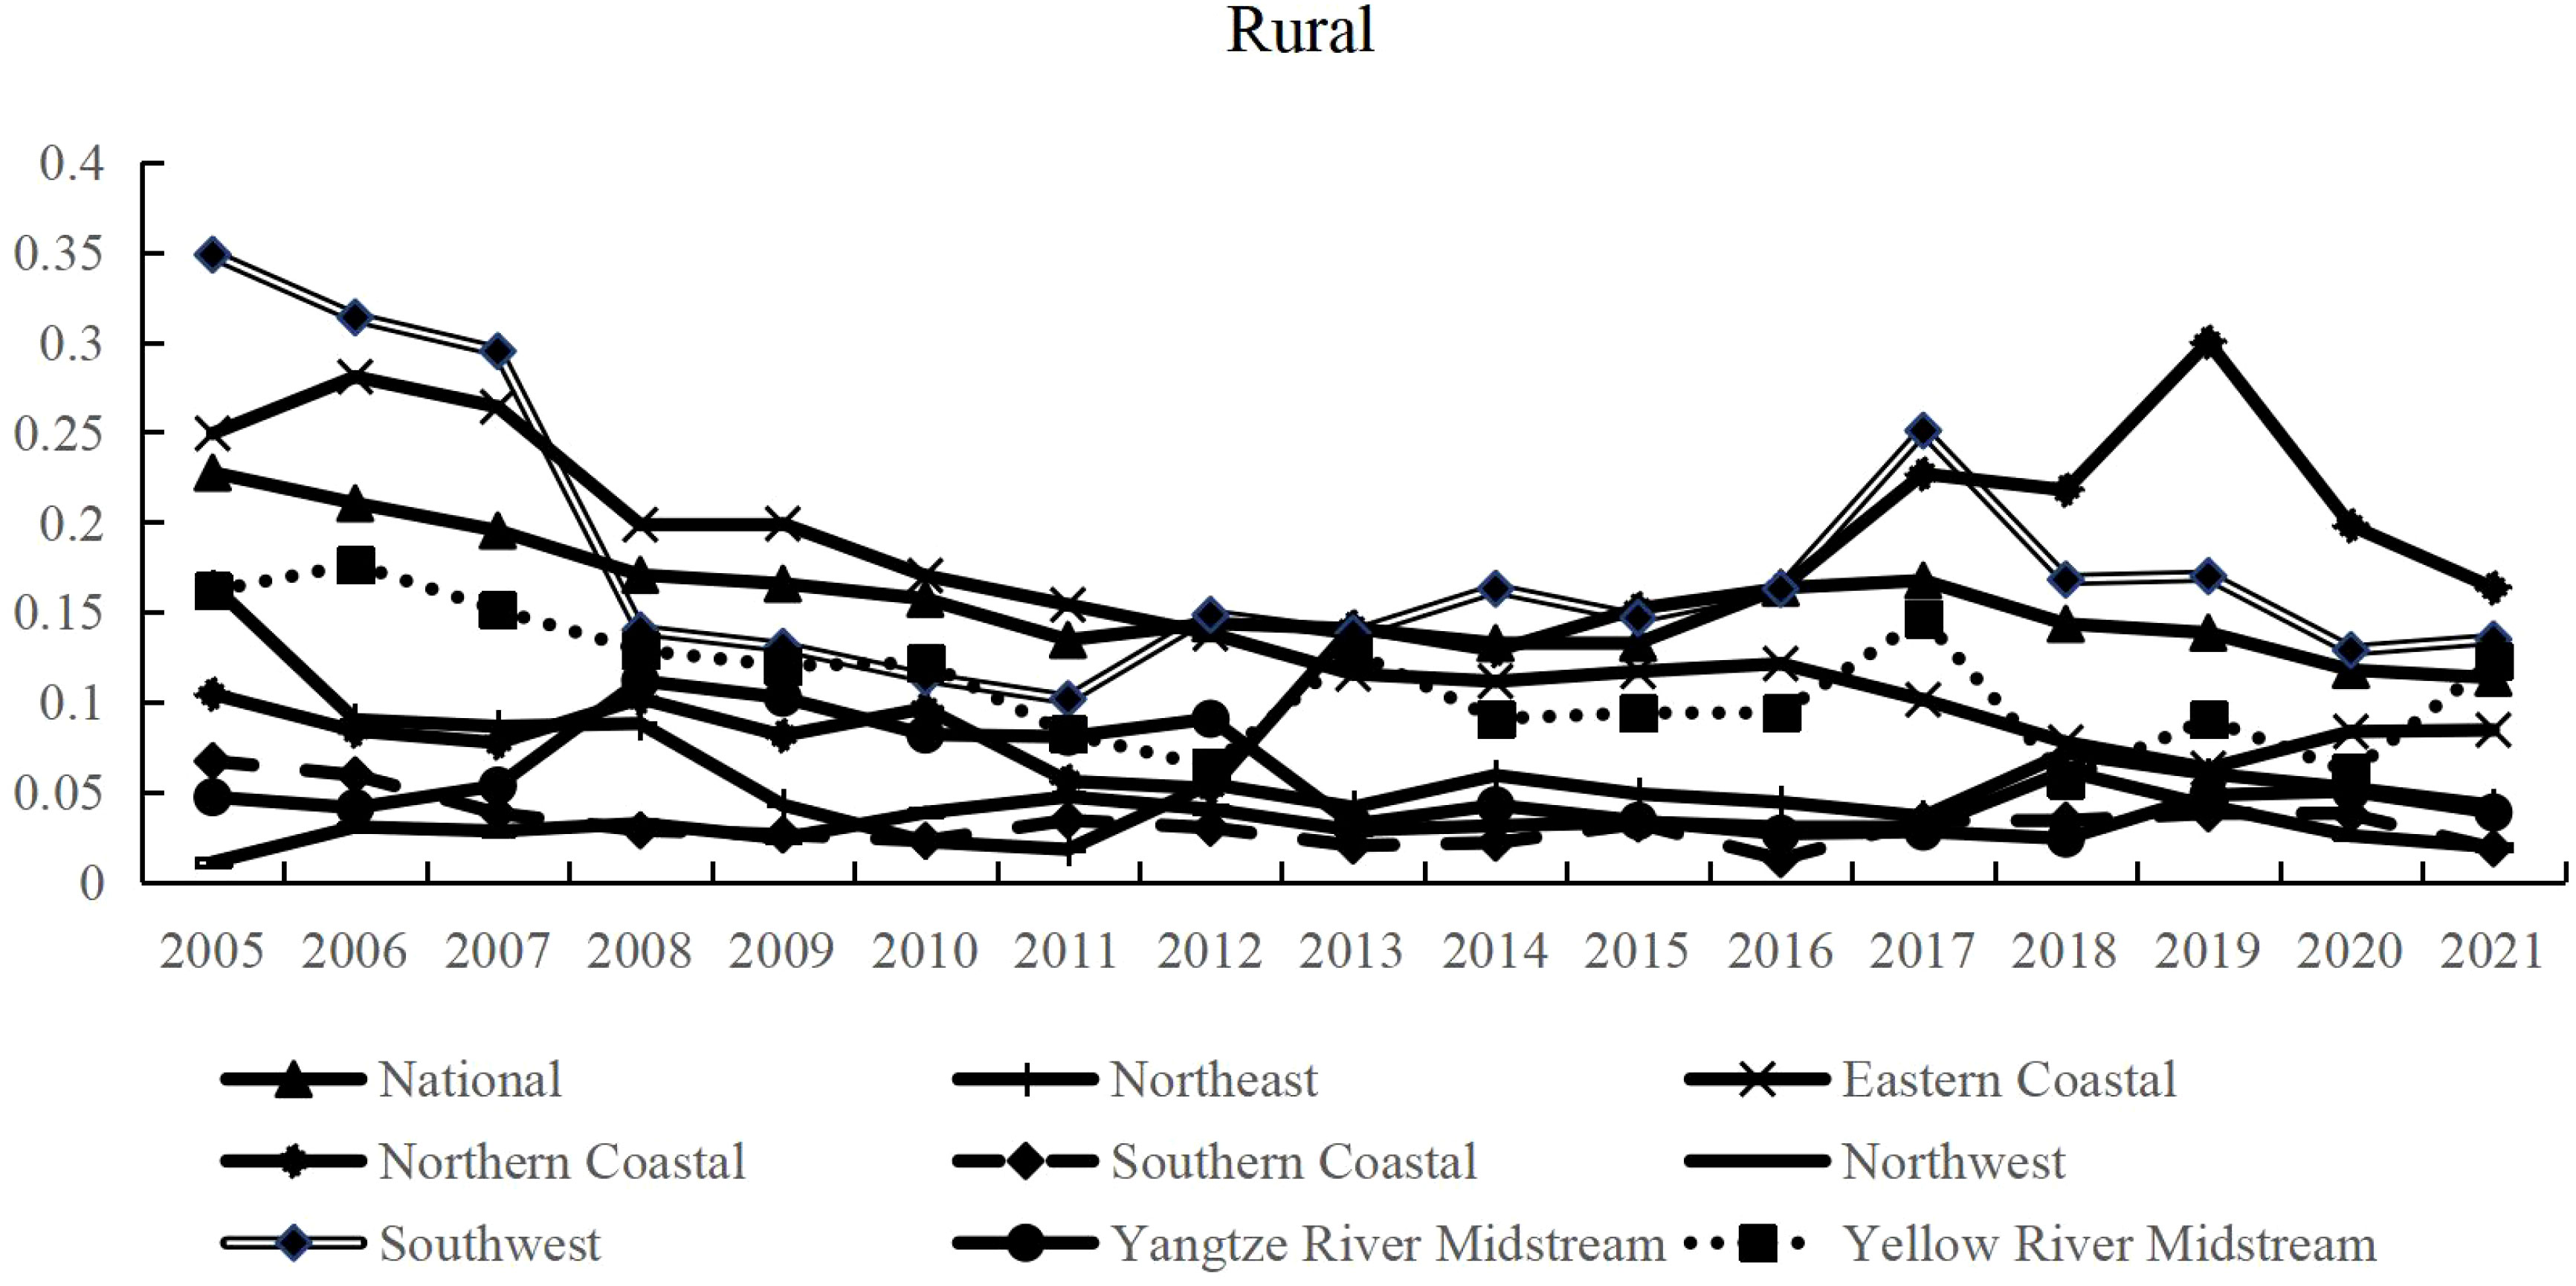
Figure 4 Dynamic trends in the distribution of rural carbon emissions in China.
6 Influencing factors of urban-rural carbon emission inequality and spatial spillover effect
6.1 Global spatial autocorrelation test
Prior to analyzing the inequality in urban-rural carbon emissions and its influencing factors, this study conducted a test for global spatial autocorrelation of these variables, with results presented in Table 2. Figure 5 presents the Moran scatterplot illustrating the inequality in carbon emissions between urban and rural residents in 2018. It was observed that the Moran’s I of urban-rural carbon emission inequality passed the significance test in most of the years under investigation, exhibiting fluctuations in certain years but generally showing an upward trend. This finding indicates that during the examination period, the distribution characteristics of urban-rural carbon emission inequality in China manifested as high-inequality areas being adjacent to other high-inequality areas, while low-inequality areas neighbored other low-inequality regions. Notably, the Moran’s I for the digital economy reached a significant positive value in 2010, suggesting a positive spatial correlation effect between the development of the digital economy and urban-rural carbon emission inequality, with this effect being particularly strong in that year. The Moran’s I for the level of economic development was consistently significant and positive across all years, indicating a stable positive spatial clustering characteristic between economic growth and urban-rural carbon emission inequality. The Moran’s I for industrial structure was negative in some years, implying a potential dispersed spatial distribution for industrial structure. The Moran’s I for government intervention and foreign direct investment also passed the significance test in most years, indicating significant spatial clustering for these factors. The Moran’s I for industrial concentration was significant in all years and showed a relatively stable spatial autocorrelation, suggesting a strong spatial correlation effect of industrial concentration on urban-rural carbon emission inequality. The Moran’s I for population density was not significant in most years, which may indicate that the spatial relationship between population density distribution and urban-rural carbon emission inequality is not apparent. In summary, the results in Table 2 reveal significant spatial autocorrelation between urban-rural carbon emission inequality and its influencing factors in China, with these autocorrelations exhibiting certain differentiated characteristics in different years. This suggests that policy formulation should consider the spatial clustering characteristics of these factors and how they influence urban-rural carbon emission inequality through spatial relationships.
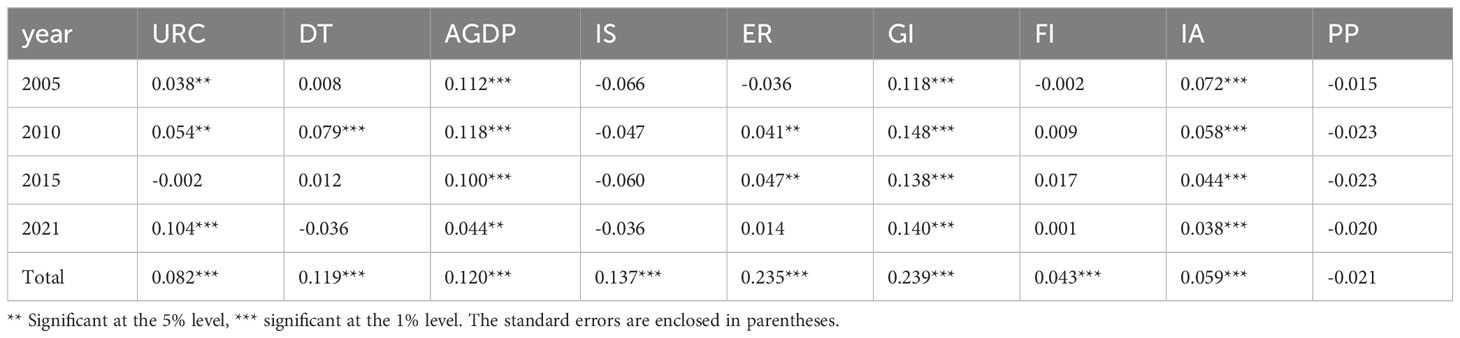
Table 2 Moran’s I values for urban-rural carbon emission inequality and its influencing factors from 2005 to 2021.

Figure 5 Moran scatter chart of carbon emission inequality between urban and rural residents in 2018.
6.2 Analysis of the impact of various factors on urban-rural carbon emission inequality
For the analysis of urban-rural carbon emission inequality and its influencing factors, this study employed various spatial matrices, including geographic distance matrix, economic distance matrix, and adjacency spatial weight matrix, to conduct a comprehensive spatial econometric analysis. Initially, a series of tests were performed on Equation 5, encompassing the Lagrange Multiplier (LM) test, Likelihood Ratio (LR) test, Hausman test, and Wald test, aiming to ascertain the most suitable estimation form for the dynamic spatial econometric model. Specifically, in the first step, an Ordinary Least Squares (OLS) estimation was conducted on a model without considering spatial effects. This approach facilitated the derivation of the LM and its robust statistics (R-LM) to determine whether to employ a Spatial Autoregressive (SAR) model or a Spatial Error Model (SEM). Subsequently, if the LM test indicated the presence of spatial effects, following Elhorst’s (2014) recommendation, the more general Spatial Durbin Model (SDM) was directly applied for spatial econometric estimation. In the third step, the LR test was utilized to evaluate the fixed effects in the spatial Durbin model, determining the inclusion of Spatial Fixed Effects (SFE) or Temporal Fixed Effects (TFE). The fourth step involved executing the Hausman test on the spatial Durbin model to decide between fixed effects and random effects. The fifth step entailed assessing whether the spatial Durbin model could be simplified to a SAR or SEM model through the Wald or LR test. The test results indicated that the dynamic spatial Durbin model with dual fixed effects was the most appropriate choice for spatial econometric estimation in this study. To further ascertain the fitting efficacy of the Spatial Durbin Model (SDM), Wald and Likelihood Ratio (LR) tests were conducted. The resultant P-values for the Wald space lag test, LR space lag test, Wald space error test, and LR space error test were found to be significantly zero at a 1% level. This finding underscores the superior fitting effect of the SDM model. Furthermore, the regression coefficients of the SDM model do not align with the transformation hypothesis, indicating an inequivalence in transitioning the SDM model into either Spatial Autoregressive (SAR) or Spatial Error Model (SEM) formats. Consequently, this study opts for the SDM model for its analytical approach.
As evident from Table 3, significant differences in the impact of various factors on urban-rural carbon emission inequality were observed under different spatial matrices. Firstly, the digital economy (DT) exhibited a negative influence in all models and passed at least the 5% significance test in geographic and economic models. This suggests that with the development of the digital economy, the degree of urban-rural carbon emission inequality is reduced. The level of economic development passed the significance test in all models, with its primary term coefficient being negative and the quadratic term positive, indicating a U-shaped relationship between economic development level and urban-rural carbon emission inequality. That is, after a certain stage of economic development, urban-rural carbon emission inequality first decreases and then increases. The industrial structure showed a negative impact in all models, passing at least the 5% significance test, implying that the optimization of industrial structure contributes to reducing the inequality of carbon emissions between urban and rural areas.
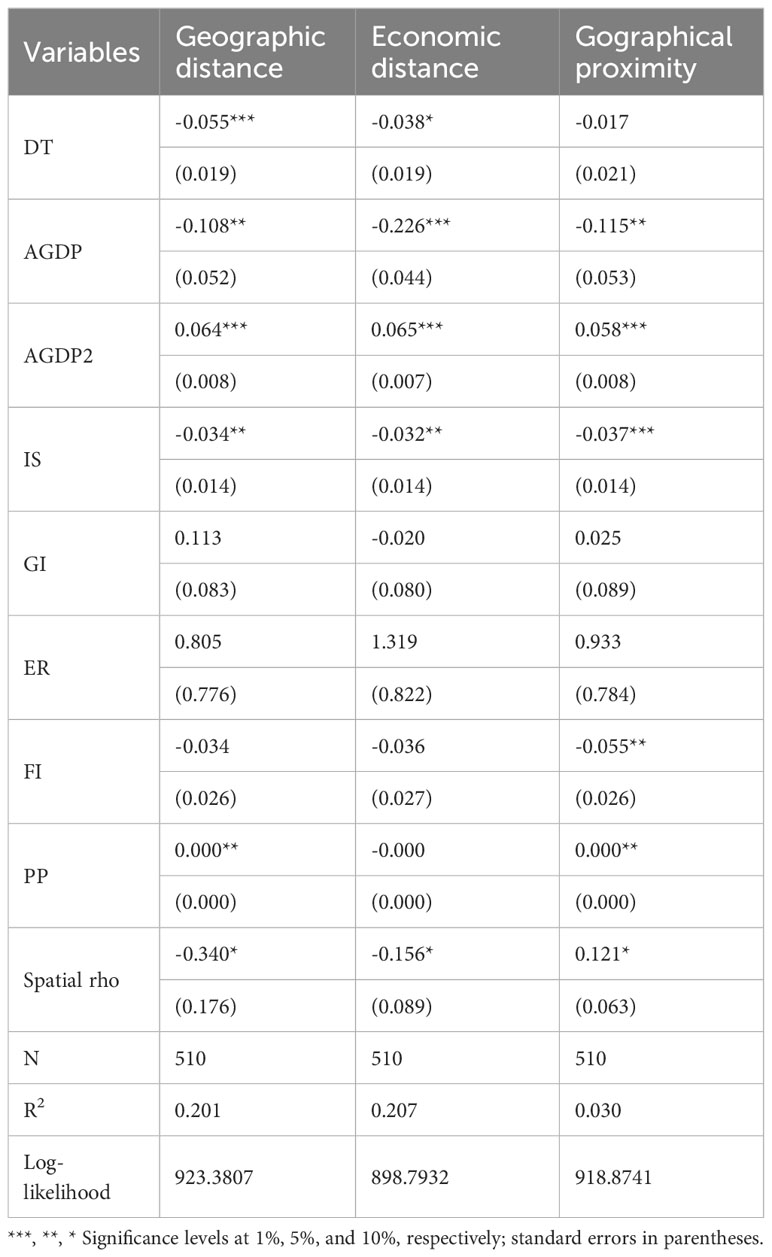
Table 3 Results of spatial econometric model.
At the government level, the impact of government intervention was inconsistent across different models and did not pass the significance test in all models, indicating that the effect of government intervention on urban-rural carbon emission inequality might be influenced by other factors and become less apparent. Environmental regulation did not pass the significance test in any model, possibly indicating an unclear relationship between environmental regulation and urban-rural carbon emission inequality. The degree of openness to the outside world passed the 5% significance test in the spatial adjacency model, suggesting that an increase in openness helps reduce urban-rural carbon emission inequality. Population density exhibited a positive impact in the geographic model and passed the 5% significance test, while its effect was less pronounced in other models.
The inverted U-shaped relationship between the level of economic development and the inequality in carbon emissions between urban and rural residents can be attributed to the rapid rise in carbon emissions in urban areas during the initial stages of economic growth, driven by rapid industrialization and high energy consumption. In contrast, slower development in rural areas exacerbates this inequality. As the economy further develops and matures, urban areas begin to adopt cleaner energy sources and improve energy efficiency, thereby reducing carbon emissions and narrowing the emission gap with rural areas. The advancement of the digital economy significantly reduces carbon emission inequality between urban and rural areas by enhancing resource efficiency and promoting dematerialized services. Concurrently, the optimization of industrial structure, especially the transition to service and high-tech industries, is more pronounced in urban areas and contributes to reducing carbon emissions among urban residents. However, higher population density, particularly in urban areas, often leads to increased energy consumption and carbon emissions, thus exacerbating the inequality in carbon emissions between urban and rural areas.
Additionally, the spatial autocorrelation coefficient ρ was negative and passed the 10% significance test in the geographic model, negative in the economic model, and positive in the spatial adjacency model, all passing the 10% significance test. This indicates that the spatial distribution of urban-rural carbon emission inequality is related to geographical location, economic connections, and spatial adjacency relationships.
By comparing the results of the three models, despite some differences in the direction of impact for certain variables, the majority exhibited a degree of consistency in their influence direction and significance characteristics across different spatial matrices. This demonstrates the robustness of the estimation results.
6.3 Analysis of the spatial spillover effects of various factors on urban-rural carbon emission inequality
To accurately represent the mechanism and actual impact of various factors on urban-rural carbon emission inequality, this study, following the approach of LeSage and Pace (2009), utilized the partial differential method to unbiasedly process the estimation results from Table 3. These results were then decomposed into direct, indirect (spatial spillover), and total effects. The direct effects comprise two parts: the impact of factors on local urban-rural carbon emission inequality and the feedback effects received by local inequality. Indirect effects, also known as spatial spillover effects, specifically refer to the direction and magnitude of influence exerted by factors in neighboring regions on local urban-rural carbon emission inequality. Accordingly, this paper dissects the direct (local) effects and indirect (spatial spillover) effects of each factor on urban-rural carbon emission inequality, with results presented in Table 4.
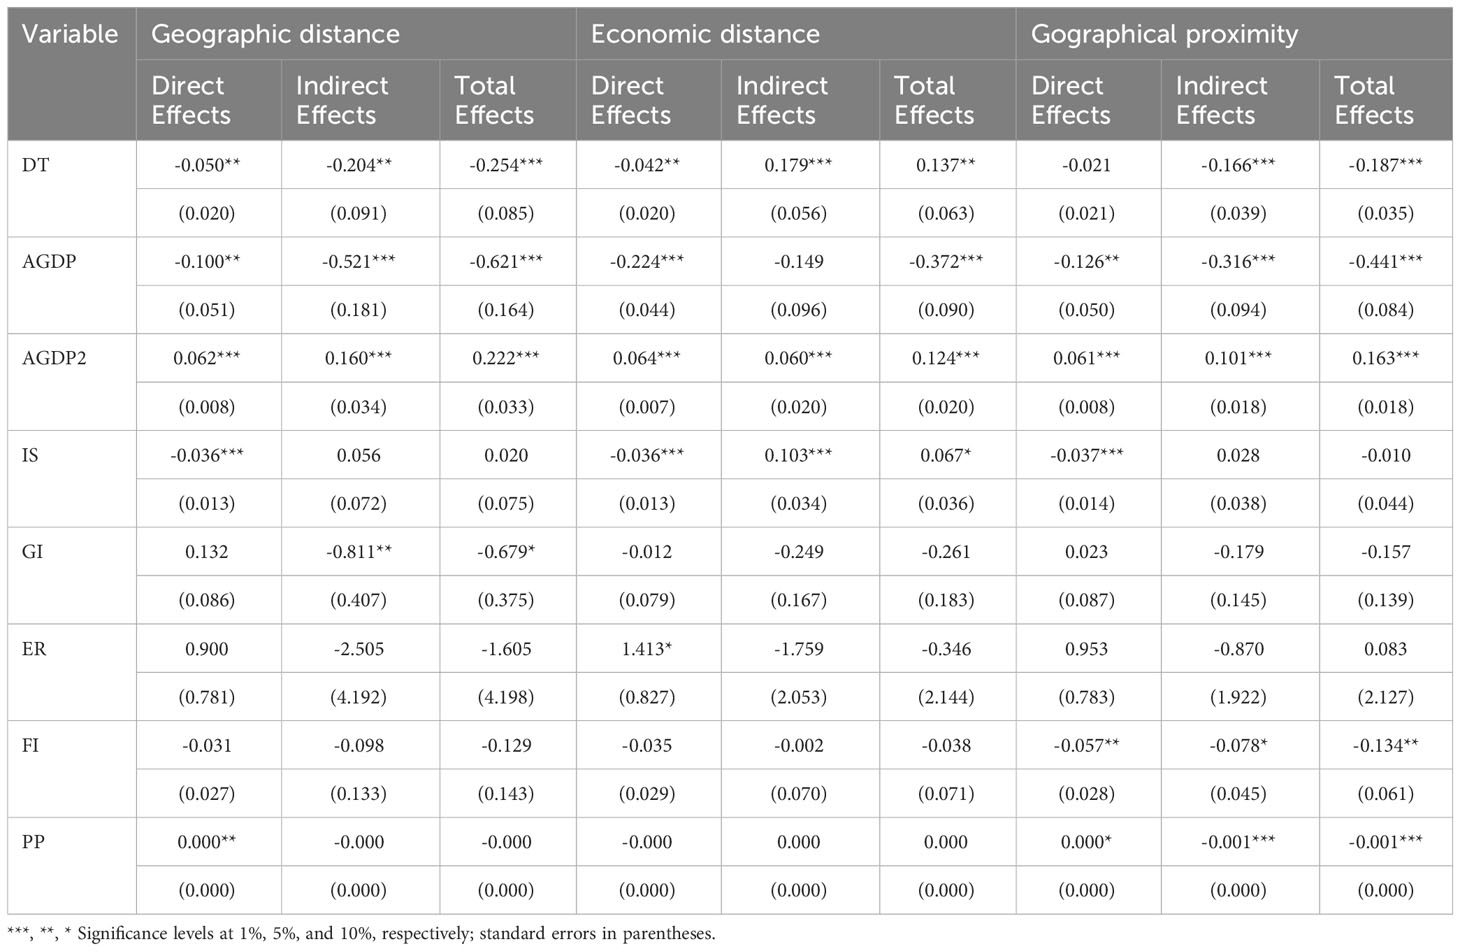
Table 4 Direct and indirect effects.
Integrating the findings from Table 4, under the geographic, economic, and spatial adjacency weight matrices, the direct effect parameter estimates for the digital economy (DT) are -0.050 in the geographic matrix, significant at the 5% level, while the indirect effects are -0.204, also significant at the 5% level. This suggests that the development of the digital economy not only directly reduces local urban-rural carbon emission inequality but also exerts a positive spillover effect on neighboring regions through spatial associations. This conclusion implies that as the digital economy grows, it bears certain spatial spillover effects in promoting the reduction of urban-rural carbon emission inequality.
The direct effects of the economic development level are negative under all spatial matrices, being -0.100 in the geographic matrix, -0.224 in the economic matrix, and -0.126 in the spatial adjacency matrix, all significant at least at the 5% level. This indicates that the enhancement of the economic development level can effectively reduce the carbon emission inequality between urban and rural areas. The quadratic term of the economic development level is positive in all models, signifying a U-shaped relationship, where after a certain level of economic growth, urban-rural carbon emission inequality increases. The direct effects of industrial structure are negative under all spatial matrices and significant at least at the 5% level in the geographic and economic matrices. However, the indirect effects of industrial structure are not significant across the models. The direct effects of government intervention are not significant in any model, suggesting that government intervention might not have a direct significant impact on urban-rural carbon emission inequality. The direct effects of environmental regulation are positive and significant at the 10% level in the economic matrix, indicating that stronger environmental regulation might increase urban-rural carbon emission inequality in some cases. The direct effects of the degree of openness are negative and significant at the 5% level in the spatial adjacency matrix, suggesting that increased openness helps reduce urban-rural carbon emission inequality. The direct effects of population density are positive and significant at the 5% level in the geographic matrix, but its indirect effects are negative and significant at the 1% level in the spatial adjacency matrix, indicating that an increase in population density might directly lead to an increase in urban-rural carbon emission inequality, while potentially exerting a negative spillover effect on neighboring regions through spatial associations.
In summary, these factors demonstrate significant spatial associations in their impact on urban-rural carbon emission inequality. The analysis of direct and indirect effects reveals that these factors not only affect urban-rural carbon emission inequality in the local area but also influence neighboring regions through spatial linkages. This spatial association might be due to the interaction and diffusion effects of economic activities, environmental policies, and technological dissemination across space. For instance, the expansion of the digital economy might promote the sharing of technological and managerial knowledge in surrounding regions, enhancing energy efficiency and reducing carbon emissions, thereby decreasing urban-rural carbon emission inequality at the regional level.
The enhancement of the economic development level and optimization of industrial structure might directly reduce local carbon emission inequality through the increase of efficient, low-carbon industrial activities and improved resource utilization efficiency. Furthermore, due to regional clustering effects of economic activities, these changes might also have spillover effects on neighboring regions, further affecting their urban-rural carbon emission inequality. However, the direct effects of some factors, such as government intervention and environmental regulation, are not significant, possibly reflecting the complexity of the implementation and impact of these policy measures on carbon emission inequality. The results for the degree of openness and population density suggest that they might influence urban-rural carbon emission inequality in different directions, likely related to variations in openness policies and population distributions.
7 Conclusions and policy implications
7.1 Conclusions
This paper applies the IPCC methodology to calculate the carbon emissions of urban and rural residents in various provinces of China from 2005 to 2021. Using kernel density estimation and the Theil Index, the study investigates regional differences and dynamic evolution in carbon emissions across the nation and in eight major regions. The main conclusions drawn are as follows:
First, the dynamic progression characteristics of carbon emissions among national, urban, and rural residents in China have shown significant differences. From 2005 to 2021, the center of the national urban carbon emission density function has overall shifted from left to right, indicating a general increase in carbon emissions and a widening of inter-provincial disparities. For urban residents, the center of the density function moved to the right, and the peak experienced fluctuations before stabilizing, reflecting an overall increase in carbon emission intensity and a widening gap between provinces. In contrast, the center of the rural residents’ carbon emission density function shifted slightly to the right, and the peak slightly decreased after fluctuations, suggesting a relative stability in carbon emission intensity among rural residents but an increase in inter-provincial differences.
Second, during the period from 2005 to 2021, China experienced three distinct phases in urban-rural carbon emission inequality: a rise, a decline, and stabilization. Specifically, from 2005 to 2010, the Theil Index displayed a rapid increasing trend, whereas from 2017 onwards, it showed a yearly decline. During this period, the inequality in carbon emissions among urban residents increased from 2005 to 2010, while for rural areas, it significantly decreased from 2005 to 2008. The Northeast region of China overall showed an increasing trend in carbon emission inequality, particularly a significant increase in urban areas since 2017. In contrast, the Eastern Coastal and Southern Coastal regions exhibited a decreasing trend in carbon emission inequality. The Northwestern region’s inequality in carbon emissions displayed fluctuations but remained generally low. Additionally, the Southwestern region and the Yangtze River Midstream region also showed a downward trend in carbon emission inequality. As for the Yellow River Midstream region, the Theil Index for carbon emission inequality fluctuated considerably.
Third, urban-rural carbon emission inequality is influenced by factors at both the market and government levels. On the market side, the development of the digital economy has a direct effect and a significant spatial spillover effect in reducing urban-rural carbon emission inequality. The relationship between the level of economic development and urban-rural carbon emission inequality is U-shaped. The optimization of industrial structure helps reduce carbon emission inequality between urban and rural areas, although its spatial spillover effect is not significant. Regarding government-level factors, the direct impact of government intervention is not significant, and the strengthening of environmental regulations might increase urban-rural carbon emission inequality in certain situations. The influences of the degree of openness and population density show complexity; the former helps reduce urban-rural carbon emission inequality, while the latter may directly increase inequality but also exert a negative spillover effect on neighboring areas.
In addressing the third conclusion of the paper, which identifies factors at both market and government levels influencing urban-rural carbon emission inequality, a coherent policy should be constructed with a focus on harnessing the positive aspects of these factors while mitigating their negative impacts. The policy should prioritize the advancement of the digital economy, recognizing its dual role in directly reducing urban-rural carbon emission inequality and generating significant spatial spillover benefits. This can be facilitated through increased investment in digital infrastructure, particularly in rural areas, and fostering digital literacy and innovation across various sectors, enabling a transition to more efficient and less carbon-intensive operations.
7.2 Policy implications
Given the dynamic progression of carbon emissions among national, urban, and rural residents in China, as detailed in this study, a nuanced and differentiated policy approach is imperative. This policy seeks to harmonize the disparate trajectories of urban and rural carbon emissions, which are characterized by increasing and widening inter-provincial disparities in urban areas, in contrast to the relative stability and emerging differences in rural regions. A dual-pronged strategy is advocated: intensifying carbon reduction efforts in urban centers through stringent emission targets, advanced monitoring systems, and sustainable, energy-efficient urban development practices. Concurrently, a tailored approach for rural areas is essential, focusing on sustainable agricultural and energy practices, supported by educational and developmental initiatives, to address inter-provincial disparities. This bifurcated strategy promises more effective and equitable carbon emissions management across China, in line with the distinct environmental and socio-economic contexts of its urban and rural areas. At the national governance level, the implementation of a differentiated carbon tax policy is suggested. In urban areas, the imposition of higher carbon taxes is recommended, while rural areas should receive subsidies and incentives for the adoption of clean technologies. This policy aims to reduce carbon emissions in urban settings and encourage a transition to low-carbon practices in rural areas. In terms of consumer behavior, national campaigns promoting sustainable consumption habits are recommended. These initiatives should focus on educating consumers about the carbon footprint of products and encouraging low-carbon lifestyle choices, such as using energy-efficient appliances, reducing meat consumption, and preferring public transportation. Tailored incentive programs and publicity strategies should be designed to meet the specific consumption patterns and needs of urban and rural residents. Management strategies should include enhancing carbon absorption capabilities in rural areas. This involves increasing investment in afforestation projects, promoting agricultural practices that improve soil carbon storage, and supporting the development of carbon-neutral or negative practices in rural communities. These measures aim not only to reduce the urban-rural carbon emission gap but also to contribute significantly to the national reduction of carbon emissions.
In Northeast China, the escalation of urban carbon emission inequality necessitates investments in green infrastructure and strict implementation of emission reduction policies in urban centers. Complementary measures to foster economic diversification and transition to low-carbon industries are crucial to mitigate potential inequality increases during the transition phase. In the Eastern and Southern Coastal areas, where carbon emission inequality is declining, the focus should be on solidifying these gains, possibly through expanding low-carbon initiatives, enhancing cross-regional collaboration, and sharing best practices. For regions with variable inequality, such as the Northwest and the middle reaches of the Yellow River, a dynamic and responsive policy framework is needed to adapt to evolving carbon emission patterns. This could entail establishing regional carbon monitoring systems for prompt policy adjustments based on real-time data, alongside promoting renewable energy and sustainable agricultural practices. In regions with generally low or decreasing carbon emission inequality, like the Southwestern region and the Yangtze River Midstream, policies should aim to sustain this trend through continued support for sustainable development in both urban and rural settings. This support could encompass ongoing financial and technical assistance for renewable energy projects, sustainable agriculture, and rural development programs that concurrently reduce carbon emissions and enhance socio-economic equality.
In response to the paper’s third conclusion, which highlights the influence of market and government factors on urban-rural carbon emission inequality, a coherent policy must be devised to capitalize on positive influences while mitigating negative impacts. The policy should prioritize advancing the digital economy, acknowledging its role in directly reducing urban-rural carbon emission inequality and its significant spatial spillover benefits. Facilitation could come through increased investment in digital infrastructure, particularly in rural areas, and promoting digital literacy and innovation across various sectors to transition towards more efficient, low-carbon operations. Recognizing the U-shaped relationship between economic development and carbon emission inequality, the policy should aim to elevate regions, especially rural areas, to a level of economic development where inequality begins to diminish. This could involve targeted economic support and development programs emphasizing sustainable, inclusive growth benefiting both urban and rural populations. Additionally, the policy should encourage optimizing industrial structures to reduce carbon emission inequality, including incentivizing more sustainable, low-carbon industries, encouraging shifts away from high-emission industries, and supporting green technology research and development. On the government intervention front, given the limited impact of direct government action and the potential for stringent environmental regulations to inadvertently increase inequality, a more strategic and balanced approach is warranted. This approach should entail thorough impact assessments of new regulations or interventions to ensure they do not unintentionally widen urban-rural inequalities.
7.3 Research limitations
This study, which delves into the carbon emissions of urban and rural residents in China, presents several limitations. Its geographical focus on China, while offering detailed insights, constrains the extrapolation of its results to nations with differing socio-economic and environmental contexts, thereby limiting its global applicability. Predominantly utilizing quantitative methods, the study might overlook qualitative aspects such as residents’ subjective perceptions or the intricate implementation of policies, which could yield deeper understanding of the disparities in urban and rural carbon emissions. The observed minimal spatial spillover effect of industrial structure optimization in mitigating urban-rural inequality invites further investigation to uncover additional factors that might enhance these outcomes. The nuanced effects of governmental interventions and environmental regulations, coupled with the complex influence of population density, suggest a complex policy landscape necessitating more comprehensive, case-specific analyses. Reliance on available data sources also raises questions regarding the comprehensiveness, accuracy, and representativeness of the data, crucial elements for ensuring the study’s validity and reliability. These limitations underscore the necessity for continued research, incorporating a variety of methodologies, wider temporal and geographical frames, and a combination of quantitative and qualitative approaches to expand the understanding of carbon emissions and their inequalities in urban and rural settings.
Data availability statement
The original contributions presented in the study are included in the article/supplementary material. Further inquiries can be directed to the corresponding authors.
Author contributions
JW: Data curation, Formal analysis, Investigation, Methodology, Software, Writing – original draft. RH: Conceptualization, Funding acquisition, Project administration, Supervision, Writing – review & editing. YL: Conceptualization, Investigation, Resources, Software, Writing – original draft. YS: Conceptualization, Data curation, Methodology, Resources, Supervision, Writing – review & editing.
Funding
The author(s) declare financial support was received for the research, authorship, and/or publication of this article. This research was funded by the Fujian Provincial Research Base for Humanities and Social Sciences - the Quantitative Economics Research Center at Huaqiao University.
Conflict of interest
The authors declare that the research was conducted in the absence of any commercial or financial relationships that could be construed as a potential conflict of interest.
Publisher’s note
All claims expressed in this article are solely those of the authors and do not necessarily represent those of their affiliated organizations, or those of the publisher, the editors and the reviewers. Any product that may be evaluated in this article, or claim that may be made by its manufacturer, is not guaranteed or endorsed by the publisher.
References
Belaïd F., Boubaker S., Kafrouni R. (2020). Carbon emissions, income inequality and environmental degradation: the case of Mediterranean countries. Eur. J. Comp. Economics 17, 73–102. doi: 10.25428/1824-2979/202001-73-102
Björkegren A., Grimmond C. (2018). Net carbon dioxide emissions from central London. Urban Climate 23, 131–158. doi: 10.1016/j.uclim.2016.10.002
Blanchard C. L., Tanenbaum S., Hidy G. M. (2013). Source attribution of air pollutant concentrations and trends in the Southeastern Aerosol Research and Characterization (SEARCH) network. Environ. Sci. Technol. 47, 13536–13545. doi: 10.1021/es402876s
Chen J., Li X. (2023). Dynamic decomposition and efficiency evaluation of carbon emissions by urban and rural residents in China. Dongyue Tribune 44, 138–149. doi: 10.15981/j.cnki.dongyueluncong.2023.07.016
Chen L., Xu L., Yang Z. (2019). Inequality of industrial carbon emissions of the urban agglomeration and its peripheral cities: A case in the Pearl River Delta, China. Renewable Sustain. Energy Rev. 109, 438–447. doi: 10.1016/j.rser.2019.04.010
Cheng Y., Wang Z., Zhang S., Ye X., Jiang H. (2013). Spatial econometric analysis of carbon emission intensity and its influencing factors in China’s energy consumption. Acta Geographica Sin. 68, 1418–1431. doi: 10.1007/s11356-019-04131-3
Chien F., Chau K. Y., Sadiq M. (2023). Impact of climate mitigation technology and natural resource management on climate change in China. Resource Policy 81, 103367. doi: 10.1016/j.resourpol.2023.103367
Christen A., Coops N., Crawford B., Kellett R., Liss K., Olchovski I., et al. (2011). Validation of modeled carbon-dioxide emissions from an urban neighborhood with direct eddy-covariance measurements. Atmospheric Environ. 45, 6057–6069. doi: 10.1016/j.atmosenv.2011.07.040
Crawford B., Christen A. (2015). Spatial source attribution of measured urban eddy covariance CO2 fluxes. Theor. Appl. Climatol 119, 733–755. doi: 10.1007/s00704-014-1124-0
Dietrich F., Chen J., Voggenreiter B., Aigner P., Nachtigall N., Reger B. (2021). MUCCnet: Munich urban carbon column network. Atmospheric Measurement Techniques 14, 1111–1126. doi: 10.5194/amt-14-1111-2021
Du Y., Liu H., Huang H., Li X. (2023). The carbon emission reduction effect of agricultural policy——Evidence from China. J. Cleaner Prod 406, 137005. doi: 10.1016/j.jclepro.2023.137005
Elhorst J. P. (2014). Spatial panel data models. In: Spatial econometrics. Springer Briefs in Regional Science. Springer: Berlin, Heidelberg. doi: 10.1007/978-3-642-40340-8_3
Guo X., Yang J., Shen Y., Zhang X. (2023). Prediction of agricultural carbon emissions in China based on a GA-ELM model. Front. Energy Res. 11. doi: 10.3389/fenrg.2023.1245820
Guo Z., Zhang X. (2023). Carbon reduction effect of agricultural green production technology: A new evidence from China. Sci. Total Environ. 874, 162483. doi: 10.1016/j.scitotenv.2023.162483
Hailemariam A., Dzhumashev R., Shahbaz M. (2020). Carbon emissions, income inequality and economic development. Empirical Economics 59, 1139–1159. doi: 10.1007/s00181-019-01664-x
Han F., Yang L. (2020). How does the agglomeration of productive service industries affect the structural upgrading of manufacturing? — A comprehensive framework integrating agglomeration economics and Schumpeter’s theory of endogenous growth. J. Manage. World 36, 72–94. doi: 10.19744/j.cnki.11-1235/f.2020.0022
Hansen J., Ruedy R., Sato M., Lo K. (2010). Global surface temperature change. Rev. Geophysics 48, 1–29. doi: 10.1029/2010RG000345
Heinonen J., Junnila S. (2011). Implications of urban structure on carbon consumption in metropolitan areas. Environ. Res. Lett. 6, 14018. doi: 10.1088/1748-9326/6/1/014018
Hu J. (2023). Synergistic effect of pollution reduction and carbon emission mitigation in the digital economy. J. Environ. Manage. 337, 117755. doi: 10.1016/j.jenvman.2023.117755
Hu J., Zhang H., Irfan M. (2023). How does digital infrastructure construction affect low-carbon development? A multidimensional interpretation of evidence from China. J. Cleaner Prod 396, 136467. doi: 10.1016/j.jclepro.2023.136467
Ielpi A., Lapôtre M. G., Finotello A., Roy-Léveillée P. (2023). Large sinuous rivers are slowing down in a warming Arctic. Nat. Climate Change 13, 375–381. doi: 10.1038/s41558-023-01620-9
Jahanger A., Hossain M. R., Usman M., Onwe J. C. (2023). Recent scenario and nexus between natural resource dependence, energy use and pollution cycles in BRICS region: Does the mediating role of human capital exist? Resource Policy 81, 103382. doi: 10.1016/j.resourpol.2023.103382
LeSage J., Pace R. K. (2009). Introduction to spatial econometrics (Aristide Briand, France: Chapman & Hall/CRC).
Li Z., Bai T., Tang C. (2022). How does the low-carbon city pilot policy affect the synergistic governance efficiency of carbon and smog? Quasi-experimental evidence from China. J. Cleaner Prod 373, 133809. doi: 10.1016/j.jclepro.2022.133809
Liu J., Ji L., Sun Y., Chiu Y., Zhao X. (2024). Unleashing the convergence between SDG 9 and SDG 8 towards pursuing SDGs: Evidence from two urban agglomerations in China during the 13th five-year plan. J. Cleaner Prod 434, 139924. doi: 10.1016/j.jclepro.2023.139924
Liu C., Jiang Y., Xie R. (2019). Does income inequality facilitate carbon emission reduction in the US? J. cleaner production 217, 380–387. doi: 10.1016/j.jclepro.2019.01.242
Liu W., Li H. (2014). China’s coal subsidy reform and its impact on carbon dioxide emission reduction. Economic Res. J. 49(08), 146–157. doi: CNKI:SUN:JJYJ.0.2014-08-012
Liu F., Liu C. (2019). Regional disparity, spatial spillover effects of urbanisation and carbon emissions in China. J. cleaner production 241, 118226. doi: 10.1016/j.jclepro.2019.118226
Liu J., Yang Y., Zhang S. (2020). Measurement and driving factors of China’s digital economy. Shanghai J. Economics 6), 81–96. doi: 10.19626/j.cnki.cn31-1163/f.2020.06.008
Liu Y., Zhang X., Shen Y. (2024). Technology-driven carbon reduction: Analyzing the impact of digital technology on China’s carbon emission and its mechanism. Technological Forecasting Soc. Change 200, 123124. doi: 10.1016/j.techfore.2023.123124
Luo G., Baležentis T., Zeng S. (2023). Per capita CO2 emission inequality of China’s urban and rural residential energy consumption: A Kaya-Theil decomposition. J. Environ. Manage. 331, 117265. doi: 10.1016/j.jenvman.2023.117265
Padilla E., Serrano A. (2006). Inequality in CO2 emissions across countries and its relationship with income inequality: A distributive approach. Energy Policy 34, 1762–1772. doi: 10.1016/j.enpol.2004.12.014
Qi Y., Bai T., Tang Y. (2022). Central environmental protection inspection and green technology innovation: empirical analysis based on the mechanism and spatial spillover effects. Environ. Sci. pollut. Res. 29, 86616–86633. doi: 10.1007/s11356-022-21833-3
Sarkodie S. A., Owusu P. A., Leirvik T. (2020). Global effect of urban sprawl, industrialization, trade and economic development on carbon dioxide emissions. Environ. Res. Lett. 15, 034049. doi: 10.1088/1748-9326/ab7640
Shen Y., Guo X., Zhang X. (2023). Digital financial inclusion, land transfer, and agricultural green total factor productivity. Sustainability. 15(8), 6436. doi: 10.3390/su15086436
Shen Y., Yang Z., Zhang X. (2023). Impact of digital technology on carbon emissions: Evidence from Chinese cities. Front. Ecol. Evol. 11. doi: 10.3389/fevo.2023.1166376
Soegaard H., Møller-Jensen L. (2003). Towards a spatial CO2 budget of a metropolitan region based on textural image classification and flux measurements. Remote Sens. Environ. 87, 283–294. doi: 10.1016/S0034-4257(03)00185-8
Sun Z.-Q., Sun T. (2020). The impact of multi-dimensional urbanization on China’s carbon emissions Based on the spatial spillover effect. Polish J. Environ. Stud. 29, 3317–3327. doi: 10.15244/pjoes/114508
Tian Y., Yin Y. (2022). Re-estimation of China’s agricultural carbon emissions: Basic status, dynamic evolution, and spatial spillover effects. Chin. Rural Economy 447, 104–127. https://kns.cnki.net/kcms/detail/11.1262.F.20220414.1128.010.html.
Ueyama M., Ando T. (2016). Diurnal, weekly, seasonal, and spatial variabilities in carbon dioxide flux in different urban landscapes in Sakai, Japan. Atmospheric Chem. Phys. 16, 14727–14740. doi: 10.5194/acp-16-14727-2016
Wu R., Xie Z. (2020). Identifying the impacts of income inequality on CO2 emissions: Empirical evidences from OECD countries and non-OECD countries. J. cleaner production 277, 123858. doi: 10.1016/j.jclepro.2020.123858
Wu R., Tan Z., Lin B. (2023). Does carbon emission trading scheme really improve the CO2 emission efficiency? Evidence from China's iron and steel industry. Energy 277, 127743. doi: 10.1016/j.energy.2023.127743
Xu C. (2023). Towards balanced low-carbon development: Driver and complex network of urban-rural energy-carbon performance gap in China. Appl. Energy 333, 120663. doi: 10.1016/j.apenergy.2023.120663
Xu X. (2023). Identifying the impact of industrial agglomeration on China’s carbon emissions based on the spatial econometric analysis. J. Environ. Public Health, 2023. doi: 10.1155/2023/4354068
Yuan H., Liu Y., Hu S., Feng Y. (2019). Does industrial agglomeration exacerbate environmental pollution? — A perspective based on foreign direct investment. Resour. Environ. Yangtze Basin 28 (04). doi: 10.3389/fpubh.2021.711033
Zeng S., Jin G., Tan K., Liu X. (2023). Can low-carbon city construction reduce carbon intensity? Empirical evidence from low-carbon city pilot policy in China. J. Environ. Manage. 332, 117363. doi: 10.1016/j.jenvman.2023.117363
Zhang S., Kharrazi A., Yu Y., Ren H., Hong L., Ma T. (2021). What causes spatial carbon inequality? Evidence from China’s Yangtze River economic belt. Ecol. Indic. 121, 107129. doi: 10.1016/j.ecolind.2020.107129
Zhang Z., Zhang T., Feng D. (2022). Regional differences, dynamic evolution, and convergence of carbon emission intensity in China. J. Quantitative Technological Economics 39 (04), 67–87. doi: 10.13653/j.cnki.jqte.2022.04.001
Keywords: climate governance, emissions inequality, Theil Index, spatio-temporal evolution, carbon neutral, spatial econometrics
Citation: Wei J, Hu R, Li Y and Shen Y (2024) Regional disparities, dynamic evolution, and spatial spillover effects of urban-rural carbon emission inequality in China. Front. Ecol. Evol. 12:1309500. doi: 10.3389/fevo.2024.1309500
Received: 08 October 2023; Accepted: 14 February 2024;
Published: 01 March 2024.
Edited by:
Guangdong Wu, Chongqing University, ChinaReviewed by:
Jiawei Liu, Nantong University, ChinaJin Hu, Guizhou University of Finance and Economics, China
Yubo Zhao, Henan University of Economic and Law, China
Copyright © 2024 Wei, Hu, Li and Shen. This is an open-access article distributed under the terms of the Creative Commons Attribution License (CC BY). The use, distribution or reproduction in other forums is permitted, provided the original author(s) and the copyright owner(s) are credited and that the original publication in this journal is cited, in accordance with accepted academic practice. No use, distribution or reproduction is permitted which does not comply with these terms.
*Correspondence: Ridong Hu, cmlkb25naHVfaHF1QDE2My5jb20=; Yanhua Li, bHloMTk5ODIwMjFAMTYzLmNvbQ==