 Beulah H. Garner1,2,3*†
 Thomas J. Creedy2,4,5Elizabeth L. Allan6
 Robyn Crowther6Elizabeth Devenish6
 Phaedra Kokkini6
 Laurence Livermore6
 Krisztina Lohonya6Nicola Lowndes6Peter Wing6
 Alfried P. Vogler1,2
- 1Department of Life Science, Imperial College London, Ascot, United Kingdom
- 2Research Group, Natural History Museum, London, United Kingdom
- 3Collections Group, Natural History Museum, London, United Kingdom
- 4Science Innovation Platforms, Natural History Museum, London, United Kingdom
- 5Centre for Environmental Policy, Imperial College London, London, United Kingdom
- 6Digital, Data and Informatics, Natural History Museum, London, United Kingdom
Introduction: Historic museum collections hold a wealth of biodiversity data that are essential to our understanding of the rapidly changing natural world. Novel curatorial practices are needed to extract and digitise these data, especially for the innumerable pinned insects whose collecting information is held on small labels.
Methods: We piloted semi-automated specimen imaging and digitisation of specimen labels for a collection of ~29,000 pinned insects of ground beetles (Carabidae: Lebiinae) held at the Natural History Museum, London. Raw transcription data were curated against literature sources and non-digital collection records. The primary data were subjected to statistical analyses to infer trends in collection activities and descriptive taxonomy over the past two centuries.
Results: This work produced research-ready digitised records for 2,546 species (40% of known species of Lebiinae). Label information was available on geography in 91% of identified specimens, and the time of collection in 39.8% of specimens and could be approximated for nearly all specimens. Label data revealed the great age of this collection (average age 91.4 years) and the peak period of specimen acquisition between 1880 and 1930, with little differences among continents. Specimen acquisition declined greatly after about 1950. Early detected species generally were present in numerous specimens but were missing records from recent decades, while more recently acquired species (after 1950) were represented mostly by singleton specimens only. The slowing collection growth was mirrored by the decreasing rate of species description, which was affected by huge time lags of several decades to formal description after the initial specimen acquisition.
Discussion: Historic label information provides a unique resource for assessing the state of biodiversity backwards to pre-industrial times. Many species held in historical collections especially from tropical super-diverse areas may not be discovered ever again, and if they do, their recognition requires access to digital resources and more complete levels of species description. A final challenge is to link the historical specimens to contemporary collections that are mostly conducted with mechanical trapping of specimens and DNA-based species recognition.
1 Introduction
An abundance of biodiversity information remains locked up on the data labels of the possibly 2 billion specimens in natural history museums worldwide (Hedrick et al., 2020). Accumulated over decades and even centuries, and across all regions of the world, museum collections provide an essential record of species diversity and distributions (Lohonya et al., 2022). The label information originally obtained from specimens deposited in natural history collections has become the fundamental resource for species catalogues and global maps of biodiversity. As such, they are the basis for studies into taxonomy, diversity, temporality, distribution, species abundance, and ecology, and frequently they remain the only verifiable data source on native distributions of species (Page et al., 2015). Many records precede the time of urbanisation, agriculture, deforestation, human population growth and other pressures on natural ecosystems at the collecting sites. Thus, the abundance of label information is a huge trove of information on the biology, biogeography and recent history of species, which is a unique source of long-term global change data (Mantle et al., 2012; Kharouba et al., 2018; Popov et al., 2021; Wilson et al., 2023).
However, at the current stage only a small proportion of specimen information held in natural history collections is available in digital form (Page et al., 2015), and although this is increasing with modernised workflows, a recent estimate still suggests that at least 85% of existing specimen data remain locked up in the labels attached to specimens or in physical registers that are not digitally available (Walton et al., 2020). This issue is particularly pressing in insects which represent the largest proportion of specimens in the world’s natural history collections (Johnson et al., 2023). As manual procedures for transferring this information are labour intensive, automated methods of label capture and provision of digital access have become peremptory. Thus, broad scale specimen digitisation is the next iteration of the curatorial process in the current age of rapidly advancing computational and engineering solutions applied to the study of museum collections. At the same time, direct access to the specimens remains critical for detailed taxonomic work and needs to be improved in many historical collections lacking a comprehensive catalogue.
Capturing data from pinned insect specimen labels is a practical challenge because of the difficulties of reading labels held on a pin under a specimen that partly or fully obscures the visibility (Tegelberg et al., 2014; Wu et al., 2019), in particular if multiple labels are used on a single pin. Techniques are therefore required for imaging of specimen labels without the need to remove them from the pins. For example, a multi-camera imaging system, known as ALICE (Angled Label Image Capture and Extraction) can capture angled images of the specimen labels, which enables data extraction in situ on the pin (Price et al., 2018; Dupont and Price, 2019). This imaging approach accelerates data capture and minimises handling of the collections, reducing the potential of damaging specimens and their labels.
As methods for automated data capture are deployed more widely, the utility of the resulting data compilation depends on the correct identification of specimens, which ultimately decides how the information is collated around a species (Linnean) name. While numerous specimens in natural history collections remain unidentified, in particular for tropical groups, a few of the world’s major natural history collections hold large numbers of type specimens and otherwise well curated specimens that have been the focus of taxonomic experts. These collections may constitute the core of the digitised specimen information and thus the foundation for species catalogues and biodiversity informatics. However, this requires that these collections are an adequate representation of diversity in nature, including geographic and taxonomic broad coverage. The composition and possible biases of a collection partly depend on the sociopolitical and historical factors that would determine the type of collecting activities as well as the time frame during which the collections were acquired. For example, the collection of the Natural History Museum (NHM) studied here is among the earliest and most extensive in the world. Because of its early origins it holds many specimens that represent the oldest preserved record of species and possibly the type specimens, which would make this collection unique as a reference for the taxonomic endeavour in particular groups, while also reflecting the history of taxonomic progress. These old collections also are closest to a time prior to the effects of large-scale anthropogenic loss of biodiversity and thus they may be suitable for studying the impact of global change on species diversity and distribution. However, the utility of the records also depends on the precision and accuracy of the label records, such as the precise location and time of the collecting events, which is compromised in many older records that predate automatic georeferencing.
In this study, we pilot the curation and digitisation of a collection of over 29,000 ground beetle (Carabidae) specimens in the subfamily Lebiinae. The group includes 6331 known species and is currently subdivided into 329 genera (Anichtchenko, 2024). Unlike most carabids the Lebiinae are a primarily arboreal lineage, which are widely distributed especially in tropical ecosystems including the forest canopy (Ober, 2003). Most species are brightly coloured or metallic (Figure 1). They are recognisable by their truncate elytra that leave the apex of the abdomen visible. Some species are widespread general predators, e.g., of chrysomelid beetle eggs and larvae, and thus of interest in pest control (Weber et al., 2006), but others are rare specialists with declining distributions, such as Lebia marginata and Lebia scapularis (Geoffroy in Fourcroy, 1785) not seen in the UK since the 19th century (Lindroth, 1974). Considering recent molecular investigations, the Lebiinae are currently classified as four tribes within the much larger subfamily Harpalinae Bonelli, 1810 sensu lato (Ober and Maddison, 2008).
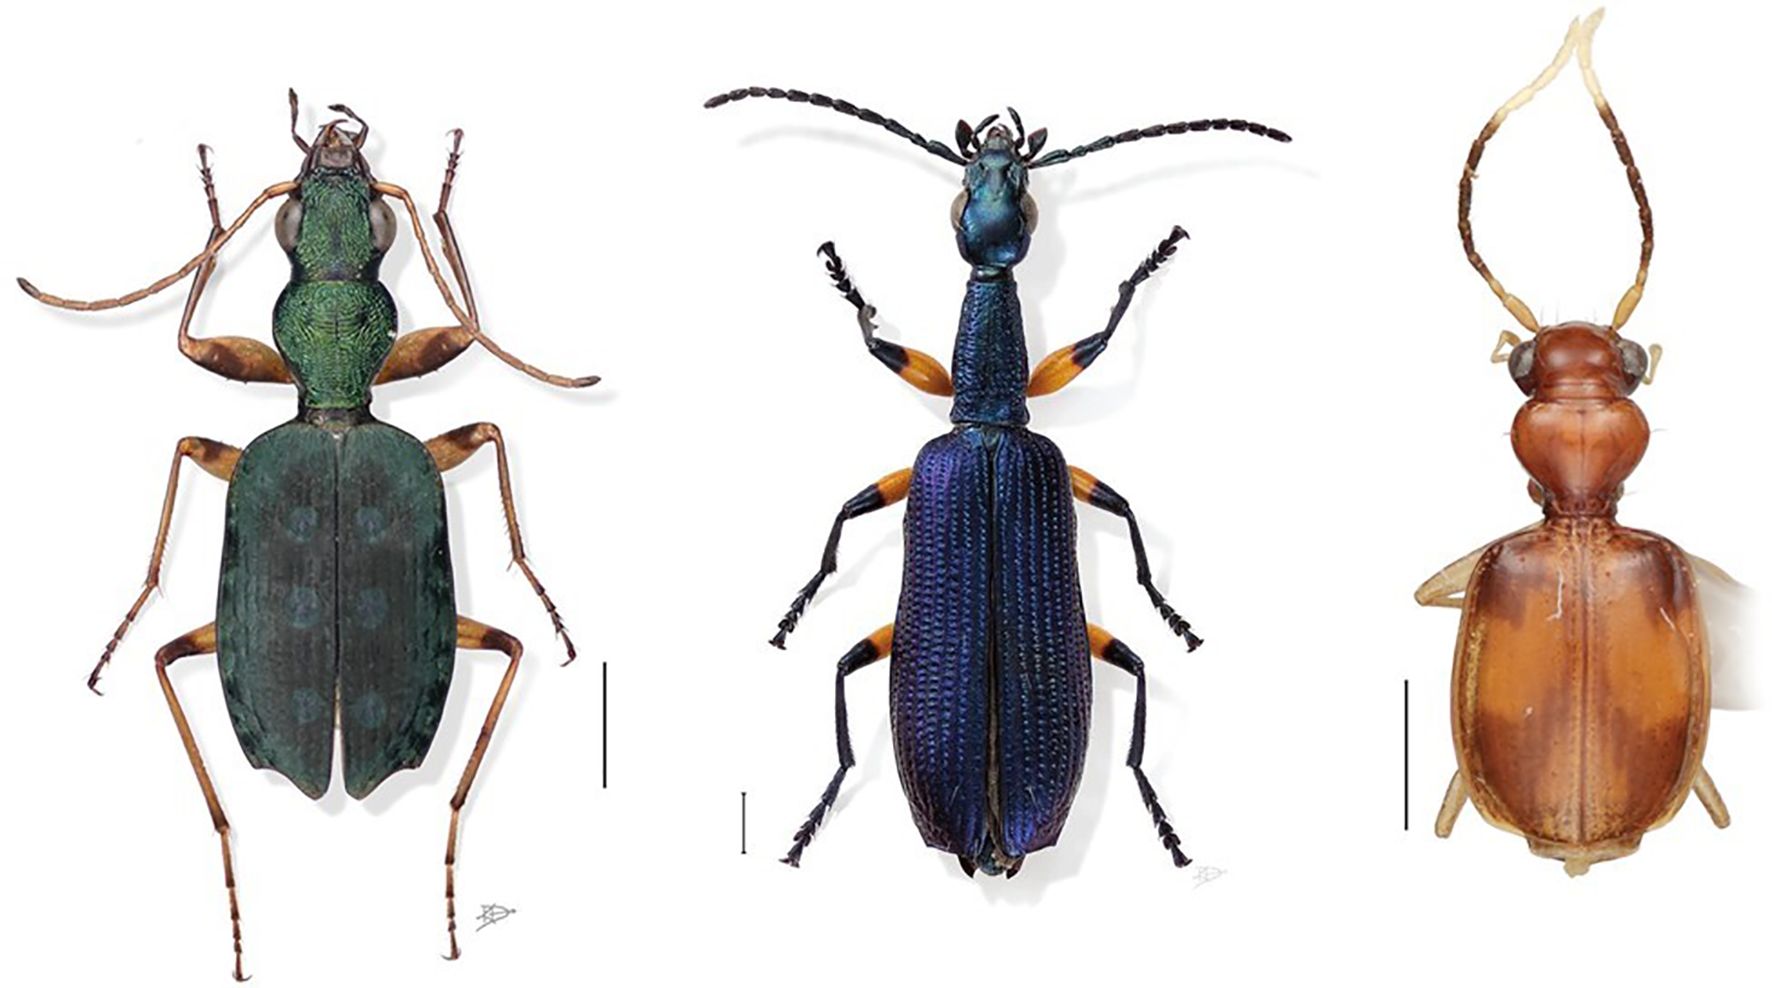
Figure 1 Morphological diversity of the Lebiinae. Habitus images are not to scale. The size range of the Lebiinae is 100 mm (Mormolyce) to 2.5 mm (Microlestes). From left to right, some examples including average size range: Quammenis spectabilis Erwin, 2000, 6.5 mm to 7.0 mm; Agra Grace Erwin, 2010, 5.71–6.1 mm; Asklepia biolat Erwin & Zamorano, 2014, 3.1–3.4 mm. Digital photo illustrations by Karie Darrow. © Terry Erwin, 2000, 2010 and © Erwin & Zamorano, 2014.
The Lebiinae collection is a representative subset of the wider NHM Coleoptera collection, which amounts to over 10 million specimens. The specimens of Lebiinae share provenance with other Coleoptera collecting events accessioned into the NHM collections over time and thus represent a cross-section of data we might expect from the rest of the Coleoptera collection should it be digitised in its entirety. We describe the steps of collection-level curation, specimen and label digitisation, collection data management, and release to public databases. The data were then used to assess the taxonomic, geographic and temporal coverage of the collection, revealing the great value of the collection as a historical record of global biodiversity spanning more than two centuries.
2 Materials and methods
2.1 Pre-digitisation curation workflow
Specimens were processed in a workflow following Nelson et al. (2012) of pre-digitisation curation, specimen imaging and processing, and electronic data capture for databasing, which here was combined with the rehousing of the collection in modern storage drawers (Figure 2). The first step of pre-digitisation curation and staging was to image individually each of the 121 drawers of the Lebiinae collection, providing a digital condition report of the specimens and their historic taxonomic interpretation. Recuration into discrete foam-lined unit trays provided safe, flexible and well-ordered housing for the rapid removal and return of specimens during the digitisation workflow (Supplementary Figure SF1). As part of the recuration process, a label was attached to each specimen with a nine-digit unique identifier (NHMUK) number which is encoded in a machine readable 2D Data Matrix barcode. This creates a digital-ready mirror image of the physical collection. After transcription (below) the specimen was linked to its relevant hierarchical taxonomy string within the museum’s Collection Management System EMu (Electronic Museum; Axiell), referred to throughout as CMS, which holds a curated register of all taxonomic names represented in the NHM’s collection. Individual specimen transcription records followed the data fields of the wider CMS fields developed by the NHM internal data standards.
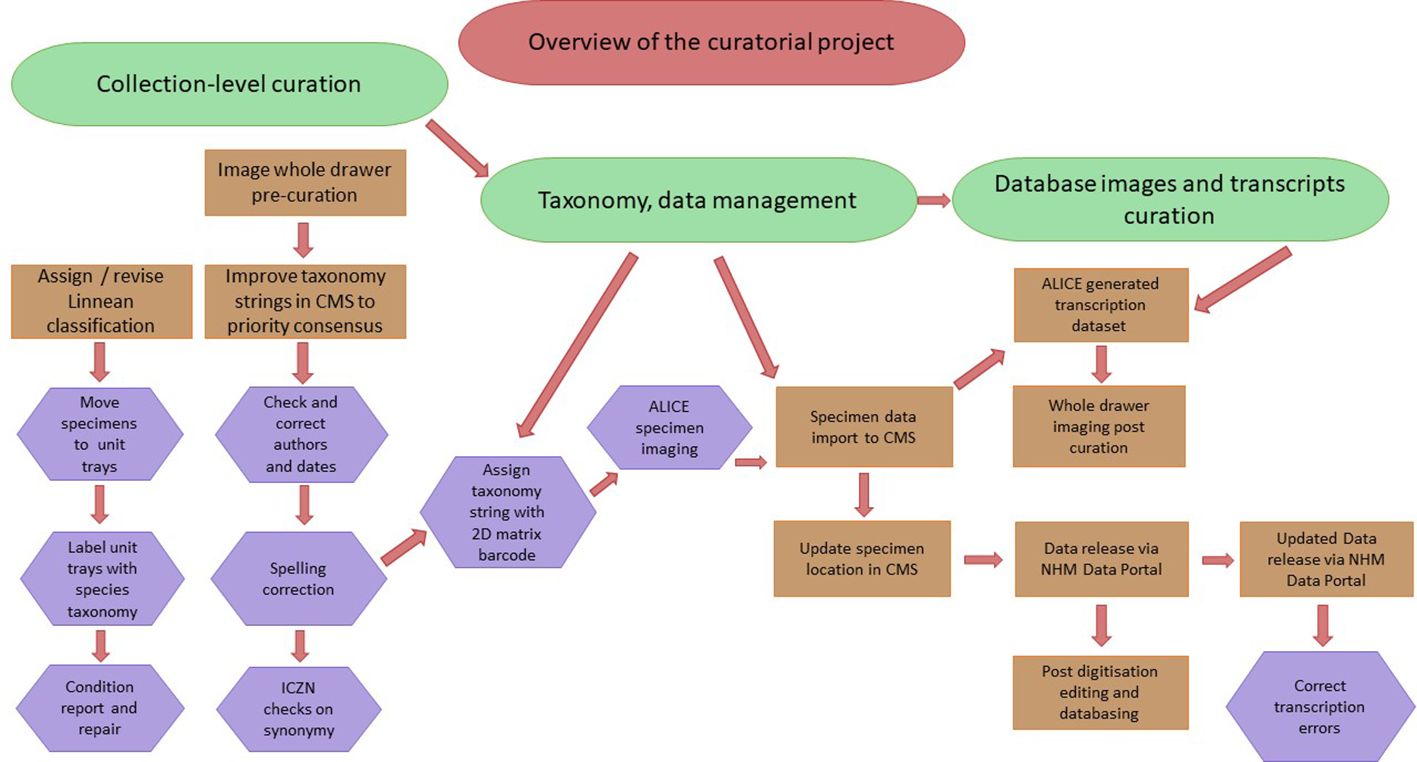
Figure 2 An overview of the curatorial workflow followed in this project, showing the major parts of the process of pre-capture curation, management of the taxonomy database in the CMS, and imaging and integration of collection specimens and data into the CMS and ultimate release into the Data Portal. The project was documented before and after curation and project completion in order to reference the prior location and condition of the specimens as well as record any curatorial errors.
Prior exploration of the collection found that of the 121 drawers, 61 were historic, shallow depth drawers (which did not accommodate the modern pin height). These were replaced with deepened versions. Most of the collection had been pinned into either cork slats (58 drawers) or plastazote (curatorial grade polyethylene foam) slats (11 drawers), or a combination of cork and plastazote slats (20 drawers). The remaining 32 drawers had been partially curated into unit trays. The estimated number of specimens based on counts of a subset of drawers was 30,500. To estimate a project completion date, a timed pre-digitisation workflow, including a condition check, placement and alignment of the labels, unfolding the labels and adding a unique identifier barcode label was employed for 100 specimens of Lasciocera Dejean, 1831, housed in a single drawer and 13 unit trays. This process took 2.5 minutes per specimen amounting to 4 hours, 17 minutes, extrapolating to 21 weeks of full-time recuration for the Lebiinae collection. This did not include the likelihood of encountering specimens requiring repair or repining, as a reality of an historic collection, or resolving taxonomic ambiguities. The ALICE setup across mixed pinned specimens including rehousing and adding a barcode is ~350 specimens per person per day. Without rehousing (as in the Lebiinae) the rate was 472 specimens per person per day. Similar projects (e.g., label removal and documentation data capture) with a single dorsal habitus image have achieved transcription of between 218–236 specimens per person per day in the case of the Pyraloidea (Paterson et al., 2016).
2.2 Imaging of specimens and labels
By employing the ALICE method, imaging of the labels is feasible without the need to remove them from the pin (Figure 3). The imaging workflow required: (1) camera calibration by imaging a calibration square, essential for downstream label transformation; (2) camera automation for the six DSLR cameras to take four angled images of labels and the specimen in dorsal and lateral view; (3) dorsal image to include temporary barcode labels encoding taxonomic and storage location information corresponding to the specimen for automated data extraction from the images (Allan et al., 2019); labels generated from the CMS to ensure a 1:1 match with the collection’s physical specimens; (4) data and unique identifier extraction and bulk renaming of image files using the software BardecodeFiler, followed by bulk processing of the image files using the software XnConvert (Allan et al., 2019); (5) use of ImageJ software to add a 5 mm scale bar on the lateral specimen image. After image capture, record management in a local database was updated for each recurated drawer, and curatorial ambiguities, such as taxonomy label mismatching specimen label identifications were highlighted by the digitisers for resolution by the curator (under ‘Database images and transcription curation’ in Figure 2).
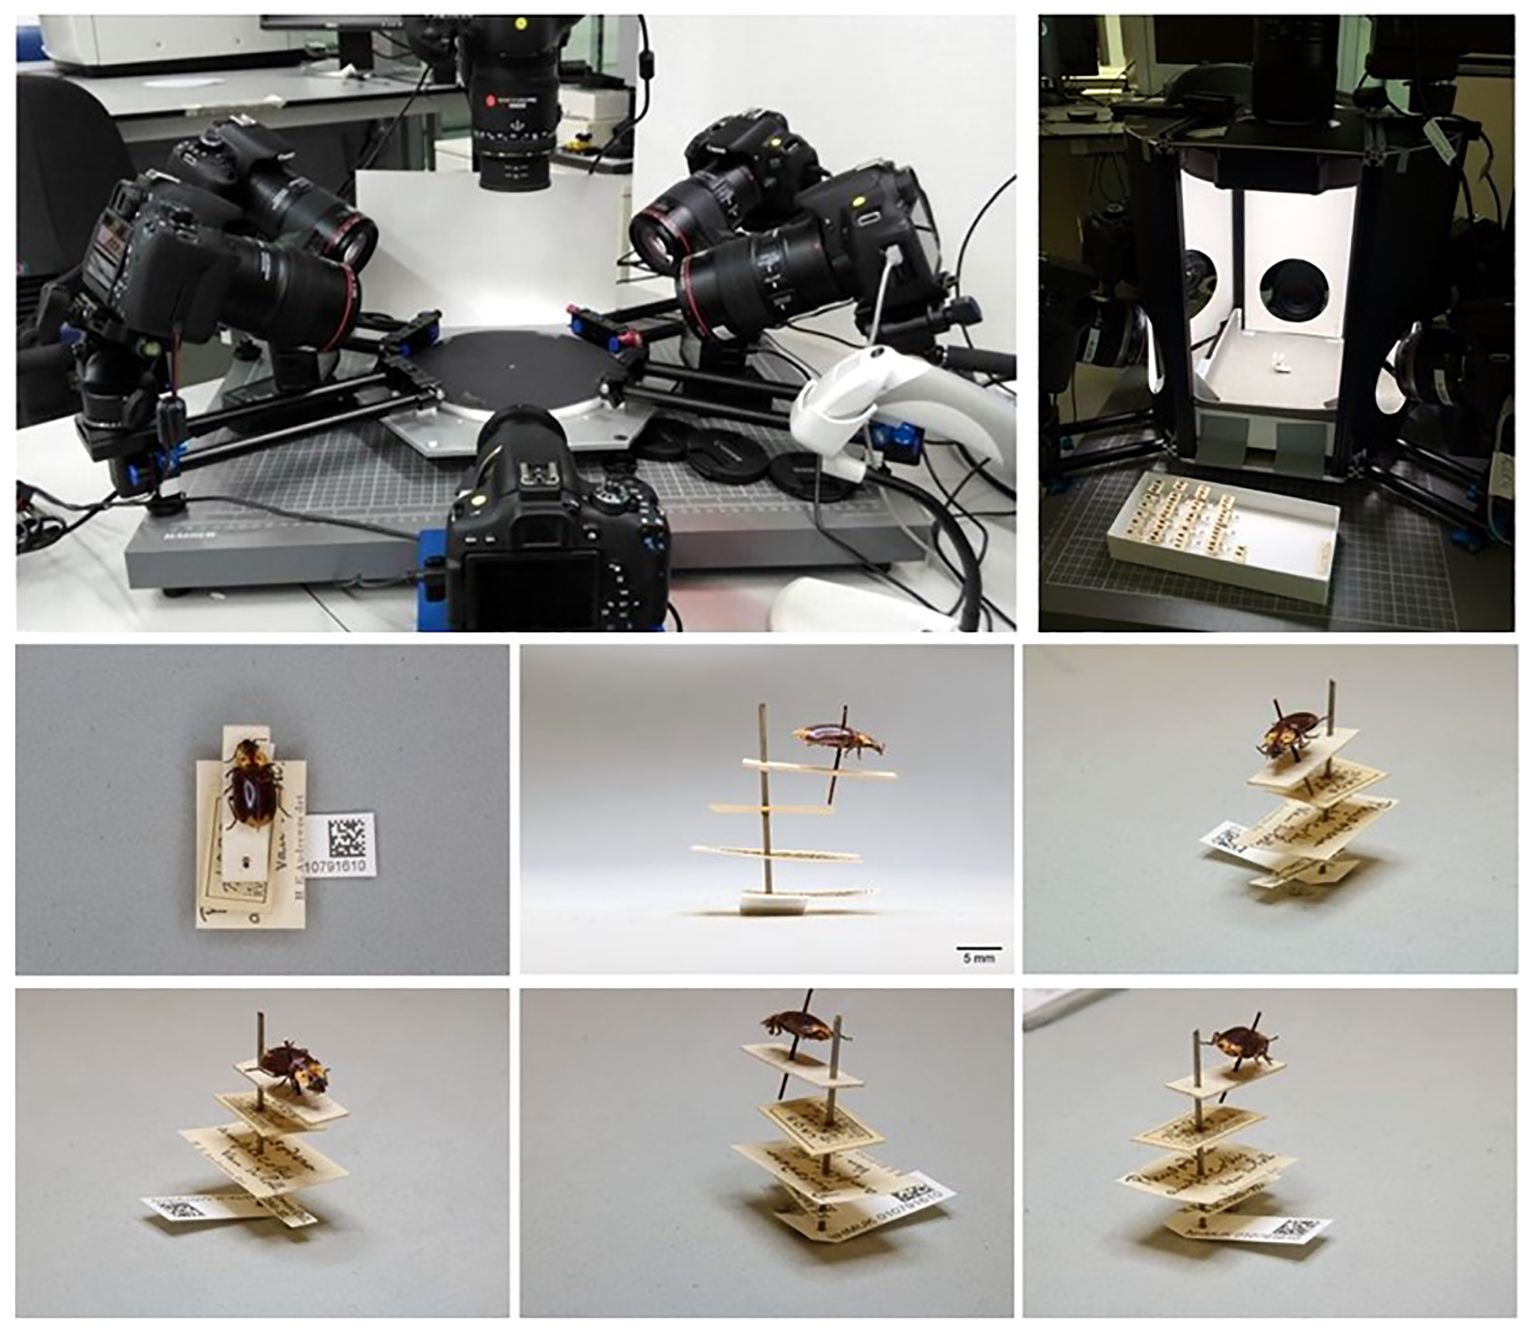
Figure 3 Imaging with the ALICE system. Top panel: The standard operating position of ALICE in situ. Six angled DSLR cameras capture six images from multiple angles to optimise label data capture. Bottom panel: An example of the six images generated by ALICE for a specimen of Physodera amplicollis Neervoort van de Poll, 1889 (NHMUK 010791610). All labels are aligned on the same plane and direction, evenly spaced, with the unique identifier Data Matrix code visible. The images were sufficient to accurately transcribe all available data from the labels.
2.3 Electronic data capture and data curation
Transcription from label images aimed to capture all data to create the most complete information about each specimen. Data quality checks included correcting transcription errors and data improvement by inference from the available data. Label data captured by ALICE, before transformation, was almost always visible. For example, for collecting locality, ‘data illegible’ or ‘not visible’ affected 1% of all records. ‘Data obscured’ for various entries, e.g. a specimen pin placed through label text, affected 2.3% of all records. Examples are given in Supplementary Table ST1. The transcribed labels were parsed into relevant data capture categories according to legibility (Supplementary Material SM1). The data generated here adhere to the technical validation requirements of the Darwin Core (DwC) (Wieczorek et al., 2012). Finally, the data were imported into the CMS for internal information management and to create structured data for release to the NHM Data Portal (Scott et al., 2019), which then allowed public access.
Data quality checks for intellectual content were applied to authors, localities, dates, and taxonomy categories. The catalogue providing the taxonomic reference data for all analysis is provided by Carabidae of the World (Anichtchenko, 2024). Further analysis requiring a downloadable reference dataset was provided by the Catalogue of Life (CatoL) (Bánki et al., 2023). Data were corrected for: (1) Author name abbreviation, multiple spellings (authority names were retrieved from the CMS). (2) Locality abbreviation, multiple spellings, current geopolitical location name; e.g. Rhodesia changed to Zimbabwe. (3) Dates with an incomplete year of collection (classified initially as ambiguous), e.g. a two-digit figure or Roman numeral such as ‘89’ was resolved by ascertaining the century of the collector’s birth and death dates, assessment of label age, the date of the species description, referral to the NHM accession registers (records of acquired or bequeathed collections), or other resources, such as the collector’s archive. In some cases, transcribers confused the collection date with the accession date. (4) The taxonomy follows (Lorenz, 2005). Verbatim names, including manuscript names and unavailable names remained present in the original transcription until the physical specimen can be correctly identified and its taxonomic identity resolved. Synonyms were recorded when the type(s) for the synonymised species was held in the NHM collection, but they should not be considered in the count of valid species represented here. These data were adjusted and are reflected in the total of specimens with usable data. In all cases, recourse to the label images provided efficient visual information of data labels to assess the final database entry. For the specimens without temporal data, we estimated an approximate collecting date based on other information attached to the species. If the collector was known and had collected other specimens with known collection years, we assigned the mean year that collector collected to any of their specimens without collection years. Where the collector was not known, or had no known collection years, we assigned specimens the mean collection year of all other specimens sharing the same accession number, if other specimens shared the same NHM accession number. Where there were no other specimens sharing the same accession number, we assigned the mean collection year of any other specimens accessioned in the same year. This left 200 specimens in the dataset and with other inferred data are flagged in the CMS as inferred without deletions to the original transcribed data.
The taxonomic classification to tribe, subtribe and genus were visualised using Krona plots (Ondov et al., 2011). Exploration of the temporal data was visualised using RStudio vs.4.3.0. For temporal analysis Tidyverse package vs.2.0.0 (Kabacoff, 2022) was used. These data, including inferred categories and corrected for transcription errors are found in Supplementary Material SM2.
3 Results
3.1 Specimen curation and database records
The overarching deliverable of specimen recuration and digitisation was an electronically accessible data set of specimen and label images amounting to altogether 143,286 images from 23,881 specimens with relevant collecting data and identifications to at least genus. This figure does not include additional images of 5,935 unidentified ‘accession’ specimens that were newly sorted into tribes. Members of the tribe Perigonini were not incorporated, as they had not been considered part of Lebiinae in earlier taxonomic curation and were consequently placed outside of the focal collection. Another artefact of historic curation was the inclusion of 182 specimens of the subfamily Ctenodactylinae, which had been placed within the sequence of Lebiinae. These were imaged and transcribed but were omitted from the downstream data compilation. All specimens were transferred to modern unit trays and provided with a machine-readable barcode (see Supplementary Figure SF1 for a comparison with the historic collection format).
From the original set of fully digitised, identified specimens, we retained 23,837 records whose labels were clearly legible. The specimens identified to species level represented 2546 out of 6331 valid species worldwide, amounting to 40% overall taxonomic coverage. This species count was imprecise given ambiguous species records which remained unresolved, such as unpublished manuscript names, erroneous generic combinations, and historical naming artefacts. Under the Data Validity and Availability fields in the CMS, there were 14 invalid manuscript names, 38 unavailable names, and 55 unknown names. A total of 819 specimens designated as synonyms were found representing synonymy for priority names already represented by specimens in the NHM collection. These names were checked against the current literature for any changes in priority. Subsequently 120 species names were elevated to priority status and these changes recorded in the CMS. The transcribed and catalogued NHM collection data were ingested by the Global Biodiversity Information Facility (GBIF), the pre-eminent international data infrastructure that provides open access to information of biodiversity on Earth, via the NHM Data Portal. After these additions, GBIF held 32,864 records for the Lebiinae (GBIF accessed 06/05/2024), of which 28,890 (87.9%) were from the NHM specimen level transcription (including the unidentified records) (Table 1). GBIF entries include data from nine other institutions, but each contributed no more than a few hundred specimens, except for the University of Arizona with 2,443 specimens (Supplementary Table ST2)
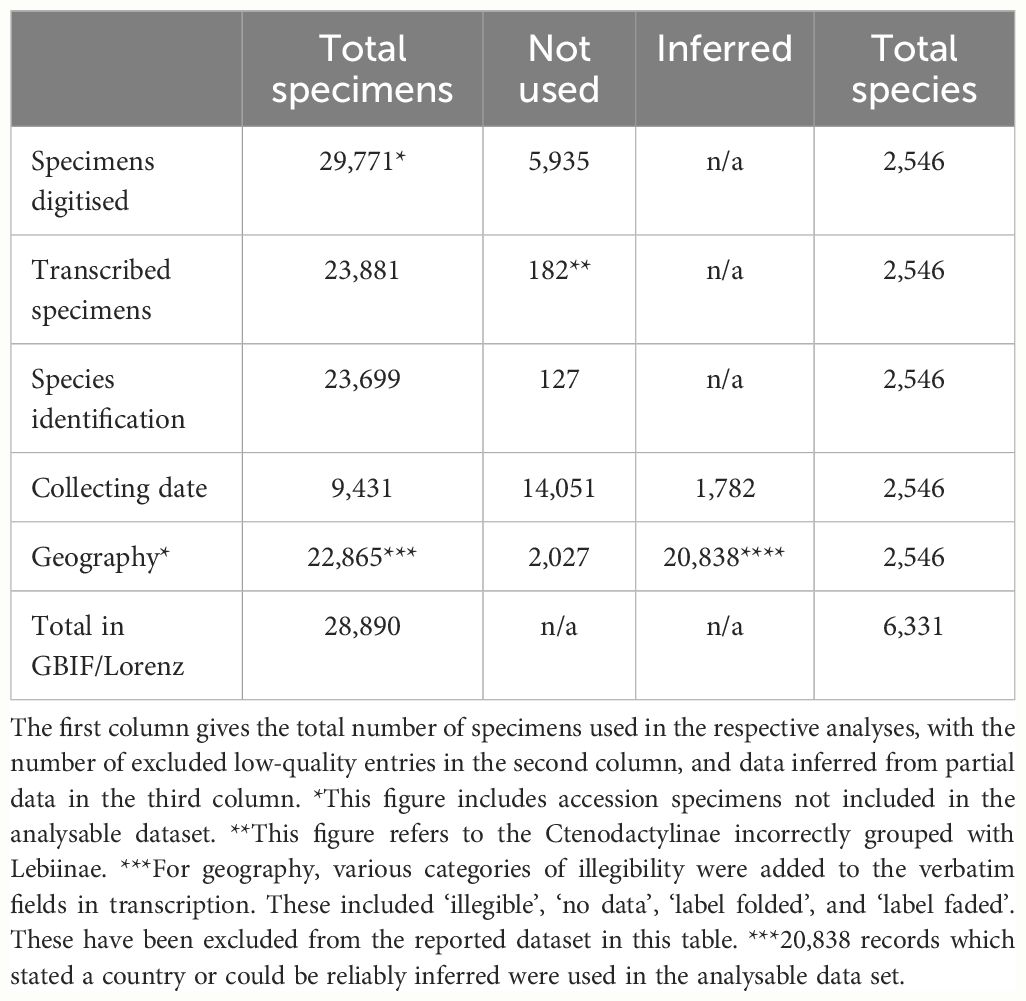
Table 1 The number of specimens included in the analysis of species count, collecting data and geographic distributions.
At higher levels, the collection contained 224 of the world's 329 genera (68%). The tribe Lebiini stands out with 246 genera (Anichtchenko, 2024), of which the NHM collection has representatives of 166 genera (67%) (Table 2). These numbers were much smaller for tribes Cyclosomini and Odacanthini (and no data were collected for Perigonini) (Table 2; Figure 4). Imbalanced taxonomic representation persisted at lower hierarchical levels; for example, 69% of all Lebiinae genera were found within the tribe Lebiini, and of those, some 18% are grouped in the subtribe Lebiina, which itself was dominated by the genus Lebia (11% of all species). Similar patterns of dominance were evident in other tribes and subtribes (Figure 4). However, these discrepancies in species representation were a good reflection of the differences in known species richness in these groups, including the genus Lebia which comprises 12% of the known species of Lebiinae (Table 2).
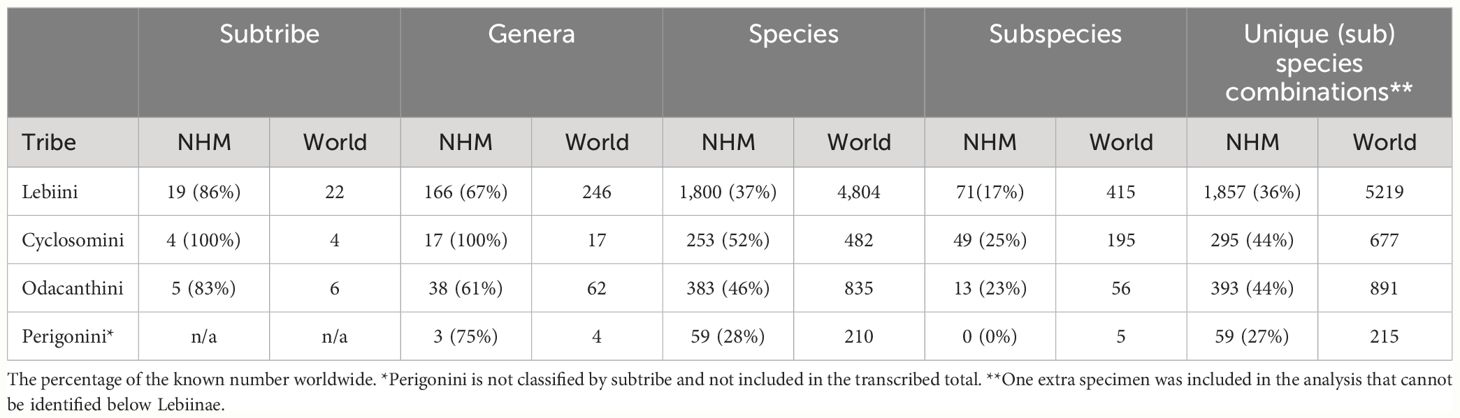
Table 2 The number of representatives and percentage of known number of species, per taxonomic rank present in the NHM collection, compared to the known number worldwide.
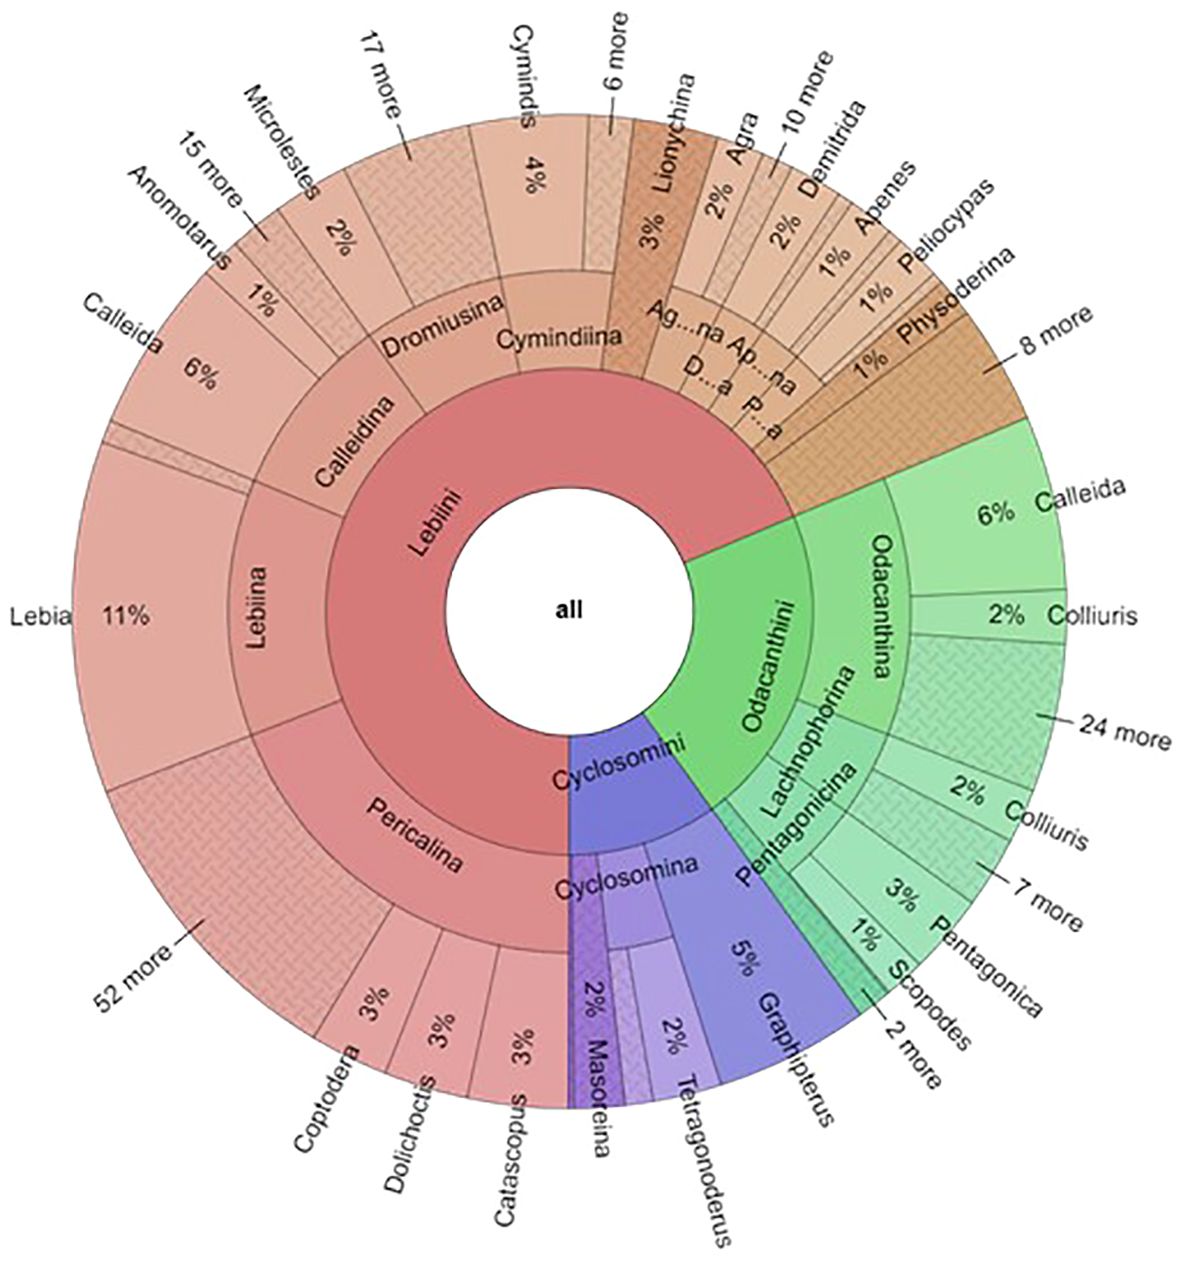
Figure 4 The proportion of the Lebiinae records by tribe, subtribe and genera in the NHM collection. For the fully operable version, see FigShare doi: 10.6084/m9.figshare.26151412.
3.2 Specimen information from label transcriptions
Specimen label data were extracted for all fully identified specimens. Out of the 23,837 records with clearly readable labels, a subset of 127 specimens was unusable because of lack of data, for example due to uninformative entries, obscured image data, or no or incomplete accession numbers unusable for data inference. This reduced the available dataset to 23,710 records for the analysis of geographic origin, time of collection, and status as type specimen.
A surprisingly large total of 14,051 specimen records presented with no collecting date information, which left a total of 8,110 specimens for the analysis, including 1,782 specimens with a date inferred from partial data. Specimen records transcribed with a partial year record, e.g., no indicated century, totalled 1545, of which the date could be inferred in 1,321 cases. An unexpected curatorial anomaly of 24 specimen records were found with accession year earlier than the collection year. This was attributed to using old labels for newly acquired specimens (by the same collector). The final number of specimens with full and inferred collecting dates was 9,431 specimens (39.8% of fully identified records) (Table 1). The timeline of collection showed huge variation in the number of specimen records per year but with a broad peak in the early 20th century, and a downwards trend towards more recent years (Figure 5A). By decade, both the specimen and species records demonstrated limited collecting activity before 1880, with a peak in the first three decades of the 20th century and a comparatively low level until the 1980s, after which the records declined further. Specimen records closely mirrored the timeline at the species level, with a broadly 2–3 times higher number of specimens collected than the species represented, i.e. the number of records per species was low on average (Figure 5B).
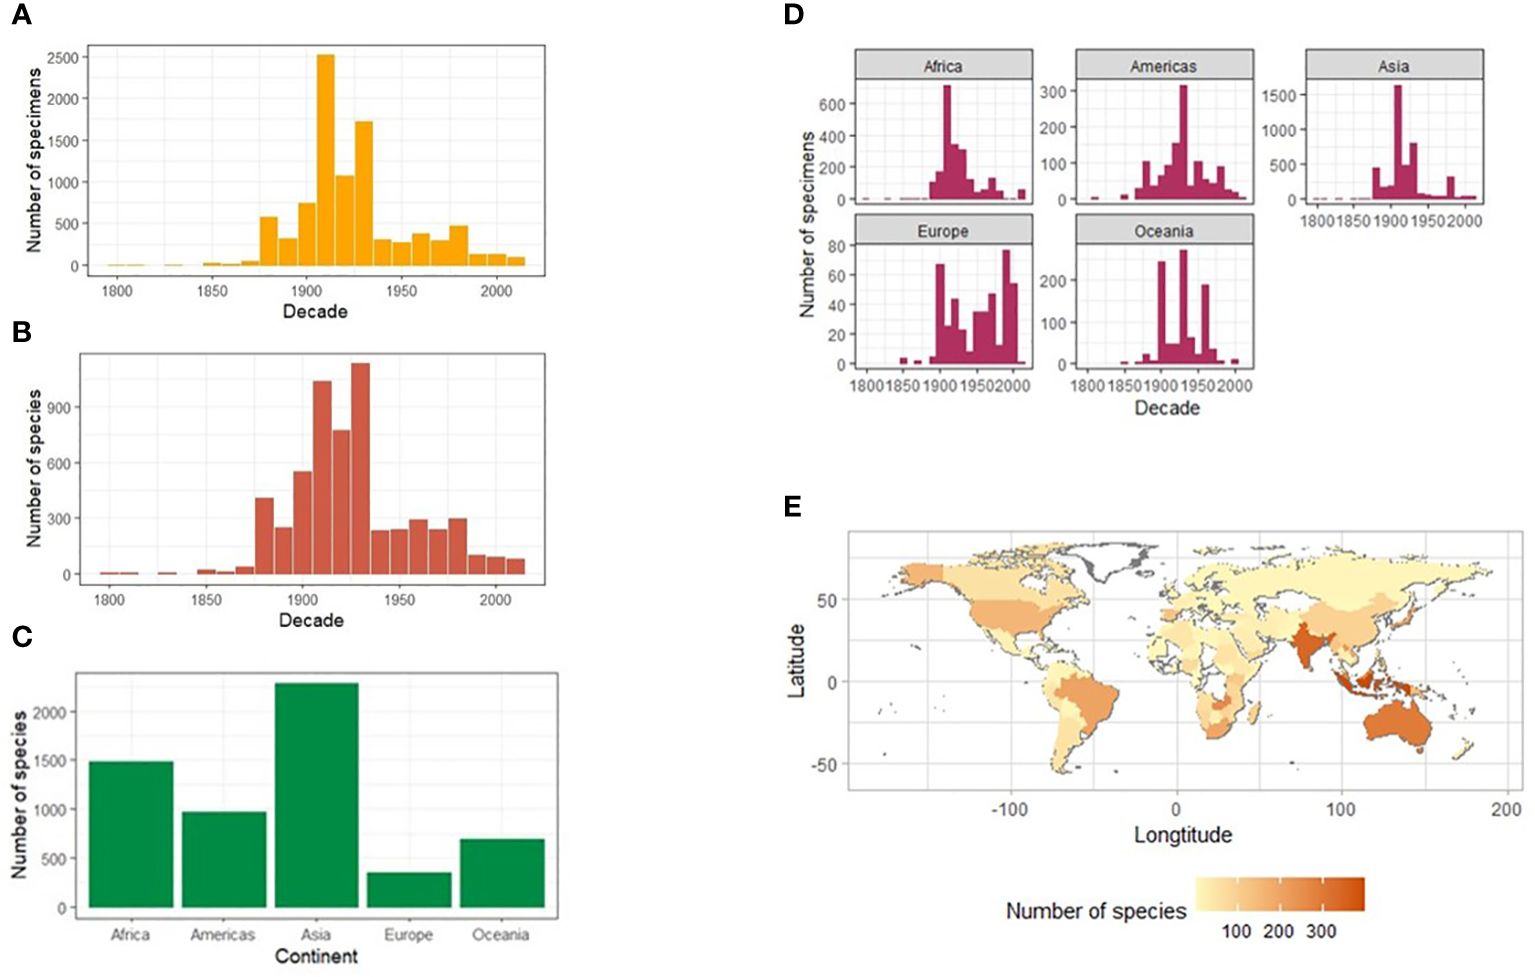
Figure 5 Timeline and geographic composition of the NHM collection of Lebiinae. The number of Lebiinae specimens (A) and species (B) collected worldwide per year binned for each decade between 1800 and 2020, and separately for each continent (C). The number of species per continent (D) and a heatmap showing the number of species of Lebiinae by country and continent (E).
A total of 22,865 of the identified specimens included labels with geographic data, of which 20,838 records (91%) stated a country or the country could be reliably inferred. For 818 specimens there was no geographic data on the specimen labels, which were thus recorded as ‘No data’ contributing to a larger unusable data set of 2027 records (Table 1). The most specimens and species were collected from Asia, followed by Africa, the Americas, Australasia, and Europe (Figures 5C, D). By country, India (the Indian subcontinent) was the most collected region (Figure 5E). A total of 146 collectors took specimens from the Indian subcontinent between 1894–1947. After 1947, when India became independent from British rule, there were only eight collecting records (with dates) representing five possible collectors. More widely across Asia, 22 out of 48 recognised countries were represented in the dataset. In Africa, as the second-most sampled continent, specimens were represented by 21 of its 54 recognised countries. South and East Africa were the most widely collected regions reflecting the political accessibility of those areas throughout the 1800s when most of the collection was obtained. For South America, all 13 countries were represented in the dataset, led by Brazil. Collecting bias was evident due to records from Guatemala and Mexico from the Biologia Centrali Americana (BCA) expeditions to Central America, including many type specimens (Table 3 and Supplementary Figure SF2). Oceania was represented by nine of the 14 recognised countries throughout the SW Pacific, with by far the most records from Australia. In North America, high numbers of specimens in the USA were collected over a wide timeframe. They included 178 species and 17 subspecies of Lebiinae and their high coverage may be due to the work of entomological societies of historic origin, e.g. the collection of Percy Gardner Bolster (Darlington and Others, 1933) (represented in the NHM collection), targeted collecting for introductions and invasive (insect) species, and the relatively large land mass. Finally, the European continent was represented by 35 of its 44 recognised countries, with Spain, France, Germany, and Russia respectively represented by the most records.
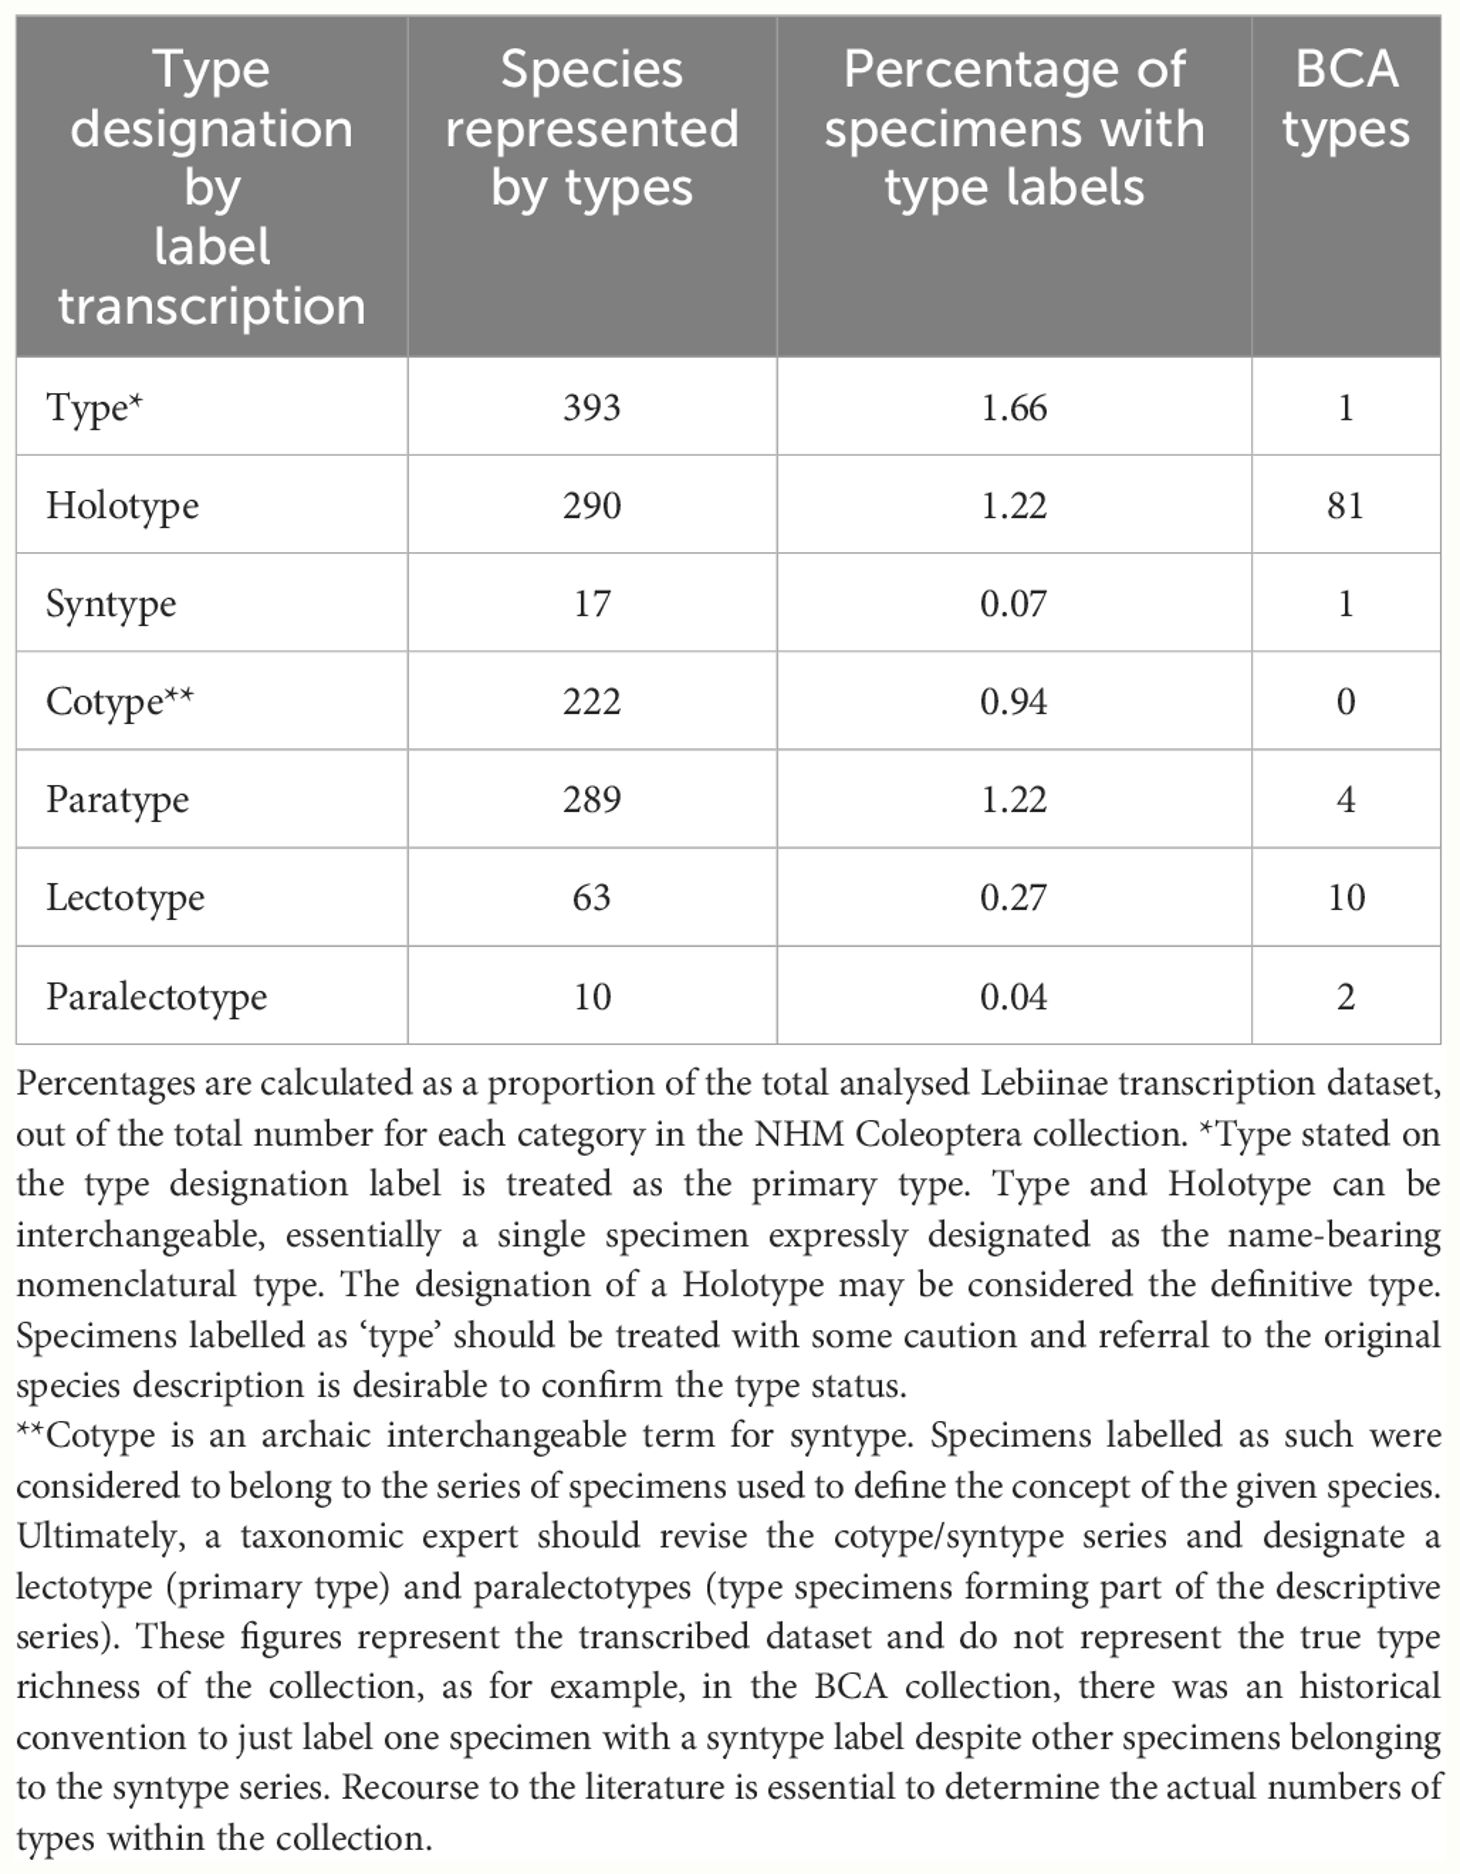
Table 3 The number and category of Lebiinae type designations in the NHMUK collection.
When broken down by continent, the global collecting timeline was largely similar for each area, with a slightly earlier onset of collecting activity in Asia and the Americas, and again the trajectory of specimen records closely resembled the species records in each continent (Figure 5D). However, there were distinct peaks of collecting in Asia (1910s), Africa (1890s) and the Americas (1910s). At the decadal scale there were no discernible effect of the 1st and 2nd World Wars on collecting effort worldwide and 1918 saw the largest collecting activity in a single year overall. The period between 1900 and 1950 remained the most prolific for collecting across all continents, and Asia and Africa were the most intensely collected continents during this period.
3.3 Lebiinae type specimens in the NHM collection
The type status of the Lebiinae specimens was assessed from the designation on the specimen labels. Primary types were designated as holotype, lectotype, type and syntype. We included syntypes because we assumed an eventual primary type designation within the syntype series. The total number of primary types (here the sum of ‘type’, ‘holotype’ and ‘lectotype’) is 746 which accounts for 12% of the world’s 6,331 described species (Table 3). The type designations included several rarely used terms which constituted a high proportion of the NHM collection overall. The BCA collection alone represented 13% of the total number of holotypes (Table 3). In several incidences only the primary type was assigned (labelled) despite a series of paratypes being associated with the original description. Also, syntype series had not always been digitally catalogued as types because in many cases they require recourse to the original literature for confirmation of type status.
3.4 Collection records and the history of species description
In general practice of taxonomy, species names are listed together with the describing author name(s) and the date of species description, which provided a timeline of the taxonomic history of the Lebiinae. Out of the 2,546 species in the collection, 2,431 species had known description dates, represented by 21,901 specimens. We used this information to assess whether species with an early description date were represented by a larger number of specimens in the collection, possibly indicating greater abundance in nature and thus greater chance of early discovery (Figure 6). The earliest descriptive date was 1758 which is the year of Linnaeus’ Systema Naturae. Only a few further species were added in the early period to about 1825, but they were generally present in high numbers. Examples of widely distributed species collected, represented by numerous specimens include Cymindis vaporariorum L., Demetrias atricapillus L. and Dromius quadrimaculatus L. Each of these species were and still are readily collectible throughout the Palaearctic and consequently were contributed to the collection by European collectors at a time when exploration in the Old and New Worlds had yet to begin in earnest. This early period was followed by rapid acceleration of species descriptions from about 1825 coincident with Empire explorations (Figure 6). Descriptive efforts were particularly dominant in the second half of the 19th century and slightly beyond, after which the accumulation of described species levels off, especially after 1950 (Supplementary Figure SF3; Figure 6). Throughout, the mean number of specimens representing a species decreased steadily, and most species described throughout the 20th century had less than 10 representatives. A total of 694 species were represented by a single specimen only, and using a cut-off for those species collected before and after 1950 the number of singleton and non-singleton species shifted significantly (χ2 = 88.56, p < 0.0001) (Supplementary Figure SF3).
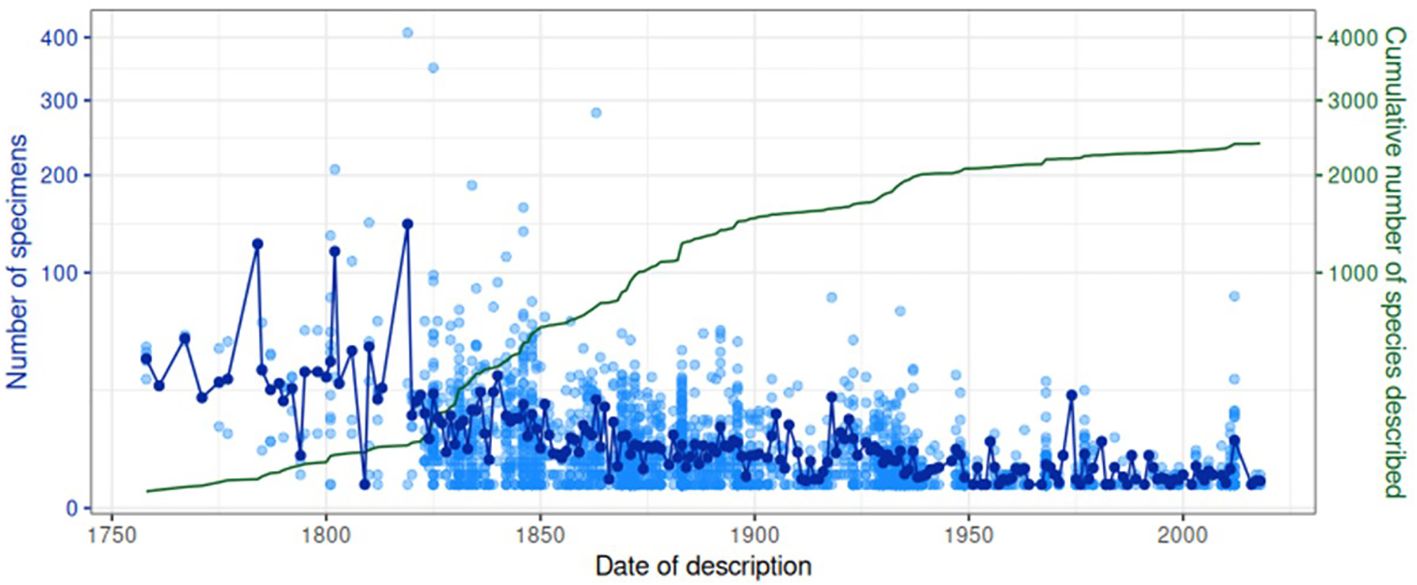
Figure 6 Temporal patterns in collection and description. Each light blue unfilled point is a (sub) species, showing the number of specimens in the collection for that (sub) species against the date of its description. Dark blue points represent the mean of these values for a given year. The green line shows the cumulative number of (sub) species described on or before a given year.
The timeline of specimen accumulation was further investigated by recording the first and last collection year for each representative of each species. Of the 22,734 specimens with a species identification and description date in the dataset, only 8,993 had a known collection year. (This number is slightly lower than the above 9,341 specimens with a collection date because here we only used fully identified specimens). For the remainder, we estimated the collection date (see Methods and Material) based on the mean time of collector activity (10,467 specimens), mean time of collections associated with the same NHM accession number (3,035 specimens), or the mean collection year of any other specimens accessioned in the same year (199 specimens). After this process, approximate collection years were assigned to all but 40 specimens. We then counted the number of specimens for each species and plotted the most recent collection record (last year of collection) against the first date of collection. The plots showed a striking pattern of discovery and rediscovery. Plotted separately for each continent (Figure 7) or biogeographic realm (Supplementary Figure SF4) based on collection country, the great majority of species had a first collecting date during the 1850–1950 range. Their date of last detection was mainly shifted to the 1940–1980 range, with a few later detections in particular in Asia, Africa and Europe (Figure 7) or the Indomalayan, Afrotropical and Palaearctic regions (Supplementary Figure SF4), but a general drop especially in the past 2–3 decades.
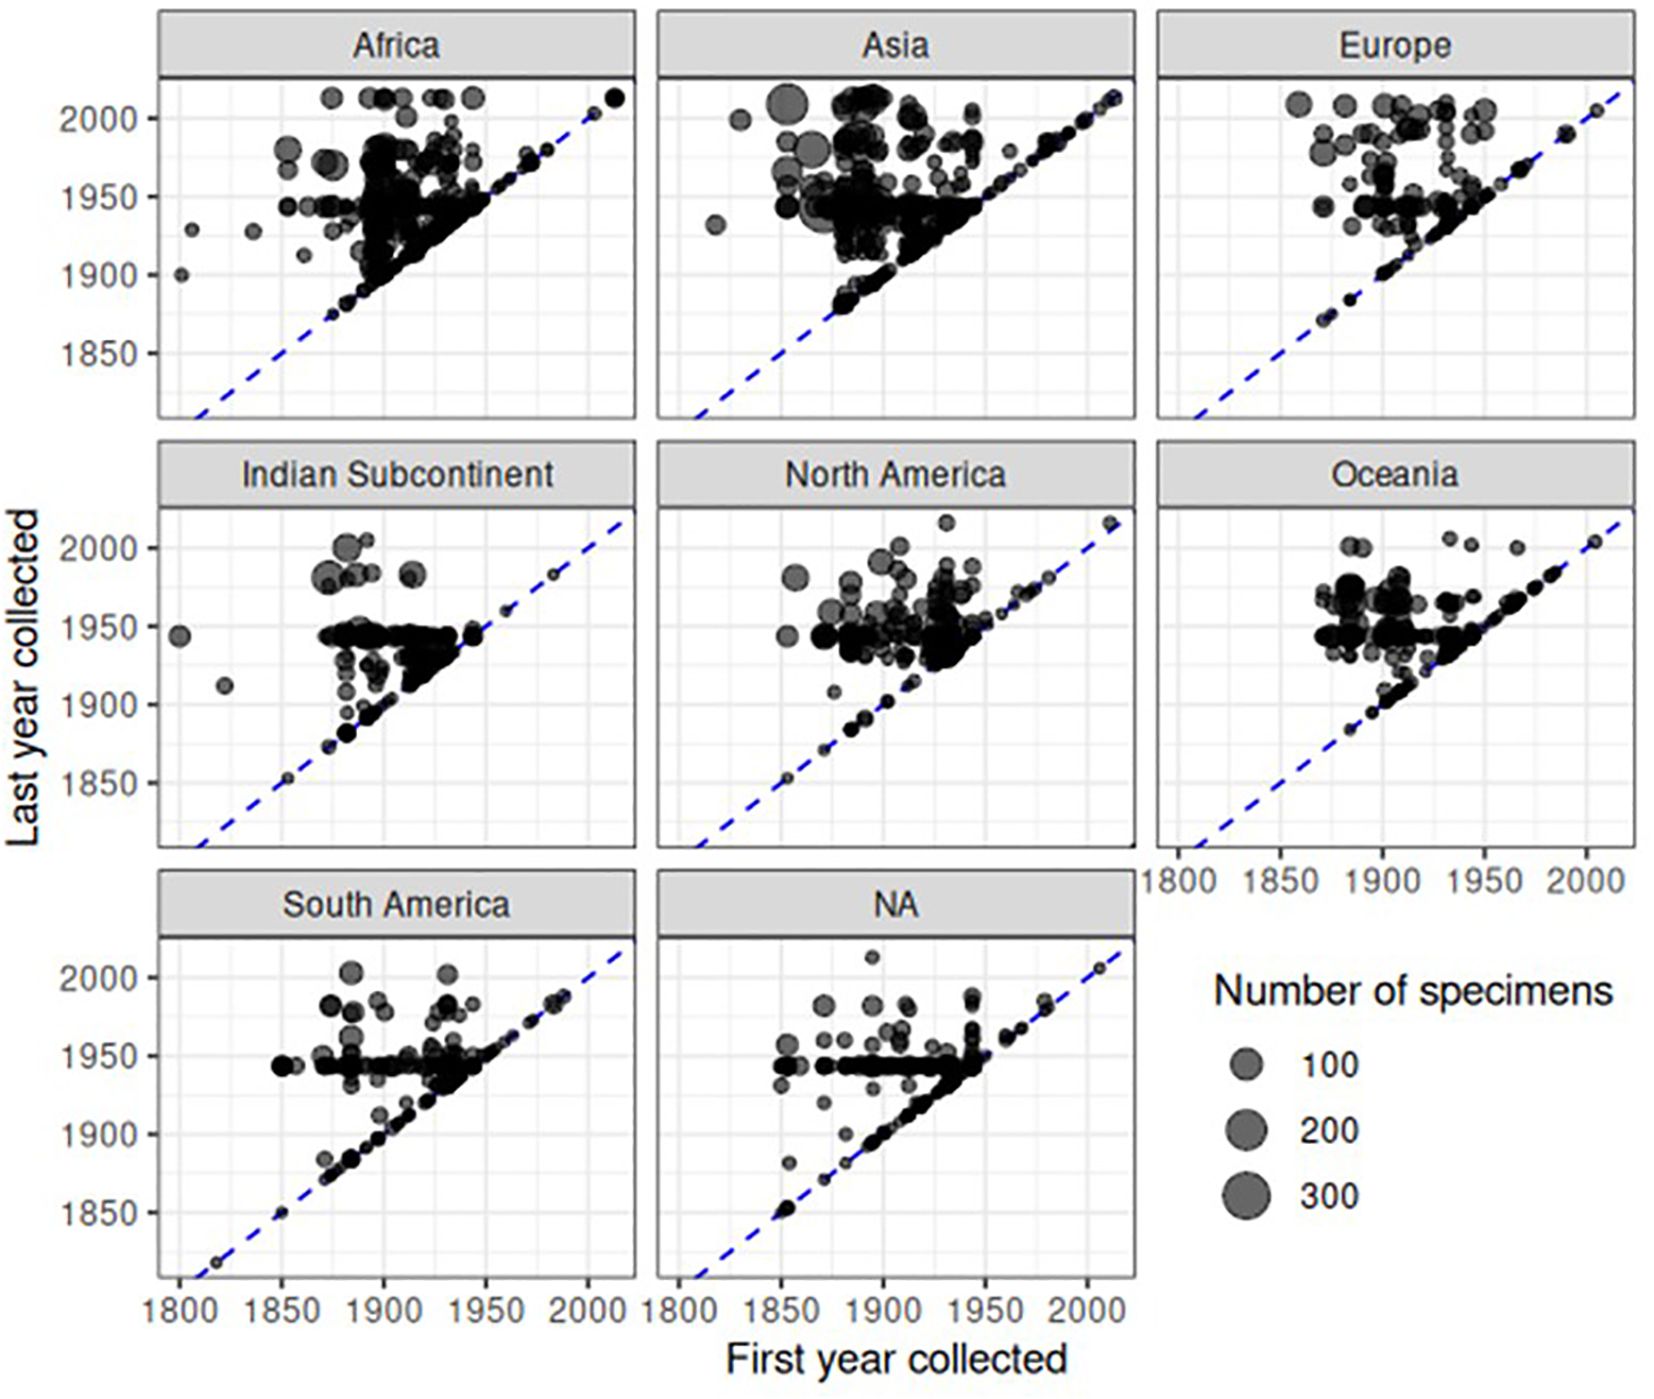
Figure 7 Patterns of collecting over continent and time. Each point represents a species in a continent, and is located based on the earliest and last collection years in the dataset. The blue dashed line represents when first and last collection years are the same, i.e. a species was only collected in one year. Points are semi transparent to reduce overplotting, although substantial overplotting remains due to the number of specimens. The size of points is proportional to the number of specimens in the dataset. NA refers to specimens for which no collecting locality information was available.
Finally, the date of first collection of a species was correlated with the date of species description. For each of the 2,546 species in the dataset, we gathered the earliest year of specimen collection, and counted the number of specimens with a definitive year and the number of specimens with estimated or unknown collection years to provide a level of confidence in this date. We disregarded species that had an unknown description date or no specimens with a definitive collection year, after which 1,512 species remained. The plots revealed a large delay in the date of description after the specimens had been added to the collection (Figure 8). The delay of species description was particularly evident for the Indomalayan and Australasian regions where species descriptions in the 2000s were conducted on specimens collected rather evenly over the length of the 20th century. In contrast, in Europe there was only a minimal delay of description date and the first deposition of the specimen (Figure 8). For a large number of species, collecting records were younger than the description (below the diagonal in Figure 8), which corresponds to species apparently described based on specimens held elsewhere. Surprisingly, such cases also applied to some type specimens held at NHM that presumably constituted the basis for the species description (red dots in Figure 8). For example, Agra rufoaenea was described in 1835 by Chevrolat, and the holotype is held at NHM, so the collecting date should precede or be equal to the time of the species description. However, the first specimen with a definitive collection date is 1932. In this case the holotype specimen itself had no collection date, and thus the potential description lag would have been missed. We also plotted the description lag by counting the number of years between the description date and the date of the earliest collection record at NHM (Figure 9), showing a large lag time till species description, frequently exceeding several decades or even >100 years (positive values in Figure 9). The lag was less evident for Palaearctic and Nearctic species, i.e. the description lag mainly affected tropical species.
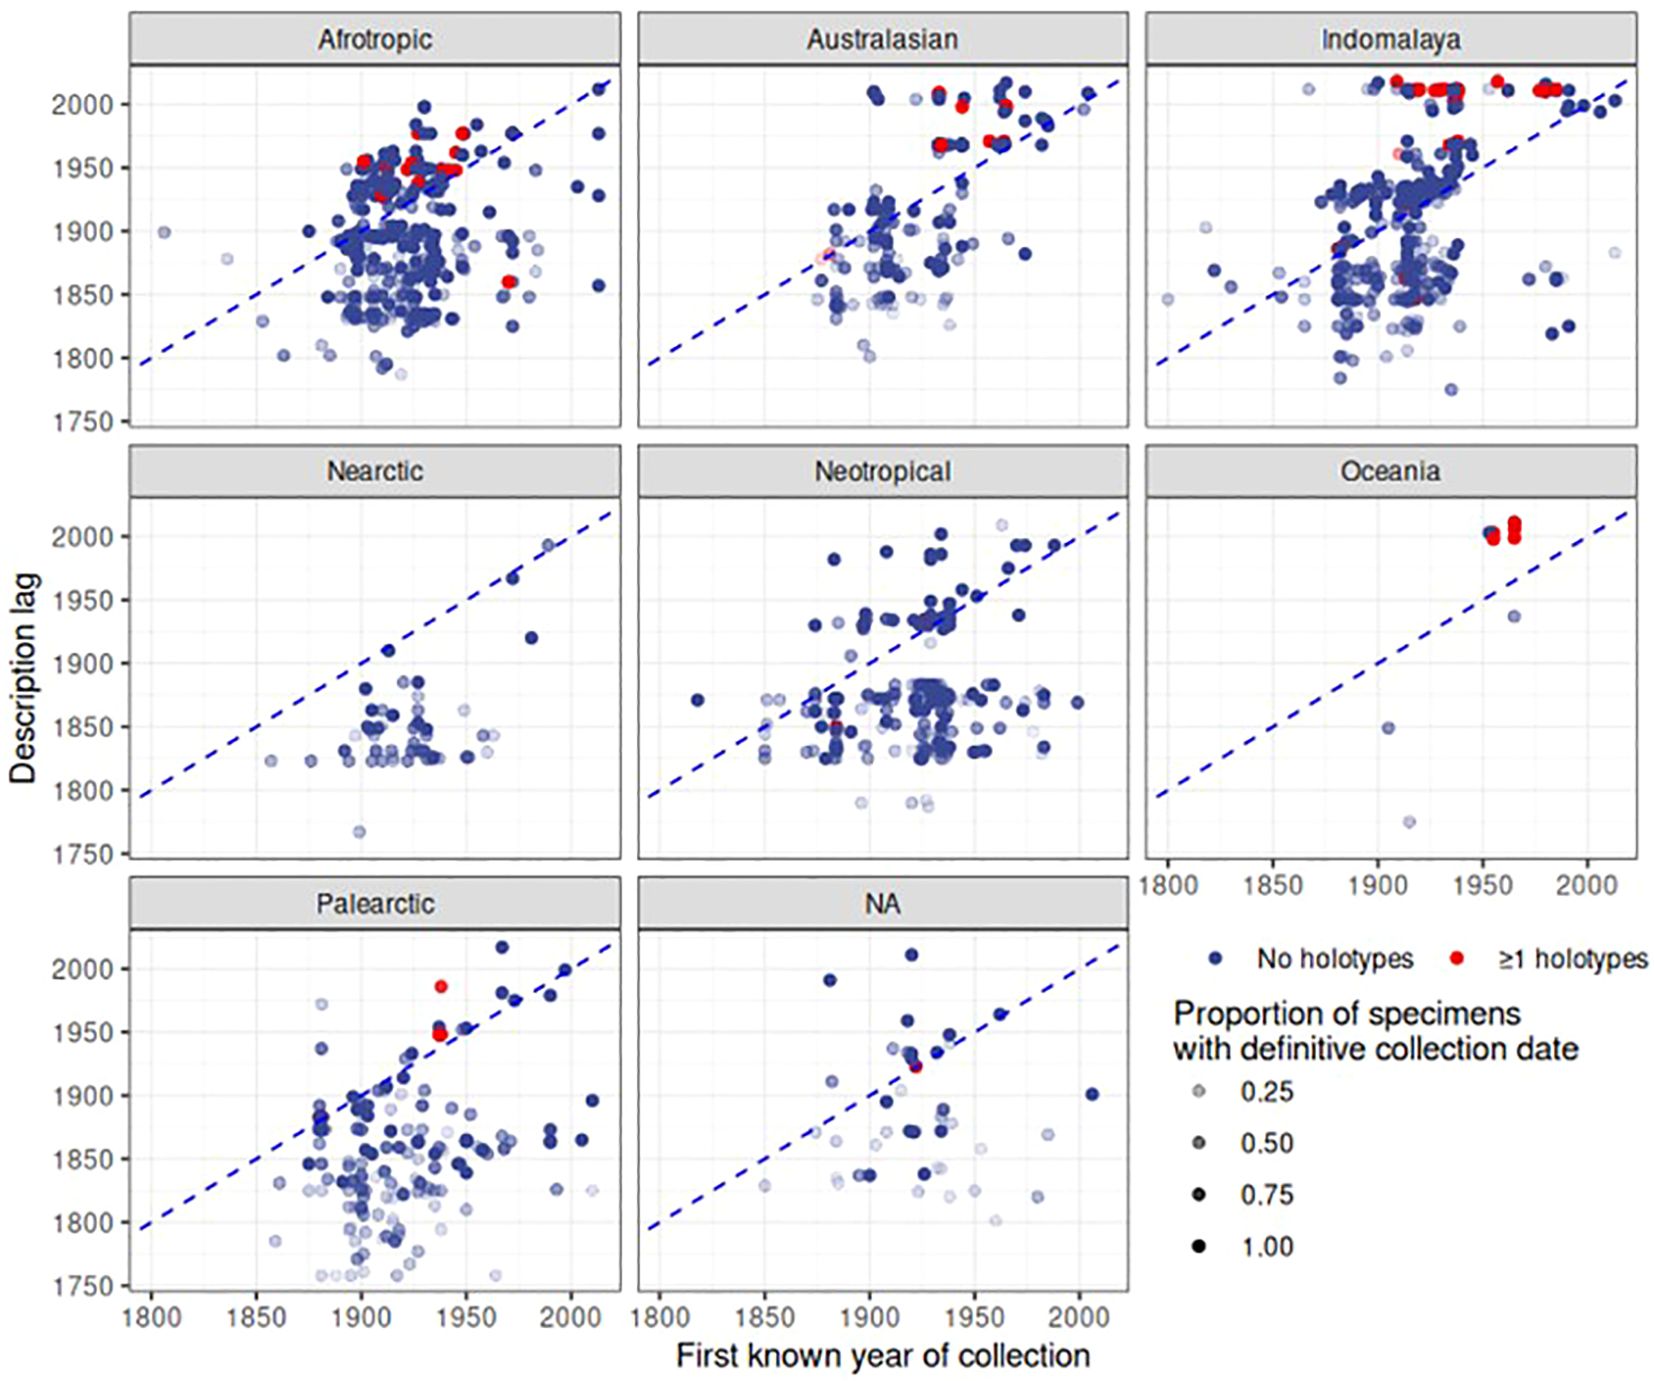
Figure 8 Patterns of description over biogeographic realm and time. Each point represents a species. The dashed blue line shows when the axes are identical; the higher above this line, the longer the time period between collection and description. Points below this line denote species where the first collection in this dataset occurs after the description date, i.e. specimens are likely described based on specimens held elsewhere. As certainty of first collection varies depending on the proportion of specimens for a given species that have a definitive date of collection, that proportion is represented by the opacity of each point. The points coloured in red indicate species represented by the holotype in the NHM collection.
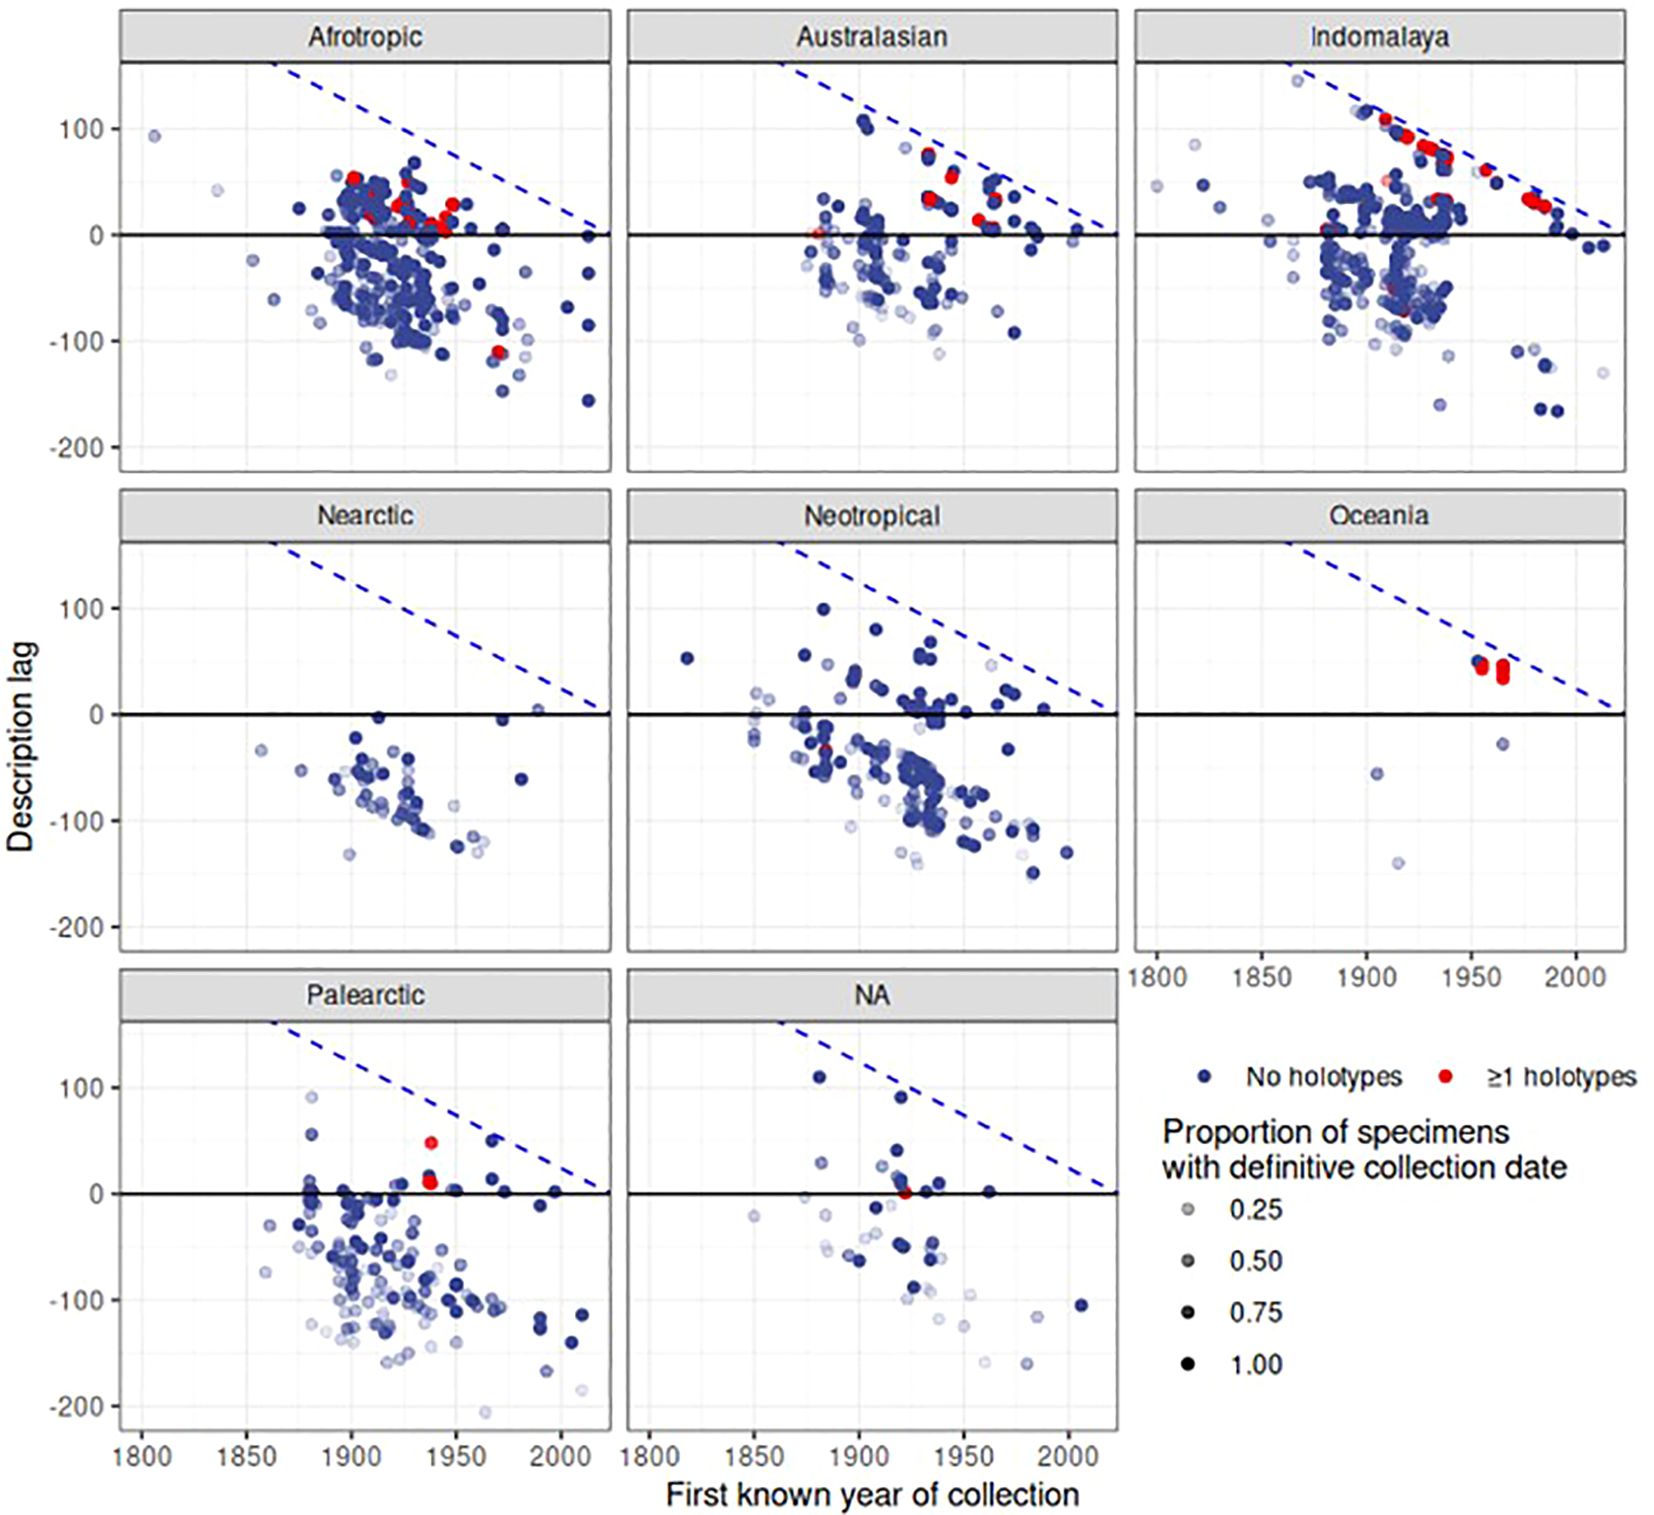
Figure 9 Description lag over biogeographic realm and time. Each point represents a species. Description lag is calculated as the year of description minus the year of first collection, so larger values represent a longer time period between collection and description. Negative values denote species where species in the collection had been described well before the earliest NHM record, presumably based on specimens obtained elsewhere and only later were added to the NHM collection. The blue dashed line represents the maximum possible lag for a given collection year. As certainty of first collection varies depending on the proportion of specimens for a given species that have a definitive date of collection, that proportion is represented by the opacity of each point.
4 Discussion
This study tackles the problem of curatorially modernising a historical insect collection while extracting scientifically valuable information from it, focused on ground beetles in the subfamily Lebiinae. Two key aspects were fulfilled: the transcription of labels for the ~29,000 specimens in this collection and the updating of the associated collection management system and taxonomic databases, which contributed to the NHM’s strategic aim to digitise its 80 million specimens and making them digitally available. The collection contains 2546 identified species, including 893 primary types, which represents nearly half of all described species of Lebiinae. Most species descriptions were conducted in a window of some 50 years starting in the late 19th century, followed by a significant drop in the rate of species description after 1950. Additional specimens for already described species were added over time in most cases, except for some 694 species considered ‘singletons’ not obtained again after their first collection date, but the rate of re-discovery dropped off in recent decades, especially after about 1980, albeit with some regional variation among continents. The transcription effort provides a platform for estimates of total species richness, patterns of biogeographic distributions and turnover, taxonomic classification, and ultimately conservation management. At the same time, the need for physically handling the specimens in the digitisation effort was used to transfer them to modern collection drawers to improve accessibility and protection.
4.1 Digital data generation and exploitation
We followed a project workflow of pre-digitisation curation, imaging and transcription, data acquisition and cleaning, and finally the rehousing into unit trays and new drawers (Supplementary Figure SF1). Imaging and transcription were conducted in batches at a rate of some 400 specimens per day by a single person for the initial automated acquisition of data, which were then parsed by the curator for data checks and transcription errors, validation against an existing database of the CMS and to flag any consistently occurring errors of taxonomic names, author or collector names, and collecting dates (e.g., assignment to century). By taking any cross-section of specimens, such as the Lebiinae, we automatically represent a portion of the whole collection that shares similar data labels throughout the Coleoptera and indeed the wider entomology collection given they are composite of larger collecting efforts, and in various cases will have the same acquisition numbers, collecting locality, collector and author. The strategy developed here for automatic scanning of label data and processing of taxonomic, geographic and temporal data therefore will be a template for mass digitisation of historical museum collections, as a necessary step for exploiting these data in studies of biodiversity and global change at a time scale not achievable with any other data types.
Yet, despite extensive automated and manual data improvement, there are limitations to the data quality and completeness from historical collections. Specifically, a high 58% of the collection had no collecting date information at all, in particular for older specimens where this information would be particularly relevant. Paterson et al. (2016) found similar trends in NHM British and Irish butterfly collections. The high proportion of missing dates is partly a result of historical curation practices that aggregated specimens from many different collectors into a single set, such as ‘W.L. Distant Coll.’, which had at least seven collections amalgamated into a single accession (‘BM accession 1911–383’). This practice effectively erased more detailed collection records. Fortunately, approximate ages can be estimated indirectly from information attached to specimens, such as the mean activity years of a collector or the mean sampling year of an accession. In the case of the Lebiinae collection, this approach was hugely successful and resulted in a provisional collection date that is probably accurate within a decade for >98% of all specimens. These dates should be added to the collection records in the CMS, and would represent an additional benefit from the digitisation efforts by linking specimens to approximate dates rather than a largely uninformative accession number. Further investigation into the collecting localities and practices of historic collectors and their collecting itineraries in the NHM’s archives could refine these dates further. However, given the long overall time frame over which we studied the collecting activities, these estimates are probably of sufficient resolution for an accurate conclusion about the overall trends of species collection dates (Figure 6).
The label data were found to be more complete for the geographic origin of specimens, with 91% of the total transcriptions providing a country record or reliable inference. In contrast, only 273 out of the ~29,000 records have digital coordinates, and without further attempts of inferring geo-localities from the label data this limits the utility of the information for detailed maps, e.g., in conservation and climate change studies that require specific site information, as well as the seamless integration and data visualisation with GBIF. Yet, already the visualisation of crude locality data provides interesting information, such as the topmost commonly collected species, which is Catascopus fascialis Weidemann, 1819, contributing 441 occurrences of the total 452 occurrences in the GBIF dataset. The country information also provides important information about global biodiversity patterns, showing the preponderance of lebiine species diversity in the Asian tropics, followed by Africa. The geographic coverage of the collection is inherently biassed given most specimens were collected around the turn of the 19th century, a period of extreme geopolitical reach of colonial powers. It was expected that the highest number of species would be collected from the Neotropics based on the distributions of species richness given in Anichtchenko (2024) but this does not seem to be reflected in the composition of the collection. Conversely, the collection mirrors closely the known diversity across all taxa and hierarchical levels (Table 2), suggesting that the records generally are an accurate representation of species diversity. Thus, when studying very large collections obtained over centuries and worldwide, sampling bias may be less problematic even if these collections are influenced by major collecting events as those under the auspices of the Biologia Centrali Americana which added >1,000 records, including 92 primary types, albeit affected by some inconsistencies and imprecision of the label information. In addition, our knowledge of total species diversity remains incomplete. For example, Erwin (2011) in his revision of Mizotrechus, a genus of Lebiinae not treated since its description by H.W. Bates in 1872, significantly increased the knowledge about the actual species diversity by understanding this genus to be sub-canopy specialists. Gaps in sampling geographically and ecologically can be identified from the existing collection records and followed up by targeted collecting of ecoregions and habitats.
Perhaps the most striking finding of our study was the antiquity of specimens in the Lebiinae collection with an average age of 91.4 years, and peak collecting years (over 100 specimens collected per year) between 1900 and 1938. It is equally striking that these collecting dates are broadly congruent with the description date, indicating that many of the earliest records of a species were deposited in the NHM collection. This makes the collection incredibly valuable as a taxonomic record of the known species diversity and the timeline of knowledge generation. However, the detailed records of collecting dates revealed the huge lag of the time to species description of generally several decades, especially for tropical species that were deposited in the collection much earlier than they were described (Figures 8, 9). The effect is probably even underestimated in our analysis, as the oldest records are more likely to have no date, i.e. the record appears to be too young and too close to the date of description. This time lag illustrates the slowness of current taxonomic practice (Engel et al., 2021), but more importantly it is a severe, possibly underappreciated problem for the use of the collection when trying to accumulate new species information under a Linnean name (that may not yet exist even though the species has long been present in the collection). Digital collection records may help to make these lingering records of potentially undescribed species more easily accessible and highlight the most likely portion of the collection (in terms of geography and collecting period) where to focus taxonomic activity, especially for the incorporation of the unidentified accession specimens.
The decline in the rate of species description was broadly followed by the rate of rediscovery (collecting records through time) with a lag of 2–3 decades. Thus for the great majority of species no specimen was added in recent time, or even within the past several decades, and in fact >690 species were added to the collection only once. This trend was similar on all continents, with a few exceptions especially in Asia and the Palaearctic. Both the lack of recent species description and the low re-deposition rate could be simply due to the low collection effort in recent years, possibly exacerbated by the lag time to species description and limited possibilities to identify new specimens against a set of still-undescribed specimens. It could also reflect the general decline in taxonomic expertise (Rodman and Cody, 2003; Engel et al., 2021). At face value, this seems to be the simplest explanation. However, the collection also probably represents areas long lost to development or no longer accessible for political or logistic reasons. Most species of Lebiinae are tropical and linked to forest habitats, i.e. they are dependent on ecosystems that have been particularly heavily affected by environmental decline over the past 50 years, which may now be evident from the collection timeline. Whether or not these species can be collected again with targeted collecting efforts, the old records in the collection preserve an image of species diversity as it existed before the widespread destruction of tropical forests.
4.2 Implications for collection management
Finally, the label digitisation went together with the recuration of the physical collection. Historical insect collections are marred by different types of pins and labels with differing degrees of fragility, along with differences in body size of the specimens that are either pinned directly or glued on cardboard. The digitisation effort and required handling of specimens provided an opportunity to rehouse the collection in a way that would increase its utility for current and future users. The new housing should now allow for substantial collection growth for the Lebiinae for the foreseeable future and the full integration of the accession specimens. The arrangement will maintain the advantage of a synoptic collection arranged by phylogenetic principles, which facilitates the recovery of available specimens for comparative analyses and taxonomic studies based on all relevant collection holdings. The use of unit trays allows the easy rearrangement of specimens as classifications change with improved knowledge of phylogeny. Correct placement may also be relevant to the digitisation process that usually targets specific taxonomic groups as part of a research project or due to a management priority. For example, in the current study the physical arrangement of the collection according to an outdated taxon concept of the Lebiinae led to the omission of the tribe Perigonini Horn, 1881, and thus the Lebiinae dataset remains incomplete until this group can be included through the wider NHM digitisation effort in future. Perigonini are typically rare, poorly known, and possibly endangered beetles, which are rare in museum collections, but the NHM contains a significant contingent of the four known genera. This case demonstrates the problems of aligning the physical specimen collections with recent phylogenetic findings, which will be partly remedied through recuration. Conversely, consideration must be given to the increased physical footprint. An already large collection of over 29,000 specimens now takes up over 200 drawers post recuration. Yet, with the digitisation now mainly completed, access to these specimens (for non-taxonomic research) will frequently be remotely, questioning the need for an expansive physical collection. If access is required by users mostly for a few targeted specimens, rather than the synoptic collection of a particular group, it may be favourable to use a space-saving warehouse style storage system. This may be arranged not by taxonomy but instead adds new drawers for incoming specimens of any kind that are accessed using unique identifier barcodes. The future patterns of usage of the Lebiinae collection should be monitored with this in mind.
The utility of the collection data is dependent on the accuracy of the transcription. While the automated digitisation step is comparatively quick (estimated at 2.5 minutes per specimen), several months of curator time was expended on the data cleaning of transcription misinterpretations across all data fields. There are arguments for and against making so-called dirty data accessible (Groom et al., 2019), but this is a matter of degree. In the current dataset both the removal of poorly transcribed data and the inference of incomplete data changed the number of entries for data analysis (Table 1). This highlights the necessity of expert curatorial input to the automated or semi-manual transcription outcomes, where knowledge of collectors, their collecting period, the taxonomy, and correct identification of a specimen is beyond the remit of a data-scientist transcriber. The aim to digitally improve and correct the total dataset is an ongoing process and becomes more rapid with the improvement of the museum-wide or other global databases against which the new entries can be aligned, possibly using machine learning approaches (de la Hidalga et al., 2022).
As new technologies develop, the emerging field of museomics utilises high-throughput digitisation to assist in other related studies such as molecular phylogenetics, biogeography, climate response, diet analysis, and host associations (e.g. Wilson et al., 2023), as well as linking museum datasets with conservation (Johnson et al., 2023). By making these data available we highlight the fact that biodiversity is not limited to the taxon concepts and classifications thus far accumulated. The taxonomic gaps in collections are only truly known from digitisation efforts that release biogeographic as well as temporal data associated with a taxon. This provides the baseline from which to direct reparative and preventative biodiversity conservation. Historical specimens, their value priceless to science and society, must be protected from potential unstable situations (conflict, war), climatic disasters (fire, flooding), and decreasing funding for custodial (curator) care. To digitise specimens is an investment in the future of museum collections, though due to their numerical prevalence, the digital curation of insect collections is particularly daunting, but necessary.
4.3 Critical evaluation
Digitisation of historical collections is imperative, for safeguarding their future and for future users and societal needs possibly not yet realised. Large infrastructure projects are underway to unify digitisation efforts, especially across natural history collections of Europe’s major research museums. The enormous power of this approach for the study of global change is supported by the current study. However, while embarking on these large and resource intensive projects, it is important to bear in mind some of the lessons learned from a pilot project of the kind conducted here. Historical collections present many biases and often consist of non-parametric data which must be treated with analytical caution. We encountered many ambiguities within this dataset which limited the scope of analysis. We share some examples in the Supplement, following the evaluation criteria set out in Pinedo-Escatel et al. (2024) (Supplementary Text S1).
5 Conclusions
Through digitisation we can understand the strengths and limitations of the specimen collection. Strategic collecting (Johnson et al., 2023) can only happen if we look to museum collections and categorically understand where the gaps are. Collections have languished in stasis for two centuries: pinned specimens in drawers only accessed physically and on a piecemeal basis dependent on (mostly taxonomic) research needs. While these specimens are in collections, without digitisation and difficult to access, they are effectively ‘dark taxa’ (Page, 2016). The way collections are stored, curated and managed is archaic and requires reconsideration in line with the digital age. The new curation here applied to a large lineage of beetles provides the baseline data to facilitate detailed studies of their diversity, distribution, or local and global extinctions. This project significantly increased data availability on this diverse group of beetles via GBIF. The collection is hugely significant because it contains almost half of the known species and many of the earliest records. Almost all specimens have geographic information attached to them, albeit mostly crude country-level data. Temporal data were more limited, but could be approximated for most specimens. In the way they are curated here, these data become part of the ‘global museum’ of specimens and associated data collected by similar digitisation efforts elsewhere for the growing world catalogue of species diversity. These data also need to be linked to parallel efforts of DNA barcoding (Ratnasingham and Hebert, 2013) and genome sequencing (Lewin et al., 2022) that use samples mainly from mechanical traps, which already greatly changed our knowledge of species richness (Hebert et al., 2016), but currently these efforts are very difficult to link with traditional species descriptions and surveys especially in tropical insects (Lo et al., 2024). During digitisation and recuration, no specimen is left untouched, but in new housing and with their collateral data extracted, they are safely stored and readily available for more detailed taxonomic studies. Without these collections and the synoptic perspective of species diversity, comparative morphology, geographic distribution and temporality afforded by them, we would know very little about the organismal diversity on Earth. As these collections may be our only remaining record of biodiversity in the pre-industrial world, the power of large-scale studies using collated label data justifies the high cost of long-term preservation and mass-digitisation of museum specimens.
Data availability statement
The names of the repository/repositories and accession number(s) can be found below: https://data.nhm.ac.uk, + search term ‘Lebiinae’.
Author contributions
BHG: Writing – original draft, Writing – review & editing, Conceptualization, Data curation, Formal analysis, Visualization, Investigation, Methodology. TJC: Writing – review & editing, Methodology, Formal analysis, Visualization, Software. ELA: Writing – review & editing, Methodology. RC: Writing – review & editing, Data curation. ED: Writing – review & editing, Data curation. PK: Writing – review & editing, Data curation. LL: Writing – review & editing, Methodology. KL: Writing – review & editing, Data curation. NL: Writing – review & editing, Data curation. PW: Writing – review & editing, Data curation. APV: Writing – original draft, Writing – review & editing, Conceptualization, Supervision.
Funding
The author(s) declare financial support was received for the research, authorship, and/or publication of this article. This project was supported by NHM internal funds.
Acknowledgments
We are grateful to our colleagues at NHM Life Sciences who supported this project: Max Barclay, Gavin Broad, Natalie Cooper, Tim Littlewood, Ben Price, and Hillery Warner. We acknowledge advice from Peter Lia and Aileen Scott (Imperial College London) and the late Dr Terry Erwin (Smithsonian Institution). The authors are grateful to the reviewers for their helpful comments on improving this manuscript.
Conflict of interest
The authors declare that the research was conducted in the absence of any commercial or financial relationships that could be construed as a potential conflict of interest.
Publisher’s note
All claims expressed in this article are solely those of the authors and do not necessarily represent those of their affiliated organizations, or those of the publisher, the editors and the reviewers. Any product that may be evaluated in this article, or claim that may be made by its manufacturer, is not guaranteed or endorsed by the publisher.
Supplementary material
The Supplementary Material for this article can be found online at: https://www.frontiersin.org/articles/10.3389/fevo.2024.1305931/full#supplementary-material
References
Allan E. L., Livermore L., Price B. W., Shchedrina O., Smith V. S. (2019). A novel automated mass digitisation workflow for natural history microscope slides. Biodivers. Data J. 7, e32342. doi: 10.3897/BDJ.7.e32342
Anichtchenko A. (2024) Carabidae of the world. Available online at: http://www.carabidae.org (Accessed June 5, 2024).
Bánki O., Roskov Y., Döring M., Ower G., Hernández Robles D. R., Plata Corredor C. A., et al. (2023). Catalogue of life checklist. doi: 10.48580/DFGNM
Darlington P. J. Jr. (1933). Obituary: Percy Gardner Bolster. Psyche 40, 87–88. doi: 10.1155/1933/98174
de la Hidalga A. N., Rosin P. L., Sun X., Livermore L., Durrant J., Turner J., et al. (2022). Cross-validation of a semantic segmentation network for natural history collection specimens. Mach. Vis. Appl. 33, 39. doi: 10.1007/s00138-022-01276-z
Dupont S., Price B. W. (2019). ALICE, MALICE and VILE: High throughput insect specimen digitisation using angled imaging techniques. BISS 3, e37141. doi: 10.3897/biss.3.37141
Engel M. S., Ceríaco L. M. P., Daniel G. M., Dellapé P. M., Löbl I., Marinov M., et al. (2021). The taxonomic impediment: a shortage of taxonomists, not the lack of technical approaches. Zool. J. Linn. Soc. 193, 381–387. doi: 10.1093/zoolinnean/zlab072
Erwin T. L. (2011). Rainforest understory beetles of the Neotropics, Mizotrechus Bates 1872, a generic synopsis with descriptions of new species from Central America and northern South America (Coleoptera, Carabidae, Perigonini). Zookeys 145, 79–128. doi: 10.3897/zookeys.145.2274
Groom Q., Dillen M., Hardy H., Phillips S., Willemse L., Wu Z. (2019). Improved standardization of transcribed digital specimen data. Database 2019. doi: 10.1093/database/baz129
Hebert P. D. N., Ratnasingham S., Zakharov E. V., Telfer A. C., Levesque-Beaudin V., Milton M. A., et al. (2016). Counting animal species with DNA barcodes: Canadian insects. Philos. Trans. R. Soc Lond. B. Biol. Sci. 371, 20150333. doi: 10.1098/rstb.2015.0333
Hedrick B. P., Heberling J. M., Meineke E. K., Turner K. G., Grassa C. J., Park D. S., et al. (2020). Digitization and the future of natural history collections. Bioscience 70, 243–251. doi: 10.1093/biosci/biz163
Johnson K. R., Owens I. F. P., Global Collection Group (2023). A global approach for natural history museum collections. Science 379, 1192–1194. doi: 10.1126/science.adf6434
Kabacoff R. (2022). R in Action, Third Edition: Data analysis and graphics with R and Tidyverse (Connecticut, USA: Manning Simon and Schuster).
Kharouba H. M., Lewthwaite J. M. M., Guralnick R., Kerr J. T., Vellend M. (2018). Using insect natural history collections to study global change impacts: challenges and opportunities. Philos. Trans. R. Soc Lond. B. Biol. Sci. 374, 20170405. doi: 10.1098/rstb.2017.0405
Lewin H. A., Richards S., Lieberman Aiden E., Allende M. L., Archibald J. M., Bálint M., et al. (2022). The earth bioGenome project 2020: starting the clock. Proc. Natl. Acad. Sci. U. S. A. 119, e2115635118. doi: 10.1073/pnas.2115635118
Lindroth C. H. (1974). Handbook for the identification of British beetles. Coleoptera: Carabidae (London: Royal Entomological Society).
Lo E., Nie R.-E., Vogler A. P. (2024). The geographic and phylogenetic structure of public DNA barcode databases: an assessment using Chrysomelidae (leaf beetles). Front. Ecol. Evol. 12. doi: 10.3389/fevo.2024.1305898
Lohonya K., Livermore L., Wajer J., Crowther R., Devenish E. (2022). Digitisation of the Natural History Museum’s collection of Dalbergia, Pterocarpus and the subtribe Phaseolinae (Fabaceae, Faboideae). Biodivers. Data J. 10, e94939. doi: 10.3897/BDJ.10.e94939
Lorenz W. (2005). Systematic list of Extant Ground Beetles of the World: Insecta Coleoptera “Geadephaga”: Trachypachidae and Carabidae incl. Paussinae, Cicindelinae, Rhysodinae, Germany: W. Lorenz.
Mantle B. L., Salle J. L., Fisher N. (2012). Whole-drawer imaging for digital management and curation of a large entomological collection. Zookeys 209, 147–163. doi: 10.3897/zookeys.209.3169
Nelson G., Paul D., Riccardi G., Mast A. R. (2012). Five task clusters that enable efficient and effective digitization of biological collections. Zookeys, 19–45. doi: 10.3897/zookeys.209.3135
Ober K. A. (2003). Arboreality and morphological evolution in ground beetles (Carabidae: Harpalinae): testing the taxon pulse model. Evolution 57, 1343–1358. doi: 10.1111/j.0014-3820.2003.tb00342.x
Ober K. A., Maddison D. R. (2008). Phylogenetic relationships of tribes within Harpalinae (Coleoptera: Carabidae) as inferred from 28S ribosomal DNA and the wingless gene. J. Insect Sci. 8, 63. doi: 10.1673/031.008.6301
Ondov B. D., Bergman N. H., Phillippy A. M. (2011). Interactive metagenomic visualization in a Web browser. BMC Bioinf. 12, 385. doi: 10.1186/1471-2105-12-385
Page R. D. M. (2016). DNA barcoding and taxonomy: dark taxa and dark texts. Philos. Trans. R. Soc Lond. B. Biol. Sci. 371, 20150334. doi: 10.1098/rstb.2015.0334
Page L. M., MacFadden B. J., Fortes J. A., Soltis P. S., Riccardi G. (2015). Digitization of biodiversity collections reveals biggest data on biodiversity. Bioscience 65, 841–842. doi: 10.1093/biosci/biv104
Paterson G., Albuquerque S., Blagoderov V., Brooks S., Cafferty S., Cane E., et al. (2016). iCollections – digitising the British and Irish butterflies in the Natural History Museum, London. Biodivers. Data J., e9559. doi: 10.3897/BDJ.4.e9559
Pinedo-Escatel J. A., Dietrich C. H., Aragon-Parada J. (2024). “Natural history collections as resources for assessing biodiversity hotspots and insect declines: Case studies, opportunities, and challenges,” in Insect decline and conservation in the Neotropics. Eds. León-Cortés J. L., Córdoba-Aguilar A. (Springer International Publishing, Cham), 275–299.
Popov D., Roychoudhury P., Hardy H., Livermore L., Norris K. (2021). The value of digitising natural history collections. Riogrande. Odontol. 7, e78844. doi: 10.3897/rio.7.e78844
Price B. W., Dupont S., Allan E. L., Blagoderov V., Butcher A. J., Durrant J., et al. (2018). ALICE: Angled Label Image Capture and Extraction for high throughput insect specimen digitisation. doi: 10.31219/osf.io/s2p73
Ratnasingham S., Hebert P. D. N. (2013). A DNA-based registry for all animal species: the barcode index number (BIN) system. PloS One 8, e66213. doi: 10.1371/journal.pone.0066213
Rodman J. E., Cody J. H. (2003). The taxonomic impediment overcome: NSF’s Partnerships for Enhancing Expertise in Taxonomy (PEET) as a model. Syst. Biol. 52, 428–435. doi: 10.1080/10635150309326
Scott B., Baker E., Woodburn M., Vincent S., Hardy H., Smith V. S. (2019). The natural history museum data portal. Database 2019. doi: 10.1093/database/baz038
Tegelberg R., Mononen T., Saarenmaa H. (2014). High-performance digitization of natural history collections: Automated imaging lines for herbarium and insect specimens. Taxon 63, 1307–1313. doi: 10.12705/636.13
Walton S., Livermore L., Bánki O., Cubey R. W. N., Drinkwater R., Englund M., et al. (2020). Landscape analysis for the specimen data refinery. Riogrande. Odontol. 6, e57602. doi: 10.3897/rio.6.e57602
Weber D. C., Rowley D. L., Greenstone M. H., Athanas M. M. (2006). Prey preference and host suitability of the predatory and parasitoid carabid beetle, Lebia grandis, for several species of Leptinotarsa beetles. J. Insect Sci. 6, 1–14. doi: 10.1673/1536-2442(2006)6[1:PPAHSO]2.0.CO;2
Wieczorek J., Bloom D., Guralnick R., Blum S., Döring M., Giovanni R., et al. (2012). Darwin Core: an evolving community-developed biodiversity data standard. PloS One 7, e29715. doi: 10.1371/journal.pone.0029715
Wilson R. J., de Siqueira A. F., Brooks S. J., Price B. W., Simon L. M., van der Walt S. J., et al. (2023). Applying computer vision to digitised natural history collections for climate change research: Temperature-size responses in British butterflies. Methods Ecol. Evol. 14, 372–384. doi: 10.1111/2041-210X.13844
Keywords: natural history collections, digitisation, biodiversity informatics, entomology, taxonomy, biogeography, Carabidae, curation
Citation: Garner BH, Creedy TJ, Allan EL, Crowther R, Devenish E, Kokkini P, Livermore L, Lohonya K, Lowndes N, Wing P and Vogler AP (2024) The taxonomic composition and chronology of a museum collection of Coleoptera revealed through large-scale digitisation. Front. Ecol. Evol. 12:1305931. doi: 10.3389/fevo.2024.1305931
Received: 02 October 2023; Accepted: 28 May 2024;
Published: 17 July 2024.
Edited by:
Jorge Ari Noriega, University of Los Andes, ColombiaReviewed by:
Dirk Ahrens, Zoological Research Museum Alexander Koenig (LG), GermanyJayme Lewthwaite, University of Southern California, United States
Copyright © 2024 Garner, Creedy, Allan, Crowther, Devenish, Kokkini, Livermore, Lohonya, Lowndes, Wing and Vogler. This is an open-access article distributed under the terms of the Creative Commons Attribution License (CC BY). The use, distribution or reproduction in other forums is permitted, provided the original author(s) and the copyright owner(s) are credited and that the original publication in this journal is cited, in accordance with accepted academic practice. No use, distribution or reproduction is permitted which does not comply with these terms.
*Correspondence: Beulah H. Garner, Yi5nYXJuZXJAbmhtLmFjLnVr
†ORCID: Beulah H. Garner, orcid.org/0000-0002-5229-2450