
94% of researchers rate our articles as excellent or good
Learn more about the work of our research integrity team to safeguard the quality of each article we publish.
Find out more
ORIGINAL RESEARCH article
Front. Ecol. Evol., 16 May 2024
Sec. Conservation and Restoration Ecology
Volume 12 - 2024 | https://doi.org/10.3389/fevo.2024.1209309
This article is part of the Research TopicScience-Based Conservation of Tigers: Assessing the Past to Prepare for the FutureView all 6 articles
 Pranav Chanchani1,2,3*†
 Barry R. Noon1,2
 Ashish Bista3
 Rekha Warrier1,2,3†Shwetha Nair3†Ruchir Sharma3†Mudit Gupta3
 Brian D. Gerber4†
Spatial heterogeneity in the local densities of terrestrial carnivores is driven by multiple interacting biotic and abiotic factors. Space-use patterns of large carnivores reflect the competing demands of resource selection (e.g., exploitation of habitats with abundant prey) and minimization of risks arising from human interactions. Estimating the relative strength of these drivers is essential to understand spatial variation in densities of large carnivores and there are still key knowledge gaps for many large carnivore populations. To better understand the relative roles of environmental and human drivers of spatial variation in tiger (Panthera tigris) densities, we surveyed a 3000 km2 landscape in North India using camera trap data. Over two years, we photo-captured 92 unique adult tigers. Associating spatial covariates with patterns of detection allowed us to test hypotheses about the relative influence of prey abundance, habitat structure and extent, and proximity to habitat edges on spatial variation in tiger densities across a gradient of anthropogenic disturbance. We documented extensive variation in tiger density within and across management units and protected areas. Spatial variation in prey abundance and proximity to grassland habitats, rather than human use (e.g. extent of human-dominated edge habitat and protection status), explained most of the spatial variation in tiger density in two of the five surveyed sites. The region’s largest tiger population occurred in a multi-use forest beyond protected area boundaries, where wild ungulates were abundant. Our results suggest that tigers can occur at high densities in areas with extensive human use, provided sufficiently high prey densities, and tracts of refuge habitats (eg. areas with dense vegetation with low human use). We argue that tiger conservation portfolio can be expanded across multi-use landscapes with a focus on areas that are adaptively managed as “zones of coexistence” and “refuge habitats”. Advancing this conservation strategy is contingent on greatly strengthening systems to effectively and equitably redress human–wildlife conflict and leveraging existing policies to strengthen local participation in conservation planning and forest stewardship. Our insights into the environmental drivers of spatial heterogeneity in tiger populations can inform both local management and guide to species recovery in working landscapes.
Worldwide, populations of large-bodied predators have declined and several species are functionally extinct in extensive areas of their native range (Check, 2006; Ripple et al., 2014). Large carnivore declines can have profound direct and indirect impacts on ecosystem structure and function (Dobson et al., 2006; Duffy et al., 2007). Key conservation goals for these species are to first identify, and then sustain, those environmental conditions that promote stable or growing populations. Meeting these goals requires one to identify the ecological and anthropogenic factors that lead to spatial variation in demographic parameters, such as density (D) and abundance (N) (Boyce and McDonald, 1999; Burton et al., 2011). Our ability to reliably estimate population parameters and link these to environmental drivers in dynamic environments is, in turn, dependent on the design and implementation of robust monitoring programs at appropriate spatial and temporal scales (Nichols and Williams, 2006).
As a consequence of environmental variation, the spatial and temporal distributions of most species are dynamic. Variation in the density of large carnivores, for example, has been attributed to numerous endogenous and exogenous factors (Carbone and Gittleman, 2002; Vanak et al., 2013). Most relevant may be the availability of their principal prey species and the distribution of competitors, which are also temporally and spatially dynamic (Carbone et al., 2011; Harihar et al., 2011; Bhola et al., 2012). Further, the location and extent of habitats required for successful reproduction, and secure from direct human threats, strongly influence the abundance and distribution of many large terrestrial carnivores (Riley and Malecki, 2001; Oriol-Cotterill et al., 2015; Chanchani et al., 2016). For example, in some landscapes large carnivores occur in agricultural areas and other habitats with high levels of human-use (Athreya et al., 2013; Warrier et al., 2020). Carnivore occurrence in human-use areas may reflect a dynamic balance between prey availability and anthropogenic threats (Basille et al., 2009). Physical landscape features, including water bodies, landform and patch connectivity, may also constrain animal movement and strongly influence patterns of space use (Dickson et al., 2005; Harihar and Pandav, 2012). Finally, behavioral factors including territoriality, mating systems and dispersal are key drivers affecting the distribution and abundance of carnivores, and these behaviors are often density-dependent (Smith, 1993; Carter et al., 2015; Chanchani et al., 2018).
Small populations are vulnerable to local extinction, and in South Asia many small tiger populations are embedded in some of the world’s most densely populated rural landscapes (The World Bank, 2011; Wikramanayake et al., 2011). To formulate conservation strategies to benefit these populations requires estimation of their local abundances and spatial distributions across the landscape. Subsequently, spatial variation in abundance needs to be linked to underlying causal factors.
Recent studies have shown that tiger densities vary dramatically at both broad (across landscapes within individual protected areas) and fine (locations within a single Protected Area) spatial scales (Jhala et al., 2015; Duangchantrasiri et al., 2016). The dominant explanatory factor of spatial variation in tiger abundance is variation in prey abundance and availability (Karanth et al., 2004). However, additional environmental and social factors, that are less studied, may significantly interact with prey availability and prove to be important divers of spatial variation in tiger abundance.
In this study, we investigated the influence of four key factors as potential drivers of spatial heterogeneity in tiger density. Our study site was located inNorth India in an area characterized by extensive habitat fragmentation and high human-use, and was centered on forests in Pilibhit District and Kheri District (Dudhwa Tiger Reserve). Initially, we investigated the relationship between tiger and prey density at fine spatial scales to estimate the extent to which local heterogeneity in prey density explained spatial variation in tiger abundance. Relationships between tiger and prey densities have typically been documented at broad spatial scales (e.g., within entire Protected Areas) (Jathanna et al., 2003; Karanth et al., 2004), but less commonly at finer spatial scales (e.g., within a single PA). Previous studies found that finer scale variation in tiger abundance is best explained by variation in habitat quality, prey availability, and management practices (Harihar et al., 2013; Dorozio et al., 2017). To estimate the influence of variation in prey abundance, relative to habitat variation and management regimes, we first estimated the relationship between prey density and fine-scale variation in tiger density.
To evaluate forest structure, including as a result of variation in forest structure and management, we measured variation in canopy cover using remotely sensed data. The primary prey species in our study select forest areas with extensive plant forage in the understory and understory vegetation that provides cover for hunting, feeding and raising young (Dinerstein, 1980; Shrestha, 2004; Sunarto et al., 2012). These environmental factors have rarely been considered when developing conservation strategies for Protected Areas (PAs) and multiple-use forests (MUFs). In India, since the colonial era, large tracts of tiger habitat in have been managed as Reserved Forests (i.e., multiple-use forests), emphasizing commercially valuable timber species. In recent decades, several reserve forests in India have been elevated to PA status, a designation which prioritizes wildlife conservation and prohibits logging. However, many regions of India remain dominated by expansive tracts of homogenous, closed-canopy forests, particularly Sal (Shorea robusta). These forests generally have little understory vegetation and support low densities of ungulate prey species (Dinerstein, 1980; Seidensticker et al., 2010; Bhattarai and Kindlmann, 2011). In contrast, in MUFs, selective tree felling creates canopy openings and edges which may increase productivity in the forest understory, including forage plant species consumed by tiger prey species (Alverson et al., 1988; Linkie et al., 2008; Rayan and Mohamad, 2009; Thapa et al., 2023).
Third, tigers achieve their highest densities in habitats that include a mosaic of forests and grasslands. Grasslands often support locally high densities of prey species, including swamp deer (Rucervus duvaucelii) and hog deer (Hyelaphus porcinus), and provide cover for tigers to rest or raise cubs (Shrestha, 2004; Sunquist, 2010). Therefore, we estimated the relationship between local tiger density and the distribution and extent of grasslands in our study area. Across India, there is extensive variation in grassland management practices. In PAs, grasslands are managed to benefit tiger or prey populations by seasonal burning and cutting to maximize productivity and promote re-growth, practices that create forage for ungulates (Peet et al., 1999b). In contrast, in MUFs, managers often attempt to convert grasslands habitats into timber-supplying woodlands by actively planting woody plant species. There are also differences between PAs and MUFs in human access of grasslands. Grasslands in core habitats of PAs are generally managed solely for wildlife. In contrast, in MUFs, grasslands are available for livestock grazing and for grass harvesting by local communities.
Lastly, we investigated variation in tiger densities as a function of distance to habitat edges. The designation of core (interior) and buffer (edge areas with high human-use zones) in many PAs is a fundamental strategy for tiger conservation in multiple countries across the species range (Panwar, 1982; Nyhus and Tilson, 2004). Such delineations are intended to minimize human–tiger interactions, and serve as “source sites”, for breeding tiger populations (Jhala et al., 2021). More recently however, studies have indicated that wild felids may extensively use and breed in habitats beyond PAs, including areas with extensive edge-habitats, especially when these areas provide predator cover and support ungulate prey (Lewis et al., 2015; Chanchani et al., 2016; Kafley et al., 2016). These findings also raise questions about how tiger populations can be sustained in multi-use forests, beyond existing Tiger Reserves the which requires the creation of strictly inviolate zones as essential for tiger conservation (eg. Jhala et al., 2021) multi – use landscapes. To shed light on these contrasting strategies, we investigated whether tiger densities were lower at habitat edges, and assessed how edge-use was influenced by vegetation cover, prey availability and human-use.
We carried out camera trap surveys to estimate variation in tiger density as a function of prey abundance, habitat type, and human-use in several PAs and MUFs in the Central Terai Landscape (CTL) in North India. We estimated these relationships at two spatial scales. At the broad spatial scale (management unit, for example national park or Reserved Forest), we hypothesized that tiger abundance would be greater in PAs, especially when connected to other PAs in the CTL. At finer spatial scales, defined by a mesh of points, each representing an area of (0.34 km2), we tested four hypotheses: 1) spatial gradients in prey density would best explain fine-scale spatial variation in tiger density; 2) open-canopy forests would support higher tiger densities than closed-canopy forests; 3) tiger density would decline as distance to large grasslands increased; and 4) tiger density estimates would not differ between PAs and MUFs, and between forest interior and edge areas.
The CTL (Figure 1) spans 5400 km2 abutting the lower Himalayan Ranges in the states of Uttarakhand and Uttar Pradesh in India and southwest Nepal. The CTL is recognized as a globally important eco-region and supports numerous endemic and endangered plant and animal species (Olson and Dinerstein, 1998), including tigers, hog deer (Axis porcinus), swamp deer (Rucervus duvaucelii), rhinoceros (Rhinoceros unicornis), and elephants (Elephas maximus). Key vegetation communities are deciduous forests dominated by Sal and grasslands characterized by Saccharum spontaneum, Themeda arundinacea, Narenga porphyrocoma, Imperata cylindrica and associated species (Dinerstein, 1980; Johnsingh et al., 2004). The regions grasslands and associated wetlands, important habitats for large mammals, have been greatly reduced in extent by agricultural expansion from historic to more recent times (Peet et al., 1999a, Peet et al., 1999b; Johnsingh et al., 2004). Today, the CTL is one of the most densely populated regions across the tiger’s range with human population density of about 600 persons/km2 and population growth rates of about 30% (in the 2001–2011 decade). Aside from the region’s forests, the only areas that have escaped extensive land use change lie in immediate proximity of the Sharda and Ghaghra Rivers that experience extensive annual floods during the monsoons.
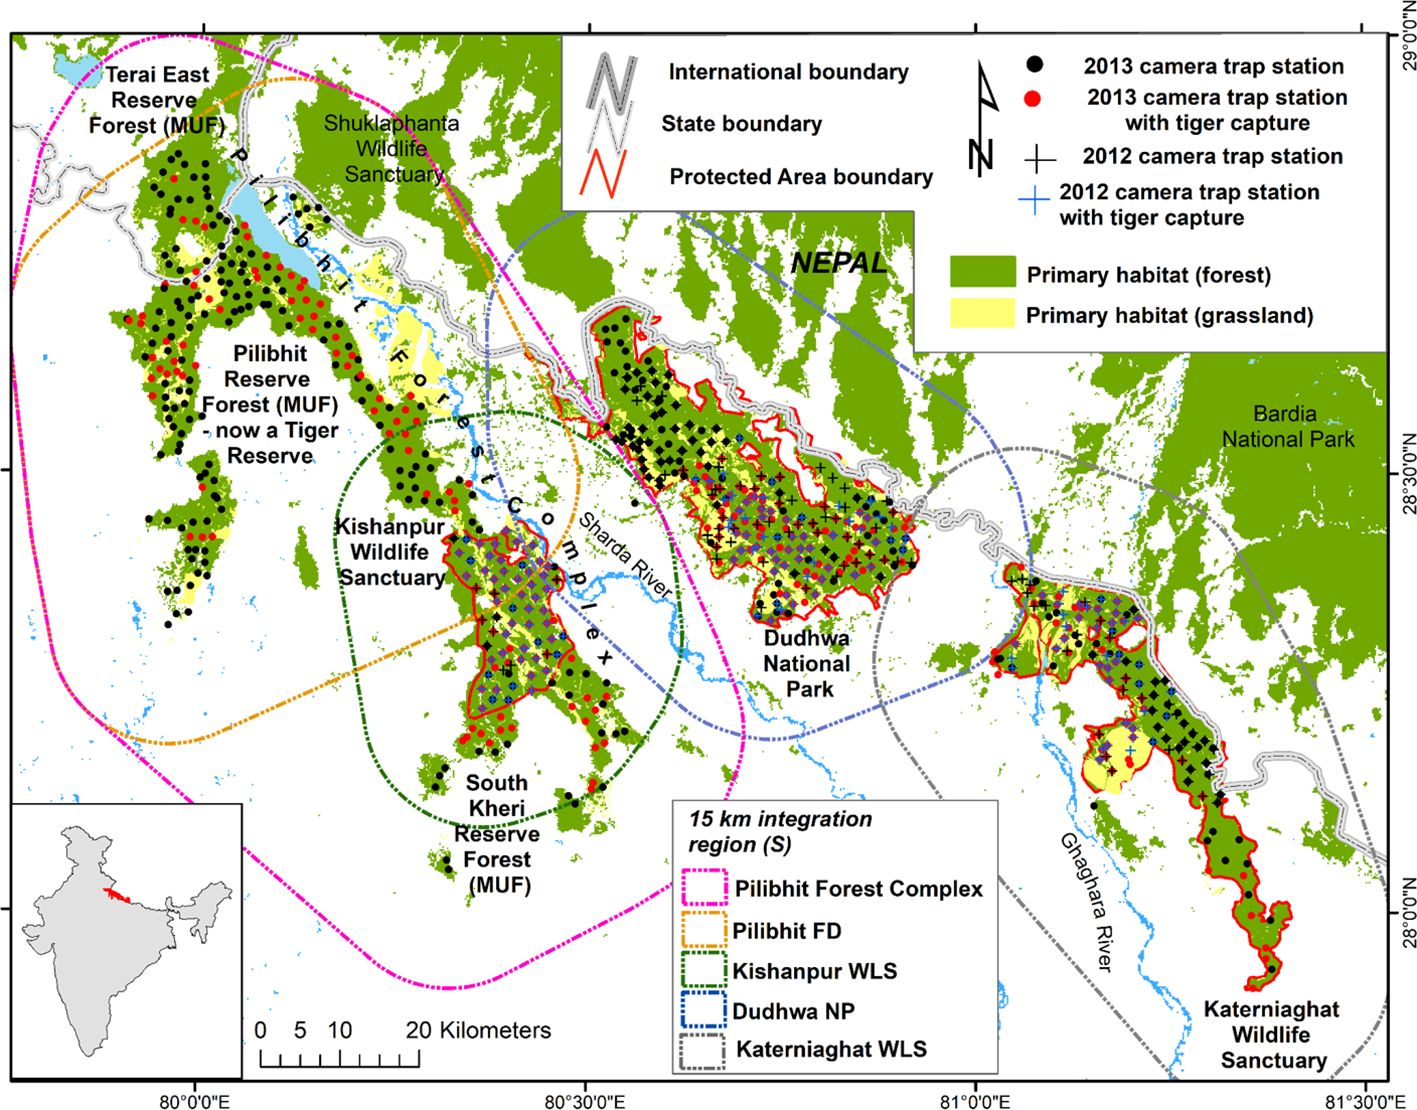
Figure 1 Map of the Central Terai Landscape depicting locations of camera traps, with and without tiger captures, in 2012 and 2013. The region of integration associated with each site’s density estimate are depicted as polygons. The region of integration was delineated using a grid of evenly spaced points each representing an area of 0.336 km2. Points that intersected “habitat” were all assigned covariate values, whereas points in non-habitat areas were masked-out from the analysis.
Our study area included three PAs and three MUFs within the CTL (Figure 1; Table 1). The PAs, including Dudhwa National Park and Kishanpur and Katerniaghat Wildlife Sanctuaries, were established between 1972 and 1977 and are collectively known as the Dudhwa Tiger Reserve. Management actions in Tiger Reserves like Dudhwa prioritize the conservation of habitats for tigers and other wildlife. In contrast, MUFs in the CTL were managed for timber production, via selective felling, for approximately 150 years. In addition, these MUFs are extensively used by local communities to extract fuel-wood, fodder and other resources (Strahorn, 2009).
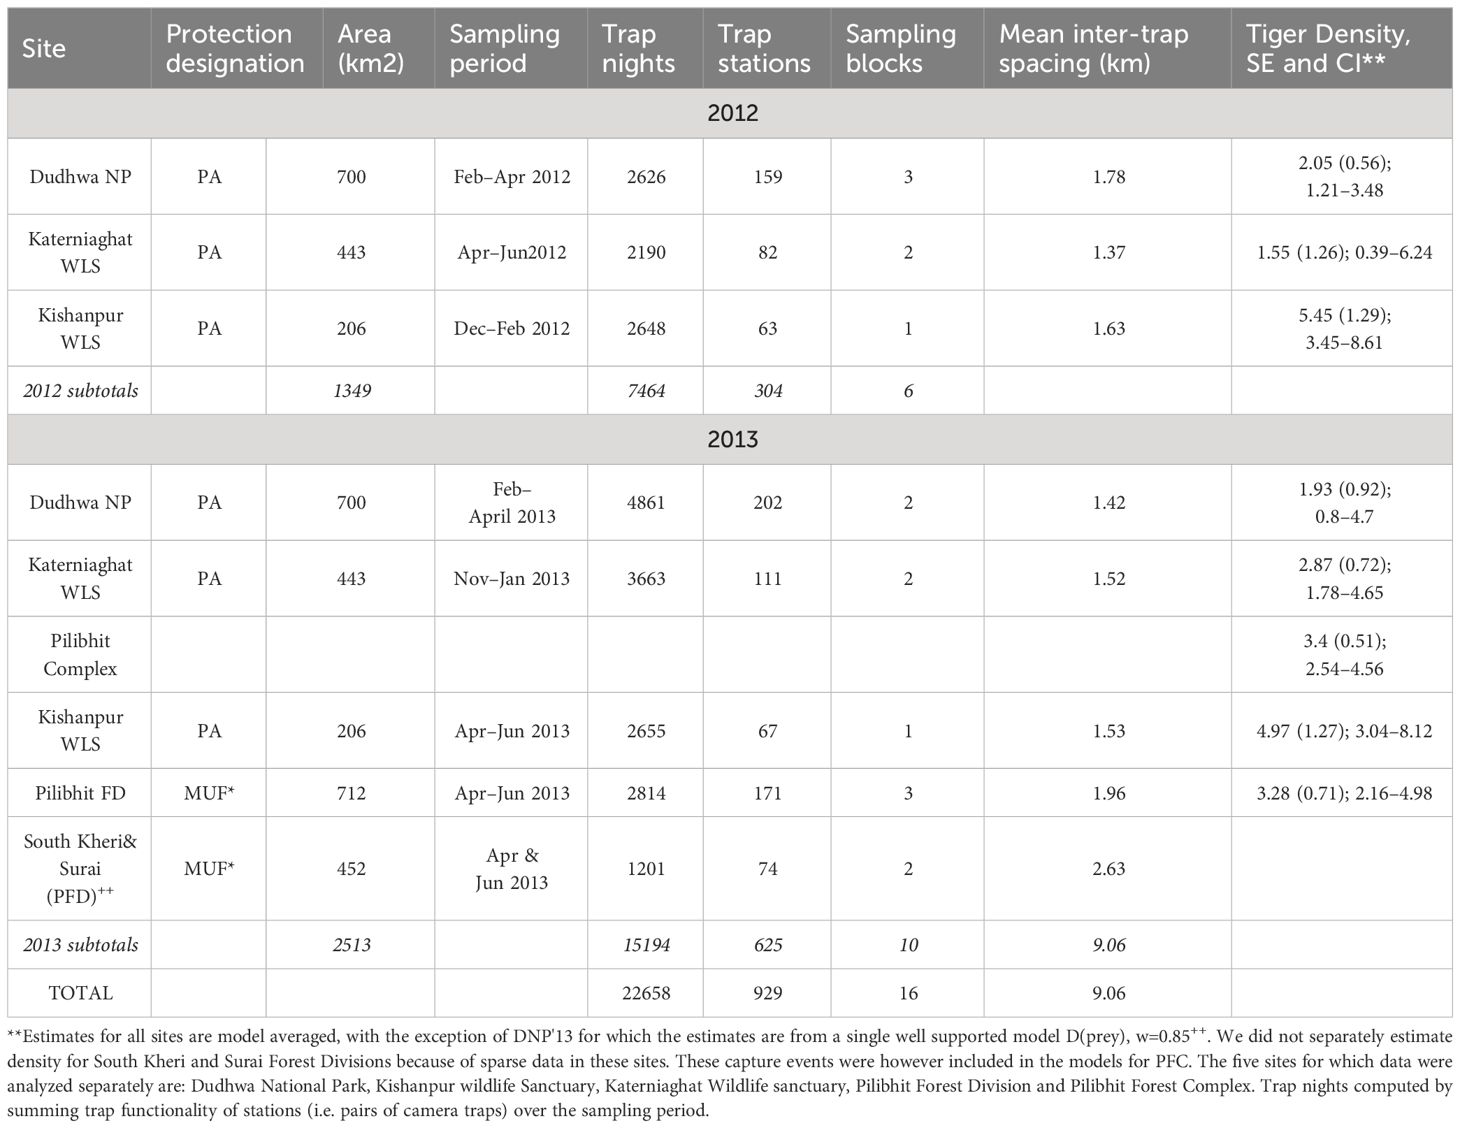
Table 1 Details of camera trap sampling for tigers in the Central Terai Landscape (2012 and 2013).
The three MUFs, collectively called the Pilibhit Forest Complex, (PCF; 1400 km2 in extent) lie within the largest area of contiguous primary forest and grassland habitat in the CTL. The largest MUF within the PFC,was re-designated as Pilibhit Tiger Reserve in 2014, based on the results of our study. Within the CTL, Dudhwa National Park has limited connectivity to other tiger habitats, while the other PAs and MUFs are connected, via conservation corridors, with tiger habitats in Nepal (Figure 1; Chanchani et al., 2016).
We sampled tiger populations using camera traps from November 2011 to June 2012 and November 2012 to June 2013. Each sampled area (PA or MUF) was referred to as a “site” (Table 1, Figure 1). Each site was sampled for ≤ 60 days to meet the assumption of demographic closure required by the closed-population, capture–recapture analyses we conducted (Karanth and Nichols, 2002; Royle et al., 2009; Table 1).
Each sampling station consisted of a pair of cameras (Cuddeback Attack, Cuddeback INC. WI, USA) housed in metal security cases and secured to a post or tree 2–5 m from the edges of trails or unpaved roads, about 50–60 cm above the ground. Camera trap stations within the survey grid were spaced 1–2 km apart. To maximize the probability of capture, camera stations were installed in carefully selected locations, for example, at wildlife trail intersections and along drainages. Camera trap data were downloaded every 5–7 days.
We had too few cameras to survey a site in its entirety using a single survey block (camera traps deployed across a site simultaneously). Therefore, we employed an incomplete trap layout design (Karanth and Nichols, 2002; O’Brien and Kinnaird, 2011), and sampled large study sites using 2–3 survey blocks. Each block of camera trap stations was active for 15–30 days, after which cameras were moved to an adjacent block (Table 1). In Katerniaghat WLS, we sampled approximately 30% more area in 2013, than in 2012. In DNP, a similar area was sampled in 2012 and 2013 (Figure 1).
Photographs of adult tigers (post-dispersal, ≥ 2 years of age) were visually analyzed by three independent observers to identify unique individuals. In addition, we used pattern recognition software (Extract Compare; Hiby et al., 2009) to corroborate identities of all usable images in the dataset (a library of tiger images is available online; Chanchani et al., 2014a; Appendix S1). Detection history matrices recorded tiger capture histories, referenced by individuals, trap station (location) and sampling occasion (24-hr period, within the sequence of days over which cameras were active).
By estimating the locations of individual activity centers based on animal movement within the trap array, spatially explicit capture recapture (SECR) models provide model-based estimates of density (D) (Borchers and Efford, 2008; Royle et al., 2013; Efford et al., 2015).
In SECR, the probability model for detection histories includes parameters for the distribution of activity centers (both within and beyond the trap area), and for detection probability (assumed to be<1 and decline with increasing distance from an animal’s activity center to a trap). We estimated detection probability as a function of two parameters – a spatial scale parameter (σ) and a baseline detection probability (g0; the probability of detection assuming that a camera trap location is coincident with an individual’s activity center) (Efford et al., 2009). Because individuals within a population may have vastly different space use (e.g., males have larger home ranges than females), g0 and σ may co-vary. In such cases, estimates were obtained by replacing the conventional detection parameterization g0 and σ by an alternate “compensatory heterogeneity” parameterization a0, σ (Efford and Mowat, 2014). Compensatory heterogeneity implies a negative covariance between g0and σ among individuals of one or both sexes. This occurs when the differences in detection probability of a given animal at specific locations are directly proportional to the amount of time it spends at different locations within its home range (Efford and Mowat, 2014). The distribution of animal activity centers in SECR models can be described as a homogenous or inhomogeneous Poisson point-process. Homogeneity implies that the expected value of density is uniform across the state-space over which activity centers are distributed (a pre-defined part of the model), whereas an inhomogeneous point process implies that density varies across space, as a function of environmental covariates (Efford and Fewster, 2013).
We used SECR models (maximum likelihood parameterization implemented in the R package secr, version 2.9.5; Efford, 2015) to test hypotheses about spatial heterogeneity in tiger density (Table 2). We assumed that the distribution of tiger activity centers followed a Poisson point process (Efford and Fewster, 2013). Following Royle et al. (2009), we delineated a grid (580 × 580m) over which individual tiger activity centers could be distributed. This state space included the tigers’ primary habitats, forest and grassland areas. Each square gird cell (0.34 km2) represented a potential activity center. The region S (integration region) over which activity centers could be distributed was defined collectively by a habitat mask comprising of the camera trap array, a 15 km buffer around the trapping array that included forests, grasslands and other features identified as “habitat”.Tiger density was estimated separately for each site (Table 1) using a two-step procedure in a multi-model hypothesis testing framework (Burnham and Anderson, 2002; Doherty et al., 2010). First, we assessed relative support for models with alternate parameterizations of g0 and σ, or a0 and σ with and without sex-specific heterogeneity. Because male home range sizes are generally larger than those of females (Smith, 1993; Sollmann et al., 2011), we allowed detection parameters to vary by sex using a two-class hybrid mixture model (Efford, 2014). The hybrid mixture model includes a mixing proportion parameter ‘pmix’, which enables class-specific modeling of detection parameters and sex ratio estimation. Further, we fit three additional models: common detection parameters for all individuals [g0(.), σ(.)] and sex-specific heterogeneity with respect to g0 or σ (models [g0(sex), σ(.)] and [g0(.), σ(sex)]. Finally, we evaluated support for the compensatory heterogeneity parameterization (a0, σ) by building one additional model [a0(.), σ(sex)]. For all five alternative detection function parameterizations, we retained a “global” structure for density, allowing it to vary as a function of four covariates: distance to large (>1km2) grasslands (‘grass’), percentage of tree canopy cover (‘treecov’), prey density (‘prey’), and distance to nearest forest edge [‘edge’; model: D(grass+treecov+prey+edge)]. Relative support for models was assessed using Akaike Information Criteria (AICc) adjusted for small sample sizes (Burnham and Anderson, 2002). The best supported model (lowest AICc score) from each model set was selected and carried forward into the second analysis step.
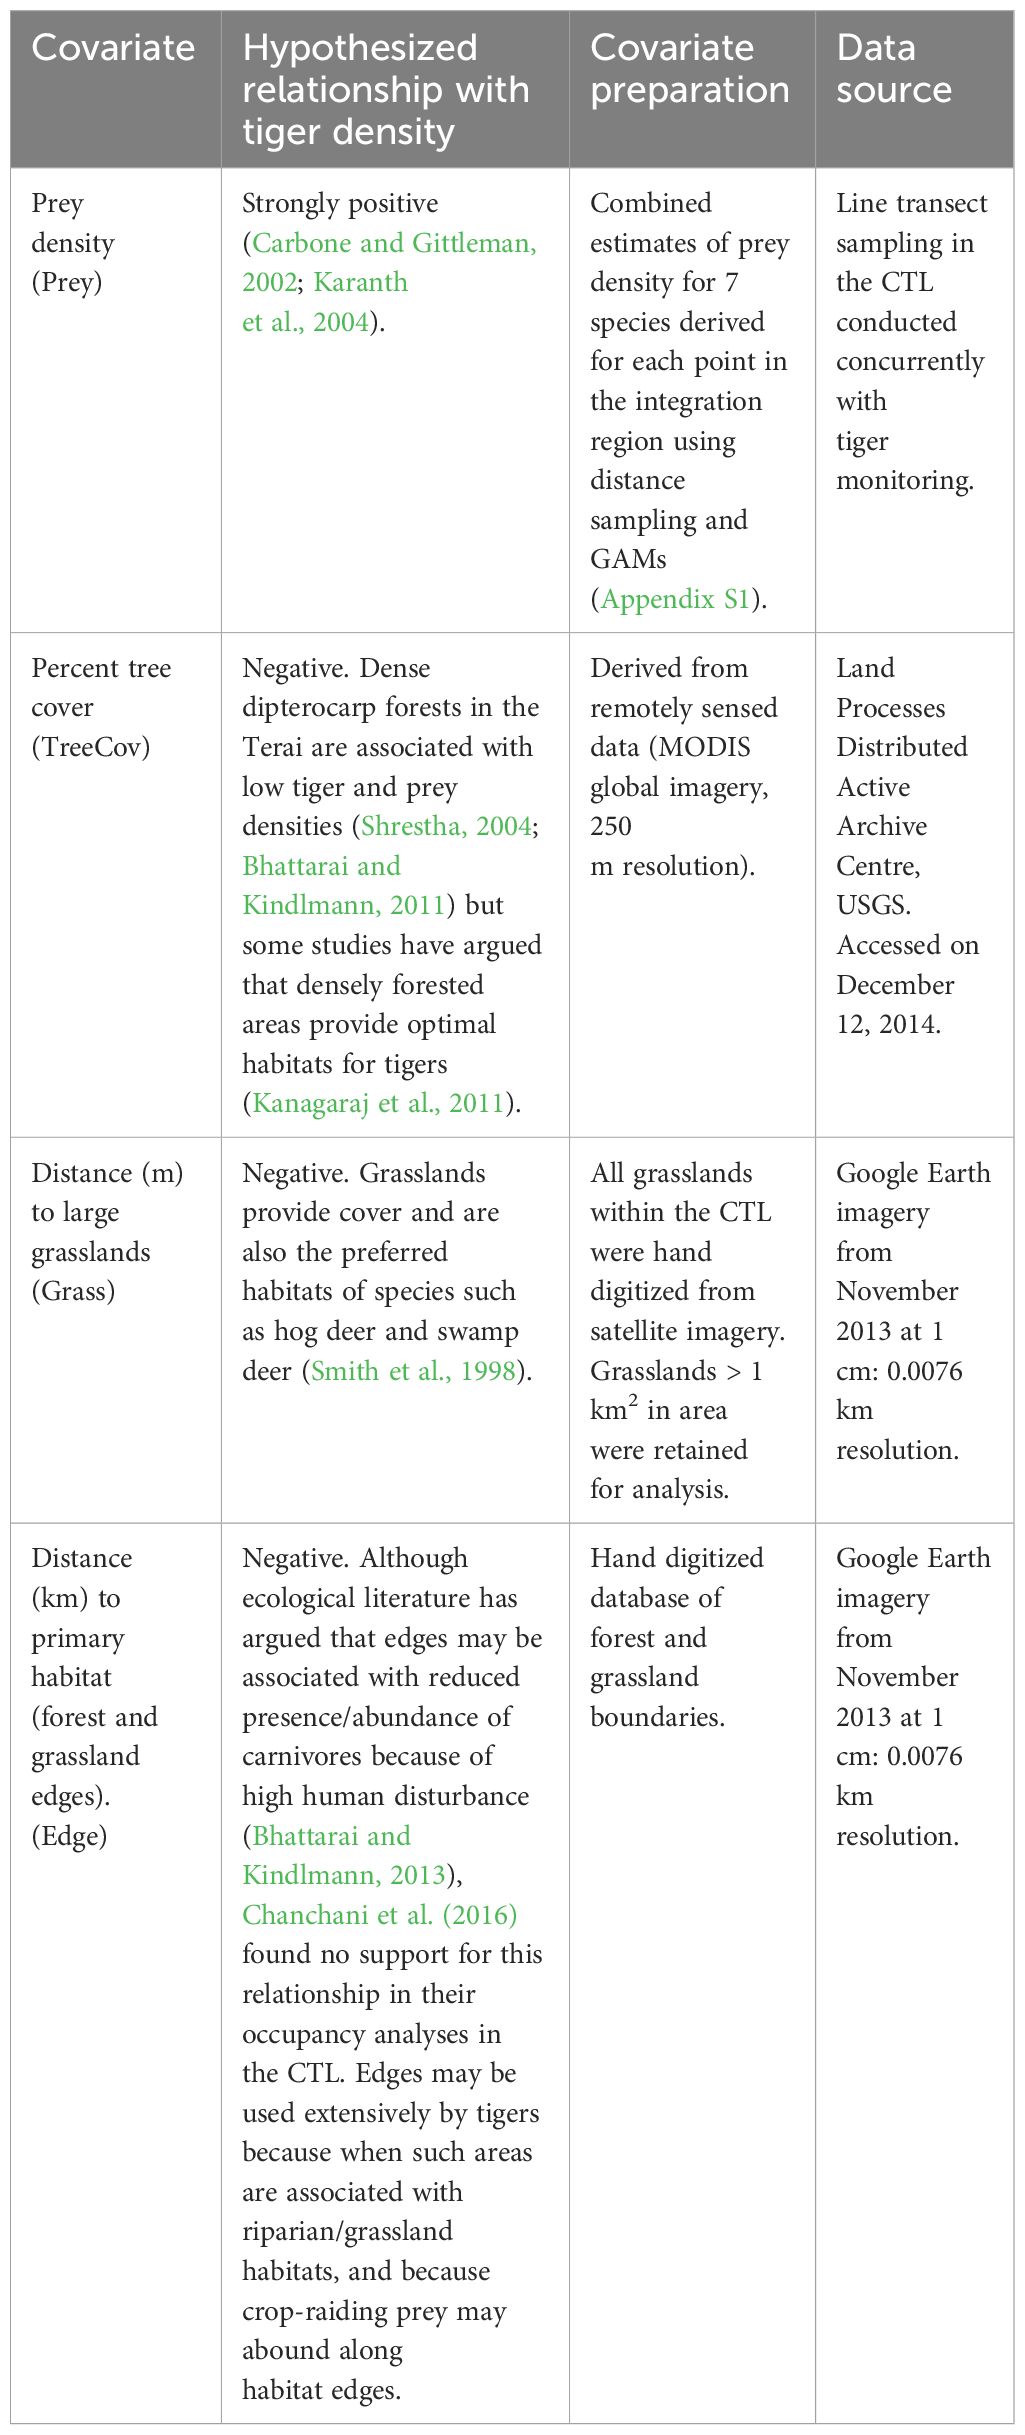
Table 2 Candidate covariates available in model-fitting to explain spatial heterogeneity in tiger density.
We retained the best supported covariate structure for the detection parameters, in subsequent models. For each of our data sets (Table 1), we fit 15 models that represented our a priori hypotheses about the relative effect of prey density, habitat (vegetation cover) and proximity to edges on fine scale spatial variations in tiger density (Appendix S3: Table S1). We compiled values for five covariates (prey density, distance from grasslands, percent tree cover, distance to forest edges and distance to the international border) for each point (potential tiger activity centers), representing a 580 × 580 m (0.34 km2) area over the integration region (Table 2).
Spatial variation in prey density is the strongest predictor of heterogeneity in tiger density. We derived spatially explicit prey density estimates from variable-distance line transect data (Buckland et al., 2001). Sparse detections of several ungulate species (e.g., swamp deer) precluded species-specific modeling of parameters. As a result, we combined detection records for seven ungulate species – chital, wild pigs, nilgai, hog deer, swamp deer, barking deer and sambar – and estimated the cumulative detection probability and density for all seven species using program Distance (Buckland et al., 2001) (Appendix S1). Subsequently, we estimated spatial heterogeneity in ungulate density, as a function of environmental covariates, using generalized additive models to generate density surfaces (Miller et al., 2013). These spatially explicit estimates of prey density served as a covariate in the tiger SECR models (Appendix S1).
Areas with dense tree canopy cover (e.g., Sal forests) would have lower tiger and prey densities, a result of minimal understory plant productivity. Tree canopy was estimated from a remotely sensed global tree canopy cover database (Table 2).
Tiger densities would decrease as a function of increasing distance from grasslands. Distance to large grasslands was estimated by digitizing all tall and short grasslands >1km2 from remotely-sensed imagery.
Tiger density will be lower along the international border with Nepal, a region with very high human-use and high poaching pressure (Wikramanayake et al., 2010; Chanchani et al., 2014b). To test this hypothesis, we estimated two covariates – distance from each potential tiger activity center to the nearest habitat edge (PA or MUF boundary), and distance to India’s international border with Nepal (Table 2).
We established camera trap grids over larger areas of PAs and MUFs in the CTL than in previous surveys conducted under the India Government’s official tiger monitoring program (Jhala et al., 2011). To ensure that our estimates were comparable to those from previous surveys, and to disentangle sampling effects on estimates of density from previous studies, we sub-sampled data from 2013 to replicate survey effort (coverage) from previous camera-trap surveys (Harihar et al., 2017). This adjustment also allowed us to assess whether density estimates from small trapping grids can be extrapolated to predict density across large contiguous habitat tracts (Appendix S4).
Prior to implementing the SECR analysis, we tested for correlations among the five covariates. The distance to international border covariate was subsequently excluded from analysis because it was strongly correlated with prey density (R=0.78). Pair-wise correlations were < 0.5 for all other covariates. We assessed relative support for models using AIC based on model weights (w), adjusted for small sample sizes.
We estimated tiger abundance (N) as the number of activity centers within the boundaries of PAs and MUFs (Efford and Fewster, 2013). In addition to density estimates, we N within the specific boundaries of an administrative region, such as an individual PA (Efford and Fewster, 2013). The boundaries of these regions were a subset of the integration region (S) for each site (Figure 1). We compiled and compared model-averaged estimates of N for all 15 models, and for all eight model sets (Figure 2; Appendix S3: Supplementary Table S1).
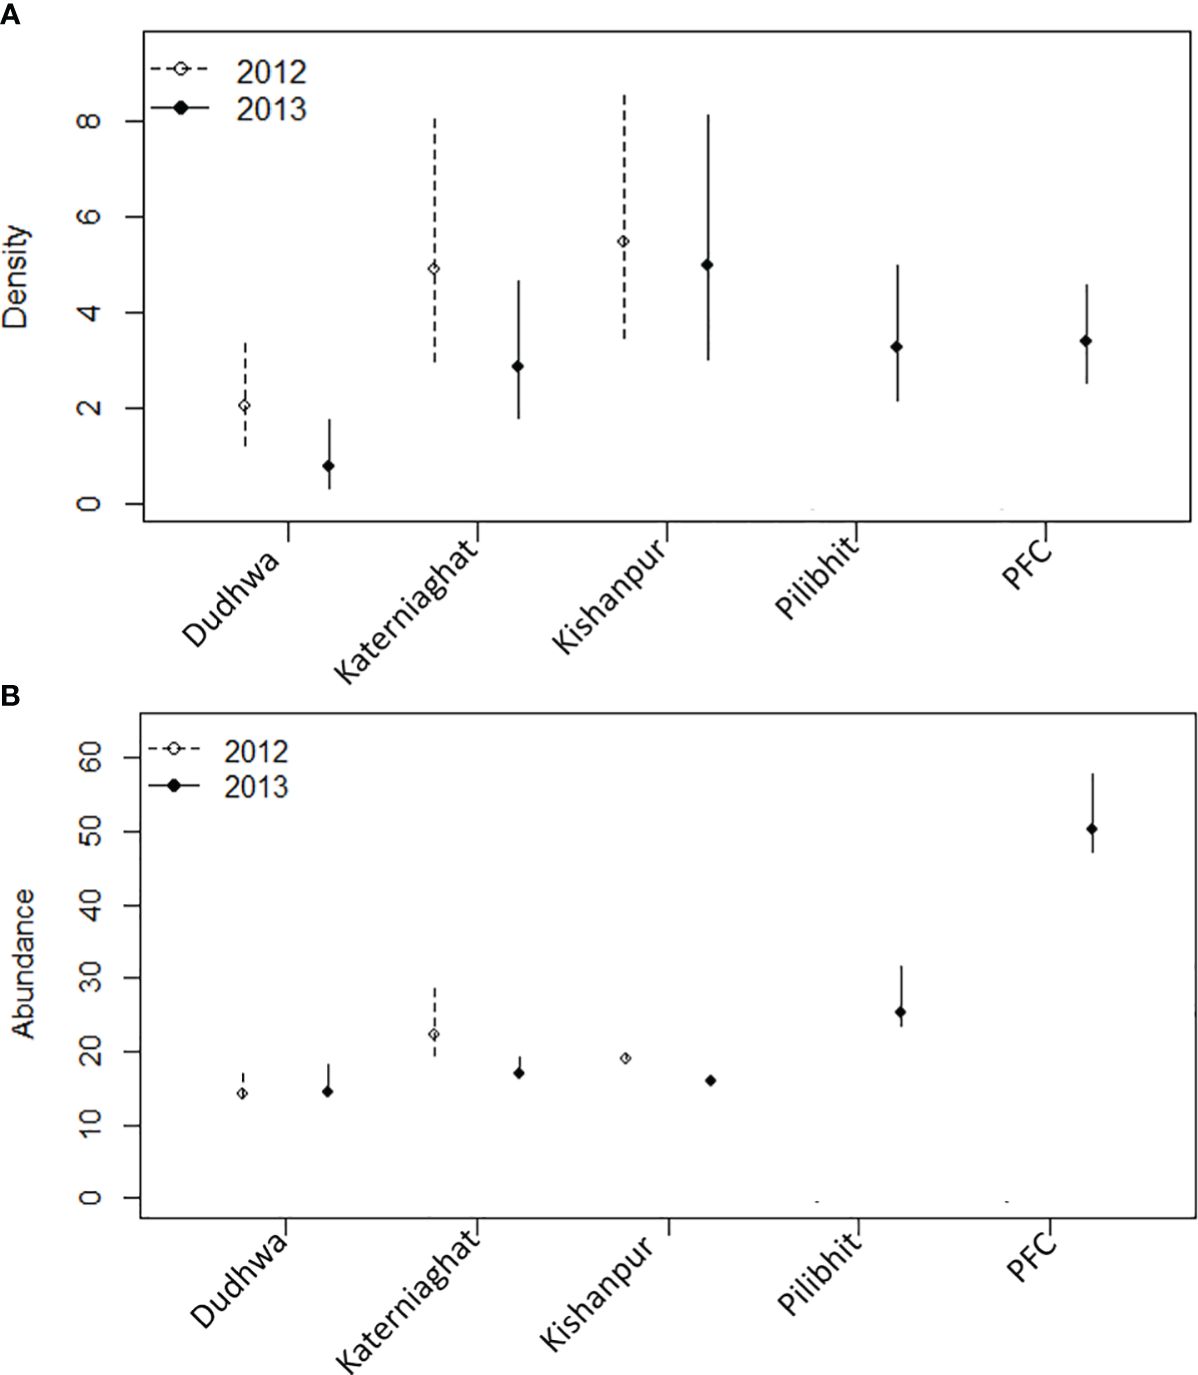
Figure 2 (A) Estimates of tiger density (individuals/100 km2), (B) abundance, and associated 95% confidence intervals for the CTL (note scale differences on the y-axes). Separate estimates are provided for the five sites sampled in 2013 and three sites in 2012. All estimates are from the best supported model for each site/year. The D(.) model was the best supported model, with the exception of Katerniaghat in 2012 D(Grass) and DNP in 2013 D(Prey), for which estimates are for the median covariate value. PFC is the Pilibhit Forest Complex which included Pilibhit Forest Division, Kishanpur Wildlife Sanctuary and South Kheri Forest Division.
We sampled tiger habitats using 929 camera trap stations (304 locations in 2012 and 625 locations in 2013). Camera traps were cumulatively active for a period of 22,658 trap nights. The mean inter-trap distance was 1,36 m (Table 1). Over the study duration, cameras recorded1352 independent captures of 92 distinct adult tigers (45 males, 44 females) and two individuals of indeterminate sex (Table 3). Across the two years, the average number of recaptures/individual was 12.49 for adult male tigers (SD=15.70) and 9.33 for female tigers (SD=8.94; Table 3).
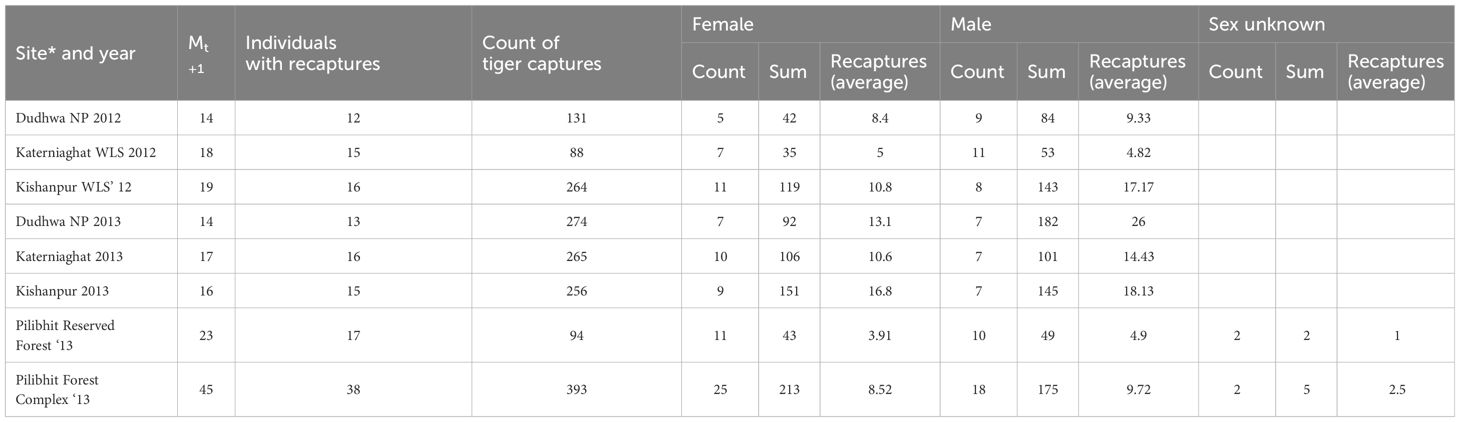
Table 3 Summary of photo captures of tigers from camera trap sampling in the CTL (2012 and 2013).
Model selection results from the first analysis step varied between sites and across years (Appendix S2: Supplementary Table S1). Sex-specific heterogeneity in the spatial scale parameter σ(sex) was supported in six of the eight model sets. In two of the six model sets, inclusion of the “compensatory heterogeneity” detection parameter [a0(.), σ(sex)] had greater support than the conventional baseline encounter parameter [g0(.), σ(sex)]. In addition, there was evidence of sex-specific heterogeneity for both g0 and σ[g0(sex), σ(sex)] in only one of the eight model sets. Lastly, the constant model [g0(.), σ(.)] was well supported (> 50% AIC weight) in only one of the eight model sets (Appendix S2: Supplementary Tables S1–S3).
Overall, tiger densities were higher in sites with higher prey densities, independent of management designation and degree of human disturbance. Site- and year-specific estimates of tiger density (individuals/100 km2) were highest for Kishanpur Wildlife Sanctuary = 5.45 (SE=1.29), KWLS = 4.97 (SE=1.27). Tiger density was the lowest for Dudhwa National Park, [DNP = 2.05 (SE = 0.56) = 1.88 (SE = 0.52)]. The other PAs and MUFs had intermediate tiger densities: Katerniaghat Wildlife Sanctuary [KGWLS = 4.76 (SE=1.14), KGWLS = 2.78 (SE=0.72)]; Pilibhit Reserved Forest [PRF = 3.028 (SE=0.71)]; and Pilibhit Forest Complex [PFC = 3.4 (SE=0.51)] (Figure 2; Appendix S3: Table S1). In the three sites surveyed in 2012 and 2013, estimates were marginally higher in 2012 than in 2013, but less precise (Figure 3; Appendix S3: Table S1). Corresponding estimates of prey density (combined for all ungulates) were 29.81 (SE=5.69) animals/km2 in KWLS, 13.64 (5.28) in DNP, 4.4 (1.55) and 22.4 (8.10) in KGWLS (in forests and grasslands respectively) and 40.05 (SE=0.23) in PFD (Bista, 2011; Chanchani et al., 2014a).
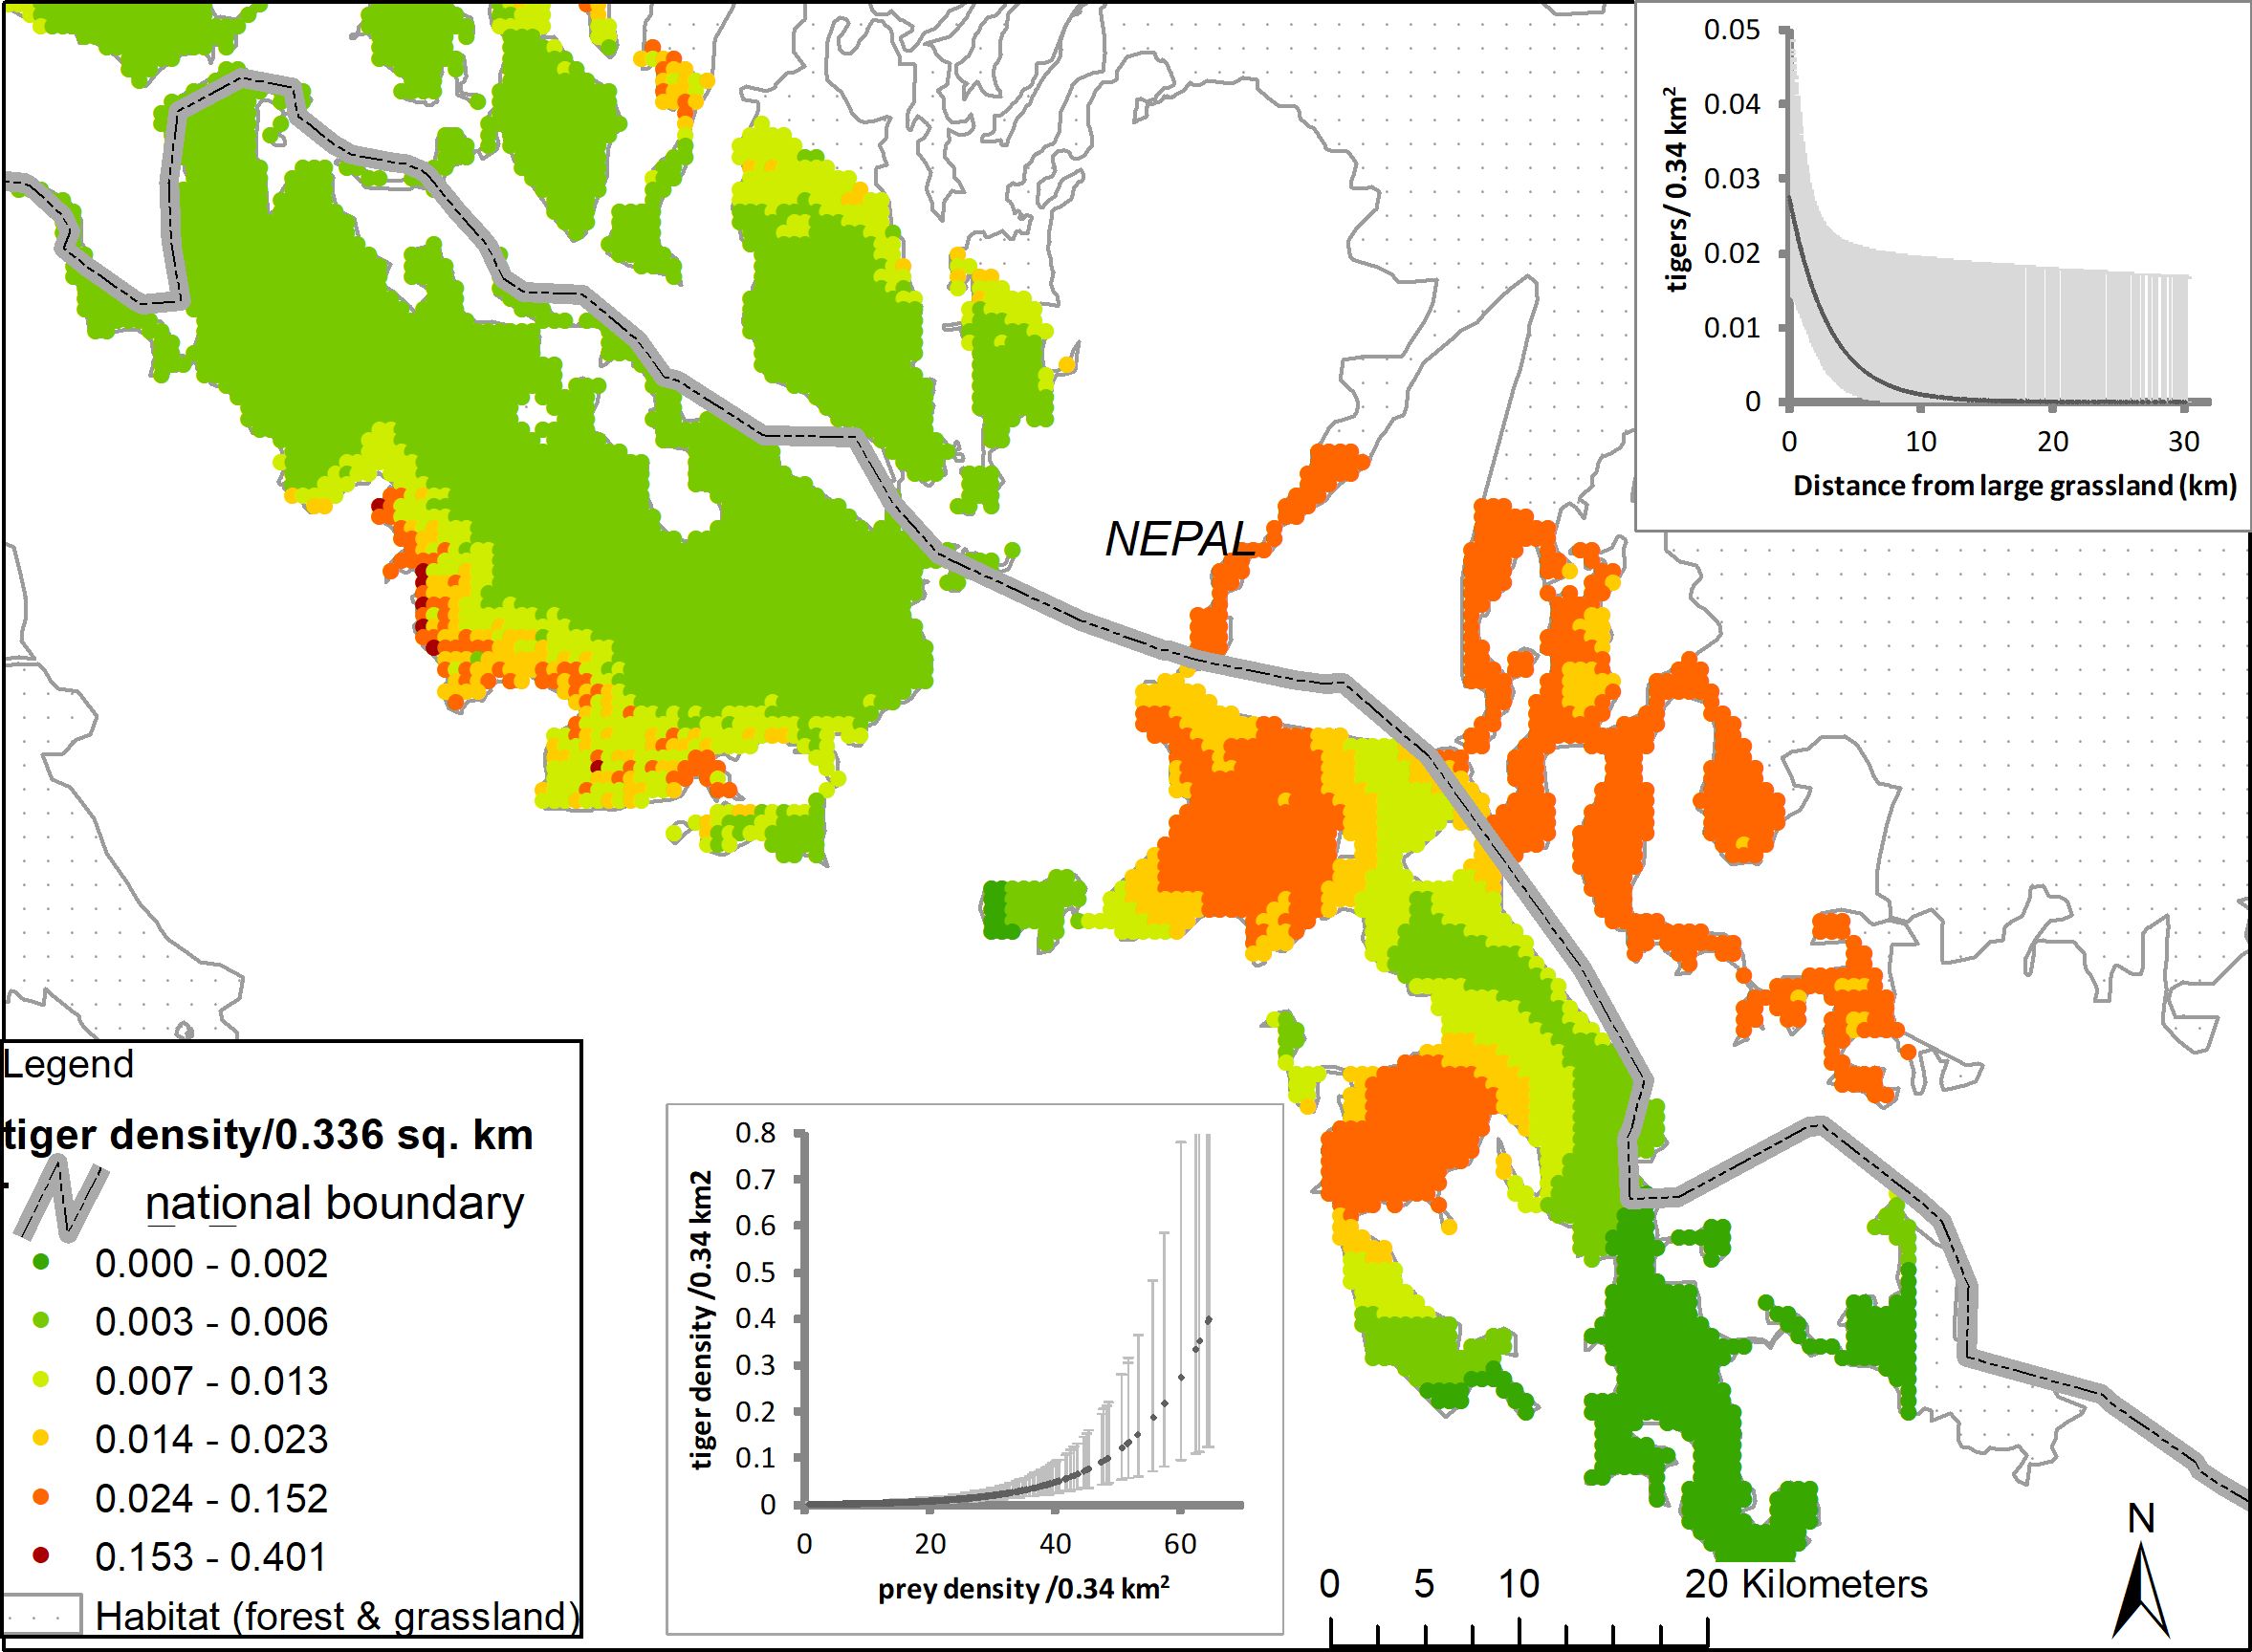
Figure 3 Density surface output for Dudhwa National Park and Katerniaghat Wildlife Sanctuaries. Inhomogeneous point process models D ~ (prey) in DNP 2013 and D ~ (distance to grasslands) in Katerniaghat 2012. Each point on the map represents a habitat area of 0.34 km2 within the integration regions of Dudhwa and Katerniaghat, respectively. Cool shades (blues and greens represent areas with higher tiger densities, warm shades (yellows and reds) represent areas of low density. Covariate relationships with tiger density for the two sites, and associated 95% confidence intervals have also been plotted.
Model-averaged estimates of σ were approximately two times higher for male (range: 2.08–6.931 km) than for female tigers (range: 1847–2962 m; n= 6 site/year combinations; Appendix S3: Table S4). Estimates of σ were largest for both males and females in Katerniaghat Wildlife Sanctuary, a site with even sex ratios and lower tiger density. In contrast, the lowest estimates of σ were recorded in Pilibhit Forest Division and Kishanpur Wildlife Sanctuary, where sex ratios were female-biased, and tigers occurred at relatively higher densities. Both σ and g0/a0estimates and their CIs were similar across all 15 models assessed in the eight model sets (Appendix S3: Supplementary Table S4). Estimates of σ were consistently higher in 2013, than in 2012, especially in Dudhwa National Park and Katerniaghat Wildlife Sanctuary where survey effort was greater in 2013 (Table 1).
Similar to broad-scale patterns in tiger density, variation in prey abundance explained the greatest amount of the fine-scale variation in tiger density (Table 4). Hypothesis 1, was strongly supported in Dudhwa National Park (2013), where the model (D(Prey)) had 85% overall support (Appendix S3: Supplementary Table S1). In Dudhwa, there was a steep gradient in prey density: high in the south and low in the north (Figure 3; Appendix S6). In four of the seven additional model sets, [D(Prey)] contained >10% of the model support. The distance to grassland (hypothesis 2) model [D(Grass)] had support (w=0.48) only in the model sets pertaining to Katerniaghat Wildlife Sanctuary (2012). In Katerniaghat WLS, grassland habitats occur only in its eastern and southern reaches, with the remaining areas dominated by dense, even-age deciduous forests. In other sites where grasslands were distributed more uniformly, the distance to grassland covariate received less support.
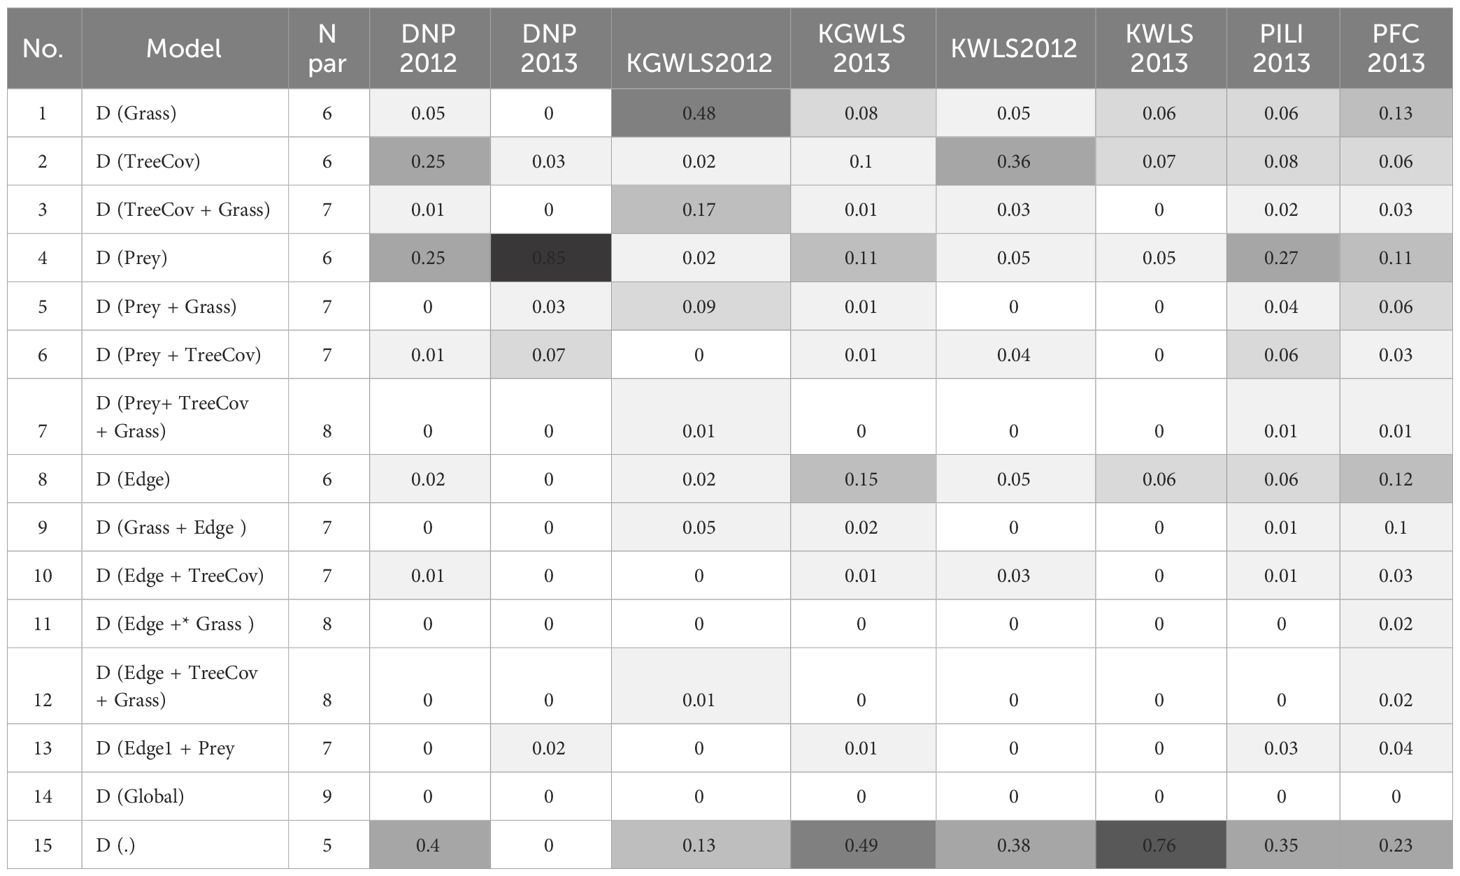
Table 4 Relative support for the 15 alternate models that were run for each site. AICc weights are reported, and darker shades represent greater support.
Hypothesis 2 – vegetation, and hypothesis 3 – edges (TreeCov and Edge) had less support than models with no covariates [null model, D(.)] in seven of eight model sets. Overall, in six of the eight model sets, the null model had the most support. AICc weight for the [D(.)] model varied between 0.8 in Kishanpur Wildlife Sanctuary (2013) and 0.23 in Pilibhit Complex (2013) (Appendix S3: Supplementary Table S1). In several sites, models with one or more covariates had similar support to the null model. Because the addition of one or more covariates did not result in improved model fit, these models were considered uninformative (Arnold, 2010).
The largest tiger population in the CTL was recorded in the PFC (2013 = 50.54, SE=2.63), which at the time of our study was composed on >80% MUF (Figure 1). Within the PFC, the largest tiger population was recorded in Pilibhit Forest Division, a MUF (2013 = 25.22; SE= 1.71). The 200 km2 Kishanpur Wildlife Sanctuary – which is the sole PA within PFC,supported a large tiger population (2012 = 19.21; SE=1.54) and (2013 = 16.0; SE = 0.02).
Dudhwa National Park supported a relatively small population of tigers (2012 = 14.25, SE = 0.51; 2013 = 14.16, SE = 0.41). Dudhwa is similar in size to Pilibhit Forest Division, but only connected to other tiger habitats in India through corridors spanning agricultural land. Large areas of Dudhwa National Park support low prey densities (Figure 5; Appendix S6). In Katerniaghat Wildlife Sanctuary, the estimated number of tigers was 2012 = 19.21 (SE = 1.54) and 2013 = 17.11 (SE =0.33) in 2012 and 2013, respectively. Katerniaghat is 40% smaller than Dudhwa National Park and the two PAs have similar prey densities.
Estimated sex ratios for adult tigers were female-biased in Kishanpur WLS, but male-biased or equal in Dudhwa NP and Katerniaghat WLS (Table 3). Significantly, sex ratios varied over the two years of study. Even though density estimates were similar across years, at several sites (e.g. Katerniaghat WLS, Dudhwa NP), there was a high turnover (~30%) of adult tigers between successive surveys (for age and sex-specific details of tiger captures, see Appendix S5: Figure S1). The point estimates for the 15 models within each of the eight model sets (site × year) were consistent, with similar precision (Figure 2; Appendix S3: Table S1).
Tiger densities varied considerably across sites, both within PAs and MUFs. In our study area, the only management unit that supported a population with > 25 adult females was the Pilibhit Forest Complex. This result was surprising given that ~ 85% of this areas was managed as MUF with selective logging operations and high levels of day-time human-use. In contrast, the region’s two largest PAs, with an emphasis on wildlife management for several decades, supported fewer tigers at lower densities.
It is increasingly being recognized that large carnivores may extensively use areas beyond PA boundaries, including edge habitats and agricultural lands even if they face elevated mortality risks in such areas (e.g. leopards in South Africa, Balme et al., 2010). In India, several MUFs and PAs outside of the CTL, and with high human-use, support tiger populations with densities similar to nearby PAs (e.g., Ramnagar, 24-Parghanas (Sunderbans), Wayanad and Sathyamangalam (based on estimates from Qureshi et al., 2023). Globally, several other large carnivore species also co-occur with humans beyond PA boundaries. These include black bears (Evans et al., 2017), jaguars (Boron et al., 2016), snow leopards (Sharma et al., 2015), grizzly bears and wolves (Chapron et al., 2014), lions (Banerjee et al., 2013; Venkataraman, et al., 2020), Eurasian lynx (Basille et al., 2009) and leopards (Athreya et al., 2013; Kshettry et al., 2020) (Figure 4).
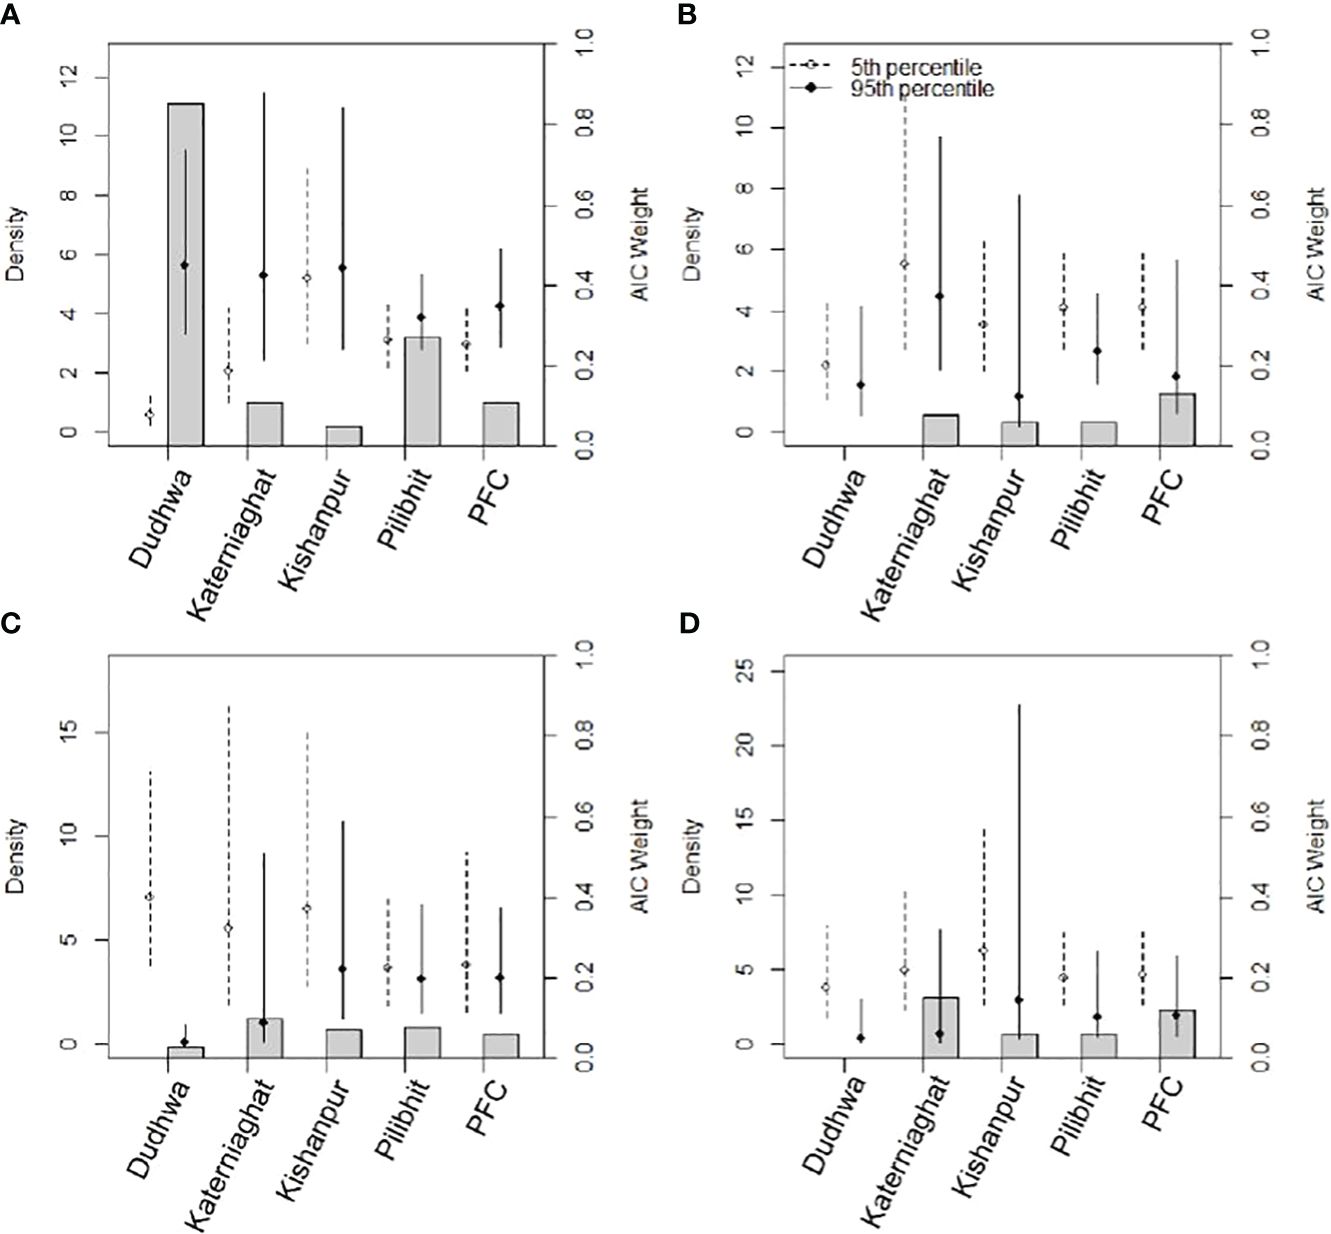
Figure 4 Estimates of tiger density and AIC support for five sites in the CTL (2013 data) from models representing our four key hypotheses (A) prey density; (B) distance to large grasslands; (C) percent tree cover and; (D) distance to habitat edges. Hollow circles and dotted error bars represent tiger densities and 95% confidence intervals associated with minimum covariate values (5th percentile), whereas solid circles and error bars are estimate of density and associated 95% confidence intervals near the upper boundary of covariate values (95th percentile). Gray bars (secondary y-axis) depict AIC weights associated with the models.
In our study, the presence of the largest tiger population in our study area in an MUF rather than in a PA is explained, at least in part, by the distribution and abundance of wild herbivores (tiger prey species) in the landscape. Previous research estimated the density of ungulate prey to be almost four-fold higher in Pilibhit (40.5 animals/km2), than in Dudhwa (13.6), whereas Kishanpur (29.81) and Katerniaghat (forests 4.41, grasslands 22.40) had intermediate prey densities (Chanchani et al., 2014a; Figure 5). The relationship between prey and tiger densities is well established and prey recovery programs are central to tiger conservation efforts across the species range (Karanth et al., 2004; Harihar et al., 2014). We note that at the fine spatial scale (580 m × 580 m secr mesh), the prey covariate was only supported in Dudhwa, where spatial heterogeneity in tiger densities strongly mirrored steep gradients in wild ungulate densities (Appendix S6). In contrast, prey and tiger densities were not as strongly spatially structured in other areas like Pilibhit Forest Division. Further, the absence of a consistent relationship between these variables across years is possibly a consequence of variation in survey effort between 2012 and 2013 in some sites (Appendix S4).
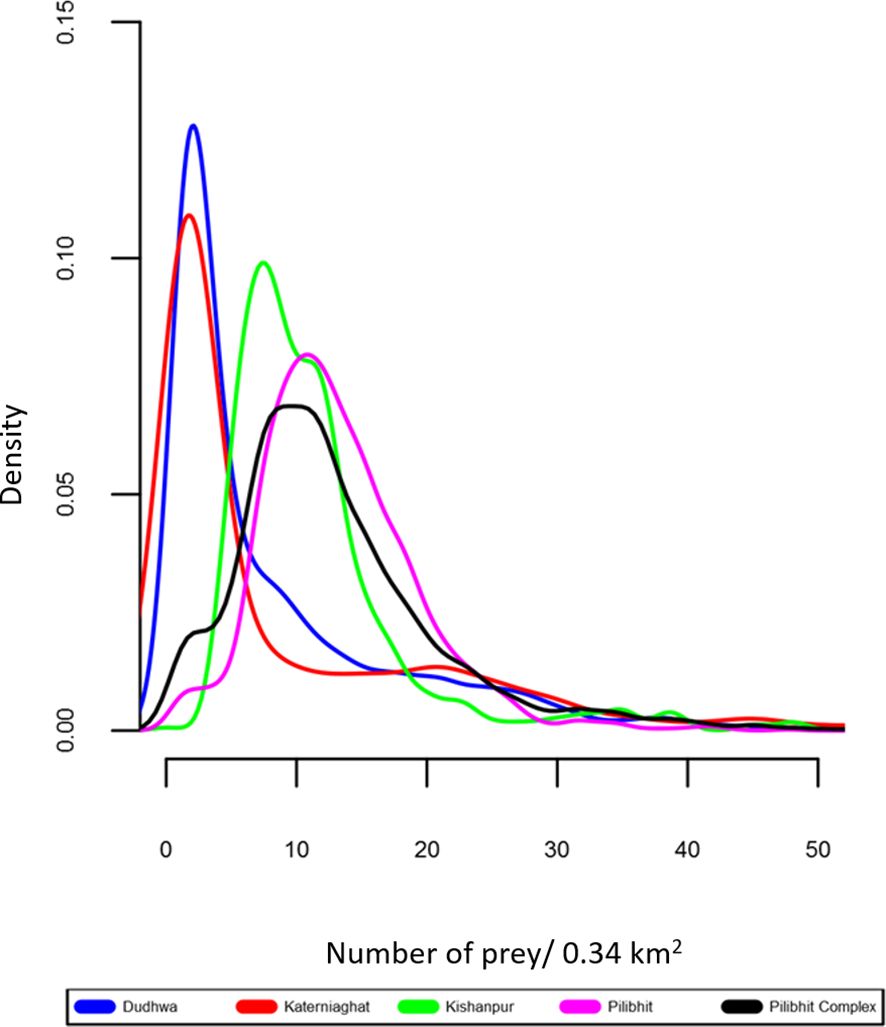
Figure 5 Density plot for distribution of prey density in the CTL’s five study sites. This depicts the distribution of prey densities. The peaks indicate the most common density value within a site, and the horizontal spread of the plots indicates the degree of spatial heterogeneity in estimated prey densities (wider plots indicate greater heterogeneity).
Similarly, proximity to grasslands did not consistently explain spatial variation in tiger densities. While terai grasslands have been associated with high herbivore densities (e.g. Wegge and Storaas, 2009), large tracts of tall grasslands in the study areas only supported low densities of wild herbivores, and were consequently associated with lower tiger densities than expected. The exceptions were grasslands where both short and tall grasses were found, including some areas with extensive livestock grazing. A likely explanation for low herbivore densities in tall grasslands is that palatable grasses for wild ungulates sharply declines within about three months of prescribed winter burning both in PAs and MUFs (Rastogi et al., 2022).
We did not find a statistically significant relationship between tiger densities and proximity to edges, with tiger density hotspots both occurring forest edges and within the forest-interior (Appendix S6). Edge-habitats, proximate to the agricultural matrix and human settlements, with extensive tiger use were also associated with high densities of wild prey, and usually had tracts of grasslands or forests with dense understory which tigers exploited as cover. Use of forest edge habitats may also be because tigers in this landscape extensively use the surrounding agricultural matrix (Warrier et al., 2020).
While large carnivores have persisted in some multi-use landscapes, previous research from the terai and elsewhere indicates tiger occupancy and density can be severely depressed in areas with extensive human use (MadhuSudan, 2004; Harihar et al., 2009). Our research raises important questions about factors and “mechanisms of coexistence” that may be critical in determining whether or not, and in what densities tigers occur in human dominated landscapes. We posit two working hypotheses in the context of our study.
First, vegetation attributes that affect the distribution and density of wild herbivores may be an indirect but primary determinant of carnivore density variation, relative to the influence of human presence. In our study area, large parts of the core zone of Dudhwa National Park, with very limited human presence supported markedly lower tiger densities than areas with much higher human “disturbance” – i.e. the PA’s edges or Pilibhit Forest Division in which wild herbivore densities were several orders of magnitude higher (Appendices S1, S6). The most likely explanation for this variation in prey densities is understory composition and palatability, as Dudhwa’s sal (Shorea robusta) dominated interior and shrubby understory supports lower ungulate densities relative to PA and understory of the Pilibhit Forest Complex.
Second, tiger densities in areas with high human use, may also critically depend on presence, extent and distribution of refuge habitats (Valeix et al., 2012; Chanchani et al., 2016; Grilo et al., 2019; Oeser et al., 2022). These are habitat tracts that are secluded, relative to surrounding areas which have higher human presence, where tigers can shelter away from people, hide and feed on kills, raise cubs, and survive, even if people are in close proximity, allowing tigers to behaviorally trade-off risk and resources, including through temporal adjustments of activity (Carter et al., 2012; Oriol-Cotterill et al., 2015). In multi-use landscapes, habitat refuges may exist in the form of tracts of marshy grasslands, steep and densely vegetated terrain, dense and thorny understorey, or even sugarcane thickets. Given adequate numbers of prey, the extent and distribution of such habitat refuges in an area may well be a critical factor that sets a ceiling on how many tigers the area can support.
Breeding tiger populations are unlikely to persist in areas where human presence is so pervasive that even such refuges are routinely intruded or degraded by excessive resource use or extraction. Likewise, tiger populations are unlikely to survive in areas where protection is deficient, and there are is high hunting pressures on tigers or their prey species (Dinerstein et al., 2007). In such contexts, it will be important to tease apart potential effects of hunting from other anthropogenic pressures (eg. livestock grazing, non-timber forest produce harvesting, and silviculture operations).
In summary, we argue that multi use landscapes that support tigers, or are envisioned as tiger-recovery areas represent “zones of coexistence”. Empirically identifying refuge habitats in such zones will be a critical strategy to effect recovery and enable tiger-persistence, provided such efforts are supported by local forest users. De facto refuge habitats within multi-use landscapes can help increase tiger survival rates (Carroll and Miquelle, 2006). Decision making regarding their identification and management should include local village institutions (e.g. Velázquez et al., 2009), and be informed by the resource access and land tenure rights of communities, levels of conflict, and levels of local acceptance of dangerous wildlife, like tigers and support for their conservation. Ultimately such areas may only support stable or growing tiger populations if comprehensive conflict management systems are in place, and if the tangible and hidden costs of conflict are adequately redressed (Karanth and Gopal, 2005; Goodrich, 2010).
Supporting information includes the following: Appendix S1 – Preparation of prey density covariate; Appendix S2 – Result summary from global models to ascertain supported detection covariates; Appendix S3 – Site and year specific estimates of density, abundance and detection parameters; Appendix S4 – Effect of reducing trap area on estimates of density and detection parameters (subset analysis); Appendix S5 – Details of tiger capture dynamics and inter-annual turn-over in sampled populations; Appendix S6 – Approximate home ranges of tigers photo captured on camera traps during the 2 years sampling period relative to the density of ungulate prey species.
The datasets presented in this article are not readily available because Tigers are an imperilled species and large spatial datasets can be shared with due approval from concerned authorities. Requests to access the datasets should be directed to pranav.chanchani@gmail.com.
Ethical review and approval was not required for the study on animals in accordance with the local legislation and institutional requirements. Non invasive sampling methods were deployed. Animals did not need to be captured or handled
PC: Designed study, conducted fieldwork, analyzed data, wrote and edited manuscript BN: Provided supervision for study design & analysis, edited manuscript AB & RW: conducted fieldwork, curated data, supported data analysis and edited manuscript SN & RS: conducted fieldwork, curated data and reviewed manuscript MG: facilitated fieldwork and edited and reviewed manuscript BG: supported data analysis and edited manuscript. All authors contributed to the article and approved the submitted version.
The author(s) declare financial support was received for the research, authorship, and/or publication of this article. This study was funded by the US Fish and Wildlife Service's Rhinoceros and Tiger Conservation Fund (grant numbers 96200-10-G138 and F12AP00925), WWF-India, and WWF's Kathryn Fuller Science for Nature Fellowship (agreement number R107101).
For permits and essential logistic support, we are especially grateful to Rupak De, S. Prasad, G. Bhatt, and many officers and field staff of the UP Forest Department. V.B. Mathur, B. Pandav and K Ramesh at the wildlife institute of India facilitated this project in its early stages. This study was enabled by WWF India’s Terai Arc Landscape Conservation Program and we are grateful for collaboration from D. Hassan, D. Ghose, S. Worah, J. Vattakaven, and J. Borah. We are indebted to S.S. Bisht, R. Ravi, M. D’Almeida, and our field assistants for contributing to data collection. Comments from L.L. Bailey, K. Crooks and N.T Hobbs and two reviewers helped us revise and strengthen this manuscript.
The authors declare that the research was conducted in the absence of any commercial or financial relationships that could be construed as a potential conflict of interest.
All claims expressed in this article are solely those of the authors and do not necessarily represent those of their affiliated organizations, or those of the publisher, the editors and the reviewers. Any product that may be evaluated in this article, or claim that may be made by its manufacturer, is not guaranteed or endorsed by the publisher.
The Supplementary Material for this article can be found online at: https://www.frontiersin.org/articles/10.3389/fevo.2024.1209309/full#supplementary-material
Alverson W. S., Hall B., Wallert D. M., Hall B., Solheim S. L., Hall B. (1988). Forests too deer: edge effects in Northern Wisconsin. Conserv. Biol. 2, 348–358. doi: 10.1111/j.1523-1739.1988.tb00199.x
Arnold T. W. (2010). Uninformative parameters and model selection using Akaike’s information criterion. J. Wild. Mana. 74, 1175–1178. doi: 10.2193/2009-367
Athreya V., Odden M., Linnell J. D. C., Krishnaswamy J., Karanth U. (2013). Big cats in our backyards: persistence of large carnivores in a human dominated landscape in India. PloS One 8, e57872. doi: 10.1371/journal.pone.0057872
Balme G. A., Slotow R., Hunter L. T. B. (2010). Edge effects and the impact of non-protected areas in carnivore conservation: leopards in the Phinda – Mkhuze Complex, South Africa. Anim. Conserv. 13, 315–323. doi: 10.1111/j.1469-1795.2009.00342.x
Banerjee K., Jhala Y. V., Chauhan K. S., Dave C. V. (2013). Living with Lions: The economics of coexistence in the Gir Forests, India. PloS One 8, e49457. doi: 10.1371/journal.pone.0049457
Basille M., Herfindal I., Santin-Janin H., Linnell J. D. C., Odden J., Andersen R., et al. (2009). What shapes Eurasian lynx distribution in human dominated landscapes: selecting prey or avoiding people? Ecography 32, 683–691. doi: 10.1111/j.1600-0587.2009.05712.x
Bhattarai B. P., Kindlmann P. (2011). Habitat heterogeneity as the key determinant of the abundance and habitat preference of prey species of tiger in the Chitwan National Park, Nepal. Acta Theriol. 57, 89–97. doi: 10.1007/s13364-011-0047-8
Bhattarai B. P., Kindlmann P. (2013). Effect of human disturbance on the prey of tiger in the Chitwan National Park- implications for park management. J. Envi. Mana. 131, 343–350. doi: 10.1016/j.jenvman.2013.10.005
Bhola N., Ogutu J. O., Said M. Y., Piepho H. P., Olff H. (2012). The distribution of large herbivore hotspots in relation to environmental and anthropogenic correlates in the Mara region of Kenya. J. Anim. Ecol. 81, 1268–1287. doi: 10.1111/j.1365-2656.2012.02000.x
Bista A. (2011). Proximate determinants of ungulate distribution and abundance in Pilibhit Forest Division, Uttar Pradesh, India. M.Sc. Thesis (Dehradun, India: Wildlife Institute of India).
Borchers D. L., Efford M. G. (2008). Spatially explicit maximum likelihood methods for capture-recapture studies. Biometrics 64, 377–385. doi: 10.1111/j.1541-0420.2007.00927.x
Boron V., Tzanopoulos J., Gallo J., Barragan J., Jaimes-Rodriguez L., Schaller G., et al. (2016). Jaguar densities across human-dominated landscapes in Colombia: The contribution of unprotected areas to long term conservation. PloS One 11, e0153973. doi: 10.1371/journal.pone.0153973
Boyce M. S., McDonald L. L. (1999). Relating populations to habitats using resource selection functions. Trends Ecol. Evol. 14, 268–272. doi: 10.1016/S0169-5347(99)01593-1
Buckland S., Anderson D., Burnham K., Laake J., Borchers D., Thomas L. (2001). Introduction to distance sampling: estimating abundance of biological populations (New York: Oxford University Press). doi: 10.1093/oso/9780198506492.001.0001
Burnham K. P., Anderson D. R. (2002). Model selection and multimodel inference: a practical information-theoretic approach (USA: Springer).
Burton A. C., Sam M. K., Kpelle D. G., Balangtaa M. K., Buedi E. B., Brashares J. S. (2011). Evaluating persistence and its predictors in a West African carnivore community. Biol. Conserv. 144, 2344–2353. doi: 10.1016/j.biocon.2011.06.014
Carbone C., Gittleman J. L. (2002). A common rule for the scaling of carnivore density. Science 295, 2273–2276. doi: 10.1126/science.1067994
Carbone C., Pettorelli N., Stephens P. A. (2011). The bigger they come, the harder they fall: body size and prey abundance influence predator-prey rations. Biol. Lett. 7, 312–315. doi: 10.1098/rsbl.2010.0996
Carroll C., Miquelle D. G. (2006). Spatial viability analysis of Amur tiger Panthera tigris altaica in the Russian Far East: the role of protected areas. J. Appl. Ecol. 43, 1056–1068. doi: 10.1111/j.1365-2664.2006.01237.x
Carter N., Levin S., Barlow A., Grimm V. (2015). Modelling tiger population and territory dynamics using an agent-based approach. Ecol. Modelli. 312, 347–362. doi: 10.1016/j.ecolmodel.2015.06.008
Carter N., Shrestha B. K., Karki J. B., Pradhan N. M. B., Liu J. (2012). Coexistence between wildlife and humans at fine spatial scales. Proc. Nati. Acad. Scie. 109, 15360–15365. doi: 10.1073/pnas.1210490109
Chanchani P., Bista A., Warrier R. A., Nair S., Sharma R., Hassan D., et al. (2014a). Status and conservation of tigers and their prey in the Uttar Pradesh Terai (New Delhi: WWF-India). Available at: https://wwfin.awsassets.panda.org/downloads/up_tal_report:web.pdf (Accessed 24 Feb 2023).
Chanchani P., Gerber B. D., Noon B. R. (2018). Elevated potential for intraspecific competition in territorial carnivores occupying fragmented landscapes. Biol. Conserv. 227, 275–283. doi: 10.1016/j.biocon.2018.08.017
Chanchani P., Lamichhane B. R., Malla S., Maurya K., Bista A., Warrier R., et al. (2014b) Tigers of the Transboundary Terai Arc Landscape: Status, distribution and movement in the Terai of India and Nepal (New Delhi and DNPWC, Kathmandu: National Tiger Conservation Authority) (Accessed 24 Feb 2023).
Chanchani P., Noon B. R., Bailey L. L., Warrier R. A. (2016). Conserving tigers in working landscapes. Conserv. Biol. 30, 649–660. doi: 10.1111/cobi.12633
Chapron G., Kaczensky P., Linnell J. D. C., von Arx M., Huber D., Andren H., et al. (2014). Recovery of large carnivores in Europe’s modern human-dominated landscapes. Science 346, 1517–1519. doi: 10.1126/science.1257553
Dickson B. G., Jenness J. S., Beier P. (2005). Influence of vegetation, topography, and raods on cougar movement in Southern California. J. Wild. Mana. 69, 264–276. doi: 10.2193/0022-541X(2005)069<0264:IOVTAR>2.0.CO;2
Dinerstein E. (1980). An ecological survey of the Royal Karnali-Barida Wildlife Reserve, Nepal. Part III: Ungulate populations. Biol. Conserv. 18, 5–37. doi: 10.1016/0006-3207(80)90063-4
Dinerstein E., Loucks C., Wikramanayake E., Ginsberg J., Sanderson E., Seidensticker J., et al. (2007). The fate of wild tigers. BioScience 57, 508–514. doi: 10.1641/B570608
Dobson A., Lodge D., Alder J., Cumming G. S., Keymer J., McGlade J., et al. (2006). Habitat loss, trophic collapse and the decline of ecosystem services. Ecology 87, 1915–1924. doi: 10.1890/0012-9658(2006)87[1915:HLTCAT]2.0.CO;2
Doherty P. F., White G. C., Burnham K. P. (2010). Comparison of model building and selection strategies. J. Ornitho. 152, 317–323. doi: 10.1007/s10336-010-0598-5
Dorozio R. M., Kumar N. S., Royle J. A., Gopalaswamy A. M. (2017). “Concepts and practices: estimating abundance of prey-species using hierarchical model-based approached,” in Methods for monitoring tiger and prey populations. Eds. Karanth K. U., Nichols J. D. (Springer Nature, Singapore), 137–161.
Duangchantrasiri S., Umponjan M., Simcharoen S., Pattanavibool A., Chaiwattana S., Maneerat S., et al. (2016). Dynamics of a low-density tiger population in Southeast Asia in the context of improved law enforcement. Conserv. Biol. 30, 639–648. doi: 10.1111/cobi.12655
Duffy J. E., Cardinale B. J., France K. E., McIntyre P. B., Thébault E., Loreau M. (2007). The functional role of biodiversity in ecosystems: Incorporating trophic complexity. Ecol. Lett. 10, 522–538. doi: 10.1111/j.1461-0248.2007.01037.x
Efford M. (2014). Finite mixture models in secr 2 9. Available at: https://www.otago.ac.nz/density/archivedsecr.html.
Efford M. (2015). “secr: Spatially explicit capture-recapture models,” in R package version 2.9.5. Available at: https://CRAN.R-project.org/package=secr.
Efford M. G., Borchers D. L., Byrom A. E. (2009). “Modelling demographic processes in Marked populations,” in Modelling demographic processes in marked populations. Eds. Thomson D. L., Cooch E. G., Conroy M. J. (Springer, Boston, US), 255–269.
Efford M. G., Dawson D. K., Jhala Y. V., Qureshi Q. (2015). Density dependent home-range size revealed by spatially explicit capture-recapture. Ecography 39, 676–688. doi: 10.1111/ecog.01511
Efford M. G., Fewster R. M. (2013). Estimating population size by spatially explicit capture-recapture. Oikos 122, 918–928. doi: 10.1111/j.1600-0706.2012.20440.x
Efford M. G., Mowat G. (2014). Compensatory heterogeneity in spatially explicit capture-recapture data. Ecology 95, 1341–1348. doi: 10.1890/13-1497.1
Evans M. J., Rittenhouse A. G., Hawley J. E., Rego P. W. (2017). Black bear recolonization patterns in a human-dominated landscape vary based on housing: New insights from spatially explicit density models. Land. Urba. Plan. 162, 13–24. doi: 10.1016/j.landurbplan.2017.01.009
Grilo C., Lucas P. M., Fernández-Gil A., Seara M., Costa G., Roque S., et al. (2019). Refuge as major habitat driver for wolf presence in human-modified landscapes. Anim. Conserv. 22, 59–71. doi: 10.1111/acv.12435
Harihar A., Chanchani P., Pariwakam M., Noon B. R., Goodrich J. (2017). Defensible inference: Questioning global trends in tiger populations. Conserv. Lett. 10, 502–505. doi: 10.1111/conl.12406
Harihar A., Chanchani P., Sharma R. K., Vattakaven J., Gubbi S., Pandav B., et al. (2013). Conflating “co-occurrence” with “coexistence”. Proc. Nati. Acad. Sci. 110, E109. doi: 10.1073/pnas.1217001110
Harihar A., Pandav B. (2012). Influence of connectivity, wild prey and disturbance on occupancy of tigers in the human-dominated western Terai Arc Landscape. PloS One 7, e40105. doi: 10.1371/journal.pone.0040105
Harihar A., Pandav B., Goyal S. P. (2009). Responses of tiger (Panthera tigris) and their prey to removal of anthropogenic influences in Rajaji National Park, India. Euro. J. Wild. Rese. 55, 97–105. doi: 10.1007/s10344-008-0219-2
Harihar A., Pandav B., Goyal S. P. (2011). Responses of leopard Panthera pardus to the recovery of a tiger Panthera tigris population. J. Appl. Ecol. 48, 806–814. doi: 10.1111/j.1365-2664.2011.01981.x
Harihar A., Pandav B., MacMillan D. C. (2014). Identifying realistic recovery targets and conservation actions for tigers in a human-dominated landscape using spatially explicit densities of wild prey and their determinants. Dive. Distrib. 20, 567–578. doi: 10.1111/ddi.12174
Hiby L., Lovell P., Patil N., Kumar N. S., Gopalaswamy A. M. (2009). and karanth, KA tiger cannot change its stripes: using a three-dimensional model to match images of living tigers and tiger skins. U.Biol. Lett. 5, 383–386. doi: 10.1098/rsbl.2009.0028
Jathanna D., Karanth K. U., Johnsingh A. J. T. (2003). Estimation of large herbivore densities in the tropical forests of southern India using distance sampling. J. Zool. 261, 285–290. doi: 10.1017/S0952836903004278
Jhala Y. V., Gopal R., Mathur V., Ghosh P., Negi H. S., Narain S., et al. (2021). Recovery of tigers in India: critical introspection and potential lessons. People Nat. 3, 281–293. doi: 10.1002/pan3.10177
Jhala Y. V., Qureshi Q., Gopal R. (2011). Status of tigers, copredators and their prey in Indi (Dehradun: National Tiger Conservation Authority, Government of India, New Delhi and Wildlife Institute of India). Available at: https://ntca.gov.in/assets/uploads/Reports/AITM/Statusof_Tigers2010.pdf (Accessed 23 Feb 2023).
Jhala Y. V., Qureshi Q., Gopal R. (2015). Status of tigers, copredators and their prey in Indi. In: (Dehradun: National Tiger Conservation Authority, Government of India, New Delhi and Wildlife Institute of India). Available at: https://ntca.gov.in/assets/uploads/Reports/AITM/AITE_2014_fullreport.pdf (Accessed 23 Feb 2023).
Johnsingh A. J. T., Ramesh K., Qureshi Q., David A., Goyal S. P., Rawat G. S., et al. (2004). Conservation status of tiger and associated species in the terai arc landscape, India (Dehradun: Wildlife Institute of India).
Kafley H., Gompper M. E., Sharma M., Lamichane B. R., Maharja R. E. (2016). Tigers (Panthera tigris) respond to fine spatial-scale habitat factors: occupancy-based habitat association of tigers in Chitwan National Park, Nepal. Wild. Researc. 43, 487–496. doi: 10.1071/WR16012
Kanagaraj R., Wiegand T., Kramer-SChadt S., Anwar M., Goyal S. P. (2011). Assessing habitat suitability for tiger in the fragmented Terai Arc Landscape of India and Nepal. Ecography 34, 970–981. doi: 10.1111/j.1600-0587.2010.06482.x
Karanth K. U., Gopal R. (2005). “An ecology based framework for human-tiger coexistence in India,” in People and wildlife: conflict or coexistence. Eds. Woodroffe R., Thirgood S. J., Rabinowitz A. (Cambridge University Press, Cambridge, UK), 373–387.
Karanth K. U., Nichols J. D. (2002). Monitoring tigers and their prey: a manual for researchers, managers, and conservationists in tropical Asia (Bangalore: Centre for Wildlife Studies).
Karanth K. U., Nichols J. D., Kumar N. S., Link W., Hines J. E. (2004). Tigers and their prey: Predicting carnivore densities from prey abundance. Proc. Nati. Acad. Scie. Unit. Stat. Amer. 101, 4854–4858. doi: 10.1073/pnas.0306210101
Kshettry A., Vaidyanathan S., Sukumar R., Athreya V. (2020). Looking beyond protected areas: Identifying conservation compatible landscapes in agro-forest mosaics in north-eastern India. Global Ecol. Conserv. 22, e00905. doi: 10.1016/j.gecco.2020.e00905
Lewis J. S., Logan K. A., Alldredge M. W., Bailey L. L., VandeWoude S., Crooks K. R. (2015). The effects of urbanisation on population density, occupancy, and detection probability of wild felids. Ecol. Applica. 25, 1880–1895. doi: 10.1890/14-1664.1
Linkie M., Haidir I. A., Nugroho A., Dinata Y. (2008). Conserving tigers Panthera tigris in selectively logged Sumatran forests. Biol. Conserv. 141, 2410–2415. doi: 10.1016/j.biocon.2008.07.002
MadhuSudan M. D. (2004). Recovery of wild large herbivores following livestock decline in a tropical Indian wildlife reserve. J. Appl. Ecol. 41, 858–869. doi: 10.1111/j.0021-8901.2004.00950.x
Miller D. L., Burt M. L., Rexstad E. A., Thomas L. (2013). Spatial models for distance sampling data: recent developments and future directions. Methods Ecol. Evol. 4, 1001–1010. doi: 10.1111/2041-210X.12105
Nichols J. D., Williams B. K. (2006). Monitoring for conservation. Trends Ecol. Evol. 21, 668–673. doi: 10.1016/j.tree.2006.08.007
Nyhus P., Tilson R. (2004). Agroforestry, elephants, and tigers: Balancing conservation theory and practice in human-dominated landscape of Southeast Asia. Agric. Ecos. Envi. 104, 87–97. doi: 10.1016/j.agee.2004.01.009
O’Brien T. G., Kinnaird M. F. (2011). Density estimation of sympatric carnivores using spatially explicit capture-recapture methods and standard trapping grid. Ecol. Applica. 21, 2908–2916. doi: 10.1890/10-2284.1
Oeser J., Heurich M., Kramer-SChadt S., Andrén H., Bagrade G., Belotti E., et al. (2022). Prerequisites for coexistence: human pressure and refuge habitat availability shape continental-scale habitat use patterns of a large carnivore. Rese. Square 38 (7), 1713–1728. doi: 10.21203/rs.3.rs-1692099/v1
Olson D. M., Dinerstein E. (1998). The Global 200: A representation approach to conserving the earth’s most biologically valuable ecoregions. Conserv. Biol. 12, 502–515. doi: 10.1046/j.1523-1739.1998.012003502.x
Oriol-Cotterill A., Valeix M., Frank G., Riginos C., MacDonald D. W. (2015). Landscapes of coexistence for terrestrial carnivores: the ecological consequences of being downgraded from ultimate to penultimate predator by humans. Oikos 124, 1263–1273. doi: 10.1111/oik.02224
Panwar H. S. (1982). What to do when you’ve succeeded: Project Tiger ten years later. Ambio 11, 330–337.
Peet N. B., Watkinson A. R., Bell D. J., Kattel B. J. (1999a). Plan diversity in the threatened sub-tropical grasslands of Nepal. Biol. Conserv. 88, 193–206. doi: 10.1016/S0006-3207(98)00104-9
Peet N. B., Watkinson A. R., Bell D. J., Sharma U. R. (1999b). The conservation management of Imperata cylindrica grassland in Nepal with fire and cutting: an experimental approach. J. Appl. Ecol. 36, 374–387. doi: 10.1046/j.1365-2664.1999.00405.x
Qureshi Q., Jhala Y. V., Yadav S. P., Mallick A. (2023). Status of Tigers, co-predators and prey in India – 2022 (Dehradun: National Tiger Conservation Authority and Wildlife Institute of India).
Rastogi S., Chanchani P., Sankaran M., Warrier R. (2022). Grasslands half-full: investigating drivers of spatial heterogeneity in ungulate occurrence in Indian Terai. J. Zool. 316, 139–153. doi: 10.1111/jzo.12939
Rayan D. M., Mohamad S. W. (2009). The importance of selectively logged forests for tiger Panthera tigris conservation: a population density estimate in Peninsular Malaysia. Oryx 43, 48–51. doi: 10.1017/S0030605308001890
Riley S. J., Malecki R. A. (2001). A landscape analysis of cougar distribution and abundance in Montana, USA. Envi. Managem. 28, 317–323. doi: 10.1007/s0026702503
Ripple W. J., Estes J. A., Beschta R. L., Wilmers C. C., Ritchie E. G., Hebblewhite M., et al. (2014). Status and ecological effects of the world’s largest carnivores. Science 301–306. doi: 10.1126/science.1241484
Royle J. A., Chandler R. B., Sollmann R., Gardner B. (2013). Spatial capture-recapture (USA: Academic Press). Available at: https://books.google.com.np/books?hl=en&lr=&id=RO08-S-amZMC&oi=fnd&pg=PR1&dq=Spatial+Capture-Recapture.+USA:+Academic+Press.&ots=e9xyPiKBYz&sig=FkHPwAUw6yd4I0aCzG_C01wm2g0&redir_esc=y#v=onepage&q=Spatial%20Capture-Recapture.%20USA%3A%20Academic%20Press.&f=false (Accessed 25 Feb 2023).
Royle J. A., Karanth K. U., Gopalaswamy A. M., Kumar N. S. (2009). Bayesian inference in camera trapping studies for a class of spatial capture-recapture models. Ecology 90, 3233–3244. doi: 10.1890/08-1481.1
Seidensticker J., Dinerstein E., Gopal S. P., Gurung B., Harihar A., Johnsingh A. J. T., et al. (2010). “Tiger range collapse and recovery at the base of the Himalayas,” in Biology and conservation of wild carnivores: the candis and the felids, two-volume set. Eds. Macdonald W. D., Loveridge A. J., Sillero-Zubiri C. (Oxford University Press, Oxford), 305–323.
Sharma R. K., Bhatnagar Y. V., Mishra C. (2015). Does livestock benefit or harm snow leopards? Biol. Conserv. 190, 8–13. doi: 10.1016/j.biocon.2015.04.026
Shrestha M. K. (2004). Relative ungulate abundance in a fragmented landscape: implications for tiger conservation. PhD Dissertation (University of Minnesota).
Smith J. L. D. (1993). The role of dispersal in structuring the Chitwan tiger population. Behaviour 124, 165–195. doi: 10.1163/156853993X00560
Smith J. L. D., Ahern S. C., McDougal C. (1998). Landscape analysis of tiger distribution and habitat quality in Nepal. Conserv. Biol. 12, 1338–1346. doi: 10.1111/j.1523-1739.1998.97068.x
Sollmann R., Furtado M. M., Gardner B., Hofer H., Jácomo A. T. A., Tôrres N. M., et al. (2011). Improving density estimates for elusive carnivores: accounting for sex-specific detection and movements using spatial capture-recapture models for jaguars in central Brazil. Biol. Conserv. 144, 1017–1024. doi: 10.1016/j.biocon.2010.12.011
Strahorn E. A. (2009). An environmental history of postcolonial north India: The Himalayan tarai in Uttar Pradesh and Uttaranchal (New York: Peter Lang). doi: 10.3726/978-1-4539-0433-6
Sunarto S., Kelly M. J., Parakkasi K., Klenzendorf S., Septayuda E., Kurniawan H. (2012). Tigers need cover: multi-scale occupancy study of the big cat in Sumatran forest and plantation landscapes. PloS One 7, e30859. doi: 10.1371/journal.pone.0030859
Sunquist M. E. (2010). “What is a tiger? Ecology and behaviour,”. Tigers world: science politics Conserv. Panthera tigris eds R. Tilson P. J. Nyphus (London: Acad. Press) 19–133.
Thapa K., Thapa G. K., Manandhar U., Dhakal M., Jnawali S. R., Maraseni T. N. (2023). Carbonated tiger-high above-ground biomass carbon stock in protected areas and corridors and its observed negative relationship with tiger population density and occupancy in the Terai Arc Landscape, Nepal. PloS One 18, e0280824. doi: 10.1371/journal.pone.0280824
The World Bank. (2011). Global tiger recovery program 2010-2022. Available at: https://documents.worldbank.org/en/publication/documents-reports/documentdetail/874191468331048098/global-tiger-recovery-program-2010-2022 (Accessed 23 Feb 2023).
Valeix M., Hemson G., Loveridge A. J., Mills G., Macdonald D. W. (2012). Behavioural adjustments of a large carnivore to access secondary prey in a human-dominated landscape. J. Appl. Ecol. 49, 73–81. doi: 10.1111/j.1365-2664.2011.02099.x
Vanak A. T., Fortin D., Thaker M., Ogden M., Owen C., Greatwood S., et al. (2013). Moving to stay in place: behavioral mechanisms for coexistence of African large carnivores. Ecology 94, 2619–2631. doi: 10.1890/13-0217.1
Velázquez A., Cue-Bär E. M., Larrazabal A., Sosa N., Villasenor J. L., McCall M., et al. (2009). Building participatory landscape-based conservation alternatives: A case study of Michoacán, Mexico. Appl. Geogr. 29, 513–526. doi: 10.1016/j.apgeog.2008.11.00
Venkataraman M., Johnson P. J., Zimmermann A., Montgomery R. A., Macdonald D. W. (2020). Evaluation of human attitudes and factors conducive to promoting human-lion coexistence in the Greater Gir landscape, India. Oryx 55, 589–598. doi: 10.1017/S0030605319000760
Warrier R., Noon B. R., Bailey L. (2020). Agricultural lands offer seasonal habitats to tigers in a human-dominated and fragmented landscape in India. Ecosphere 11, e03080. doi: 10.1002/ecs2.3080
Wegge P., Storaas T. (2009). Sampling tiger ungulate prey by the distance method: lessons learned in Bardia National Park, Nepal. Anim. Conserv. 12, 78–84. doi: 10.1111/j.1469-1795.2008.00230.x
Wikramanayake E., Dinerstein E., Seidensticker J., Lumpkin S., Pandav B., Shrestha M., et al. (2011). A landscape-based conservation strategy to double the wild tiger population. Conserv. Lett. 4, 219–227. doi: 10.1111/conl.2011.4.issue-3
Wikramanayake E. D., Manandhar A., Bajimaya S., Nepal S., Thapa G., Thapa K. (2010). “The Terai Arc Landscape: a tiger conservation success story in a human-dominated landscape,” in Tigers of the world: the science, politics and conservation of Panthera tigris. Eds. Tilson R., Nyhus P. J. (Academic Press, London), 163–173.
Keywords: carnivore–prey relationships, conservation zonation, edge habitat, protected areas, spatially explicit capture recapture, tiger–human co-occurrence, working landscapes
Citation: Chanchani P, Noon BR, Bista A, Warrier R, Nair S, Sharma R, Gupta M and Gerber BD (2024) Influence of resource gradients and habitat edges on density variation in tiger populations in a multi-use landscape. Front. Ecol. Evol. 12:1209309. doi: 10.3389/fevo.2024.1209309
Received: 20 April 2023; Accepted: 23 February 2024;
Published: 16 May 2024.
Edited by:
Fernanda Michalski, Universidade Federal do Amapá, BrazilReviewed by:
Sudeepto Bhattacharya, Shiv Nadar University, IndiaCopyright © 2024 Chanchani, Noon, Bista, Warrier, Nair, Sharma, Gupta and Gerber. This is an open-access article distributed under the terms of the Creative Commons Attribution License (CC BY). The use, distribution or reproduction in other forums is permitted, provided the original author(s) and the copyright owner(s) are credited and that the original publication in this journal is cited, in accordance with accepted academic practice. No use, distribution or reproduction is permitted which does not comply with these terms.
*Correspondence: Pranav Chanchani, cHJhbmF2QHd3ZmluZGlhLm5ldA==
†Present addresses: Pranav Chanchani, WWF-India, New Delhi, India
Rekha Warrier, Department of Human Dimensions of Natural Resources, Colorado
State University, Fort Collins, CO, United States
Shwetha Nair, Central European University, Vienna, Austria
Ruchir Sharma, Cynergy, Tamil Nadu, Auroville, India
Brian D. Gerber, Colorado Cooperative Fish and Wildlife Research Unit, U.S. Geological Survey, Fort Collins, CO, United States
Department of Fish, Wildlife, and Conservation Biology, Colorado State University Fort Collins, Fort Collins, CO, United States
Disclaimer: All claims expressed in this article are solely those of the authors and do not necessarily represent those of their affiliated organizations, or those of the publisher, the editors and the reviewers. Any product that may be evaluated in this article or claim that may be made by its manufacturer is not guaranteed or endorsed by the publisher.
Research integrity at Frontiers
Learn more about the work of our research integrity team to safeguard the quality of each article we publish.