
95% of researchers rate our articles as excellent or good
Learn more about the work of our research integrity team to safeguard the quality of each article we publish.
Find out more
ORIGINAL RESEARCH article
Front. Ecol. Evol. , 04 March 2024
Sec. Population, Community, and Ecosystem Dynamics
Volume 12 - 2024 | https://doi.org/10.3389/fevo.2024.1168288
This article is part of the Research Topic Exploring the Unseen World: Advancements in Understanding Environmental Microorganisms View all 5 articles
 Simin Wang1*
 Dominik Schneider2
 Tamara R. Hartke1,3Johannes Ballauff4Carina Carneiro de Melo Moura5
 Garvin Schulz1Zhipeng Li6
 Andrea Polle4,7
 Rolf Daniel2
 Oliver Gailing5,7
 Bambang Irawan8
 Stefan Scheu1,7
 Valentyna Krashevska1,9
Introduction: High-throughput sequencing (HTS) provides an efficient and cost-effective way to generate large amounts of sequence data, providing a very powerful tool to analyze biodiversity of soil organisms. However, marker-based methods and the resulting datasets come with a range of challenges and disputes, including incomplete reference databases, controversial sequence similarity thresholds for delimitating taxa, and downstream compositional data analysis.
Methods: Here, we use HTS data from a soil nematode biodiversity experiment to explore standardized HTS data processing procedures. We compared the taxonomic assignment performance of two main rDNA reference databases (SILVA and PR2). We tested whether the same ecological patterns are detected with Amplicon Sequence Variants (ASV; 100% similarity) versus classical Operational Taxonomic Units (OTU; 97% similarity). Further, we tested how different HTS data normalization methods affect the recovery of beta diversity patterns and the identification of differentially abundant taxa.
Results: At this time, the SILVA 138 eukaryotic database performed better than the PR2 4.12 database, assigning more reads to family level and providing higher phylogenetic resolution. ASV- and OTU-based alpha and beta diversity of nematodes correlated closely, indicating that OTU-based studies represent useful reference points. For downstream data analyses, our results indicate that loss of data during subsampling under rarefaction-based methods might reduce the sensitivity of the method, e.g. underestimate the differences between nematode communities under different treatments, while the clr-transformation-based methods may overestimate effects. The Analysis of Compositions of Microbiome with Bias Correction approach (ANCOM-BC) retains all data and accounts for uneven sampling fractions for each sample, suggesting that this is currently the optimal method to analyze compositional data.
Discussion: Overall, our study highlights the importance of comparing and selecting taxonomic reference databases before data analyses, and provides solid evidence for the similarity and comparability between OTU- and ASV-based nematode studies. Further, the results highlight the potential weakness of rarefaction-based and clr-transformation-based methods. We recommend future studies use ASV and that both the taxonomic reference databases and normalization strategies are carefully tested and selected before analyzing the data.
High-throughput sequencing (HTS) of taxonomically informative markers (e.g., 16S for prokaryotes and 18S/ITS for eukaryotes) provides an efficient and cost-effective way to generate large amounts of sequence data and assign those sequences with high taxonomic resolution. Such taxonomy-related data can provide the basis for determining functional groups in the studied ecosystems. This approach is particularly important for groups that are difficult to identify based on morphology and for species-rich groups such as nematodes.
Nematodes, considered to be the most abundant animals on Earth (Bardgett and Van der Putten, 2014), are ubiquitous in soil, and play essential roles in the provisioning of a number of ecosystem services, such as carbon and nutrient cycling, and pest and disease regulation (Ingham et al., 1985; Ferris et al., 2004; Wilson and Khakouli-Duarte, 2009; Ferris, 2010). Total nematode diversity is estimated at more than one million species (Lambshead, 1993), but only around 30,000 species have been described so far (Kiontke and Fitch, 2013). Morphology-based nematode communities studies are highly constrained by time, money and morphological identification skills (Griffiths et al., 2018), but progress in HTS technologies and data analysis methods are gradually overcoming these limitations (Sapkota and Nicolaisen, 2015; Geisen et al., 2018). However, marker-based methods and the resulting datasets come with a range of challenges and disputes, mainly regarding incomplete reference databases for targeted genes, controversial sequence similarity thresholds for animal taxa delimitation, and critical normalization methods for compositional data analysis (Holovachov, 2016; Callahan et al., 2017; Gloor et al., 2017; Weiss et al., 2017; Knight et al., 2018).
Traditionally, to reduce the impact of spurious reads created by sequencing errors, marker sequence reads obtained from HTS have been identity clustered to operational taxonomic units (OTUs), which use a pre-defined sequence similarity threshold, usually 97%, for sequences from the same species (Konstantinidis and Tiedje, 2005; Nguyen et al., 2016). New bioinformatics methods now successfully control sequencing errors, allowing the discrimination of amplicon sequence variants (ASV) at single nucleotide resolution, which greatly increase the taxonomic resolution (Eren et al., 2013, 2014; Tikhonov et al., 2015; Callahan et al., 2016; Edgar, 2016; Amir et al., 2017). Therefore, it has been argued that previous methods based on OTUs should be replaced by new ASV-based methods (Callahan et al., 2017; Knight et al., 2018). ASV-based methods are not only expected to increase taxonomic resolution, but to also increase the reusability, reproducibility and comprehensiveness of marker-gene studies (Callahan et al., 2017). This view is supported by microbial community ecology studies showing that such methods can help explain additional variation among samples (Eren et al., 2014; Needham et al., 2017) and may outperform OTU clustering if sufficient sequencing depth is provided (Joos et al., 2020). Even so, direct comparisons indicate that ASV- and OTU-based methods often reveal similar ecological patterns, both for bacteria and fungi at different scales and ecosystems (Botnen et al., 2018; Glassman and Martiny, 2018; García-García et al., 2019). Different sequence clustering methods have also been tested and compared for protists (Forster et al., 2019). Unfortunately, studies on sequence clustering methods are lacking for nematodes, and it is still unclear whether ASV- and OTU-based methods produce comparable ecological patterns, and whether OTU-based results can be directly compared to ASV-based results.
Another key step in HTS analysis is read assignment based on taxonomically curated reference databases. In the last decade, the SILVA ribosomal RNA gene database (http://www.arb-silva.de) and the Protist Ribosomal Reference database (PR2, http://ssu-rrna.org/) have been established as the two main rDNA reference databases offering curated taxonomies for both unicellular eukaryotic and multicellular eukaryotic SSU rRNA sequences (Guillou et al., 2013; Quast et al., 2013). The SILVA database provides regularly updated taxonomic information for Bacteria, Archaea and Eukarya (Quast et al., 2013), while the PR2 database, formerly dedicated to protists, also covers eukaryotic sequences from Metazoa, plants, fungi and certain eukaryotic organelles of ecological interest (Guillou et al., 2013). However, with the increasing interest in nematode analysis, it is still unknown whether SILVA and PR2 databases currently provide sufficient and similar taxonomic information, and how the choice of reference databases may influence nematode taxonomic classification and phylogenic results.
Although many studies have found that relative abundance data from metabarcoding are positively correlated with biomass or population density (Kelly et al., 2014; Doi et al., 2017; Geisen et al., 2018; Schenk et al., 2019), overrepresentation of certain taxa after PCR was also recognized (Geisen et al., 2018; Ahmed et al., 2019). Further, several characteristics of raw count tables derived from HTS data, including uneven sampling depth, sparsity and compositionality, can seriously affect the statistical results in downstream analyses and represent major challenges for data interpretation (Gloor et al., 2017; Weiss et al., 2017; Boshuizen and Te Beest, 2022). Therefore, to reduce the impact of those biases, it is important to normalize or transform count tables prior to further analysis. Rarefaction or subsampling of the read counts to an equal, usually the minimum, library size (or sequencing depth) is a commonly used normalization method to correct for uneven sampling depth (Lozupone et al., 2011; Wong et al., 2016). However, this method was not designed to address the issues of compositionality, and it can reduce statistical power by removing vast amounts of valid data (McMurdie and Holmes, 2014; Weiss et al., 2017). Alternatively, log-ratio based methods can properly account for the compositional nature of HTS datasets, among which the centered log-ratio (clr) transformation (Aitchison, 1982) has been proposed as a valid approach for HTS datasets (Gloor and Reid, 2016; Gloor et al., 2017; Quinn et al., 2019). In this approach, pseudo-count methods are applied before the logarithmic transformation to cope with sparsity of the data (Mandal et al., 2015). Although adding pseudo-counts and applying the clr-transformation to HTS datasets take into account the library size within a sample, the different library sizes across samples are ignored, and pseudo-counts will cause additional bias (Kaul et al., 2017). To remedy these deficiencies, Kaul et al. (2017) proposed the ANCOM-II method to identify and accommodate different types of zeros in HTS datasets, and simultaneously account for differences in library size across samples. Recently, Lin and Peddada (2020a) defined “sampling fraction” as the ratio of the expected absolute abundance of a taxon to its absolute abundance in a unit volume of the studied system, and pointed out that the bias introduced by differences in the sampling fractions across samples is a major obstacle when analyzing HTS datasets. Thus, Lin and Peddada (2020a) developed the ANCOM-BC (Analysis of Compositions of Microbiome with Bias Correction) tool and corresponding data normalization method to address the problem of unequal sampling fractions in HTS datasets. However, different normalization methods applied to HTS datasets might have different sensitivities and outputs, potentially causing misleading or conflicting results (Weiss et al., 2015; Gloor et al., 2017), thus it remains necessary to compare the performance of the different normalization methods on community composition analysis and evaluate the consistency of downstream differential abundance analysis (Lin and Peddada, 2020b; Swift et al., 2023).
Here, we use soil nematode sequencing data based on the 18S rRNA gene, the most widely used gene region for nematode metabarcoding due to its broad taxonomic coverage and good phylogenetic resolution, from three land-use systems in Indonesia (tropical rainforest, rubber and oil palm plantations), to compare standardized HTS data analysis processes. The tropical rainforest and two monoculture plantation systems have totally different tree species, understory vegetation and soil properties, which are expected to host different nematode assemblages, and therefore provide a suitable case study to test the power of different statistical approaches. Our aims were to (1) determine whether the choice of reference database has a significant effect on nematode HTS data analysis by comparing the taxonomic assignment performance of the two main reference sequence databases, SILVA and PR2, (2) test whether the use of ASVs versus 97% OTUs affects detection of ecological patterns, including alpha and beta diversity, in nematode HTS datasets, and (3) compare the impact of different normalization methods of HTS datasets, including the classic rarefaction, the centered log-ratio (clr) transformation and the data normalization method proposed in the ANCOM-BC tool, on the recovery of beta diversity patterns in ordination analysis and identification of differentially abundant taxa. We hypothesized that (1) SILVA and PR2 databases generate comparable taxonomic information and phylogenetic diversity with few differences, e.g., in taxonomic assignments, (2) alpha and beta diversity based on ASV and OTU datasets are similar in their biological signal, and (3) outputs of clr-transformation and ANCOM-BC tool based HTS data analyses are similar, but rarefaction-based analysis is more likely to underestimate or not detect effects due to the loss of data during subsampling, which reduces the sensitivity of this method.
Soil samples from the tropical lowlands in Bukit Duabelas region, Jambi Province of southwest Sumatra, Indonesia, were taken in October – November 2016 for three land-use systems: secondary lowland rainforests, and rubber and oil palm plantations. Each land-use system was replicated four times, with three subplots in each replicated plot (3 land-use systems × 4 plots × 3 subplots), resulting in a total of 36 samples. For more details of the study site, see Drescher et al. (2016). Sampling and treatment of soil samples have been described previously (Ballauff et al., 2021). Briefly, we established three 5 m × 5 m subplots in each plot, with 15 m between subplots. Surface leaf litter was removed before soil samples were taken; five soil cores (15 cm depth, 4 cm diameter) were taken at random from each subplot and pooled, resulting in a total of three samples per plot, and stored in zip-lock bags at 4°C until they could be homogenized and sieved through 5 mm mesh to remove roots and stones. Soil samples were immediately freeze-dried (VirTis Bench Top K, SP Industries, Warminster, USA) and exported to the University of Göttingen (Germany) for molecular analysis.
For each freeze-dried, ground and homogenized soil sample, 250 mg of soil was used for DNA extraction using the MoBio PowerSoil isolation kit (Dianova, Hamburg, Germany) following the manufacturer’s protocol. The hypervariable V4 region of the 18S rRNA gene was targeted, as described by Sapkota and Nicolaisen (2015). In brief, primers NemF (5′-GGGGAAGTATGGTTGCAAA- 3′) (Sapkota and Nicolaisen, 2015) and 18Sr2b (5′-TACAAAGGGCAGGGACGTAAT- 3′) (Porazinska et al., 2009) were used in a pre-amplification step followed by amplification with primers NF1 (5′-GGTGGTGCATGGCCGTTCTTAGTT- 3′) (Porazinska et al., 2009) and 18Sr2b in a semi-nested procedure. NF1 and 18Sr2b were paired with MiSeq-Adapter Forward overhang (5′-TCGTCGGCAGCGTCAGATGTGTATAAGAGACAG- 3′) and Reverse overhang (5′-TCTCGTGGGCTCGGAGATGTGTATAAGAGACAG-3′). This strategy has been reported to be highly specific to nematodes, with nearly two-third (64.4%) of the total number of sequences classified as Nematoda in previous studies (Sapkota and Nicolaisen, 2015). All amplicon PCRs (both the pre-amplification step and the second PCR step) were performed in triplicate and pooled in equimolar ratios for sequencing. Detailed descriptions of the methodology are provided in the Supporting Information Additional File S1. Amplicon length was approximately 420 bp. The sequences of the 18S amplicons were sequenced using Illumina MiSeq at the Institute for Microbiology and Genetics of the University of Göttingen. Raw 18S rRNA gene sequence data are available through the project PRJEB54886 on the European Nucleotide Archive, www.ebi.ac.uk/ena.
Raw paired-end sequences from the Illumina MiSeq were quality-filtered with fastp v0.20.0 (Chen et al., 2018) using default settings with the addition of a minimum base phred score of 20, overlapping base pair correction, sliding windows of 4 bp, a mean minimum quality of 20 and sequence minimum length of 50 bp. After quality control, the paired-end reads were merged using PEAR v0.9.11 (Zhang et al., 2014) and additional primer clipping was performed with cutadapt v1.16 (Martin, 2011) using default settings. High-quality sequences were further processed with VSEARCH (v2.14.1) (Rognes et al., 2016), which included sorting and size-filtering of the reads to ≥250 bp (–sortbylength –minseqlength 250), and dereplication (–derep_fulllength) to exclude potential artificial 18S rRNA gene fragments (i.e., too short for the target region). Dereplicated amplicon sequence variants were further denoised by UNOISE3 (Edgar, 2016) using default settings (–cluster_unoise – minsize 8) and chimeric amplicons were removed (–uchime3_denovo). An additional reference-based chimeric amplicon removal was performed (–uchime_ref against the PR2 4.12 database and the SILVA 138 eukaryotic database). After chimera removal, filtered reads were stored as ASVs (100% sequence identity) for use in gene database comparisons, and then clustered to OTUs (–usearch_global–id 0.97) at 97% sequence identity for further identity threshold comparison.
To select a suitable reference database for taxonomy assignment, the taxonomy of all ASVs was assigned using BLAST 2.9.0+ (Camacho et al., 2009) against two databases, the PR2 4.12 database (Guillou et al., 2013) and the SILVA 138 database (Quast et al., 2013); Taxonomic assignment for both reference databases was based on the best match. For all nematode ASVs, the percentage identity was greater than 90% (in about 80% of the ASVs the percentage identity was > 95%), and in more than 90% of the ASVs the query coverage was equal to 100%. We removed the taxonomic assignment for blast hits if dividing in half the sum of percentage identity and percent query coverage resulted in ≤ 93% as recommended (Quast et al., 2013). The implied “family” information based on the provided taxonomic information of “orders”, “genera” and “species” by each database were fulfilled (mainly according to http://nemaplex.ucdavis.edu). We specifically checked the dominant family Thelastomatidae (41.4%) assigned by SILVA, which was not identified by PR2, the values for all genera in this family were ≥ 96% (Blattophila = 100%, Cephalobellus ≥ 96%, Hammerschmidtiella ≥ 98.8%, Severianoia ≥ 99.8%, Thelastoma ≥ 99.5%). The blast hits with low expect-values (the range of e-value in the whole datasets was from 0 to 9.68e-95) ensure that only significant blast hits were used. The nematode data handling and calculation was done with the packages ampivs2 v2.6.8 (Andersen et al., 2018) and dplyr v1.0.3 (Wickham et al., 2017) in R v3.6.0 (R Core Team, 2014) with R studio interface (Team, 2016), and the final tables were loaded and combined using knitr v1.31 (Xie, 2014) (Supplementary Tables S1, S2). For database comparison and selection, the total nematode ASVs and family numbers, numbers and frequency of reads as well as ASVs for each identified nematode family and for unidentified (family level) nematodes were checked for both reference databases.
For phylogenetic analysis, nematode ASVs with less than five sequences for the whole dataset was removed (87.9% ASVs remained for SILVA and 86.9% for PR2). The remaining sets of ASV sequences were aligned using MAFFT v7 (Katoh et al., 2019) and checked visually using MEGA v6.0 (Tamura et al., 2013). The best evolutionary model was selected using PartitionFinder v2 (Lanfear et al., 2017) by employing linked branch lengths, greedy search and BIC model selection. GTR+I+G was selected as the best model for both SILVA and PR2 alignments. A sequence of Capitella teleta (GenBank accession number: LC208027.1) was added as outgroup. Maximum likelihood analyses for each multiple sequence alignment were performed separately using IQ-TREE v1.5.5 (Nguyen et al., 2015), with the nucleotide substitution model set to GTR, base frequencies set to empirical and the site heterogeneity model set to Gamma + Invariant Sites. Nodal support was obtained with 1,000 rapid bootstraps (-bb 1,000) submitted to Cipres Platform (Miller et al., 2010). Tip annotations were conducted using Figtree v1.4.4 (Drummond et al., 2012) and ITol v4 (Letunic and Bork, 2019). Phylogenetic diversity of each species-tree inference was estimated using the PD index (Faith, 1992) in the package Picante v1.8.2 (Kembel et al., 2010) in R v3.6.0 (R Core Team, 2014), and differences between the PD indexes were tested using the Wilcoxon signed rank test.
The following analyses and that described in section 2.6 were all performed in R v4.0.3 (R Core Team, 2020) with R studio interface (RStudio, Inc.), and all nematode ASVs or OTUs were kept in read count tables for further analysis. For alpha diversity comparison between ASV and OTU data, samples were first rarefied to the minimum library size (2,941 reads for ASVs and 2,859 reads for OTUs). Alpha diversity indices (Observed Richness, Shannon, Simpson, Chao1) for both ASV and OTU data tables were calculated using the “amp_alphadiv” function in ampivs2 v2.6.8. Pearson correlations and linear regressions were applied to determine the relationship between alpha diversity indices of the ASV- and OTU-based data. For beta diversity comparison of ASV and OTU data, Bray-Curtis and Jaccard dissimilarity matrices were calculated in the R package vegan v2.5-7 (Oksanen et al., 2019) using the “avgdist” function (https://github.com/vegandevs/vegan/blob/master/man/avgdist.Rd), and the correlation of beta diversity metrics between ASV and OTU methods was then tested using Mantel correlations. The correlations between both methods were plotted using the package ggplot2 v3.3.3 (Wickham, 2011).
For compositional marker-gene analysis, the nematode ASV table was used, and the performance of the rarefaction, clr-transformation (Aitchison, 1982; Pawlowsky-Glahn and Egozcue, 2006; Gloor and Reid, 2016; Quinn et al., 2019) and ANCOM-BC-based methods (Lin and Peddada, 2020a) was compared. For the rarefaction method, rarefaction curves of alpha diversity indices were plotted (R v4.0.3, ggplot2 v3.3.3) to check whether the diversity of samples had been fully characterized at the minimum library size of all samples (2,941 reads). In order to apply clr-transformation to our data, we first used count zero multiplicative (czm) replacement to impute zeros in the raw read counts using the “cmultRepl” function in the package zCompositions v1.3.4 (Palarea-Albaladejo and Martín-Fernández, 2015), and then the “clr” function from the package compositions v2.0-1 was applied (Van den Boogaart et al., 2014). The ANCOM-BC-based normalization method was also implemented based on the raw counts community matrix using the R functions described in Lin and Peddada (2020a).
The performance of these methods was then compared by testing the ability of each dataset to discriminate different land-use systems using ordination and visualization methods. To avoid bias caused by a “Procrustean bed” (e.g., forcibly applying one unified multivariate analysis on all normalization techniques), different ordination and visualization strategies were applied based on the standard or recommended technique for each normalization method. Principal Coordinates Analysis (PCoA) was based on a Bray-Curtis distance matrix of rarefied ASV data (Weiss et al., 2015). For clr-transformed data, the Euclidean distance is superior to other dissimilarity metrics and the Principal Components Analysis (PCA) can be substantially more reproducible and stable for plotting (Aitchison et al., 2000; Gloor and Reid, 2016) and therefore was applied for the clr-transformed data. Non-metric multidimensional scaling (NMDS) was used on the Bray-Curtis distance matrix derived from ANCOM-BC normalized ASV data since it is proven to perform very well in visualizing this kind of transformed dataset (Lin and Peddada, 2020a). Squared Mahalanobis distances (MD2) between group centroids (rainforest, rubber and oil palm plantations) and pairwise Hotelling’s T-squared tests were applied separately to each ordination to identify significant differences among land-use systems. All distance matrices were calculated using the vegan v2.5-7 package (Oksanen et al., 2019) and all figures were plotted using ggplot2 v3.3.3 (Wickham, 2011). Differentially abundant ASVs and genera among the three land-use systems were also tested and compared using methods appropriate for the transformation. For the rarefaction- and clr-transformation-based methods, the “envfit” function in the vegan v2.5-7 package (Oksanen et al., 2019) was applied to the respective distance matrices to identify their differentially abundant ASVs and genera. While for the ANCOM-BC-based method, the “ancombc” function from ANCOM-BC v1.0.3 was applied to the raw count table to identify the differentially abundant ASVs and genera. Venn diagrams, plotted using VennDiagram v1.6.20, were used to represent consistency of differentially abundant ASVs/genera identified by rarefaction, clr-transformation, and ANCOM-BC-based methods.
SILVA v138 and PR2 v4.12 successfully assigned 615,313 and 621,984 reads to nematodes, respectively. Similar total numbers of nematode ASVs and families were also obtained for SILVA (779 ASVs and 64 families) and PR2 (853 ASVs and 64 families). However, SILVA assigned a much higher number of nematode reads and ASVs (567,585 reads, accounting for 92.3% of total reads, and 677 ASVs, accounting for 86.9% of total ASVs) to family level than PR2 (350,734 reads, accounting for 56.4% of total reads, and 672 ASVs, accounting for 78.8% of total ASVs). SILVA assigned the highest proportion of total reads to the nematode family Thelastomatidae (41.4%), followed by unidentified families (7.7%), Criconematidae (7.4%), Tylenchidae (5.5%), Rhabditidae (3.5%), and Mydonomidae (3.2%) (Supplementary Table S1). PR2 was unable to assign taxanomy to 43.6% of reads; the highest proportion of assigned reads were to the nematode family Criconematidae (7.4%), followed by Tylenchidae (4.0%), Cephalobidae (3.9%), Rhabditidae (3.4%), and Anguinidae (3.2%) (Supplementary Table S2). For the most abundant nematode family Thelastomatidae in SILVA (41.4%), five genera (Cephalobellus, Blattophila, Thelastoma, Hammerschmidtiella, Severianoia) were identified, but none of them were recognized by PR2 database.
The topology of the trees based on PR2 and SILVA annotation was similar (Figure 1), and phylogenetic diversity did not vary between species-tree inferences assigned by the two databases (p < 0.0978, Wilcoxon signed rank test). More monophyletic clades were displayed by the tree annotated with the SILVA database (Dorylaimida, Mermithida, Plectida and Trichocephalida) compared to that using the PR2 annotations (Diplogasterida and Trichinellida), and only the SILVA assignments identified the dominant nematode order Oxyurida, which accounted for about 40% of the total reads (Supplementary Table S1). Incoherencies in taxonomic classifications of the databases were also detected by divergent order assignments to similar families (e.g., Trichuridae was assigned as Trichinellida by PR2, and to Trichocephalida by SILVA).
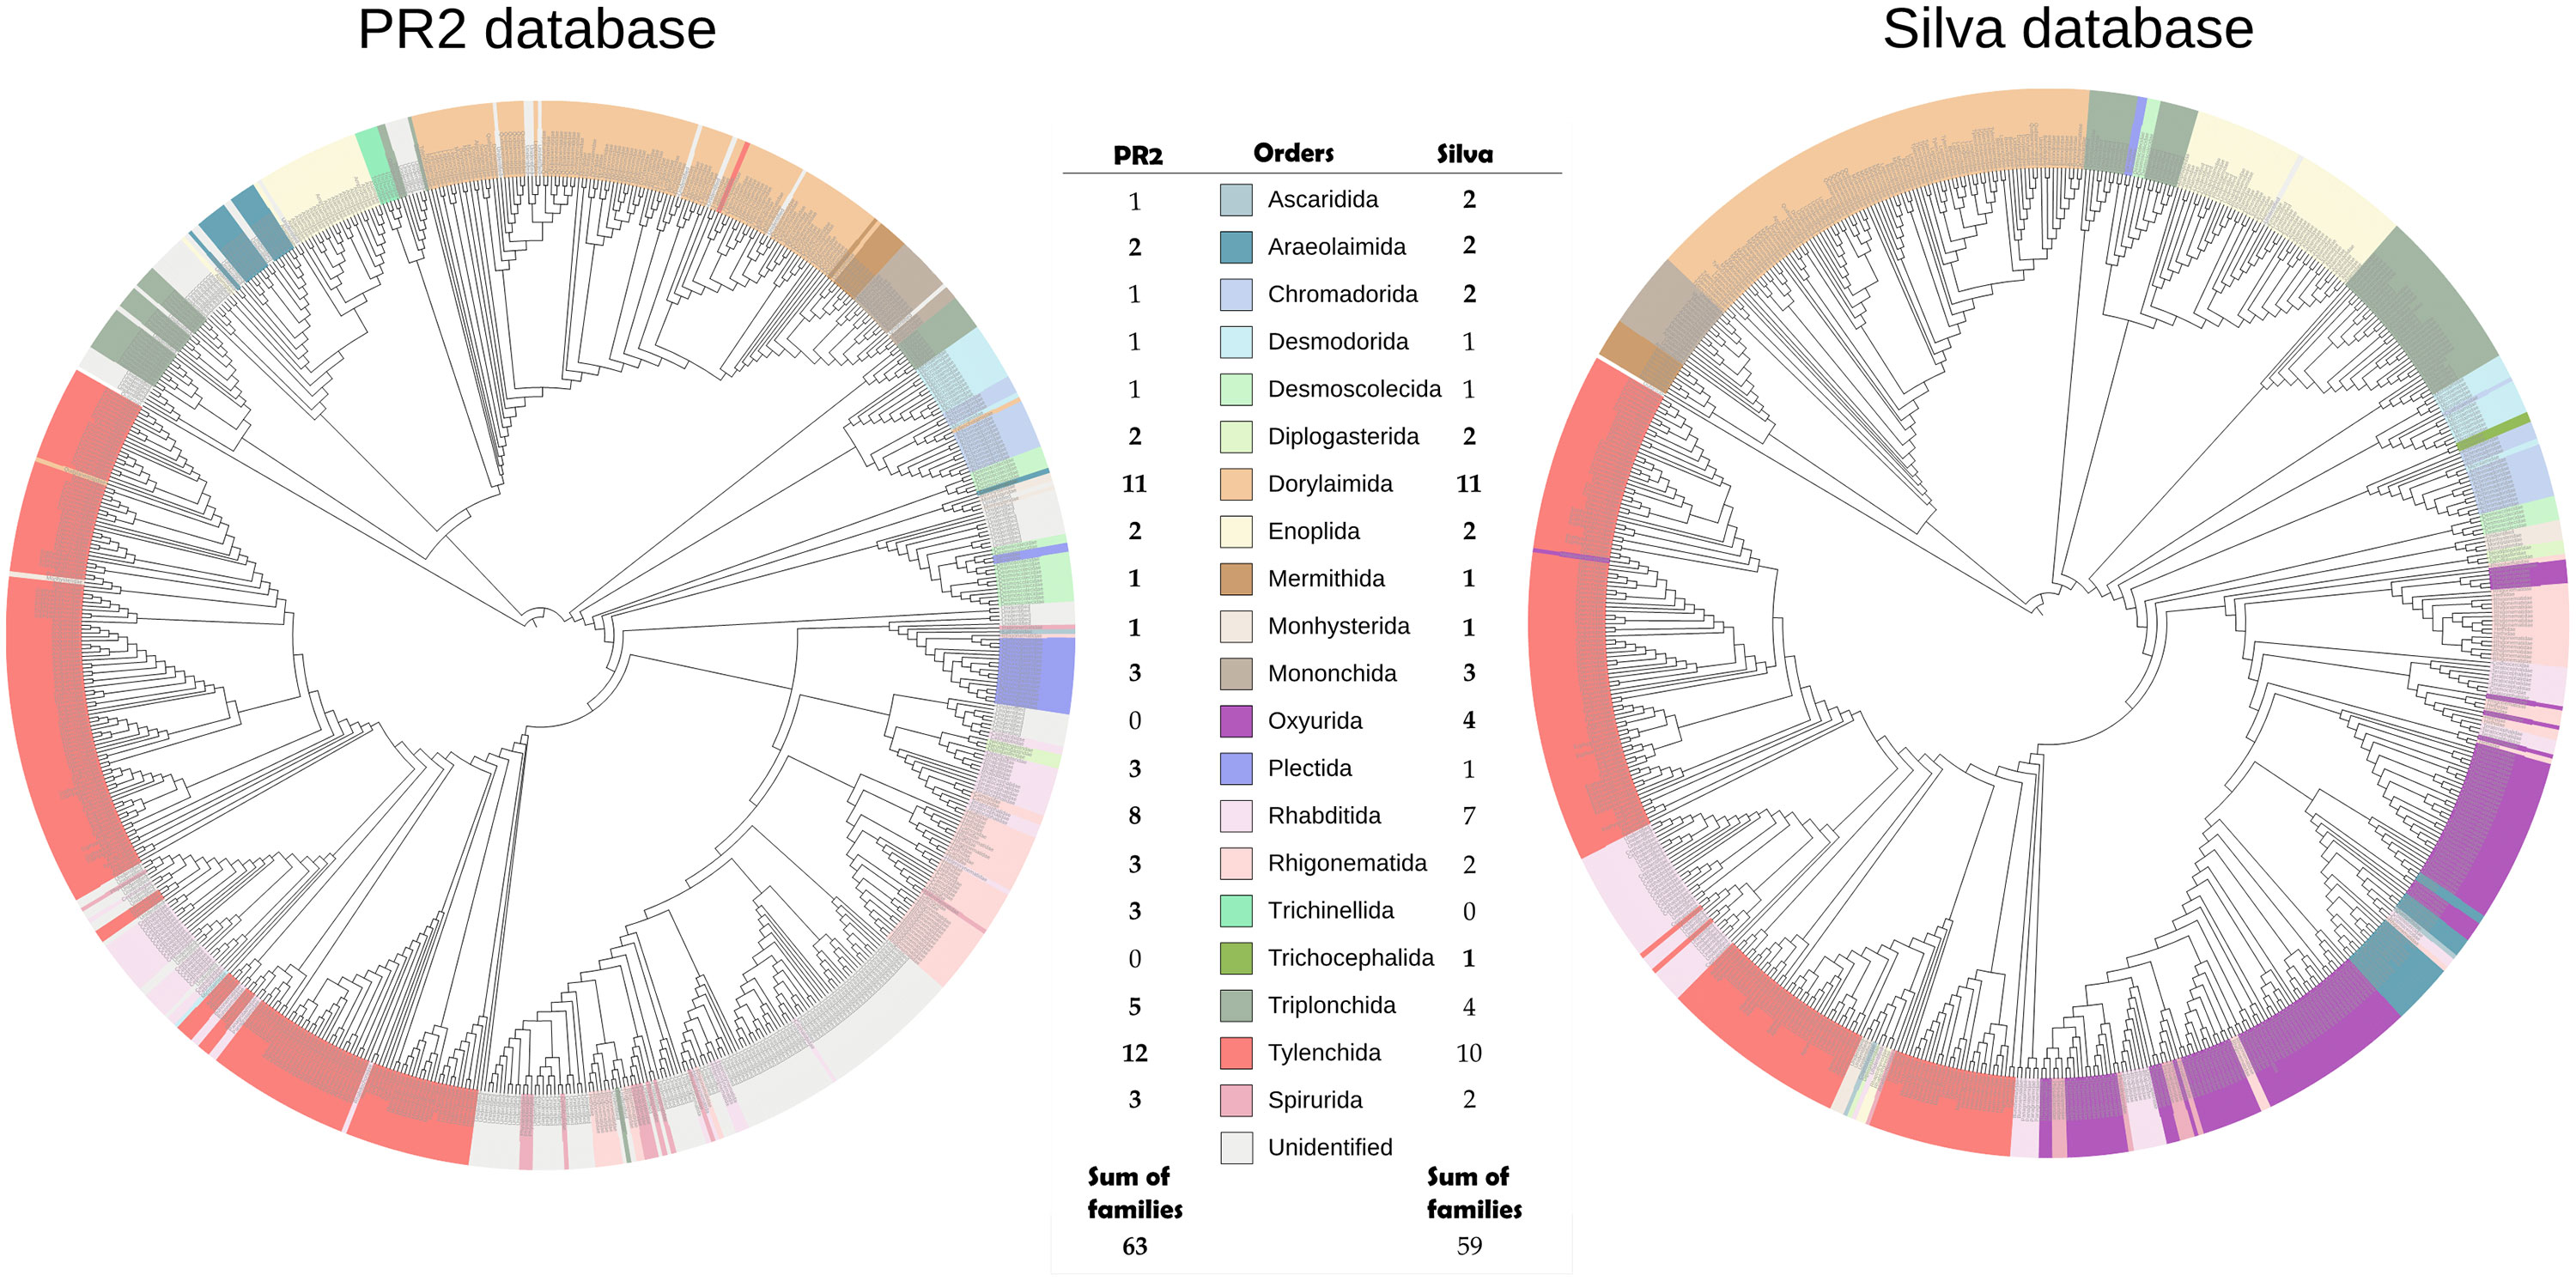
Figure 1 Comparison of phylogenetic trees of nematodes (18S rRNA gene) based on taxonomic assignment with PR2 (left) and SILVA (right) databases. Tip annotations depict family assignments using the respective database. Colors correspond to orders as encoded in the legend. Numbers represent the number of families assigned to each order by each database.
Sample-wise comparison of all four diversity indices (taxonomic unit Richness, Shannon, Inverse Simpson and Chao1) found strong correlations between ASV- and OTU-based calculations (mean Pearson’s R = 0.89; all p-values are < 0.001). For the Shannon index, the ASV and OTU approaches were not only highly correlated (Figure 2B, Pearson’s R = 0.95), but also similar in their values (mean slope = 0.89, Supplementary Table S3). For both taxonomic unit richness and Chao1 index, ASV- and OTU-based results were strongly correlated (Figures 2A–D, Pearson’s R = 0.94 and 0.73), but the values for richness and Chao1 index based on ASVs were approximately two times higher than those based on OTUs for the same sample (Supplementary Table S3, slope = 2.15 and 2.32). Inverse Simpson index values for ASV and OTU approaches were also highly correlated (Figure 2C, Pearson’s R = 0.93), but the Inverse Simpson index based on ASVs was approximately one and a half times higher than that of the corresponding OTU-based value (Supplementary Table S3, slope = 1.41).
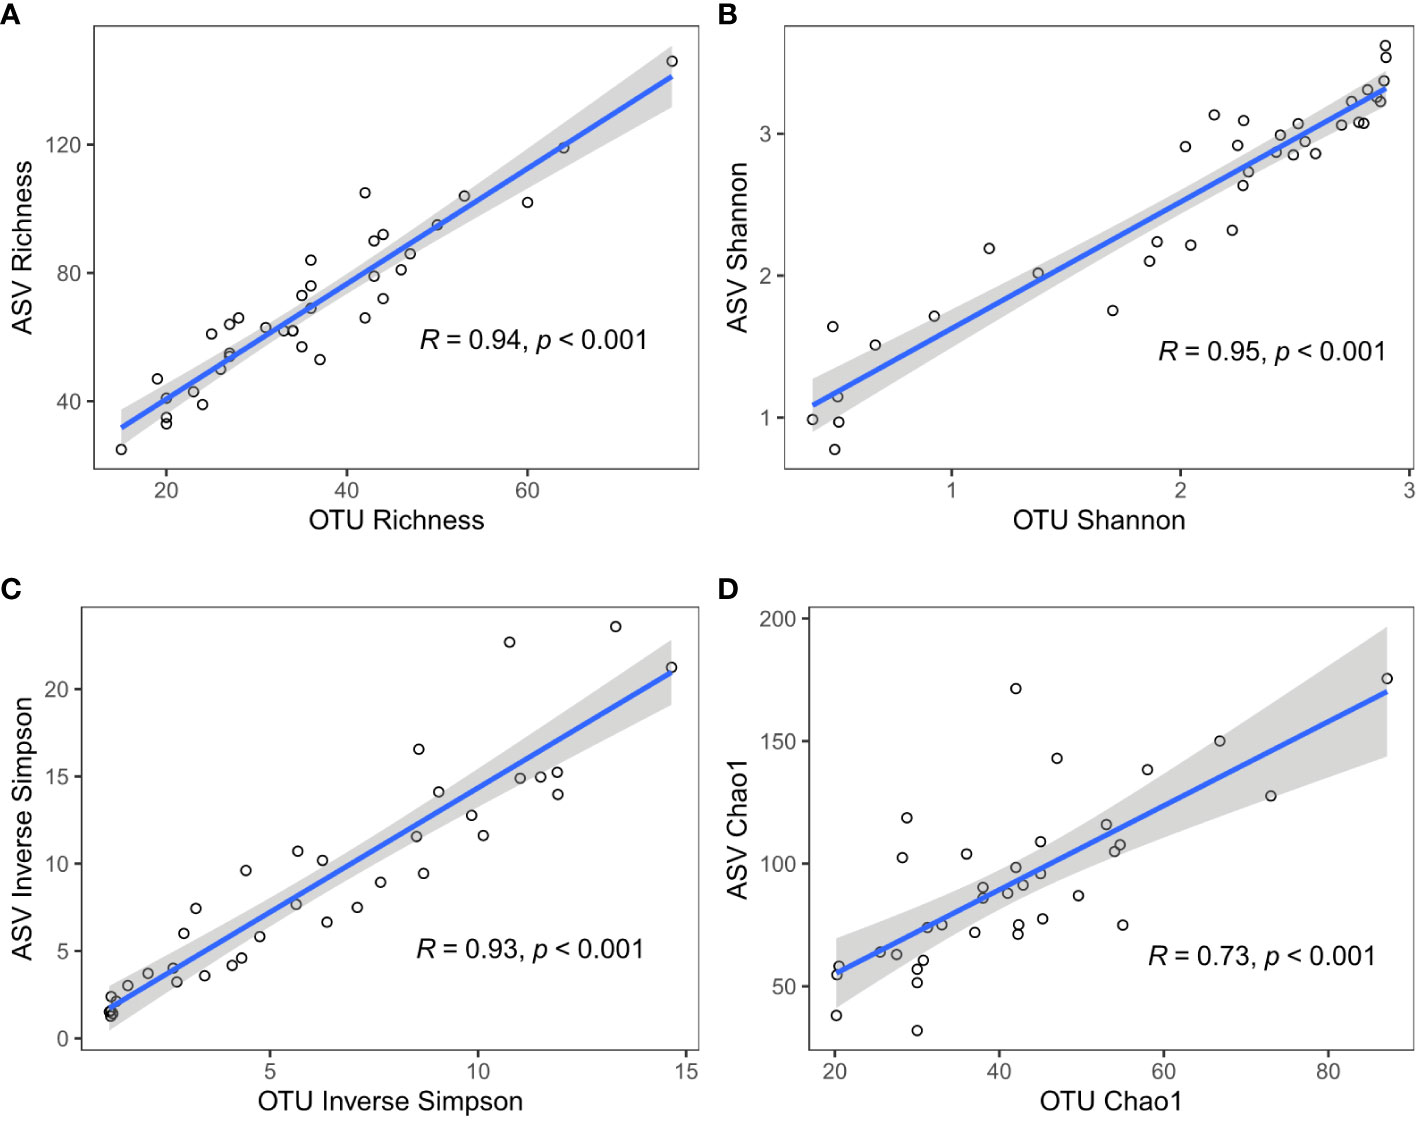
Figure 2 Comparison of alpha-diversity indices based on different data identity thresholds: ASV 100% (y-axis) or OTU 97% (x-axis). (A) Taxa unit richness, (B) Shannon index, (C) Inverse Simpson index, and (D) Chao1 index.
Beta diversity metrics were also highly correlated across samples between ASV- and OTU-based datasets (Bray-Curtis average Mantel’s R = 0.95; p values < 0.001; Figure 3), and their values were similar between ASV and OTU methods (slopes = 0.79).
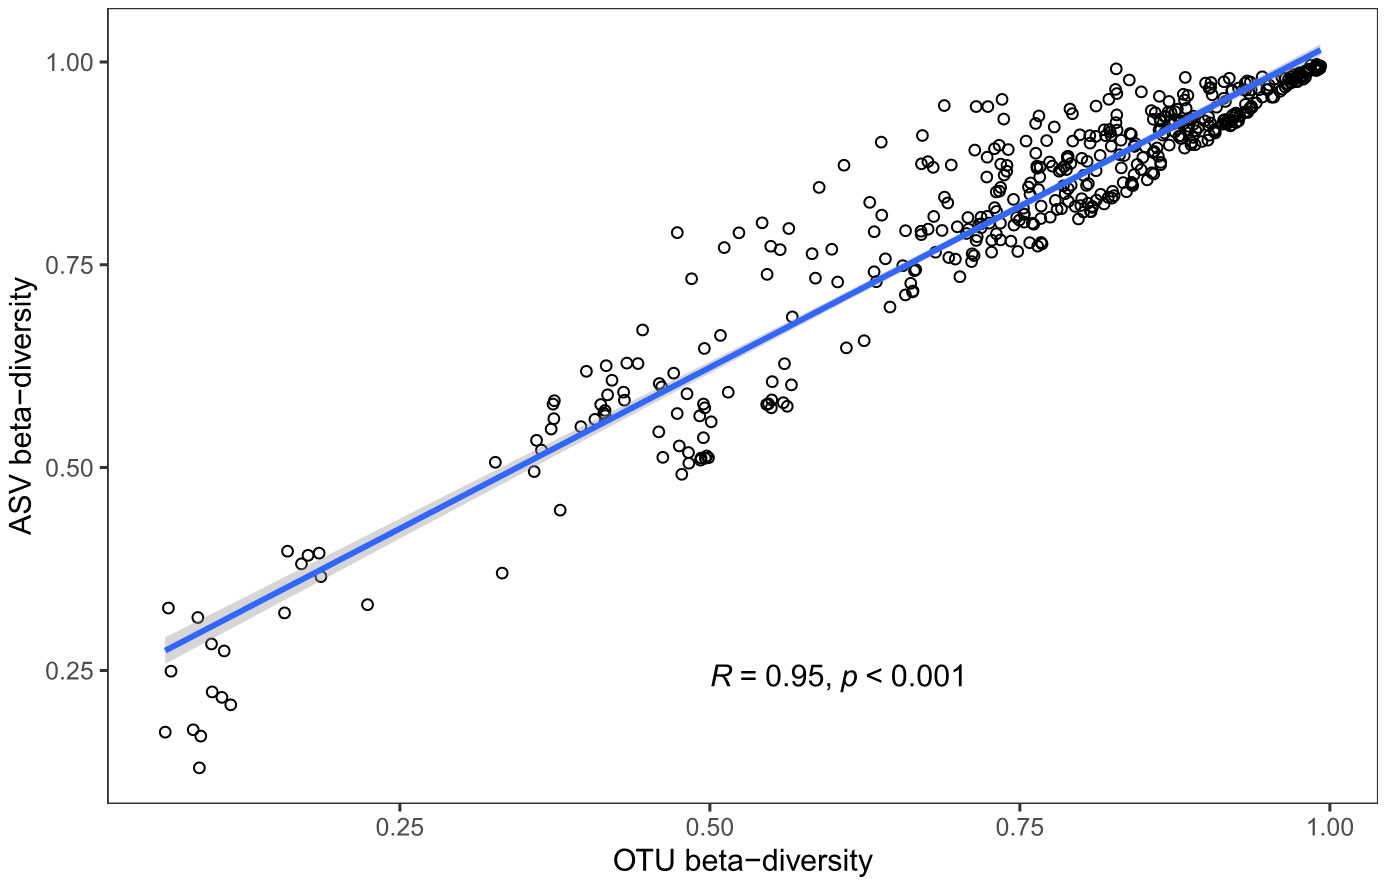
Figure 3 Comparison of beta diversity (Bray-Curtis dissimilarity) based on different data-identity thresholds: ASV 100% (y-axis) or OTU 97% (x-axis).
Differences in nematode communities between the three land-use systems were found by all downstream marker-gene data analysis methods, including rarefaction (Figure 4), clr-transformation (Figure 5) and ANCOM-BC normalization based methods (Figure 6). Rarefaction curves of alpha diversity indices (Shannon [Supplementary Figure S1] and Inverse Simpson index [Supplementary Figure S2]) showed that diversity of the samples had been fully characterized at the minimum library size (2,941 reads) of all samples after rarefaction. PCoA based on rarefied ASV data (Figure 4) clearly separated the nematode community of rainforests from the nematode community of rubber plantations (MD2 = 1.3, p = 0.007; Table 1), but less distinctly from that of oil palm plantations (MD2 = 0.8, p = 0.059; Table 1); there was no significant difference between rubber and oil palm plantations (MD2 = 1.2, p = 0.229; Table 1).
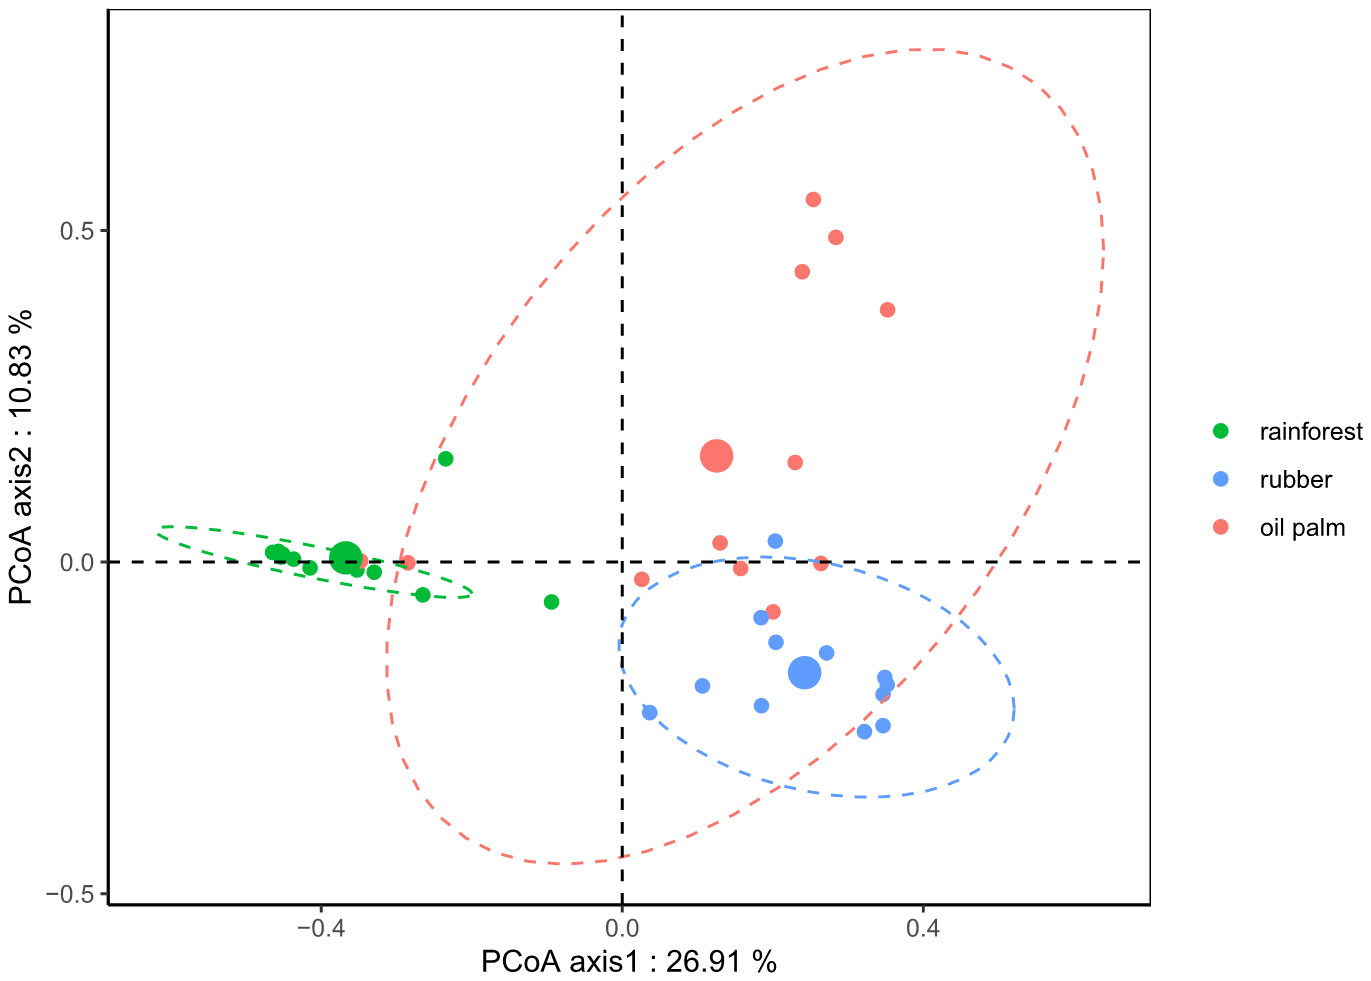
Figure 4 Principal Coordinate Analysis (PCoA) based on Bray-Curtis distances derived from rarefied (depth = 2,941) nematode ASV-based communities of three land-use systems. Rainforest: green; Rubber: blue; Oil palm: red. Ellipses were drawn at 95% confidence intervals for visualization of the respective land-use systems; centroids for each system are represented by larger circles.
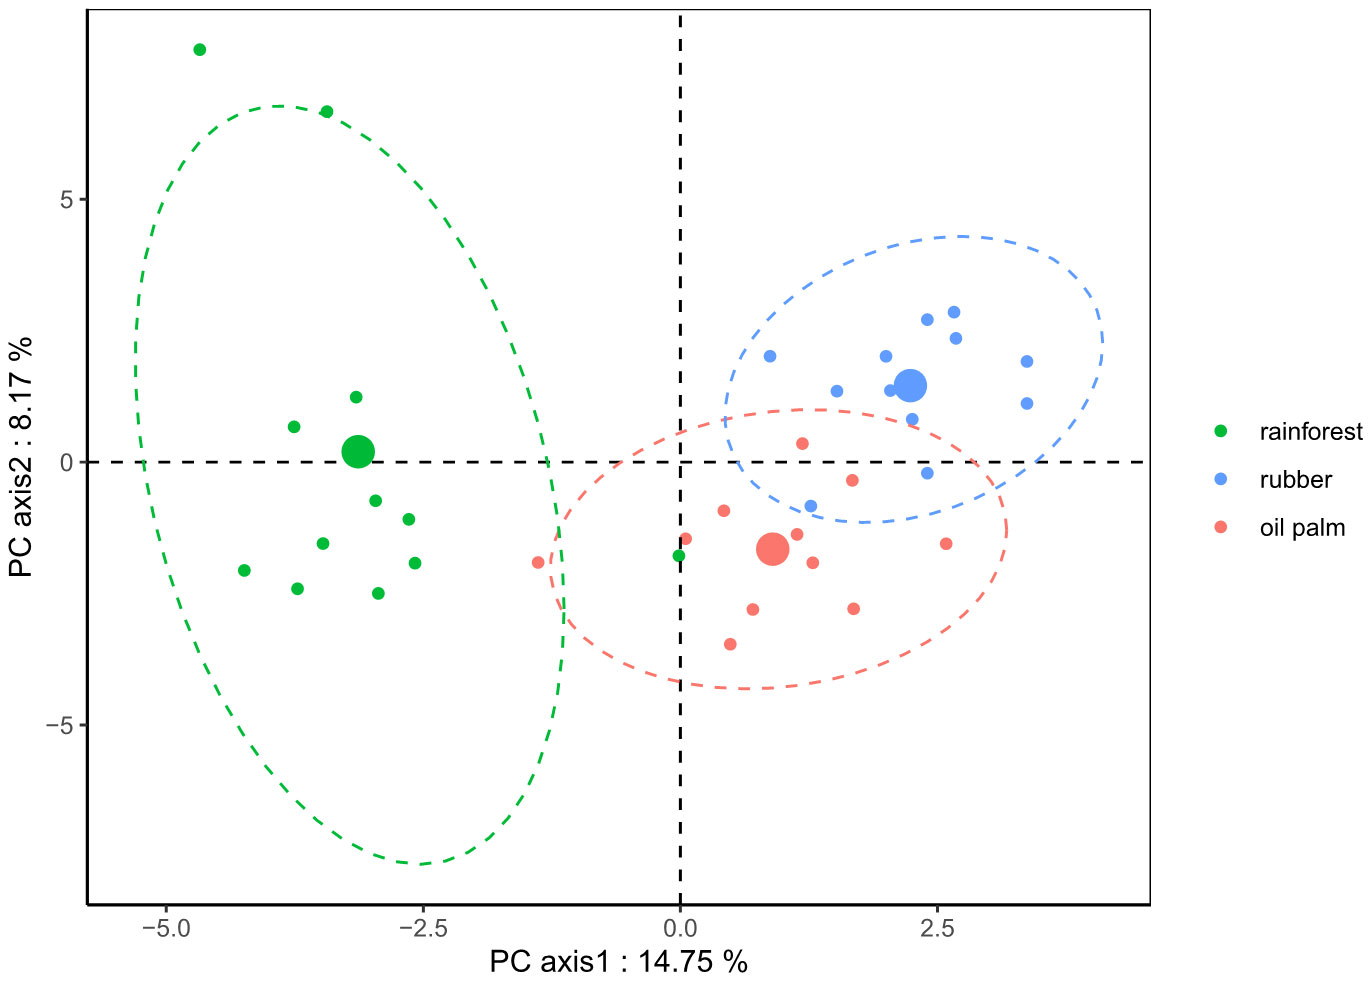
Figure 5 Principal Component Analysis (PCA) plot based on Euclidean distances calculated from clr-transformed ASV-based nematode communities of three land-use systems. Rainforest: green; Rubber: blue; Oil palm: red. Ellipses were drawn at the 95% confidence interval for visualization of the respective land-use systems; centroids for each system are represented by larger circles.
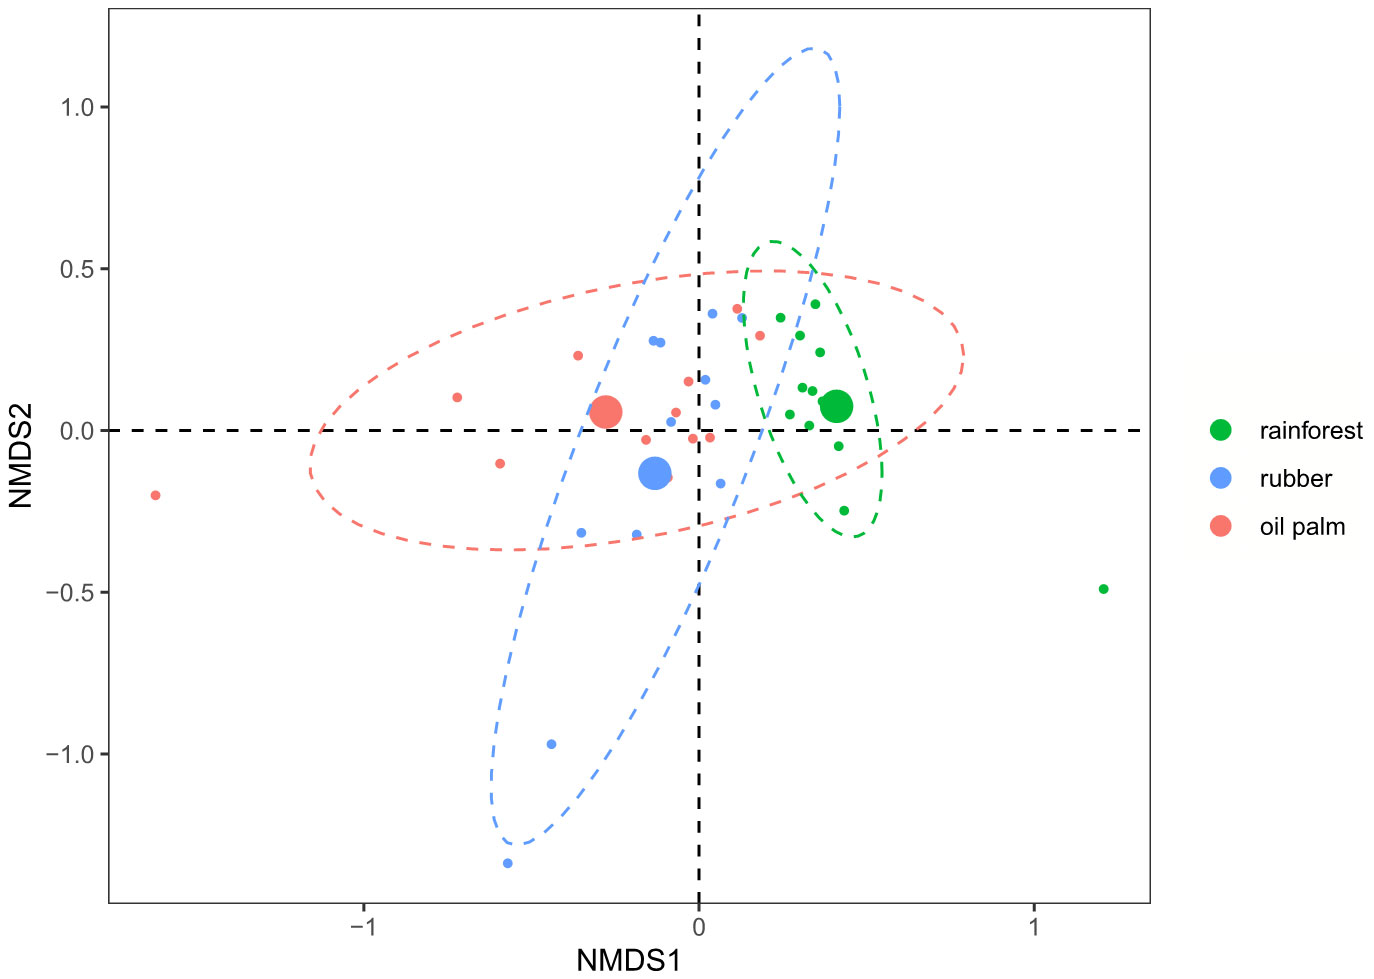
Figure 6 Non-metric Multidimensional Scaling (NMDS) plot based on Bray-Curtis distances calculated from ANCOM-BC normalized ASV-based nematode communities of three land-use systems (K = X, Stress = 0.1088). Rainforest: green; Rubber: blue; Oil palm: red. Ellipses were drawn at the 95% confidence interval for visualization of the respective land-use systems; centroids for each system are represented by larger circles.
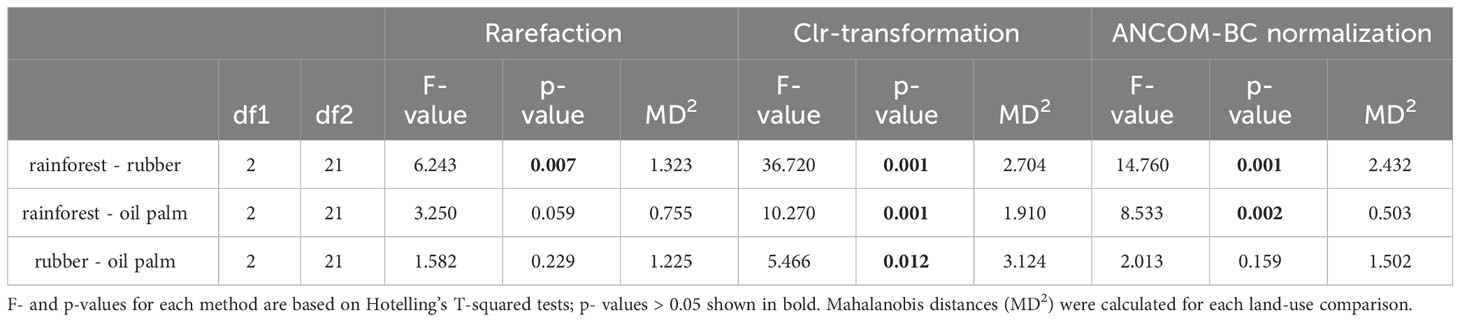
Table 1 Pairwise discrimination of nematode communities by land-use system, normalized using rarefaction, clr-transformation, and ANCOM-BC based methods.
PCA based on clr-transformed data (Figure 5) showed a similar pattern as the rarefaction-based results, but the nematode communities of the three land-use systems were all significantly different from each other: rainforests clearly separated from rubber (MD2 = 2.7, p < 0.001; Table 1) and oil palm plantations (MD2 = 1.9, p < 0.001; Table 1), and rubber plantations also separated from oil palm plantations (MD2 = 3.1, p = 0.012; Table 1).
NMDS based on ANCOM-BC normalized ASVs (Figure 6) found similar patterns as the other two methods, but the significance of the nematode community separation was intermediate to that of the rarefaction- and clr-transformation-based methods. Nematode community composition in rainforests clearly separated from that in rubber (MD2 = 2.4, p < 0.001; Table 1) and oil palm plantations (MD2 = 0.5, p = 0.002; Table 1), but there was no significant difference between nematode communities of rubber and oil palm plantations (MD2 = 1.5, p = 0.159; Table 1).
Clr-transformation-based methods recovered the most differentially abundant taxa (74) among the three land-use systems, followed by the ANCOM-BC-based (57) and rarefaction-based (36) methods (Supplementary Table S2; Figure 7). A core group of 30 differentially abundant taxa were recovered by all methods, representing 83%, 41%, and 53% of the total taxa recovered from rarefaction-, clr-transformation- and ANCOM-BC-based strategies, respectively, and nearly 40% (30/82) of the sum total (Figure 7). Only 1 of the 36 (3%) differentially abundant taxa recovered with the rarefaction method was unique, while 11% (6/57) of those recovered from ANCOM-BC and 26% (20/76) of those from clr-transformed data were unique (Figure 7).
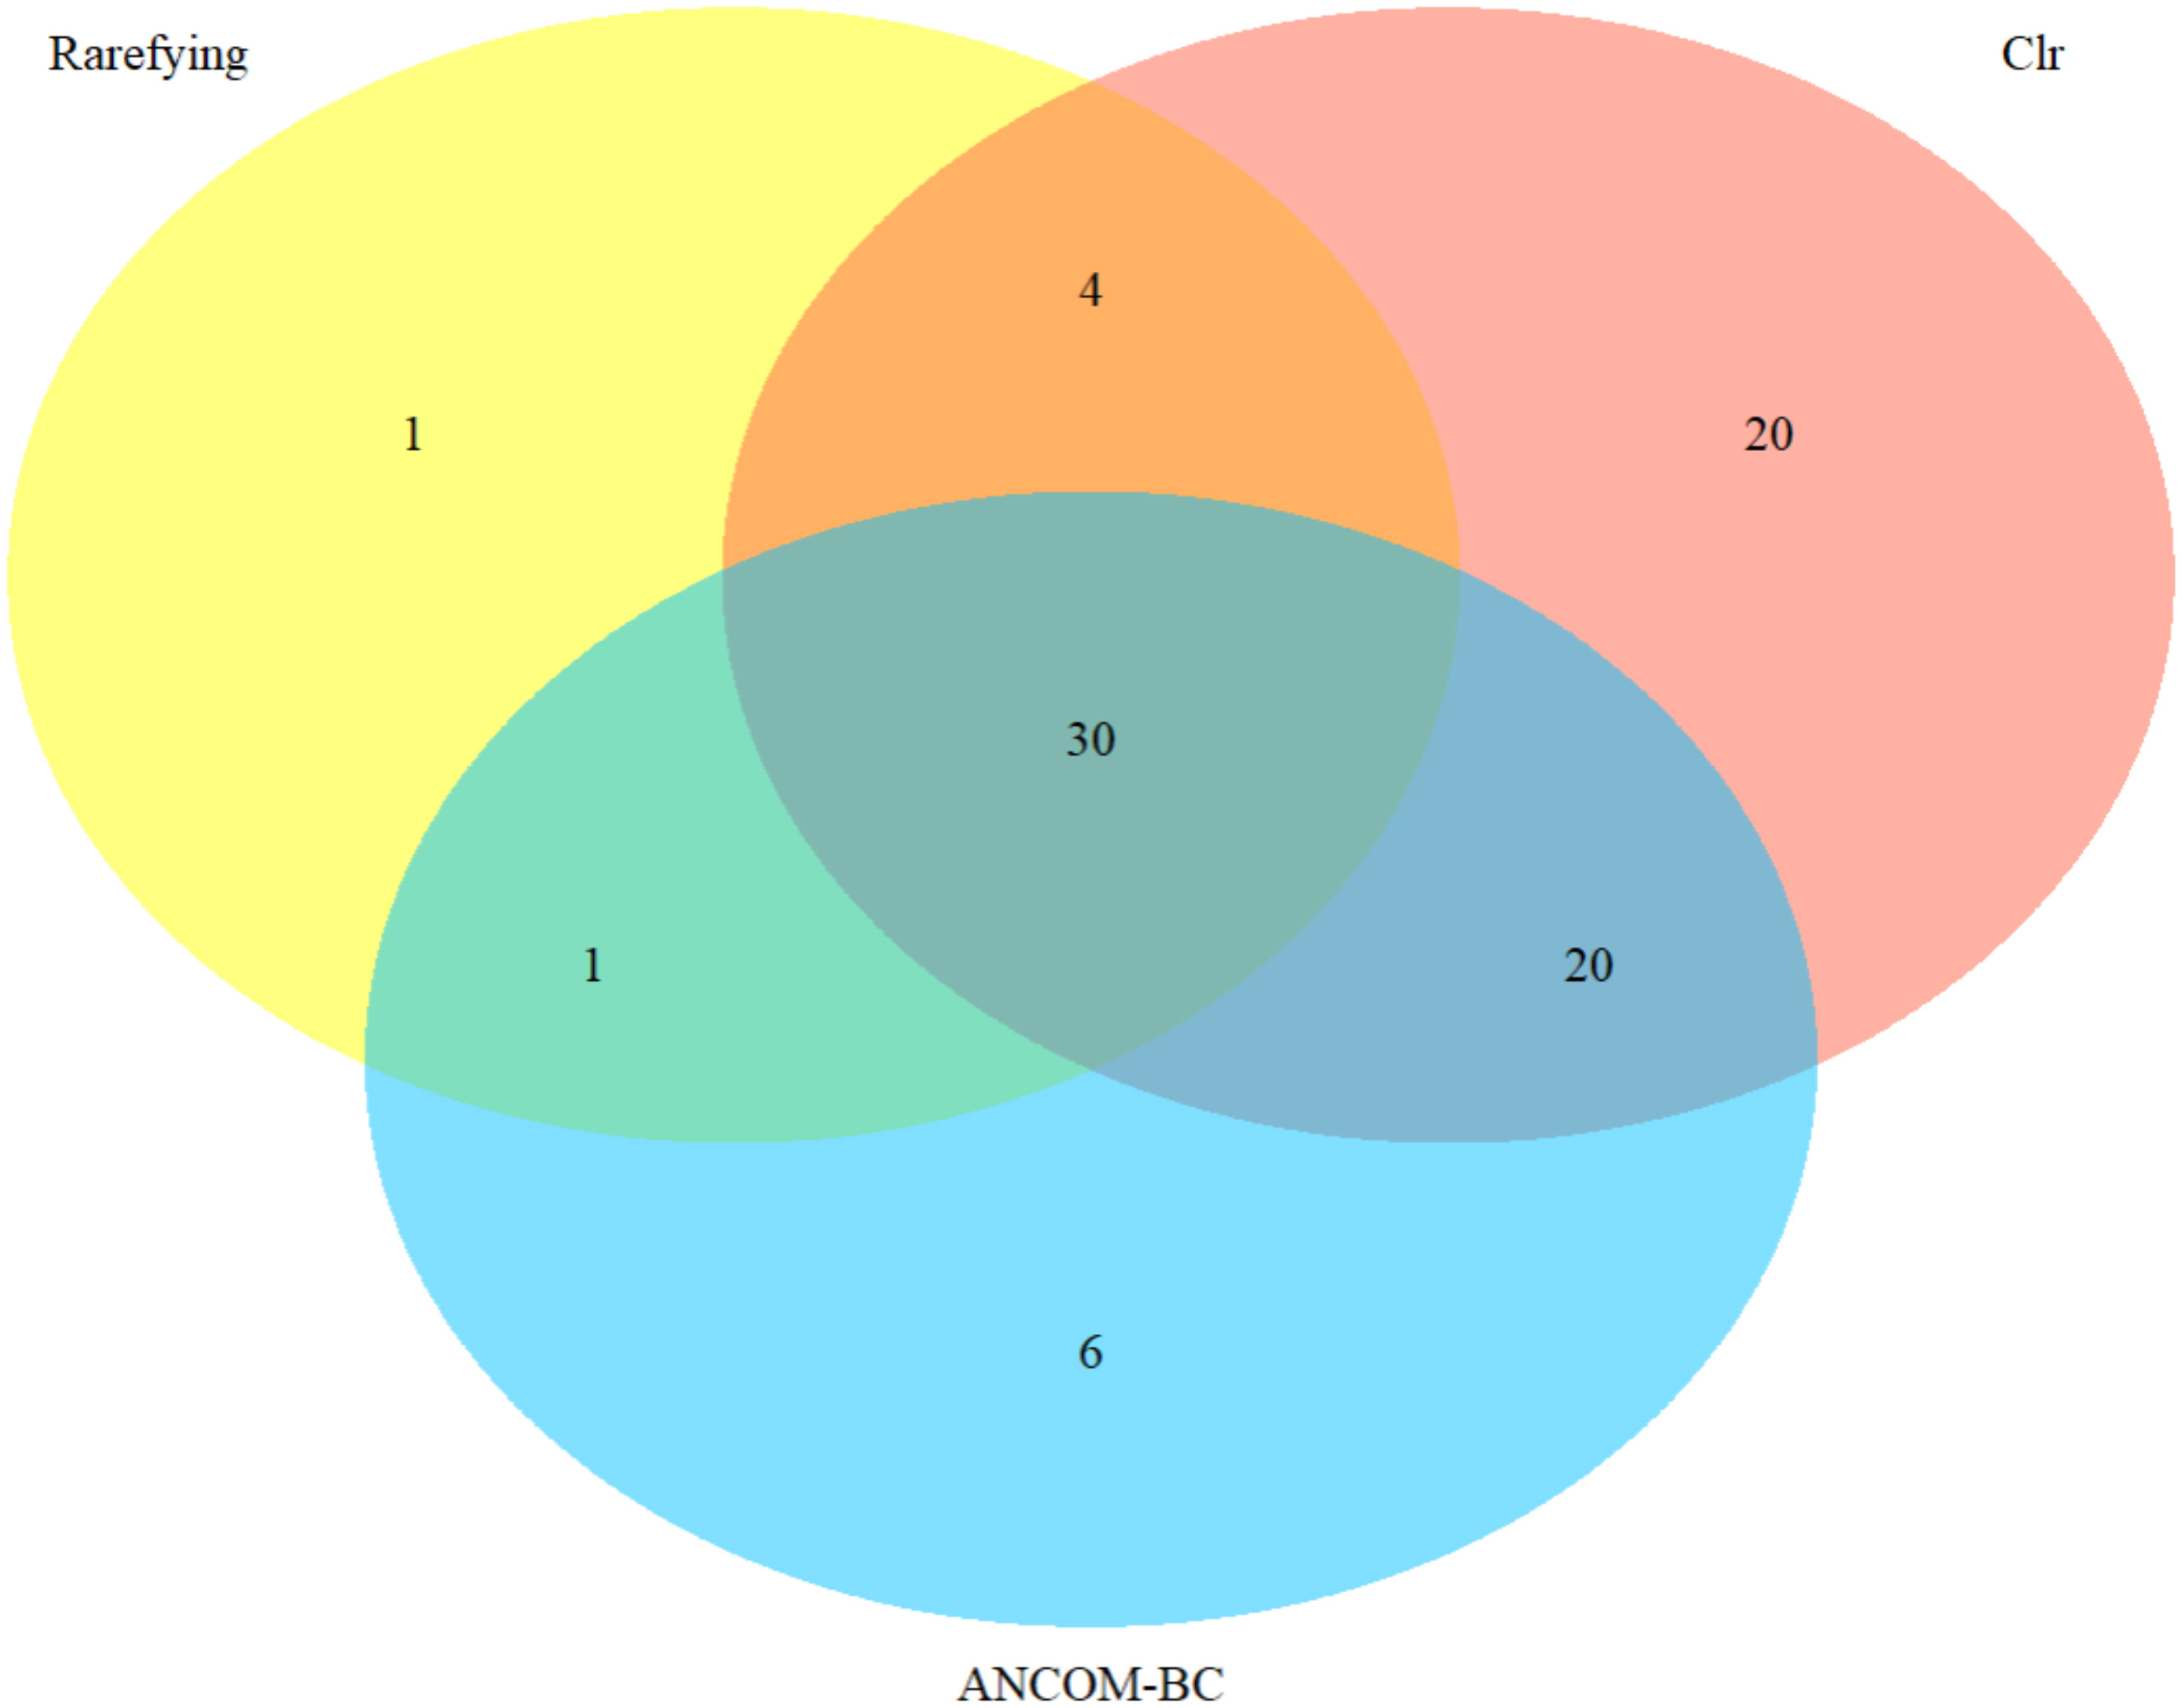
Figure 7 Venn diagram of differentially abundant nematode genera recovered by rarefaction, clr-transformation, and ANCOM-BC based methods. Taxonomic classification at genus level based on 18S rRNA gene sequences identified using the SILVA reference database.
Over the last decade, cost-effective HTS technology has become an essential tool for assessing microbial and microfaunal communities. However, marker-based techniques and the resulting datasets come with the challenge of appropriate reference database selection, taxa delimitation and compositional data analysis (Gloor et al., 2017; Weiss et al., 2017; Boshuizen and Te Beest, 2022). The present study explores the potential effects of using different taxonomic reference databases, identity thresholds and data normalization methods. Our results showed that the choice of different identity thresholds (ASV 100% vs. OTU 97%) does not affect the detection of nematode diversity. However, the selection of a taxonomic reference database does affect the assignment rates and putative identifications of nematode taxa. Further, the selection of data normalization methods affected the detection of compositional differences in nematode communities and of differentially abundant taxa among land-use systems, which might lead to different biological interpretations.
Recently, SILVA and PR2 databases have been successfully used in a number of nematode studies (Sapkota and Nicolaisen, 2015; Kerfahi et al., 2016; Geisen et al., 2018; Schuelke et al., 2018; Bongiorno et al., 2019; Wilschut et al., 2019; Sikder et al., 2020; Gong et al., 2021). However, studies on how the choice of reference database may influence nematode taxonomic classification and phylogenic results are lacking entirely. Our results showed that although nematode phylogenetic diversity based on the two databases was similar, the SILVA database assigned more reads and ASVs to the family level, performing better than PR2 at this time. This partially supports our first hypothesis, as the two reference databases generated comparable phylogenetic outputs. Taxonomic assignment was more complete with SILVA, but cases were found in which the taxonomy was not accurate in either database. We found some differences in the output that can be linked to differences in the historical foci of these two databases. SILVA database has long offered taxonomic information for Bacteria, Archaea and Eukarya (Quast et al., 2013), while the PR2 database was formerly dedicated to protists (Guillou et al., 2013). It should be noted that there are also other databases that can be used for nematodes, e.g. the NCBI NT database (www.ncbi.nlm.nih.gov). Further, our results do not indicate that the SILVA database is better than the PR2 database for studying nematodes, but rather emphasize the importance of comparing and choosing the appropriate taxonomic reference database as part of the analysis pipeline. All reference databases are dynamic and differ in their taxonomic coverage, therefore a database that is optimal now for one group of organisms may not be the first choice in the future. Thus, the importance of database selection should be extended to all marker-based studies, regardless of target organism.
The 18S rRNA gene is commonly used for molecular studies of nematodes and other eukaryotes because of the availability of universal primers and its phylogenetic resolution at high taxonomic levels (De Ley et al., 2005). Several studies have evaluated the taxonomic accuracy of this gene region for terrestrial, freshwater and marine nematodes, and found that it allows identification at family-, but also even at species-level (Meldal et al., 2007; Holovachov, 2014; Holovachov et al., 2017). Previous research indicates that 97% nucleotide identity similarity of the 16S rRNA gene approximates a species-level discrimination for bacteria (Stackebrandt and Goebel, 1994). Extended thresholds of the 18S rRNA gene were also applied to nematodes (Holovachov, 2016; Holovachov et al., 2017).
Supporting our second hypothesis, soil nematode alpha and beta diversity were similar for ASV and OTU datasets. Although the correlation of the Chao1 index between ASV and OTU datasets was less strong (larger p-values and smaller Pearson’s R value) than for other alpha-diversity indices (taxonomic unit Richness, Shannon, Inverse Simpson), the correlation was still statistically significant. The lower correlation can be explained by the high weight of singletons in calculating the Chao1 index (Chao, 1987); this increases the difference between the two datasets, as the number of singletons in the high resolution ASV data will generally be higher than in OTU data. The strongly correlated alpha- and beta-diversity metrics indicate that biological conclusions based on these metrics are likely to be similar. Therefore, our results suggest that, for nematodes, OTU-based studies can provide useful reference points and their results are likely comparable with ASV-based studies, even though ASVs are preferred to OTUs because they may increase taxonomic resolution, and increase the reusability, reproducibility and comprehensiveness of marker-gene studies (Callahan et al., 2017; Knight et al., 2018). Similar to the present study on nematodes, comparisons of ASV and OTU methods in fungi and bacteria have found that both methods reveal similar ecological patterns across different scales and ecosystems (Botnen et al., 2018; Glassman and Martiny, 2018; García-García et al., 2019). However, this may not apply to all groups, e.g. Forster et al. (2019) showed that different sequence grouping methods produced similar results for beta diversity in protists, but different results for alpha diversity or for the identification of certain key species. Therefore, comparisons between OTU- and ASV-based studies should be made with caution because different organisms may show different ecological patterns under different identity thresholds.
Results obtained using rarefaction, clr-transformation, and ANCOM-BC count data normalization methods partly support our third hypothesis that all three strategies detect similar patterns in separating nematode communities under different land-use systems. The clr-transformation-based methods were most sensitive, providing the strongest separation of land-use systems and the highest number of differentially abundant taxa, followed by ANCOM-BC-based and rarefaction-based methods. These results suggest that loss of data during subsampling under rarefaction-based methods might reduce the sensitivity of the method. On the other hand, the clr-transformation-based methods might overestimate effects: these methods do not account for uneven library size across samples (Kaul et al., 2017), potentially magnifying differences between samples. Log-transformation-based methods are likely to exaggerate the importance of rare taxa, while rarefaction or proportion based methods, which fully normalize read depths across samples, may be superior to log-transformation-based methods for comparing ecological communities (McKnight et al., 2019). Although developed for differential abundance testing, ANCOM-BC methods outperformed other normalization methods, including the proportion-based method proposed by McKnight et al. (2019) for the visualization of separate samples from different populations (Lin and Peddada, 2020a). It is beyond the scope of the present study to statistically demonstrate the superiority of ANCOM-BC-based methods, but our results do highlight the impacts of analyzing marker-gene data using different data normalization methods, as well as the potential weaknesses of rarefaction- and log-transformation-based methods for analyzing nematode HTS data.
Our results show that the SILVA database performed better than the PR2 database, with more nematode reads and ASVs assigned to family level. This indicates that the choice of reference database may significantly influence taxonomic classification even though the taxonomic coverage of the databases may only differ slightly. OTU- and ASV-based nematode data provided strongly correlated alpha- and beta-diversity results. This indicates that OTU-based studies may be used as reference points and their results are likely to be similar to ASV-based studies. All normalization strategies applied in this study detected similar patterns between nematode communities from different land-use systems, but clr-transformation-based methods were most sensitive, followed by ANCOM-BC-based and rarefaction-based methods. Rarefaction- and clr-transformation-based methods may under- or over-estimate effects, respectively. As ANCOM-BC retains all data and accounts for uneven library sizes between samples, it appears more suitable to analyze nematode community data. Patterns of nematode community composition correspond to those recovered by clr-transformation- and ANCOM-BC-based methods, suggesting that statistically significant findings of rarefaction-based studies may well be used for comparison. Differentially abundant taxa identified by rarefaction-based methods represented a subset of those detected by the other two methods, providing a more conservative picture of differences in nematode diversity. Overall, our study highlights the importance of analytical decisions for marker-gene data. While future studies might prefer ASV over OTU to achieve higher resolution of target organisms and increase reusability of the data, both the taxonomic reference database and normalization strategy should be carefully considered before data analysis.
The datasets presented in this study can be found in online repositories. The names of the repository/repositories and accession number(s) can be found below: https://www.ebi.ac.uk/ena, PRJEB54886.
VK and SS designed the study. VK, JB, TH performed the field or laboratory work. AP advised field and lab work. SW, CM, ZL, GS, DS analyzed the data. SW drafted the first version of manuscript. VK revised the first draft. All authors contributed to the article and approved the submitted version.
The author(s) declare financial support was received for the research, authorship, and/or publication of this article. This study was financed by the German Research Foundation (DFG), project number 192626868-SFB 990 in the framework of the collaborative German-Indonesian research project CRC990. We gratefully acknowledge the China Scholarship Council (CSC) (202008080160) for supporting Simin Wang.
We thank the following persons and organizations for granting us access to properties: village leaders, local plot owners, State Ministry of Research and Technology of Indonesia (RISTEK), the Indonesian Institute of Sciences (LIPI), Ministry of Forestry (PHKA), Bukit Duabelas National Park. We thank the colleagues and helpers for their support in the field and laboratory. We thank the reviewers for their comments.
The authors declare that the research was conducted in the absence of any commercial or financial relationships that could be construed as a potential conflict of interest.
All claims expressed in this article are solely those of the authors and do not necessarily represent those of their affiliated organizations, or those of the publisher, the editors and the reviewers. Any product that may be evaluated in this article, or claim that may be made by its manufacturer, is not guaranteed or endorsed by the publisher.
The Supplementary Material for this article can be found online at: https://www.frontiersin.org/articles/10.3389/fevo.2024.1168288/full#supplementary-material
Ahmed M., Back M. A., Prior T., Karssen G., Lawson R., Adams I., et al. (2019). Metabarcoding of soil nematodes: the importance of taxonomic coverage and availability of reference sequences in choosing suitable marker(s). Metabarcoding Metagenom. 3, e36408. doi: 10.3897/mbmg.3.36408
Aitchison J. (1982). The statistical analysis of compositional data. J. R. Stat. Soc.: Ser. B (Methodological) 44, 139–160. doi: 10.1111/j.2517-6161.1982.tb01195.x
Aitchison J. A., Vidal C., Martín-Fernández J., Pawlowsky-Glahn V. (2000). Logratio analysis and compositional distance. Math. Geol. 32, 271–275. doi: 10.1023/A:1007529726302
Amir A., Daniel M., Navas-Molina J., Kopylova E., Morton J., Xu Z. Z., et al. (2017). Deblur rapidly resolves single-nucleotide community sequence patterns. Am. Soc. Microbiol. 2, 1–7. doi: 10.1128/mSystems.00191-16
Andersen K. S., Kirkegaard R. H., Karst S. M., Albertsen M. (2018). ampvis2: An R package to analyse and visualise 16S rRNA amplicon data. bioRxiv, 299537. doi: 10.1101/299537
Ballauff J., Schneider D., Edy N., Irawan B., Daniel R., Polle A. (2021). Shifts in root and soil chemistry drive the assembly of belowground fungal communities in tropical land-use systems. Soil Biol. Biochem. 154, 108140. doi: 10.1016/j.soilbio.2021.108140
Bardgett R. D., Van Der Putten W. H. (2014). Belowground biodiversity and ecosystem functioning. Nature 515, 505–511. doi: 10.1038/nature13855
Bongiorno G., Bodenhausen N., Bünemann E. K., Brussaard L., Geisen S., Mäder P., et al. (2019). Reduced tillage, but not organic matter input, increased nematode diversity and food web stability in European long-term field experiments. Mol. Ecol. 28, 4987–5005. doi: 10.1111/mec.15270
Boshuizen H. C., Te Beest D. E. (2022). Pitfalls in the statistical analysis of microbiome amplicon sequencing data. Mol. Ecol. Res. 23, 539–548. doi: 10.1111/1755-0998.13730
Botnen S. S., Davey M. L., Halvorsen R., Kauserud H. (2018). Sequence clustering threshold has little effect on the recovery of microbial community structure. Mol. Ecol. Resour. 18, 1064–1076. doi: 10.1111/1755-0998.12894
Callahan B. J., Mcmurdie P. J., Holmes S. P. (2017). Exact sequence variants should replace operational taxonomic units in marker-gene data analysis. ISME J. 11, 2639–2643. doi: 10.1038/ismej.2017.119
Callahan B. J., McMurdie P. J., Rosen M. J., Han A. W., Johnson A. J. A., Holmes S. P. (2016). DADA2: High-resolution sample inference from Illumina amplicon data. Nat. Methods 13, 581–583. doi: 10.1038/nmeth.3869
Camacho C., Coulouris G., Avagyan V., Ma N., Papadopoulos J., Bealer K., et al. (2009). BLAST+: architecture and applications. BMC Bioinf. 10, 421. doi: 10.1186/1471-2105-10-421
Chao A. (1987). Estimating the population size for capture-recapture data with unequal catchability. Biometrics 43, 783–791. doi: 10.2307/2531532
Chen S., Zhou Y., Chen Y., Gu J. (2018). fastp: an ultra-fast all-in-one FASTQ preprocessor. Bioinformatics 34, i884–i890. doi: 10.1093/bioinformatics/bty560
De Ley P., De Ley I. T., Morris K., Abebe E., Mundo-Ocampo M., Yoder M., et al. (2005). An integrated approach to fast and informative morphological vouchering of nematodes for applications in molecular barcoding. Philos. Trans. R. Soc. B: Biol. Sci. 360, 1945–1958. doi: 10.1098/rstb.2005.1726
Doi H., Inui R., Akamatsu Y., Kanno K., Yamanaka H., Takahara T., et al. (2017). Environmental DNA analysis for estimating the abundance and biomass of stream fish. Freshw. Biol. 62, 30–39. doi: 10.1111/fwb.12846
Drescher J., Rembold K., Allen K., Beckschäfer P., Buchori D., Clough Y., et al. (2016). Ecological and socio-economic functions across tropical land use systems after rainforest conversion. Philosophical Transactions of the Royal Society B. Biol. Sci. 371, 20150275. doi: 10.1098/rstb.2015.0275
Drummond A. J., Suchard M. A., Xie D., Rambaut A. (2012). Bayesian phylogenetics with BEAUti and the BEAST 1.7. Mol. Biol. Evol. 29, 1969–1973. doi: 10.1093/molbev/mss075
Edgar R. C. (2016). UNOISE2: improved error-correction for Illumina 16S and ITS amplicon sequencing. bioRxiv, 081257. doi: 10.1101/081257
Eren A. M., Maignien L., Sul W. J., Murphy L. G., Grim S. L., Morrison H. G., et al. (2013). Oligotyping: Differentiating between closely related microbial taxa using 16S rRNA gene data. Methods Ecol. Evol. 4, 1111–1119. doi: 10.1111/2041-210X.12114
Eren A. M., Morrison H. G., Lescault P. J., Reveillaud J., Vineis J. H., Sogin M. L. (2014). Minimum entropy decomposition: Unsupervised oligotyping for sensitive partitioning of high-throughput marker gene sequences. ISME J. 9, 968–979. doi: 10.1038/ismej.2014.195
Faith D. P. (1992). Conservation evaluation and phylogenetic diversity. Biol. Conserv. 61, 1–10. doi: 10.1016/0006-3207(92)91201-3
Ferris H. (2010). Contribution of nematodes to the structure and function of the soil food web. J. Nematol. 42, 63.
Ferris H., Venette R. C., Scow K. M. (2004). Soil management to enhance bacterivore and fungivore nematode populations and their nitrogen mineralisation function. Appl. Soil Ecol. 25, 19–35. doi: 10.1016/j.apsoil.2003.07.001
Forster D., Lentendu G., Filker S., Dubois E., Wilding T. A., Stoeck T. (2019). Improving eDNA-based protist diversity assessments using networks of amplicon sequence variants. Environ. Microbiol. 21, 4109–4124. doi: 10.1111/1462-2920.14764
García-García N., Tamames J., Linz A. M., Pedrós-Alió C., Puente-Sánchez F. (2019). Microdiversity ensures the maintenance of functional microbial communities under changing environmental conditions. ISME J. 13, 2969–2983. doi: 10.1038/s41396-019-0487-8
Geisen S., Snoek L. B., ten Hooven F. C., Duyts H., Kostenko O., Bloem J., et al. (2018). Integrating quantitative morphological and qualitative molecular methods to analyse soil nematode community responses to plant range expansion. Methods Ecol. Evol. 9, 1366–1378. doi: 10.1111/2041-210X.12999
Glassman S. I., Martiny J. B. H. (2018). Broadscale ecological patterns are robust to use of exact sequence variants versus operational taxonomic units. mSphere 3, e00148–e00118. doi: 10.1128/mSphere.00148-18
Gloor G. B., Macklaim J. M., Pawlowsky-Glahn V., Egozcue J. J. (2017). Microbiome datasets are compositional: And this is not optional. Front. Microbiol. 8, 2224. doi: 10.3389/fmicb.2017.02224
Gloor G. B., Reid G. (2016). Compositional analysis: A valid approach to analyze microbiome high-throughput sequencing data. Can. J. Microbiol. 62, 692–703. doi: 10.1139/cjm-2015-0821
Gong X., Chen X., Geisen S., Zhang J., Zhu H., Hu F., et al. (2021). Agricultural habitats are dominated by rapidly evolving nematodes revealed through phylogenetic comparative methods. Soil Biol. Biochem. 155, 108183. doi: 10.1016/j.soilbio.2021.108183
Griffiths B. S., de Groot G. A., Laros I., Stone D., Geisen S. (2018). The need for standardisation: Exemplified by a description of the diversity, community structure and ecological indices of soil nematodes. Ecol. Indic. 87, 43–46. doi: 10.1016/j.ecolind.2017.12.002
Guillou L., Bachar D., Audic S., Bass D., Berney C., Bittner L., et al. (2013). The Protist Ribosomal Reference database (PR2): A catalog of unicellular eukaryote Small Sub-Unit rRNA sequences with curated taxonomy. Nucleic Acids Res. 41, D597–D604. doi: 10.1093/nar/gks1160
Holovachov O. (2014). Nematodes from terrestrial and freshwater habitats in the Arctic. Biodivers. Data J. 2). doi: 10.3897/BDJ.2.e1165
Holovachov O. (2016). Metabarcoding of marine nematodes–evaluation of similarity scores used in alignment-based taxonomy assignment approach. Biodivers. Data J. 4). doi: 10.3897/BDJ.4.e10647
Holovachov O., Haenel Q., Bourlat S. J., Jondelius U. (2017). Taxonomy assignment approach determines the efficiency of identification of OTUs in marine nematodes. R. Soc. Open Sci. 4, 170315. doi: 10.1098/rsos.170315
Ingham R. E., Trofymow J. A., Ingham E. R., Coleman D. C. (1985). Interactions of bacteria, fungi, and their nematode grazers: effects on nutrient cycling and plant growth. Ecol. Monogr. 55, 119–140. doi: 10.2307/1942528
Joos L., Beirinckx S., Haegeman A., Debode J., Vandecasteele B., Baeyen S., et al. (2020). Daring to be differential: metabarcoding analysis of soil and plant-related microbial communities using amplicon sequence variants and operational taxonomical units. BMC Genomics 21, 1–17. doi: 10.1186/s12864-020-07126-4
Katoh K., Rozewicki J., Yamada K. D. (2019). MAFFT online service: multiple sequence alignment, interactive sequence choice and visualization. Briefings Bioinf. 20, 1160–1166. doi: 10.1093/bib/bbx108
Kaul A., Mandal S., Davidov O., Peddada S. D. (2017). Analysis of microbiome data in the presence of excess zeros. Front. Microbiol. 8, 2114. doi: 10.3389/fmicb.2017.02114
Kelly R. P., Port J. A., Yamahara K. M., Martone R. G., Lowell N., Thomsen P. F., et al. (2014). Harnessing DNA to improve environmental management. Science 344, 1455–1456. doi: 10.1126/science.1251156
Kembel S. W., Cowan P. D., Helmus M. R., Cornwell W. K., Morlon H., Ackerly D. D., et al. (2010). Picante: R tools for integrating phylogenies and ecology. Bioinformatics 26, 1463–1464. doi: 10.1093/bioinformatics/btq166
Kerfahi D., Tripathi B. M., Porazinska D. L., Park J., Go R., Adams J. M. (2016). Do tropical rain forest soils have greater nematode diversity than High Arctic tundra? A metagenetic comparison of Malaysia and Svalbard. Global Ecol. Biogeogr. 25, 716–728. doi: 10.1111/geb.12448
Kiontke K., Fitch D. H. (2013). Nematodes. Curr. Biol. 23, R862–R864. doi: 10.1016/j.cub.2013.08.009
Knight R., Vrbanac A., Taylor B. C., Aksenov A., Callewaert C., Debelius J., et al. (2018). Best practices for analysing microbiomes. Nat. Rev. Microbiol. 16, 410–422. doi: 10.1038/s41579-018-0029-9
Konstantinidis K. T., Tiedje J. M. (2005). Genomic insights that advance the species definition for prokaryotes. Proc. Natl. Acad. Sci. 102, 2567–2572. doi: 10.1073/pnas.0409727102
Lambshead P. J. D. (1993). “Recent developments in marine benthic biodiversity reserch” in Oceanis : serie de documents oceanographiques. 19, 5–24.
Lanfear R., Frandsen P. B., Wright A. M., Senfeld T., Calcott B. (2017). PartitionFinder 2: new methods for selecting partitioned models of evolution for molecular and morphological phylogenetic analyses. Mol. Biol. Evol. 34, 772–773. doi: 10.1093/molbev/msw260
Letunic I., Bork P. (2019). Interactive Tree Of Life (iTOL) v4: recent updates and new developments. Nucleic Acids Res. 47, W256–W259. doi: 10.1093/nar/gkz239
Lin H., Peddada S. D. (2020a). Analysis of compositions of microbiomes with bias correction. Nat. Commun. 11, 1–11. doi: 10.1038/s41467-020-17041-7
Lin H., Peddada S. D. (2020b). Analysis of microbial compositions: a review of normalization and differential abundance analysis. NPJ biofilms microbio. 6, 60. doi: 10.1038/s41522-020-00160-w
Lozupone C., Lladser M. E., Knights D., Stombaugh J., Knight R. (2011). UniFrac: An effective distance metric for microbial community comparison. ISME J. 5, 169–172. doi: 10.1038/ismej.2010.133
Mandal S., Van Treuren W., White R. A., Eggesbø M., Knight R., Peddada S. D. (2015). Analysis of composition of microbiomes: a novel method for studying microbial composition. Microbial. Ecol. Health Dis. 26, 27663. doi: 10.3402/mehd.v26.27663
Martin M. (2011). Cutadapt removes adapter sequences from high-throughput sequencing reads. EMBnet. J. 17, 10–12. doi: 10.14806/ej.17.1
McKnight D. T., Huerlimann R., Bower D. S., Schwarzkopf L., Alford R. A., Zenger K. R. (2019). Methods for normalizing microbiome data: An ecological perspective. Methods Ecol. Evol. 10, 389–400. doi: 10.1111/2041-210X.13115
McMurdie P. J., Holmes S. (2014). Waste not, want not: why rarefying microbiome data is inadmissible. PloS Comput. Biol. 10, e1003531. doi: 10.1371/journal.pcbi.1003531
Meldal B. H., Debenham N. J., De Ley P., De Ley I. T., Vanfleteren J. R., Vierstraete A. R., et al. (2007). An improved molecular phylogeny of the Nematoda with special emphasis on marine taxa. Mol. Phylogenet. Evol. 42, 622–636. doi: 10.1016/j.ympev.2006.08.025
Miller M. A., Pfeiffer W., Schwartz T. (2010). “Creating the CIPRES Science Gateway for inference of large phylogenetic trees,” in 2010 gateway computing environments workshop (GCE). (Institute of Electrical and Electronics Engineers, New York City, the U.S.: IEEE), 1–8.
Needham D. M., Sachdeva R., Fuhrman J. A. (2017). Ecological dynamics and co-occurrence among marine phytoplankton, bacteria and myoviruses shows microdiversity matters. ISME J. 11, 1614–1629. doi: 10.1038/ismej.2017.29
Nguyen L. T., Schmidt H. A., Von Haeseler A., Minh B. Q. (2015). IQ-TREE: A fast and effective stochastic algorithm for estimating maximum-likelihood phylogenies. Mol. Biol. Evol. 32, 268–274. doi: 10.1093/molbev/msu300
Nguyen N. P., Warnow T., Pop M., White B. (2016). A perspective on 16S rRNA operational taxonomic unit clustering using sequence similarity. NPJ Biofilms Microbio. 2, 1–8. doi: 10.1038/npjbiofilms.2016.4
Oksanen J., Blanchet F., Guillaume Friendly M., Kindt R., Legendre P., McGlinn D., et al. (2019). Package “vegan” Title Community Ecology Package Version 2.5-6. R Package version 2-5. Available at: https://github.com/vegandevs/vegan/.
Palarea-Albaladejo J., Martín-Fernández J. A. (2015). zCompositions — R package for multivariate imputation of left-censored data under a compositional approach. Chemomet. Intel. Lab. Syst. 143, 85–96. doi: 10.1016/j.chemolab.2015.02.019
Pawlowsky-Glahn V., Egozcue J. J. (2006). Compositional data and their analysis: an introduction. Geol. Soc. London Special Public. 264, 1–10. doi: 10.1144/GSL.SP.2006.264.01.01
Porazinska D. L., Giblin-Davis R. M., Faller L., Farmerie W., Kanzaki N., Morris K., et al. (2009). Evaluating high-throughput sequencing as a method for metagenomic analysis of nematode diversity. Mol. Ecol. Resour. 9, 1439–1450. doi: 10.1111/j.1755-0998.2009.02611.x
Quast C., Pruesse E., Yilmaz P., Gerken J., Schweer T., Yarza P., et al. (2013). The SILVA ribosomal RNA gene database project: Improved data processing and web-based tools. Nucleic Acids Res. 41, D590–D596. doi: 10.1093/nar/gks1219
Quinn T. P., Erb I., Gloor G., Notredame C., Richardson M. F., Crowley T. M. (2019). A field guide for the compositional analysis of any-omics data. GigaScience 8, giz107. doi: 10.1093/gigascience/giz107
R Core Team. (2014). R: A language and environment for statistical computing. (Vienna, Austria: R Foundation for Statistical Computing).
R Core Team. (2020). R: A language and environment for statistical computing. (R Foundation for Statistical Computing). Available at: https://www.R-project.org/.
Rognes T., Flouri T., Nichols B., Quince C., Mahé F. (2016). VSEARCH: A versatile open source tool for metagenomics. PeerJ 4, e2584. doi: 10.7717/peerj.2584
Sapkota R., Nicolaisen M. (2015). High-throughput sequencing of nematode communities from total soil DNA extractions. BMC Ecol. 15, 1–8. doi: 10.1186/s12898-014-0034-4
Schenk J., Geisen S., Kleinbölting N., Traunspurger W. (2019). Metabarcoding data allow for reliable biomass estimates in the most abundant animals on earth. Metabarcoding Metagenom. 3, e46704. doi: 10.3897/mbmg.3.46704
Schuelke T., Pereira T. J., Hardy S. M., Bik H. M. (2018). Nematode-associated microbial taxa do not correlate with host phylogeny, geographic region or feeding morphology in marine sediment habitats. Mol. Ecol. 27, 1930–1951. doi: 10.1111/mec.14539
Stackebrandt E., Goebel B. M. (1994). Taxonomic note: a place for DNA-DNA reassociation and 16S rRNA sequence analysis in the present species definition in bacteriology. Int. J. Syst. Evol. Microbiol. 44 (4), 846–849.
Sikder M., Vestergård M., Sapkota R., Kyndt T., Nicolaisen M. (2020). Evaluation of metabarcoding primers for analysis of soil nematode communities. Diversity 12, 388. doi: 10.3390/d12100388
Swift D., Cresswell K., Johnson R., Stilianoudakis S., Wei X. (2023). A review of normalization and differential abundance methods for microbiome counts data. Wiley Interdiscip. Reviews: Comput. Stat 15, e1586. doi: 10.1002/wics.1586
Tamura K., Stecher G., Peterson D., Filipski A., Kumar S. (2013). MEGA6: molecular evolutionary genetics analysis version 6.0. Mol. Biol. Evol. 30, 2725–2729. doi: 10.1093/molbev/mst197
Team, R. (2016). RStudio: integrated development environment for R. 2016. (250 northern avenue, suite 420, Boston, the U.S.: Posit).
Tikhonov M., Leach R. W., Wingreen N. S. (2015). Interpreting 16S metagenomic data without clustering to achieve sub-OTU resolution. ISME J. 9, 68–80. doi: 10.1038/ismej.2014.117
Van den Boogaart K. G., Tolosana R., Bren M. (2014). compositions: Compositional Data Analysis. R package version 1.40-1 (Vienna: R Found. Stat. Comput).
Weiss S., Xu Z., Amir A., Peddada S., Bittinger K., Gonzalez A., et al. (2015). Effects of library size variance, sparsity, and compositionality on the analysis of microbiome data. PeerJ Preprints 3, e1408. doi: 10.7287/peerj.preprints.1157v1
Weiss S., Xu Z. Z., Peddada S., Amir A., Bittinger K., Gonzalez A., et al. (2017). Normalization and microbial differential abundance strategies depend upon data characteristics. Microbiome 5, 1–18. doi: 10.1186/s40168-017-0237-y
Wickham H., Francois R., Henry L., Müller K. (2017) Dplyr: A Grammar of Data Manipulation. Available online at: https://cran.r-project.org/package=dplyr.
Wilschut R. A., Geisen S., Martens H., Kostenko O., de Hollander M., Ten Hooven F. C., et al. (2019). Latitudinal variation in soil nematode communities under climate warming-related range-expanding and native plants. Global Change Biol. 25, 2714–2726. doi: 10.1111/gcb.14657
Wilson M. J., Khakouli-Duarte T. (2009). Nematodes as environmental indicators (Global: CABI). doi: 10.1079/9781845933852.0000
Wong R. G., Wu J. R., Gloor G. B. (2016). Expanding the unifrac toolbox. PloS One 11, e0161196. doi: 10.1371/journal.pone.0161196
Xie Y. (2014). knitr: a comprehensive tool for reproducible research in R. Implement Reprod. Res. 1, 20. doi: 10.1201/9781315373461
Keywords: 18S rRNA gene, reference database, amplicon sequence variant (ASV), operational taxonomic unit (OTU), data normalization method
Citation: Wang S, Schneider D, Hartke TR, Ballauff J, de Melo Moura CC, Schulz G, Li Z, Polle A, Daniel R, Gailing O, Irawan B, Scheu S and Krashevska V (2024) Optimising high-throughput sequencing data analysis, from gene database selection to the analysis of compositional data: a case study on tropical soil nematodes. Front. Ecol. Evol. 12:1168288. doi: 10.3389/fevo.2024.1168288
Received: 17 February 2023; Accepted: 16 February 2024;
Published: 04 March 2024.
Edited by:
Bertrand Fournier, University of Potsdam, GermanyReviewed by:
Enrique Lara, Spanish National Research Council (CSIC), SpainCopyright © 2024 Wang, Schneider, Hartke, Ballauff, de Melo Moura, Schulz, Li, Polle, Daniel, Gailing, Irawan, Scheu and Krashevska. This is an open-access article distributed under the terms of the Creative Commons Attribution License (CC BY). The use, distribution or reproduction in other forums is permitted, provided the original author(s) and the copyright owner(s) are credited and that the original publication in this journal is cited, in accordance with accepted academic practice. No use, distribution or reproduction is permitted which does not comply with these terms.
*Correspondence: Simin Wang, c2ltaW4ud2FuZ0BiaW9sb2dpZS51bmktZ29ldHRpbmdlbi5kZQ==
Disclaimer: All claims expressed in this article are solely those of the authors and do not necessarily represent those of their affiliated organizations, or those of the publisher, the editors and the reviewers. Any product that may be evaluated in this article or claim that may be made by its manufacturer is not guaranteed or endorsed by the publisher.
Research integrity at Frontiers
Learn more about the work of our research integrity team to safeguard the quality of each article we publish.