- 1Institute of Mountain Hazards and Environment, Chinese Academy of Sciences, Chengdu, China
- 2Chongqing Jiaotong University, Chongqing, China
- 3Technology Innovation Center for Southwest Land Space Ecological Restoration and Comprehensive Renovation, Ministry of Natural Resources, Chengdu, China
- 4Shandong Jianzhu University, Jinan, China
- 5Chengdu Land Consolidation and Ecological Rehabilitation Center, Chengdu, China
Three-River-Source (TRS) National Park stands as one of China’s earliest established national parks, dedicated to significant ecological responsibilities that include conserving soil and water resources in the Tibetan Plateau region. Research on climate change’s influence on the TRS region’s grasslands is of great significance in our efforts to comprehend and conserve the grassland ecosystem. The most effective random forest (RF) model was chosen to invert the aboveground biomass (AGB) of grassland in the previous 6 years (2015−2020) and predict the grassland AGB in the following 20 years (2021−2040) by comparing linear regression and multivariate nonlinear regression models such as RF, support vector machine, decision tree, and artificial neural network. A Theil–Sen median trend analysis and a Mann–Kendal test were then used to examine the trends of grassland AGB. The results showed that (1) RF outperformed other models in estimating grassland AGB, with a test set decision coefficient of multiple determination (R2) of 0.722, a root mean square error of 42.596 g/m2, and a mean absolute error of 35.619 g/m2; (2) over 6 years, the grassland AGB in TRS National Park had a spatial trend of a steady rise from the northwest to the southeast. The average annual grassland AGB was 247.333 g/m2, with averages of 44.836 g/m2, 92.601 g/m2, and 120.217 g/m2 in the Yangtze River, Yellow River, and Lancang River source parks respectively. The trend of the grassland AGB was primarily stabilized and slightly recovered, with a small portion of the slightly deteriorated areas; (3) climate change significantly affected grassland AGB, and when temperature and precipitation conditions were adequate, grassland AGB values increased with temperature and precipitation. In the scenarios of ssp119, ssp245, and ssp585, grassland AGB is projected to exhibit a dynamic upward trend over the next 20 years. Global warming is expected to boost grassland AGB. Comprehensive measures are essential to maintain grassland health and ensure a positive impact on global carbon and ecological balance. The study’s findings hold great importance for the ecological security of the TRS region and contribute to our global understanding of sustainable grassland development.
1 Introduction
Grassland ecosystems, recognized as the most important ecosystem types globally, encompass over 40% of the Earth’s land area. They have a vital role in the global carbon cycle, climate regulation, and carbon storage (Chapin et al., 2013). As the largest nature reserve in China and a critical grassland ecological function area, Three-River-Source (TRS) National Park is essential to maintaining water conservation and ecological security on the Tibetan Plateau and inland Asia (Yu et al., 2020b; Jiang F. et al., 2022). However, TRS National Park is located in the hinterland of the Qinghai–Tibetan Plateau, where the high altitude and harsh natural conditions make the region’s ecological environment very fragile (Ma et al., 2022). Furthermore, the TRS region is confronting a pressing ecological challenge—grassland degradation. This predicament has arisen due to global warming, escalating environmental deterioration, and overgrazing (Li C. et al., 2019; Shu et al., 2022). Therefore, assessing the status and trends of the grassland biomass in TRS National Park and monitoring and analyzing critical parameters of grassland ecosystems can provide a scientific basis for the sustainable use of grassland resources and ecological restoration in the region (Yu et al., 2020a).
Grassland aboveground biomass (AGB) is an important indicator reflecting grassland ecosystems’ productivities and carbon cycles. It is also a critical factor in assessing the degree of grassland degradation and the effect of restoration (Jia et al., 2016; Zhou et al., 2023). Due to the vast scope, complex terrain, and inconvenient transportation of TRS National Park, it is difficult and costly to obtain grassland AGB data with the use of traditional field survey methods, and the spatial and temporal coverage is low (Zhang F. et al., 2022). Despite significant progress in the estimation of grassland AGB, several challenges persist. The unique environmental conditions, extreme weather variations, and specific vegetation types found in high-altitude and high-latitude regions pose distinct challenges for accurate AGB estimation (Gao et al., 2020). Remote sensing technology can provide high spatial- and temporal-resolution remote sensing image data, and by establishing a quantitative relation model between remote sensing images and grassland AGB, rapid, accurate, and large-scale inversion and prediction of grassland AGB can be achieved (Jiang L. et al., 2022; Liu et al., 2022). Fan et al. (2022) used Sentinel-2 images to estimate the grassland AGB of the Qinghai–Tibetan Plateau, and Chapungu et al. (2020) assessed grassland biomass in northeastern Zimbabwe by hyperspectral remote sensing data using the relation between vegetation indices and grassland organisms. In addition to remote sensing imagery, uncrewed aerial vehicle (UAV) imagery is often a favored tool for analyzing grassland AGB (Alvarez-Mendoza et al., 2022). Zhang H. et al. (2022) used UAV technology to obtain large-area grassland AGB with an R2 of 0.78, which is good evaluation accuracy. New technologies like the 3D-laser point cloud technology are essential in estimating grassland biomass (Wijesingha et al., 2019). In future scenarios, sky–ground integration for estimating grassland AGB will help to understand the changing characteristics of grassland ecosystems and achieve the scientific use of grassland resources and sustainable development (Yu et al., 2021a).
To establish inversion models, most studies use empirical statistical models, such as linear and nonlinear regression. Although those models can describe the mathematical relation between grassland AGB and remote sensing indices, they lack the explanatory value of physical mechanisms. They are also limited by the number of sample data, making it difficult to achieve a generalized application across regions and time (Zhang Y. et al., 2022). In recent years, machine learning models have provided new methods for the inversion of grassland AGB (Morais et al., 2021). Ge et al. (2022) constructed grassland AGB data from 2000 to 2019 in North China by comparing 4 machine learning algorithms and selecting the optimal random forest (RF) model. Liu et al. (2023) also constructed a model of grassland biomass in the western part of Southwest China with the use of RF and analyzed the relation between its response to climatic factors. Although machine learning algorithms are widely used in various fields for their advantages and accuracy, they differ markedly in sample requirements, parameter adjustment, and computational efficiency (Wang Y. et al., 2022; Ma et al., 2023). Also, overfitting during the machine learning fitting process remains a critical problem that continues to be addressed (Yu et al., 2021b). Therefore, it is essential to compare and evaluate the accuracy, performance, and applicability of various machine learning algorithms and emerging algorithms in remote sensing inversion to promote the application of machine learning in this field.
For grassland AGB inversion in TRS National Park, the current method still has some problems in data selection, modeling, and result validation (Xu et al., 2021). More in-depth studies are urgently required to improve the accuracy and reliability of grassland AGB inversion. Also, because TRS National Park is located in an area sensitive to global warming, the past and future spatial and temporal distribution and changes of its grassland AGB are significantly affected by climatic factors (Xu et al., 2022; Zhang L. et al., 2022). Therefore, exploring how the AGB in TRS National Park will respond to future climate change is important for determining the health and sustainability of grassland ecosystems. This study aimed to (1) assess the suitability and limitations of various regression models for estimating grassland AGB in TRS National Park through remote sensing and determine the best inversion models, (2) analyze the spatial and temporal distribution patterns of AGB and its trends in the park and offer a reference for addressing degradation in specific regions, and (3) explore the impacts of climate change on the AGB in TRS National Park to better understand the ecological influences on grasslands and to provide strategic information on grassland management in the TRS region.
2 Data and research methods
2.1 Study area
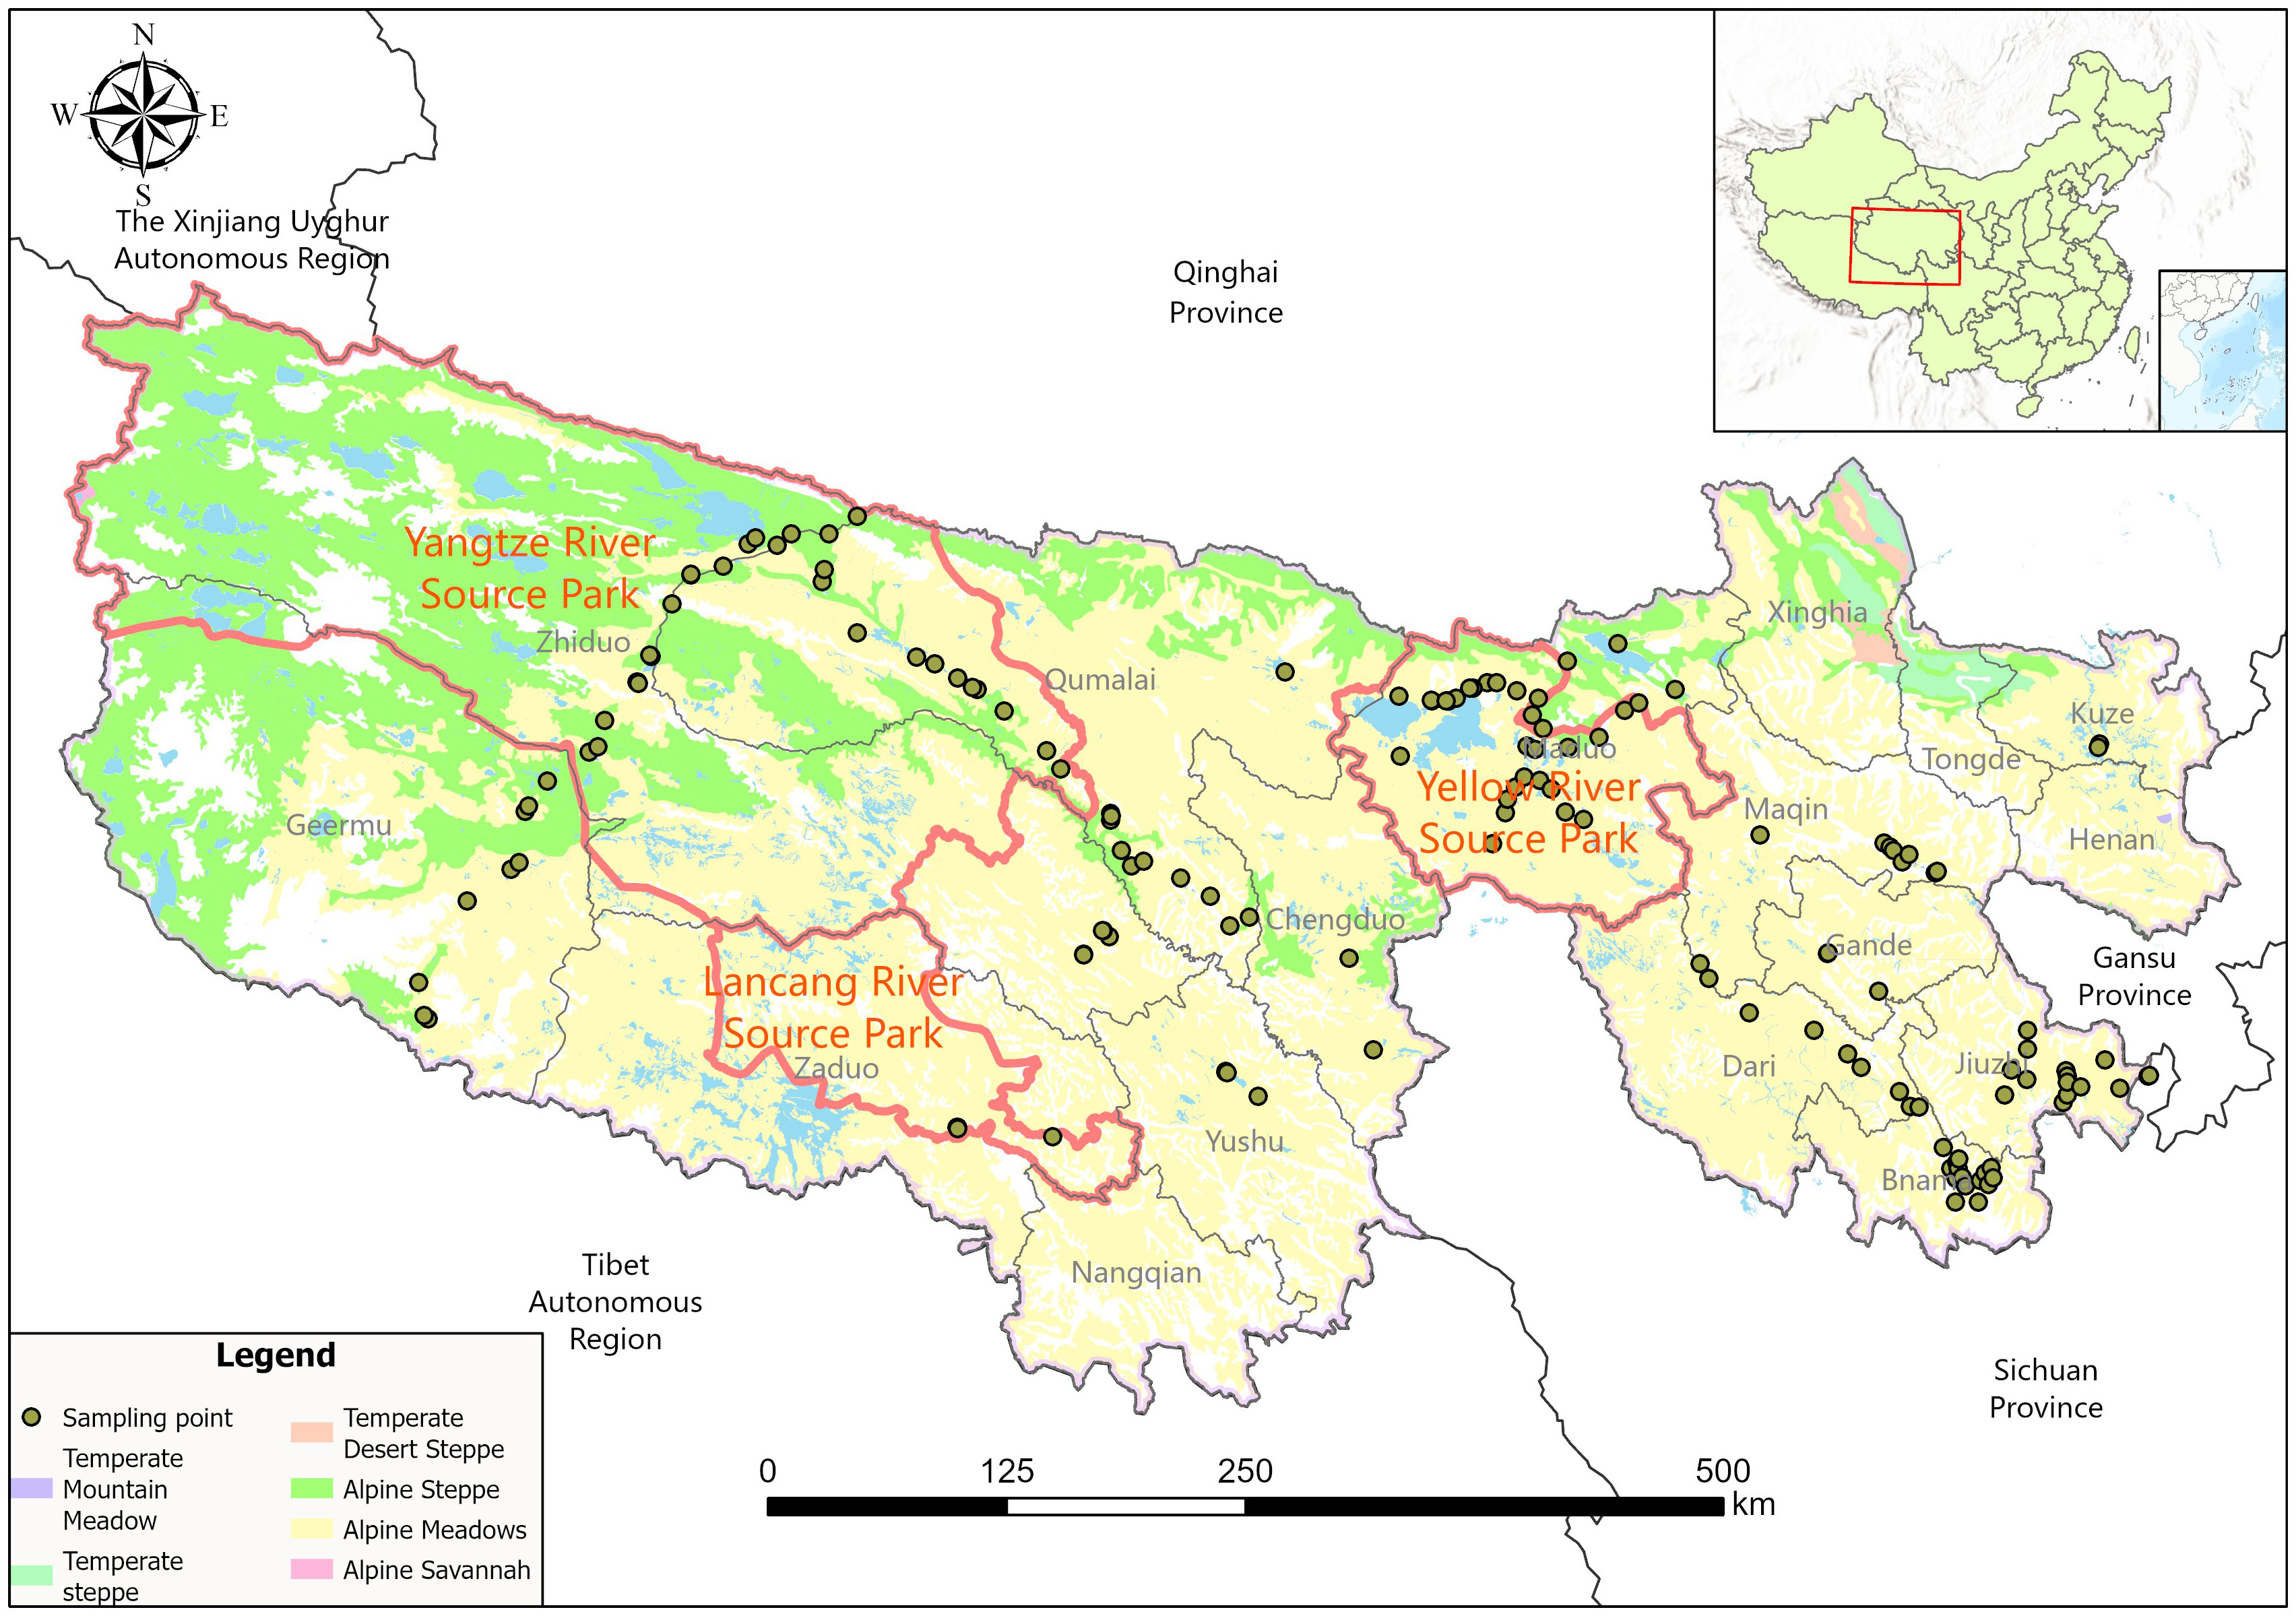
The TRS National Park encompasses the headwaters of 3 major rivers in southern Qinghai Province and is accordingly divided into 3 zones: the sources of the Yangtze Yellow, and Lancang rivers (Figure 1). The park covers an expansive area of 123,100 km2, extending from approximately long 89°50’57”E to long 99°14’57”E and from lat 32°22’36”N to lat 36°47’53”N. This area constitutes 31.16% of the entire TRS region. It spans 4 counties: Zhiduo, Maduo, Qumalai, and Zaoduo, and encompasses the Cococli Nature Reserve (Zhang et al., 2019). The park is in the heart of the Qinghai–Tibetan Plateau, with an average altitude exceeding 4,500 m. The climate is characterized by extreme cold and aridity, featuring an average annual temperature of 1.9°C and an average annual precipitation of 498.5 mm (Zheng et al., 2020). The park has various grassland ecosystems, including alpine meadows, alpine steppes, alpine swamps, and alpine scrub meadows. Among those, the alpine steppes and meadows are the most pivotal ecosystems, significantly contributing to water conservation and biodiversity preservation.
2.2 Data collection
2.2.1 Sampling data
In this study, ground sample data from grasslands were collected primarily during the peak months of July and August between 2018 and 2020. The sample area for grass collection was standardized to 1 m by 1 m, with a minimum separation distance of more than 20 m between each sampling square. The key recorded information included ground cover, species names, vegetation height, biomass measurements, and latitude and longitude coordinates of each sample square. All grass samples were carefully harvested during sampling, subsequently dried at 85°C within a laboratory setting, and weighed. The AGBs of the sample squares were determined by averaging the data obtained from 3 sample squares. One hundred sixty sampling points were established, concentrated primarily within the TRS area.
2.2.2 Remote sensing data
Remote sensing data were acquired using MOD13Q1/Global 250 m resolution with 16 d composite data, accessible at https://search.earthdata.nasa.gov/search. That dataset included 2 images, h25v05 and h26v05, covering the designated study area. MODIS Reprojection Tool software was used for data processing tasks such as format conversion, projection adjustment, and image mosaicking. Subsequently, relevant vegetation indices were extracted from the data with the use of ENVI software.
2.2.3 Climate and other data
Climate data for 2015 to 2020 were sourced from the National Science and Technology Basic Conditions Platform-National Earth System Science Data Center (http://www.geodata.cn). Those data primarily included monthly average temperature and precipitation data. Future climate data from 2021 to 2040 were obtained from CMIP6 (cmip6–Home | ESGF-CoG [llnl.gov]), comprising monthly average temperature and precipitation data. That dataset featured data from EC-Earth3, encompassing 3 future climate scenarios: ssp119, ssp245, and ssp585. Those scenarios correspond to various socio-economic development pathways and greenhouse gas emission levels. The numerical suffix in the ssp scenarios indicates the projected radiative forcing level for the year 2100, with higher radiative forcing values indicating more substantial global warming (Hurtt et al., 2020). Specifically, ssp119 represents a low-emission and low-forcing scenario aimed at limiting global warming to approximately 1.5°C above pre-industrial temperatures, ultimately stabilizing at approximately 1.4°C by the end of the century. ssp245 signifies a medium-emission and medium-forcing scenario, where temperatures are projected to rise by 2.7°C by the end of the century. ssp585 denotes a high-emission and high-forcing scenario, anticipating global average temperatures to increase by 4.4°C by 2100 (Popp et al., 2017). The climate data used in the text were average monthly temperatures and precipitation for August. Three-River-Source grassland-type data were acquired from the National Tibetan Plateau Data Center (https://data.tpdc.ac.cn/zh-hans/). Digital elevation model (DEM) data were derived from the Geospatial Data Cloud (http://www.gscloud.cn/) SRTMTPI 90 m resolution data product, and the slope data were generated from the DEM data.
2.3 Modeling and data analysis
2.3.1 Inversion model construction and accuracy assessment
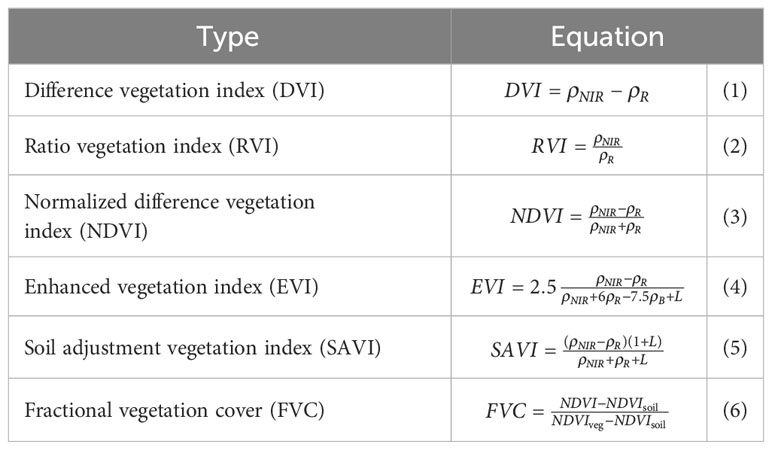
(1) Vegetation index: This study used IBM’s SPSS Statistics software to establish correlations between the extracted vegetation indices and the collected sample grassland biological data (Table 1). The primary objective was to assess the potential of the selected vegetation indices and actual grassland AGB as influential factors in estimating overall biomass within the study area (Li M. et al., 2019). This validation process facilitated determining the correlation strength between these factors, laying the groundwork for constructing the inversion model and identifying the most strongly correlated vegetation index for the model’s development.
Where:
is the reflectance in the near-infrared band.
is the reflectance in the red band.
is the reflectance in the blue band.
is the soil conditioning coefficient, which assumes a value of 1 in the and 0.5 in the (Ren et al., 2018). is the value of an area that is completely bare soil or has no vegetation cover, while is the value of an image element that is completely covered by vegetation.
(2) Model construction: This study used various modeling approaches for remote sensing inversion, including traditional simple linear regression, multivariate linear models, and machine learning models such as RF, decision tree (DT), support vector machine (SVM), and artificial neural network (ANN).
In the simple linear regression, the normalized difference vegetation index (NDVI), the vegetation index with the highest correlation, was selected as the independent variable, and measured grassland AGB in grams per square meter (g/m2) as the dependent variable . The model is represented as
where and are the model parameters representing the slope and intercept respectively.
A multiple linear regression model used several independent variables to describe the linear relation between those variables and the dependent variable. Let the dependent variable be denoted as and the respective independent variables as , , , and so forth up to . The linear relation between the dependent and independent variables can be represented as
where is the dependent variable; , , and are the independent variables; , , , and are the regression coefficients; and is the error coefficient. This error coefficient accounts for the difference between the actual true value and the predicted value.
Machine learning methods contain mainly RFs, decision trees, SVMs, and ANNs.
An RF is an algorithm that combines the strengths of multiple decision trees. Each tree is independently trained on randomly selected data subsamples, reducing the risk of overfitting (Zeng et al., 2019). Moreover, RFs are known for their high predictive accuracy and exceptional performance in handling complex data and high-dimensional features.
Decision trees divide the input space into regions, each corresponding to an output value. Predictions of the output variable are made based on the value of the input variable (Zhang J. et al., 2022).
Support vector machines map the input data to a high-dimensional feature space with the use of nonlinear mapping. They then construct an optimal hyperplane in the feature space to minimize the distance from all data points to the hyperplane for predicting the output variable (Amarsaikhan et al., 2023).
Artificial neural networks are composed of interconnected neurons, with layers for input, hidden, and output nodes. The network architecture, including the number of nodes in each layer and their connections, is defined. Those networks are trained using optimization algorithms to handle linear and nonlinear regression problems (Yang et al., 2018).
(3) Accuracy assessment: During the model construction process, 80% of the samples were designated as the training set, and 20% the test set. Our goal was to ensure that the inversion model accurately reflected the conditions within the study area. To evaluate model accuracy, several metrics were used, including the root mean square error (RMSE), R2, and mean absolute error (MAE) between the actual grassland AGB and the simulated grassland AGB. Those metrics were crucial for assessing the model’s performance. In accuracy evaluation, the R2 value ranged from 0 to 1, where the closer the value 1, the higher the accuracy of the constructed inversion model. Additionally, the RMSE and the MAE measured the deviation between actual and simulated grassland AGB values. Smaller values for the RMSE and MAE signified a smaller difference between the actual and simulated values, thereby indicating higher accuracy in the constructed inversion model (Zhang et al., 2023).
The accuracy of the validation inversion model was determined using the following equations:
where is the actual grassland AGB of the sample, is the corresponding calculated simulated grassland AGB, is the mean of the simulated grassland AGB across all samples, and is the total number of samples.
2.3.2 The Theil–Sen median slope estimation and Mann–Kendall nonparametric test
The Theil–Sen median slope estimation and Mann–Kendall nonparametric test are combined methods for analyzing time-series data trends (Wu N. et al., 2023).
The Theil–Sen median slope estimation is a robust nonparametric statistical approach used to calculate the average rate of change, or slope, in time-series data. This method determines the direction and magnitude of trends within a time series.
A calculated value of greater than 0 signifies an upward trend in the time series, whereas a value of less than 0 indicates a downward trend in the time series. If equals 0, it suggests a stable or flat trend within the time series.
The Mann–Kendall nonparametric test is a method used to assess the presence of marked trend changes in time-series data. What sets this test apart is that it does not assume that the data follow a specific distribution, making it versatile for various applications. Furthermore, it is robust at handling missing values and outliers and is particularly well suited for conducting trend-significance testing on lengthy time-series data.
where
where and are the AGB values in years and respectively, while is the total number of data points in the time series. The function refers to the mathematical signum function. The statistic is a measure that can take a range of values from negative infinity to positive infinity. At a given significance level , when it indicates a significant change in the time series at the level. Typically, is set to 0.05, leading to a value of approximately ±1.96. In this study, the significance of trend changes in the AGB time series was determined with a confidence level of 0.05 (Table 2).
3 Results
3.1 Correlation between vegetation index and grassland aboveground biomass
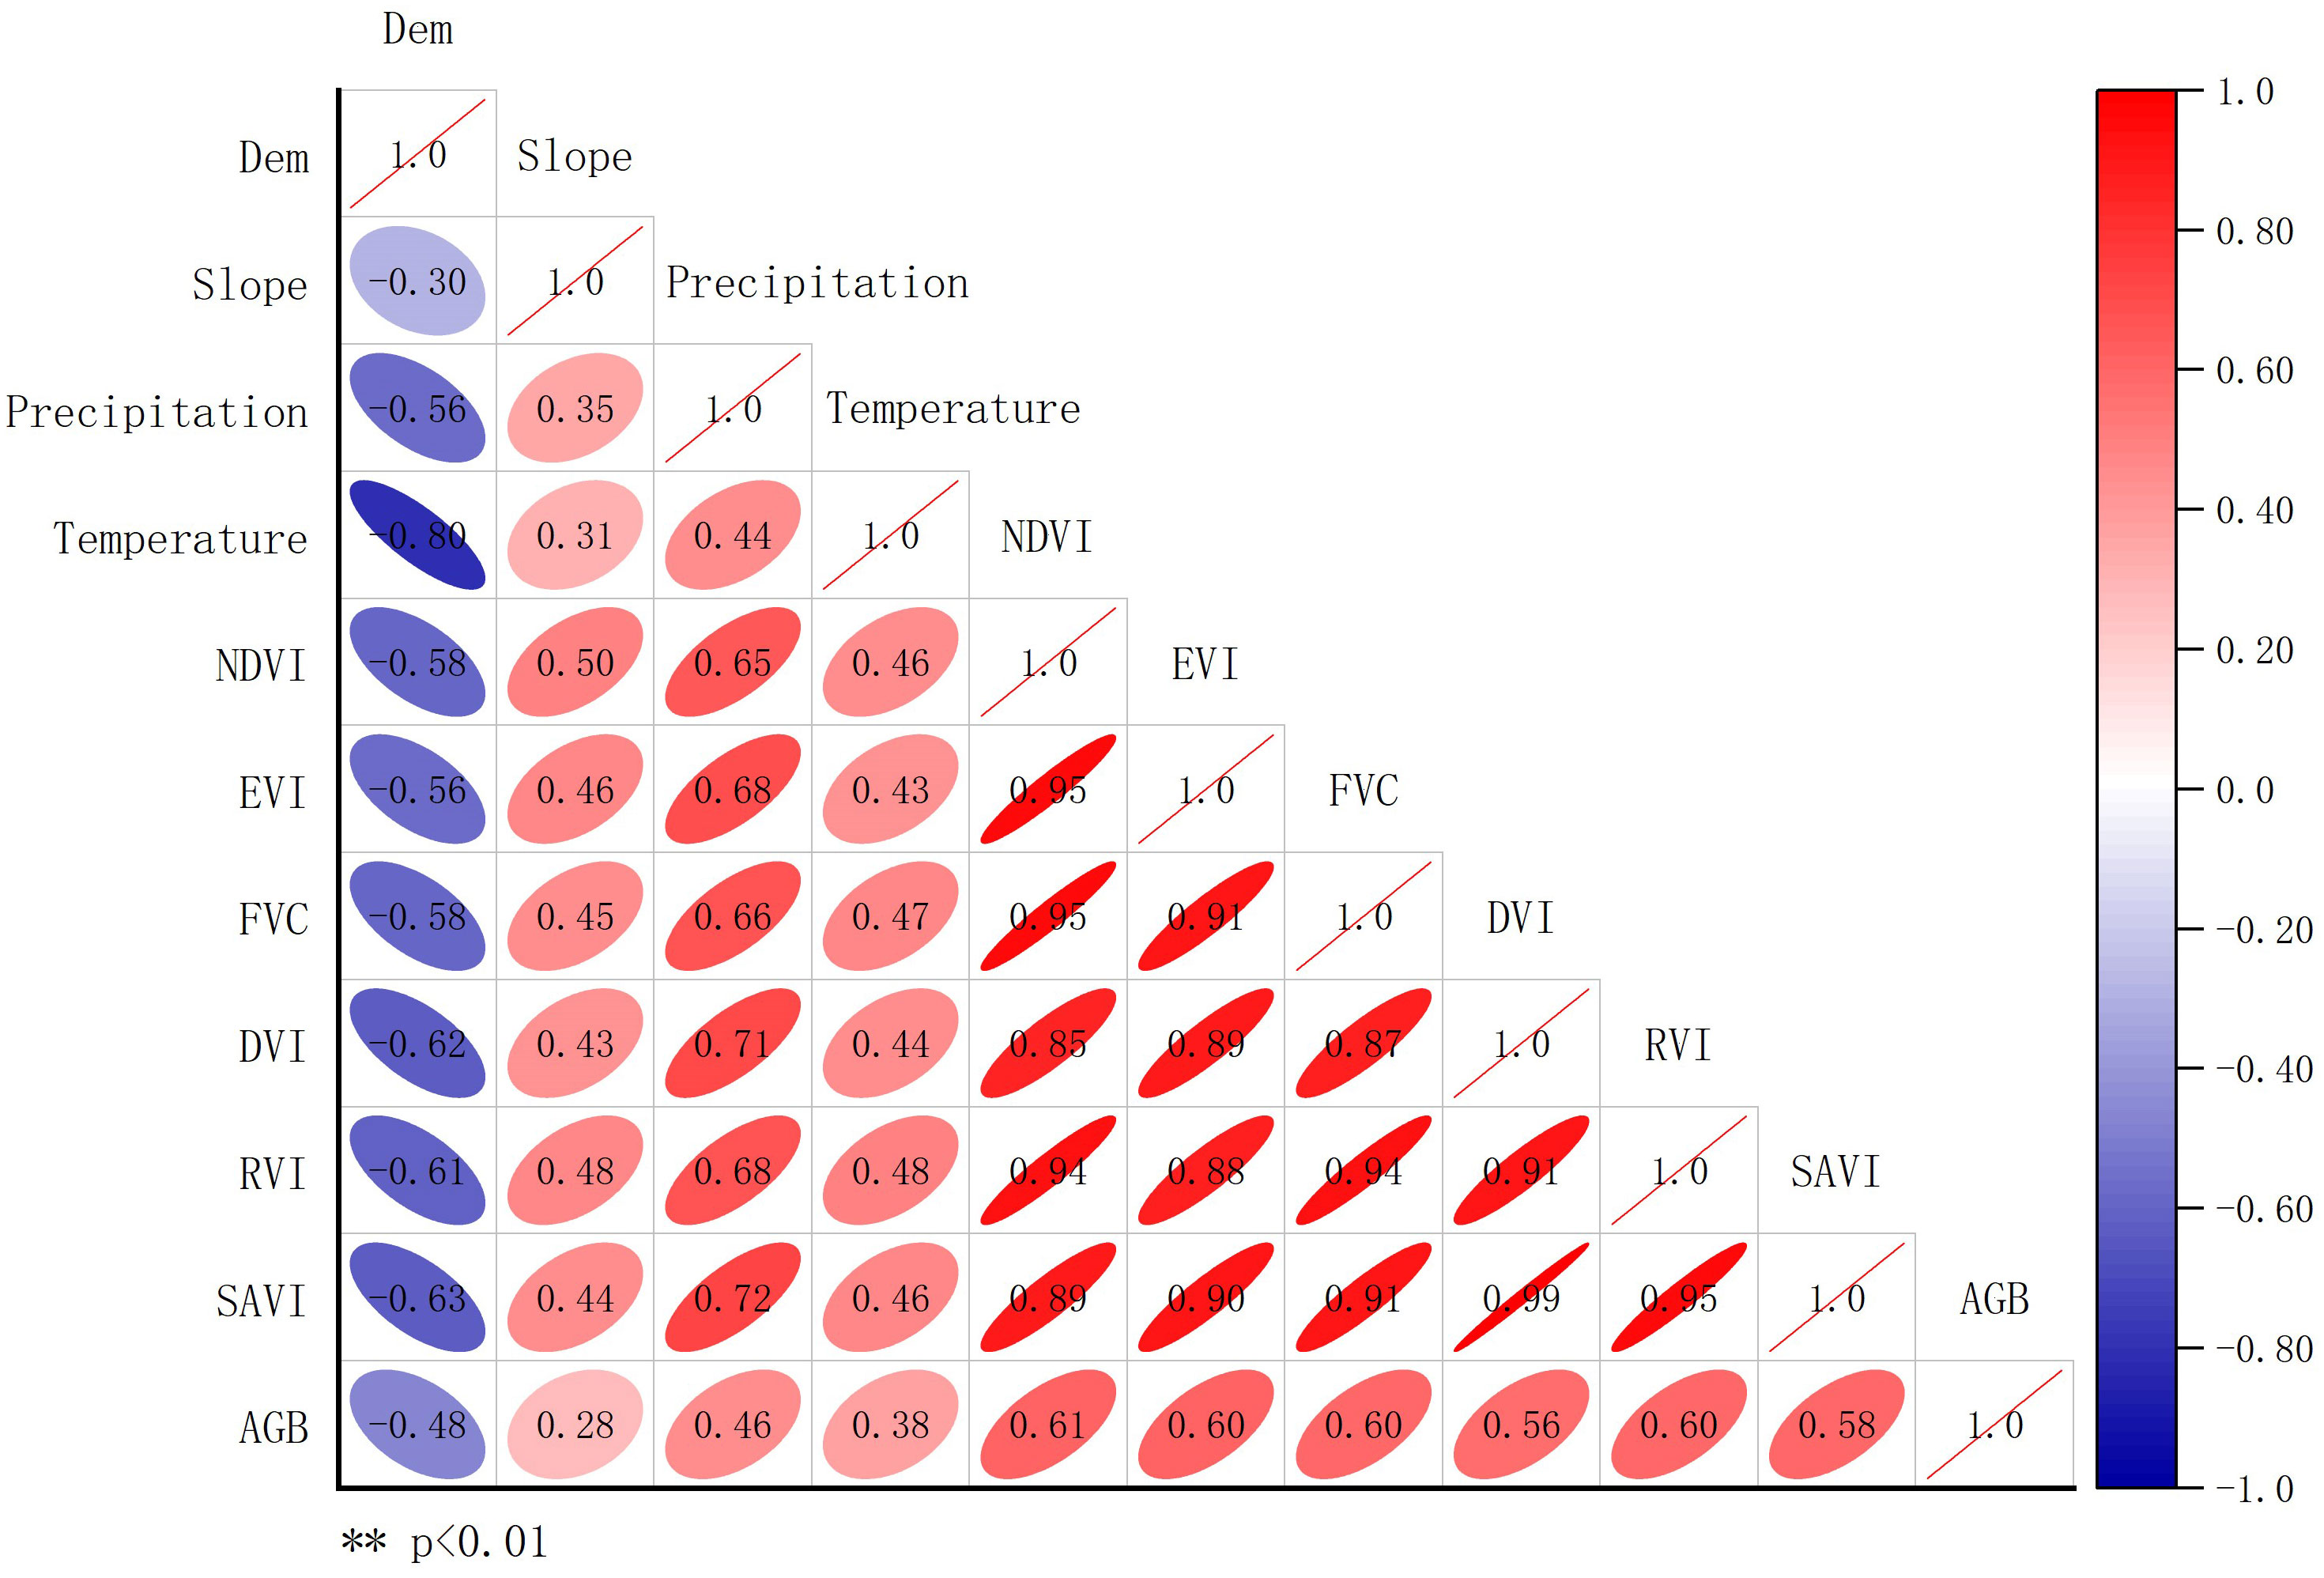
Among the vegetation indices, the highest correlation coefficient was observed between grassland AGB and the NDVI, which stood at 0.61. Following closely, the correlation coefficients for the enhanced vegetation index, the ratio vegetation index, and the fractional vegetation cover were 0.60, indicating a high degree of similarity among these 3 vegetation indices, and their correlation coefficients ranked second only to that of the NDVI. The soil adjustment vegetation index and the difference vegetation index had slightly lower correlation coefficients, with values of 0.58 and 0.56 respectively. All vegetation indices had a positive correlation with AGB. The higher the vegetation index, the higher the AGB value. This suggests that vegetation indices effectively characterize grassland AGB. In the realm of climatic factors, the correlation coefficients between grassland AGB and monthly average air temperature and precipitation were 0.38 and 0.46 respectively. Notably, precipitation influenced grassland AGB significantly more than air temperature did. Within certain bounds, precipitation and air temperature increases lead to higher grassland AGB values. Geographic factors also affect grassland AGB. The correlation coefficient between AGB and the DEM was −0.48, indicating that grassland AGB decreases with rising altitude. Because the study area was in a plateau region, there was also a positive correlation between grassland AGB and slope, albeit with a relatively small correlation coefficient of 0.28 (Figure 2).
3.2 Model accuracy
Six distinct models were used to analyze and predict grassland AGB within the TRS National Park area (Table 3). In the simple linear regression, the independent variable chosen was solely the vegetation index NDVI, because it showed the highest correlation coefficient with AGB. For the multivariate linear model and the machine learning model, 5 influential factors were integrated: NDVI, average monthly precipitation, average monthly temperature, elevation, and slope, because those factors collectively contributed to the construction of the regression model.
In the training set constructed by the 6 grassland AGB models, the DT model yielded the highest R2 at 0.893. Furthermore, it showed the lowest RMSE and MAE at 29.382 g/m2 and 20.500 g/m2 respectively. Notably, the RF model closely followed with an R2 of 0.876 and relatively low RMSE and MAE values. On the other hand, simple linear regression achieved the lowest R2 at 0.560 in the training set, resulting in higher RMSE and MAE compared to the other models. In the test set, the RF model had the highest R2 at 0.722, along with corresponding RMSE and MAE values of 42.596 g/m2 and 35.619 g/m2 respectively. The multivariate linear model achieved the second-highest R2 in the test set at 0.690, demonstrating its effectiveness. In general, all 4 machine learning models attained R2 values exceeding 0.63 in the test set, indicating a strong fit. In contrast, simple linear regression had the lowest R2 in the test set at 0.624, resulting in comparatively higher RMSEs and MAEs. Due to its limitation of relying on only one factor to predict grassland AGB, that model had a poorer fit. Overall, the RF approach demonstrated advantages in predicting grassland AGB in both the training and test sets.
Through the comparison of 6 different models and their actual versus predicted values, the RF approach stood out for its superior performance (Figure 3). As shown in Figure 3D, the predictions obtained through the RF model closely aligned with the actual values. The fitting line in those figures closely approximates a 1:1 relation, with only a few predictions deviating markedly from the observed AGB. Multivariate linear regression, DT regression, and ANN models also demonstrated relatively minor differences between their predicted values and actual values. However, the SVM model was more accurate when AGB values were below 150 g/m2. Conversely, when the AGB value was relatively high, the gap between the actual and predicted values of the SVM became more pronounced. Simple linear regression showed the lowest correlation with measured AGB values, with a more dispersed distribution of sample points, indicating the least effective modeling.
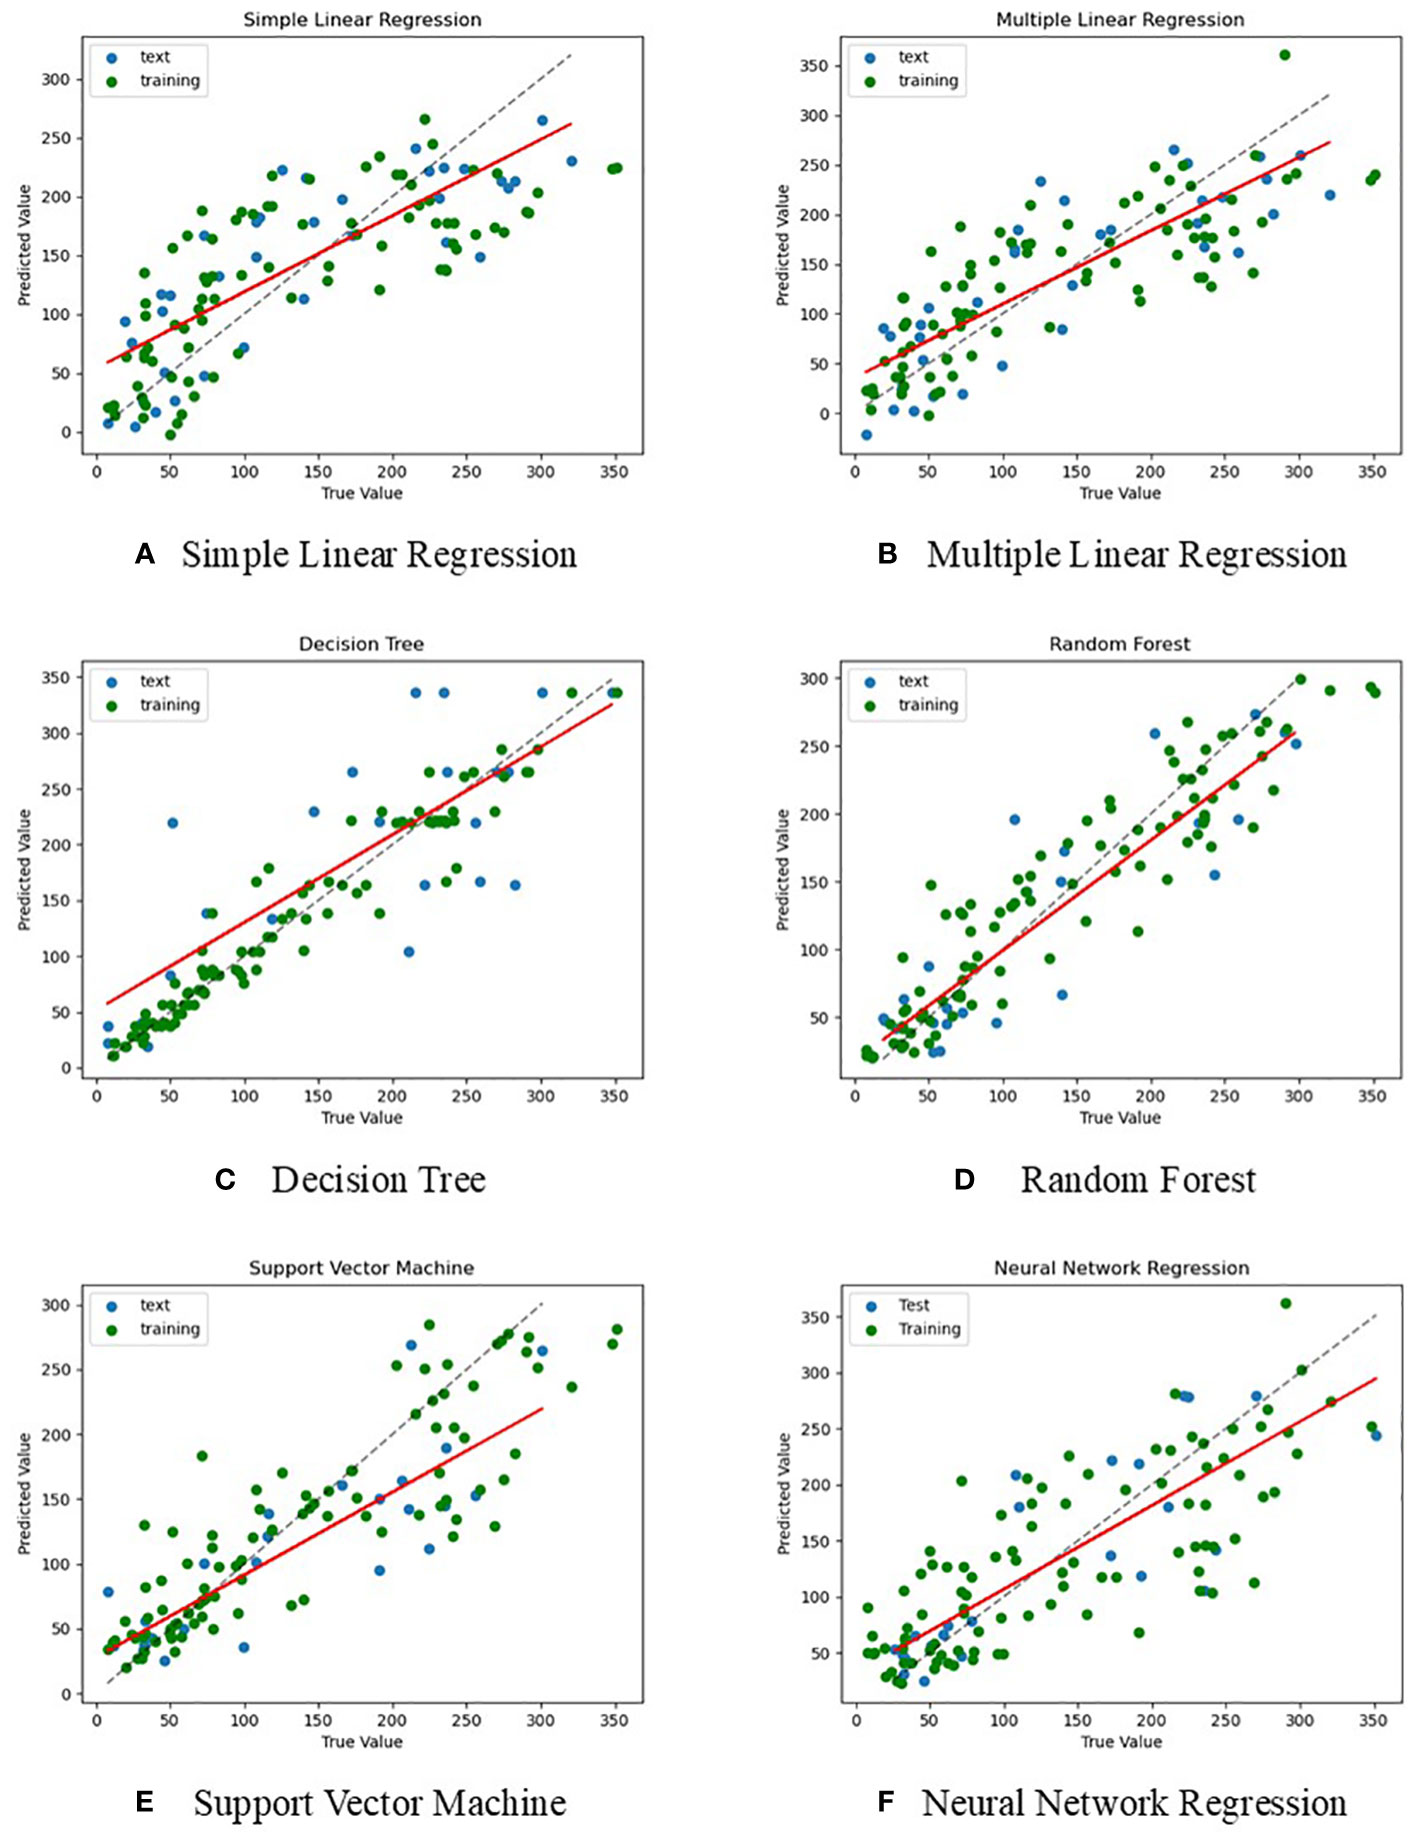
Figure 3 Comparison of the actual value of each model with the predicted value (unit: g/m2). (A) Simple Linear Regression, (B) Multiple Linear Regression, (C) Decision Tree, (D) Random Forest, (E) Support Vector Machine, (F) Neural Network Regression.
Building upon the preceding context, RF was used to estimate the grassland biomass within TRS National Park.
3.3 Temporal dynamic and spatial pattern of grassland aboveground biomass distribution in each park
3.3.1 Temporal dynamic of grassland aboveground biomass
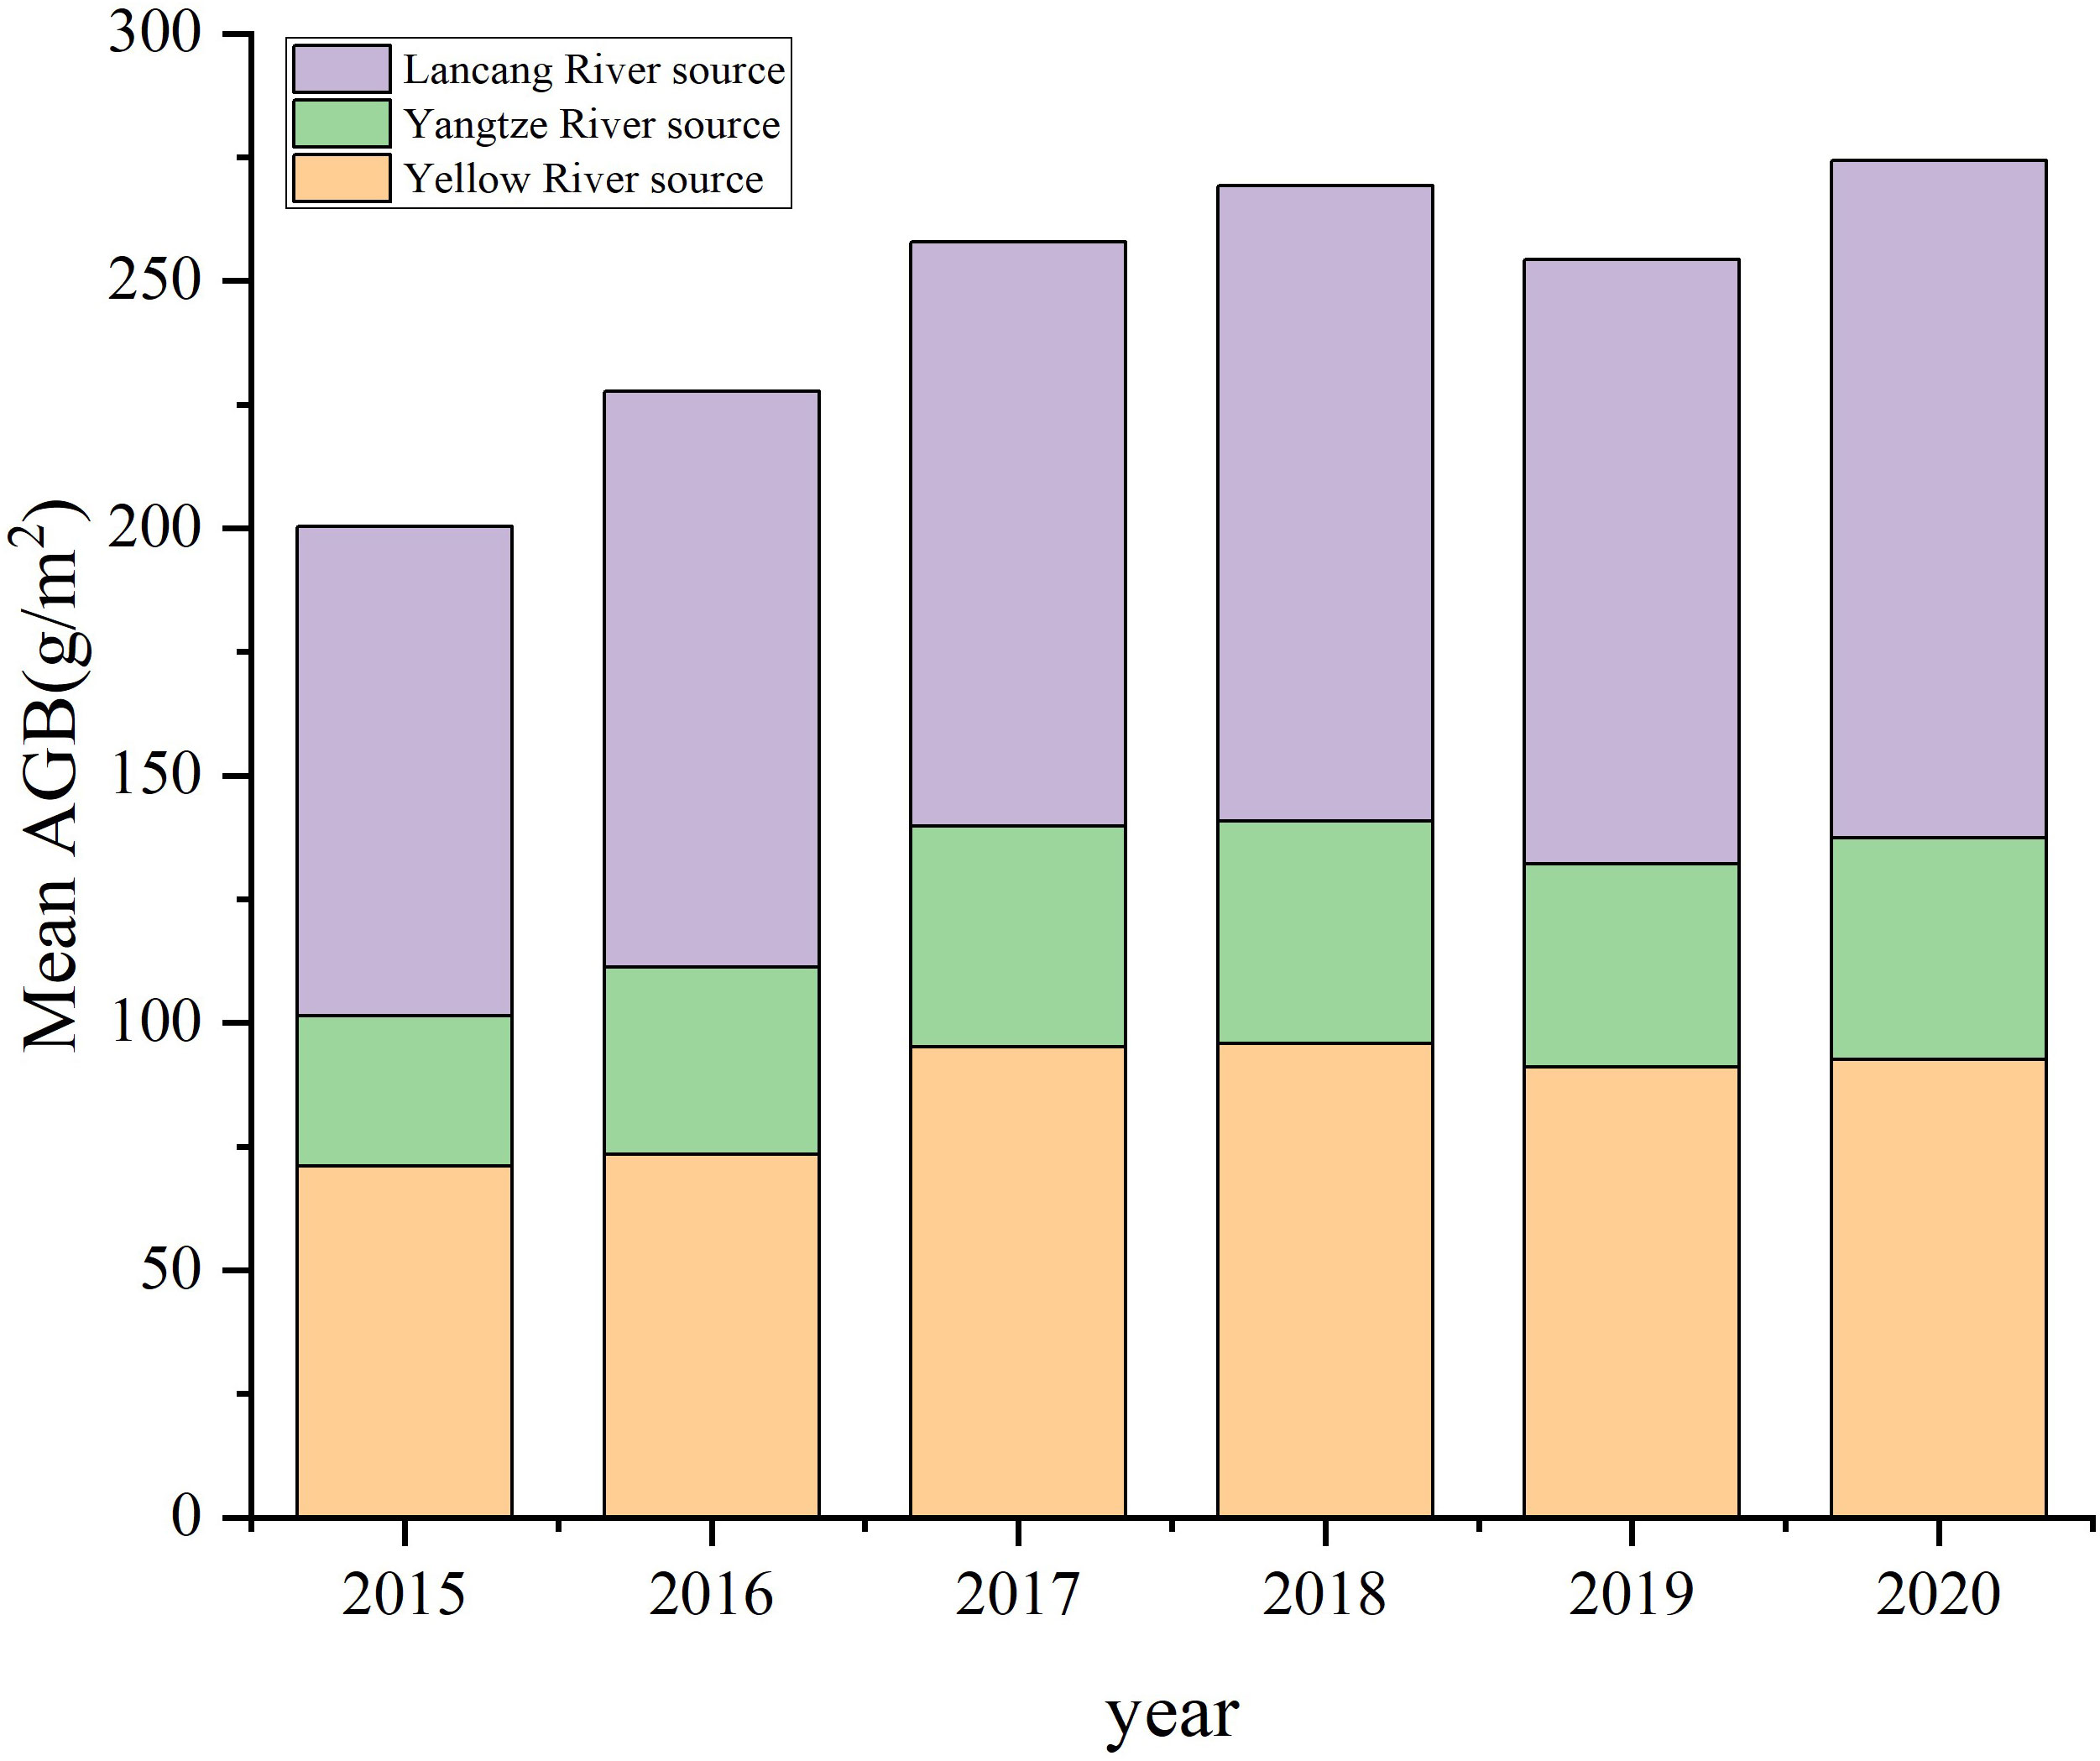
From the inversion of the grassland AGB in TRS National Park from 2015 to 2020 with the use of RF modeling, the average AGB values in the Yellow River, Yangtze River, and Lancang River source parks showed a consistent and dynamic increasing trend (Figure 4). The most substantial increase in grassland AGB occurred in the Yellow River source park from 2016 to 2017, with an average AGB rise of 19.224 g/m2. The Yangtze River source park, influenced by its geographic location and climatic factors, had lower average grassland AGB values than the other 2 parks. The maximum AGB value within the 6 years did not surpass 50 g/m2. Notably, the AGB in that park showed a linear increase from 2015 to 2017, with a growth rate of 24.73%, suggesting an enhancement in the ecological health of the Yangtze River source park grassland. Conversely, the Lancang River source park showed a relatively consistent growth trend during the same 6-year period, with annual average values ranging from 98.966 g/m2 to 136.892 g/m2. TRS National Park had a growth trend similar to those of the individual parks over the 6 years, consistently showing a dynamic increase. The average AGB rose from 200.371 g/m2 in 2015 to 274.330 g/m2 in 2020, marking a total increase of 73.958 g/m2. All 3 parks experienced a reduction in grassland AGB during 2018−2019, with a decrease of 5.54%. The primary reason for that was insufficient precipitation in the TRS region during that period, leading to limited grass growth.
3.3.2 Spatial pattern of grassland AGB
The overall spatial distribution of TRS National Park from 2015 to 2020 had relatively minor changes, and all areas demonstrated a gradual increase in AGB from the northwest to the southeast (Figure 5). That pattern showed noticeable heterogeneity, aligning closely with the distribution of actual sampling data. The average grassland AGB for TRS National Park as a whole was 247.333 g/m2. When considering the region’s individual parks, the Yangtze River source park had the lowest average AGB at 44.836 g/m2. That can be attributed to its elevated average altitude and less favorable water and heat conditions. In contrast, the Yellow River and Lancang River source parks boasted higher average grassland AGB values, standing at 92.601 g/m2 and 120.217 g/m2 respectively. The Lancang River source park enjoyed a more suitable climate and altitude, resulting in a higher grass biomass.
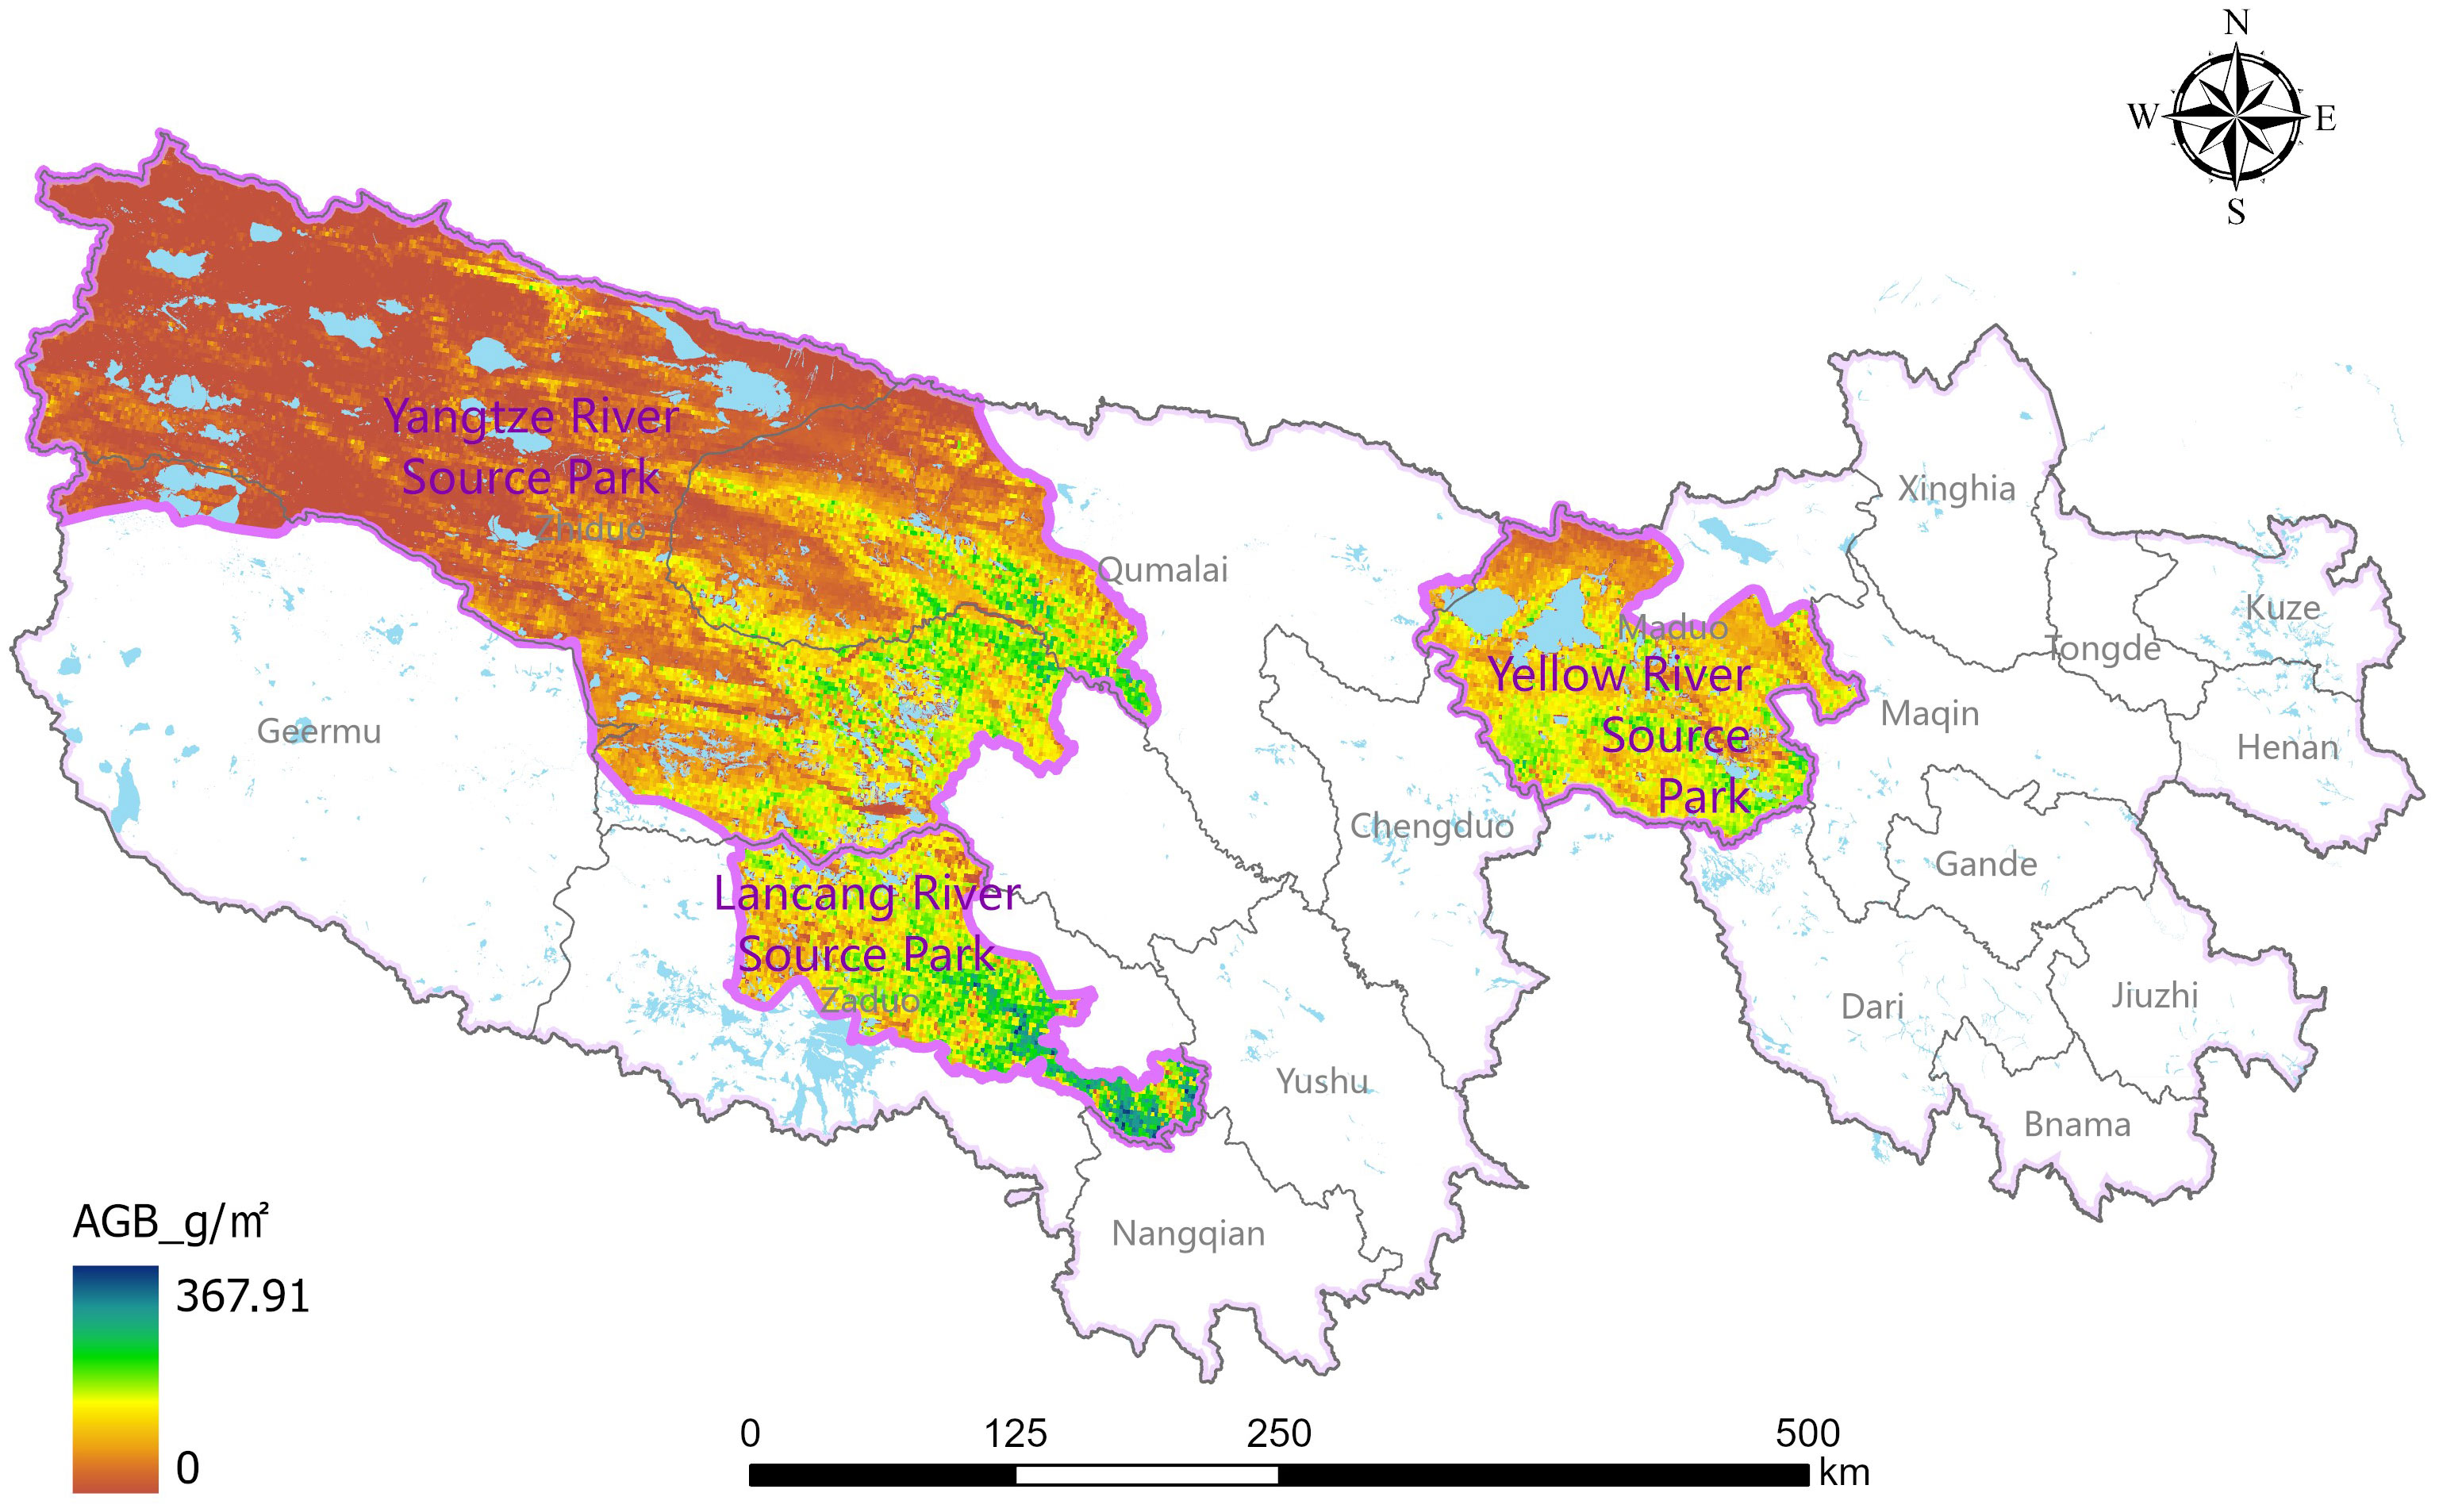
Figure 5 Spatial distribution of average grassland aboveground biomass in Three-River-Source National Park.
3.3.3 Trends of changes in grassland aboveground biomass
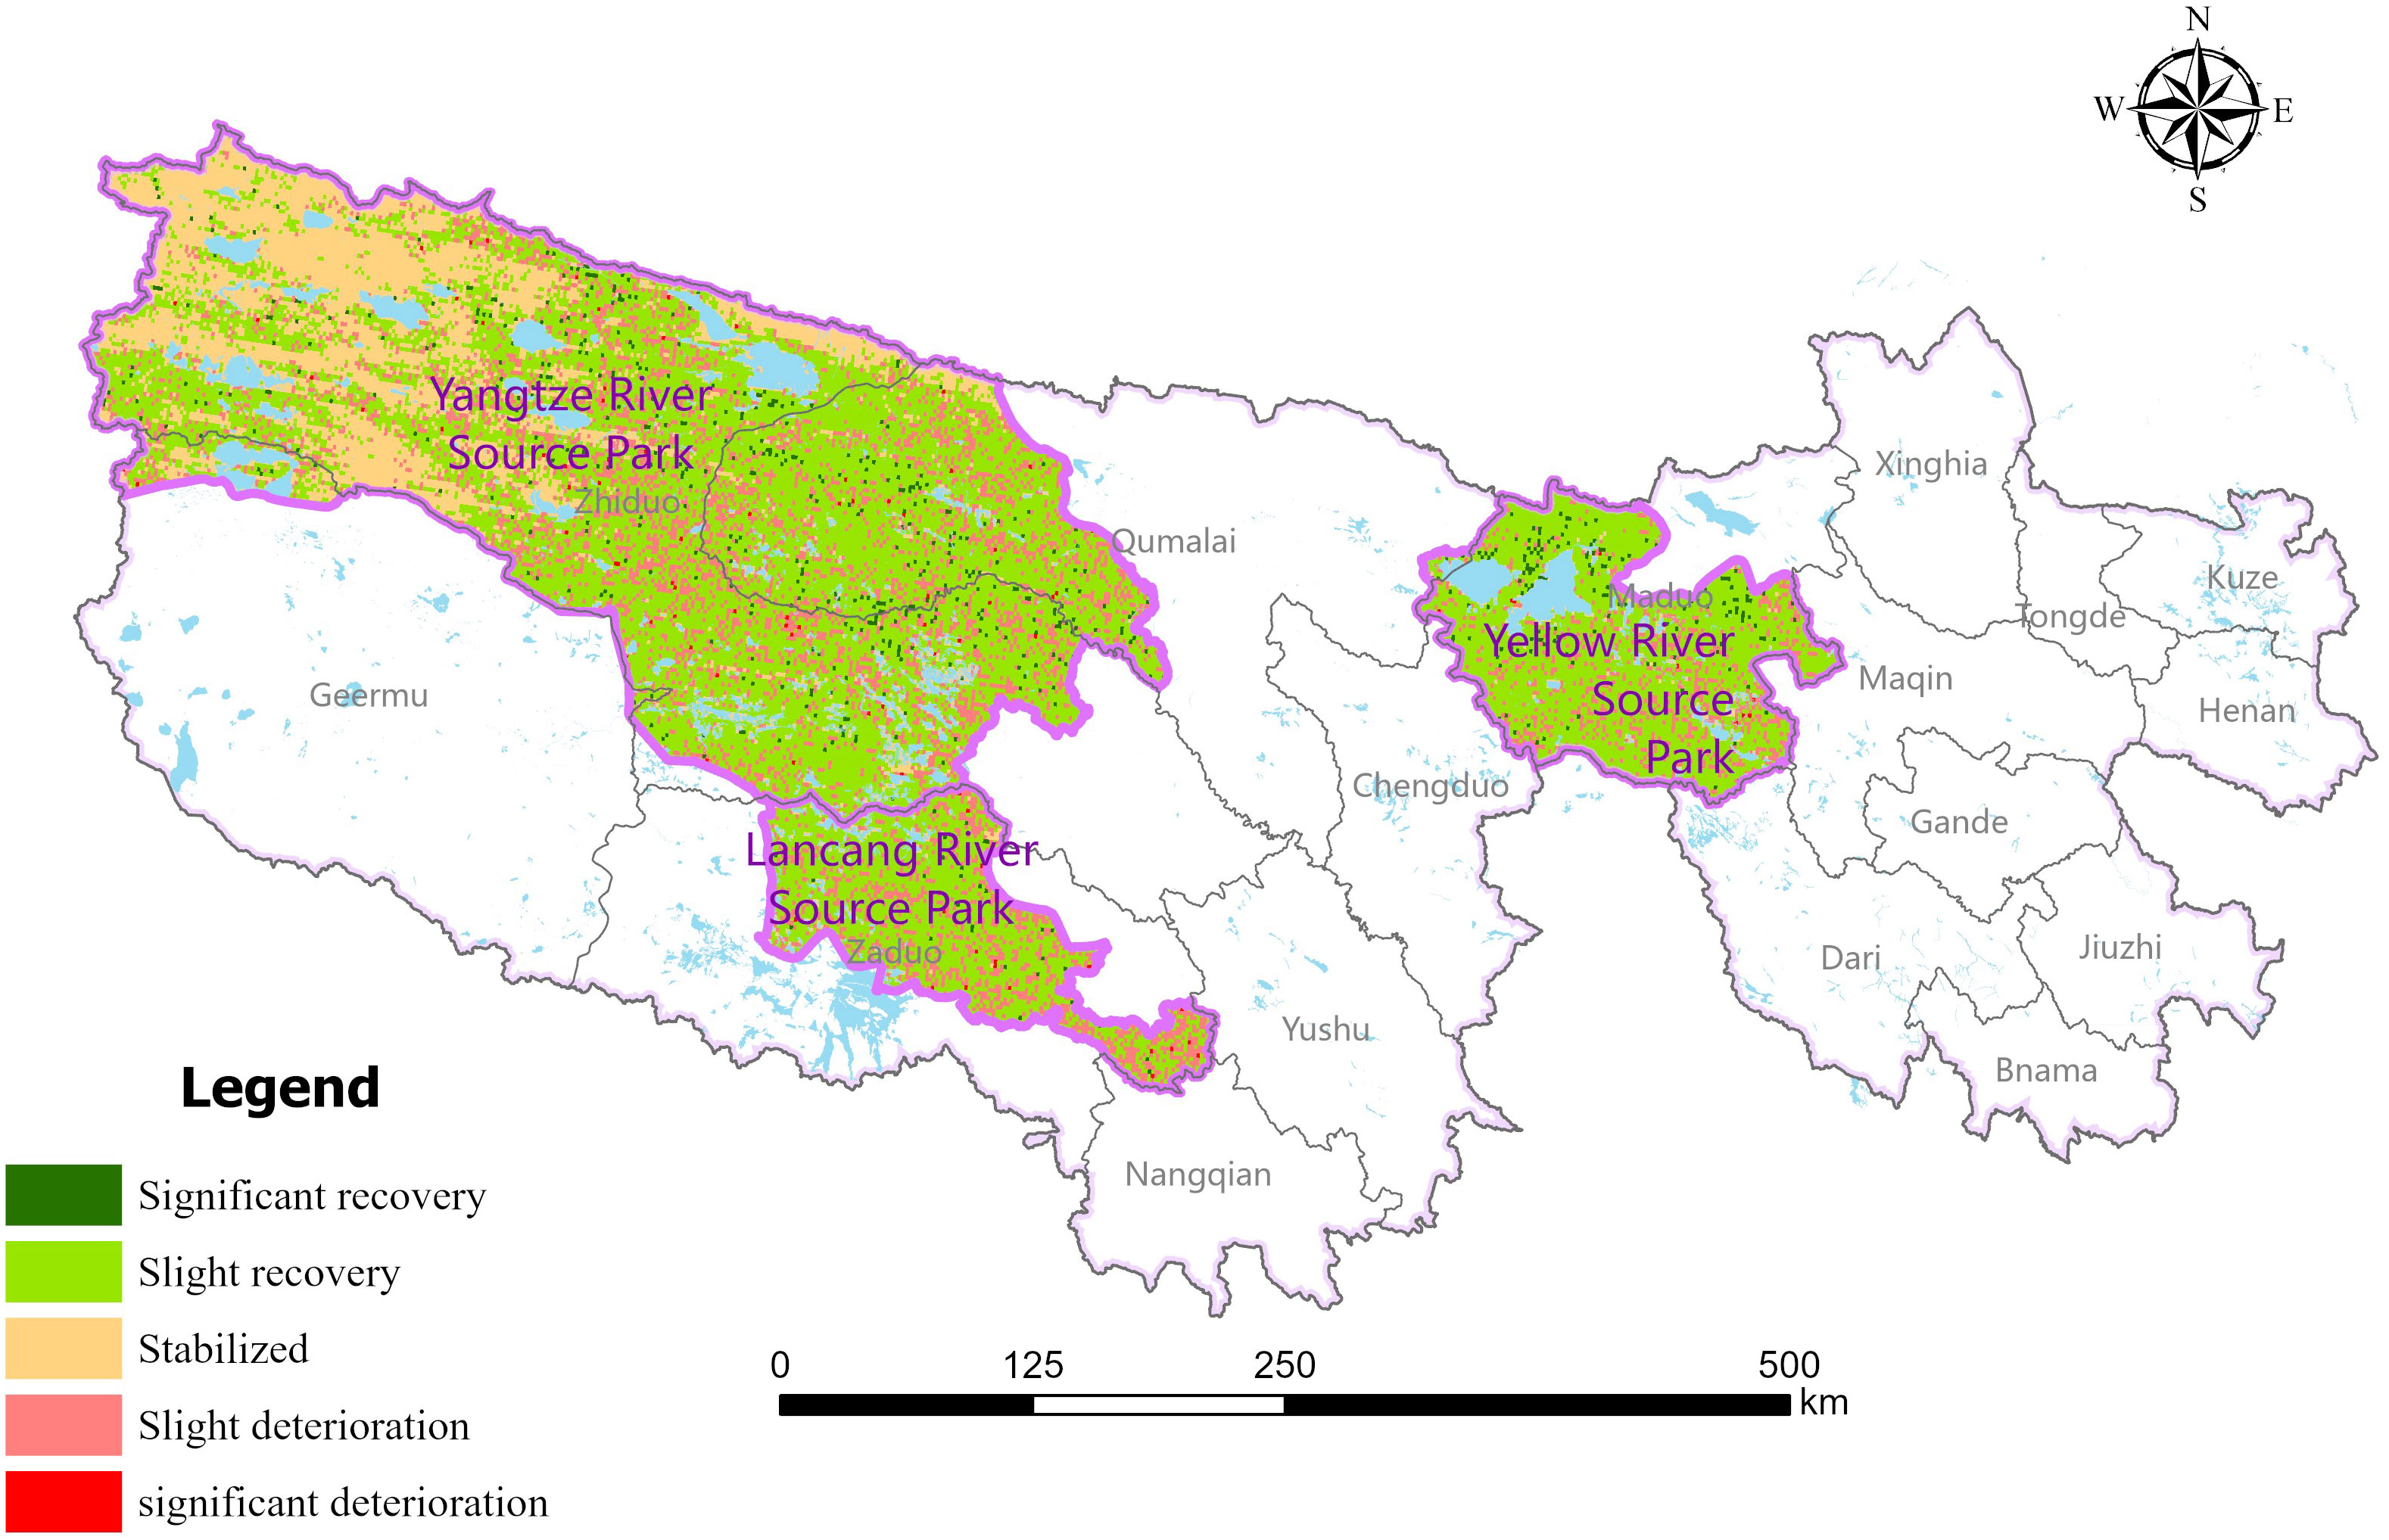
By overlaying the results of grassland AGB changes with their significance, we delineated the trends in grassland AGB changes across TRS National Park during the 6-year period. As shown in Figure 6, the 3 parks predominantly slightly recovered and stabilized in their AGB trends. A few areas showed slight deterioration, with minimal signs of either significant recovery or significant deterioration. The areas showing slight recovery are the most extensive and are situated primarily in the southeast of the Yangtze River source park, a substantial portion of the Lancang River source park, and the south-central area of the Yellow River source park. Stabilized areas are concentrated in the northwestern region of the Yangtze River source park, while scenarios of slight deterioration were observed primarily in the southeastern part of all 3 parks.
The most extensive category was slight recovery, encompassing an area of 69,780.53 km², which accounts for 56.99% of TRS National Park’s total area. This suggests that the overall grassland recovery in the TRS region has been relatively positive in recent years. The stabilized category encompassed a total area of 28,148.06 km², distributed primarily in the Yangtze River source park area. That region is relatively undisturbed, resulting in a more stable grassland condition. Notably, the Yangtze River source park comprises 25,654.65 km², representing 91.14% of the total stabilized area, while the Yellow River and Lancang River source parks had smaller stabilized areas. Areas of slight deterioration were dispersed across the 3 parks, totaling 22,003.87 km². Within this category, the Yellow River, Yangtze River, and Lancang River source parks occupied 13.54%, 69.27%, and 17.19% of the total area respectively. Moreover, the combined areas of significantly deteriorated and significantly restored regions measured 2,535.63 km², constituting 2.07% of TRS National Park’s total area. These results suggest that from 2015 to 2020, the TRS area experienced an overall trend of grassland recovery, stability in the eastern part of the Yangtze River source park, and localized deterioration trends (Table 4).
3.4 Distribution of grassland aboveground biomass in future scenarios
Using the RF approach, the future changes in grassland AGB in TRS National Park were modeled for the period 2021−2040 under 3 scenarios: ssp119, ssp245, and ssp585 (Figure 7). All scenarios had a dynamic upward trend in grassland AGB, with trend lines showing slopes greater than 0. Notably, the ssp119 scenario showcased the most rapid upward trend in grassland AGB for TRS National Park, with a slope of 7.618. That slope exceeded those observed in the ssp245 and ssp585 scenarios. The fluctuations in overall grassland AGB remained relatively consistent across the 3 parks, with the Lancang River source park displaying the highest values, followed by the Yellow River and Yangtze River source parks. Under the ssp585 scenario, the mean grassland AGB in TRS National Park averaged 320.92 g/m² over the 20-year period. This figure surpassed the mean values of ssp119 and ssp245, which stood at 288.80 g/m² and 311.53 g/m² respectively. This suggests that higher radiative forcing corresponds to increased global warming, resulting in elevated temperatures and, consequently, higher grassland AGB values.
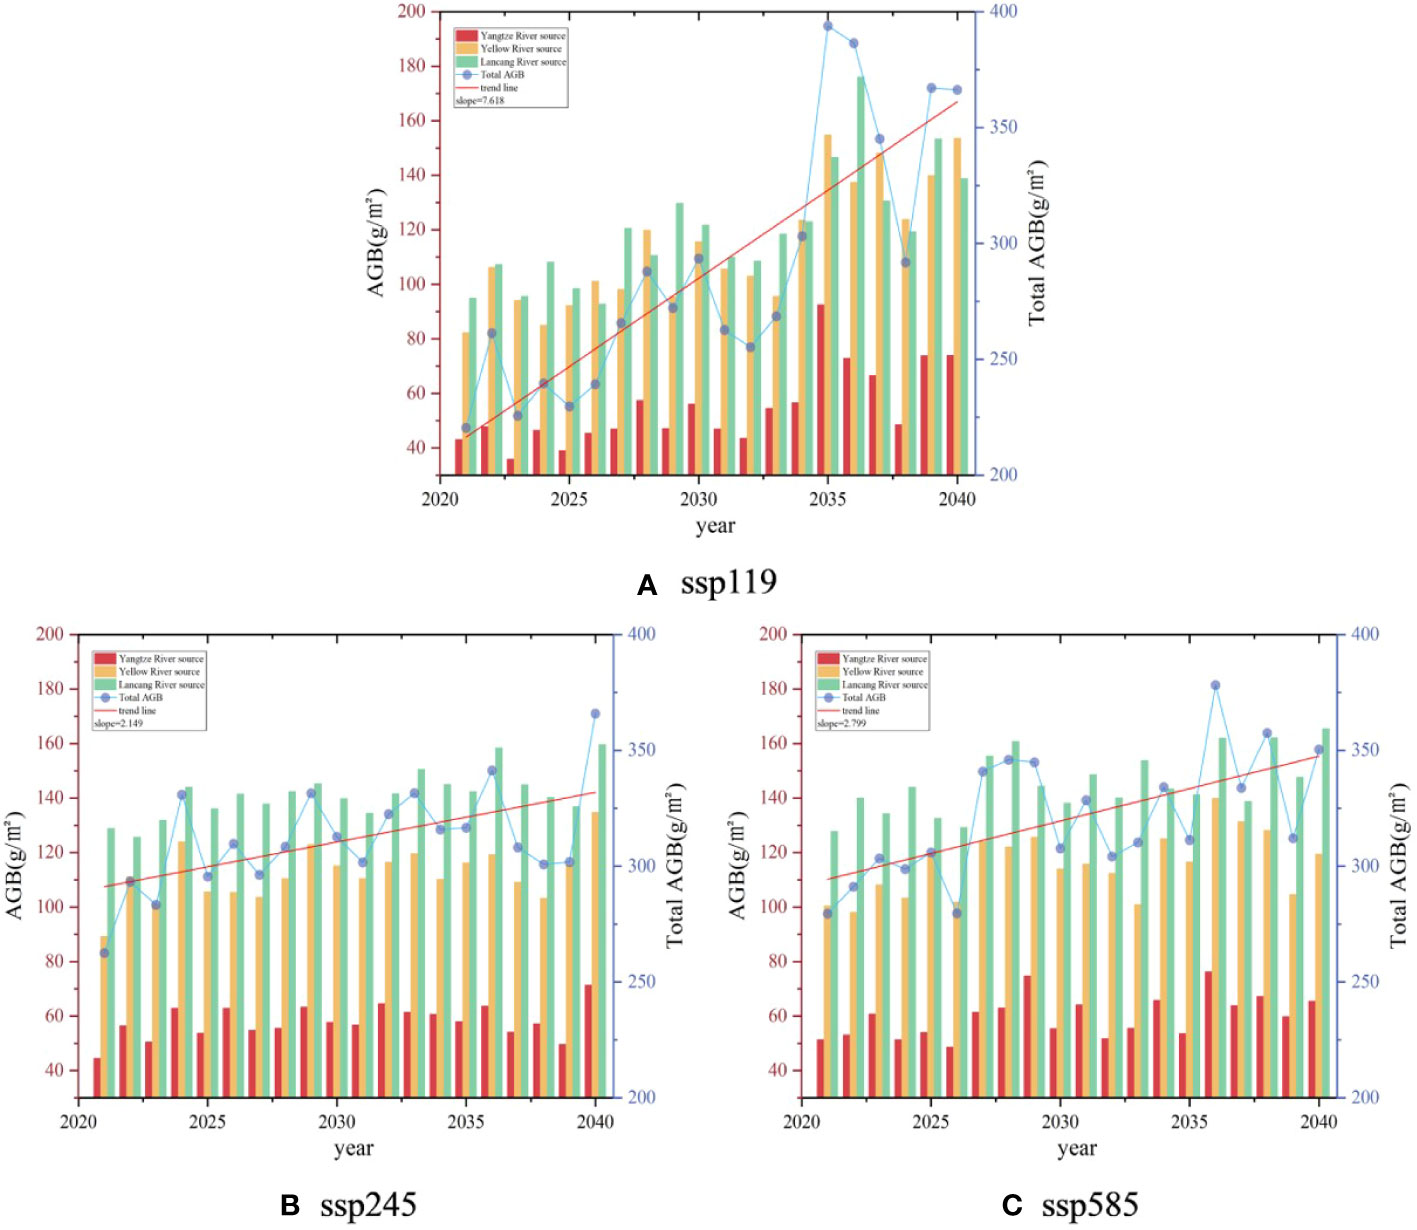
Figure 7 Changes in grassland aboveground biomass under various scenarios. (A) ssp119 scenarios, (B) ssp245 scenarios, (C) ssp585 scenarios.
In the ssp119 scenario, the average grass biomass in Changjiang Yuan Park increased to 54.77 g/m² from 2020 to 2035, surpassing the average value from 2015 to 2020. Notably, in 2035, the AGB of grassland in the Yangtze River source park peaked at 92.55 g/m². In the subsequent years, an average AGB of approximately 60 g/m² was maintained, which was markedly higher than the period from 2020 to 2034. The Yellow River source park showed an average grass biomass of 113.79 g/m² over 20 years, with 101.29 g/m² from 2020 to 2035 and a peak of 142.93 g/m² from 2035 to 2040. The Lancang River source park had the highest average grassland AGB of 120.24 g/m² over the 20-year period, displaying a dynamic upward trend, with a peak of 92.55 g/m² in the subsequent years. That was a 33.19% increase from 2031 to 2035.
Under the ssp245 scenario, the mean grassland AGB in TRS National Park increased at a lower rate than in ssp119, showing a fluctuating upward trend. In this scenario, the Yangtze River source park peaked at 71.37 g/m² in 2040, with a mean value of 57.29 g/m² from 2020 to 2039, showing a steep increase between 2039 and 2040. The mean value of grass biomass in the Yellow River source park remained relatively stable at 112.17 g/m² over the 20 years, ranging from 89.20 g/m² to 134.83 g/m². In that scenario, the mean value of grassland AGB in the Lancang River source park exceeded that of the other 2 parks, with a mean value of 141.36 g/m², marking a 21.25 g/m² increase compared to the period from 2015 to 2020, accounting for 17.59% of the total.
Under the ssp585 scenario, the mean grassland AGB in the Yangtze River source park averaged 59.87 g/m² over 20 years, reaching a peak of 76.30 g/m² in 2036. The Yellow River source park showed an average grassland AGB of 115.60 g/m² over 20 years, with occasional lower values in 2021, 2022, and 2033, whereas the remaining years consistently exceeded 100 g/m². In the Lancang River source park, the ssp585 scenario showed an increase in the mean grassland AGB, with a minimum value of 129.26 g/m² and an average of 145.49 g/m². That indicated that temperature increases had a more pronounced effect on grassland AGB in the Lancang River source park than in the Yellow River and Yangtze River source parks.
4 Discussion
4.1 Factors affecting the accuracy of grassland aboveground biomass inversion models
Machine learning algorithms offer clear advantages over traditional simple and multivariate linear regression models, because they excel in capturing and characterizing the relation between grassland AGB and its influencing factors. When constructing models, it became evident that relying solely on a single variable like NDVI could not encompass the full spectrum of characteristics within grassland biomass. The complexity of measured grassland AGB data and the presence of multicollinearity among influencing factors further hinder the accurate estimation of grassland AGB through multiple linear regression models, as noted by Zhou et al. (2021).
Among the 4 machine learning algorithms considered, RF was the top performer when assessed using training set accuracy analysis. Following RF, the ranking continued with ANN, DT, and SVM respectively. Its effectiveness in estimating grassland biomass in the TRS region was further substantiated by the findings of Zeng et al. (2021), who found that the RF model outperformed other machine learning models, achieving an impressive correlation coefficient (r) of 0.84 and RMSE of 76.99 g/m2. Moreover, Zhang J. et al. (2022) also successfully applied the RF model to estimate alpine grassland AGB from 2001 to 2019 in the Tibetan Plateau, which encompasses the TRS region, thereby emphasizing the strong regional representation offered by the RF fitting method.
The machine learning approach effectively captures the nonlinear relation between independent and dependent variables and often yields higher accuracy relative to traditional regression models. However, is not without its challenges, notably the problem of overfitting in practical applications due to noise interference. This concern is further exacerbated when pertaining to studies that use smaller sample sizes and a greater number of variables for fitting, as observed in many contemporary research works (Yu et al., 2021b). To mitigate overfitting, it is crucial to increase the number of samples during the fitting process while simultaneously exercising control over the number of variables. Furthermore, note that the accuracy of machine learning models can also be affected by problems related to the model’s physical parameters, as highlighted by Liang et al. (2016). Therefore, optimizing model parameters is another critical and challenging aspect that merits continued exploration and refinement in future research endeavors.
It is essential to recognize that model inversion accuracy is subject to various influencing factors (Qiu et al., 2022). Because the actual sampling data years were 2018 to 2020, and the inversion grass biomass years were 2015 to 2020, the model inversion results were subject to errors caused by the mismatch in the numbers of sampling years. The TRS region, situated on the Tibetan Plateau, has substantial variations in elevation, with different areas being affected by varying elevations and slopes (Liang et al., 2016; Wang L. et al., 2022). The remote sensing estimation method for grassland AGB represents a transition from statistical analysis to growth-process simulation. It involves simulating the grass’s growth and development by analyzing the statistical relations among various influencing factors, including environmental, anthropogenic, topographic, and climatic factors. In this intricate process, irregular fluctuations in external factors can significantly affect the precision of grass biomass model construction.
4.2 Impacts of climate change on grassland aboveground biomass
Temperature and precipitation fluctuations directly influence the supply and demand of water and heat crucial for grass growth. Moreover, climate factors can induce alterations in the attributes of grassland vegetation by affecting the transformation of biological conditions like soil (Chi et al., 2021; Shi et al., 2023).
Future global warming will alter soil temperature and moisture levels (Pei et al., 2023). Research indicates that temperature determines grassland growth, with higher temperatures promoting vegetation growth and development (Xu and Li, 2021). Precipitation also has a broad spectrum of effects on grass vegetation characteristics. It influences the interaction between plants and soil microorganisms, leading to changes in vegetation biomass distribution (Zhang and Xi, 2021). Moreover, there is an asynchronous relation between grassland biomass and changes in precipitation. Zhang et al. (2023) researched moisture conditions affecting both the aboveground and belowground biomasses of grasslands during different stages of vegetation flowering and fruiting. Wang Q. et al. (2022) found that increased temperatures have a significant effect on the biomass and species diversity of degraded grasslands in their natural recovery state, although they have little effect on natural grasslands. Therefore, restoring degraded grasslands might become more challenging under future warming scenarios. To address the degradation trend observed in the grasslands of the TRS National Park, sustainable grazing management practices should be implemented, grassland restoration projects advanced, and proactive measures taken to protect and enhance biodiversity to ensure the health and sustainability of the grasslands.
This study explored the relation between grass biomass and temperature and precipitation within the TRS National Park area. The relations among average monthly temperature, monthly precipitation, and grassland AGB were constructed based on sample data (Figure 8). It was observed that when precipitation was below 90 mm, the average grassland AGB remained below 136.6 g/m2 regardless of temperature changes. In the range of 90−120 mm of precipitation and temperatures ranging from 9°C to 12°C, the grassland AGB increased with rising temperatures. The peak grassland AGB was reached when precipitation was approximately 95 mm, and the temperature was approximately 11°C. This suggests that grassland AGB increases with both precipitation and temperature under favorable climatic conditions. In the ssp585 scenario, grassland AGB increased more substantially with rising temperature and precipitation compared to the ssp119 and ssp245 scenarios. Precipitation appeared to have a greater influence than temperature change, mainly because, at lower temperatures, increasing precipitation led to more grassland AGB. However, the relation between temperature change and grassland AGB was weaker under lower precipitation conditions. Wu W. et al. (2023) also demonstrated that climate factors have varying effects in Inner Mongolia and the Tibetan Plateau, with increased precipitation positively affecting grassland material production, while increased temperature has varying effects in different regions, both promoting and suppressing scenarios. In the context of global warming, most of the extreme climate indicators have risen in the TRS region, the frequency of extreme heat events has increased, and the frequency of extreme precipitation is higher than in other regions of the globe (Jin et al., 2020). To address the challenge of climate warming in the TRS region, key measures to improve the sustainability of agriculture and animal husbandry, strengthen water resource management, and raise awareness of ecological protection are required to ensure the health and balance of grassland ecosystems.
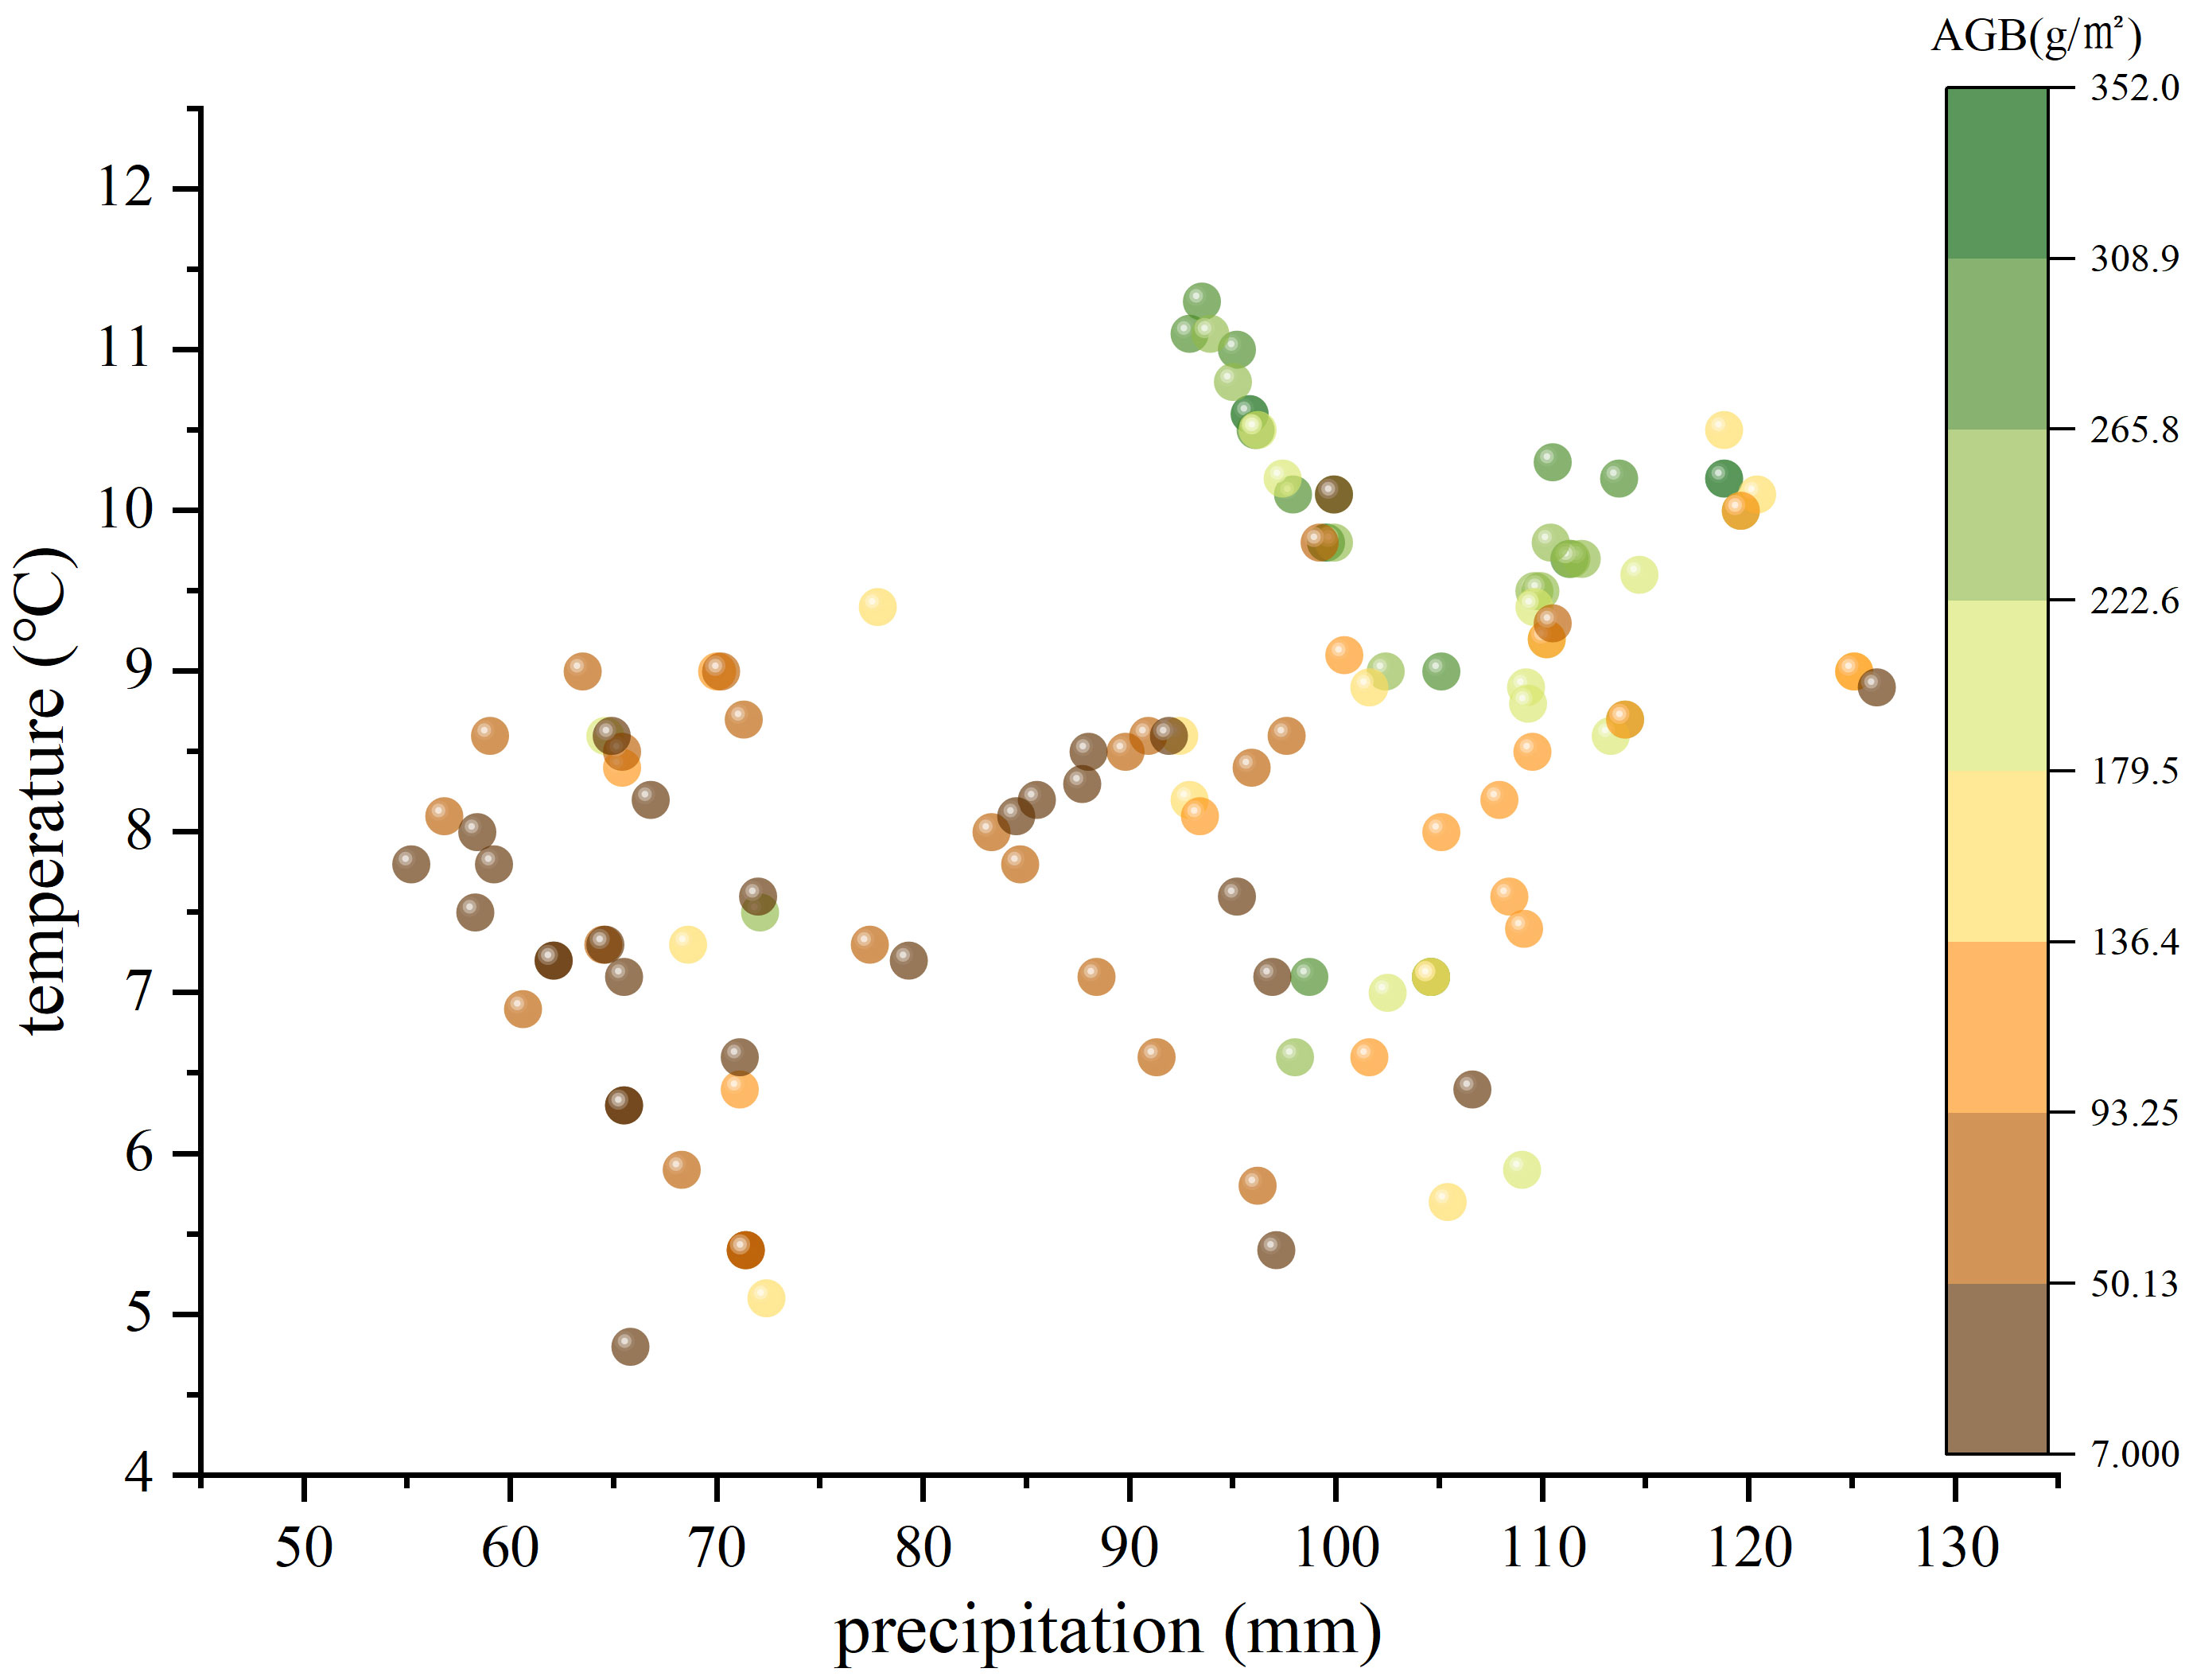
Figure 8 Relation between mean monthly temperature, mean monthly precipitation, and grassland aboveground biomass.
5 Conclusion
This paper delves into the practicality of various remote sensing inversion models for estimating grassland AGB, using actual sampling points and remote sensing data. The analysis covers changes in grassland AGB within the TRS National Grassland from 2015 to 2020, forecasts future biomass trends, and examines the potential influence of climate change on grassland AGB. The key findings can be summarized as follows:
(1) Grassland AGB strongly correlates with vegetation indices, with the highest correlation coefficient observed with the NDVI. Machine learning models proved more accurate in estimating grassland AGB in the TRS region than traditional linear regression models. Among the machine learning methods, the RF fitting approach yielded the highest accuracy, with a test set coefficient of determination reaching 0.722, making it well suited for grassland AGB analysis in TRS.
(2) From 2015 to 2020, the mean grassland AGB in TRS National Park showed a continuous upward trajectory characterized by a gradual increase from northwest to southeast. The analysis of grassland AGB trend changes revealed a predominant pattern of slight recovery and stabilization, with some areas experiencing slight deterioration. Notably, the areas displaying significant recovery or deterioration were limited. For degraded grassland areas, measures such as vegetation restoration, improved grazing management, and soil protection should be taken to restore and maintain the ecological health of grasslands.
(3) The grassland AGB in TRS National Park consistently displayed fluctuating and increasing trends across three future climate change scenarios (ssp119, ssp245, and ssp585). Apart from geographic factors, the effects of temperature and precipitation on grassland AGB proved to be more pronounced. Within specific ranges, grassland AGB values also increased as temperatures continued to increase and precipitation grew. Notably, the growth rate was particularly evident under conditions of 100−120 mm of precipitation and temperatures ranging from 9°C to 12°C. Global warming is expected to further drive the rise in grassland AGB values. Proactive measures must be taken to protect grasslands in the context of global warming. Those measures include implementing sustainable grassland management methods and enacting policies focused on preserving grasslands to mitigate the effect of climate change on these ecosystems.
Data availability statement
The original contributions presented in the study are included in the article/supplementary material. Further inquiries can be directed to the corresponding authors.
Author contributions
HH: Data curation, Writing – original draft. HY: Methodology, Writing – review & editing. ZR: Data curation, Writing – original draft. YY: Conceptualization, Methodology, Writing – original draft. PL: Writing – review & editing.
Funding
The author(s) declare financial support was received for the research, authorship, and/or publication of this article. The research was funded by the Strategic Priority Research Program of the Chinese Academy of Sciences (Grant No. XDA23060601), National Natural Science Foundation of China (U20A2088), Sichuan Science and Technology Program (Grant Nos. 2022YFS0494 and 2019YFS0467), Sichuan Natural Resources Scientific Research Project (Kj-2021-12).
Acknowledgments
The authors thank the Northwest Institute of Plateau Biology, Chinese Academy of Sciences and the Three-River-Source National Park Administration for providing grass sampling data.
Conflict of interest
The authors declare that the research was conducted in the absence of any commercial or financial relationships that could be construed as a potential conflict of interest.
Publisher’s note
All claims expressed in this article are solely those of the authors and do not necessarily represent those of their affiliated organizations, or those of the publisher, the editors and the reviewers. Any product that may be evaluated in this article, or claim that may be made by its manufacturer, is not guaranteed or endorsed by the publisher.
References
Alvarez-Mendoza C. I., Guzman D., Casas J., Bastidas M., Polanco J., Valencia-Ortiz M., et al. (2022). Predictive modeling of above-ground biomass in brachiaria pastures from satellite and UAV imagery using machine learning approaches. Remote Sens. 14 (22), 5870. doi: 10.3390/rs14225870
Amarsaikhan E., Erdenebaatar N., Amarsaikhan D., Otgonbayar M., Bayaraa B. (2023). Estimation and mapping of pasture biomass in Mongolia using machine learning methods. Geocarto Int. 38 (1), 1-19. doi: 10.1080/10106049.2023.2195824
Chapin F. S., Sala O. E., Huber-Sannwald E. (2013). Global biodiversity in a changing environment: scenarios for the 21st century (German: Springer Science & Business Media).
Chapungu L., Nhamo L., Gatti R. C. (2020). Estimating biomass of savanna grasslands as a proxy of carbon stock using multispectral remote sensing. Remote Sens. Applications: Soc. Environ. 17, 100275. doi: 10.1016/j.rsase.2019.100275
Chi Q. D., Wang J., Liu Y. Q., Zhao J., Cheng Y., Cai Z. C., et al. (2021). Varying interactive effects of climate, soil properties, and gross nitrogen dynamics on biomass production between the topsoil and the subsoil in natural grassland ecosystems. Eur. J. Soil Biol. 104, 103299. doi: 10.1016/j.ejsobi.2021.103299
Fan X., He G., Zhang W., Long T., Zhang X., Wang G., et al. (2022). Sentinel-2 images based modeling of grassland above-ground biomass using random forest algorithm: A case study on the Tibetan Plateau. Remote Sens. 14 (21), 5321. doi: 10.3390/rs14215321
Gao X., Dong S., Li S., Xu Y., Liu S., Zhao H., et al. (2020). Using the random forest model and validated MODIS with the field spectrometer measurement promote the accuracy of estimating aboveground biomass and coverage of alpine grasslands on the Qinghai-Tibetan Plateau. Ecol. Indic. 112, 106114. doi: 10.1016/j.ecolind.2020.106114
Ge J., Hou M., Liang T., Feng Q., Meng X., Liu J., et al. (2022). Spatiotemporal dynamics of grassland aboveground biomass and its driving factors in North China over the past 20 years. Sci. Total Environ. 826, 154226. doi: 10.1016/j.scitotenv.2022.154226
Hurtt G. C., Chini L., Sahajpal R., Frolking S., Bodirsky B. L., Calvin K., et al. (2020). Harmonization of global land use change and management for the period 850–2100 (LUH2) for CMIP6. Geosci. Model. Dev. 13 (11), 5425–5464. doi: 10.5194/gmd-13-5425-2020
Jia W., Liu M., Yang Y., He H., Zhu X., Yang F., et al. (2016). Estimation and uncertainty analyses of grassland biomass in Northern China: Comparison of multiple remote sensing data sources and modeling approaches. Ecol. Indic. 60, 1031–1040. doi: 10.1016/j.ecolind.2015.09.001
Jiang F., Zhang J. J., Song P. F., Qin W., Wang H. J., Cai Z. Y., et al. (2022). Identifying priority reserves favors the sustainable development of wild ungulates and the construction of Sanjiangyuan National Park. Ecol. And Evol. 12 (11), e9464. doi: 10.1002/ece3.9464
Jiang L., Cui T., Liu H., Xue Y. (2022). Remote sensing monitoring and analytical evaluation of grasslands in the muli region of Qinghai, China from 2000 to 2021. Land 11 (10), 1733. doi: 10.3390/land11101733
Jin Z., You Q., Wu F., Sun B., Cai Z. (2020). Changes of climate and climate extremes in the Three-Rivers Headwaters’ Region over the Tibetan Plateau during the past 60 years. Trans. Atmospheric Sci. 43 (6), 1042–1055. doi: 10.13878/j.cnki.dqkxxb.20201008001
Li C., De Jong R., Schmid B., Wulf H., Schaepman M. E. (2019). Spatial variation of human influences on grassland biomass on the Qinghai-Tibetan plateau. Sci. Total Environ. 665, 678–689. doi: 10.1016/j.scitotenv.2019.01.321
Li M., Wu J., Song C., He Y., Niu B., Fu G., et al. (2019). Temporal variability of precipitation and biomass of alpine grasslands on the Northern Tibetan Plateau. Remote Sens. 11 (3), 360. doi: 10.3390/rs11030360
Liang T., Yang S., Feng Q., Liu B., Zhang R., Huang X., et al. (2016). Multi-factor modeling of above-ground biomass in alpine grassland: A case study in the Three-River Headwaters Region, China. Remote Sens. Environ. 186, 164–172. doi: 10.1016/j.rse.2016.08.014
Liu W., Xu C., Zhang Z., De Boeck H., Wang Y., Zhang L., et al. (2023). Machine learning-based grassland aboveground biomass estimation and its response to climate variation in Southwest China. Front. Ecol. Evol. 11. doi: 10.3389/fevo.2023.1146850
Liu Z., Qiu H., Zhu Y., Liu Y., Yang D., Ma S., et al. (2022). Efficient identification and monitoring of landslides by time-series InSAR combining single- and multi-look phases. Remote Sens. 14 (4), 1026. doi: 10.3390/rs14041026
Ma S., Qiu H., Zhu Y., Yang D., Tang B., Wang D., et al. (2023). Topographic Changes, Surface Deformation and Movement Process before, during and after a Rotational Landslide. Remote Sens. 15 (3), 662. doi: 10.3390/rs15030662
Ma B. R., Zeng W. H., Xie Y. X., Wang Z. Z., Hu G. Z., Li Q., et al. (2022). Boundary delineation and grading functional zoning of Sanjiangyuan National Park based on biodiversity importance evaluations. Sci. Total Environ. 825, 154068. doi: 10.1016/j.scitotenv.2022.154068
Morais T. G., Teixeira R. F. M., Figueiredo M., Domingos T. (2021). The use of machine learning methods to estimate aboveground biomass of grasslands: A review. Ecol. Indic. 130, 108081. doi: 10.1016/j.ecolind.2021.108081
Pei Y., Qiu H., Zhu Y., Wang J., Yang D., Tang B., et al. (2023). Elevation dependence of landslide activity induced by climate change in the eastern Pamirs. Landslides 20 (6), 1115–1133. doi: 10.1007/s10346-023-02030-w
Popp A., Calvin K., Fujimori S., Havlik P., Humpenöder F., Stehfest E., et al. (2017). Land-use futures in the shared socio-economic pathways. Global Environ. Change 42, 331–345. doi: 10.1016/j.gloenvcha.2016.10.002
Qiu H., Zhu Y., Zhou W., Sun H., He J., Liu Z. (2022). Influence of DEM resolution on landslide simulation performance based on the Scoops3D model. Geomatics Natural Hazards Risk 13 (1), 1663–1681. doi: 10.1080/19475705.2022.2097451
Ren H., Zhou G., Zhang F. (2018). Using negative soil adjustment factor in soil-adjusted vegetation index (SAVI) for aboveground living biomass estimation in arid grasslands. Remote Sens. Environ. 209, 439–445. doi: 10.1016/j.rse.2018.02.068
Shi Y., Gao J., Li X., Brierley G., Lin C., Ma X. (2023). Spatiotemporal variability of alpine meadow aboveground biomass and sustainable grazing in light of climate warming. Rangeland Ecol. Manage. 90, 64–77. doi: 10.1016/j.rama.2023.05.009
Shu K., Gao X., Qian D., Zhao L., Li Q., Dai L. (2022). Relationship between biomass and biodiversity of degraded grassland in the sanjiangyuan region of Qinghai–Tibet Plateau. Diversity 14 (11), 1002. doi: 10.3390/d14111002
Wang Y., Qin R., Cheng H., Liang T., Zhang K., Chai N., et al. (2022). Can machine learning algorithms successfully predict grassland aboveground biomass? Remote Sens. 14 (16), 3843. doi: 10.3390/rs14163843
Wang L., Qiu H., Zhou W., Zhu Y., Liu Z., Ma S., et al. (2022). The post-failure spatiotemporal deformation of certain translational landslides may follow the pre-failure pattern. Remote Sens. 14 (10), 2333. doi: 10.3390/rs14102333
Wang Q., Zheng J., Zhao M., Zhang J. (2022). Effects of warming on early restoration of degraded grassland in desert steppe. Acta Agrestia Sin. 30 (5), 1077–1085. doi: 10.11733/j.issn.1007-0435.2022.05.007
Wijesingha J., Moeckel T., Hensgen F., Wachendorf M. (2019). Evaluation of 3D point cloud-based models for the prediction of grassland biomass. Int. J. Appl. Earth Observation Geoinformation 78, 352–359. doi: 10.1016/j.jag.2018.10.006
Wu N., Liu G., Wuyun D., Yi B., Du W., Han G. (2023). Spatial-temporal characteristics and driving forces of aboveground biomass in desert steppes of inner Mongolia, China in the past 20 years. Remote Sens. 15 (12), 3097. doi: 10.3390/rs15123097
Wu W., Sun R., Liu L., Liu X., Yu H., Ma Q., et al. (2023). Precipitation consistently promotes, but temperature inversely drives, biomass production in temperate vs. alpine grasslands. Agric. For. Meteorology 329, 109277. doi: 10.1016/j.agrformet.2022.109277
Xu M., Li X. (2021). Review of response of grassland community stability to global warming based on correlation between species biodiversity and biomass. Acta Botanica Boreali-Occidentalia Sin. 41 (2), 348–358. doi: 10.7606/j.issn.1000-4025.2021.02.0348
Xu C., Liu W., Zhao D., Hao Y., Xia A., Yan N., et al. (2022). Remote sensing-based spatiotemporal distribution of grassland aboveground biomass and its response to climate change in the Hindu Kush Himalayan region. Chin. Geographical Sci. 32 (5), 759–775. doi: 10.1007/s11769-022-1299-8
Xu D., Wang C., Chen J., Shen M., Shen B., Yan R., et al. (2021). The superiority of the normalized difference phenology index (NDPI) for estimating grassland aboveground fresh biomass. Remote Sens. Environ. 264, 112578. doi: 10.1016/j.rse.2021.112578
Yang S., Feng Q., Liang T., Liu B., Zhang W., Xie H. (2018). Modeling grassland above-ground biomass based on artificial neural network and remote sensing in the Three-River Headwaters Region. Remote Sens. Environ. 204, 448–455. doi: 10.1016/j.rse.2017.10.011
Yu H., Liu B.-T., Wang G.-X., Zhang T.-Z., Yang Y., Lu Y.-Q., et al. (2021a). Grass-livestock balance based grassland ecological carrying capability and sustainable strategy in the Yellow River Source National Park, Tibet Plateau, China. J. Mountain Sci. 18 (8), 2201–2211. doi: 10.1007/s11629-020-6087-2
Yu H., Wang G., Yang Y., Bai Z., Liu B., Zhang T., et al. (2020a). Enhancing ecological value through sustainable food supply of grasslands in the Three-River-Source National Park, Tibet Plateau, China. Ecosystem Serv. 46, 101218. doi: 10.1016/j.ecoser.2020.101218
Yu H., Wang G., Yang Y., Lu Y. (2020b). Concept of grassland green carrying capacity and its application framework in national park. Acta Ecologica Sin. 40 (20), 7248–7254. doi: 10.5846/stxb201906171276
Yu H., Wu Y., Niu L., Chai Y., Feng Q., Wang W., et al. (2021b). A method to avoid spatial overfitting in estimation of grassland above-ground biomass on the Tibetan Plateau. Ecol. Indic. 125, 107450. doi: 10.1016/j.ecolind.2021.107450
Zeng N., Ren X., He H., Zhang L., Li P., Niu Z. (2021). Estimating the grassland aboveground biomass in the Three-River Headwater Region of China using machine learning and Bayesian model averaging. Environ. Res. Lett. 16 (11), 114020. doi: 10.1088/1748-9326/ac2e85
Zeng N., Ren X., He H., Zhang L., Zhao D., Ge R., et al. (2019). Estimating grassland aboveground biomass on the Tibetan Plateau using a random forest algorithm. Ecol. Indic. 102, 479–487. doi: 10.1016/j.ecolind.2019.02.023
Zhang J., Fang S., Liu H. (2022). Estimation of alpine grassland above-ground biomass and its response to climate on the Qinghai-Tibet Plateau during 2001 to 2019. Global Ecol. Conserv. 35, e02065. doi: 10.1016/j.gecco.2022.e02065
Zhang Y., Huang J., Jin Y., Wang J., Zhao Y., Feng Q., et al. (2022). Estimation of grasslands aboveground biomass: A review. Acta Agrestia Sin. 30 (4), 850–858. doi: 10.11733/j.issn.1007-0435.2022.04.010
Zhang F., Li H., Yi L., Luo F., Zhang G., Wang C., et al. (2022). Spatial response of topsoil organic carbon, total nitrogen, and total phosphor content of alpine meadows to grassland degradation in the Sanjiangyuan National Park. Acta Ecologica Sin. 42 (14), 5586–5592. doi: 10.5846/stxb202106111566
Zhang B., Min Q., Jiao W., Liu M., He S., Liu X., et al. (2019). Comparative study between Three-River-Source National Park of China and Jiri national park of Korea. Acta Ecologica Sin. 39 (22), 8271–8285. doi: 10.5846/stxb201903190511
Zhang H., Tang Z., Wang B., Meng B., Qin Y., Sun Y., et al. (2022). A non-destructive method for rapid acquisition of grassland aboveground biomass for satellite ground verification using UAV RGB images. Global Ecol. Conserv. 33, e01999. doi: 10.1016/j.gecco.2022.e01999
Zhang C. H., Xi N. X. (2021). Precipitation changes regulate plant and soil microbial biomass via plasticity in plant biomass allocation in grasslands: A meta-analysis. Front. Plant Sci. 12. doi: 10.3389/fpls.2021.614968
Zhang L., Xiao P., Yu H., Zhao T., Liu S., Yang L., et al. (2022). Effects of climate changes on the pasture productivity from 1961 to 2016 in sichuan yellow river source, Qinghai-Tibet Plateau, China. Front. Ecol. Evol. 10. doi: 10.3389/fevo.2022.908924
Zhang Y., Zhou T., Liu X., Zhang J., Xu Y., Zeng J., et al. (2023). Crucial roles of the optimal time-scale of water condition on grassland biomass estimation on Qinghai–Tibet Plateau. Sci. Total Environ. 905, 167210. doi: 10.1016/j.scitotenv.2023.167210
Zheng D., Hao S., Lv L., Xu W., Wang Y., Wang H. (2020). Spatial-temporal change and trade-off/synergy relationships among multiple ecosystem services in Three-River-Source National Park. Geographical Res. 39 (1), 64–78. doi: 10.11821/dlyj020180898
Zhou W., Li H., Xie L., Nie X., Wang Z., Du Z., et al. (2021). Remote sensing inversion of grassland aboveground biomass based on high accuracy surface modeling. Ecol. Indic. 121, 107215. doi: 10.1016/j.ecolind.2020.107215
Keywords: climate change, grassland AGB, machine learning, model evaluation, remote sensing inversion, Three-River-Source National Park
Citation: He H, Yu H, Rong Z, Yang Y and Li P (2023) Estimation of grassland aboveground biomass and its response to climate changes based on remote sensing inversion in Three-River-Source National Park, Tibet Plateau, China. Front. Ecol. Evol. 11:1326980. doi: 10.3389/fevo.2023.1326980
Received: 24 October 2023; Accepted: 13 November 2023;
Published: 29 November 2023.
Edited by:
Haijun Qiu, Northwest University, ChinaCopyright © 2023 He, Yu, Rong, Yang and Li. This is an open-access article distributed under the terms of the Creative Commons Attribution License (CC BY). The use, distribution or reproduction in other forums is permitted, provided the original author(s) and the copyright owner(s) are credited and that the original publication in this journal is cited, in accordance with accepted academic practice. No use, distribution or reproduction is permitted which does not comply with these terms.
*Correspondence: Hui Yu, eXVodWlAaW1kZS5hYy5jbg==; Pengshang Li, dGFyZ2V0bHBzQDE2My5jb20=
†These authors have contributed equally to this work and share co-first authorship
 Hui He
 Hui Yu
 Ziwei Rong4
 Yan Yang