 Peijin Li
 Yixin Liao
 Chen Huang1
 Lang Yi
- 1School of Engineering Management, Hunan University of Finance and Economics, Changsha, China
- 2College of Natural Resources and Environment, South China Agricultural University, Guangzhou, Guangdong, China
- 3Key Laboratory of Natural Resources Monitoring and Supervision in Southern Hilly Region, Ministry of Natural Resources, Changsha, China
Introduction: A series of significant ecological construction projects in the southern hilly region have brought about substantial changes to the ecological status and comprehensive zoning of the region. Hunan Province, with its strategic significance, was chosen as a representative research subject in the southern hilly region.
Methods: We conducted a dynamic evaluation of the ecological status change and comprehensive zoning of Hunan Province from a structure–function perspective by applying the transfer matrix, Theil-Sen, Mann-Kendall, and ecosystem service trade-offs or synergies methods. The research goal was to integrate and harmonize structural complexity and functional diversification, providing valuable insights for optimizing both ecological background and territorial background.
Results: The main results are as follows: (1) The structural changes of ecosystems were mainly concentrated in settlement and Cropland ecosystems. While the area of bulti-up ecosystems has increased significantly, from 1.34% in 2000 to 2.72% in 2020. Cropland ecosystems marking a decrease of 1.39%, with a continued conversion of Cropland into construction land ecosystems. (2) Ecosystem function changes have introduced instability. Over time, NPP exhibited an oscillating trend of increase followed by a decrease. Spatially, there was a sharp decline in peripheral building land, and the regions of declining NPP displayed a lateral U-shaped distribution. (3) The overall trend in ecosystem service changes was positive. Quantitatively, GP and CS experienced an ascending-then-decreasing pattern, while HQ showed a weak decline and WY increased annually. At the county scale, there was noticeable spatial heterogeneity. Human socio-economic activities and environmental protection policies exert a significant impact on the ecological conditions within the study area. (4) Regarding the national territory space function partition, urban functional zones have primarily catered to residential functions and were mainly distributed in the Changsha-Zhuzhou-Xiangtan area.
Discussion: Ecological functional zones were mainly centered on ecological functions, and most were located in the mountainous areas of western and southern Hunan Province. The agricultural function areas were mainly to serve production functions and were mainly located in the Dongting Lake Plain, the nearshore plain of the mainstream and tributary systems of the rivers of Xiang, Zi, Yuan, and Li. In general, the changes in ecosystem structure and function in the study area reflect changes in ecological conditions. In the future, ecosystem diversity, stability, and sustainability should be improved from an integrated structure–function perspective.
1 Introduction
The analysis of changes in ecological status constitutes a pivotal model for the comprehensive assessment of ecosystems. These changes are primarily influenced by natural and human factors, resulting in significant changes in ecosystem structure, function, and services (Hou et al., 2015; He et al., 2021; Liu G.B. et al., 2023), such as the loss of Cropland (Zhu et al., 2022), fragmentation of landscape structure (Peng et al., 2017), and reduction of habitat quality (Ouyang and Zhu, 2020), among others. Ecosystem services, which emerge directly or indirectly from functioning (Hou et al., 2015), embody another facet of this functioning. Therefore, it is crucial to quantify the state of regional ecosystems from both structural and functional perspectives. This understanding is essential for evaluating regional high-quality development, optimizing regional territorial spatial planning, and making informed decisions.
As the primary determinant shaping the context and spatial variations of ecosystem function, ecosystem structure reveals the spatial distribution patterns of its internal subsystems and their spatial structural interrelationships (Xu et al., 2008; Ouyang et al., 2023). Ecosystem structure refers to the proportionality or composition of various ecosystems at a given scale. Ecosystem function can be represented by three key axes: maximum productivity, water utilization strategy, and carbon utilization strategy. When describing the condition of an ecosystem, the structure and function approach takes both aspects into account. The foremost key axis, contributing the most significantly, represents the ecosystem’s maximum productivity and is mainly affected by vegetation structure (Migliavacca et al., 2021). Consequently, it is paramount to unveil changes in ecological status from both structural and functional perspectives in order to achieve integrated governance of ecosystem systems. This approach offers theoretical and practical reference values for the overall protection and synergistic governance of social-ecological systems (Dan et al., 2020; Wei et al., 2023a). To reinforce the cohesion and systemic coherence of ecosystems, fostering mutual feedback between their structure and function is needed. Many scholars have extensively investigated changes in ecological conditions from the perspectives of ecosystem structure and ecosystem function. Based on the ecosystem structure perspective, it is evident that frequent human activities can result in significant alterations in land use type, thereby impacting the landscape and ecosystem health of the region. Existing literature mainly employs methods such as the transfer matrix (Li et al., 2023; Zhang et al., 2023) and landscape pattern index (Liu et al., 2022b; Chen et al., 2023; Wei et al., 2023b). For example, the ecosystem transfer matrix was used to reveal temporal and spatial changes in the ecosystems of the Yellow River Basin over the past 35 years. The benefit transfer method and elasticity coefficient were utilized to evaluate their impact on ecosystem service values (Liu et al., 2021). Additionally, the landscape pattern index was used to construct an ecosystem health evaluation system for wetlands in the urban area of Xiongan, exploring its landscape pattern and ecological health status (Xu et al., 2020). As for the ecosystem function perspective, it can be categorized into methods evaluating value quantity and those evaluating physical quality (Zhao et al., 2023). For instance, the ecosystem service value equivalent factor was applied to estimate the ecosystem service value of known land use areas (Shi et al., 2022; Zhou et al., 2022). Using variables like NPP, water retention services, and habitat quality, the spatial pattern of ecosystem service functions in the Beijing-Tianjin-Hebei region was modeled. Next, the region’s raster-scale ecosystem health variations were assessed (Ning et al., 2021). On the other hand, there are researchers who perceive ecosystem service clusters from a different perspective (Pan et al., 2021; Zhang et al., 2021; Liu et al., 2022b). Ecosystem service clusters encompass collections of ecosystem services occurring in close proximity in space (Li et al., 2016). They assist in coordinating the composite functional zoning of territorial space and support the overall optimization and improvement of local ecosystems. In particular, Zhang Chunyue et al. used K-Mean cluster analysis to identify clusters of ecosystem services and examined their synergistic relationships to improve the comprehensive ecosystem service capacity of the study area (Zhang et al., 2021). Likewise, Pan Ying et al. utilized the PAM module within the “cluster” package of the R language to conduct cluster analysis of ecosystem services in the Daqing River Basin, identifying driving factors (Pan et al., 2021).
The structure and function of ecosystems are essential elements for partitioning the functions of national territory space, in line with the objective of achieving high-quality development. This comprehension stands as a pivotal aspect to understanding the evolution of ecological conditions and enabling comprehensive national territory space function partitioning. Some scholars have suggested that single dominant function zoning is inadequate in the current literature on qualitative analysis, and that the new era of territorial spatial function classification should be divided into multifunctional mixed zoning and combined with spatially secondary functions (Zou et al., 2022; Hu et al., 2023). In quantitative research, ecosystem macro-structure, NDVI, and NPP were used to examine changes in the ecological status of different principal functional zones within the Yangtze River Economic Zone (Wu et al., 2018).Remote sensing classification data was used to measure the ecological function, and its value was calibrated by integrating ecosystem service values. Consequently, the spatial function of land within Henan Province was evaluated, and the functional zoning was subsequently established based on the two-dimensional graph theory clustering algorithm (Zhou et al., 2020).
In general, numerous findings have emerged from studies focusing on ecosystem change through a single perspective of either structure or function. However, a comprehensive understanding of how ecosystem conditions evolve under the integrated structure–function perspective requires further investigation, particularly in terms of the synergistic effect of ecosystem structure and function on the functional zoning of land space. As a result, this study concentrates on addressing the following scientific issues: (1) how to characterize ecosystem changes from a structure–function perspective; (2) how to delineate different integrated functional regions from a service cluster perspective. The southern hilly mountainous belt stands as a significant ecological security barrier in southern China, containing the world’s largest and most well-preserved meso-subtropical woodland ecosystems within the same latitudinal belt (Ma et al., 2021). Based on this, this paper employed methodologies, such as the transfer matrix and ecosystem service trade-offs or synergy, to reveal the spatio-temporal dynamic change patterns of ecosystem conditions and identify integrated functional areas in Hunan Province between 2000 and 2020. The ultimate goal is to furnish a scientific and theoretical foundation for ecological construction and planning within the context of the southern hilly mountainous belt.
2 Overview of the study area
The southern hilly region, which encompasses seven provinces: Zhejiang, Fujian, Jiangxi, Hunan, Guangdong, Guangxi, and Guizhou (Figure 1), is characterized by a wealth of heat and water and pleasant temperatures due to its subtropical monsoon climate. The southern hilly areas have made immeasurable contributions to the ecological security of China’s southern region as an integral part of the country’s “two screens and three belts” ecological pattern. They also play an indispensable role in exploring the spatial functional zoning of the country’s land and fostering the high-quality development of the southern region.
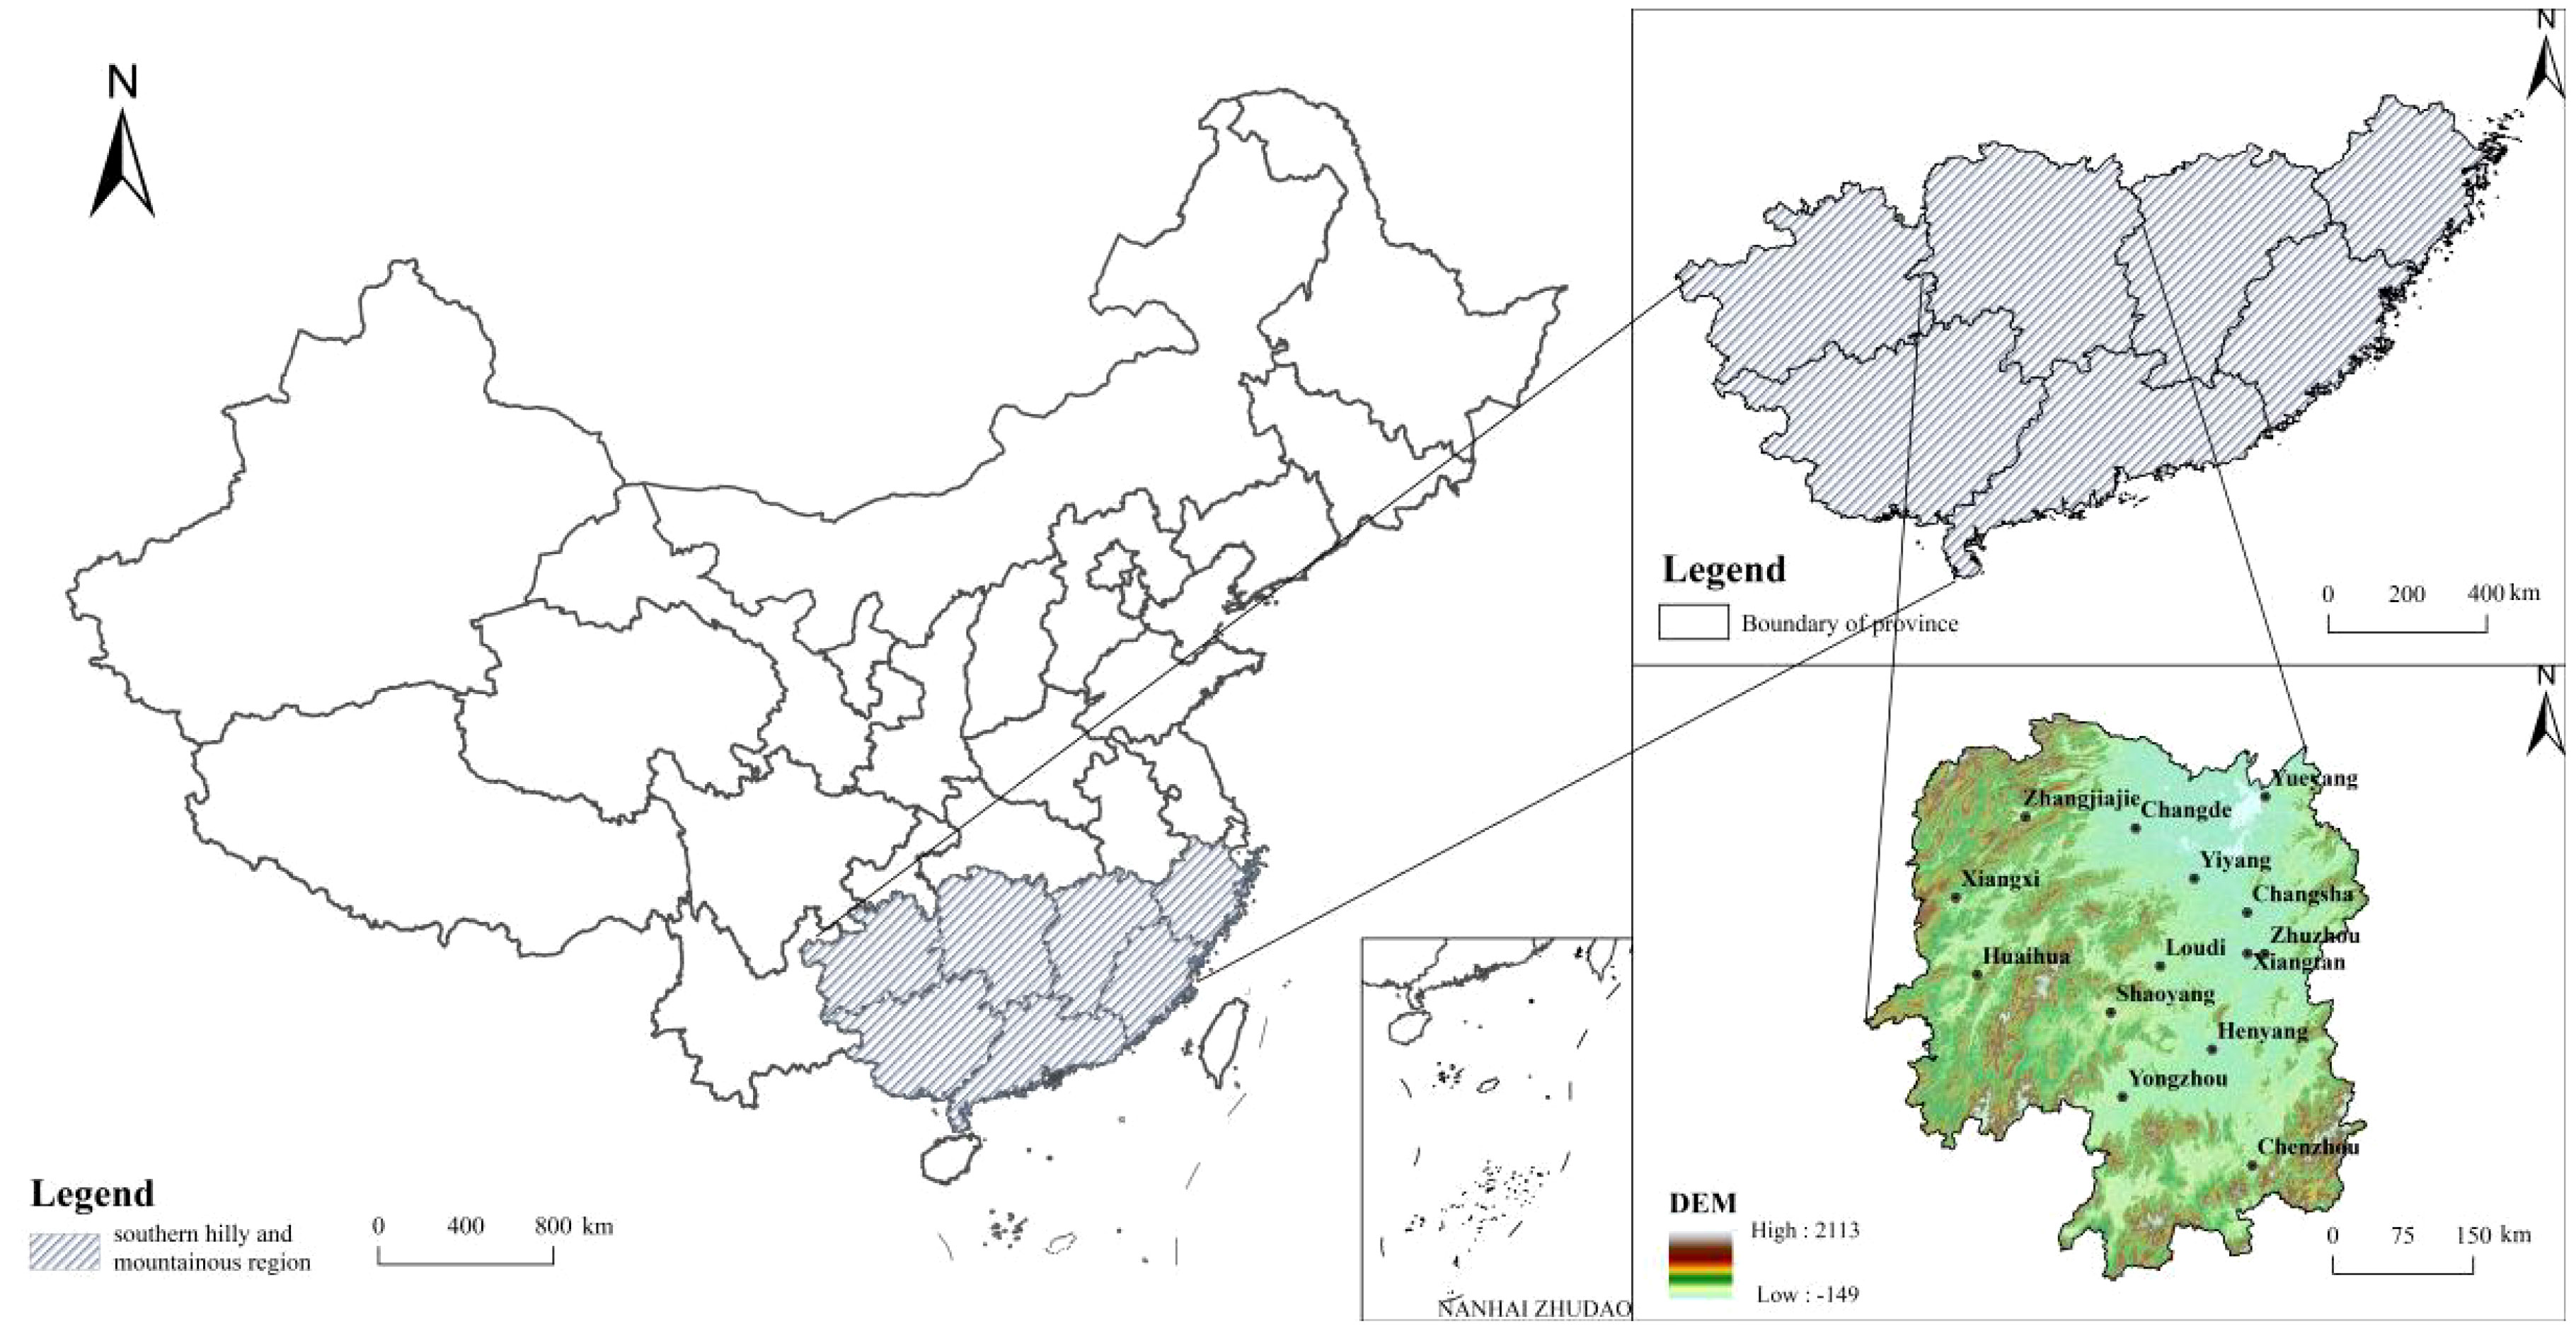
Figure 1 Schematic location diagram of Hunan Province.
Hunan Province is situated between latitude 24°38′–30°08′N and longitude 108°47′–114°15′E, sharing borders with Chongqing and Guizhou in the west, Jiangxi in the east, Guangxi and Guangdong in the south, and Hubei in the north (Figure 1), covering a total land area of 211,800 km2. The majority of its landforms are mountains and hills, including the Mufu-Luoxiao mountain range in the east, the Nanling mountain range in the south, the Wuling and Xuefeng Mountains in the west, and the Dongting Lake Plain in the north (Zheng et al., 2023). The province’s center consists of hills and valleys, a dense network of rivers, and well-established water systems across Hunan (Chen et al., 2019). In 2022, the GDP of Hunan Province was 4,867.037 billion yuan, with a resident population of 66.220 million people. The province contains 122 county-level divisions and 14 prefectural-level administrative districts. Being a key development axis in the central region, Hunan Province boasts diverse ecosystem types and performs ecosystem service activities such as water conservation, regional climate regulation, and biodiversity maintenance. It also serves as a significant ecological reserve and water conservation area in the southern hilly region, with its favorable ecological environment being essential for maintaining and sustaining regional ecosystem functions (Xiong et al., 2020). To provide an ecological foundation and a national territory foundation for the thorough implementation of the significant strategy of “three highs and four news” in Hunan Province, it is of utmost importance to study how to integrate changes in ecological conditions and spatial functional zoning of the national territory.
3 Data sources and processing and research methods
3.1 Data sources
The data utilized in this study primarily consists of the following: Social and natural economic development datasets were predominantly sourced from the Hunan Statistical Yearbook (2000–2020) and the China Meteorological Data Network.
(1) Ecosystem-type datasets were primarily ecosystem-type records for Hunan Province spanning from 2000, 2005, 2010, 2015, and 2020. The datasets were obtained from the Resource and Environmental Science and Data Center of the Chinese Academy of Sciences, accessible through the specific website (https://www.resdc.cn/). The spatial resolution was set at 0.03 km, with the transfer matrix generated post-processing using ArcGIS 10.2. This classification involves referencing the “Third National Land Survey Land Classification” alongside relevant findings pertaining to ecosystem-type divisions. The classification encompasses various types, including cropland, woodland, grassland, built-up, and waterbody, among others.
(2) Nighttime light data were acquired from the National Earth System Science Data Center (http://geodata.nnu.edu.cn/). The data processing procedure involves utilizing the Sigmoid function conversion, resampling SNPP-VIIRS data, and splicing DMSP-OLS from the Colorado School of Mines (http://eogdata.mines.edu/nighttime_light/) to obtain China-wide DMSP-OLS (1 km) spanning from 2000 to 2020.
(3) Net primary productivity (NPP) data from 2000 to 2020 were derived from the National Aeronautics and Space Administration MOD17A3HGFd dataset, which featured a spatial resolution of 0.5 km. The resolution was harmonized to 1 km for consistency
3.2 Research methods
3.2.1 Ecosystem pattern transfer matrix
The conversion link between ecosystem patterns in Hunan Province was examined at the start and the conclusion of the study period using the transfer matrix of the ecosystem pattern (Shi et al., 2000):
In the above equation, is the number of ecosystem types; , refers to the ecosystems at the beginning and end of the study period; denotes the area where ecosystem type was transferred to ecosystem type during the study period.
3.2.2 Trend analysis of NPP changes
We examined the variations in vegetation NPP characteristics within Hunan Province using the Theil-Sen median trend analysis. Among these, the Theil-Sen median trend analysis employs the median function to generate the detection factor, signifying a reliable nonparametric calculation method unaffected by measurement errors and outlier data. This approach is commonly used for trend analysis of extensive time series data (Wan et al., 2023):
In the above equation, and denote the NPP values of the sample time series and , respectively; denotes the median of the slopes for calculating data combinations.
The Mann-Kendall significance test is a nonparametric statistical test that is unaffected by missing values and outliers and does not require that the measurement data follow a normal distribution or that the trend be linear (Wan et al., 2023):
The test statistics (and ), the number of replicated data sets in the study time series (m), the number of repetitious data in the set of replicated data (), and the variance of () are all included in Equations (3–6). When the absolute value of is greater than 1.96 or 1.65, the significance test is considered to have been successfully conducted with a 95% or 90% confidence level. When the value is greater than 0, the table NPP displays an increasing trend; when the value is 0, a falling trend.
3.2.3 Ecosystem service clusters
The Self-Organizing Feature Mapping network (SOFM) is a neural network approach used in this study for unsupervised learning. It identifies ecosystem service clusters at the county scale and assigns each county unit to an ecosystem service cluster based on the spatial co-occurrence similarity of ecosystems (Xia et al., 2023). In order to guarantee consistency and comparability of defined ecosystem service clusters across a 20-year period, the SOFM implementation used normalized values for ecosystems of the same scale.
Food production exhibited inconsistency across different land-use types, and we evaluated the region’s food supply capacity by converting food mass into corresponding energy (kJ/kg). (Li et al., 2016; Zhang et al., 2017). When combined with land cover data and biodiversity threat indicators, the InVEST model’s Habitat Quality module serves as raster data. (Di Febbraro et al., 2018). To assess carbon storage in each cell, the InVEST model analyzes carbon densities and maps for each land-use type (Natural Capital Project, 2023). The InVEST model’s water yield service module is based on Budyko’s coupled hydrothermal equilibrium assumption. (Zhu et al., 2023). Water yield service typically represents the difference between precipitation and evapotranspiration, which measures the ecosystem’s supply water capability.
The “Kohonen” package in R4.0 software was used to run SOFM, clustering and analyzing five distinct ecosystem services: food production, nighttime light index, habitat quality, carbon storage, and water yield service, across 122 counties (urban areas) throughout the entire study area in 2000, 2010, and 2020. These specific indexes are detailed in Table 1. Based on the features of each cluster’s ecosystem services, they were designated as urban functional area, agricultural functional area, and ecological functional area (Zhang et al., 2019; Hu et al., 2022; Niu et al., 2022; Qiu et al., 2023). Radar diagrams were created to depict the ecosystem service cluster structures. SOFM has the advantage of being more stable and insensitive while dealing with a larger amount of data than general K-mean cluster analysis.
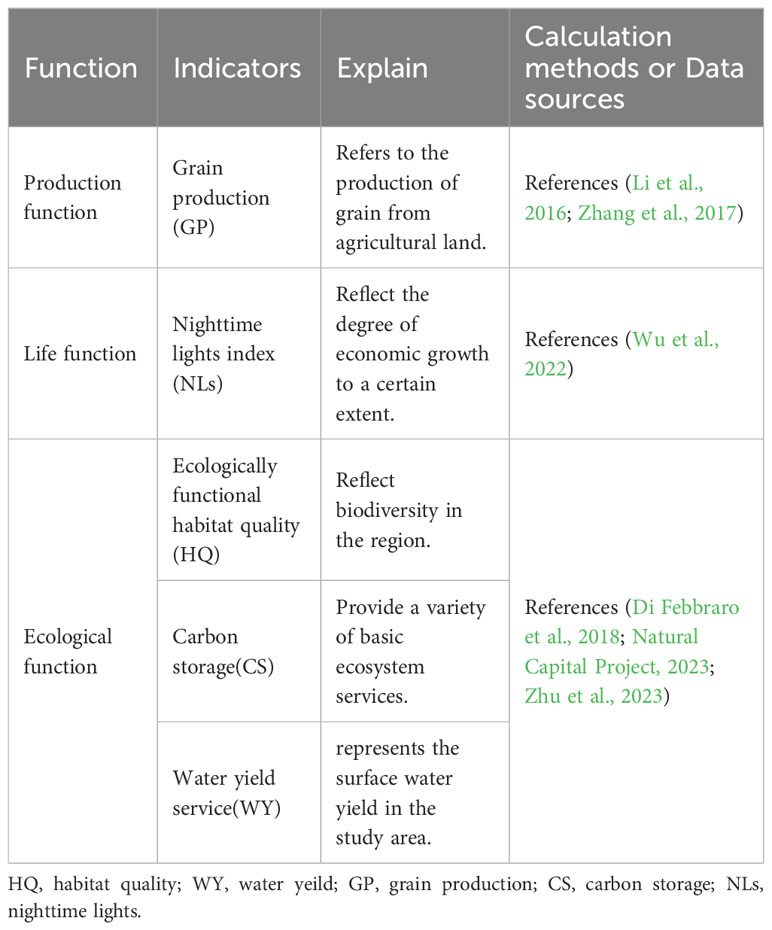
Table 1 Comprehensive zoning evaluation index system.
3.2.4 Driving factor analysis
Several factors collaborate to influence changes in ecosystem conditions. These variables include those that are intrinsic to ecosystem changes, like temperature and precipitation; extrinsic variables, like human activity; and changes in ecosystem patterns, which are subject to the effect of national policy (Di Febbraro et al., 2018). In this study, the anthropogenic disturbance index was used to assess the impact of human activities on ecosystem conditions changes in Hunan Province. The least squares method was employed to analyze interannual trends in natural factors like temperature and precipitation.
Given that human activities affect different ecosystems to varying degrees, causing varying levels of disturbance, such as minimal disturbance to unutilized land and substantial disturbance to cropland, hierarchical assignments were assigned to each ecosystem. Anthropogenic disturbance indices were categorized into four levels (as shown in Table 2) based on the degree of disruption to different ecosystems. This categorization is referenced in the study by Zhao et al. (Zhao et al., 2023).
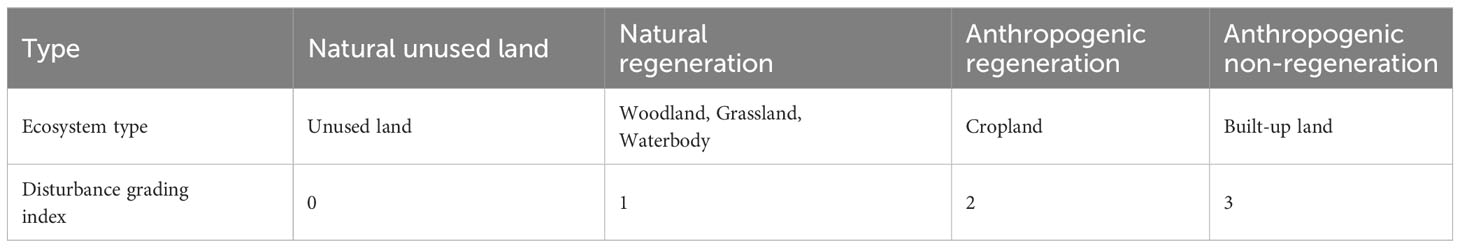
Table 2 Grading scale of human disturbance.
For a given region, ecosystem types with multiple disturbance grading indices generally exist simultaneously. Therefore, the composite human disturbance index for ecosystems in the region is calculated through a weighted summation method, resulting in a composite human disturbance index for ecosystems between 0 and 3:
In the above equation, is the human disturbance index, denotes the grading index of the ecosystem at level, and denotes the percentage of area of the ecosystem at level .
4 Results and analysis
4.1 Macro-structural change of the ecosystem
During the study period, significant changes occurred in various ecosystems (see Table 3). Notably, cropland ecosystems experienced a continuous 1.39% decline, equivalent to 2948.14 km2, from 2000 to 2020. In contrast, bulti-up ecosystems spatially expanded by 2917.82 km2, growing from 1.34% in 2000 to 2.72% in 2020. Woodland ecosystems and waterbody ecosystems increased slightly in their respective areas, with no substantial alterations observed. Grassland ecosystems continued to decrease, covering an area of 679.6 km2. The area of unused land exhibited a fluctuating pattern, initially increasing and then decreasing, ultimately covering an area of 989.87 km2 in 2020, accounting for only 0.47% of the total land area within the study area.
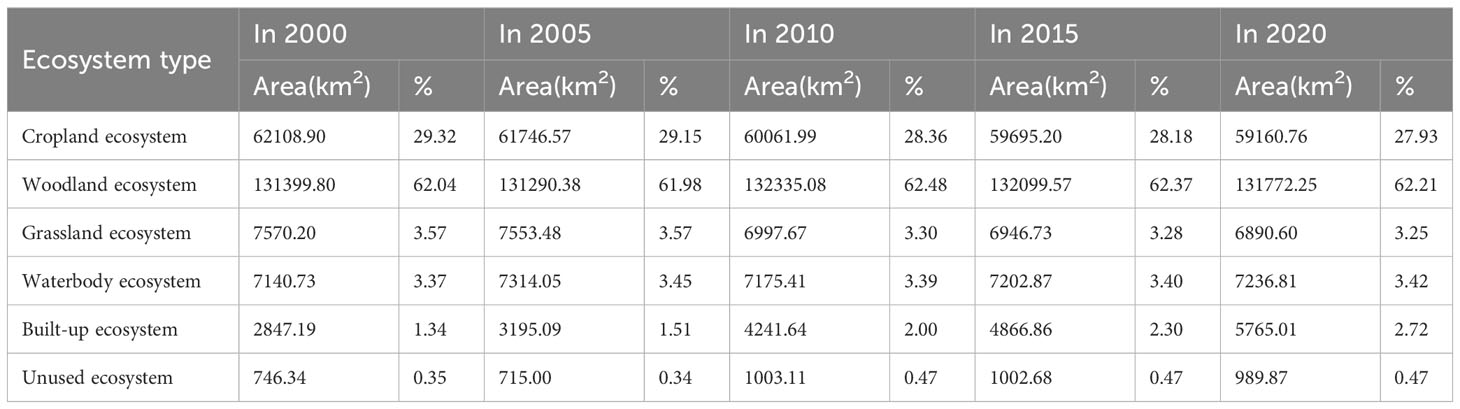
Table 3 Land use types and proportions of land in Hunan Province from 2000 to 2020.
To illustrate the configuration of each ecosystem’s land use type and the corresponding transitions occurring within Hunan Province from 2000 to 2020, this study employed a transfer matrix. The results of ecosystem transfers were then visually represented through a chordal diagram (Figures 2A–D). Within the four phases of ecosystem area transformation, the primary interchanges involved cropland and woodland, exhibiting bidirectional conversion attributes.
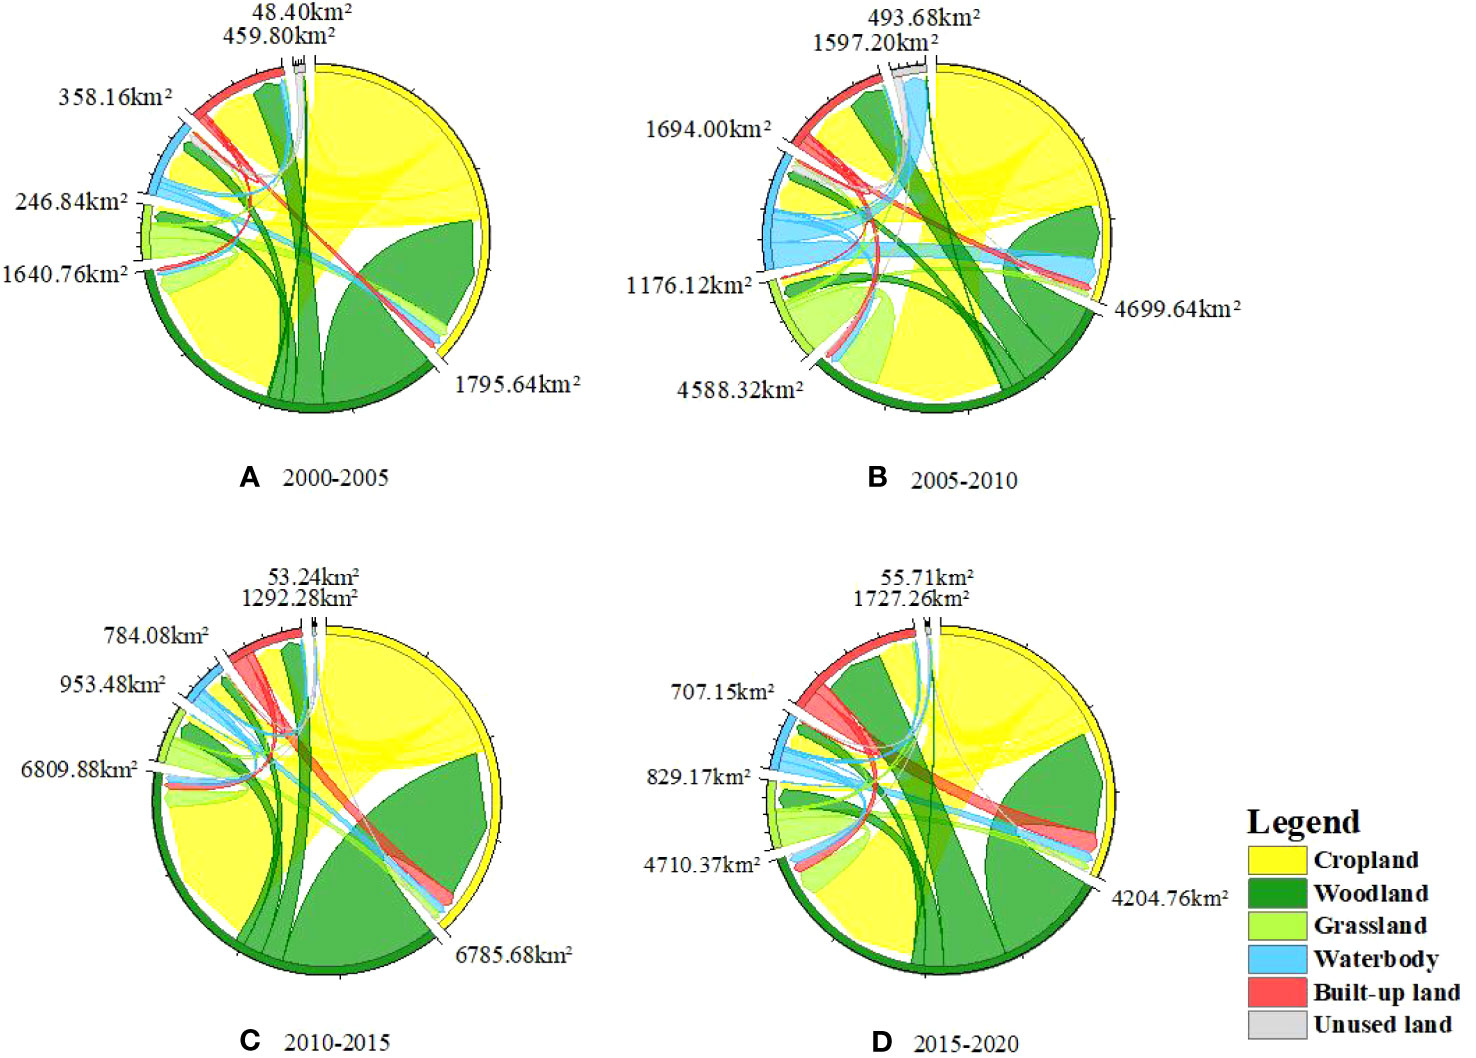
Figure 2 Ecosystem transfer in Hunan Province from 2000 to 2020. (A) 2000–2005, (B) 2005–2010, (C) 2010–2015, and (D) 2015–2020.
From 2000 to 2005, land-use conversion was significant, equivalent to 1.07% of the total area. This indicates the high intensity of human activities affecting land use during the study period, resulting in notable land-use alterations. Specifically, the principal conversions comprised cropland and woodland, totaling 1122.88 km2 and 808.28 km2, accounting for 49.36% and 35.53% of the transferred area, respectively. Notably, cropland mainly shifted to woodland, encompassing an area of 696.96 km2, while woodland primarily converted to cropland, encompassing 542.08 km2.
From 2005 to 2010, this phase predominantly followed the trajectory of ecosystem area conversion from the previous stage. The main types of conversion remained cropland(3,291.2 km2) and woodland (1,747.24 km2), accounting for 46.19% and 24.5% of converted areas, respectively. Cropland was primarily converted to woodland (1,931.16 km2) and built-up land (745.36 km2). This pattern aligns with the ongoing “Return Farmland to woodlands” initiative, which has already made a substantial impact. woodland, amounting to 556.6 km2, was converted into built-up land as well, primarily driven by rapid urban development and the need for expanded built-up land areas, resulting in the encroachment on both cropland and woodland ecosystems.
From 2010 to 2015, the majority of conversions consisted of cropland (3,571.92 km2) and grassland (484 km2), accounting for 48.64% of the total transfer area. Grassland shifted mainly to woodland, while cropland was primarily converted to woodland (2691.04 km2) and built-up land(454.96 km2), showcasing the significant impact of the farmland-to-woodland conversion. A smaller amount of land was converted between 2015 and 2020, with the majority undergoing conversions to cropland (2,350.88 km2) and woodland(2,550.22 km2). During this stage, the transitions involved reciprocal conversions between cropland and woodland, with a substantial portion being converted into built-up land(1,258.25 km2), reflecting the continued expansion of built-up land. Additionally, there was an increase in the proportion of waterbody ecosystem area, aligning with the effectiveness of returning cropland to water.
4.2 Spatiotemporal change of ecosystem function
4.2.1 Temporal variation characteristics of vegetation NPP
Figure 3 illustrates the trend in the annual average vegetation NPP within the study area from 2000 to 2020, demonstrating a noticeable upward trajectory (p<0.01). The trend exhibits a rate of 2.96 gC/m2/a and a mean value of 603.47 gC/m2/a for the given study period. This value is comparable to the estimated 2000–2019 vegetation NPP of 566.92 gC/m2/a, as assessed by Yan Yan et al. (2022) utilizing the CASA model. By including the mean NPP value for 2020, the present study’s mean value increased to 625.37 gC/m2/a. The highest value, 658.62 gC/m2/a, was observed in 2015, while the lowest value, 549.97 gC/m2/a, was recorded in 2000, reflecting a variation of 108.65 gC/m2/a. From 2000 to 2015, there was an upward oscillation, whereas from 2015 to 2020, a downward oscillation was observed.
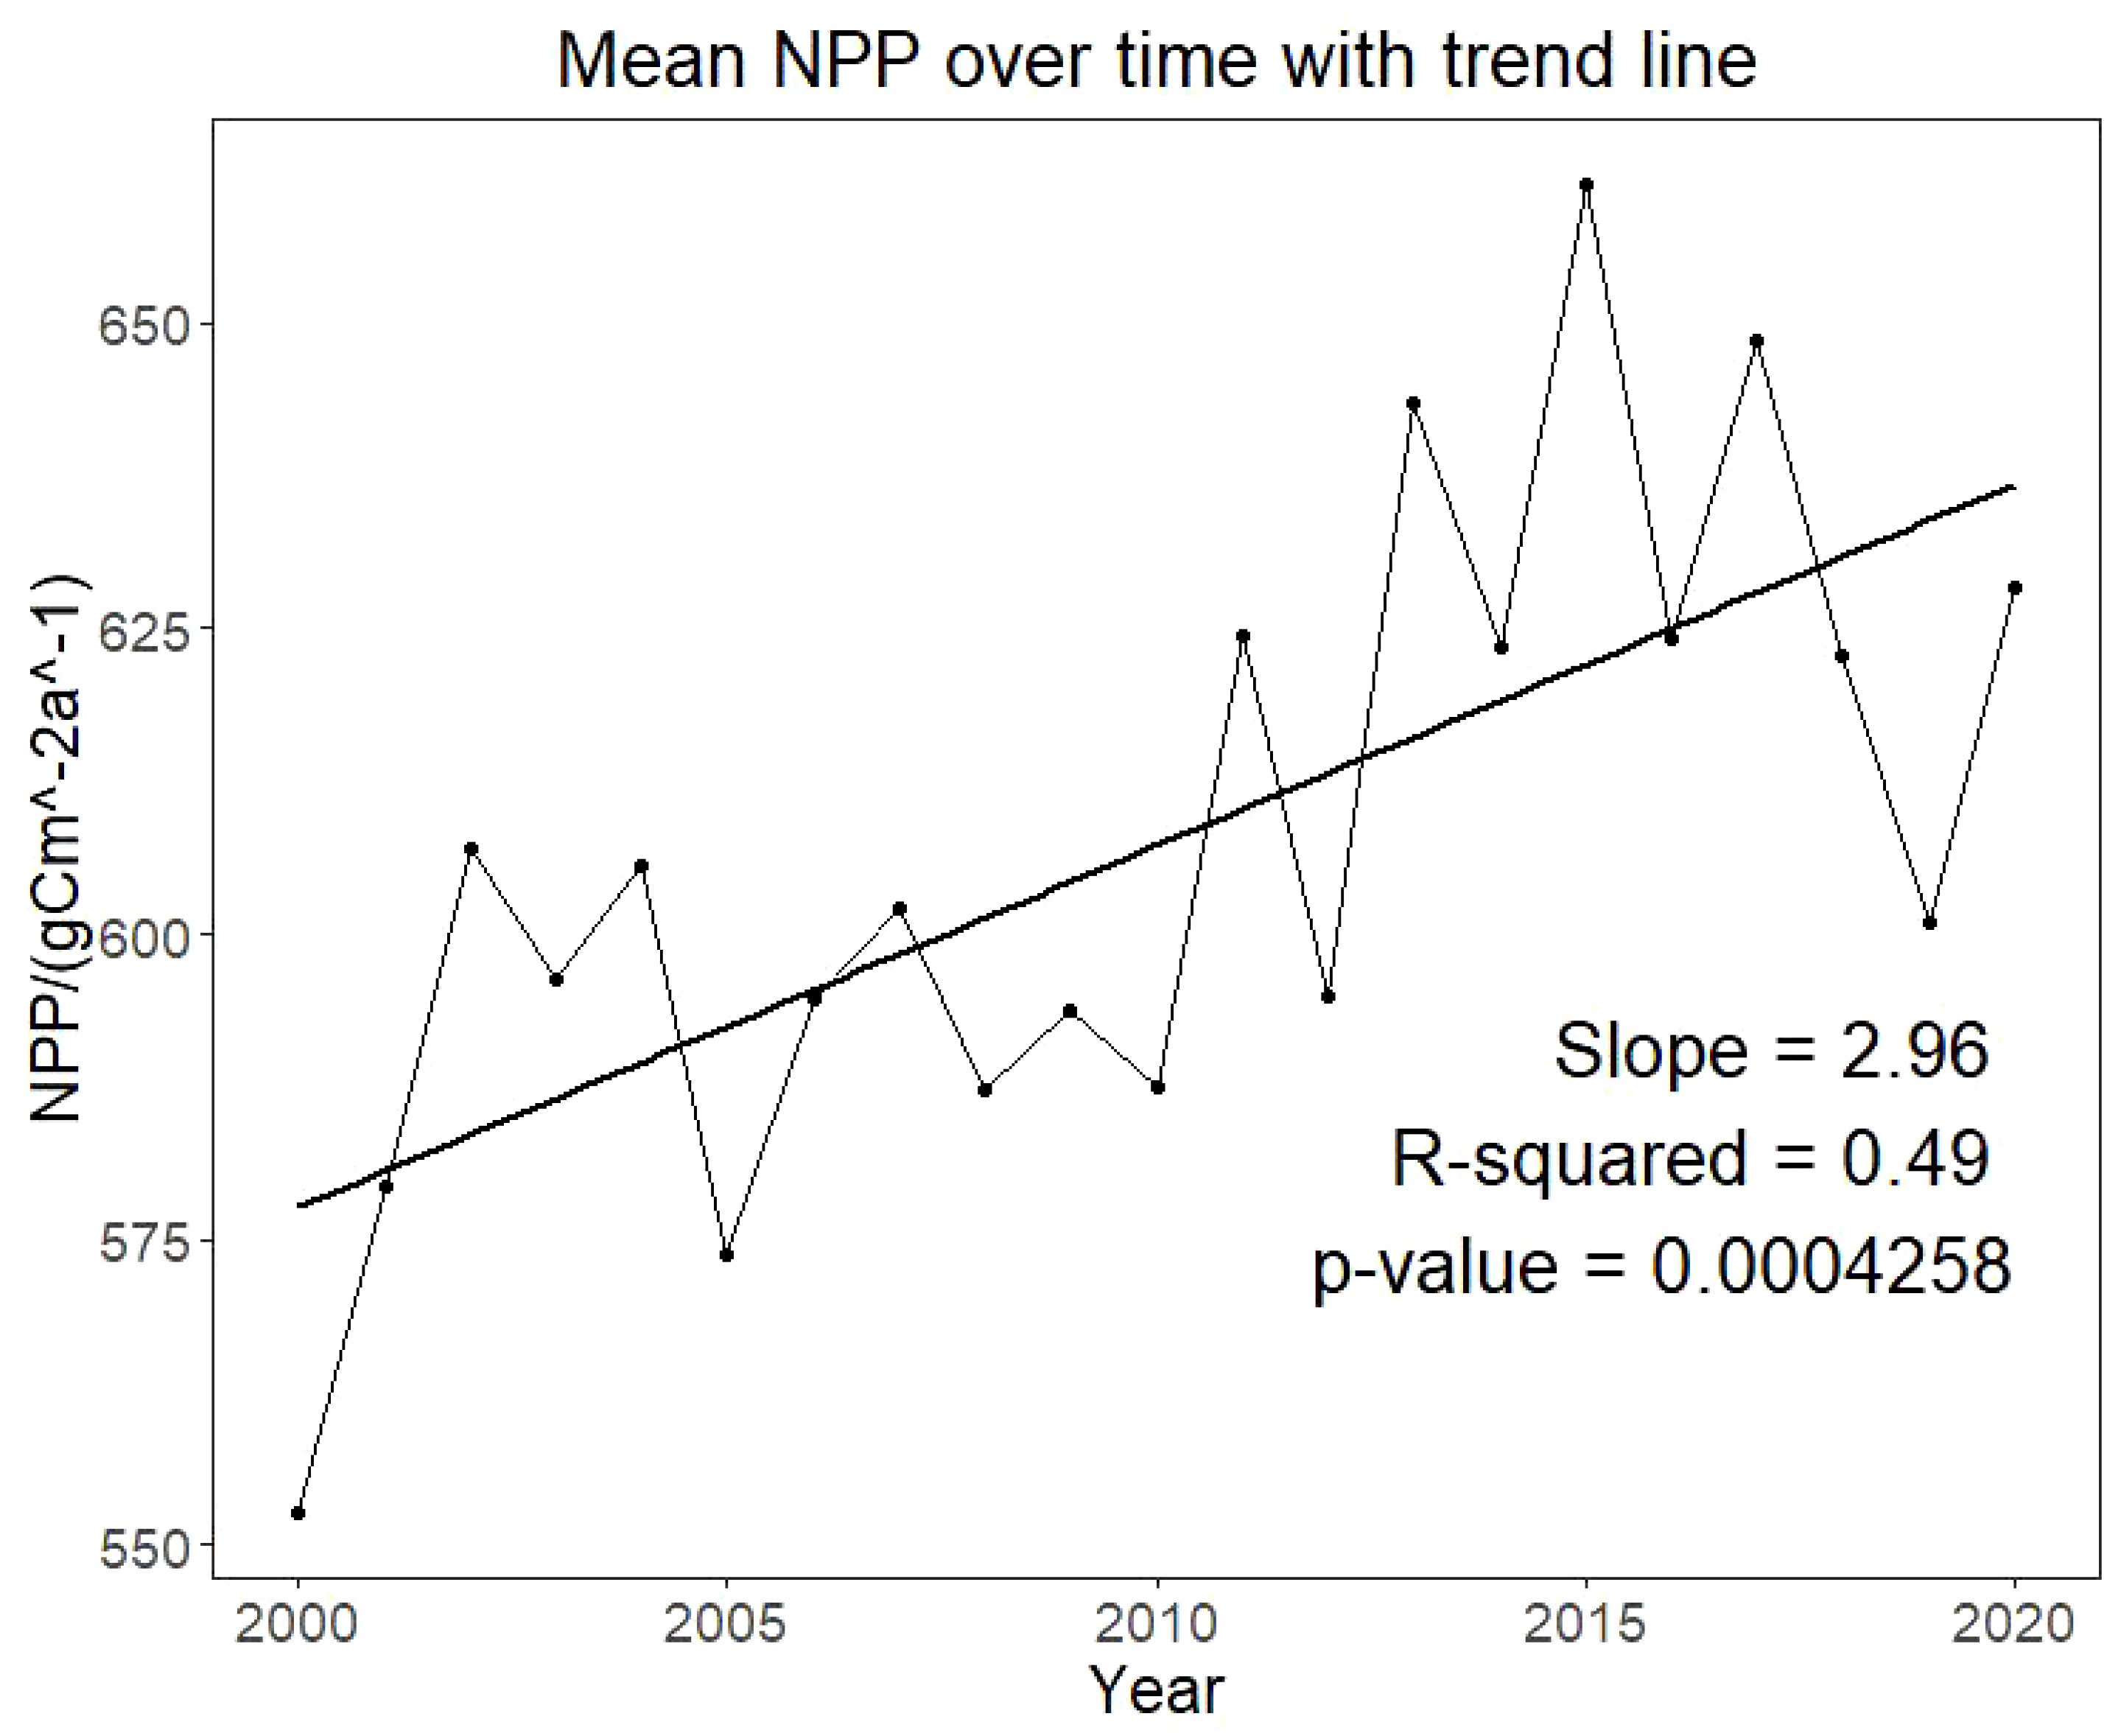
Figure 3 Inter-annual trend of NPP in Hunan Province, 2000–2020.
Figure 4 presents the distribution of the annual average vegetation NPP area share across different classes within the study area from 2000 to 2020. This distribution can be divided into three subperiods based on their change characteristics: (1) The period 2000–2002 represents the growth phase, during which the area with NPP>500 experienced a 15.18% increase. (2) The period from 2003 to 2010 is characterized as the stabilization period, in which the area share of different grades remained within a narrow range. The maximum increase was 5.61%, and the maximum decrease was −5.18%, corresponding to the 400–500 range in 2003–2004 and 2004–2005, respectively. (3) The period from 2011 to 2020 can be viewed as the gearing period, with changes in the share of different grades showing fluctuation and some instability. Notably, the maximum increment of 305.26% and the maximum decrement of −59.42% occurred within the NPP intervals greater than 900 in 2012–2013 and 2013–2014, respectively.

Figure 4 Circumferential stacking of NPP area share in Hunan Province, 2000–2020.
4.2.2 Characteristics of vegetation NPP spatial distribution
The distribution of average vegetation NPP in Hunan Province from 2000 to 2020 (Figure 5) showed distinct characteristics: high along the southeast, even higher in the northwest, lower in the central areas, and further decreased in the northern parts. The southeastern part of the Xiangnan region experienced an average annual NPP exceeding 900 gC/m2/a. In the northwestern part of the Great Xiangxi region, NPP ranged between 600–900 gC/m2/a. The Dongting Lake region’s north-central part and the CZT region’s center had NPP proportions below 500 gC/m2/a. The NPP values notably less than 300 gC/m2/a, mainly distributed around built-up land. From 2000 to 2020, the average vegetation NPP in Hunan Province remained high in the southeast while being lower in the central and northern regions. Throughout this period, the trend of vegetation NPP change in Hunan Province primarily centered around ±12 gC/m2/a. Decreasing NPP trends mainly encompassed the northern part of the Dongting Lake area, the CZT area’s center, the southwestern part of Daxiang, and the southeastern part of the Xiangnan area. This distribution exhibited a side U-shape pattern, covering a total area of 17.60%. In contrast, areas displaying an upward trend accounted for 77.76%, indicating an overall positive annual mean NPP in Hunan Province.
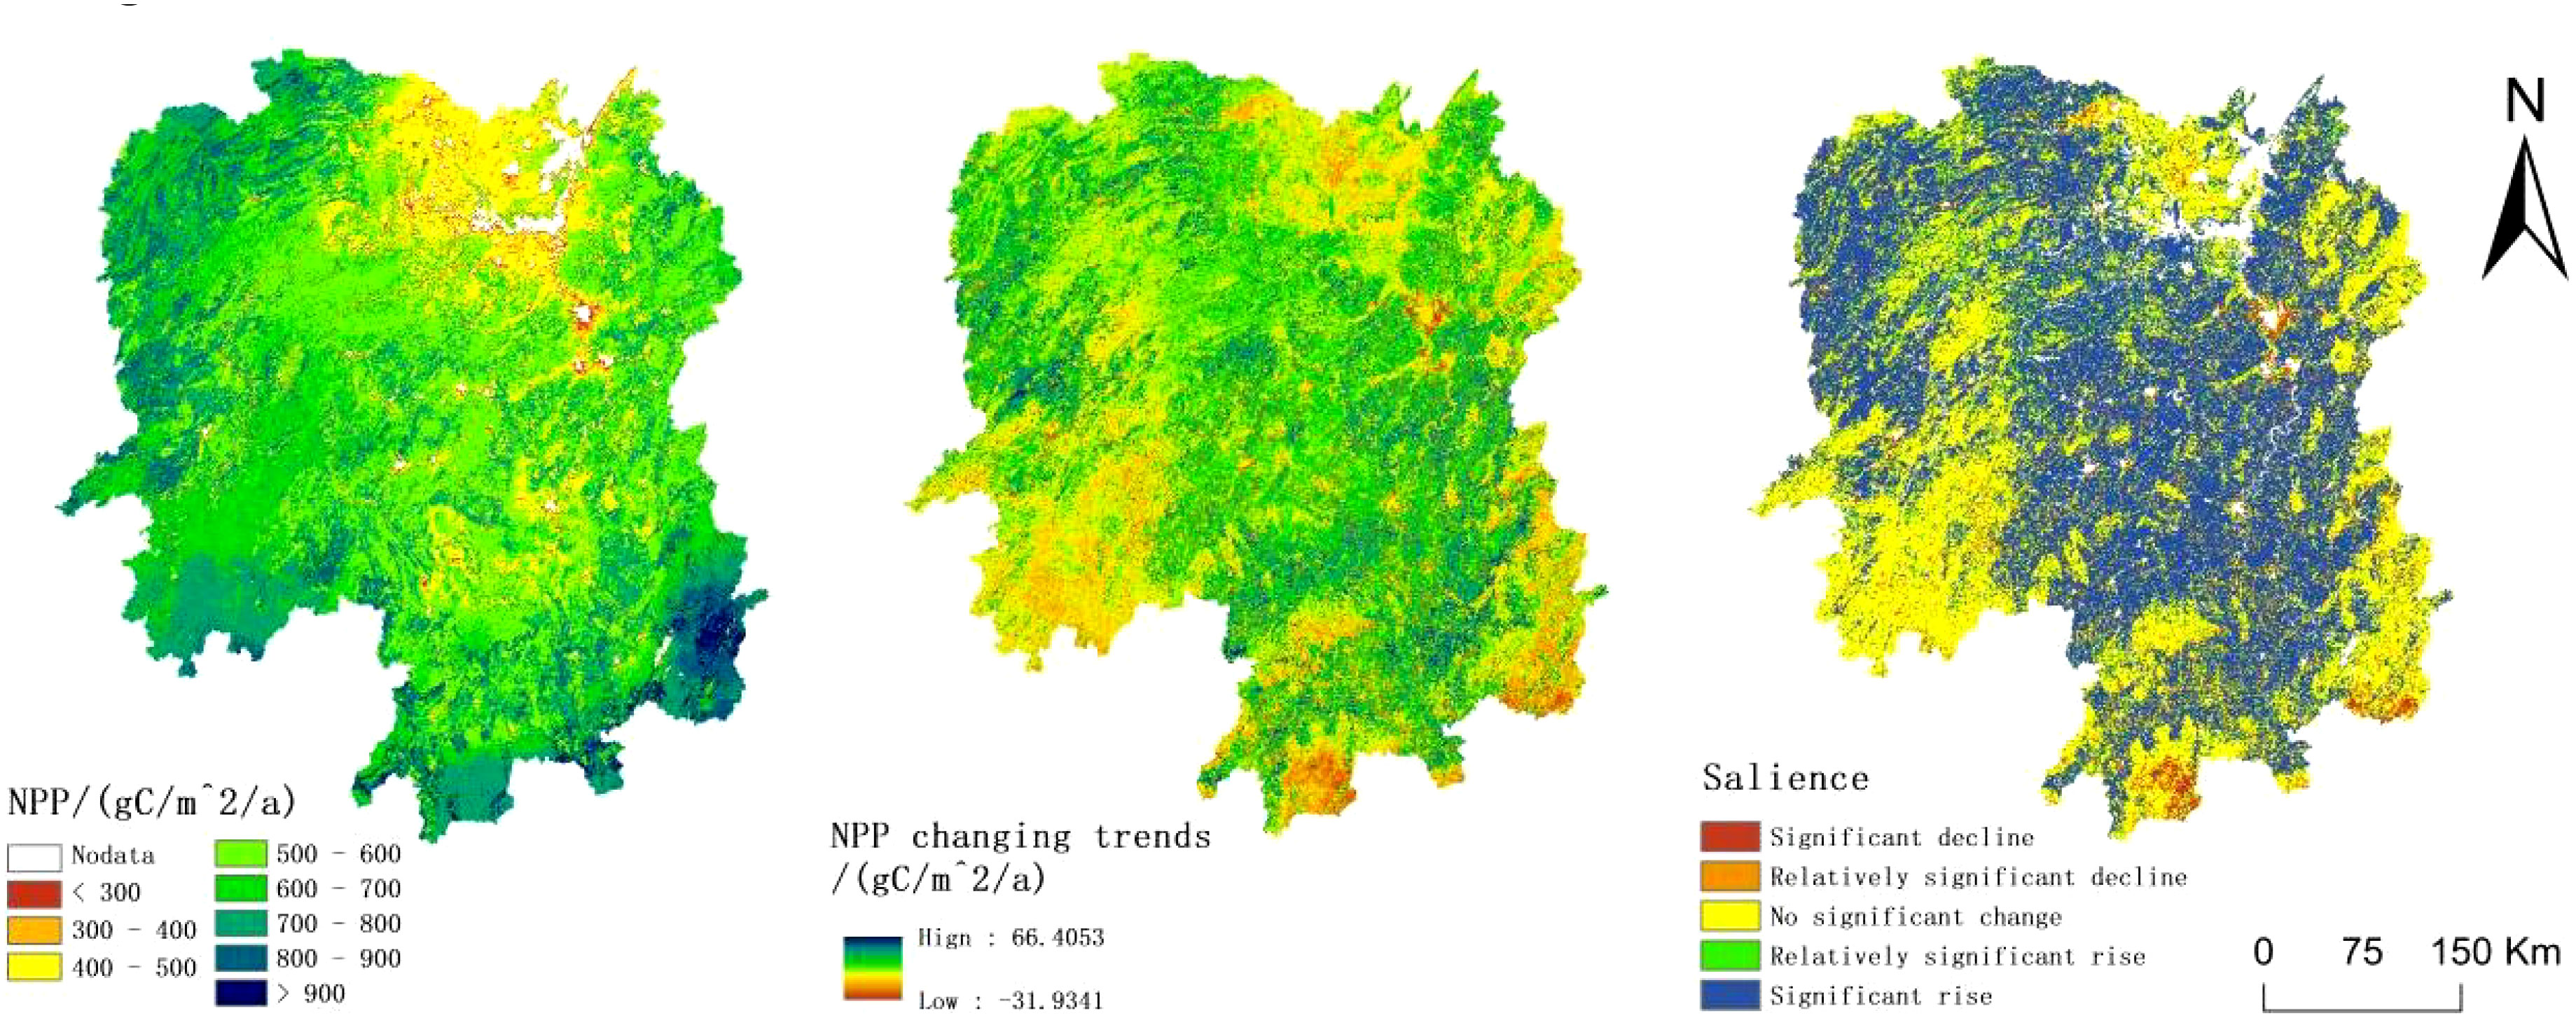
Figure 5 Spatial distribution and variation characteristics of NPP from 2000 to 2020.
Combining the results of the Theil-Sen median trend analysis and Mann-Kendall significance test, and referring to the type classification of Liu G. et al. (2023), vegetation NPP changes in Hunan Province from 2000 to 2020 can be classified into five types: significant increase, relatively significant increase, no significant change, relatively significant decrease, and significant decrease (Liu et al., 2022a). Significantly declining areas accounted for 3.74% of the total area, mainly distributed in the southern Xiangnan region and around the CZT region’s built-up land. The area proportion of regions with an upward trend was 58.54%, indicating a general increase in the average annual NPP over the study period. The area share of the average annual vegetation NPP change rate in Hunan Province from 2000 to 2020, greater than zero, accounted for 74.83%, while the proportion with a change rate below 25% was 4.24%. The downward trend in the NPP change rate corresponded with the main distribution around the Dongting Lake area and the CZT region, encircling built-up land. The southern part of the larger Xiangxi region displayed a less pronounced negative change characteristic.
4.2.3 Spatial and temporal changes in ecosystem services
Table 4 presents the quantities of four distinct types of ecosystem services and their temporal evolution. In Hunan Province, the average values of grain production, carbon storage, habitat quality, and water production services were 452.14 KJ/hm2, 147.59 t/hm2, 0.79, and 940.81mm in 2000, 2010, and 2020, respectively.
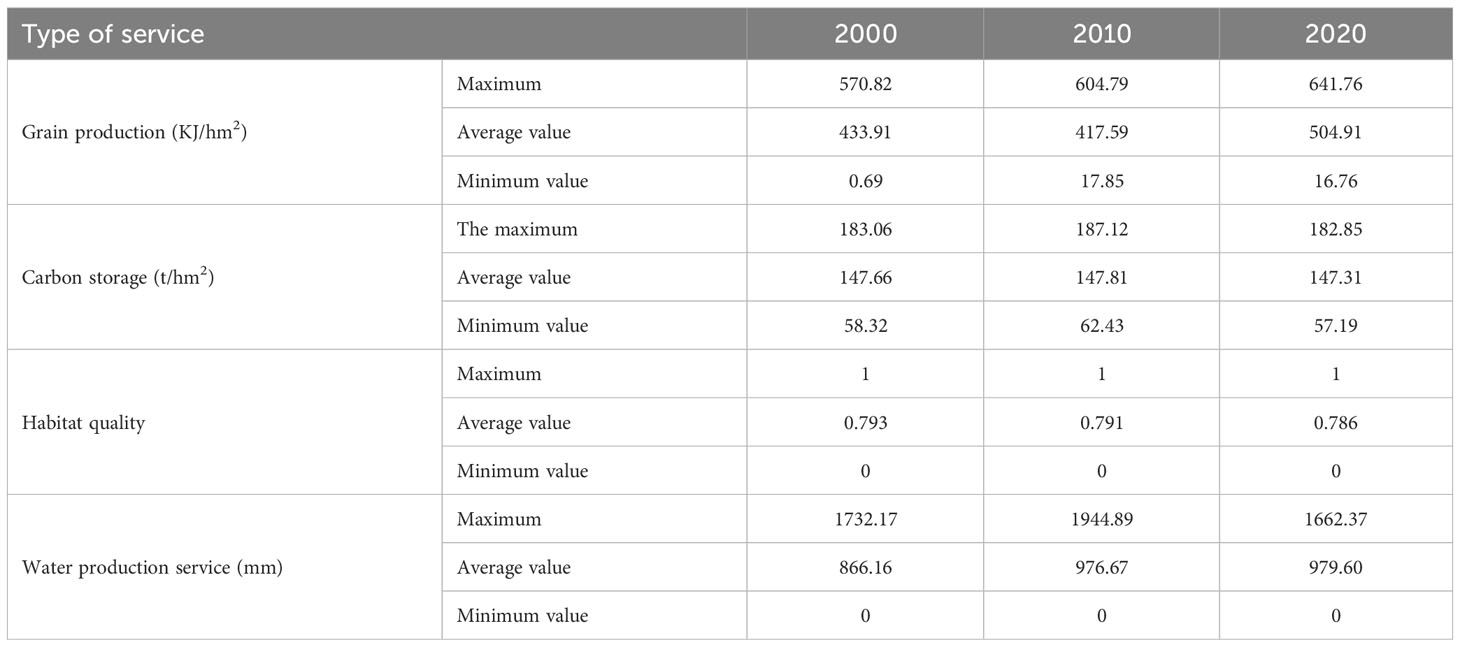
Table 4 Changes in ecosystem services in Hunan Province, 2000–2020.
Over the past two decades, the maximum grain production increased by 70.94 t/hm2, which can be largely attributed to advancements in grain production technology and ongoing improvements in agricultural infrastructure. During this period, both the maximum and minimum values of grain production have shown a steady rise. The province’s average grain production exhibited a pattern of decrease followed by increase, a trend influenced by rapid urbanization occurring between 2000 and 2010, leading to a reduction in Cropland available for grain cultivation. However, with increasing emphasis on Cropland protection, implementation of stringent protection measures, and initiatives such as establishing high-standard basic farmland, the province’s grain output rebounded and improved between 2010 and 2020.
Both carbon stock and habitat quality values underwent marginal changes during the study period. Specifically, habitat quality decreased by 0.007 over two decades, indicating some level of ecological disturbance in Hunan Province due to anthropogenic activities and the development and exploitation of land resources. In comparison, the mean value of the water production service has displayed an annual increase, rising by a total of 113.44 mm.
Figures 6A–L show the marked spatial heterogeneity of ecosystem services across different counties. Between 2000 and 2020, regions with elevated and even higher GP, CS, and HQ were primarily concentrated in the mountainous southwestern Hunan area, encompassing Suining, Xinning, and Chengbu counties. Similar patterns are observed in the western Hunan region, including Yongshun, Sangzhi, and Longshan counties, as well as the hilly southeastern Hunan regions, including Rucheng County, Guidong County, and Zixing City. These areas are characterized by abundant woodland, relatively plentiful water resources, and less human intervention. The coastal regions around Dongting Lake, including Yueyang County, Huarong County, and Yuanjiang City, predominantly exhibit lower values of WY, CS, and HQ. This disparity is attributed to factors such as flat topography, high population density, and significant agricultural activity in these areas, contributing to diminished levels of these three ecosystem services. These challenges are expanding due to ongoing ecosystem disturbance in these regions. Areas demonstrating average performance across the four ecosystem services are primarily located in the central Hunan region, which includes Lianyuan City, Shuangfeng County, and Xiangxiang City.
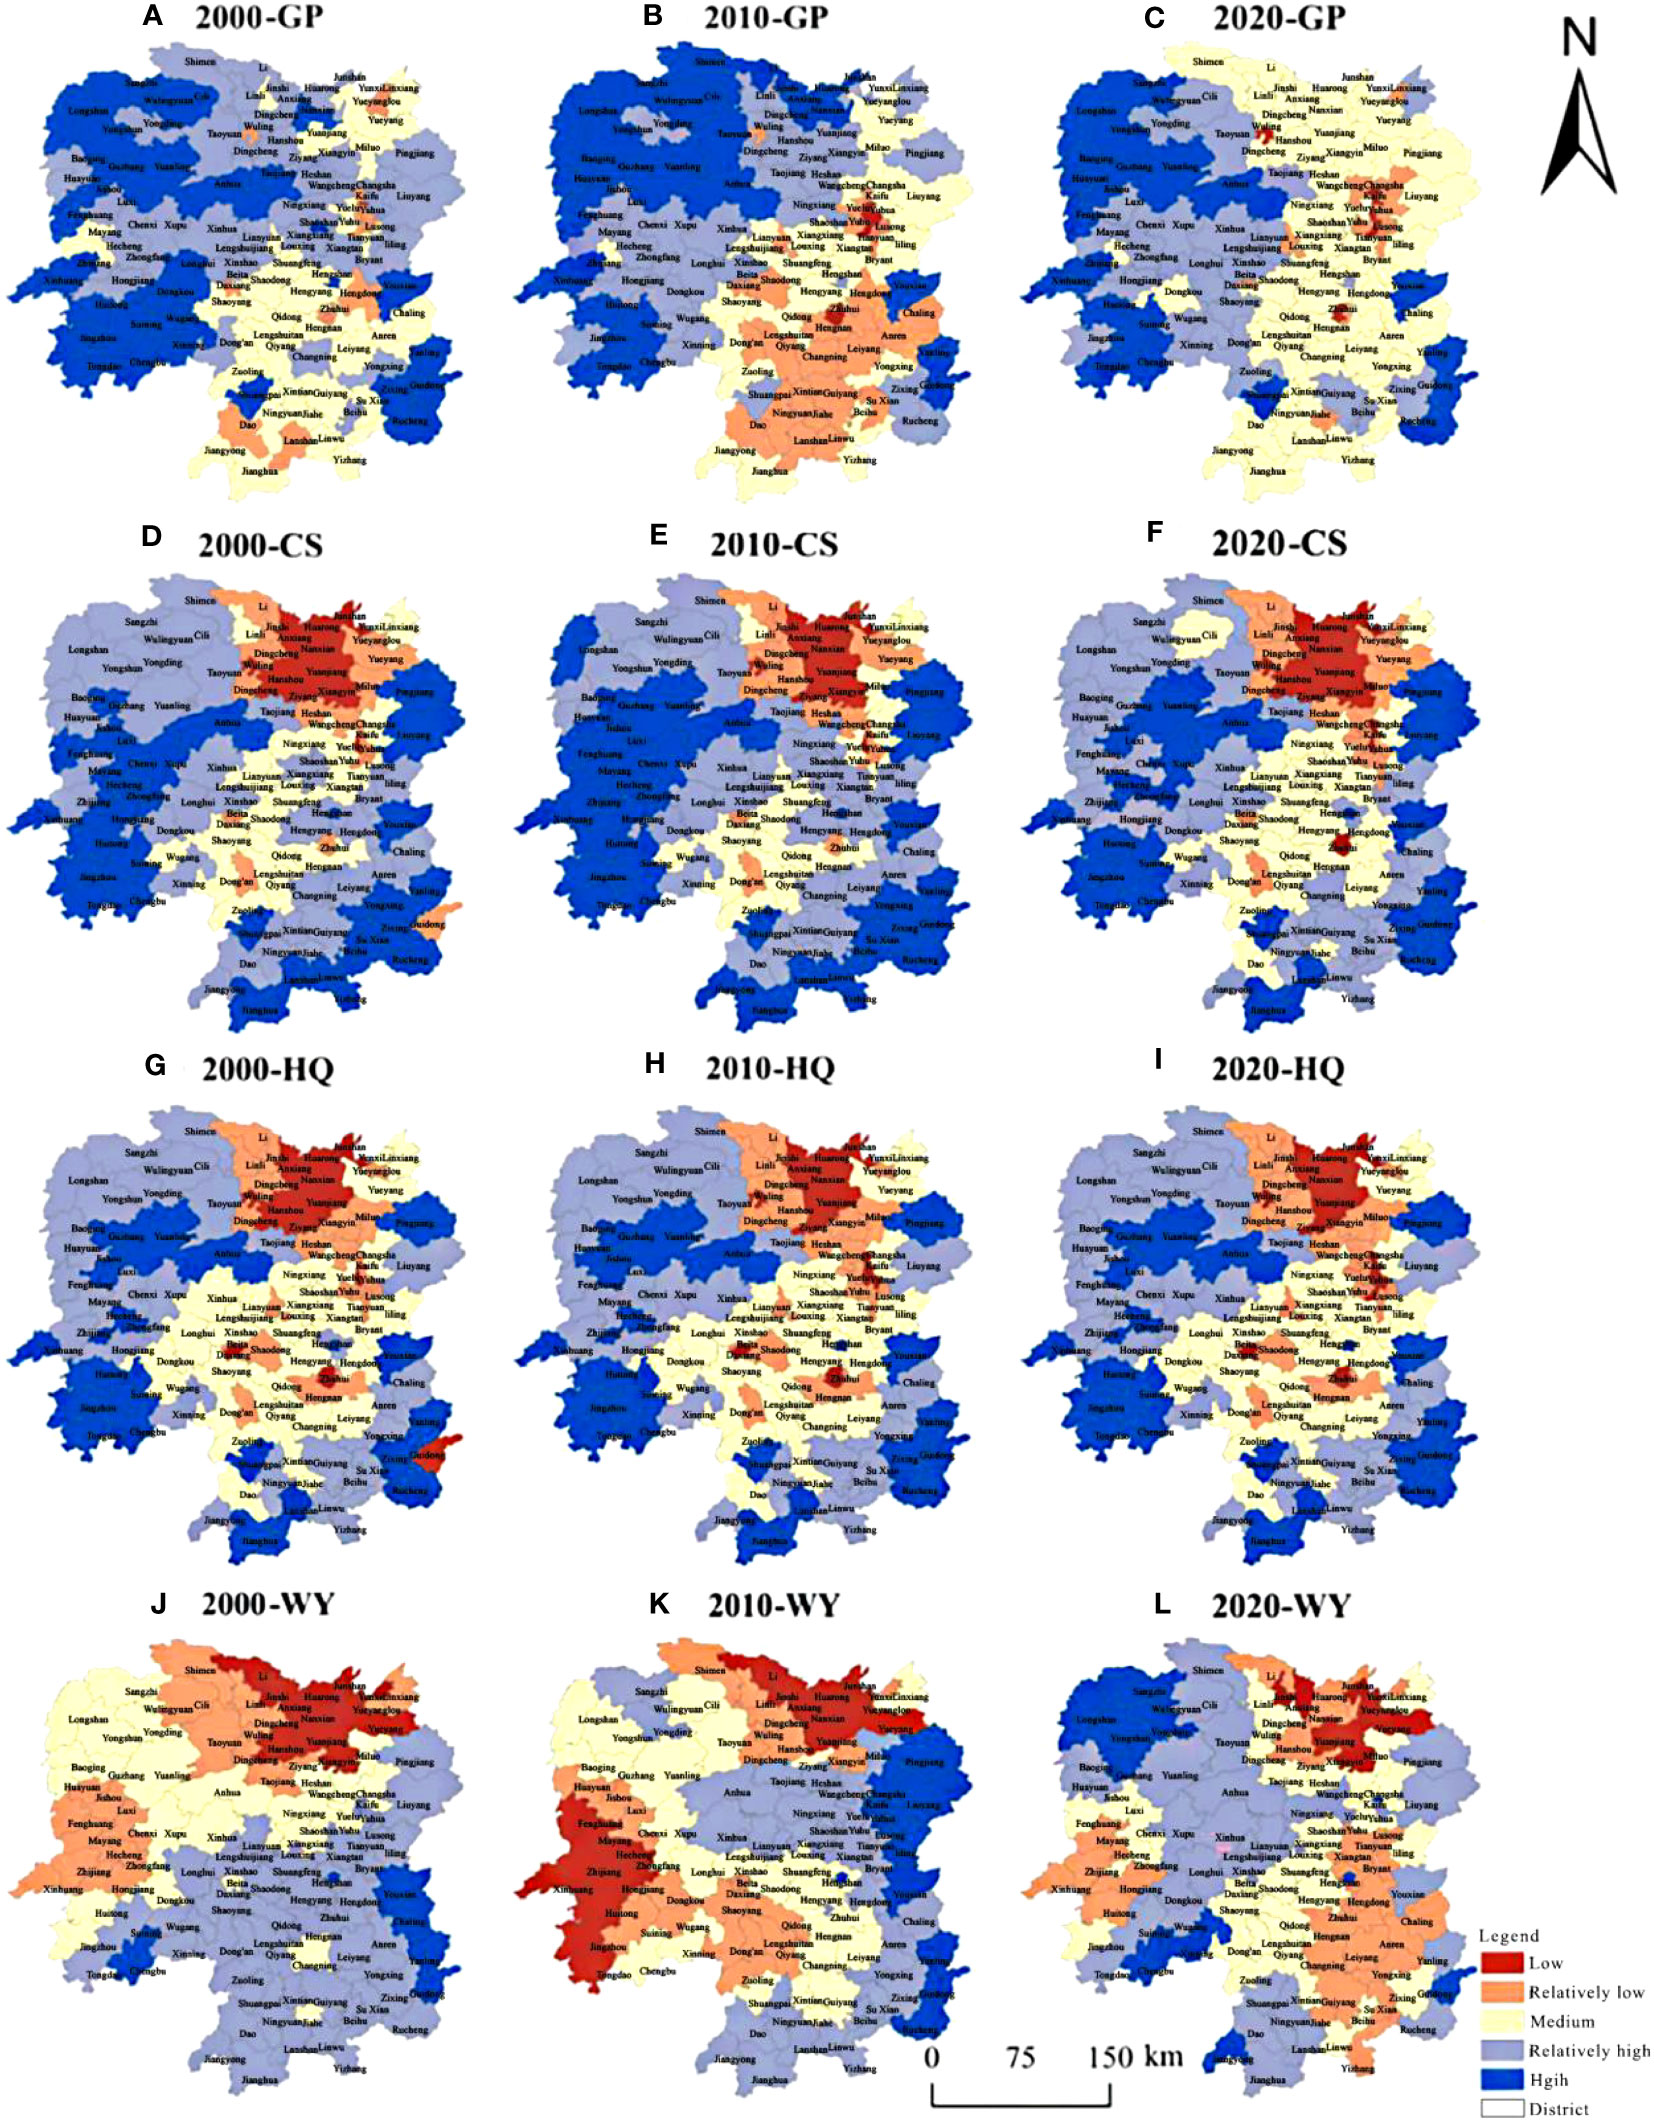
Figure 6 Spatial change of ecosystem services of Hunan Province in 2000-2020. (A–C) GP in 2000, 2010 and 2020, (D–F) CS in 2000, 2010 and 2020, (G–I) HQ in 2000, 2010 and 2020 and (J–L) WY in 2000, 2010 and 2020.
Hunan Province exhibits noticeable latitudinal and vertical heterogeneity in ecosystem services. In general, the capacity for ecosystem services in the hilly and mountainous regions in western and southern Hunan markedly surpassed that of the Dongting Lake Plain area in northern and central Hunan. Moreover, the ecosystem service capacity of the CZT urban agglomeration constituted the ecological weak point of the study area. In terms of the four ecosystem services, GP exhibited a spatial distribution that is higher in the west and lower in the east. The number of counties with average GP values increased, and the spatial distribution of high and higher values gradually shrank to the west and became more compact. CS was mainly affected by the land-use type and the natural environment of the region, demonstrating a spatial pattern with the Dongting Lake area as the core low-value region, expanding irregularly towards the periphery. HQ remained relatively stable during the 20-year period, maintaining a capacity significantly higher than that of the Dongting Lake Plain area and Xiangzhong City Cluster, consistent with that of Cropland and built-up areas in various cities. Given that built-up land can negatively impact HQ significantly, counties with a larger proportion of built-up land tend to have relatively lower HQ values. HQ was concentrated in woodland with excellent ecological environments, while areas with intensive human activities exhibited lower HQ values. In terms of WY, a spatial pattern emerged with higher values in the south and lower values in the north. However, during the study period, WY did not show any noticeable regular geographical changes because it is mostly driven by natural precipitation.
5 Discussion and conclusion
5.1 Discussion
5.1.1 Impact factors of ecological condition change
Ecological condition change drivers include various factors that contribute to shifts in ecosystem utilization, encompassing natural factors, socio-economic dynamics, and policy systems. Natural drivers include climate, geomorphology, and plant succession, while socio-economic drivers include social, economic, and technological variables as well as those that have a direct impact on how regional ecosystems evolve over time (Ji et al., 2020; Hou et al., 2022; Yan et al., 2022; Zhang et al., 2022; Liu S. C., et al., 2023).
Hunan Province experiences a subtropical monsoon climate characterized by abundant sunlight, heat, and precipitation, with simultaneous rain and warmth. The region’s topography is predominantly mountainous and hilly, flanked by mountains on three sides, resulting in elevated terrain in the south and lower elevation in the north. Climatic factors, such as temperature, precipitation, wind speed, and humidity, have a significant influence on the growth conditions of surface vegetation. Therefore, comprehending the impact of natural variables on changes in the land surface ecosystem pattern within the research area is essential. The ecological landscape of Hunan Province has transformed over the the past two decades, spanning from 2000 to 2020, driven by a synergy of natural and anthropogenic forces.
Climatic conditions in the study area are generally favorable, and factors like a suitable temperature and a low wind speed can directly affect the rate of change in both natural and human-influenced vegetation-based ecosystems (Niu and Liu, 2022). In addition, conditions that promote alterations in biodiversity and the extent of soil erosion can indirectly affect ecosystem changes in Hunan Province. In particular, average temperatures remained relatively stable within the study region from 2000 to 2020.
Socio-economic development stands as a pivotal driving factor that influences and changes the pattern of artificial ecosystems. Hunan Province has witnessed rapid socio-economic progress, with a substantial surge in GDP from 369.188 billion yuan in 2000 to 4,178.15 billion yuan in 2020, marking an increase of 1131.7%. Similarly, Hunan’s population has increased considerably. Since 2000, alongside urbanization initiatives, a growing rural population has migrated to urban areas due to increasing settlement needs, particularly for residential land and transportation land. This trend has led to the continual conversion of surrounding Cropland and woodland ecosystem areas into urban infrastructure and residential zones, aligning with the findings of previous analyses (Xu et al., 2023).
Over the past two decades, Hunan Province has experienced significant landscape changes due to the successive implementation of various policies, including the Xiangjiang River Basin and Dongting Lake ecological protection and restoration project, the middle and upper reaches of the Yangtze River protective woodland project, the returning farmland to woodland project, and the pilot project for ecological protection and restoration of mountains, water, forests, fields, lakes, and grasses. Specifically, Cropland ecosystems, which accounted for 29.32% of the province’s land area in 2000, shrank to 29.15% in 2005, 28.36% in 2010, 28.18% in 2015, and 27.93% in 2020, demonstrating a steady decline in Cropland area. About 5319.16 km2 of Cropland was converted into woodland ecosystems, constituting 66.61% of the total transformed area. A smaller portion of Cropland was converted into watersheds. This transformation was primarily influenced by policies promoting the conversion of farmland back into woodland, leading to increased fragmentation of Cropland ecosystems. Over time, the Cropland ecosystems in the study area also displayed a trend toward simplification.
From 2000 to 2020, the comprehensive human disturbance level in Hunan Province experienced fluctuations, initially rising, then declining, and again rising (Table 5), exhibiting an overall upward trajectory and a net change of 0.0027. Specifically, the comprehensive human disturbance index from 2005 to 2010 increased by 0.0112 compared with that from 2000 to 2005. This increase was primarily attributed to the shift of cropland and woodland with lower disturbance levels into colonies with higher disturbance levels (Table 3). The rapid expansion of built-up land drove the augmentation of the composite human disturbance index.

Table 5 Human disturbance index.
Hunan Province initiated the farmland-to-forest project in 2002, which was followed by increased efforts by the national and provincial governments to conserve the environment. Policies encompassing returning farmland to woodland, closing mountains to forests, prohibiting cutting and logging, and reforestation initiatives have yielded significant outcomes. The composite human disturbance index decreased from 2010 to 2015 (Table 3), then again from 2015 to 2020 (Table 4), though at a slower rate than the preceding period, as higher-disturbance Cropland was converted to lower-disturbance wooded area. In 2020, there was a small increase of about 0.0014 compared with 2010–2015. The first period of the study was primarily focused on ecosystem transformation, while the subsequent period witnessed a reduction in the transformation of ecosystems, emphasizing the consolidation of earlier transformation outcomes. As a result, the average value of the comprehensive human disturbance index was higher in the first ten years than in the following decade.
5.1.2 Comprehensive national territory space function partition from the perspective of service clusters
National territory space function partition can guide the balance of supply and demand for social-ecological system services. The foundation of comprehensive zoning lies in delineating urban, ecological, and agricultural zones based on their dominant functions. The integration of main functional domains and social-ecological system components serves as a crucial avenue for achieving multifunctional territorial spatial functional comprehensive zoning (Hu et al., 2022; Qu et al., 2023).
The environmental service clusters in Hunan Province exhibited regional and temporal variations from 2000 to 2020 (Figures 7A–C). Urban functional zones, primarily concentrated in the CZT area and the core regions of rapidly urbanizing cities like Changde Wuling District and Hengyang Steam Xiang District, are primarily used for residential functions. The number of counties (districts) covered increased significantly from 31 to 49 between 2000 and 2020. The CZT urban agglomeration, witnessing continued population concentration, is a prominent region experiencing substantial transformations. In terms of the ecosystem service composition structure, NLs are more prominent, with other services slightly trailing at the mean level. Ecological function areas are mainly located in the mountainous terrains of western and southern Hunan province. These areas boast superior ecological environment quality, high vegetation cover, and better carbon sequestration services. However, due to topographic constraints, the proportion of both NLs and GPs in this region remains quite low.
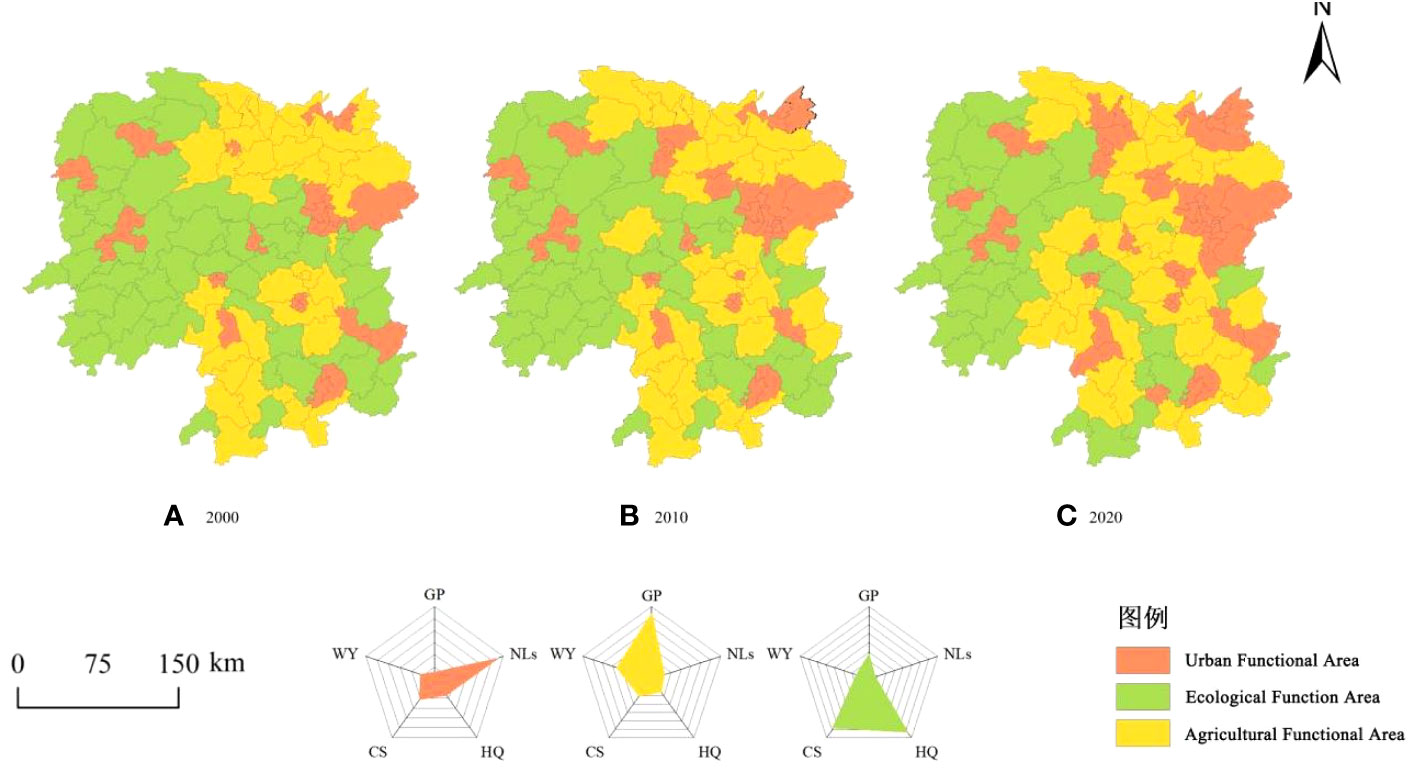
Figure 7 Spatial distribution and composition of ecosystem service clusters, 2000–2020. (A) 2000, (B) 2010 and (C) 2020.
In the overarching framework of ecosystem service composition, CS and HQ services are more prominent, and ecosystem regulating services significantly outweigh provisioning services. However, due to the rapid pace of urbanization, a discernible spatial shift in ecosystem services has occurred from regulating services to provisioning services. Additionally, the extent of ecological functional areas declined between 2000 and 2020. The agricultural functional area is dominated by the production function and is mainly located in Dongting Lake Plain, the near-shore plains of the four watercourses, and tributary water systems. These areas have rich natural resources and favorable geographic conditions, rendering them suitable for agricultural development. They represent the primary food source region in Hunan Province and are characterized by substantial human intervention, frequent agricultural activities, prominent GP, high WY, and good synergistic effects. However, the living and ecological functions within this zone are relatively weak. Overall, the agricultural functional area is in a state of growth.
5.1.3 Limitations
In summary, from a “structure–function” perspective, this paper analyzed the shifts in ecosystem macro-structure, functions, and services and integrated the driving factors of nature, social economy, and policy to explore their influence paths and degrees on structural and functional changes. Subsequently, guided by the service cluster concept, this paper explored the current “structure–function” scenario within territorial spatial comprehensive zoning, discussing potential optimization strategies for future functional zoning. However, there are still several research limitations. First, given the universal applicability of single dominant function zoning and the study’s focus on comprehensive zoning utilizing ecosystem service clusters, it becomes imperative to clarify the relationship and interconnection between dominant and secondary functions within the comprehensive zoning of the national territory space in subsequent studies. This clarification would provide insights into second-level guideline zoning. Second, this study first investigated the path toward second-level zoning, utilizing the spatial distribution of service clusters as the primary guideline and the compositional structure as the second-level guideline. In future studies, it is essential to meticulously refine the evaluation index system of comprehensive zoning to enhance the precision of functional zoning guidance. This refinement will facilitate a deeper exploration of primary functional areas based on “double evaluation” and land spatial planning. As a result, it will facilitate a more comprehensive connection between secondary zoning and planning, guiding the delineation of diverse primary comprehensive functional zones.
5.2 Conclusion
This study focuses on Hunan Province and utilizes land use data from five distinct periods (i.e., 2000, 2005, 2010, 2015, and 2020), we comprehensively analyzed the spatio-temporal characteristics of ecosystems and their directional shifts within the province. This analysis was accomplished using the transfer matrix, land use dynamics, human disturbance index, and ecosystem service clusters. Additionally, we explored the synergistic benefits of ecosystem services. The main results of the study are as follows:
(1) The ecosystem structure of Hunan Province has undergone substantial transformations from 2000 to 2020. Macro-structural changes were concentrated in the ecosystems of built-up land and Croplands. The area occupied by built-up land has increased significantly, while Cropland has experienced a marked decrease, steadily converting into built-up land. Therefore, to maintain the ecological stability of the province, a more cautious approach to growth should be adopted, with a focus on containing expansion within core areas and prioritizing the protection of regions that provide crucial ecological functions.
(2) Human socio-economic activities and environmental protection policies exert a significant impact on the ecosystem configuration within the study area. The urban periphery’s Croplands are gradually yielding to the expanding city limits, caused mainly by the construction of residences, public infrastructure, and road networks, among others. Consequently, Croplands with lower disturbance levels are being transformed into areas with higher disturbance levels, leading to significant shifts in the ecosystem layout.
(3) The functional areas of towns and cities have steadily expanded, while the capacity of ecological functions within the ecological space has gradually contracted. During this period, the zones with significantly decreasing NPP change trends in Hunan Province experienced a U-shape distribution, with woodland ecosystems being prevalent. With the rapid development of society and economy, people are increasingly pursuing high-quality ecosystems that cater to recreational and cultural needs. However, ecosystems in closer proximity to areas of human production and habitation have experienced weakened capabilities in providing essential functions, primarily due to the continuous expansion of construction land.
(4) The overall trend of ecosystem service changes is favorable. Quantitatively, GP and CS experienced initial increases followed by declines, while HQ showed a gradual decline, and WY increased year by year. Spatially, these changes exhibited pronounced heterogeneity, marked by both latitudinal and vertical variations. Ecological functional zones were primarily designated for ecological functions, with a majority situated in the mountainous areas of western and southern Hunan. Agricultural functional zones were mainly designated for production functions, located mainly in the plains of Dongting Lake and the nearby plains of the four main streams of the Xiangzhi Yuanli water systems, along with their tributaries. The agricultural functional areas were primarily situated in the plains of Dongting Lake, as well as along the main streams and tributaries of the Xiangzhi Yuan and Li Rivers.
Data availability statement
The original contributions presented in the study are included in the article/supplementary material. Further inquiries can be directed to the corresponding author.
Author contributions
PL: Conceptualization, Formal analysis, Software, Supervision, Writing – original draft, Writing – review and editing. YL: Data curation, Formal analysis, Methodology, Writing – original draft. CH: Data curation, Formal analysis, Methodology, Software, Writing – original draft. LY: Data curation, Supervision, Writing – original draft. LX: Conceptualization, Resources, Validation, Writing – original draft.
Funding
The author(s) declare financial support was received for the research, authorship, and/or publication of this article. This paper was supported by the Research Foundation of the Department of Natural Resources of Hunan Province, China (2022-49), Hunan Province social Science Fund project (21YBA245) and the Open Topic of Key Laboratory of Natural Resources Monitoring and Supervision in Southern Hilly Region, Ministry of Natural Resources, China, (NRMSSHR2022Z06).
Conflict of interest
The authors declare that the research was conducted in the absence of any commercial or financial relationships that could be construed as a potential conflict of interest.
Publisher’s note
All claims expressed in this article are solely those of the authors and do not necessarily represent those of their affiliated organizations, or those of the publisher, the editors and the reviewers. Any product that may be evaluated in this article, or claim that may be made by its manufacturer, is not guaranteed or endorsed by the publisher.
References
Chen L.-C., Guan X., Li H.-M., Wang Q.-K., Zhang W.-D., Yang Q.-P., et al. (2019). Spatiotemporal patterns of carbon storage in forest ecosystems in Hunan Province, China. For. Ecol. Management 432, 656–666. doi: 10.1016/j.foreco.2018.09.059
Chen J., Qi Q., Wang B., He S., Li Z., Wang L., et al. (2023). Response of ecosystem services to landscape patterns under socio-economic-natural factor zoning: A case study of Hubei Province, China. Ecol. Indicators 153, 110417. doi: 10.1016/j.ecolind.2023.110417
Dan Y. Z., Peng J., Zhang Z. M., Xu Z. H., Mao Q., Dong J. Q. (2020). Territorially ecological restoration zoning based on the framework of degradation pressure, supply state and restoration potential: a case study in the Pearl River Delta region. J. Ecology 23, 8451–8460. doi: 10.5846/stxb202004240982
Di Febbraro M., Sallustio L., Vizzarri M., De Rosa D., De Lisio L., Loy A., et al. (2018). Expert-based and correlative models to map habitat quality: Which gives better support to conservation planning? Global Ecol. Conserv. 16, e00513. doi: 10.1016/j.gecco.2018.e00513
He Y. L., You N. S., Cui Y. P., Xiao T., Hao Y. Y., Dong J. W. (2021). Spatio-temporal changes in remote sensing-based ecological index in China since 2000. J. Natural Resources. 05, 1176–1185. doi: 10.31497/zrzyxb.20210507
Hou J., Wang J. W., Qin T. L., Liu S. S., Zhang X., Yan S., et al. (2022). Attribution identification of terrestrial ecosystem evolution in the Yellow River Basin. Open Geosciences 14, 615–628. doi: 10.1515/geo-2022-0385
Hou P., Wang Q., Shen W., Zhai J., Liu H., Yang M. (2015). Progress of integrated ecosystem assessment: Concept, framework and challenges. Geogr. Res. 10, 1809–1823. doi: 10.11821/dlyj201510001
Hu Q., Shen W., Zhang Z. (2023). How does urbanisation affect the evolution of territorial space composite function? Appl. Geography 155, 102976. doi: 10.1016/j.apgeog.2023.102976
Hu Q., Zhang Z., Niu L. (2022). Identification and evolution of territorial space from the perspective of composite functions. Habitat Int. 128, 102662. doi: 10.1016/j.habitatint.2022.102662
Ji Z. X., Xu Y. Q., Wei H. J. (2020). Identifying dynamic changes in ecosystem services supply and demand for urban sustainability: insights from a rapidly urbanizing city in central China. Sustainability 12, 1-23. doi: 10.3390/su12083428
Li B., Chen D., Wu S., Zhou S., Wang T., Chen H. (2016). Spatio-temporal assessment of urbanization impacts on ecosystem services: Case study of Nanjing City, China. Ecol. Indicators 71, 416–427. doi: 10.1016/j.ecolind.2016.07.017
Li T., Zhang Q., Wang G., Singh V. P., Zhao J., Sun S., et al. (2023). Ecological degradation in the Inner Mongolia reach of the Yellow River Basin, China: Spatiotemporal patterns and driving factors. Ecol. Indicators 154, 110498. doi: 10.1016/j.ecolind.2023.110498
Liu Z., Huang Q., Zhou Y., Sun X. (2022b). Spatial identification of restored priority areas based on ecosystem service bundles and urbanization effects in a megalopolis area. J. Environ. Management 308, 114627. doi: 10.1016/j.jenvman.2022.114627
Liu B., Pan L. B., Qi Y., Guan X., Li J. S. (2021). Land use and land cover change in the yellow river basin from 1980 to 2015 and its impact on the ecosystem services. Land 10, 1-11. doi: 10.3390/land10101080
Liu G. B., Shao Q. Q., Fan J. W., Ning J., Rong K., Huang H. B., et al. (2023). Spatiotemporal evolution and driving forces of ecosystem service value and ecological risk in the Ulan Buh Desert. Front. Environ. Sci. 10. doi: 10.3389/fenvs.2022.1053797
Liu S. C., Shao Q. Q., Niu L. N., Ning J., Liu G. B., Zhang X. Y. (2023). Changes of ecological and the characteristics of trade-offs and synergies of ecosystem services in the upper reaches of the Yangtze River. J. Ecology 03, 1028–1039. doi: 10.5846/stxb202110092798
Liu S., Wang Z., Wu W., Yu L. (2022a). Effects of landscape pattern change on ecosystem services and its interactions in karst cities: A case study of Guiyang City in China. Ecol. Indicators 145, 109646. doi: 10.1016/j.ecolind.2022.109646
Ma S., Wang L.-J., Zhu D., Zhang J. (2021). Spatiotemporal changes in ecosystem services in the conservation priorities of the southern hill and mountain belt, China. Ecol. Indicators 122, 107225. doi: 10.1016/j.ecolind.2020.107225
Migliavacca M., Musavi T., Mahecha M. D., Nelson J. A., Knauer J., Baldocchi D. D., et al. (2021). The three major axes of terrestrial ecosystem function. Nature 598, 468–472. doi: 10.1038/s41586-021-03939-9
Natural Capital Project (2023) InVEST 3.13.0. Stanford university, University of Minnesota, Chinese Academy of Sciences, The Nature Conservancy, World Wildlife Fund, Stockholm Resilience Centre and the Royal Swedish Academy of Sciences. Available at: https://naturalcapitalproject.stanford.edu/software/invest.
Ning L. X., Liang X. Y., Cheng C. X. (2021). Spatiotemporal variations of ecosystem health of Jing-Jin-Ji region based on the PSR model. Ecol. Science 06, 1–12. doi: 10.14108/j.cnki.1008-8873.2021.06.001
Niu X. Y., Liu L. A. (2022). Change trend and restoration potential of vegetation net primary productivity in China over the past 20 years. Remote Sens. 14, 1-26. doi: 10.3390/rs14071634
Niu G. Y., Wang G. L., Lu Q. C., Xiong C. H. (2022). Function evaluation and optimal strategies of three types of space in cross-provincial areas from the perspective of high-quality development: A case study of yangtze river delta, China. Polish J. Environ. Stud. 31, 2763–2777. doi: 10.15244/pjoes/144910
Ouyang X., Wei X., Wei G., Wang K. (2023). The expansion efficiency of urban land in China’s urban agglomerations and its impact on ecosystem services. Habitat Int. 141, 102944. doi: 10.1016/j.habitatint.2023.102944
Ouyang X., Zhu X. (2020). Spatio-temporal characteristics of urban land expansion in Chinese urban agglomerations. J. Geography 03, 571–588. doi: 10.11821/dlxb202003010
Pan Y., Zheng H., Yi Q. T., Li R. N. (2021). The change and driving factors of ecosystem service bundles: A case study of Daqing River Basin. J. Ecology 13, 5204–5213. doi: 10.5846/stxb202103100650
Peng J., Liu Y., Liu Z., Yang Y. (2017). Mapping spatial non-stationarity of human-natural factors associated with agricultural landscape multifunctionality in Beijing-Tianjin-Hebei region, China. Agriculture Ecosyst. Environment 246, 221–233. doi: 10.1016/j.agee.2017.06.007
Qiu Y., Zhou A., Li M., Guo Y., Hao C., Ma C. (2023). Territorial spatial usage regulation based on resources endowment and sustainable development: A case of Wuhan, China. J. Cleaner Production 385, 135771. doi: 10.1016/j.jclepro.2022.135771
Qu Y., Dong X., Su D., Jiang G., Ma W. (2023). How to balance protection and development? A comprehensive analysis framework for territorial space utilization scale, function and pattern. J. Environ. Management 339, 117809. doi: 10.1016/j.jenvman.2023.117809
Shi P. J., Chen J., Pan Y. Z. (2000). Landuse change mechanism in shenzhen city. J. Geography 02, 151–160. doi: 10.11821/xb200002003
Shi J., Li S., Song Y., Zhou N., Guo K., Bai J. (2022). How socioeconomic factors affect ecosystem service value: Evidence from China. Ecol. Indicators 145, 109589. doi: 10.1016/j.ecolind.2022.109589
Wan H., Xie Y., Li B., Cai Y., Yang Z. (2023). An integrated method to identify and evaluate the impact of hydropower development on terrestrial ecosystem. Environ. Impact Assess. Review. 99, 107042. doi: 10.1016/j.eiar.2023.107042
Wei G., Bi M., Liu X., Zhang Z., He B. (2023a). Investigating the impact of multi-dimensional urbanization and FDI on carbon emissions in the belt and road initiative region: Direct and spillover effects. J. Cleaner Production 384, 135608. doi: 10.1016/j.jclepro.2022.135608
Wei G., He B., Sun P., Liu Y., Li R., Ouyang X., et al. (2023b). Evolutionary trends of urban expansion and its sustainable development: Evidence from 80 representative cities in the belt and road initiative region. Cities 138, 104353. doi: 10.1016/j.cities.2023.104353
Wu Y. Z., Shi K. F., Chen Z. Q., Liu S. R., Chang Z. J. (2022). Developing improved time-series DMSP-OLS-like data, (19922019) in China by integrating DMSP-OLS and SNPP-VIIRS. IEEE Trans. Geosci. Remote Sens. 60, 1-14. doi: 10.1109/TGRS.2021.3135333
Wu D., Zou C. X., Lin N. F., Xu M. J. (2018). Characteristic analysis of ecological status in the yangtze River economic belt based on the plan for major function-oriented zones. Yangtze River Basin Resour. Environment 08, 1676–1682. doi: 10.11870/cjlyzyyhj201808003
Xia H., Yuan S., Prishchepov A. V. (2023). Spatial-temporal heterogeneity of ecosystem service interactions and their social-ecological drivers: Implications for spatial planning and management. Resources Conserv. Recycling. 189, 106767. doi: 10.1016/j.resconrec.2022.106767
Xiong Y., Sun W. J., Wei X., He J. X., Zhao D. D., Sun B., et al. (2020). Cooperative development model of ecosystem services and rural communities in hilly-mountain of Southern China: a case study of eight villages in Lechang, Guandong Province. J. Ecology 18, 6505–6521. doi: 10.5846/stxb201911142420
Xu X. L., Liu J. Y., Shao Q. Q., Fan J. W. (2008). The dynamic changes of ecosystem spatial pattern and structure in the Three-River Headwaters region in Qinghai Province during recent 30 years. Geogr. Res. 04, 829–838 + 974. doi: 10.11821/yj2008040011
Xu Z., Peng J., Liu Y., Qiu S., Zhang H., Dong J. (2023). Exploring the combined impact of ecosystem services and urbanization on SDGs realization. Appl. Geogr. 153, 102907. doi: 10.1016/j.apgeog.2023.102907
Xu Y., Yang F., Yan C. Z. (2020). Ecological health assessment of urban wetland in Xiong’an based on landscape pattern. J. Ecology 20, 7132–7142. doi: 10.5846/stxb201912202744
Yan X. L., Li X. Y., Liu C. H., Li J. W., Zhong J. Q. (2022). Scales and historical evolution: methods to reveal the relationships between ecosystem service bundles and socio-ecological drivers-A case study of dalian city, China. Int. J. Environ. Res. Public Health 19, 1-20. doi: 10.3390/ijerph191811766
Zhang C. Y., Bai Y. P., Yang X. D., Li L. W., Liang J. S., Wang Q., et al. (2021). Identification of ecosystem service bundles in Ningxia Plain under multi-scenario simulation. Geogr. Res. 12, 3364–3382. doi: 10.11821/dlyj020220289
Zhang D., Huang Q., He C., Wu J. (2017). Impacts of urban expansion on ecosystem services in the Beijing-Tianjin-Hebei urban agglomeration, China: A scenario analysis based on the Shared Socioeconomic Pathways. Resources Conserv. Recycling. 125, 115–130. doi: 10.1016/j.resconrec.2017.06.003
Zhang J. F., Liu C. Y., Chang F. (2019). A new approach for multifunctional zoning of territorial space: the panxi area of the upper yangtze river in China case study. Sustainability 11, 1-19. doi: 10.3390/su11082325
Zhang T. J., Zhang S. P., Cao Q., Wang H. Y., Li Y. L. (2022). The spatiotemporal dynamics of ecosystem services bundles and the social-economic-ecological drivers in the Yellow River Delta region. Ecol. Indic. 135, 1-14. doi: 10.1016/j.ecolind.2022.108573
Zhang Y., Zheng M., Qin B. (2023). Optimization of spatial layout based on ESV-FLUS model from the perspective of “Production-Living-Ecological”: A case study of Wuhan City. Ecol. Modelling. 481, 110356. doi: 10.1016/j.ecolmodel.2023.110356
Zhao Y., Wang M., Lan T., Xu Z., Wu J., Liu Q., et al. (2023). Distinguishing the effects of land use policies on ecosystem services and their trade-offs based on multi-scenario simulations. Appl. Geogr. 151, 102864. doi: 10.1016/j.apgeog.2022.102864
Zheng H., Xu Z., Hu T., Cheng X., Xia P., Peng J. (2023). A wavelet coherence approach to zoning supply-demand matching of carbon sequestration service. Sci. Total Environ. 901, 165641. doi: 10.1016/j.scitotenv.2023.165641
Zhou H., Jin P., Xia W. S. (2020). Functional zoning of territorial space in provincial level based on the production-living-ecological functions: A case of henan province. China Land Science 08, 10–17. doi: 10.11994/zgtdkx.20200731.164624
Zhou Z., Sun X., Zhang X., Wang Y. (2022). Inter-regional ecological compensation in the Yellow River Basin based on the value of ecosystem services. J. Environ. Management 322, 116073. doi: 10.1016/j.jenvman.2022.116073
Zhu C. M., Yang L. X., Xu Q. Y., Fu J. W., Lin Y., Sun L., et al. (2022). A comparative analysis of farmland occupation by urban sprawl and rural settlement expansion in China. Land 11, 1-16. doi: 10.3390/land11101738
Zhu C. X., Zhong S. Z., Long Y., Yan D. (2023). Spatiotemporal variation of ecosystem services and their drivers in the Yellow River Basin, China. J. Ecol. 1-15, 2502-2513. doi: 10.13292/j.1000-4890.202310.005
Keywords: southern hilly region, structure and function, ecosystem service clusters, national territory space function, ecosystem pattern transfer
Citation: Li P, Liao Y, Huang C, Yi L and Xie L (2023) Evolution and zoning of spatial ecosystem functional stability in the southern hilly region of China: a “structure–function” perspective. Front. Ecol. Evol. 11:1319815. doi: 10.3389/fevo.2023.1319815
Received: 11 October 2023; Accepted: 10 November 2023;
Published: 18 December 2023.
Edited by:
Xue-Chao Wang, Beijing Normal University, ChinaCopyright © 2023 Li, Liao, Huang, Yi and Xie. This is an open-access article distributed under the terms of the Creative Commons Attribution License (CC BY). The use, distribution or reproduction in other forums is permitted, provided the original author(s) and the copyright owner(s) are credited and that the original publication in this journal is cited, in accordance with accepted academic practice. No use, distribution or reproduction is permitted which does not comply with these terms.
*Correspondence: Linglin Xie, eGxsQGltZy5uZXQ=