 Shiyao Liu
 Zhijian Gao2†
 Wanghai Tao
94% of researchers rate our articles as excellent or good
Learn more about the work of our research integrity team to safeguard the quality of each article we publish.
Find out more
ORIGINAL RESEARCH article
Front. Ecol. Evol., 09 January 2024
Sec. Urban Ecology
Volume 11 - 2023 | https://doi.org/10.3389/fevo.2023.1307274
Introduction: Arid and semi-arid regions encompass nearly 40% of the Earth’s land surface and are characterized by extensive undeveloped land, scarce water resources, and fragile ecosystems. The arid northwestern China is a representative arid and semi-arid region. It has developed rapidly in recent years, leading to a significant increase in human activity. This increased activity has had a pronounced impact on the ecosystem, posing a major challenge to the environment. The close relationship between human activities and ecosystem service value (ESV) is crucial for the healthy development of both humans and ecosystems. However, the intricate nature of this relationship and the degree to which they are codependent remain unclear and require further investigation.
Methods: This study investigates the impact of human activities on land use intensity (LUI) and degree of urbanization (URB). It comprehensively evaluates the spatial and temporal distribution of human activities and ESV, quantifying their coordination through coupling models.
Results: This work provides valuable insights and theoretical support for promoting the coordinated development of human activities and ESV. Overall, the LUI in the arid northwestern region decreased (from 0.485 in 2000 to 0.459 in 2020), while the URB increased (from 0.060 in 2000 to 0.087 in 2020). The ESV significantly increased, with a total growth of 556.58 billion yuan. In prefecture-level cities, the growth in ESV values ranges from 75.19 yuan/hm2 to 10,062.49 yuan/hm2.The coupling coordination degree between ESV and LUI has changed over time, transitioning from uncoordinated development to coordinated development. In addition, the coordination between ESV and URB has evolved from uncoordinated development to transitional coordination. The level of coordination between human activities and ESV in provincial capital cities significantly influences the coordination in surrounding cities.
Discussion: In conclusion, effective development recommendations are provided based on the ESV, LUI, and URB of different cities, along with a proposed development strategy for ecosystem service functions that aligns with the 14th Five-Year Plan and “Vision 2035” of each province. This work provides important insights into the relationship between human activities and ESV, and its findings can be used to guide coordinated and sustainable urban development.
The well-being, health, economy, and survival of humans critically depend on the invaluable contributions of ecosystems (Sukhdev et al., 2010; Costanza et al., 2014). However, in recent years, global ecosystems have transformed because of the rise in human actions (Han et al., 2022), resulting in an approximately 60% decline of ecosystem services. This change has significantly impacted human well-being, health, and socio-economic development (MA, 2005; Sukhdev et al., 2010). Urban areas significantly influence ecosystem services due to their growth and progress. The process of urbanization causes the degradation and destruction of ecosystems due to land development, infrastructure construction, and population growth. For example, urban expansion can cause changes in land surface coverage, affecting biodiversity and habitat stability. The United Nations Human Settlements Programme (UN-Habitat) has reported a global surge in urbanization, projecting that the global urban population’s proportion will rise from 56% in 2021 to 68% by 2050. (UN-Habitat, 2022). Evidently, the pressure on ecosystems from urban development is gradually increasing. Researchers and decision-makers worldwide are increasingly concerned about the nexus between urban development and ecosystem services. Therefore, exploring the correlation between urban growth and ecosystem services is crucial to establish a theoretical basis for sustainable development at the regional level (He et al., 2022).
Ecosystem service value (ESV) measures the economic worth of ecosystem services and reflects the contribution of ecosystems to human well-being. In 1997, Costanza et al. (1997) published a groundbreaking paper that, provided the first estimates of the value of various ecosystem services worldwide. Costanza’s research garnered widespread attention and discussion, subsequently leading to numerous follow-up studies and improvements. After that, Xie et al. (2003) made further advancements by utilizing Costanza’s findings to create an approach that is appropriate for assessing the ecosystem service value in China. This technique has gained extensive utilization, as evidenced by its frequent citation in recent studies (Gao et al., 2021; Wang et al., 2021; Wang et al., 2022; Zhou et al., 2022).
The impact of human activities on ecosystems has become more apparent as society has progressed (Chen et al., 2020; Zhang et al., 2020; Zhou et al., 2021). The alteration of land use and land cover (LUCC) is a significant way through which human activities impact ecosystems. LUCC influences the structure and functioning of ecosystems, leading to changes in the delivery of ecosystem services. (Li et al., 2018; Liu et al., 2022; Duan et al., 2023). In recent years, a number of academics have recognized the significance of exploring the relationship between changes in LUCC and the ESV. Zuo et al. (2023) investigated the land use changes in Qiqihar City for 2010 and 2020 and found that the conversion of wetlands to cultivated land significantly impacted the ESV. Li et al. (2021) observed in the karst basin of the Lancang River Basin that human-driven land use changes substantially modified the structure of ecosystem services, thereby influencing the ESV. Zhang et al. (2015) analyzed land use changes in China’s Chaohu Lake Basin from 1985 to 2007 and identified that the increase in ESV was primarily attributable to the expansion of woodlands and water bodies.
An essential step in examining the correlation between LUCC and ESV to effectively assess the influence of human activities on ecosystems is to recognize that alterations in land use are not the sole cause of the impact on ecosystems. The impact is also influenced by factors such as the increase in population, progress in the economy, and other related aspects (Chen et al., 2014; Narducci et al., 2019; Zhang et al., 2023b). Hence, thoroughly analyzing and exploring the topic of ESV from various viewpoints and aspects are imperative. Recognizing this, researchers identified population density, GDP density, and other associated aspects as further influences on the impact of urbanization on ESV (Shi et al., 2021; Yang et al., 2023). In general, previous studies focused on evaluating the quantitative impact and spatial distribution of land use change or urbanization on ESV caused by human activities. However, these studies often consider a single factor, and few studies have been conducted on the coordination between human activities and ESV. Therefore, to comprehensively assess the impact of human activities, this study quantified land use and urbanization, and evaluated the spatial and temporal distribution characteristics of the coordination between human activities and ESV through coupling coordination models, thus providing theoretical support for promoting the coordinated development of human activities and ESV.
Globally, nearly 40% of the land area comprises arid and semi-arid regions, which are particularly sensitive to environmental changes and human influences. With rapid socio-economic development, human interference is increasingly affecting ecosystems in these arid and semi-arid regions. Hence, evaluating the impact of human disturbances on ecosystems in arid and semi-arid regions is of paramount importance (Fan et al., 2021; Jia et al., 2021). The arid northwestern China, as a typical arid and semi-arid region, has consistently maintained a crucial strategic position in China. Between 2000 and 2020, the arid northwestern region underwent swift progress, witnessing notable transformations in its economic status, population dispersion, and land utilization. However, these advancements have concurrently presented fresh hurdles for the environment (Liu et al., 2021; Li M. et al., 2022; Zhang et al., 2023a). Hence, it is imperative to investigate how human actions have influenced the functions of ecosystem services in different cities within the arid northwestern region over the past 20 years and provide guidance for future progress. In the study area, the focus of this study is on the following four aspects: (1) clarifying the temporal and spatial features of land use types and land use intensity (LUI); (2) examining the temporal and spatial patterns of the degree of urbanization(URB); (3) assessing the temporal and spatial characteristics of ESV; (4) quantitatively evaluating the correlation between ESV, LUI, and URB; (5) providing development recommendations that are tailored to the specific circumstances of different cities. The research findings are expected to provide scientific foundations for the effective conservation and management of ecosystems, the maintenance and enhancement of ecosystem service capabilities, as well as the optimization of resource allocation and sustainable development, not only for China but also globally.
The geographical location of the arid northwestern China is situated between 73.41°–120°E and 32.65°–49.16°N, with an elevation that varies from − 155 m to 7412 m (Figure 1). This region spans several provinces, including Shaanxi, Gansu, Ningxia, Qinghai, Xinjiang, and Inner Mongolia Autonomous Region, covering around 3.45 million square kilometers. The arid climate in this area is a result of its elevated plateau and hilly landscape, situated far from the coast and deep within the mainland. These features obstruct the flow of moist air, resulting in limited precipitation. Consequently, vast desert and Gobi dune landscapes have formed in this region.
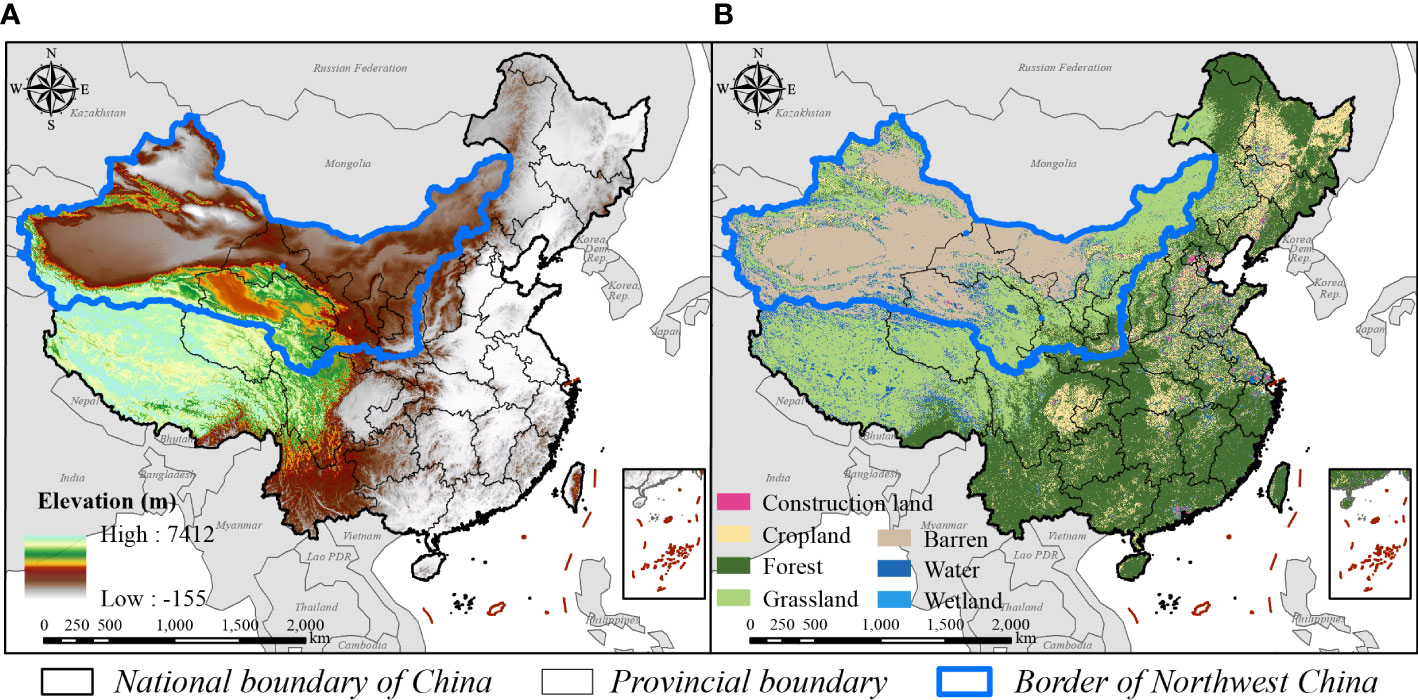
Figure 1 (A) represents represents elevation. (B) represents land use types.
The main types of land use include barren, grassland, and cropland. Although artificial oasis regions make up less than 10% of the overall land area, they sustain approximately 98% of the population and contribute 95% of the region’s GDP. The arid northwestern region are primarily distinguished by rivers located inland, where the main source of water resources comes from the melting of glacial snow in high mountain regions, rainfall in the forested areas of the middle mountains, and water from cracks in rock formations of the low mountains (Chen et al., 2015). Water resources are typically formed in mountainous regions but consumed in flatlands, oases, and desert regions. Water is essential in linking the three important ecosystems of mountains, oases, and deserts within the intricate arid northwestern region.
The measurement of land utilization and development in a particular area is crucial and can be determined by LUI. This metric plays a crucial role in evaluating the extent to which land is utilized for different objectives (Sun et al., 2019; Fan et al., 2022; Tian et al., 2022). The detailed calculation is provided in Equation (1):
The classification index for LUI, denoted as Aj, is assigned the following values: 1 for land that is barren, 2 for areas covered by forest, grassland, and water body, 3 for cropland, and 4 for areas occupied by construction land. Cj denotes the ratio of every land cover category while L denotes the level of LUI.
Studying the extent of urbanization is crucial in comprehending its impact on different areas such as the economy, population, and land utilization. By providing a scientific basis, it supports policy development and facilitates the establishment of sustainable urbanization. Urbanization is a vibrant phenomenon that encompasses three crucial aspects: financial progress, population increase, and territorial expansion. The economic, population, and land aspects of urbanization are represented by these dimensions, as stated by Bai et al. (2014) and Yang et al. (2023). By utilizing the subsequent formula, this study aims to evaluate the URB, considering land urbanization, population urbanization, and economic urbanization Equation (2).
URBi represents the overall measure of urbanization, while wj denotes the weight assigned to urbanization indicator j, which is 1/3 in this investigation; is the standardized value of urbanization indicator j in research unit i (including economic density, population density, and construction land ratio).
At present, methods for assessing ecosystem services are mainly divided into monetary and non-monetary approaches. Unlike non-monetary methods, monetary approaches allow for the conversion of diverse types and dimensions of ecosystem services into a unified currency unit, providing a more intuitive reflection of the value and significance of ecosystem services. A quantitative evaluation framework for assessing land use change and ESV was proposed by Costanza et al. (1997), based on the principles and methods for estimating the value of ecosystem services. This method, as a typical monetary approach for assessing ecosystem services, possesses the advantages of requiring minimal demand data, considering multiple aspects, and having a broad applicability (He et al., 2021).
Specific ecosystems exhibit a direct relationship between biomass and various aspects such as gas regulation, climate regulation, biodiversity conservation, food production, raw materials, waste disposal, recreation, and culture. Moreover, water conservation depends on regional precipitation, and soil formation and protection depend on the soil’s erosion control capacity, which is determined by factors such as rainfall, slope, vegetation cover, and soil properties. Hence, the ESV factors were modified by considering net primary productivity (NPP), rainfall, and soil preservation. The detailed calculations are as stated in Equations (3–5).
ESV stands for the collective ESV within a specific region, Ai represents the size of the i-th ecosystem type area, Xij indicates the value coefficient of the j-th service category within the i-th ecosystem type, and E represents the standard equivalent value (Table 1). The variables m and n symbolize the quantity of ecological classifications and service groups, respectively. Fi represents the adjustment coefficient for ecosystem services (Supplementary Table A.1). NPP (NPPy), rainfall (Ry), and soil conservation (SCy) are the corresponding factors in the study area. China’s national values for NPP, rainfall, and soil conservation are represented by NPPc, Rc, and SCc, respectively.
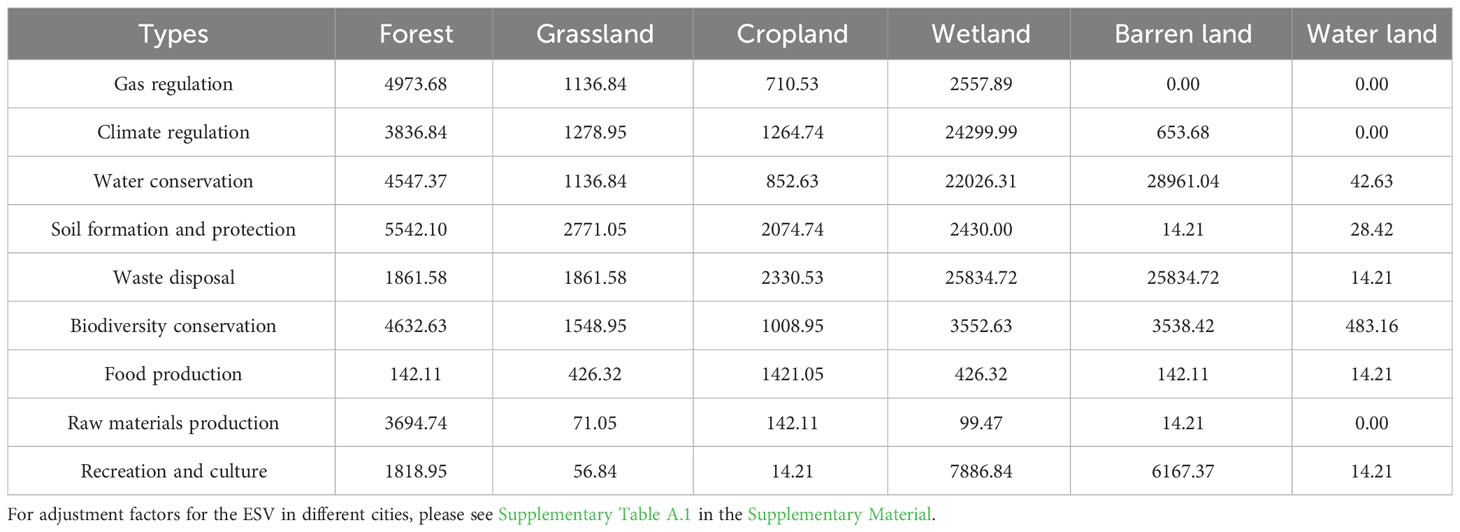
Table 1 Standard equivalent value in the arid northwestern region (yuan/hm2).
Data normalization is a common data preprocessing technique that transforms data of different scales and ranges into a standardized range to eliminate differences between data points. The calculation procedure is given by Lichtenberg et al. (2017) and Yin et al. (2022) with Equation (6):
The standardized value si,j,t is obtained from the raw data Si,j,t, where m and t represent the category, the indicator, the total number of categories, and time.
The investigation of clustering high values (hot spots) and low values (cold spots) of ESV employs hotspot analysis (Li et al., 2016; Shi et al., 2020). The whereabouts of regions experiencing a rise or decline in ESV can be detected by using this approach. An ESV value-added hotspot area is a statistically significant region where the change in ESV is significantly greater than in the surrounding areas. Consequently, the ESV in that region has experienced a substantial enhancement. Conversely, an ESV loss coldspot area, which is a statistically significant coldspot, refers to an area where the ESV change is considerably lower than that the surrounding regions. Consequently, the ESV in that region experienced a substantial decrease. The calculation formula is represented by Equation (7).
Xj represents the value of attribute j; Wij represents the weight between attribute i and j (1 if they are neighboring, and 0 if they are not neighboring); n is the total number of samples; X denotes the average; and S denotes the deviation.
Coupling analysis, alternatively referred to as coupling assessment, is used to examine the interconnections and impacts among various elements within a given system. It is commonly applied to complex systems such as socio-economic, ecological, and engineering systems to reveal the degree of coupling and interdependence among various parts within the system. Coupling analysis is extensively utilized in correlational investigations that involve ESV, land use, urbanization, and other associated factors (Gao et al., 2021; He et al., 2022). The calculation formulas are represented by Equations (8–10):
Ct represents the degree of coupling, indicating the interconnection among different elements. Mt denotes the coefficient of LUI or URB. The coefficient of ESV, denoted as Et, is determined by the entropy weight and the previously calculated ESV. The degree of coordination, denoting the extent of synchronization among the components, is symbolized by Dt. Tt represents the coupling coordination degree. The variable t refers to time. This study considers both LUI and ESV as equally vital in the overall development of the study area. Similarly, the URB is also deemed equally important in the area’s overall development, along with ESV. Both α and β are set to 0.5 to ensure equal significance and balanced consideration of these factors.
The main data required for this study include land use, grain price, socioeconomic data, NPP, soil and water conservation, precipitation. The specific sources and calculation methods are outlined in Table 2.
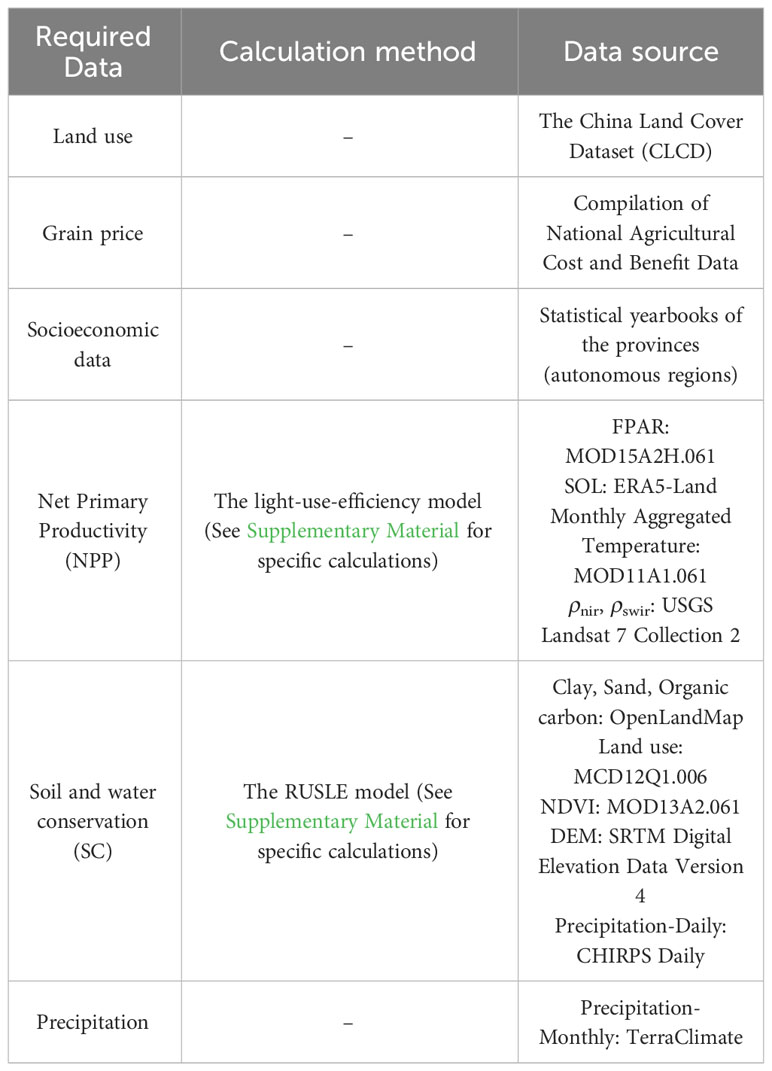
Table 2 Data source.
Human activities and interventions have led to transformations in land use, demonstrating their significant impact on land resources. Roughly half of the arid northwestern region is covered by barren land, making it the dominant feature in the area. Nevertheless, the percentage has been declining over the years according to Table 3. While certain expansions in the size of grassland and cropland the research duration, they predominantly demonstrate a decreasing pattern. Conversely, the size of forests and water bodies has exhibited a general upward trend, especially since 2010.
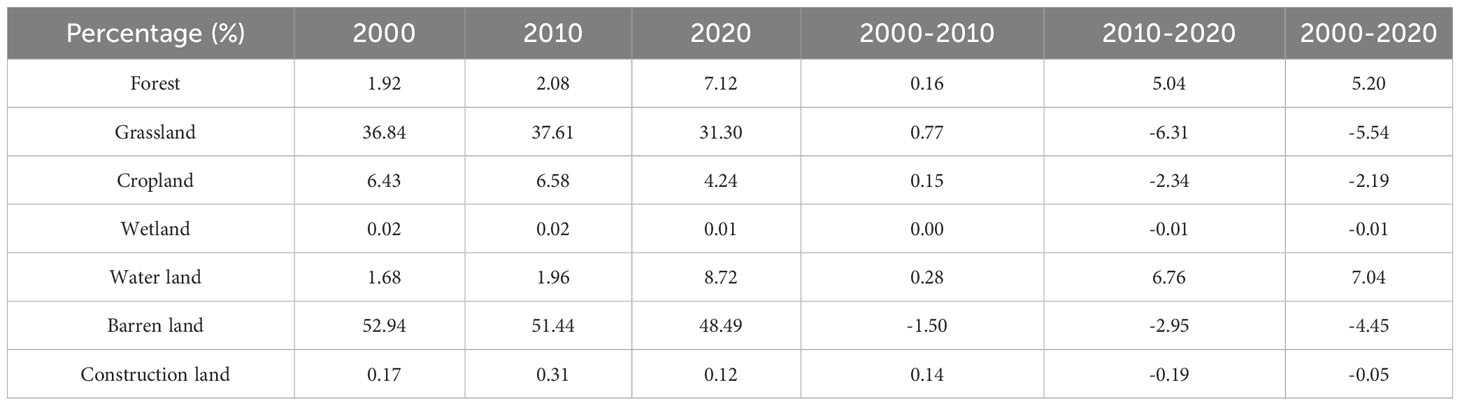
Table 3 Proportions of land use types and their change characteristics.
During the period from 2000 to 2010, the primary alterations in land utilization primarily consisted of transitions between grassland, barren land, and cropland. Grassland was created from around 120,616.25 km2 of previously barren land, with approximately 60,63.25 km2 being transformed into barren land. In addition, an area of 60,470 square kilometers that was originally covered in grassland underwent conversion to cropland, while another 56,518.75 square kilometers experienced the opposite transformation, changing from cropland to grassland. Between 2010 and 2020, the main alterations in land utilization mainly consisted of conversions from grassland or barren land to water body and from grassland or cropland to forest. Water bodies replaced approximately 205,260 km2 of grassland and 193,282.25 km2 of barren land. In addition, forests were expanded by converting 161,485 km2 of grassland and 123,836 km2 of cropland (Figure 2). In general, the alterations in land utilization between 2000 and 2010 were relatively minor, primarily consisting of transitions among grassland, barren land, and cropland. However, significant changes occurred after 2010, with prominent conversions from other land uses to water bodies and forests.

Figure 2 Areas of land use transitions.
Regional land development and utilization are indicated in this study by the measure of LUI. The LUI is classified into four levels: low (0–0.2), moderate-low (0.2–0.4), moderate-high (0.4–0.6), and high (>0.6). Equation (1) was used to calculate the LUI for the arid northwestern region, and the findings are illustrated in Figure 3. The analysis shows that the mean standardized LUI for the years 2000, 2010, and 2020 was 0.485, 0.493, and 0.459, respectively. This finding suggests a general upward trend followed by a subsequent downward trend. Throughout the three time periods, 23, 21, and 13 cities were categorized as having high levels of LUI (primarily situated in the eastern section of the arid northwestern region). Conversely, there were 12, 16, and 25 cities were classified as having moderate-high levels of LUI (mostly found in the central and eastern regions of the arid northwestern region). A total of 9, 8, and 7 cities were categorized as moderate-low LUI level, primarily found in the central and western regions of the arid northwestern region. Additionally, there were 10, 9, and 9 cities classified as low LUI level, mainly situated in the western area of the arid northwestern region. A noticeable shift occurred in the number of prefecture-level cities exhibiting high or relatively high levels of LUI. In the last two decades, 26 cities have experienced a rise in LUI, while 28 cities have witnessed a decline in LUI. The central and western regions exhibit a higher concentration of cities with an increase in LUI, whereas the eastern region is predominantly characterized by cities experiencing a decrease in LUI. The most notable decline in LUI was observed in Guyuan City in Ningxia Hui Autonomous Region, Weinan City in Shaanxi Province, and Tongchuan city in Shaanxi Province, with reductions of 19.7%, 17.4%, and 15.8% respectively. Conversely, the LUI experienced notable growth in Karamay City in Xinjiang Uyghur Autonomous Region, Jiayuguan City in Gansu Province, and Bortala Mongol Autonomous Prefecture in Xinjiang Uyghur Autonomous Region, with increases of 10.9%, 10.5%, and 6.5% respectively. From 2010 to 2020, the number of cities experiencing a rise in LUI decreased (from 34 to 19), while the number of cities witnessing a decline in LUI increased (from 20 to 35) than the period of 2000–2010. During the last 20 years, the LUI in cities of the arid northwestern region fluctuated. The decreases in intensity have generally been greater than the increases, suggesting an overall downward trend following an initial rise.
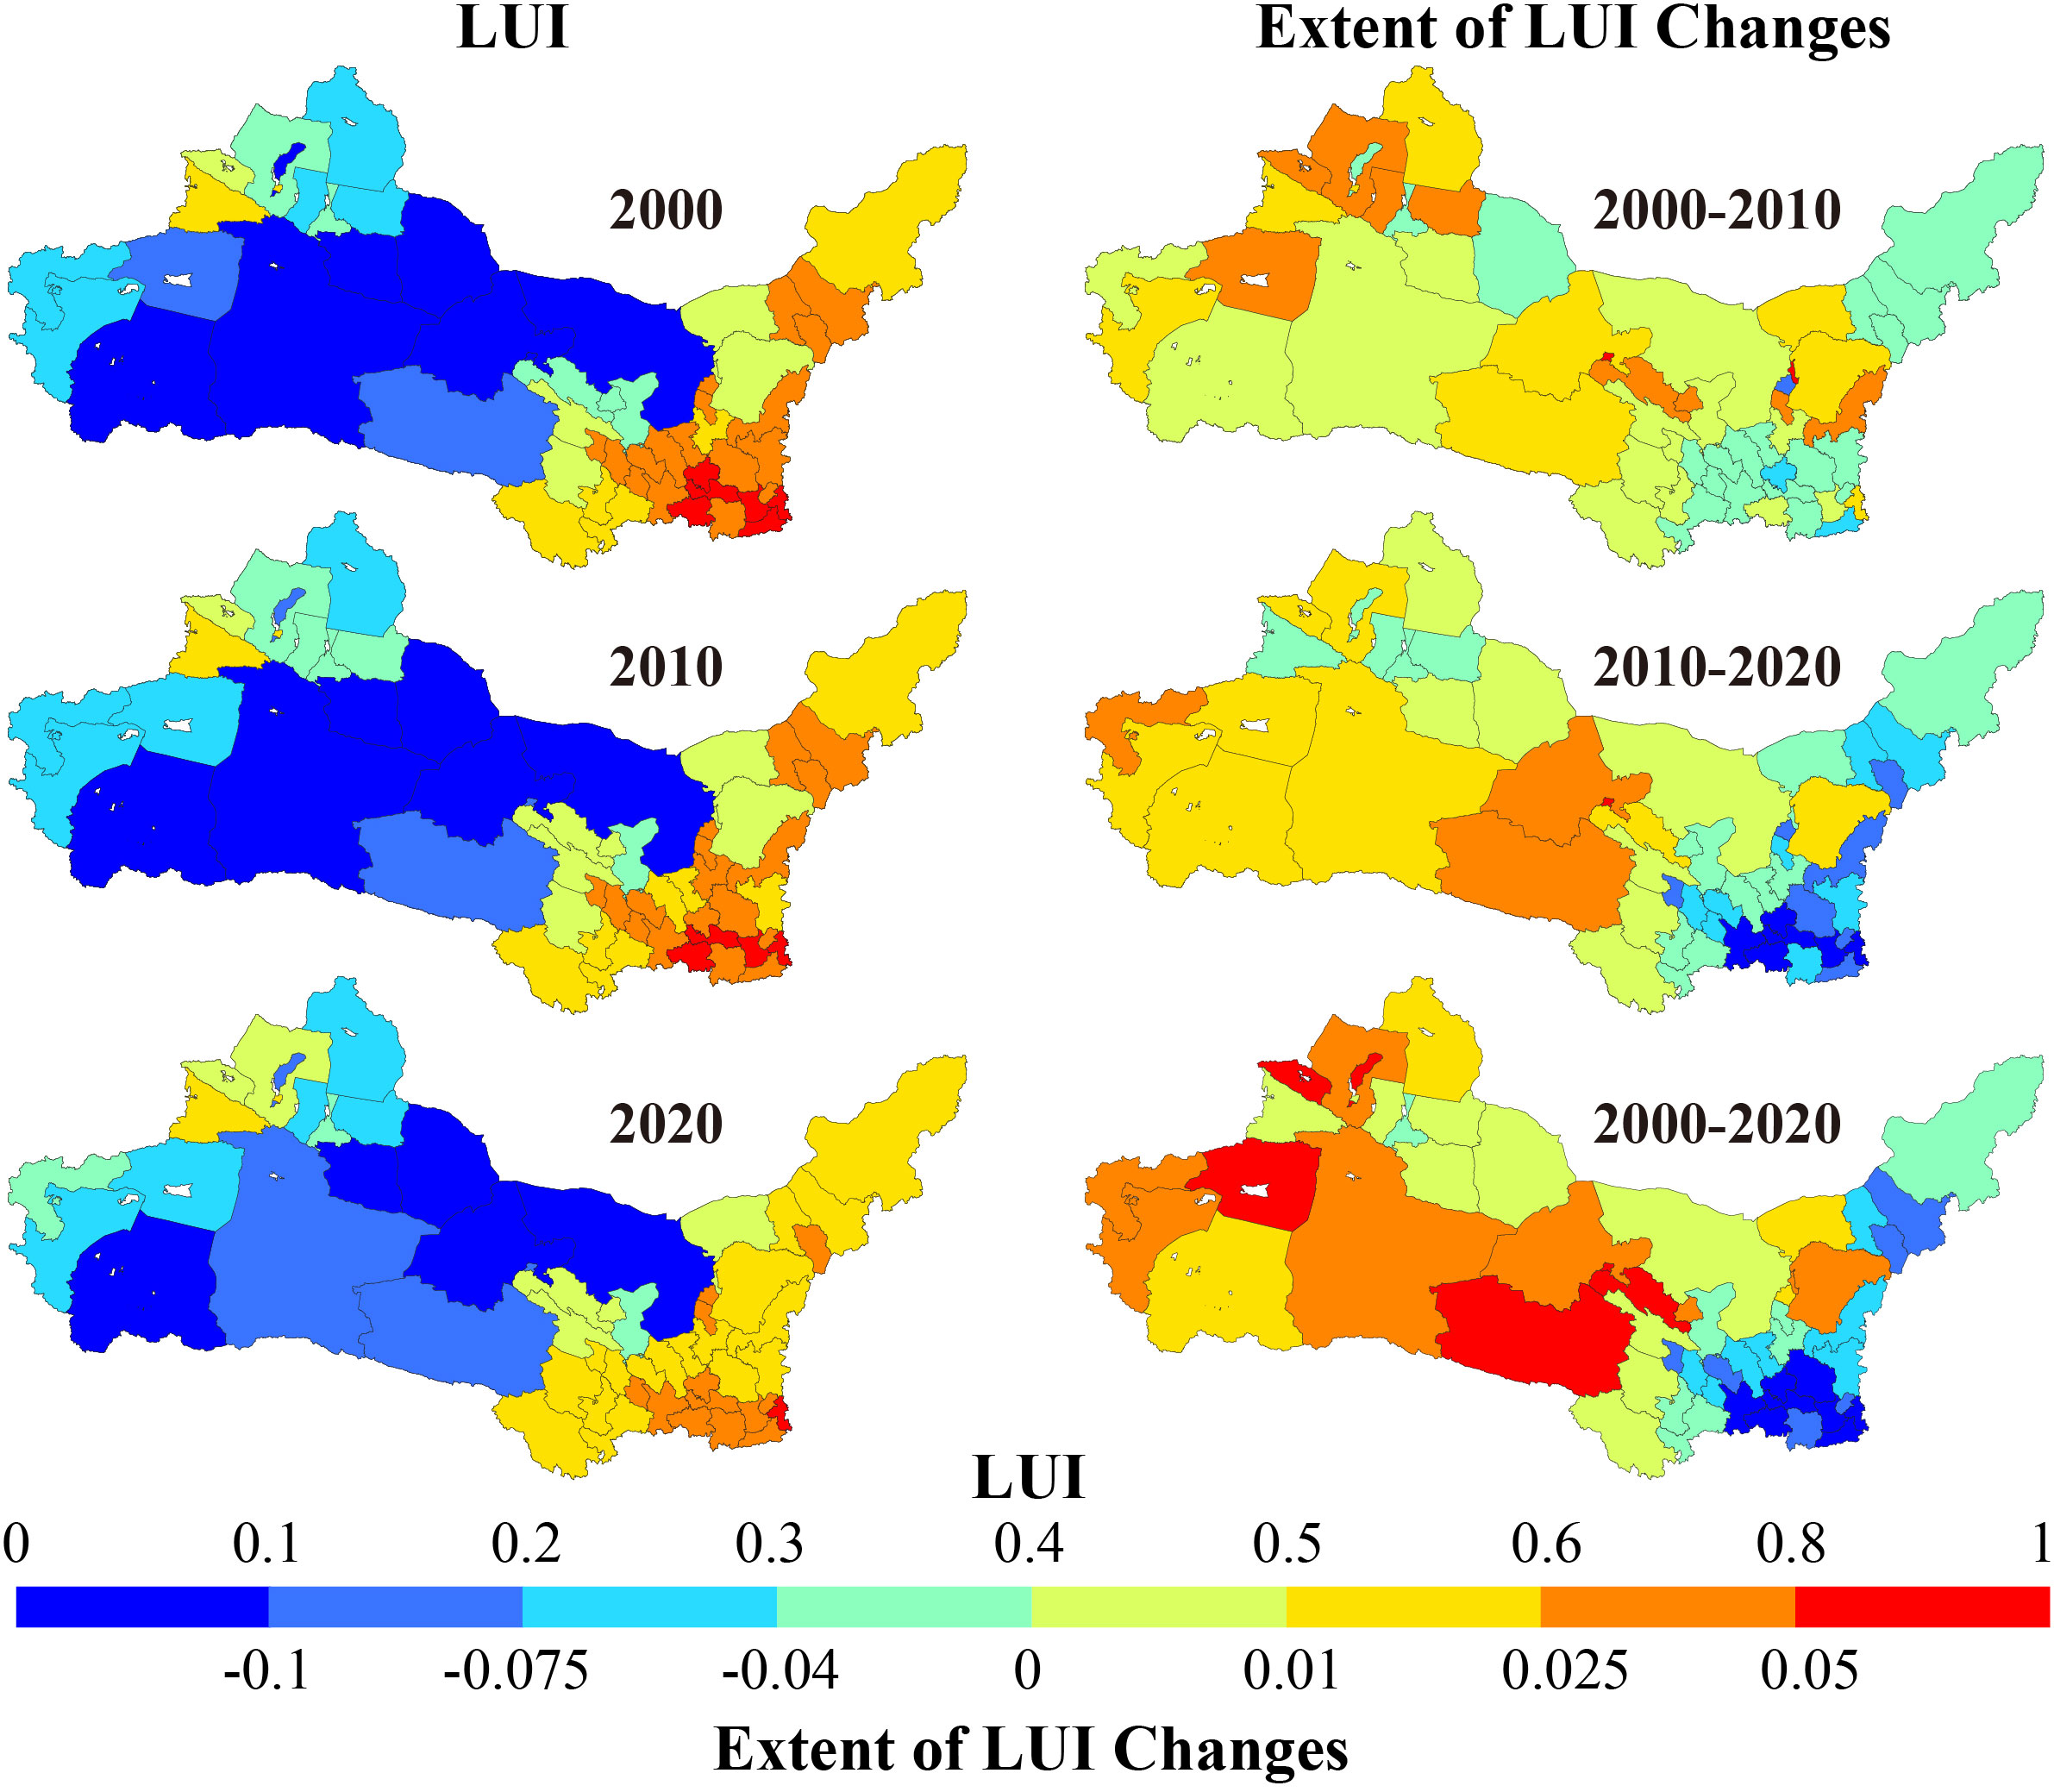
Figure 3 Spatial distribution and characteristics of LUI and change.
The growth of cities is a manifestation of economic progress and an increase in urban areas, driven by population expansion. The URB is categorized into four tiers: low (0–0.2), moderate-low (0.2–0.4), moderate-high (0.4–0.6), and high (greater than 0.6). The URB values for 2000, 2010, and 2020 in the arid northwestern region were 0.060, 0.061, and 0.087, respectively, demonstrating a general upward trend. In the year 2000, a total of 49 cities had URB values categorized as below moderate-low, while 5 cities had URB values categorized as moderate-low or higher. Figure 4 shows that in 2020, 47 cities had URB values lower than moderate-low, while 7 cities had URB values categorized as moderate-low or higher.
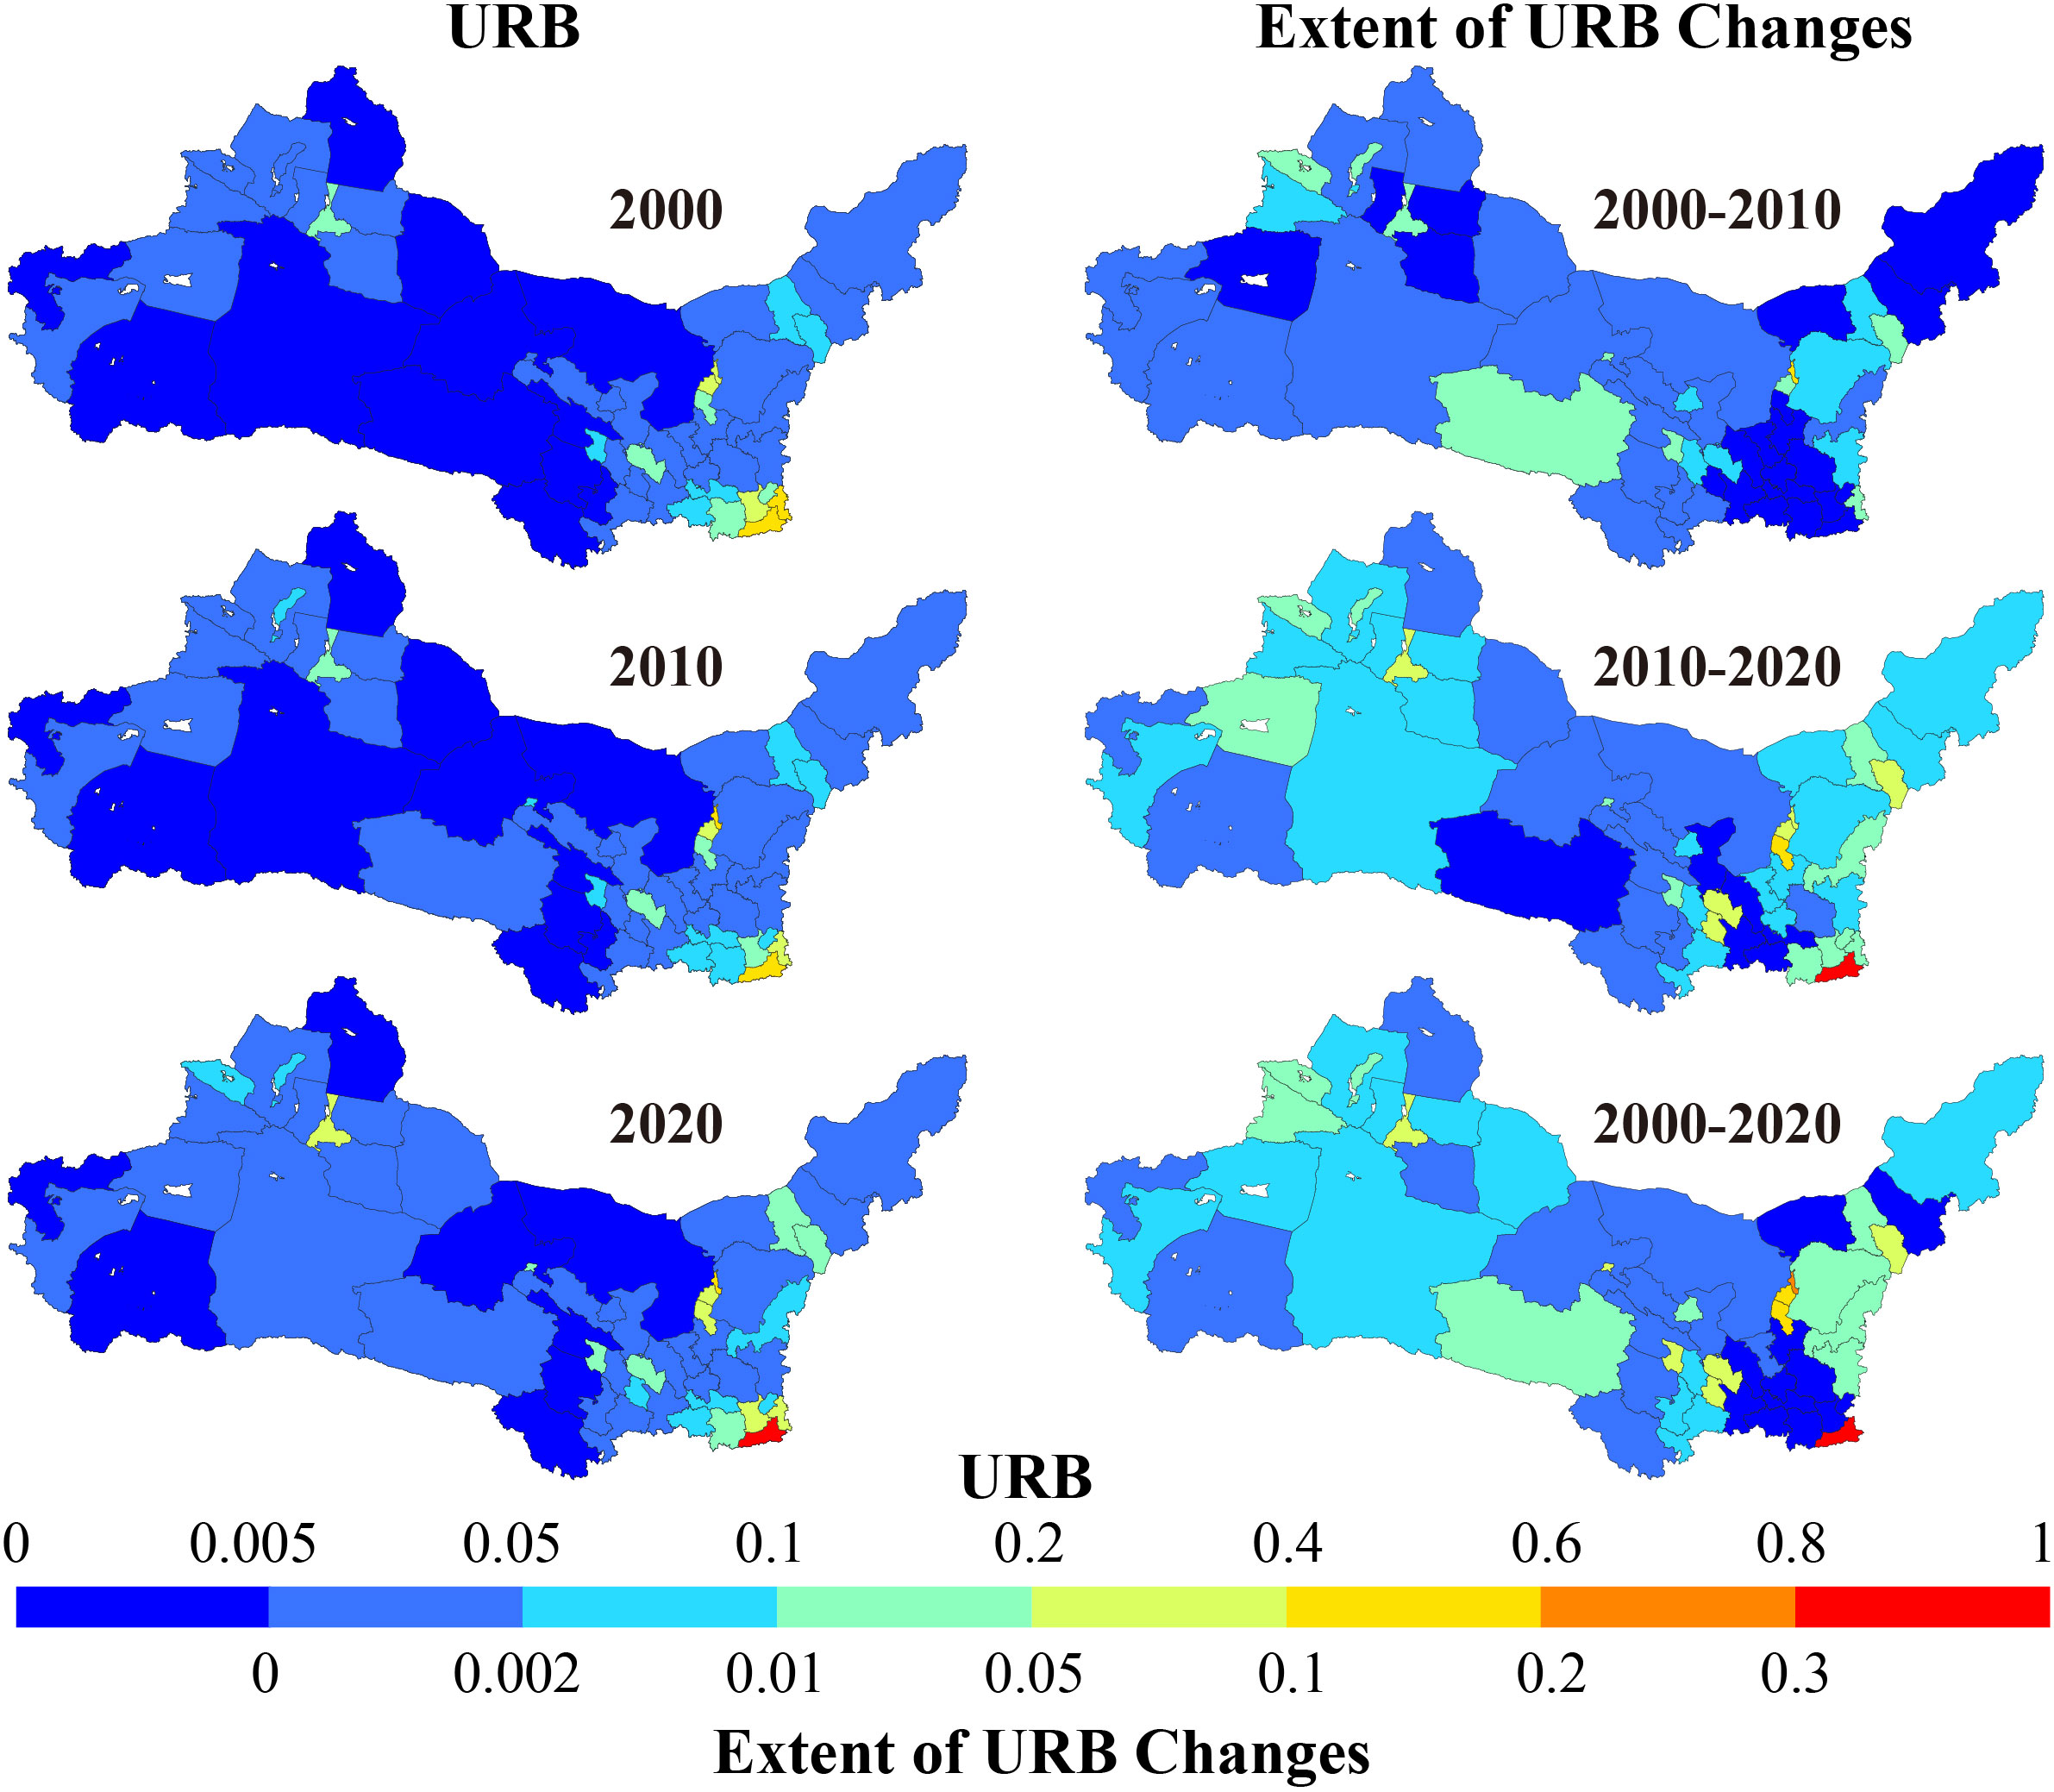
Figure 4 Spatial distribution of the degree of urbanization and changes in amount.
Between 2000 and 2020, the URB increased in 41 cities, with the most notable growth seen in Xi’an, Shaanxi Province; Wuhai, Inner Mongolia Autonomous Region; and Shizuishan, Ningxia Hui Autonomous Region, experiencing respective increases of 39.9%, 23.3%, and 12.1%. Conversely, 13 cities witnessed a decline in URB, with Weinan, Shaanxi Province; Xianyang, Shaanxi Province; and Pingliang, Gansu Province, showing the most significant decreases of 7.9%, 2.8%, and 1.2% respectively. In the arid northwestern region, the URB in cities has seen fluctuations over the last 20 years, with a tendency for increases to surpass decreases. The URB for the entire region exhibited a greater number of notable changes during the period spanning from 2010 to 2020 than in the years between 2000 and 2010, suggesting a consistent upward trend in urbanization.
From 2000 to 2020, the arid northwestern region witnessed a cumulative rise in ecosystem functionality, amounting to a total of 556.58 billion yuan. Water conservation and waste disposal showed a tremendous increase (Figure 5A). In Table 4, the values rose by 183.86 billion yuan and 129.68 billion yuan, respectively. The ESV, ranging from highest to lowest, also underwent changes in soil formation and protection, recreation and culture, biodiversity conservation, gas regulation, raw materials production, climate regulation, and food production. However, food production decreased with a reduction of 4.6 billion yuan.
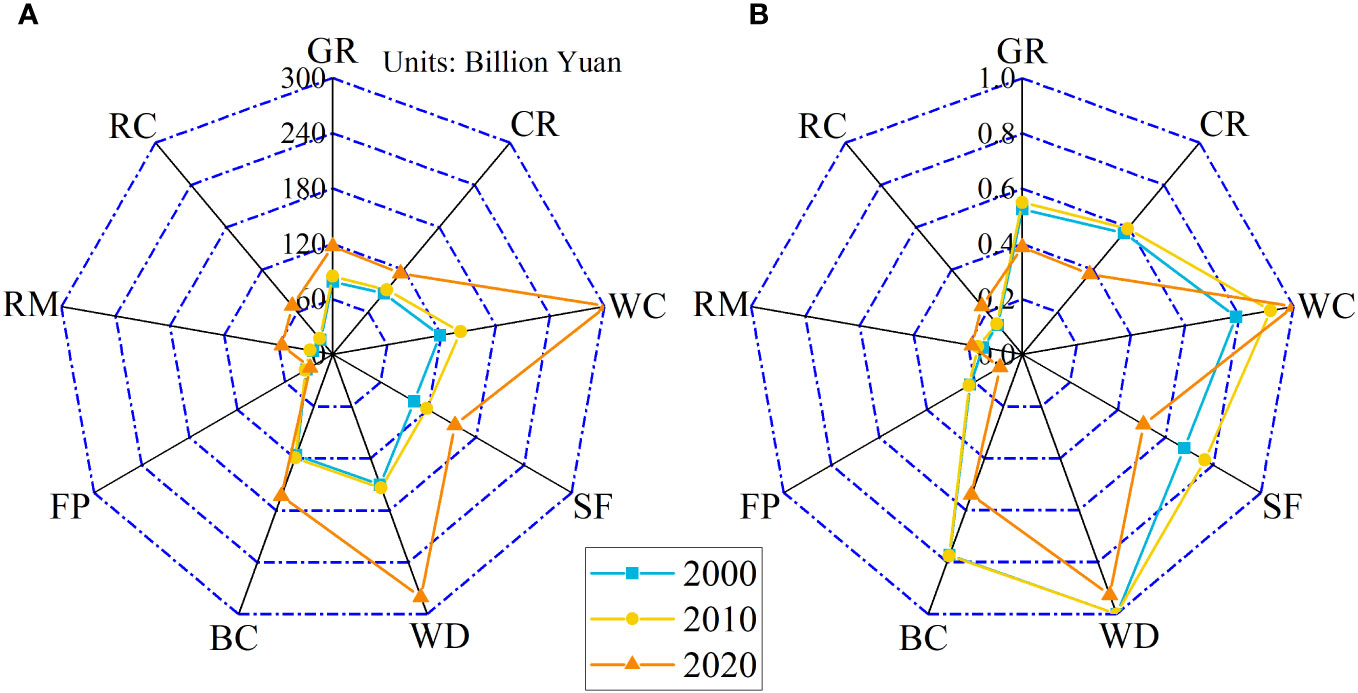
Figure 5 Total value of various ecosystem services at different times. (GR, CR, WC, SF, WT, BC, FP, RM, and RC represent gas regulation, climate regulation, water conservation, soil formation and protection, waste disposal, biodiversity conservation, food production, raw materials production, recreation and culture. (A) represents the total value of various ecosystem service functions at different times. (B) represents the ratio of the total value of various ecosystem service functions at different times to the maximum total value of ecosystem service functions at the corresponding time.).
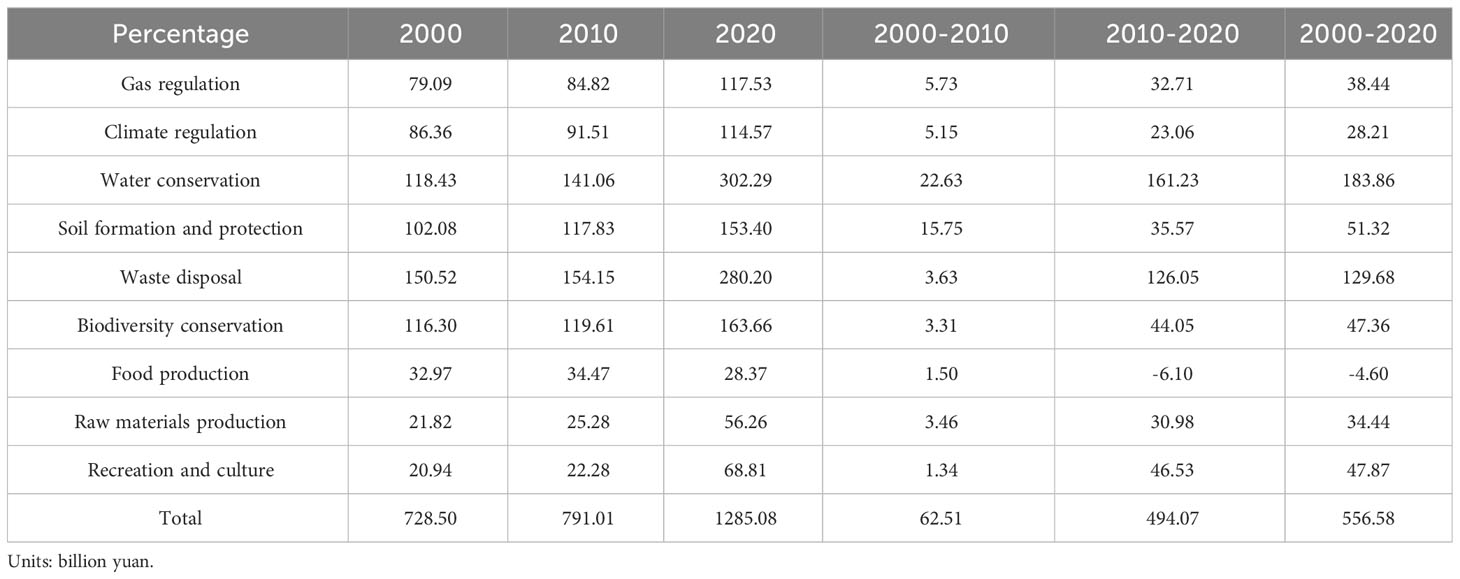
Table 4 Characteristics of changes in the total value of various ecosystem services.
The order of ESV across different functions has also undergone alteration. In the year 2000, waste management had the highest contribution (20.66%) to the overall ESV, closely followed by water conservation (16.26%), biodiversity conservation (15.96%), soil formation and protection (14.01%), climate regulation (11.85%), gas regulation (10.86%), food production (4.53%), raw materials production (3.00%), and recreation and culture (2.87%). The year 2020 witnessed significant importance placed on water conservation (23.52%), followed closely by waste disposal (21.80%), biodiversity conservation (12.74%), soil formation and protection (11.94%), gas regulation (9.15%), climate regulation (8.92%), recreation and culture (5.34%), raw materials (4.38%), and food production (2.21%) following closely (Figure 5B). Between 2000 and 2010, the arid northwestern region experienced limited alterations in ecosystem functionality, whereas from 2010 to 2020, notable modifications in ecosystem functionality took place, which were strongly linked to shifts in land utilization and urbanization trends.
Figure 6 depicts the changes over time in the overall value of ecosystem services and the monetary value of various classified ecosystem services in the arid northwestern region. Afterwards, the city-level ESV is examined. The measurement of ESV across cities will be based on the ESV per unit area to account for geographical size variation. Between the years 2000 and 2020, the ESV per unit area in every city experienced a progressive increase, varying from 75.19 yuan/hm2 to 10,062.49 yuan/hm2. Tianshui City in Gansu Province witnessed the most significant surge, with a staggering growth rate of 727.6%, whereas the Xilin Gol League in Inner Mongolia Autonomous Region recorded the lowest increase of only 11.0%.
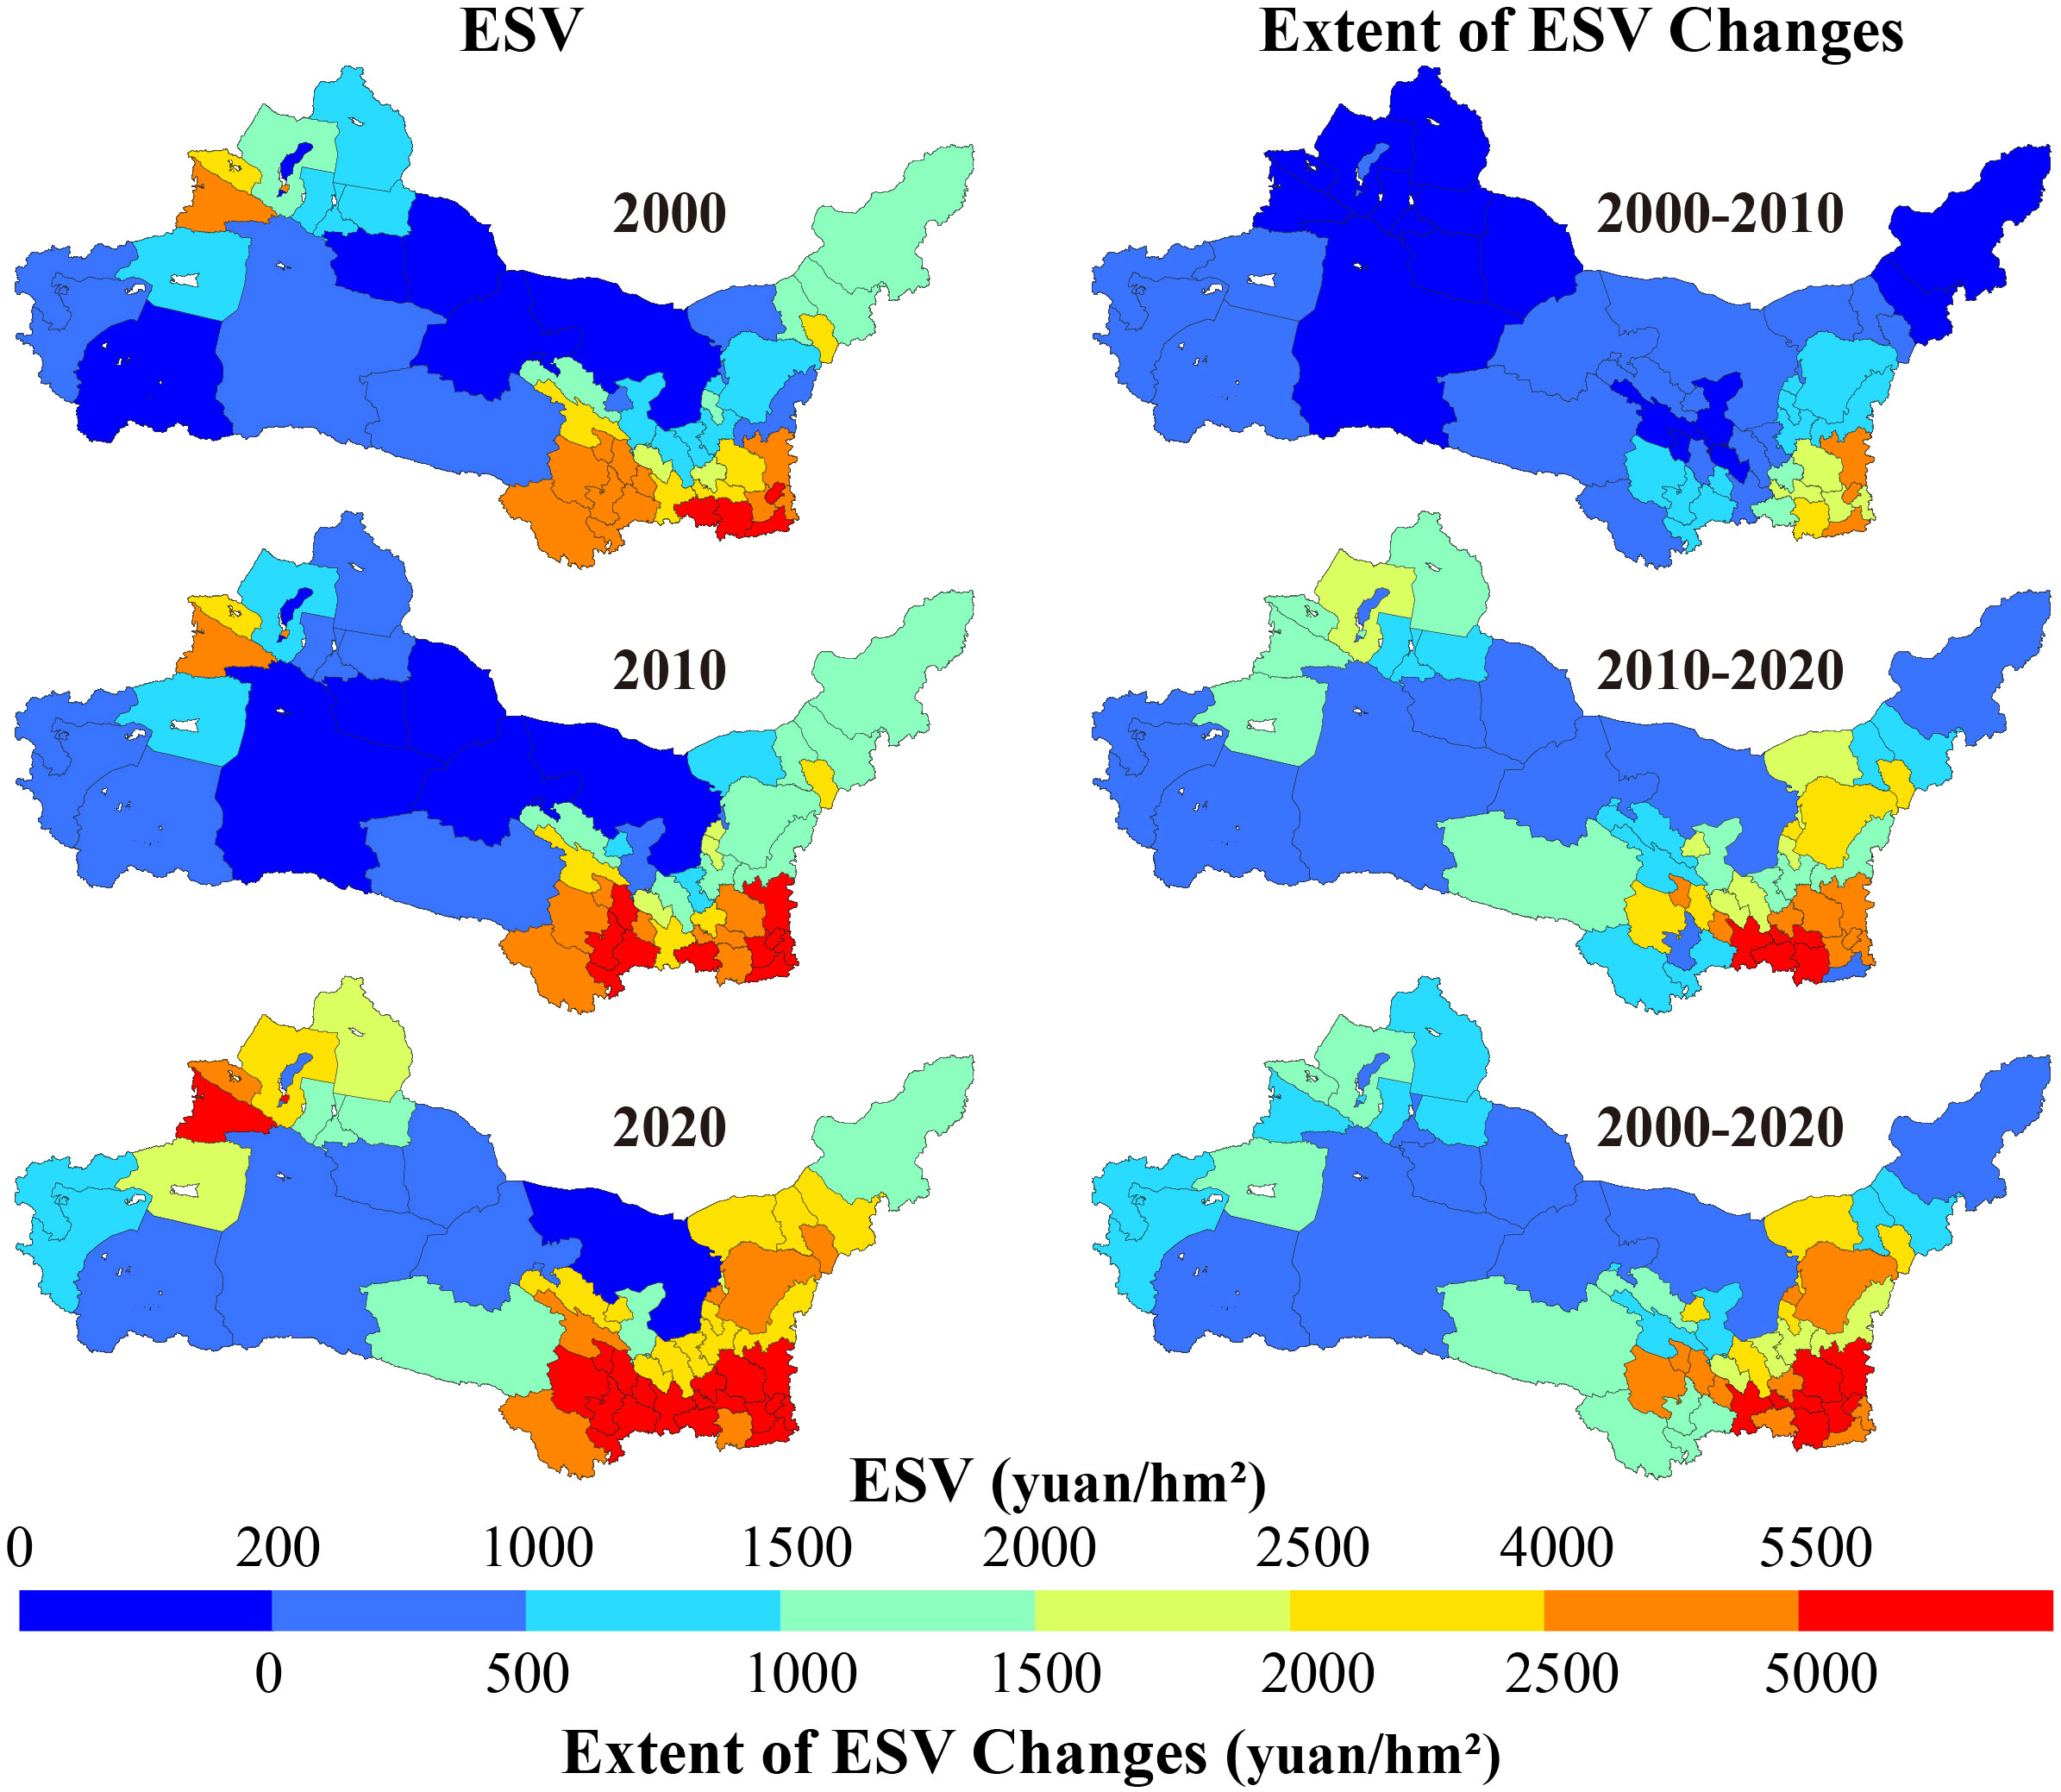
Figure 6 Spatial distribution characteristics of the value and change amount of ecosystem services per unit area.
Between 2000 and 2020, the number of cities with a per unit area ESV surpassing 5500 yuan/hm² increased from 4 to 20. Seven cities and one city, respectively, had an ESV per unit area below 200 yuan/hm². During the specified period, variations were observed in the ESV per unit area in different cities. Out of these, 39 cities demonstrated a rising pattern, whereas 15 cities displayed a declining trend. During the period from 2010 to 2020, urban areas experienced significant changes in ESV per unit area, showing a consistent upward trend.
Through hotspot analysis, both valuable and less valuable regions within a specific geographical area can be detected, thereby leading to a better comprehension of the spatial attributes and distribution patterns of ESV. This study aims to examine the cold and hot spot areas in the arid northwestern region by utilizing the municipal region as the fundamental unit of analysis.
During the research period, the cold and hot spot areas of ESV in the arid northwestern region exhibited notable alterations (Figure 7). In the year 2000, zero cold spot regions, 14 regions with high temperatures, and 40 areas that were not statistically significant. By the year 2010, the number of regions experiencing cold spots increased, reaching a total of 3. In contrast, the number of regions with hot spots decreased to 13, and the number of areas without significant differences decreased to 38. By the year 2020, the number of cold spot regions decreased to only one, while the number of hot spot regions witnessed increased to 15. The number of non-significant areas, however, remained unchanged at 38. In the last two decades, the year with the highest occurrence of cold spot regions was 2010, while 2020 witnessed the highest number of hot spot areas.
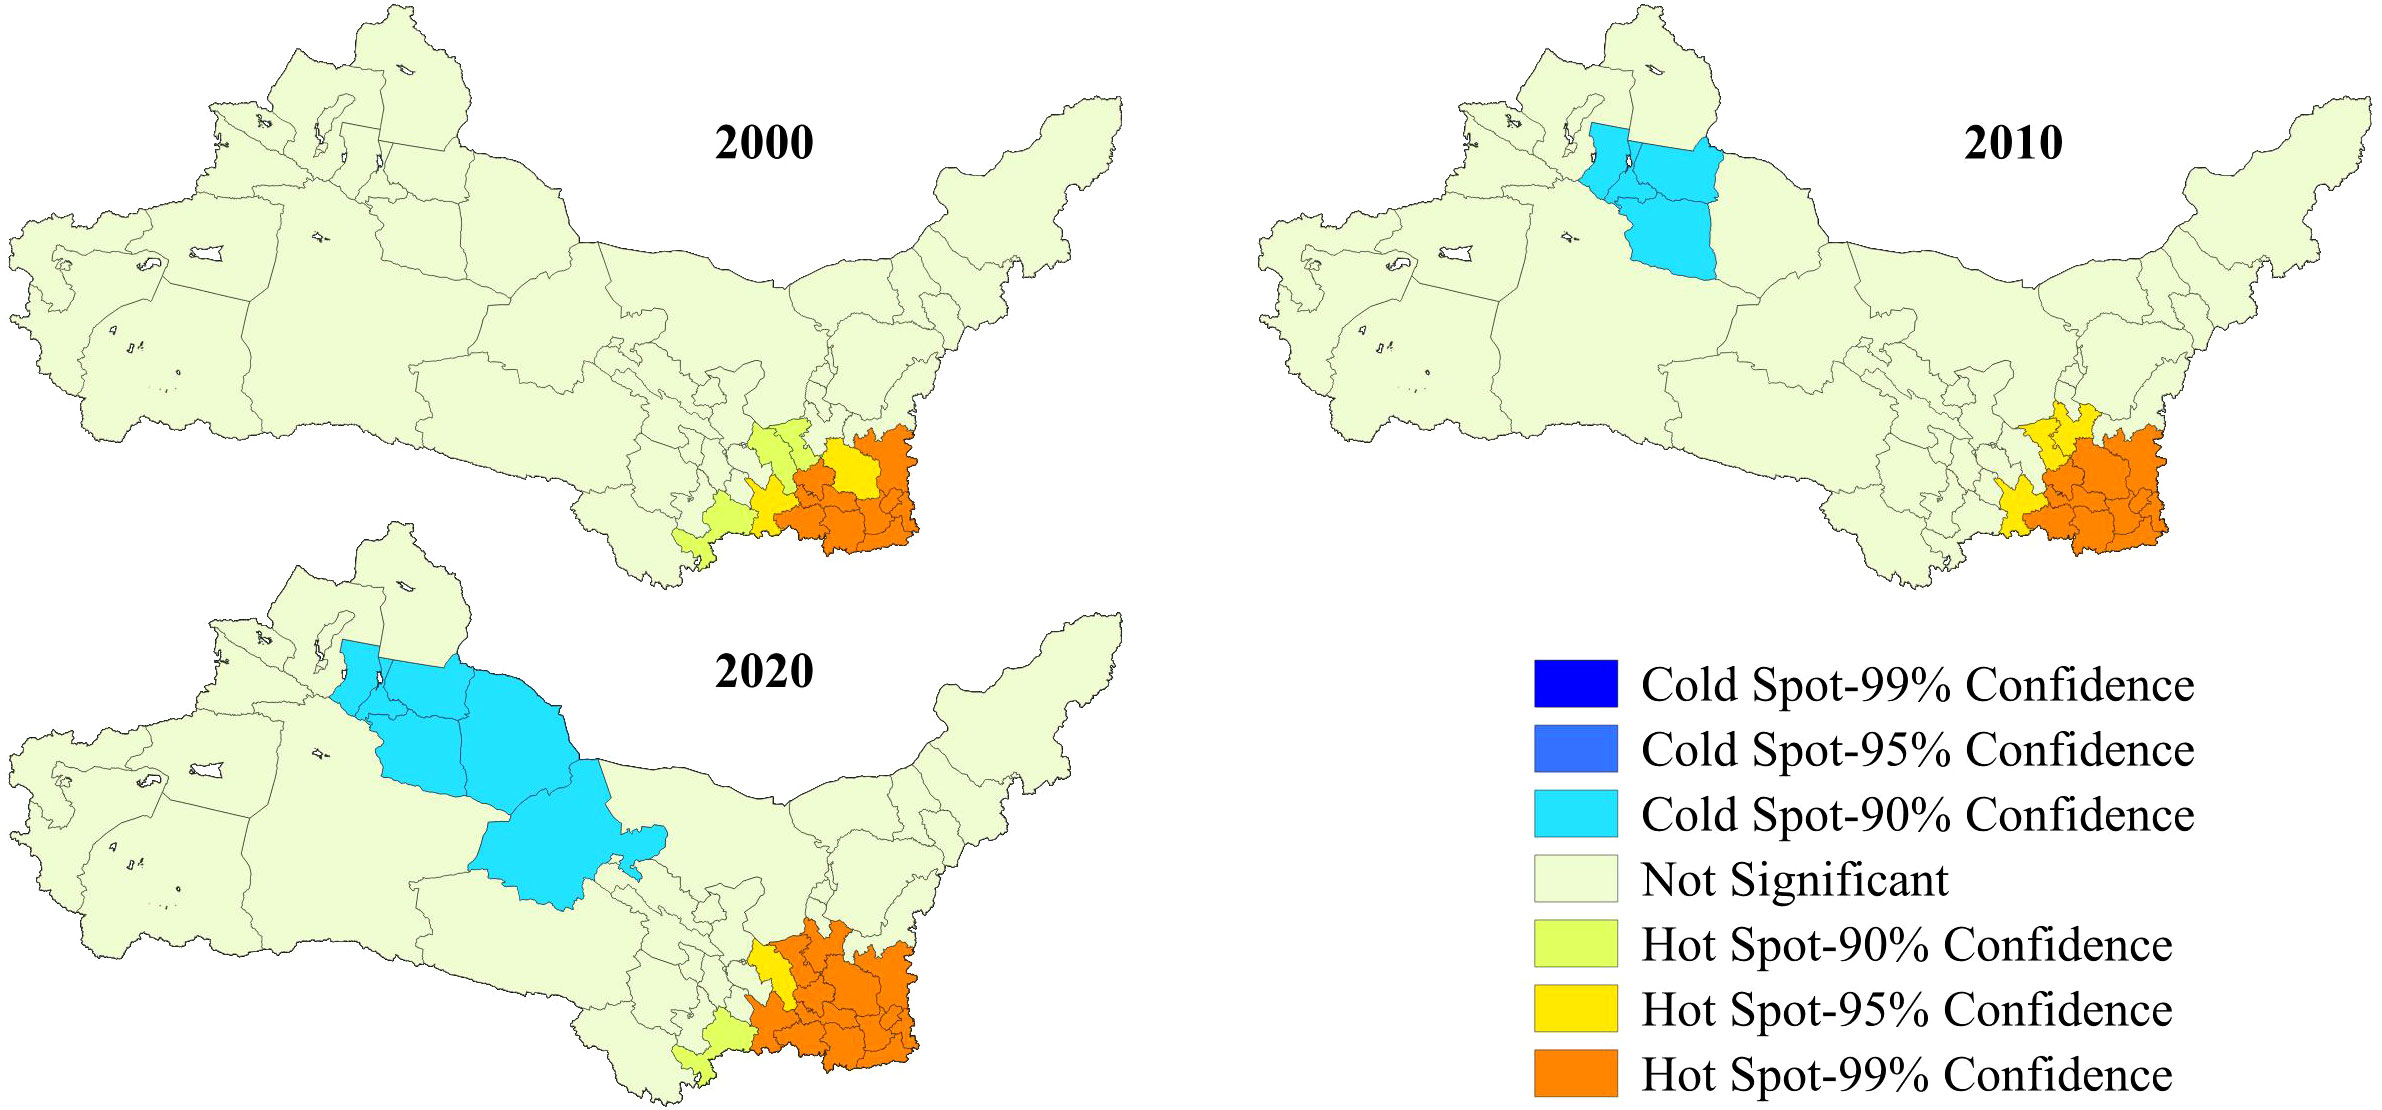
Figure 7 Spatial hotspot analysis of the ESV per unit area.
Between 2000 and 2020, a total of 11 cities (Ordos City, Bayannur City, Ulanqab City, Alxa League, Xianyang City, Weinan City) consistently emerged as areas of high activity, and one city (Wuzhong City) transitioned from insignificance to becoming a hot spot. In addition, three cities (Urumqi City, Turpan City, Bortala Mongolian Autonomous Prefecture) shifted from insignificance to becoming areas of low activity.
The coupling coordination degree is categorized into three levels: uncoordinated development (0–0.3), transitional coordination (0.3–0.6), and coordinated development (0.6–1). The coupling coordination between the ESV and LUI is on the rise (the average correlation values in 2000, 2010, and 2020 were 0.41, 0.44, and 0.49, respectively).
Figure 8 shows that in the year 2000, 13 cities at the prefecture level experienced uncoordinated development, 35 cities experienced transitional coordination, and 6 cities had coordinated development in terms of the relationship between ESV and LUI. In the year 2010, a total of 12 cities at the prefecture level experienced uncoordinated development, while 33 cities had a transitional level of coordination, and 9 cities achieved coordinated development between ESV and LUI. In 2020, 8 cities at the prefecture level experienced uncoordinated development, while 31 cities were in a state of transitional coordination, and 15 cities achieved coordinated development between ESV and LUI.
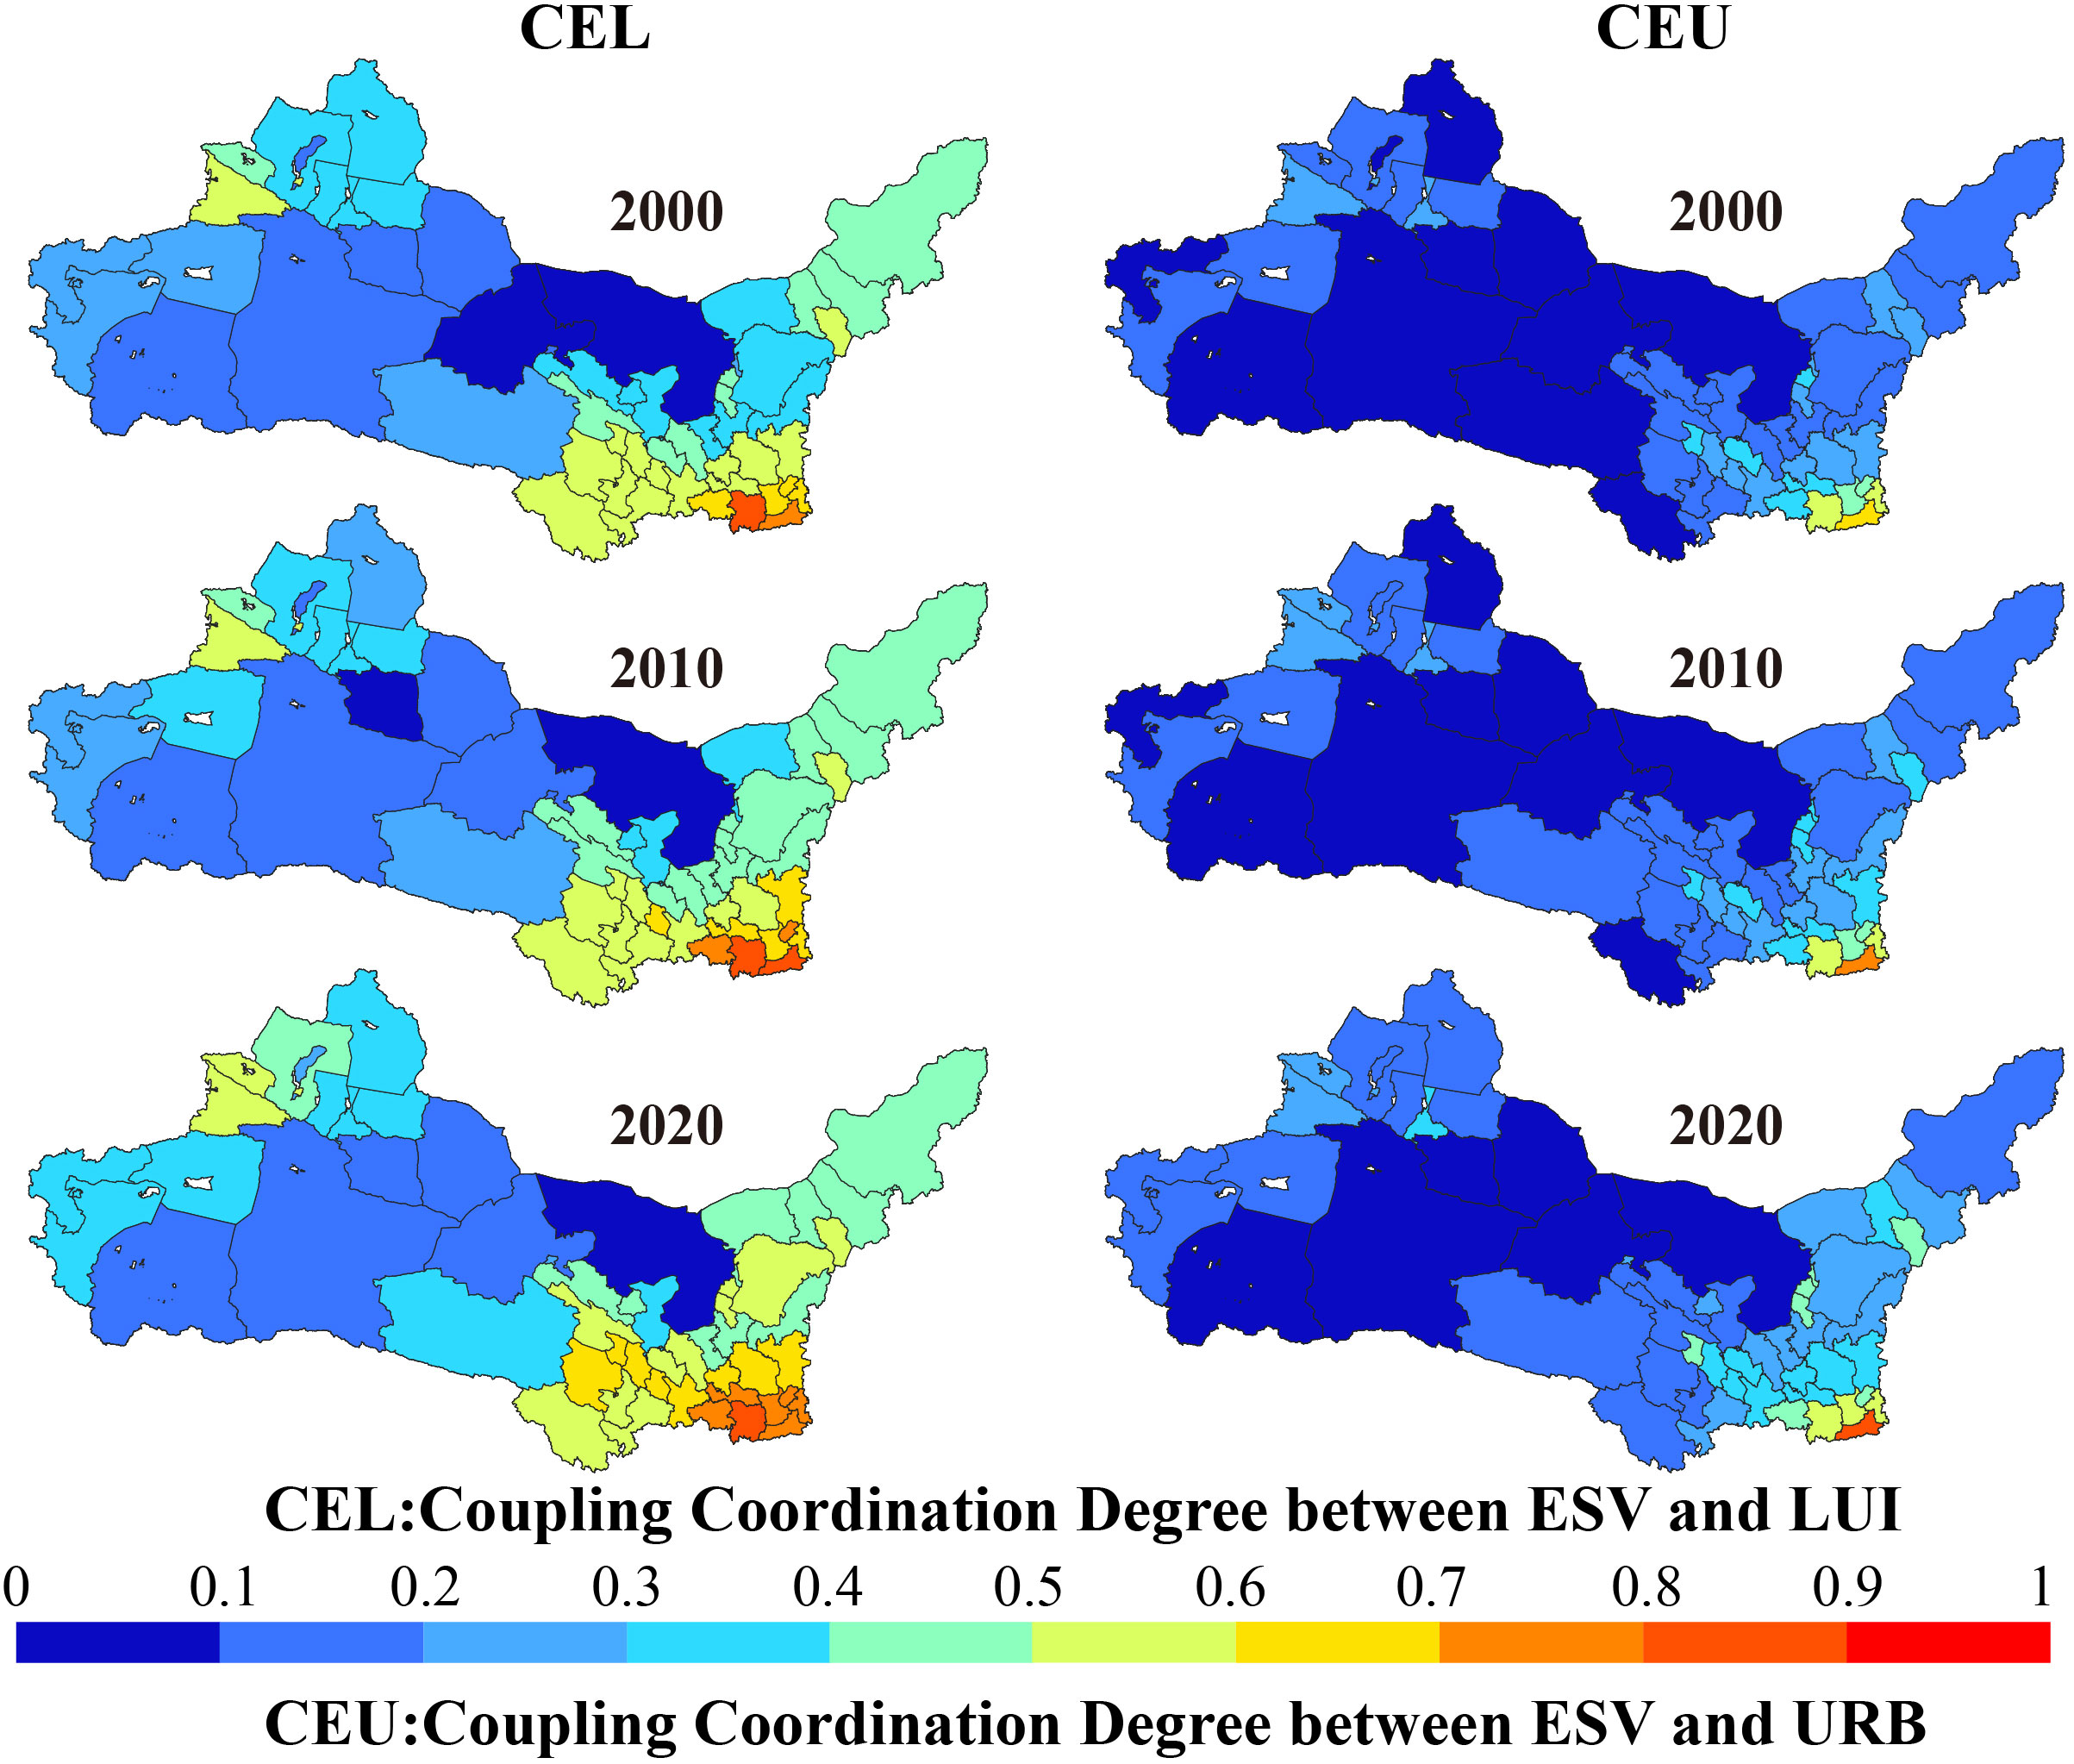
Figure 8 Coordination between the ESV per unit area and LUI (URB).
The coupling coordination between the ESV and URB also demonstrates a rising pattern, with mean coupling coordination values of 0.21, 0.22, and 0.28 in the years 2000, 2010, and 2020, respectively. In the year 2000, 44 cities at the prefecture level experienced uncoordinated development, 9 cities had transitional coordination, and 1 city achieved coordinated development in terms of the coupling coordination between ESV and URB. By the year 2010, 40 cities at the prefecture level experienced uncoordinated development, 13 cities experience transitional coordination, and 1 city achieved coordinated development in terms of the ESV and URB. During the year 2020, 33 cities at the prefecture level experienced uncoordinated development, while 20 cities underwent a transitional coordination, and 1 city achieved coordinated development.
In the last 20 years, the coupling coordination between the ESV and LUI has been higher than that between the ESV and URB. The coupling coordination between the ESV and the LUI, as well as the coupling coordination with urbanization exhibited an upward trend.
Significant alterations in land utilization have taken place in the arid northwestern China during the previous20 years, as stated in Section 3.1.1. Land use changes can be influenced by various factors, including population dynamics, policies related to land use, and economic and technological advancements (Long, 2020). Between 2000 and 2010, land utilization exhibited a predominant alteration, primarily encompassing the transformation among grassland, barren land, and cropland. All land use categories, except for barren land, experienced a rising pattern. Between 2010 and 2020, the size of water bodies and forests rose remarkably, whereas barren land, cropland, and grassland areas experienced a substantial decline. This finding is partially consistent with related studies. Li et al. (2019) investigated of land use changes from 2000 to 2010, and found an increase in cultivated land and a decrease in wasteland in the arid northwestern region, aligning with the findings of this study. However, the trends in forest and grassland changes showed opposite results to our research. These discrepancies may be attributed to the broader scope covered in this study, encompassing a more extensive area in the arid northwestern region, leading to deviations in the results.
Over the past few years, large-scale reforestation initiatives have been implemented in the arid northwestern region to combat desertification and improve the ecological surroundings (Zhang et al., 2016; Xi et al., 2022). As a result, the amount of barren land has decreased considerably, and the expanse of forests has grown substantially. Moreover, starting from 1999, China has been implementing the “Grain for Green” initiative (Feng et al., 2005; Wang et al., 2017), leading to a substantial transformation of agricultural land into woodland. Notably, between 2000 and 2010, both the area of cropland and the size of forested areas exhibited an increase. As forests were created by transforming some cropland, the growth of the population caused a rise in the need for crops, leading to the transformation of different land use categories into cropland. In the past few years, the productivity of crops per unit of land has increased because of the progress in agricultural science and technology (Fan et al., 2019; Iizumi and Sakai, 2020), resulting in the ability to fulfill crop demand with less cropland. Since 2010, the implementation of the “Grain for Green” policy has led to a substantial reduction in the area of cropland. In addition, the water bodies in the arid northwestern region increased significantly, which is closely related to the global warming causing snow melting and precipitation increase (Yang et al., 2022).
The indicators that are commonly utilized to measure urbanization include population growth, economic development, and land transformation (Yang et al., 2023). In 2000, China launched the Western Development Strategy, resulting in swift progress in the Western regions (Yang et al., 2018). The analysis in Section 3.1.2, showed the majority of prefecture-level cities (41 out of 54) in the arid northwestern region experienced a rise in their urbanization index. Nevertheless, the overall scale of the rise in the urbanization index was less significant compared with the decline. According to statistical analysis (Supplementary Material: Supplementary Table A.3), provincial capital cities such Xi’an in Shaanxi Province, Lanzhou in Gansu Province, Hohhot in Inner Mongolia Autonomous Region, Urumqi in Xinjiang Uygur Autonomous Region, Xining in Qinghai Province, and Yinchuan in Ningxia Hui Autonomous Region experienced a substantial growth in URB. These six provincial capitals all ranked among the top 10 in terms of the increase in URB. This finding is consistent with the context where provincial capitals, serving as political centers, are typically also economic and cultural hubs (Ning and Zhang, 2021).
In the arid northwestern region, the economic and population urbanization indicators exhibited a consistent upward trajectory, which is particularly evident in the notable advancements of provincial capital cities’ economic and population urbanization measures. The rapid growth of the economy, ample job prospects, competitive wages, and the ability to attract migrant workers from different areas are factors that contribute to this phenomenon (Lyu et al., 2019; Yu et al., 2019). The urbanization index of land in the arid northwestern region showed a slight decline, which aligns with the decreasing pattern of construction land area in the same region between 2000 and 2020 (Table 3). The land urbanization index of every provincial capital city experienced both growth and decline. Cities such as Xi’an in Shaanxi Province, Yinchuan in Ningxia Hui Autonomous Region, Lanzhou in Gansu Province, and Xining in Qinghai Province exhibited a decline in the urbanization index for land. Simultaneously, the land urbanization index showed a rising pattern in Hohhot, located in Inner Mongolia Autonomous Region, and Urumqi, situated in Xinjiang Uygur Autonomous Region.
Land use policies and urban development have a close connection to the alterations in land use. Furthermore, the need for land for construction has risen due to the growth in urban economy and population (Li et al., 2020; Mahtta et al., 2022). Conversely, over the past few years, urban green areas have increased due to a range of land use strategies, resulting in the transformation of certain areas of construction land into grassland or forested regions (Xu et al., 2019; Jiang et al., 2021; Kuang et al., 2021). These two aspects have a mutually restraining relationship but can also be coordinated and unified, promoting healthy city development.
ESV and URB have shown a general upward trend in the last20 years, as indicated by the analysis findings in Sections 3.1, 3.2, and 3.3. Conversely, LUI has declined, with the most notable transformations observed between 2010 and 2020. The level of coordination indicates the connection between systems, with a higher degree of coordination indicating stronger alignment and vice versa (Wang et al., 2019; Gao et al., 2021). The analysis results in Section 3.4 indicate a growing correlation between ESV and both LUI and URB in the arid northwestern region, as observed from the coordination degree (CEL) and the coordination degree (CEU). CEL shifts from uncoordinated development and transitional coordination to coordinated development, whereas CEU primarily shifts from uncoordinated development to transitional coordination. Overall, CEL is greater than CEU.
Among the provincial capital cities listed in Supplementary Table A.4 (Supplementary Material), Xi’an City in Shaanxi Province demonstrated coordinated development in CEU across the three time periods of 2000, 2010, and 2020. In the Xinjiang Uygur Autonomous Region, Urumqi City exhibited uncoordinated development, uncoordinated development, and transitional coordination during the three respective periods. In terms of CEU, the development of Lanzhou City in Gansu Province, Hohhot City in Inner Mongolia Autonomous Region, Yinchuan City in Ningxia Hui Autonomous Region, and Xining City in Qinghai Province exhibits uncoordinated development, transitional coordination, and transitional coordination during the three periods, respectively. During the three periods, Xi’an City in Shaanxi Province demonstrated coordinated development in terms of CEL. In terms of CEL, Xining City in Qinghai Province demonstrates transitional coordination, transitional coordination, and coordinated development during the corresponding three periods. During the three periods, Urumqi City in the Xinjiang Uygur Autonomous Region, Lanzhou City in Gansu Province, Yinchuan City in Ningxia Hui Autonomous Region, and Hohhot City in the Inner Mongolia Autonomous Region demonstrate a transitional coordination in relation to CEL.
The progress of provincial capital cities has a substantial influence on the progress of neighboring cities (Fan et al., 2019; Bian et al., 2020; Zou et al., 2022). Hence, the correlation between the CEL and CEU of cities neighboring provincial capitals is often present. This finding consistent with the development patterns among cities. Baoji, Weinan, and Xianyang, which are adjacent to Xi’an in Shaanxi Province, are taken as examples. The air quality in these four cities is among the bottom 20 nationwide according to results released by the Ministry of Ecology and Environment of the People’s Republic of China in December 2022 (Ministry of Ecology and Environment of the People’s Republic of China, 2023). The population of these four cities ranks among the top five in Shaanxi Province (Shaanxi Provincial Bureau of Statistics, 2022). The research results indicate that the CEL and CEU levels in Xi’an, Baoji, Weinan, and Xianyang all increased. Yinchuan City and Shizuishan City in the Ningxia Hui Autonomous Region demonstrated a transitional coordination and close correlation in 2020 in terms of CEL and CEU. During the year 2020, transitional coordination in CEU was observed among Lanzhou City, Dingxi City, and Linxia Hui Autonomous Prefecture in Gansu Province, with their CEL values closely ranging from 0.5 to 0.67.
In contemporary times, many scholars are exploring the coordination between human development and ecological environmental protection from various perspectives, providing insights for the sustainable development of both humanity and nature (Liang and Yang, 2019; Shi et al., 2021; Chen et al., 2022; He et al., 2023). Yuan et al. (2022) proposed strategies for the high-quality development of the industrial ecological economy along the Yangtze River, including aspects such as the balanced development of the industrial economy, the transformation and upgrading of surrounding environments, and coordinated integrated development. Lai and Chen (2020) confirmed the fundamental correlation between environmental performance and human development, providing important references for future environmental management and human development decision-making. Frazier et al. (2019) explored how to utilize landscape ecology and landscape sustainability science to achieve ecological civilization.
Ecosystem services, as a gift from nature to humanity, support human life in various ways. At the same time, human activities affect ecosystem service functions in different ways. Exploring the correlation between ecosystem services and human activities is of crucial significance for the coordinated development of humanity and nature (Shi et al., 2021; Zuo et al., 2023). The functions of ecosystem services are often regarded as a luxury, viable only in specific economic environments (Farley, 2012; Mauerhofer, 2018). However, with the progress of society and the accelerated process of urbanization, the functionality of ecosystem services may face limitations (Cumming et al., 2014; Chen and Chi, 2022). Yang et al. (2023) provided rational recommendations for coordinating ecological conservation and urban development based on the relationship between ESV and URB. This study further comprehensively considers the results of human activities. Accordingly, urban development recommendations are categorized into the following five groups based on different scenarios:
Cities areas that possess elevated ESV enjoy ecological benefits and ought to prioritize maintaining equilibrium among diverse ecosystem service functions while fostering the growth of such functions.
Cities with low ESV, high URB, and low LUI tend to have less developed economies, scarce populations, and a significant amount of unutilized land. These cities should prioritize economic development while preserving the ecological environment.
Cities with low ESV, high URB, and high LUI tend to achieve successful economic growth, exhibit high population density, and contain a substantial amount of built-up and cropland. These cities should intensify efforts to restore the ecological environment while maintaining economic development.
Cities with low ESV, low URB, and high LUI have a significant amount of cropland but a limited amount of construction land. Their level of economic progress and the concentration of people in their area are considered moderate. To accelerate urban economic development, these cities must implement stringent measures to protect cropland, effectively utilize the ecosystem service function of ‘food production’, and harmonize the development of other ecosystem service functions.
Cities with low ESV, high urbanization, and low LUI tend to undergo successful economic growth, have a high concentration of population, possess limited cropland, and exhibit relatively extensive grassland areas. The primary focus of these cities should be the conversion of grassland into forests, all the while ensuring economic growth and fostering the enhancement of ecosystem service functions.
Achieving the significance and far-reaching prospects of China’s 14th Five-Year Plan and “Vision 2035” is of great importance (Li B. et al., 2022; Zhang Q et al., 2023). Therefore, feasibility suggestions for the development and maintenance of ecosystem services need to be proposed based on the current situation and goals of each province.
Xinjiang Uygur Autonomous Region, located on the northwest border of China in the central part of the Eurasian continent, plays a significant role in promoting the construction of the “Belt and Road” due to its unique geographical advantage. The region boasts high-quality solar-thermal resources, water resources, tourism resources, biological resources, mineral resources, wind energy resources, forest resources, and land resources, providing abundant ecosystem service functions. While abundant resources pose opportunities, achieving high-quality development remains a challenge for Xinjiang. For instance, in terms of pollution control, efforts should be strengthened in preventing and controlling agricultural non-point source pollution, along with strict control of water quality in drinking water sources. In terms of food and raw material production, enhancing agricultural production capacity, strengthening basic farmland protection, and achieving a balance between the quantity and quality of cultivated land are crucial ways to ensure the effective supply of important agricultural products. Provinces such as Qinghai, Gansu, Ningxia, Inner Mongolia, and Shaanxi, through which the Yellow River flows, are pivotal for the construction of important water conservation areas in the Yellow River Basin and the realization of high-quality development. Consequently, these provinces should further strengthen and improve soil and water conservation projects and ecological restoration zone construction. An essential task is to enhance the long-term compensation mechanism for water resources and ecology and establish a basin cooperation and governance platform. Following the principle of “those who meet the standards benefit, those who exceed the standards compensate,” promoting the improvement of the ecological comprehensive compensation mechanism for the main stream and major tributaries of the Yellow River is imperative. Each province (autonomous region) should coordinate the development and protection of various ecosystem service functions according to its own situation, pursuing a path of civilized development that is environmentally friendly, productive, and prosperous.
Moreover, the central cities, including provincial capitals, in the western regions of China continue to experience robust development, giving rise to a powerful “siphoning effect” in various aspects of urban development. As industrialization progresses and development levels continually rise in the western regions, central cities represented by provincial capitals shift their focus from primarily relying on the siphoning effect to emphasizing a “radiating” effect. A broader urban network will gradually replace the singular central city, becoming the vehicle for the high-quality development of the western regions. In this new development stage, we should leverage the radiating role of provincial capitals and surrounding cities from the perspective of ecosystem service development. This approach will drive the ecological civilization construction and high-quality development of cities throughout the entire province or autonomous region.
The primary limitations of this study are as follows:
This study employed the value-equivalent method based on expert knowledge to calculate ESV. While efforts were made to collect expert opinions to minimize subjective bias, it cannot fundamentally eliminate such bias.
The dynamic changes in the static value-equivalent table were represented in this study using NPP, soil and water conservation, and precipitation. However, the values of NPP and soil and water conservation are derived from model calculations, and their numerical values may vary depending on the formulas and basic data used.
The study comprehensively explored the relationship between LUI, URB, and ESV at the prefecture-level city scale, potentially overlooking influences at the county and township levels.
In future research, ESV calculations can be extended to administrative scales below the prefecture level to obtain more detailed results and provide more specific development recommendations. In addition, some scholars have calculated ecological compensation standards for various cities based on ESV (Gao et al., 2021; Du et al., 2023). Such work is crucial for clarifying the responsibilities and rights of both compensation and payment parties. Further research can calculate ecological compensation considering the differences in environmental, social, and economic aspects among regions, offering valuable recommendations for the coordinated development of cities.
This study utilized data from 2000 to 2020 to assess LUI, URB, and ESV in various cities in arid northwestern China. It innovatively and comprehensively explored the spatial and temporal distribution characteristics of the coordination between ESV and LUI, as well as URB. The results indicate that, over time, LUI generally decreased, while URB and ESV increased in the entire arid northwestern region. The changes from 2010 to 2020 were more significant than those from 2000 to 2010. Spatially, there is an east-to-west gradient exists in the distribution of LUI, URB, and ESV per unit area. Furthermore, an examination of the coordination factors revealed that the correlation between ESV and LUI is higher than that between ESV and URB. On the basis of the high or low values of ESV, URB, and LUI, development suggestions for each city are proposed. Moreover, recommendations for the development of ecosystem service functions are provided, taking into account the 14th Five-Year Plan and “Vision 2035” of each province.
The original contributions presented in the study are included in the article/Supplementary Material. Further inquiries can be directed to the corresponding author.
SL: Software, Writing – original draft. ZG: Writing – review & editing, Supervision, Resources. WT: Methodology, Writing – review & editing. QW: Supervision, Writing – review & editing. LS: Writing – review & editing. YS: Writing – review & editing. YYS: Writing – review & editing. ZQ: Writing – review & editing.
The author(s) declare financial support was received for the research, authorship, and/or publication of this article. We gratefully acknowledge the funding for this study provided by the National Natural Science Foundation of China (No. 52109064), the Major Science and Technology Projects of the XPCC (2021AA003-2), the Major Science and Technology Projects of Autonomous Region (2020A01003-3), the Doctoral Dissertation Innovation Fund of Xi’an University of Technology (310–252072214), and Open Research Fund of China Institute of Water Resources and Hydropower Research (YSS2022010).
The authors declare that the research was conducted in the absence of any commercial or financial relationships that could be construed as a potential conflict of interest.
All claims expressed in this article are solely those of the authors and do not necessarily represent those of their affiliated organizations, or those of the publisher, the editors and the reviewers. Any product that may be evaluated in this article, or claim that may be made by its manufacturer, is not guaranteed or endorsed by the publisher.
The Supplementary Material for this article can be found online at: https://www.frontiersin.org/articles/10.3389/fevo.2023.1307274/full#supplementary-material
Bai X., Shi P., Liu Y. (2014). Society: Realizing China’s urban dream. Nature 509, 158–160. doi: 10.1038/509158a
Bian J., Ren H., Liu P. (2020). Evaluation of urban ecological well-being performance in China: A case study of 30 provincial capital cities. J. Cleaner Production 254, 120109. doi: 10.1016/j.jclepro.2020.120109
Chen W., Chi G. (2022). Urbanization and ecosystem services: The multi-scale spatial spillover effects and spatial variations. Land Use Policy 114, 105964. doi: 10.1016/j.landusepol.2021.105964
Chen W., Chi G., Li J. (2020). Ecosystem services and their driving forces in the middle reaches of the Yangtze river urban Agglomerations, China. IJERPH 17, 3717. doi: 10.3390/ijerph17103717
Chen Y., Jessel B., Fu B., Yu X., Pittock J. (2014). Ecosystem Services and Management Strategy in China (Berlin, Heidelberg: Springer Berlin Heidelberg). doi: 10.1007/978-3-642-38733-3
Chen Y., Li Z., Fan Y., Wang H., Deng H. (2015). Progress and prospects of climate change impacts on hydrology in the arid region of northwest China. Environ. Res. 139, 11–19. doi: 10.1016/j.envres.2014.12.029
Chen H., Liu L., Fang J., Li C., Wang L., Quan Q., et al. (2022). Spatio-temporal analysis of the coupling relationship between urbanization and eco-environment in backward regions of China. Environ. Sci. pollut. Res. 29, 7406–7423. doi: 10.1007/s11356-021-16240-z
Costanza R., de Groot R., Sutton P., van der Ploeg S., Anderson S. J., Kubiszewski I., et al. (2014). Changes in the global value of ecosystem services. Global Environ. Change 26, 152–158. doi: 10.1016/j.gloenvcha.2014.04.002
Costanza R., Limburg K., Naeem S., O’Neill R. V., Paruelo J., Raskin R. G., et al. (1997). The value of the world’s ecosystem services and natural capital. Nature 387, 253–260. doi: 10.1038/387253a0
Cumming G. S., Buerkert A., Hoffmann E. M., Schlecht E., Von Cramon-Taubadel S., Tscharntke T. (2014). Implications of agricultural transitions and urbanization for ecosystem services. Nature 515, 50–57. doi: 10.1038/nature13945
Du H., Zhao L., Zhang P., Li J., Yu S. (2023). Ecological compensation in the Beijing-Tianjin-Hebei region based on ecosystem services flow. J. Environ. Manage. 331, 117230. doi: 10.1016/j.jenvman.2023.117230
Duan X., Chen Y., Wang L., Zheng G., Liang T. (2023). The impact of land use and land cover changes on the landscape pattern and ecosystem service value in Sanjiangyuan region of the Qinghai-Tibet Plateau. J. Environ. Manage. 325, 116539. doi: 10.1016/j.jenvman.2022.116539
Fan Y., Fang C., Zhang Q. (2019). Coupling coordinated development between social economy and ecological environment in Chinese provincial capital cities-assessment and policy implications. J. Cleaner Production 229, 289–298. doi: 10.1016/j.jclepro.2019.05.027
Fan S., Li P., He Q., Cheng J., Zhang M., Wu N., et al. (2022). Study on the spatial-temporal evolution of land use ecosystem service value and its zoning management and control in the typical alpine valley area of southeast Tibet—Empirical analysis based on panel data of 97 villages in Chayu county. Sustainability 14, 10057. doi: 10.3390/su141610057
Fan X., Yu H., Tiando D. S., Rong Y., Luo W., Eme C., et al. (2021). Impacts of human activities on ecosystem service value in arid and semi-arid ecological regions of China. IJERPH 18, 11121. doi: 10.3390/ijerph182111121
Farley J. (2012). Ecosystem services: The economics debate. Ecosystem Serv. 1, 40–49. doi: 10.1016/j.ecoser.2012.07.002
Feng Z., Yang Y., Zhang Y., Zhang P., Li Y. (2005). Grain-for-green policy and its impacts on grain supply in West China. Land Use Policy 22, 301–312. doi: 10.1016/j.landusepol.2004.05.004
Frazier A. E., Bryan B. A., Buyantuev A., Chen L., Echeverria C., Jia P., et al. (2019). Ecological civilization: perspectives from landscape ecology and landscape sustainability science. Landscape Ecol. 34, 1–8. doi: 10.1007/s10980-019-00772-4
Gao X., Shen J., He W., Zhao X., Li Z., Hu W., et al. (2021). Spatial-temporal analysis of ecosystem services value and research on ecological compensation in Taihu Lake Basin of Jiangsu Province in China from 2005 to 2018. J. Cleaner Production 317, 128241. doi: 10.1016/j.jclepro.2021.128241
Han J., Wang D., Zhang S. (2022). Momoge internationally important wetland: ecosystem integrity remote assessment and spatial pattern optimization study. Land 11, 1344. doi: 10.3390/land11081344
He S., Wang D., Zhao P., Li Y., Lan H., Chen W., et al. (2021). Quantification of basin-scale multiple ecosystem services in ecologically fragile areas. CATENA 202, 105247. doi: 10.1016/j.catena.2021.105247
He W., Zhang K., Kong Y., Yuan L., Peng Q., Mulugeta Degefu D., et al. (2023). Reduction pathways identification of agricultural water pollution in Hubei Province, China. Ecol. Indic. 153, 110464. doi: 10.1016/j.ecolind.2023.110464
He N., Zhou Y., Wang L., Li Q., Zuo Q., Liu J. (2022). Spatiotemporal differentiation and the coupling analysis of ecosystem service value with land use change in Hubei Province, China. Ecol. Indic. 145, 109693. doi: 10.1016/j.ecolind.2022.109693
Iizumi T., Sakai T. (2020). The global dataset of historical yields for major crops 1981–2016. Sci. Data 7, 97. doi: 10.1038/s41597-020-0433-7
Jia Y., Liu Y., Zhang S. (2021). Evaluation of agricultural ecosystem service value in arid and semiarid regions of northwest China based on the equivalent factor method. Environ. Process. 8, 713–727. doi: 10.1007/s40710-021-00514-2
Jiang H., Sun Z., Guo H., Weng Q., Du W., Xing Q., et al. (2021). An assessment of urbanization sustainability in China between 1990 and 2015 using land use efficiency indicators. NPJ Urban Sustain 1, 34. doi: 10.1038/s42949-021-00032-y
Kuang W., Zhang S., Li X., Lu D. (2021). A 30 m resolution dataset of China’s urban impervious surface area and green space 2000–2018. Earth Syst. Sci. Data 13, 63–82. doi: 10.5194/essd-13-63-2021
Lai S. L., Chen D.-N. (2020). A research on the relationship between environmental sustainability management and human development. Sustainability 12, 9001. doi: 10.3390/su12219001
Li G., Fang C., Wang S. (2016). Exploring spatiotemporal changes in ecosystem-service values and hotspots in China. Sci. Total Environ. 545–546, 609–620. doi: 10.1016/j.scitotenv.2015.12.067
Li B., Guan M., Zhan L., Liu C., Zhang Z., Jiang H., et al. (2022). Urban comprehensive carrying capacity and development order: A “Pressure-capacity-potential” Logical Framework. Front. Environ. Sci. 10. doi: 10.3389/fenvs.2022.935498
Li Z., Luan W., Zhang Z., Su M. (2020). Relationship between urban construction land expansion and population/economic growth in Liaoning Province, China. Land Use Policy 99, 105022. doi: 10.1016/j.landusepol.2020.105022
Li B., Shi X., Chen Y., Jiang Y. (2019). Quantitative assessment of the ecological effects of land use/cover change in the arid region of Northwest China. Environ. Monit. Assess. 191, 704. doi: 10.1007/s10661-019-7911-4
Li M., Wang X., Chen J. (2022). Assessment of grassland ecosystem services and analysis on its driving factors: A case study in Hulunbuir grassland. Front. Ecol. Evol. 10. doi: 10.3389/fevo.2022.841943
Li N., Wang J., Wang H., Fu B., Chen J., He W. (2021). Impacts of land use change on ecosystem service value in Lijiang River Basin, China. Environ. Sci. Pollut. Res. 28, 46100–46115. doi: 10.1007/s11356-020-12190-0
Li Y., Zhan J., Liu Y., Zhang F., Zhang M. (2018). Response of ecosystem services to land use and cover change: A case study in Chengdu City. Resources Conserv. Recycling 132, 291–300. doi: 10.1016/j.resconrec.2017.03.009
Liang W., Yang M. (2019). Urbanization, economic growth and environmental pollution: Evidence from China. Sustain. Computing: Inf. Syst. 21, 1–9. doi: 10.1016/j.suscom.2018.11.007
Lichtenberg E. M., Kennedy C. M., Kremen C., Batáry P., Berendse F., Bommarco R., et al. (2017). A global synthesis of the effects of diversified farming systems on arthropod diversity within fields and across agricultural landscapes. Glob Change Biol. 23, 4946–4957. doi: 10.1111/gcb.13714
Liu S., Huang G., Wei Y., Qu Z. (2022). Monitoring and assessing land use/cover change and ecosystem service value using multi-resolution remote sensing data at urban ecological zone. Sustainability 14, 11187. doi: 10.3390/su141811187
Liu D., Li Y., Wang P., Zhong H., Wang P. (2021). Sustainable agriculture development in northwest China under the impacts of global climate change. Front. Nutr. 8. doi: 10.3389/fnut.2021.706552
Long H. (2020). Land Use Transitions and Rural Restructuring in China (Singapore: Springer Singapore). doi: 10.1007/978-981-15-4924-3
Lyu H., Dong Z., Roobavannan M., Kandasamy J., Pande S. (2019). Rural unemployment pushes migrants to urban areas in Jiangsu Province, China. Palgrave Commun. 5, 92. doi: 10.1057/s41599-019-0302-1
Mahtta R., Fragkias M., Güneralp B., Mahendra A., Reba M., Wentz E. A., et al. (2022). Urban land expansion: the role of population and economic growth for 300+ cities. NPJ Urban Sustain 2, 5. doi: 10.1038/s42949-022-00048-y
MA, M.E.A (2005). Millennium Ecosystem Assessment. Ecosystems and human well-being: synthesis (Island Press, Washington, DC.:World Resources Institute).
Mauerhofer V. (2018). The law, ecosystem services and ecosystem functions: An in-depth overview of coverage and interrelation. Ecosystem Serv. 29, 190–198. doi: 10.1016/j.ecoser.2017.05.011
Ministry of Ecology and Environment of the People’s Republic of China (2023). Available at: https://www.mee.gov.cn/ywdt/xwfb/202301/t20230128_1014006.shtml (Accessed December 5, 2023).
Narducci J., Quintas-Soriano C., Castro A., Som-Castellano R., Brandt J. S. (2019). Implications of urban growth and farmland loss for ecosystem services in the western United States. Land Use Policy 86, 1–11. doi: 10.1016/j.landusepol.2019.04.029
Ning Y., Zhang F. (2021). The high quality development of provincial capital cities: based on theChange of primate degree of the provincial capital cities in China. J. Tongji Univ. (Social Sci. Section) 32, 9. doi: CNKI:SUN:TJDS.0.2021-03-013
Shaanxi Provincial Bureau of Statistics (2022). Available at: http://tjj.shaanxi.gov.cn/tjsj/ndsj/tjnj/sxtjnj/index.html?2023 (Accessed December 5, 2023).
Shi L., Halik Ü., Mamat Z., Aishan T., Abliz A., Welp M. (2021). Spatiotemporal investigation of the interactive coercing relationship between urbanization and ecosystem services in arid northwestern China. Land Degrad Dev. 32, 4105–4120. doi: 10.1002/ldr.3946
Shi Y., Shi D., Zhou L., Fang R. (2020). Identification of ecosystem services supply and demand areas and simulation of ecosystem service flows in Shanghai. Ecol. Indic. 115, 106418. doi: 10.1016/j.ecolind.2020.106418
Sukhdev P., Wittmer H., Schröter-Schlaack C., Neßhöver C., Bishop J., Ten Brink P., et al. (2010). Mainstreaming the Economics of Nature: a Synthesis of the Approach, Conclusions and Recommendations of TEEB (United Nations Environment Programme (UNEP)).
Sun Y., Liu S., Dong Y., An Y., Shi F., Dong S., et al. (2019). Spatio-temporal evolution scenarios and the coupling analysis of ecosystem services with land use change in China. Sci. Total Environ. 681, 211–225. doi: 10.1016/j.scitotenv.2019.05.136
Tian Y., Xu D., Song J., Guo J., You X., Jiang Y. (2022). Impacts of land use changes on ecosystem services at different elevations in an ecological function area, northern China. Ecol. Indic. 140, 109003. doi: 10.1016/j.ecolind.2022.109003
UN-Habitat (2022) Urbanization is unstoppable, global urban population will account for 68% by 2050 [WWW Document]. Available at: https://news.un.org/zh/story/2022/06/1105282 (Accessed June 28, 2023).
Wang L., Chen C., Xie F., Hu Z., Zhang Z., Chen H., et al. (2021). Estimation of the value of regional ecosystem services of an archipelago using satellite remote sensing technology: A case study of Zhoushan Archipelago, China. Int. J. Appl. Earth Observation Geoinformation 105, 102616. doi: 10.1016/j.jag.2021.102616
Wang B., Gao P., Niu X., Sun J. (2017). Policy-driven China’s Grain to Green Program: Implications for ecosystem services. Ecosystem Serv. 27, 38–47. doi: 10.1016/j.ecoser.2017.07.014
Wang Z.-J., Liu S.-J., Li J.-H., Pan C., Wu J.-L., Ran J., et al. (2022). Remarkable improvement of ecosystem service values promoted by land use/land cover changes on the Yungui Plateau of China during 2001–2020. Ecol. Indic. 142, 109303. doi: 10.1016/j.ecolind.2022.109303
Wang J., Wang S., Li S., Feng K. (2019). Coupling analysis of urbanization and energy-environment efficiency: Evidence from Guangdong province. Appl. Energy 254, 113650. doi: 10.1016/j.apenergy.2019.113650
Xi Y., Peng S., Liu G., Ducharne A., Ciais P., Prigent C., et al. (2022). Trade-off between tree planting and wetland conservation in China. Nat. Commun. 13, 1967. doi: 10.1038/s41467-022-29616-7
Xie G.-D., Lu C. X., Leng Y.-F., Zheng D. U., Li S. C. (2003). Ecological assets valuation of the Tibetan Plateau. J. Natural Resour. 18, 189–196. doi: CNKI:SUN:ZRZX.0.2003-02-010
Xu Z., Zhang Z., Li C. (2019). Exploring urban green spaces in China: Spatial patterns, driving factors and policy implications. Land Use Policy 89, 104249. doi: 10.1016/j.landusepol.2019.104249
Yang M., Gao X., Siddique K. H. M., Wu P., Zhao X. (2023). Spatiotemporal exploration of ecosystem service, urbanization, and their interactive coercing relationship in the Yellow River Basin over the past 40 years. Sci. Total Environ. 858, 159757. doi: 10.1016/j.scitotenv.2022.159757
Yang L., Tian J., Fu Y., Zhu B., He X., Gao M., et al. (2022). Will the arid and semi-arid regions of Northwest China become warmer and wetter based on CMIP6 models? Hydrology Res. 53, 29–50. doi: 10.2166/nh.2021.069
Yang F., Yang M., Xue B., Luo Q. (2018). The effects of China’s western development strategy implementation on local ecological economic performance. J. Cleaner Production 202, 925–933. doi: 10.1016/j.jclepro.2018.08.203
Yin L., Zheng W., Shi H., Ding D. (2022). Ecosystem services assessment and sensitivity analysis based on ANN model and spatial data: A case study in Miaodao Archipelago. Ecol. Indic. 135, 108511. doi: 10.1016/j.ecolind.2021.108511
Yu Z., Zhang H., Tao Z., Liang J. (2019). Amenities, economic opportunities and patterns of migration at the city level in China. Asian Pacific Migration J. 28, 3–27. doi: 10.1177/0117196819832054
Yuan L., Li R., He W., Wu X., Kong Y., Degefu D. M., et al. (2022). Coordination of the industrial-ecological economy in the Yangtze river economic belt, China. Front. Environ. Sci. 10. doi: 10.3389/fenvs.2022.882221
Zhang Z., Gao J., Gao Y. (2015). The influences of land use changes on the value of ecosystem services in Chaohu Lake Basin, China. Environ. Earth Sci. 74, 385–395. doi: 10.1007/s12665-015-4045-z
Zhang W., Hu G., Dang Y., Weindorf D. C., Sheng J. (2016). Afforestation and the impacts on soil and water conservation at decadal and regional scales in Northwest China. J. Arid Environments 130, 98–104. doi: 10.1016/j.jaridenv.2016.03.003
Zhang S., Wang Y., Wang Y., Li Z., Hou Y. (2023a). Spatiotemporal evolution and influencing mechanisms of ecosystem service value in the Tarim River Basin, northwest China. Remote Sens. 15, 591. doi: 10.3390/rs15030591
Zhang S., Wu T., Guo L., Zou H., Shi Y. (2023b). Integrating ecosystem services supply and demand on the Qinghai-Tibetan Plateau using scarcity value assessment. Ecol. Indic. 147, 109969. doi: 10.1016/j.ecolind.2023.109969
Zhang Z., Xia F., Yang D., Huo J., Wang G., Chen H. (2020). Spatiotemporal characteristics in ecosystem service value and its interaction with human activities in Xinjiang, China. Ecol. Indic. 110, 105826. doi: 10.1016/j.ecolind.2019.105826
Zhang Q., Ye S., Ma T., Fang X., Shen Y., Ding L. (2023). Influencing factors and trend prediction of PM2.5 concentration based on STRIPAT-Scenario analysis in Zhejiang Province, China. Environ. Dev. Sustain 25, 14411–14435. doi: 10.1007/s10668-022-02672-1
Zhou Z., Sun X., Zhang X., Wang Y. (2022). Inter-regional ecological compensation in the Yellow River Basin based on the value of ecosystem services. J. Environ. Manage. 322, 116073. doi: 10.1016/j.jenvman.2022.116073
Zhou Y., Zhang X., Yu H., Liu Q., Xu L. (2021). Land use-driven changes in ecosystem service values and simulation of future scenarios: A case study of the Qinghai–Tibet plateau. Sustainability 13, 4079. doi: 10.3390/su13074079
Zou Y., Deng M., Wang Q., Zhang Q., Rong Y. (2022). Evolution characteristics of new urbanization in the provincial capital cities of western China. Front. Environ. Sci. 10. doi: 10.3389/fenvs.2022.926444
Keywords: land use intensity, urbanization, ecosystem service value, coupling analysis, arid region
Citation: Liu S, Gao Z, Tao W, Wang Q, Su L, Sun Y, Shan Y and Qu Z (2024) Research on the coordinated relationship between human activities and ecosystem service value in the Arid Region, Northwestern China. Front. Ecol. Evol. 11:1307274. doi: 10.3389/fevo.2023.1307274
Received: 04 October 2023; Accepted: 18 December 2023;
Published: 09 January 2024.
Edited by:
Ümüt Halik, Xinjiang University, ChinaCopyright © 2024 Liu, Gao, Tao, Wang, Su, Sun, Shan and Qu. This is an open-access article distributed under the terms of the Creative Commons Attribution License (CC BY). The use, distribution or reproduction in other forums is permitted, provided the original author(s) and the copyright owner(s) are credited and that the original publication in this journal is cited, in accordance with accepted academic practice. No use, distribution or reproduction is permitted which does not comply with these terms.
*Correspondence: Wanghai Tao, eGF1dHNvaWx3YXRlckAxNjMuY29t
†These authors have contributed equally to this work
Disclaimer: All claims expressed in this article are solely those of the authors and do not necessarily represent those of their affiliated organizations, or those of the publisher, the editors and the reviewers. Any product that may be evaluated in this article or claim that may be made by its manufacturer is not guaranteed or endorsed by the publisher.
Research integrity at Frontiers
Learn more about the work of our research integrity team to safeguard the quality of each article we publish.