 Yuting Yang
 Chenyang Zhang
 Yushi Lu1
 Zhenwei Dai
94% of researchers rate our articles as excellent or good
Learn more about the work of our research integrity team to safeguard the quality of each article we publish.
Find out more
ORIGINAL RESEARCH article
Front. Ecol. Evol. , 10 January 2024
Sec. Environmental Informatics and Remote Sensing
Volume 11 - 2023 | https://doi.org/10.3389/fevo.2023.1301261
This article is part of the Research Topic Interplay between Coastal Marine Environmental Dynamics and Ecosystem Protection: Theoretical Analysis, Laboratory Experiment, and Numerical Simulation View all 3 articles
A significant number of ancient landslides with double or multi-sliding zones exist in reservoir areas. However, understanding large-scale reservoir landslides with double-sliding zones remains limited due to the challenges of studying deformation along the sliding zone independently from surface deformation. In this study, the seepage and deformation characteristics of the Taping landslide were obtained through field investigations and long-term in-situ monitoring. For the first time, hydrological factors influencing double-sliding zones were revealed using an attribute reduction algorithm based on long-term field data. The results indicate that the Taping landslide undergoes significant step-like consistent creep deformation, exhibiting failure along double-sliding zones. For the toe part, reservoir water level (RWL) and precipitation are two critical hydrological factors triggering deformation. Shallow sliding is more susceptible to rainfall, while the deep sliding zone is more affected by RWL variations. In the rear part, precipitation has a greater impact than RWL. Daily precipitation is the primary hydrological factor affecting slope movement along the shallow sliding zone. However, accumulated precipitation over the previous seven days is the most crucial factor influencing slope movement along the deep sliding zone. During the RWL drawdown period, shallow sliding initially occurs at the toe, induced by the de-buttressing effect, while deep sliding occurs after the RWL reaches 145 m, induced by the downslope seepage force. Local damage and failure at the toe provide space for the instability of the rear part, reducing the anti-sliding force. Consequently, failure extends to the rear part. The findings of this study hold significant implications for gaining a deeper understanding of the deformation mechanisms of large-scale reservoir landslides with double-sliding zones and improving landslide management and mitigation strategies in reservoir area.
The Three Gorges Reservoir (TGR) began impounding water for power generation in June 2003, and by 2008, the reservoir water level (RWL) had risen to 172 m above sea level (a.s.l.). Since 2010, the RWL has experienced annual fluctuations between 145 and 175 m a.s.l. These fluctuations in RWL have been frequently linked to the occurrence of landslides (Tang et al., 2015; Yin et al., 2016). In 2003, when impoundment began, the Shuping landslide was reactivated, and its deformation intensified after the RWL reached 171 m a.s.l. in 2008 (Wang et al., 2008). Similarly, significant reactivation deformation was observed in the Liangshuijing landslide in 2008, when the impoundment reached 171 m a.s.l. (Li et al., 2021). The Outang landslide in Fengjie County, a large-scale ancient landslide, has recently experienced considerable deformation and reactivation due to the combined effects of rainfall and RWL fluctuations (Yin et al., 2010; Zou et al., 2023). Consequently, the reactivation of large-scale ancient landslides along the TGR area has become a critical issue, substantially impacting the reservoir’s safe operation (Huang et al., 2020; Liao et al., 2023).
RWL fluctuations primarily trigger the reactivation of ancient landslides along the reservoir banks (Lane and Griffiths, 2000; Wu et al., 2022). The influence of RWL fluctuations on landslide stability depends on various factors, including the permeability of the slide mass (Zangerl et al., 2009), the geometry of the sliding surface (Paronuzzi et al., 2013), and the rate of RWL fluctuations (Takayama and Fumitoshi, 2023). Tang et al. (2019) classified reservoir landslides in the TGR area into seepage-induced and buoyancy-induced landslides. Examples of buoyancy-induced landslides include the Baijiapu landslide, the Baishuihe landslide, and the Shuping landslide, which primarily undergo deformation during periods of high RWL and reservoir water rising (Seguí et al., 2020). The main mechanism of instability for these landslides is the increase in pore water pressure at the front edge of the landslide and the reduction in effective stress as the RWL rises, inducing deformation (Wang et al., 2008). Seepage-induced landslides, such as the Taping ancient landslide (Zhang et al., 2021a) and Outang landslide (Wang et al., 2021), typically occur during rapid RWL drawdown. The primary mechanism for seepage-induced landslides is the sudden drop in water pressure at the slope’s toe, thus generating the outward seepage force, as the pore water pressure does not dissipate easily (Zhang et al., 2022).
Seasonal precipitation is another crucial factor in the deformation and failure of reservoir landslides in the TGR area (Tang et al., 2019). During the annual low RWL period (i.e., 145 m a.s.l.), the TGR area experiences substantial rainfall, causing rainwater to infiltrate the sliding body. This infiltration increases the sliding body material’s weight, raises the groundwater level (GWL), reduces the effective stress in the sliding zone soil, and ultimately leads to the instability of the reservoir bank slope (Segoni et al., 2018; Zhang et al., 2023). For large-scale reservoir landslides, previous researches has indicated that rainfall in the rear can significantly elevate the GWL. Consequently, the hydraulic head difference between the front and rear edges within the slope substantially increases the hydraulic gradient, which is extremely detrimental to the stability of large-scale reservoir landslides (Zhang et al., 2021b).
Previous research has primarily focused on the deformation response characteristics and instability mechanisms of reservoir landslides with single-sliding zones. However, in the TGR area, numerous ancient landslides feature double-sliding zones and multiple-sliding zones (Tomás et al., 2016; Liao et al., 2021). Due to the varying positions of these slide zones, landslides’ responses to RWL and precipitation differ significantly across distinct sliding zones (Zhang et al., 2023). Consequently, the stability of landslides within each sliding zone also varies under the influence of RWL fluctuations. Despite this, our understanding of the deformation characteristics of reservoir landslides with double-sliding zones remains limited, as it is challenging to study deformation along the sliding zone separately from surface deformation.
This paper uses the Taping landslide in the TGR area as a case study. Through field investigation, we reveal the landslide’s basic characteristics, and long-term in-situ monitoring uncovers the surface deformation characteristics in response to RWL and precipitation. Most importantly, for the first time, long-term inclinometer monitoring reveals the response characteristics of deformation along the double-sliding zones to RWL and precipitation. The findings of this paper significantly contribute to our understanding of the deformation mechanisms of large-scale reservoir landslides with double-sliding zones.
The Taping landslide, a large ancient reservoir landslide, is situated in Quchi town, Chongqing city, China (Figure 1). A field investigation conducted from April to September 2019 revealed the landslide’s fundamental features. Spanning 590 meters in length and with a width ranging from 480 to 550 m (Figure 1C), the landslide has an average thickness of 60 meters. It occupies an area of 28.3 × 10⁴ square meters and comprises a volume of 18.91 million cubic meters. The slope gradient of the landslide is relatively gentle in the rear region (2–7° between 261 and 300 m a.s.l), where Quchi Town is located. However, it becomes steeper in the leading and middle sections (24–37° between 142 and 261 m a.s.l.). In recent years, the active movement zone of the landslide has been found to be concentrated in the southeastern section (Figure 1C), with a width and length of 450 and 330 m, respectively. The active movement zone covers an area of 14.89 × 10⁴ square meters, has an average thickness of 50 m, and contains a volume of 6.34 million cubic meters.
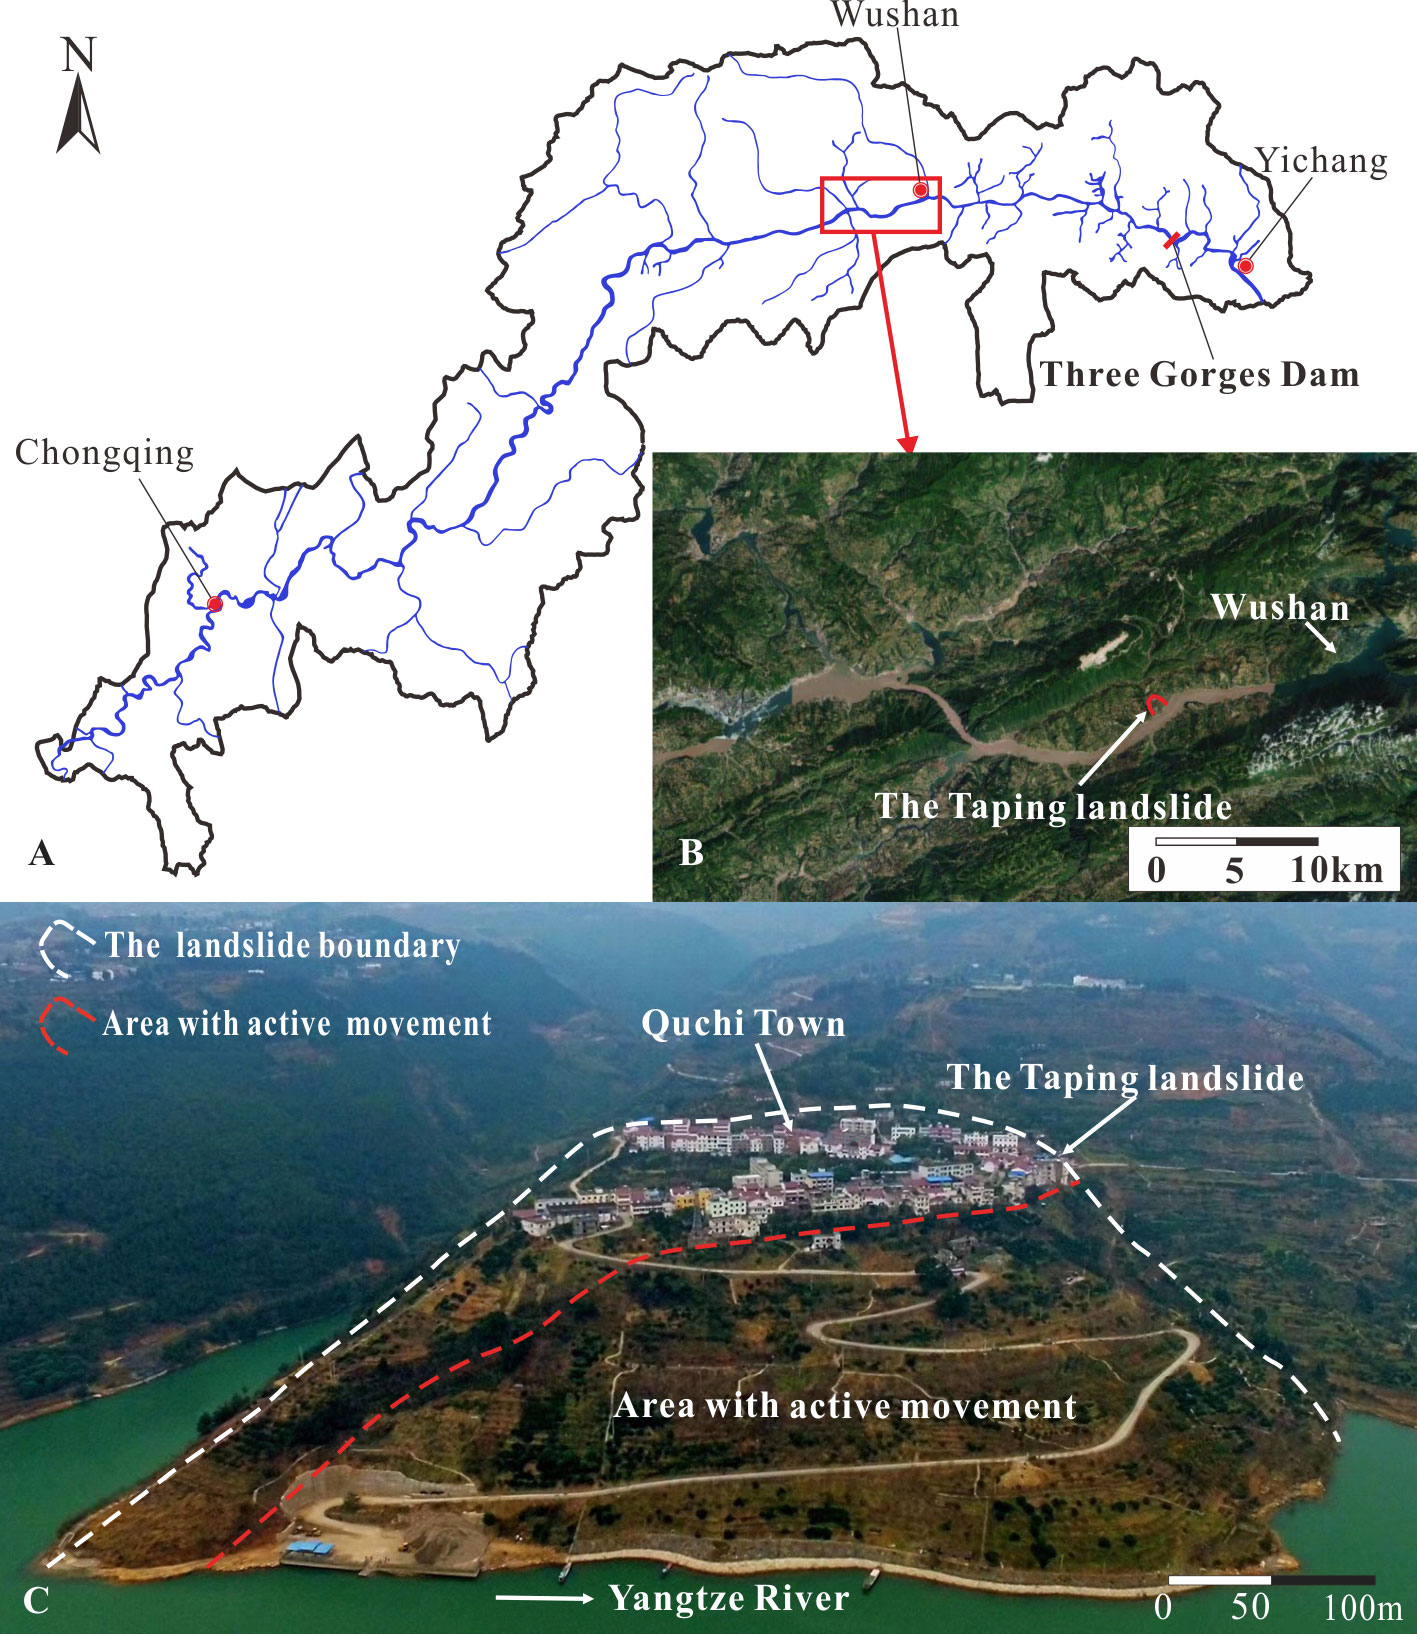
Figure 1 Location (A, B) and overview photo (C) of the Taping landslide.
The field investigation disclosed the material composition and structural characteristics of the Taping landslide, as illustrated in a typical geological section presented in Figure 2. As depicted in Figure 2, the upper layer of the sliding body consists of silty clay with a thickness ranging from 10–15 m. Beneath this layer lies a fractured quartz sandstone layer, with a thickness varying between 35 and 80 m, which serves as the primary geomaterial for potential failure. The rock fragmentation degree differs across sections within this layer; the upper part is relatively intact, while the lower part is more fragmented. The bedrock is located below the fractured quartz sandstone layer and comprises sandstone and carbon shale from the Xujiahe Formation in the Upper Triassic system (T3xj). The strata’s orientation is 130° with a dip of 22°. Drilling cores also indicate that a mud layer exists beneath the bedrock, and a gravelly soil layer with a thickness of 2–5 m is embedded within the fractured quartz sandstone layer.
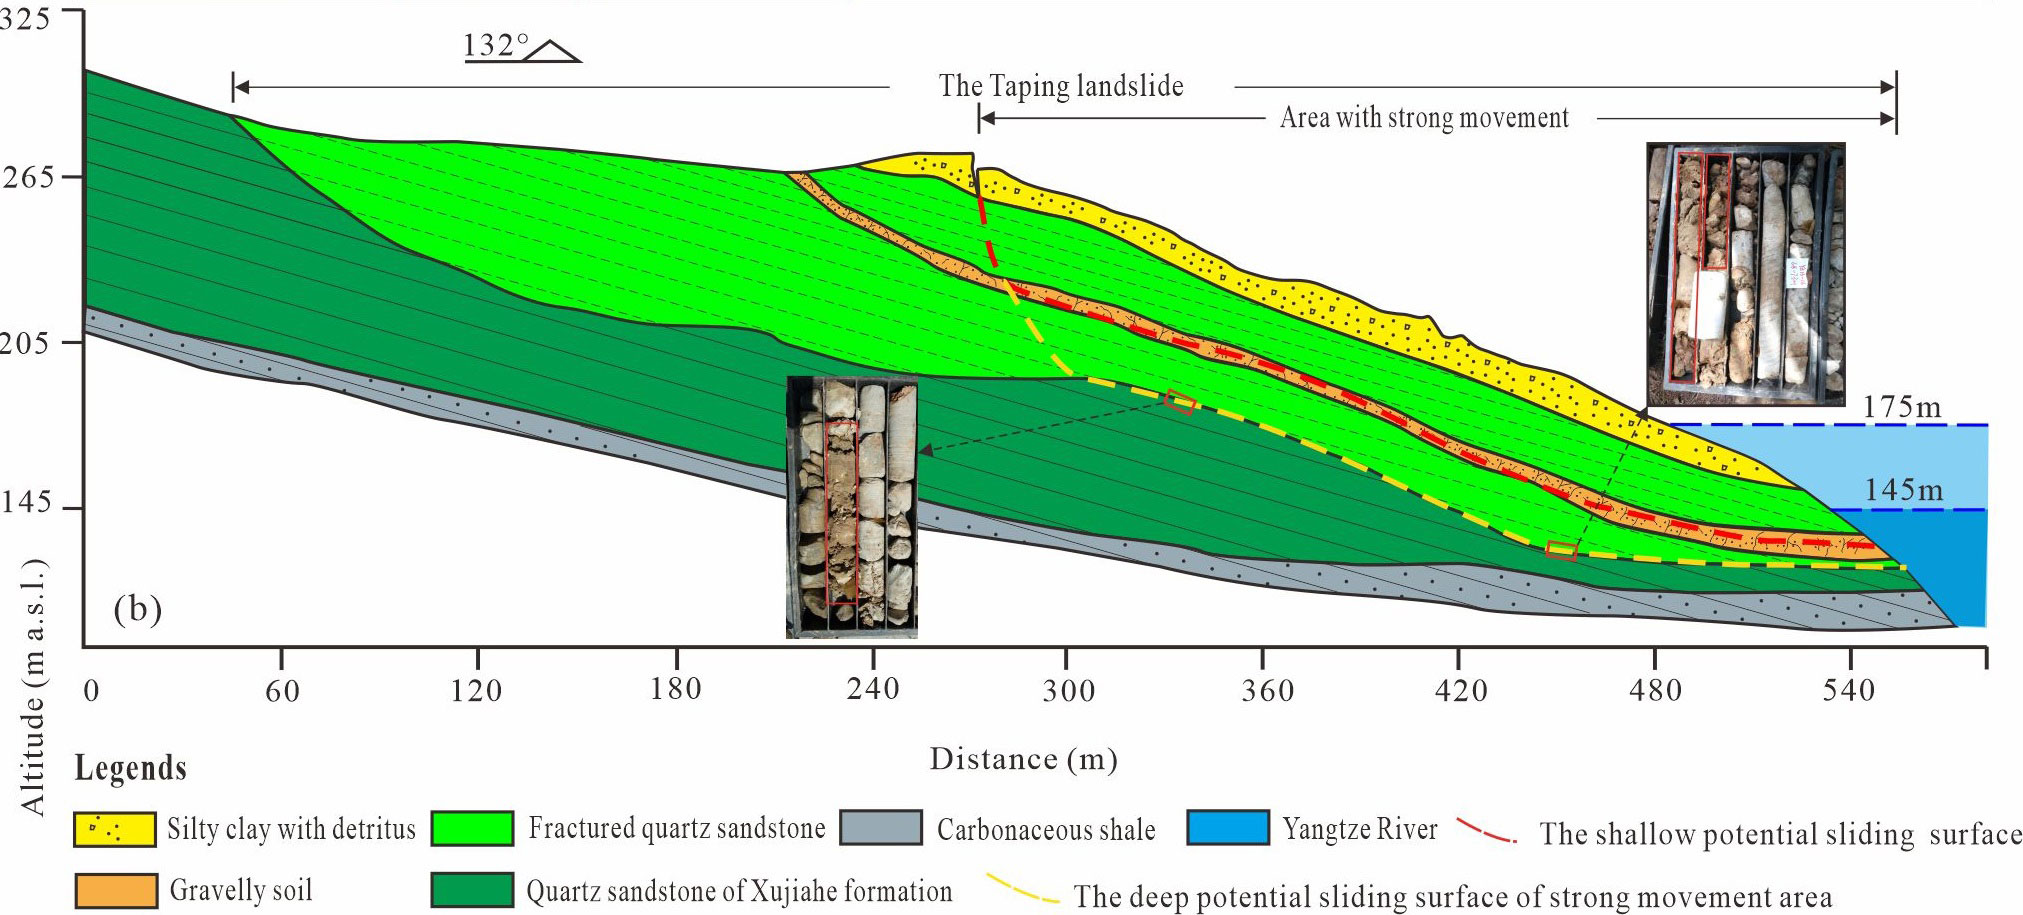
Figure 2 Cross-section of the Taping landslides (from Zhang et al., 2021a).
To obtain the GWL, surface displacement, and subsurface displacement of the Taping landslide, a long-term in-situ monitoring system has been established since 2014. This monitoring system primarily consists of displacement and hydrological monitoring stations, with the detailed layout shown in Figure 3. Surface displacements were obtained from GNSS measurement stations, providing readings with an accuracy of ±2.5 mm+l ppm in planimetry and ±5.0 mm+2 ppm in altimetry. Data collection intervals were set at 10-day intervals and reduced during periods of rapid RWL fluctuations and heavy rainfall. Subsurface displacements were measured using inclinometers, including an automatic displacement monitoring station (SB02) and manual displacement monitoring stations (SB05, SB06, SB07, and SB10).
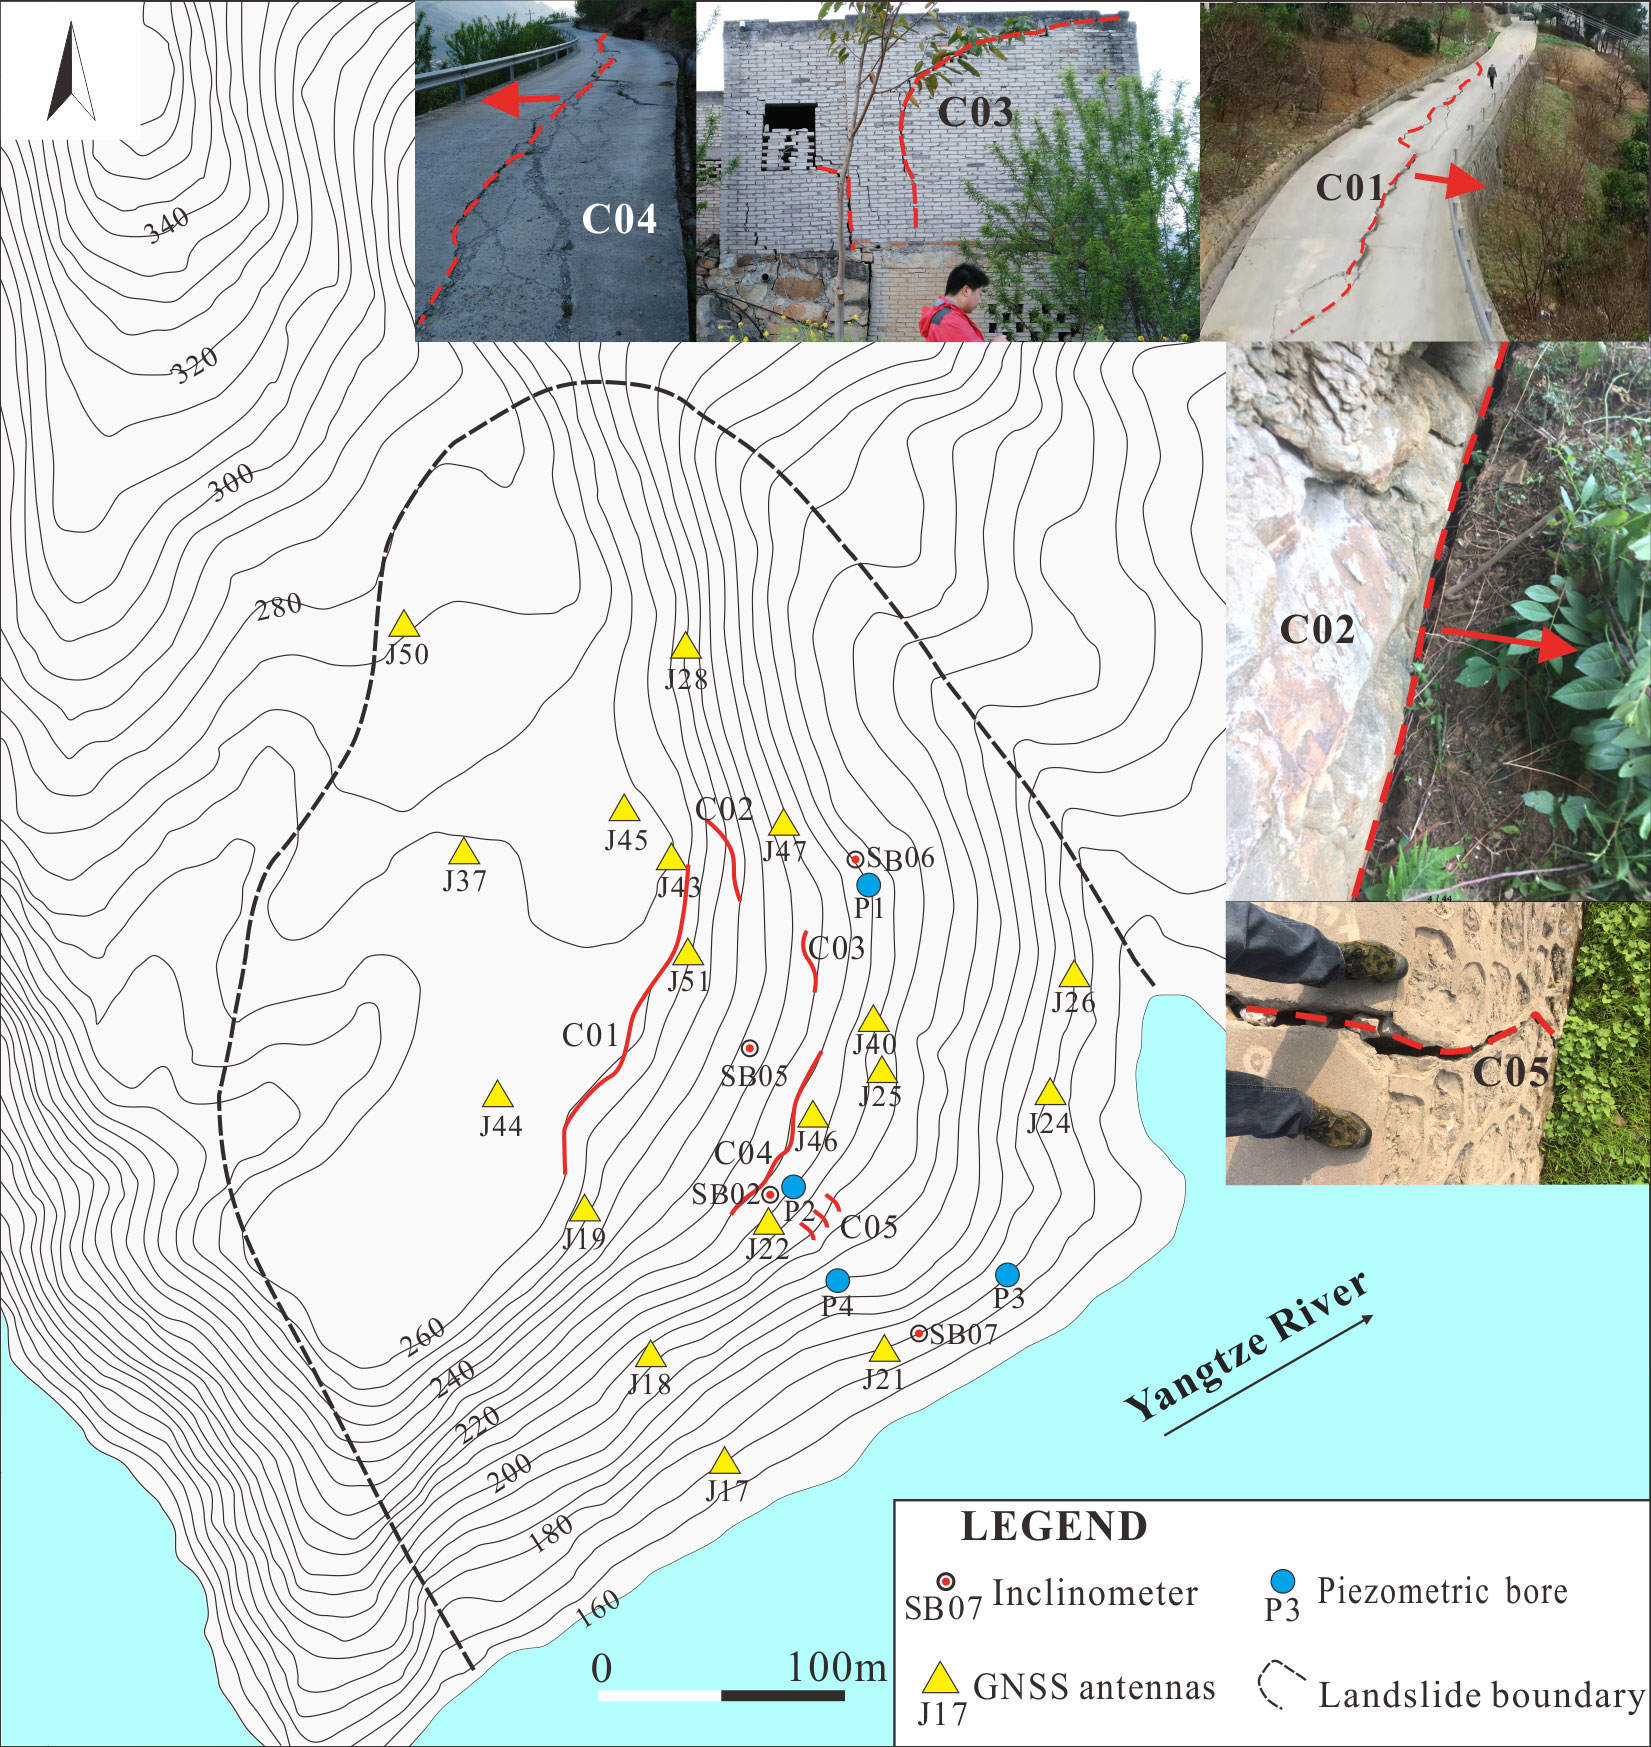
Figure 3 Plan map of the Taping landslide and the layout of the in-situ monitoring system (modified from Zhang et al., 2021a).
Hydrological monitoring included GWL, RWL, and precipitation. Real-time GWL data were automatically collected by pore water piezometers (P1, P2, P3, and P4), with locations shown in Figure 3. Data on RWL variations were obtained from the weather station in Wushan town, while rainfall data were gathered from a rain gauge installed in Wushan town. Although the rain gauge is only 2 km away from the Taping landslide, its precipitation data has been discontinuous since 2008 due to frequent failures. In contrast, the rainfall data monitored by the Wushan town weather station are accurate and continuous, so they were used in our research.
Figure 4 shows the monitored GWL variations from April 2017 to September 2019, alongside RWL fluctuations and precipitation. P3 is located at the toe of the landslide, P4 at the middle, and P2 at the rear. The detailed locations can be found in Figure 3. It is evident that the GWL at P3 and P4 are very close and consistent with RWL. Interestingly, when the RWL dropped below 150 meters, the GWL at P4 gradually flattened and eventually stabilized at 149 m, while the GWL at P3 continued to drop to 144 m as the RWL decreased. This led to an increased water head between P3 and P4, primarily occurring during the late stages of rapid RWL drawdown and throughout the low RWL period. When the RWL rose higher than 150 m, the water head between P3 and P4 disappeared.
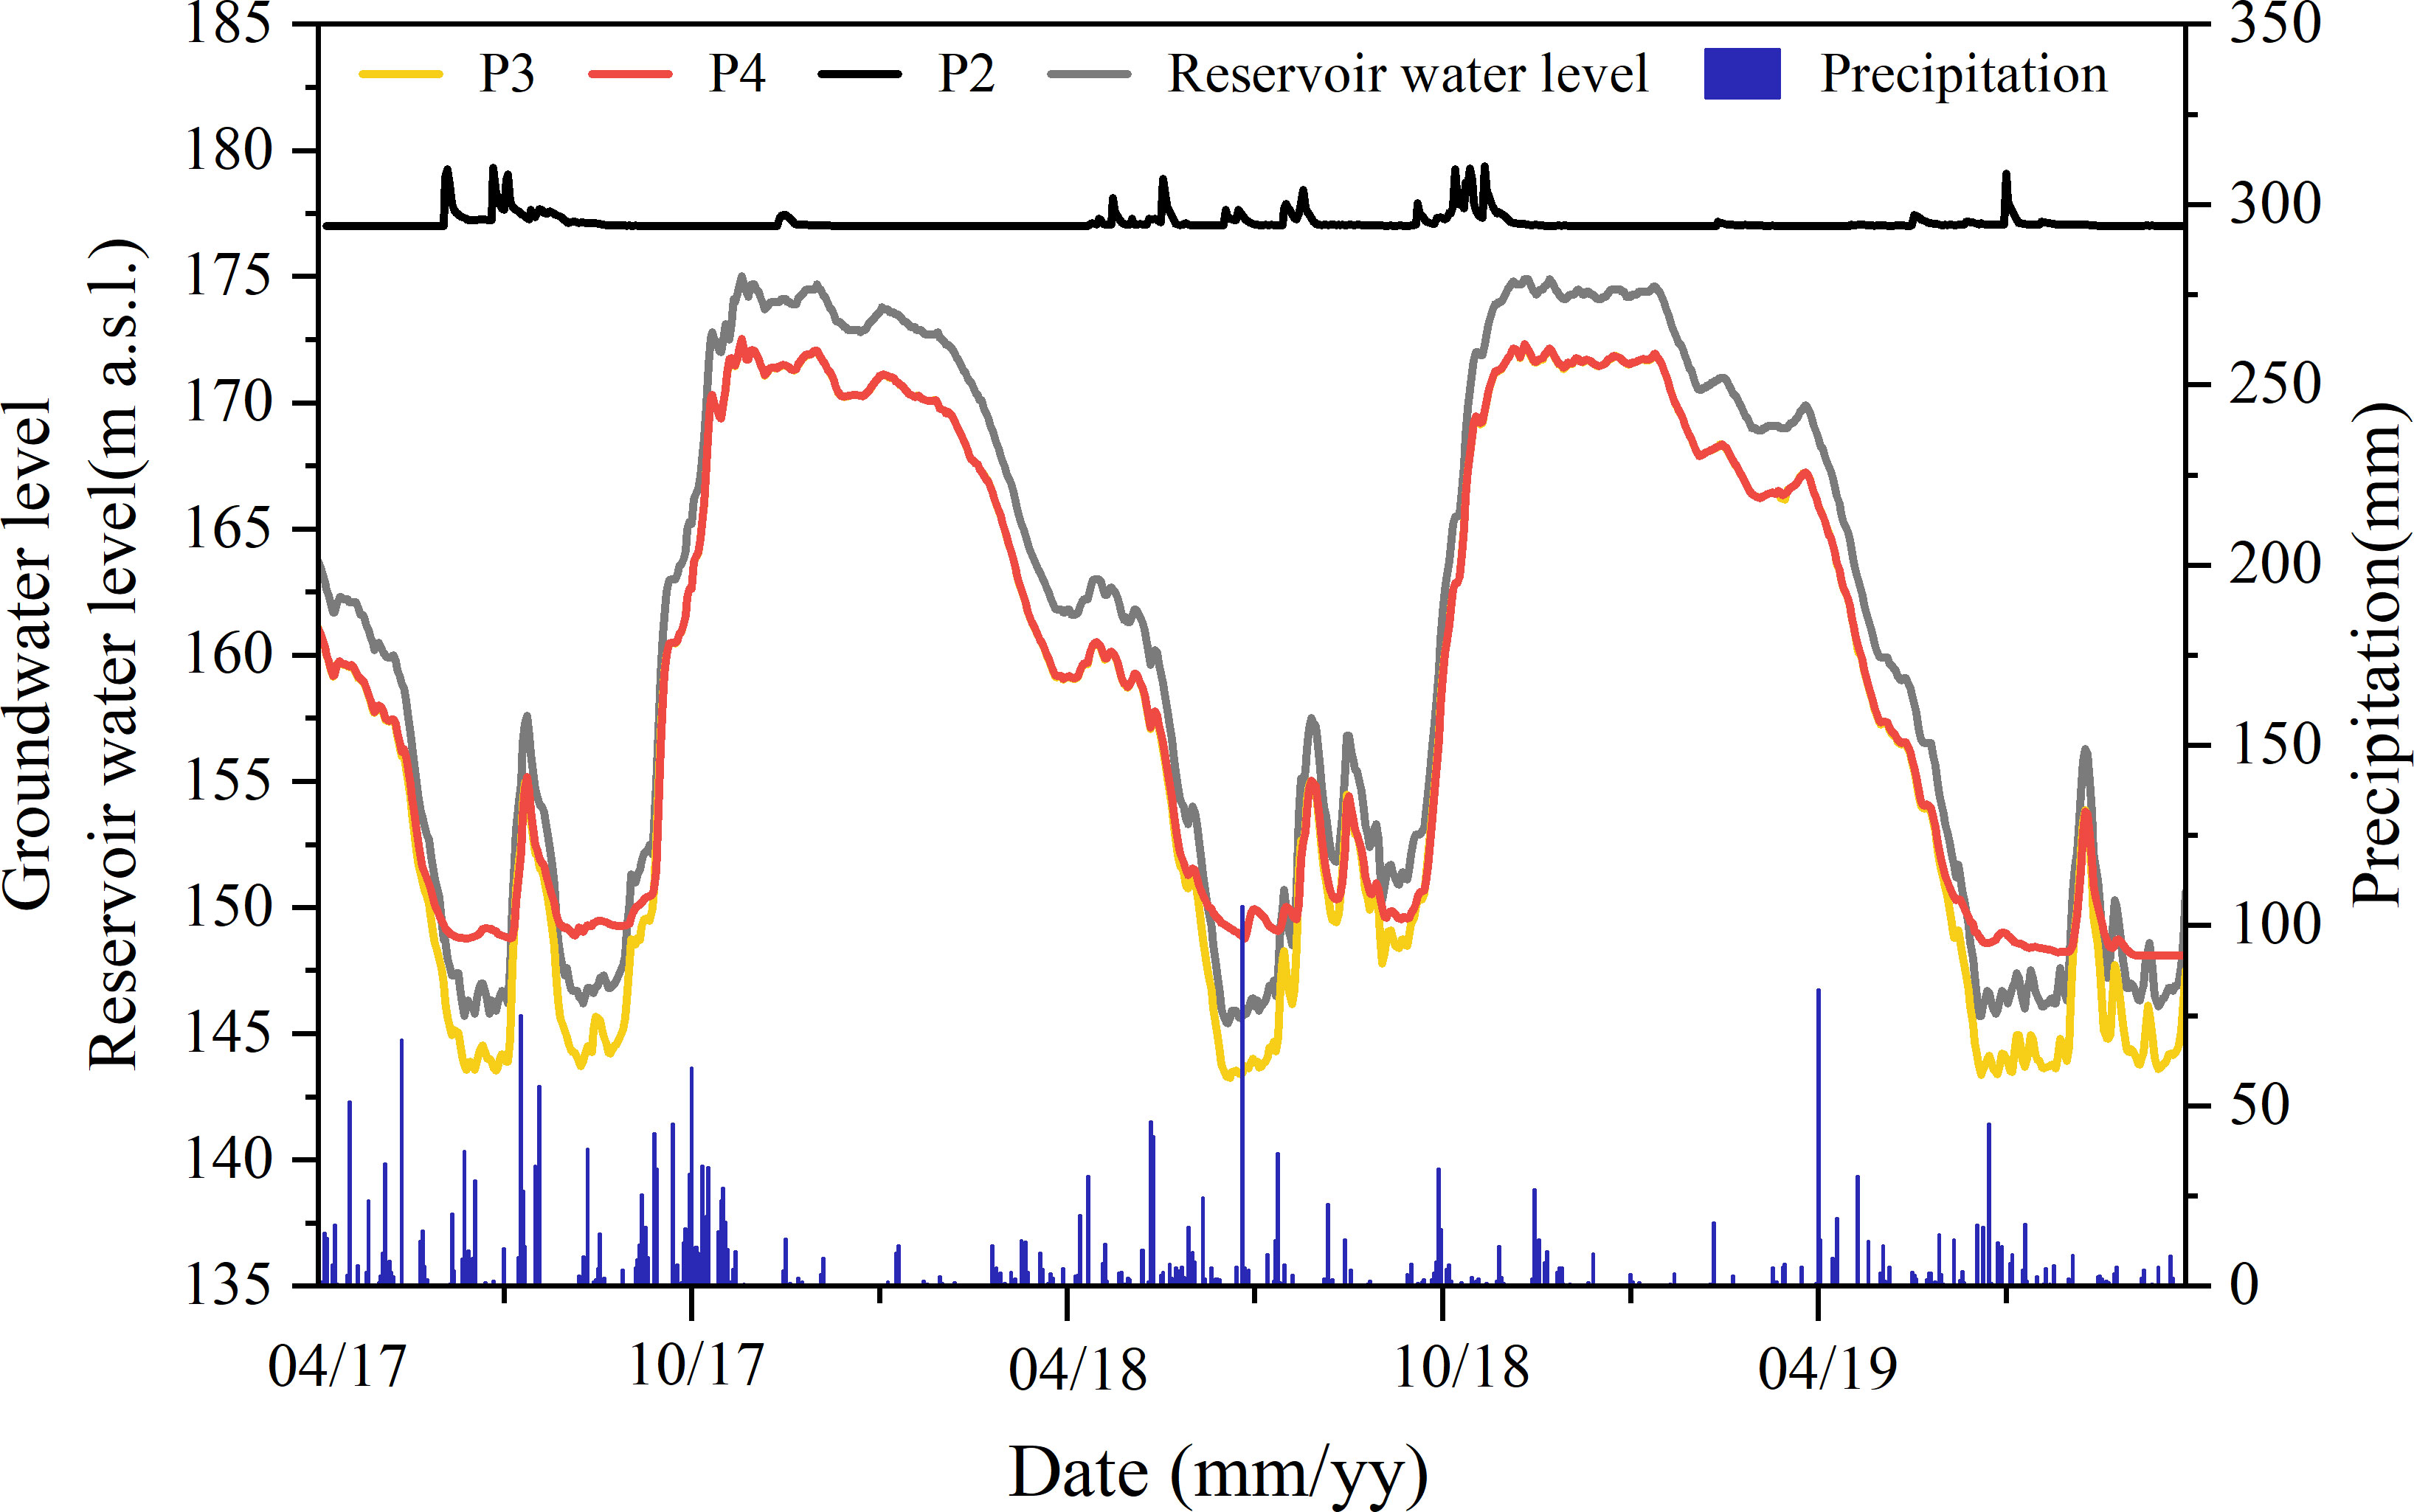
Figure 4 Monitoring groundwater levels evolution with RWL and precipitation.
Observations also reveal that the GWL at P2, located in the rear part of the landslide, remains independent of the RWL but exhibits a significant relationship with precipitation. Specifically, the GWL at P2 was mostly stable at around 177 m but would rise by about 1–3 m following continuous rainfall and quickly drop to 177 m after the rain stopped. This may be explained by the distance of P2 from the reservoir bank being too far for groundwater to be affected. Moreover, topographic observations indicate that P2 is close to Quchi Town, which is relatively flat and more conducive to the collection and infiltration of rainwater.
Monitoring results show that the GWL at the toe of the Taping landslide is more susceptible to RWL, and its changes align with RWL fluctuations. As the distance from the reservoir bank increases upslope, the response to RWL becomes more delayed, especially during the rapid RWL drawdown period. The GWL at the rear of the landslide is not affected by RWL, and its changes are primarily related to rainfall.
The toe of the Taping landslide has been identified as the critical zone responsible for initiating rapid movement (Luo et al., 2019; Zhang et al., 2021a) and is most impacted by RWL fluctuations. To investigate the GWL response to RWL operation in detail, seepage lines within the toe part can be delineated based on the monitoring of GWL and RWL, as shown in Figure 5. The red line represents the shallow sliding zone, while the blue line corresponds to the deep sliding zone. The dotted lines represent the seepage lines. The time frame presented in the figure spans from July 2017 to September 2018.
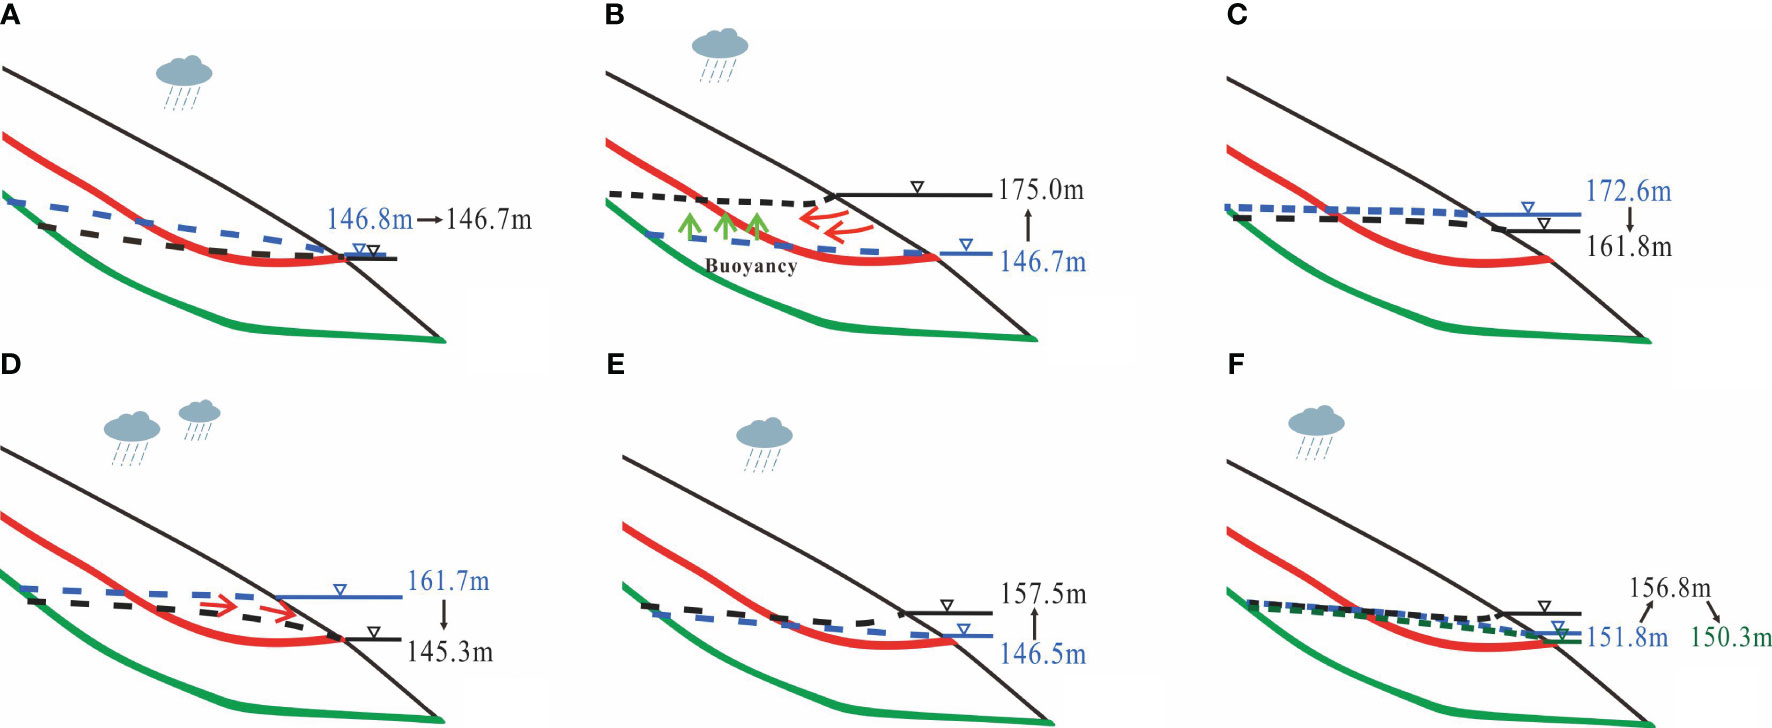
Figure 5 Schematic diagram of the GWL changes at the toe part of the landslide. (A) RWL maintained a low water level of 146.8 meters; (B) RWL rose from 146.8 meters to 175.0 meters; (C) RWL dropped slowly from 172.6 meters to 161.8 meters; (D) RWL dropped rapidly from 161.7 meters to 145.3 meters; (E) RWL rose from 146.5 meters to 157.5 meters; (F) Rapid RWL changes were required for flood control during summer. The red line represents the shallow sliding zone, while the blue line corresponds to the deep sliding zone. The time frame spans from July 2017 to September 2018. Red arrows indicate the water flow direction, black arrows indicate the RWL fluctuation direction, and green arrows indicate the buoyancy force.
Figure 5A illustrates the seepage line variation after the RWL drops to 146.8 m a.s.l. and remains at a low level. Observations indicate that even though the RWL stays unchanged, the GWL in the slope continues to decrease, causing the seepage line to become progressively flatter. Figure 5B shows the RWL rising from 146.7 m to 175.0 m, causing the GWL at the toe of the landslide to increase as the RWL rises rapidly. The increase in GWL is faster closer to the reservoir bank. As a result, the hydraulic gradient shifts from outward to inward, suggesting the generation of an inward seepage force at this phase. It also implies that, as the RWL rises, the buoyancy pressure within the toe part increases significantly.
Figures 5C, D demonstrate that the RWL dropped from 172.6 m to 145.3 m. Observations show that as the RWL dropped rapidly from 160.1 m to 145.5 m, the seepage line exhibits a “convex” shape, revealing that the GWL within the slope lags behind the RWL operation. It also suggests that the closer to the reservoir bank, the faster the GWL drops, implying that the hydraulic gradient at the toe part increased rapidly. The hydraulic gradient within the toe reached its maximum as the RWL dropped to 145 m. Figures 5E, F show the RWL’s frequency conversion between 145 m and 156 m. During this period, the RWL underwent high-frequency and rapid fluctuations, accompanied by substantial rainfall. The alternating transitions between drawdown and rising of RWL led to a swift and pronounced change in GWL within the slope. Consequently, a limited seepage pressure, either inwards or outwards, could be generated for a brief duration. Moreover, it is noteworthy that significant variations in GWL were predominantly observed at the toe part of the landslide.
Figure 6 shows the cumulative ground horizontal displacement data of monitoring points J26, J24, and J21 at the toe part of the landslide. It is evident that the landslide exhibits a significant step-like consistent creep deformation pattern, characterized by periodic changes in cycles of short periods of rapid deformation and long periods of slow deformation. The rapid deformation periods occurred from the end of May to the end of August each year (shown in the red boxes in Figure 6A), coinciding with the rainy season, rapid RWL drawdown, and low RWL periods.
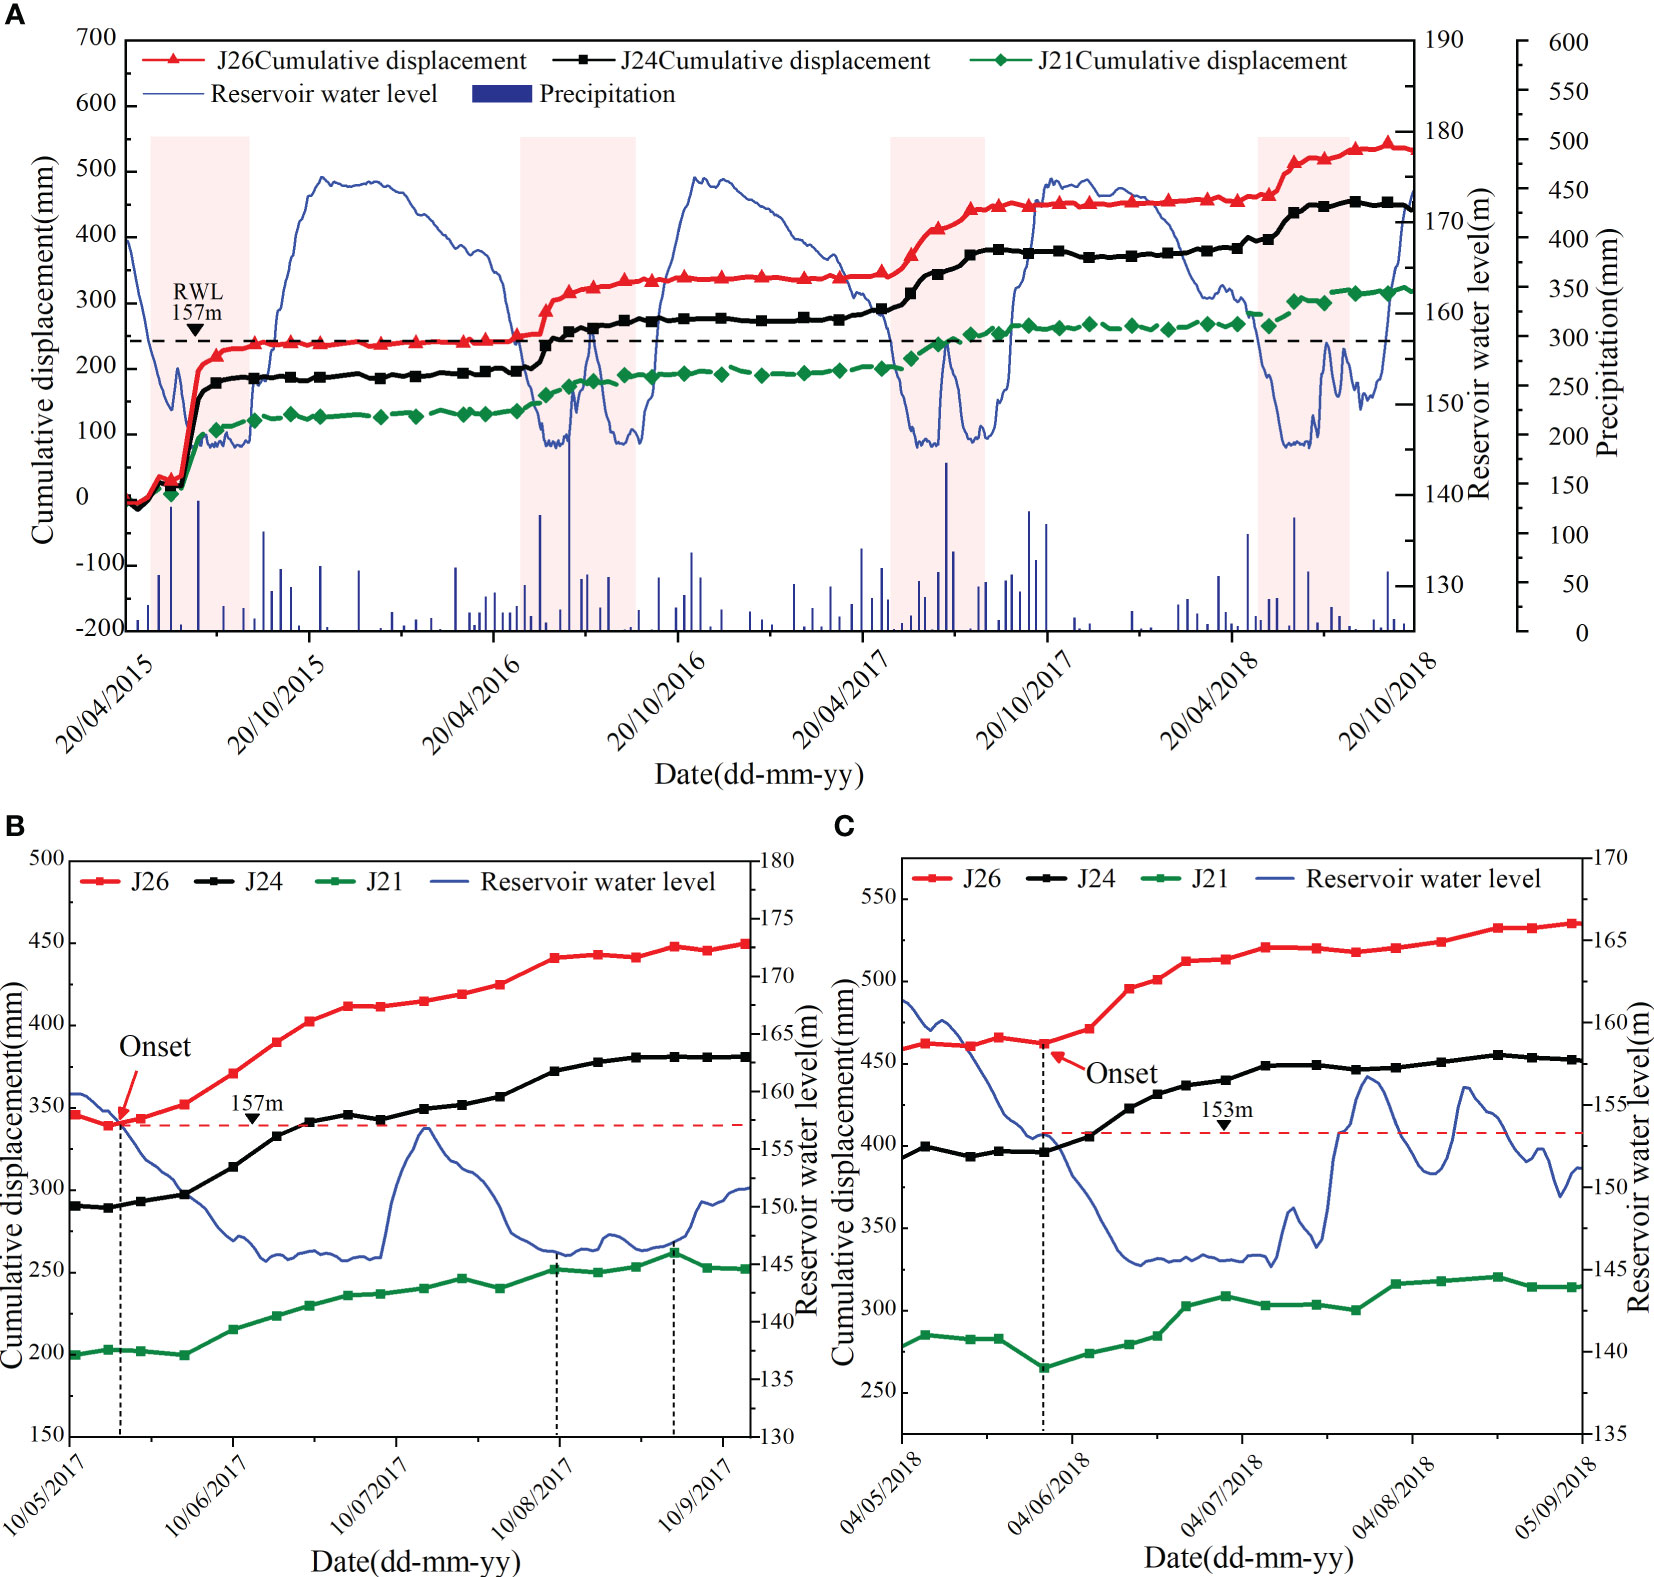
Figure 6 Time history of cumulative ground horizontal displacement in the fast movement zone of the Taping landslide (B and C are partially enlarged views from A). The red boxes in (A) represent the fast movement periods. (B, C) further indicate the RWL inducing fast movement is 151~153 m a.s.l.
It is clear that deformation responses vary under different RWL fluctuations. The landslide remains stable during RWL rise periods and high RWL periods. This stability can be attributed to the buttressing effect and the inward seepage force. Specifically, as the RWL rises, the volume of the submerged zone increases, rapidly increasing water pressures of 30 m on the slope surface, which creates lateral support at the submerged zone (Huang et al., 2018). Furthermore, reservoir water flows into the slope, producing an inward seepage force (Figure 5B). Additionally, results from in-situ pumping tests indicate that the permeability coefficients of the rock mass within the Taping landslide range from 2.2e-6 to 2.0e-5 m/s (Zhang et al., 2021a). This suggests that the rock mass has poor permeability, causing the response of groundwater within the slope to lag behind the RWL and leading to a delayed increase in pore water pressure. This can result in a rapid increase in the effective earth pressure within the slope (Zhang et al., 2023), ultimately reinforcing the slope’s stability (Song et al., 2018).
Fast ground movement occurs during the RWL rapid drawdown periods. Observations also show that the RWL rapid drawdown period often corresponds to the rainy season when rainfall is heavier. This makes it difficult to identify the triggering factors for rapid landslide movement. However, further observation reveals that rapid deformation starts when the RWL drops rapidly to 157 m, indicating that an RWL of 157 m may be a criterion for the onset of fast landslide movement. The reasons for the rapid deformation of slopes induced by RWL rapid drawdown can be attributed to two factors. On one hand, as the RWL rapidly decreases, the water pressure at the toe part can result in a rapid reduction of total soil stress, causing the de-buttressing effect (Cossart et al., 2008). On the other hand, the poor permeability of the slope hinders the dissipation of groundwater within the slope, thus generating outward seepage forces (Figure 5D). Eventually, the combined effect of these factors triggers the fast movement of the landslide.
Figure 7 displays the cumulative ground horizontal displacement data of monitoring points J22, J25, and J40 at the rear part of the landslide (detailed locations are in Figure 3). It is evident that the deformation pattern of ground movement at the rear part of the Taping landslide is consistent with that at the toe part. However, comparing the time history of displacement curves of monitoring points at the rear part (J22) and the toe part (J21), it can be observed that fast ground movement at J22 lags behind that at J21, with a time lag of about 10–15 days (Figure 8). Furthermore, the deformation of J21 reached 125 mm from 2015 to 2018, while the deformation of J22 reached 55 mm. This suggests that the deformation of the toe part is 2–3 times that of the rear part. The deformation of the Taping landslide initiates at the toe part first, followed by fast movement at the rear part. This may imply that the Taping landslide exhibits a possible progressive failure pattern in which the leading section destabilizes first under the RWL rapid drawdown, subsequently leading to failure at the rear part.
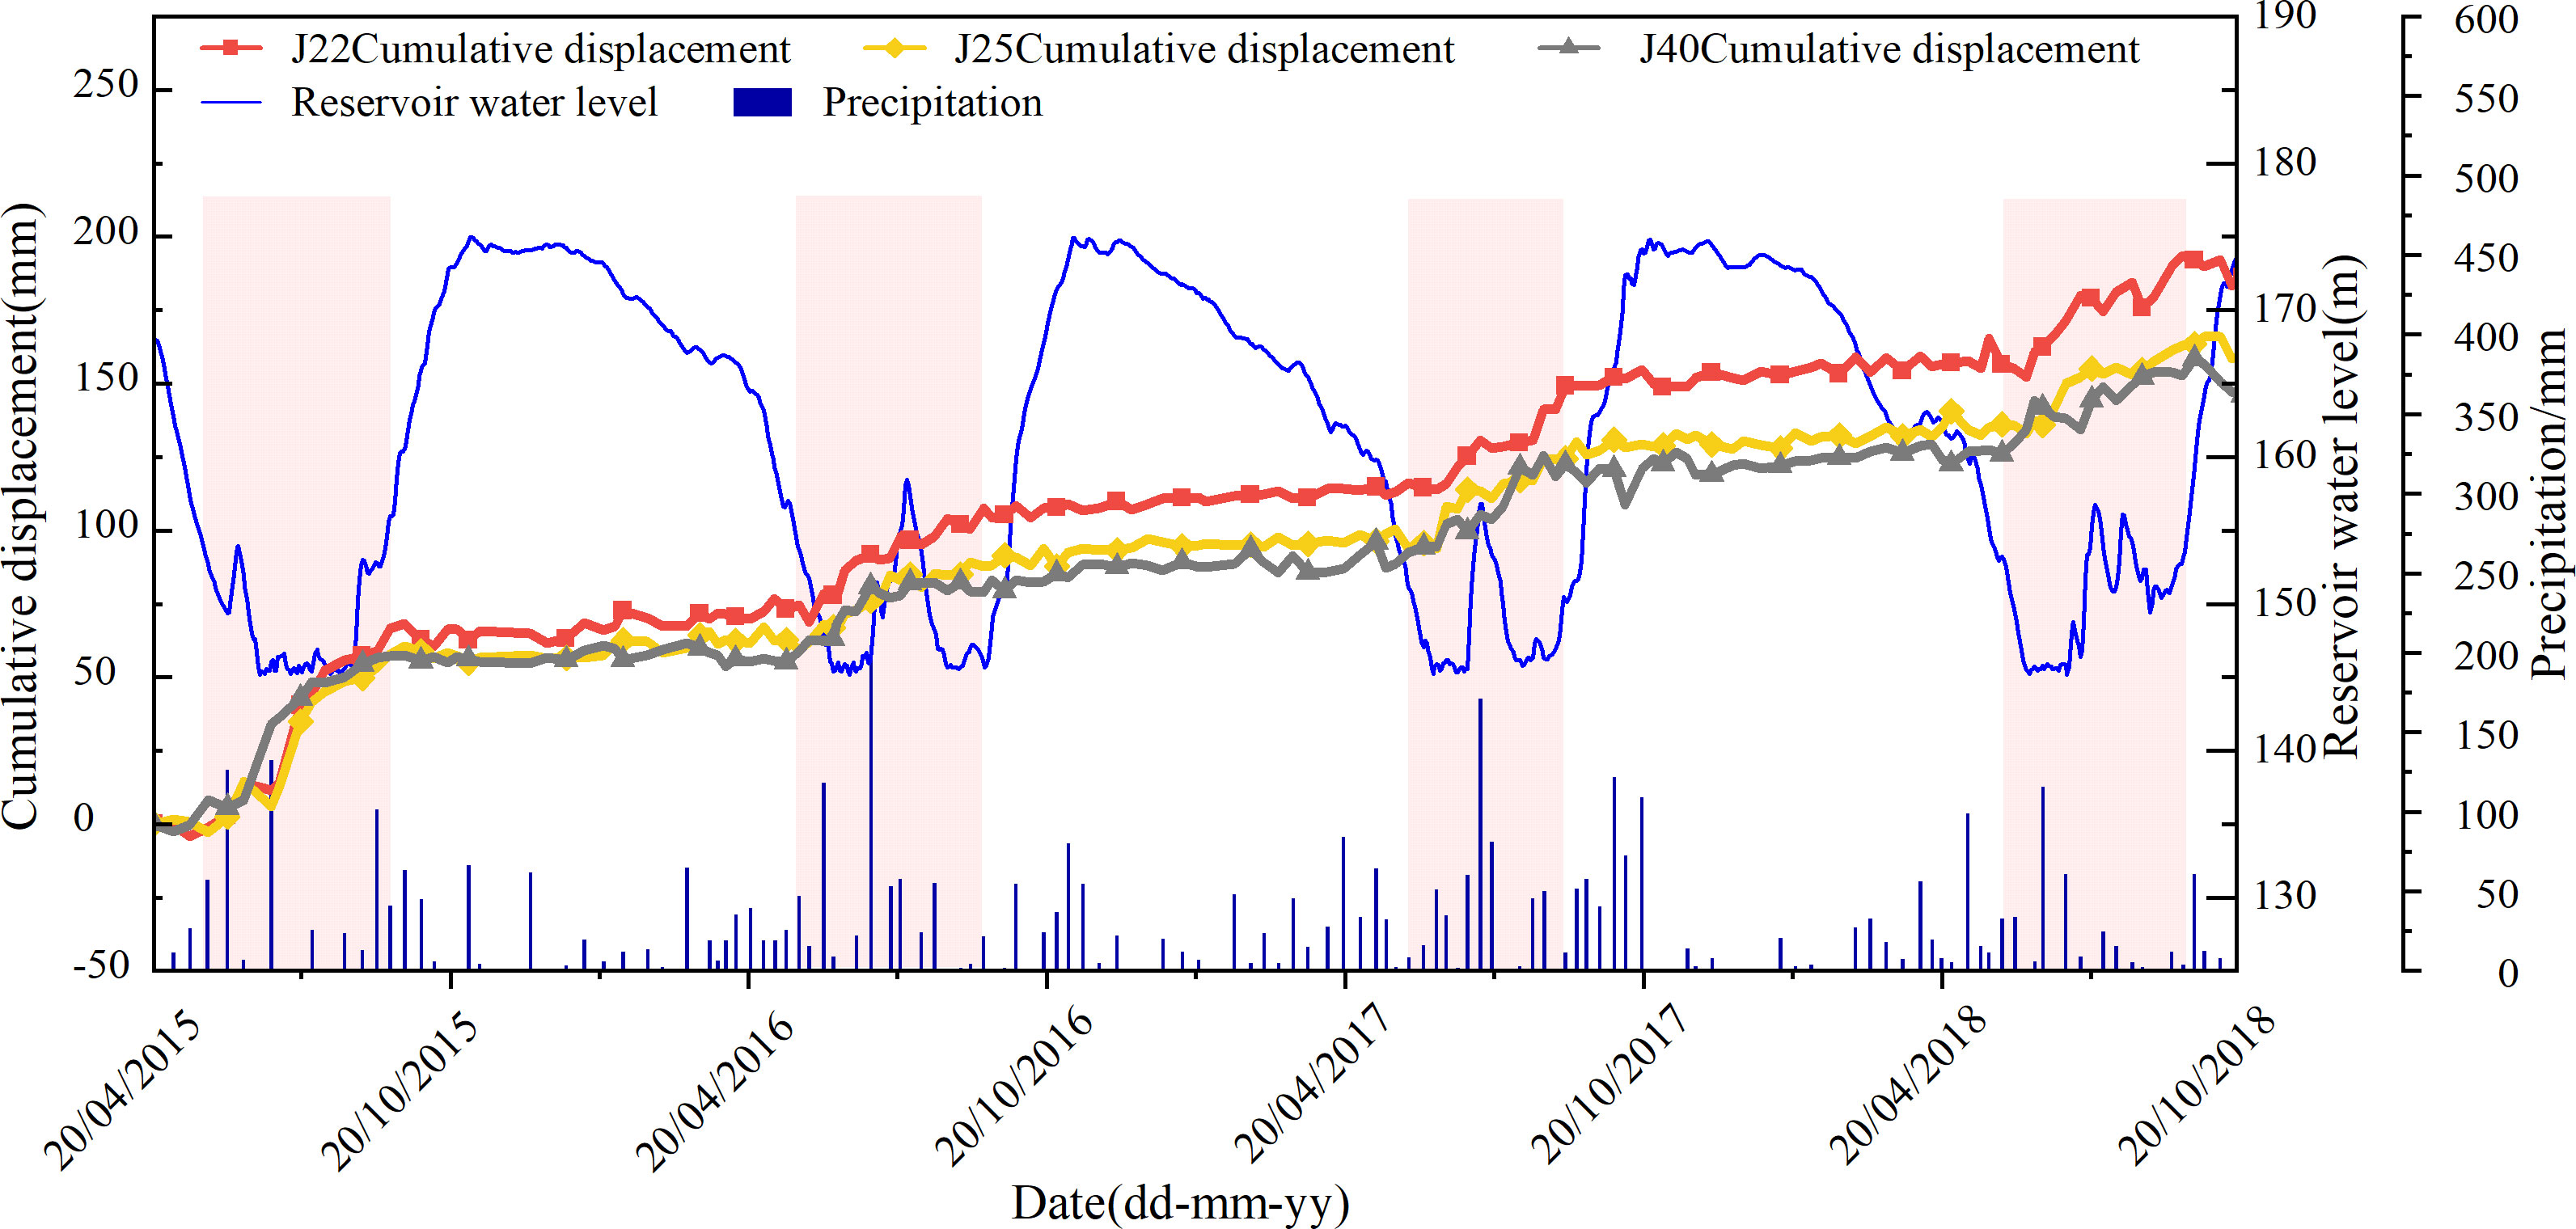
Figure 7 Monitoring results of cumulative ground horizontal displacement in rear part of the Taping landslide.
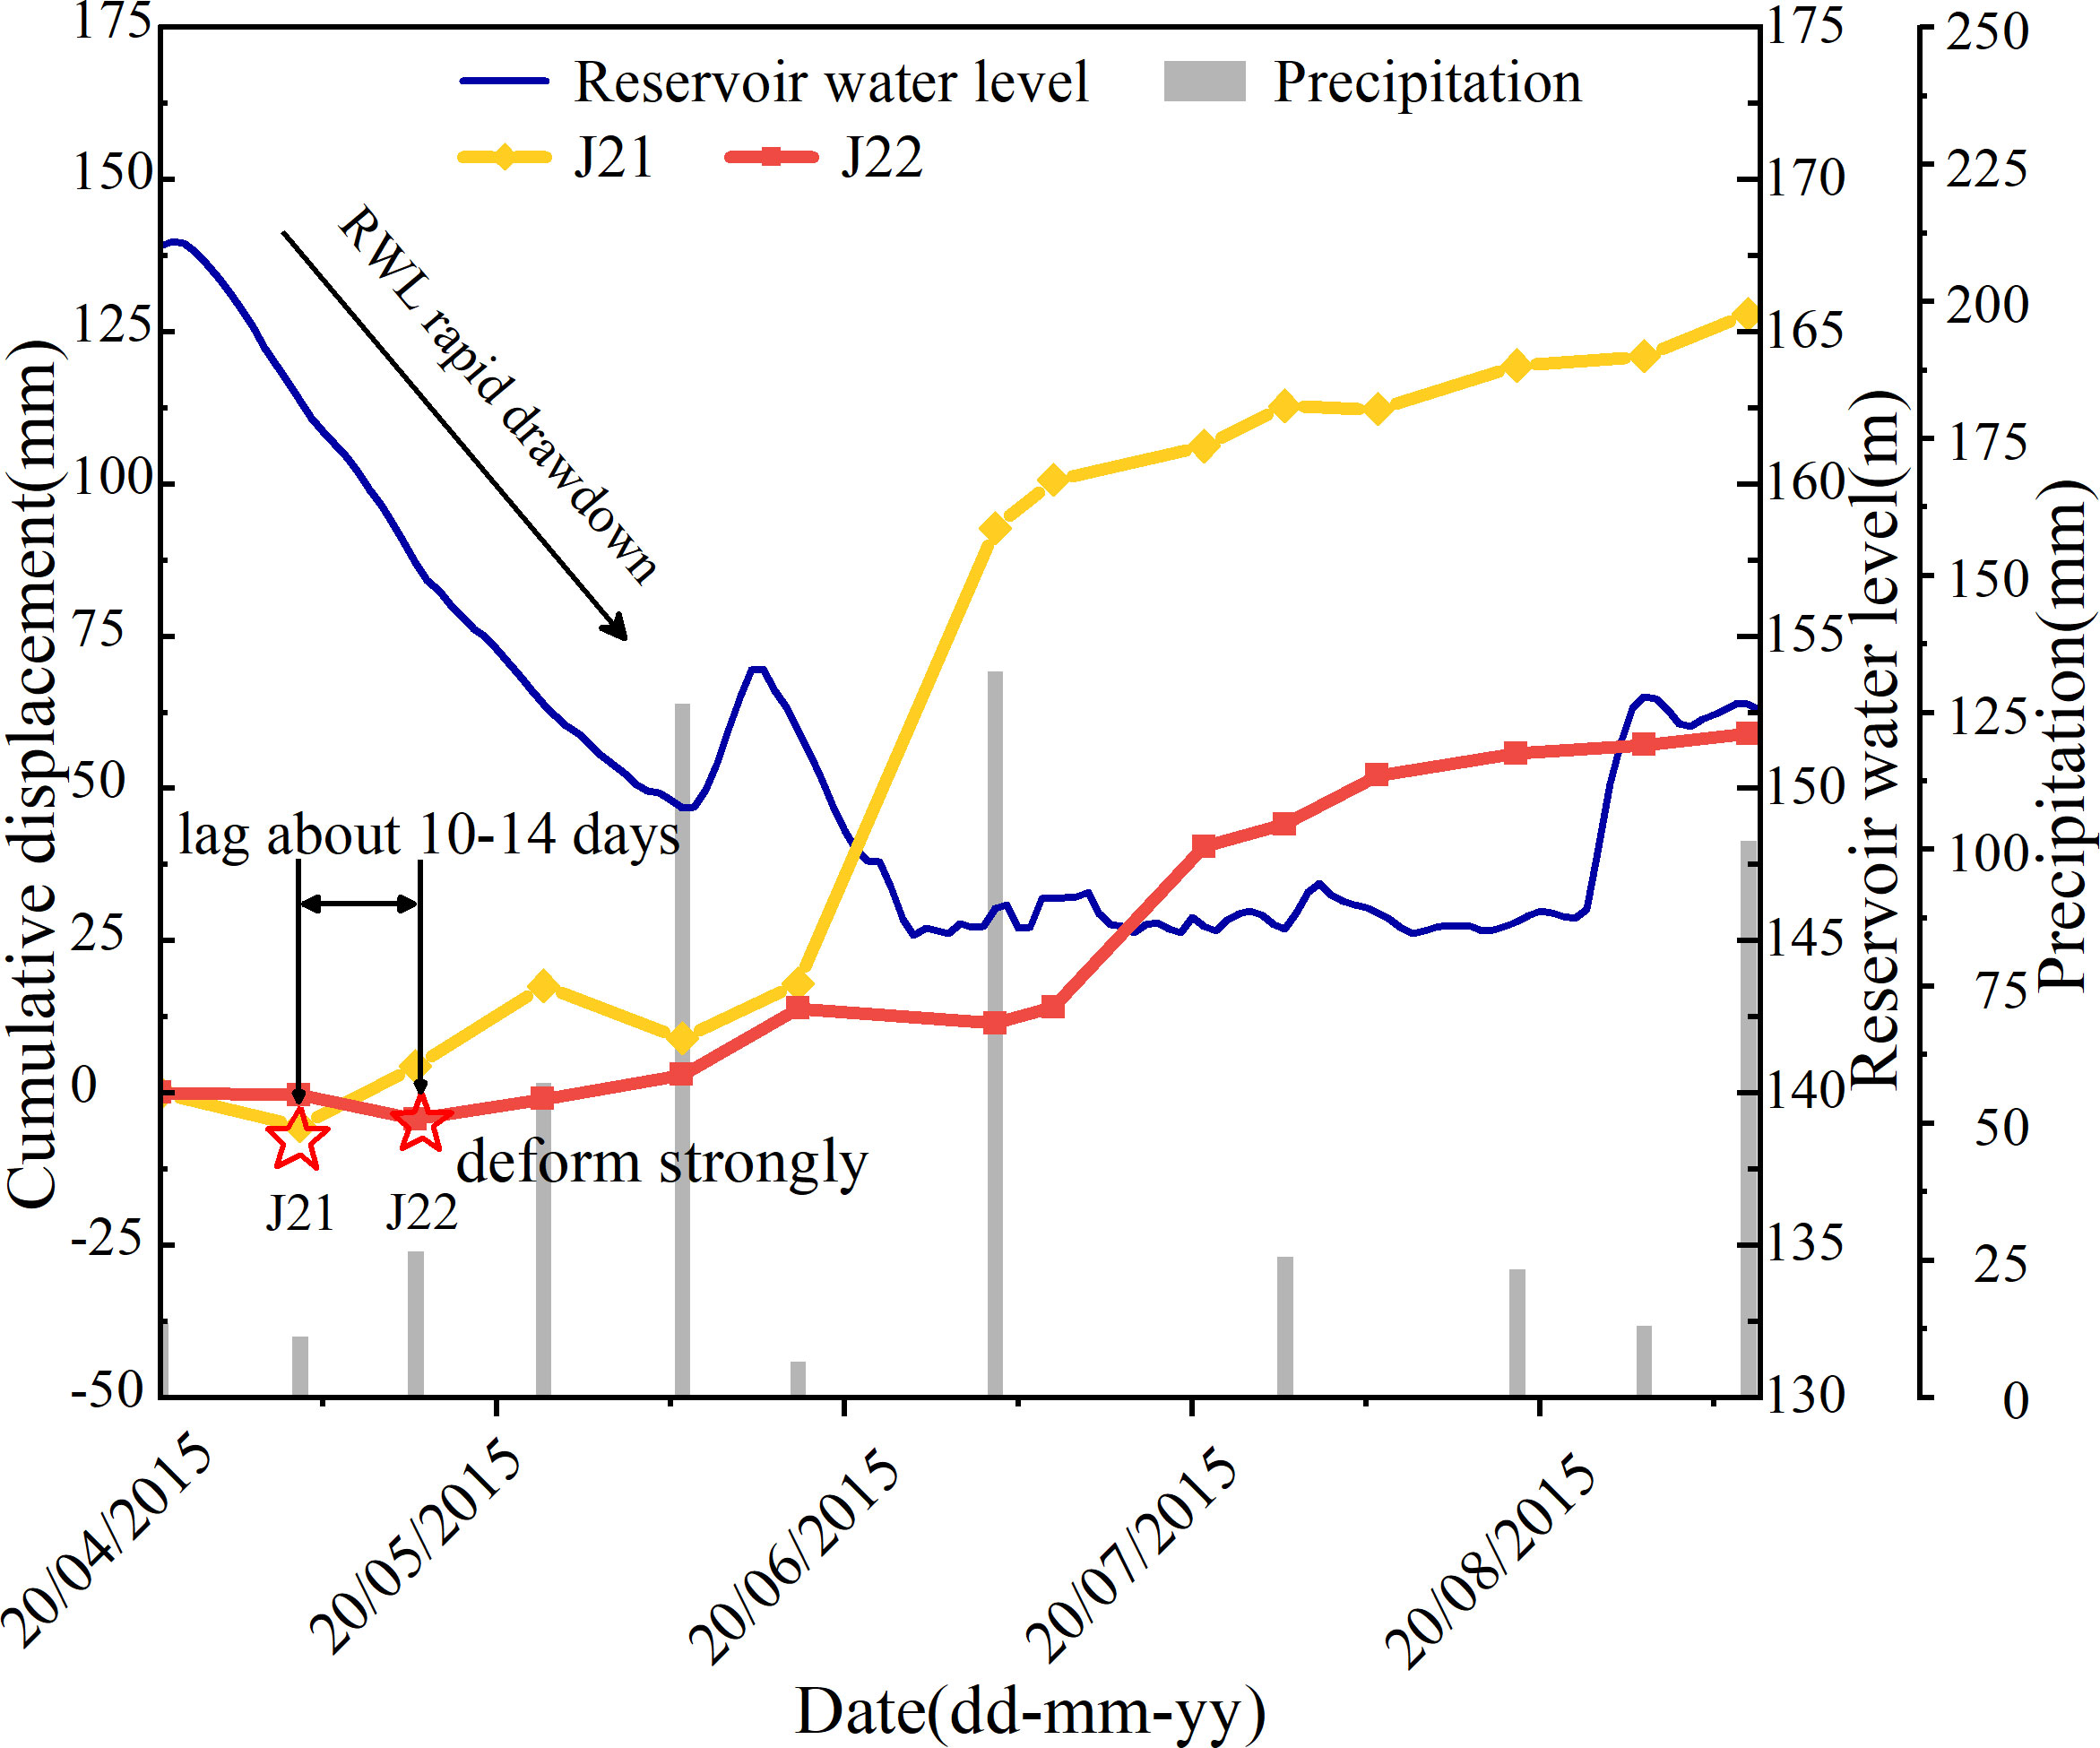
Figure 8 Comparison of displacement curves of monitoring points J21 and J22.
The subsurface movement characteristics of the Taping landslide can be obtained by the inclinometers, installed in the landslide (the detailed locations can be found in Figure 3). Figure 9 shows the slope subsurface movement along the depths at locations of SB06 and SB07.
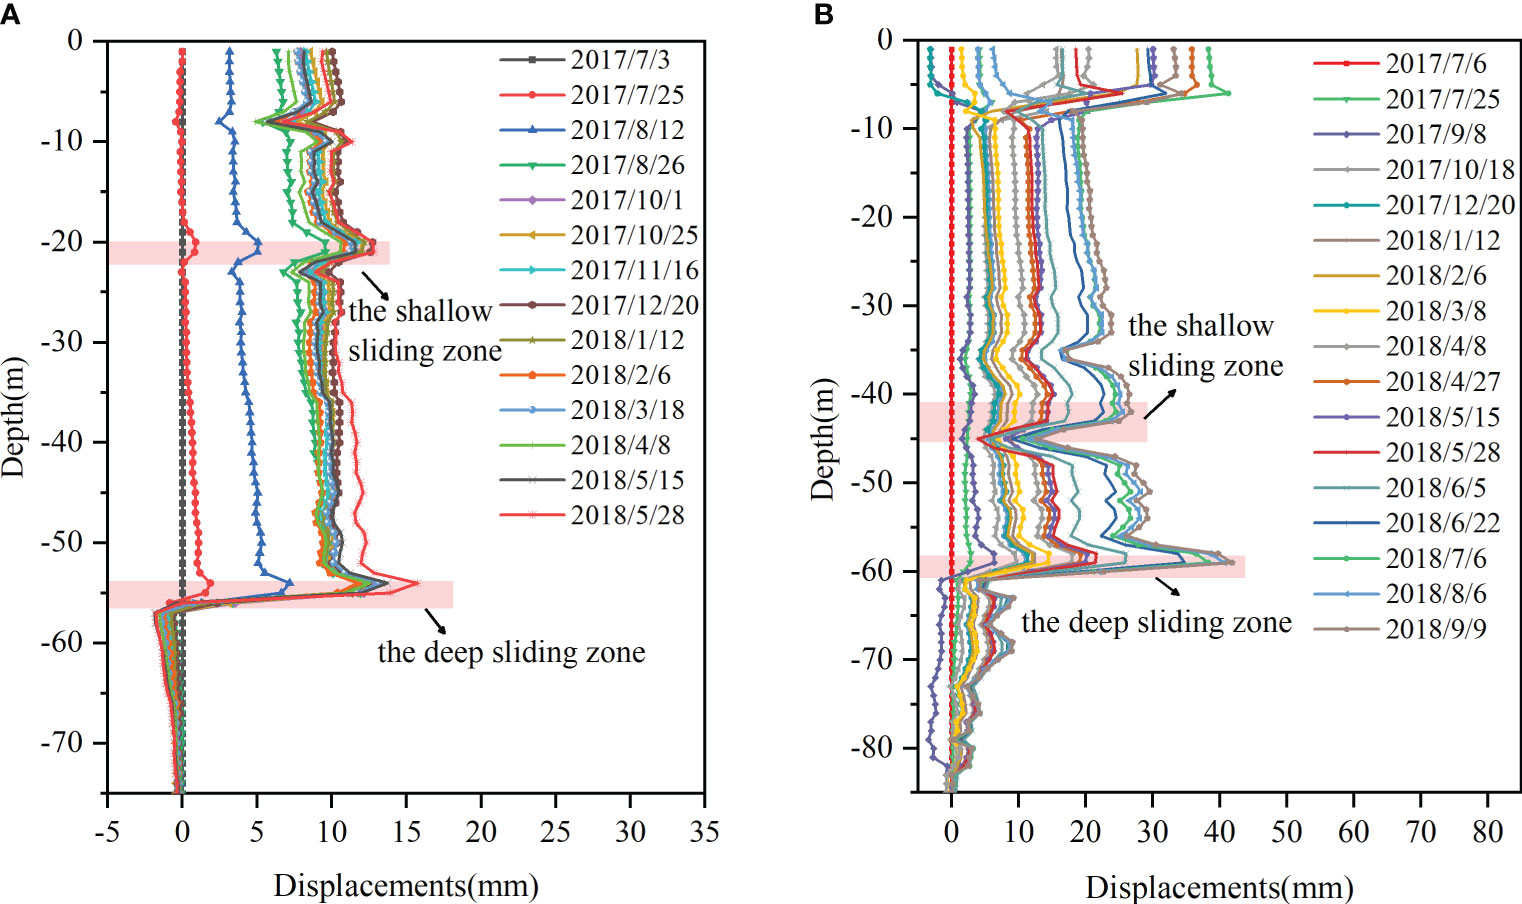
Figure 9 Cumulative horizontal displacements profiles along depths measured by inclinometers: (A) SB06, (B) SB07.
The inclinometer data from SB06 (Figure 9A) shows that has obvious subsurface displacements at depths of 21 m and 54 m. Among these, the maximum subsurface displacements reached 15.73 mm at the depth of 5–57 m from July 2017 to May 2018; furthermore, the other sliding zone at the subsurface displacements at the depth of 21 m reached 12.79 m. Therefore, it can be concluded that the shear plane at 54–57 m is the deep sliding surface of the Taping landslide (the rock mass of drilling at depths of 56–58 m is argillaceous, and the core is clay-like which contains lots of gravel and breccia), and the shear plane at 20–23 m is the shallow sliding surface (this section is a fractured rock mass, and the core is short columnar or columnar). It is relatively stable below the depth of 57 m (drilling data revealed that the material composition below the depth of 56 m is a shale layer at the bottom of the Xujiahe Formation). Moreover, the shear plane at the depth of 5–10 m can be observed in Figure 9A, however, because it is shallow in depth, it is identified as a partial slump within the shallow layer and not a sliding zone that controls the overall failure of the landslide.
The inclinometer data from SB07 (Figure 9B) reveals that the maximum subsurface displacements occurred at the depth of 59 m from July 2017 to September 2018, with the displacements reaching 41.92 mm. This observation suggests that the shear plane situated at a depth of 59–61 m constitutes the deep sliding zone of the landslide, as evidenced by the presence of silty clay and a small quantity of breccia in the drill core at a depth of 58–59.6 m. Furthermore, a distinct shear plane is present along the depth range of 42–45 m, which can be identified as the shallow sliding zone.
The time history of displacement along the identified double-sliding zones can be plotted as shown in Figure 10. It can be seen that it is similar to the surface deformation pattern, showing short-term rapid movement and long-term slow movement alternately. The rapid deformation periods last from the end of May to the end of August each year, which is consistent with the rainy season, the rapid RWL drawdown and the low RWL periods. However, there are differences in the deformation characteristics for the shallow sliding zone and the deep sliding zone.
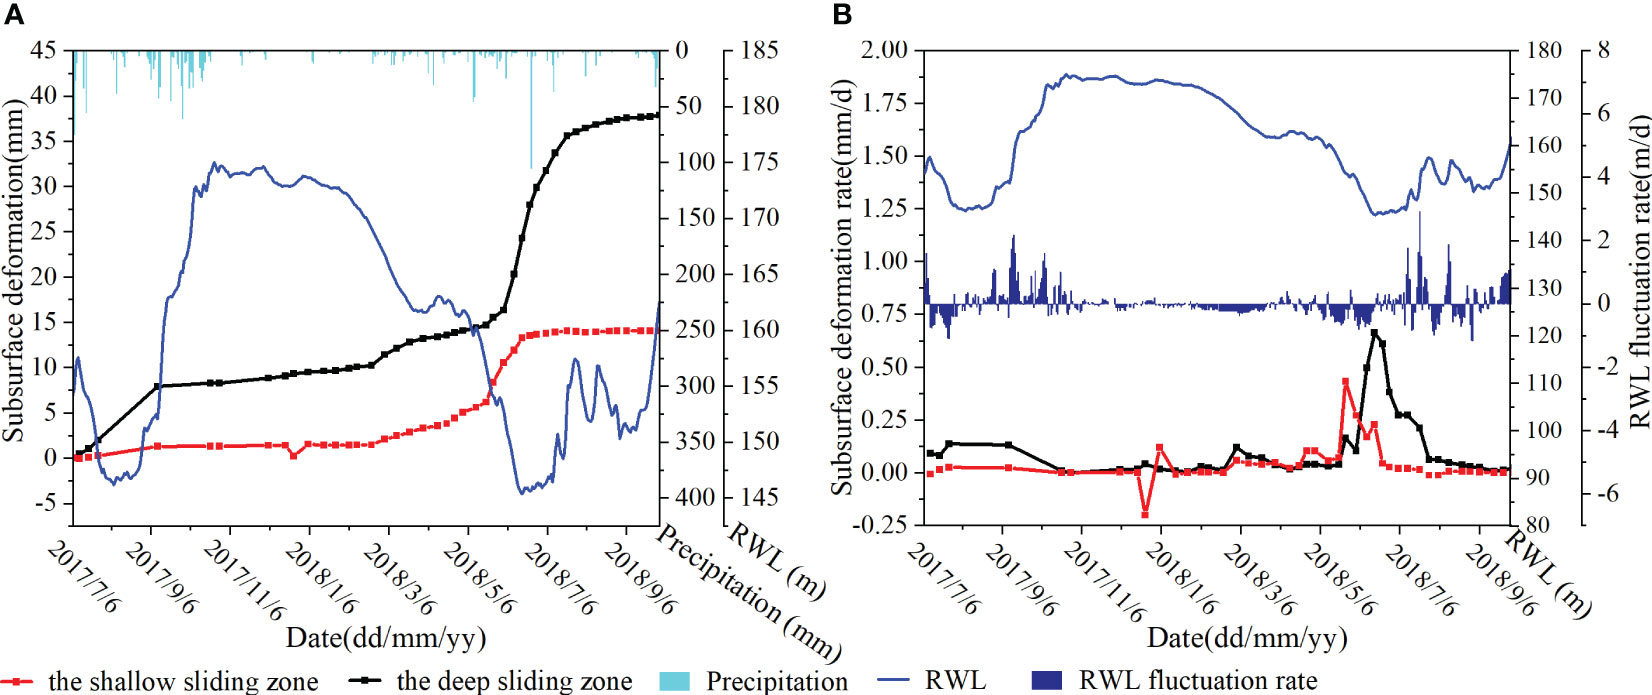
Figure 10 Time history of subsurface movements along shallow sliding zone and deep sliding zone at location of SB06: (A) is the subsurface movement; (B) is the movement velocity.
As shown in Figure 10A, the deformation of the deep sliding zone is three times greater than that of the shallow sliding zone during July 2017 to September 2018. It indicates that the deformation of the Taping landslide is mainly along the deep sliding zone. Moreover, it also can be found that 157 m RWL is a criteria for fast movement along double-sliding zones, which is consistent with the criteria of surface fast movement. Figure 10B shows the velocity of deformation along the double-sliding zones. It is clear that the deformation velocity along the shallow sliding zone is greater than that along the deep sliding zone when the RWL drops from 157 m to 155 m. However, when the RWL drops from 155 m to 145 m, the deformation velocity along the deep sliding zone is greater than that along the shallow sliding zone. It suggests that as the RWL drawdown, the landslide slides along the shallow sliding zone initially, after that slides mainly along the deep sliding zone. This may be due to the different positions of the double-sliding zones, resulting in differences in the response of deformation to the RWL drawdown. Specifically, for the shallow sliding zone with high elevation, the de-buttressing effect induced by the RWL drawdown is more pronounced and faster than the deep sliding zone. It is noteworthy that when the RWL drops to 145 m, the deformation velocity along the shallow sliding zone decreases to zero, whereas the deformation velocity along the deep sliding zone attains its maximum value. This phenomenon can be attributed to the fact that when the RWL drops to 145 m, it falls below the elevation of the front edge of the shallow sliding zone (i.e., 145.5 m a.s.l.), implying that the RWL has no influence on the shallow sliding zone at this point. Conversely, due to the lower position of the deep sliding zone (i.e., 122 m a.s.l.), when the RWL drops to 145 m, the hydraulic gradient at the toe part, caused by the delay in GWL, reaches its peak, resulting in the maximum deformation velocity.
The different positions of the sliding zone will invariably result in distinct responses to RWLs and rainfall, which, in turn, significantly influence the failure mechanism of landslides with double-sliding or multi-sliding zones. This section presents a qualitative analysis of the long-term monitoring data pertaining to the deformation along the two different sliding zones. A quantitative assessment of the factors affecting the deformation along the two different sliding zones, such as GWL, precipitation, and RWL, will be addressed in the subsequent section.
Rough set theory was first proposed by Pawlak (1991), and later, Wilson and Martinez (1997) introduced neighborhood rough set theory to address numerical and categorical data in attribute reduction and classification. Since then, neighborhood rough set theory has been extensively applied to feature selection in landslide triggering factors (Yao et al., 2019; Zhang et al., 2021a). In this study, we utilized an attribute reduction algorithm based on neighborhood rough set theory to investigate the hydrological factors’ impact on the movement within Taping landslide’s different subzones.
Previous researches have qualitatively identified RWL fluctuation (Wang et al., 2008), GWL elevation (Zhang and Zhang, 2017), and precipitation (Kafle et al., 2022) as key factors influencing reservoir landslide deformation. This study examines 20 potential influencing factors, including RWL, RWL variation velocity, GWL variation velocity, precipitation, and hydraulic gradient, to assess their impact on movement along the two distinct sliding zones. Table 1 lists these 20 factors. We selected the displacement velocities along the shallow and deep sliding zones, monitored by SB07, to represent the subsurface deformation characteristics in Taping landslide’s toe part, while the displacement velocities along the shallow and deep sliding zones, monitored by SB06, were chosen to represent the subsurface deformation characteristics in the rear part of the landslide. The SB06 dataset, comprising 20 hydrological factors and daily displacement and displacement velocities, covers the period from July 2017 to September 2018, while the SB07 dataset spans from July 2017 to May 2018.
Table 1 Candidate condition attributes of daily displacement and displacement velocity along double-sliding zones.
Through rough set theory, the effects of hydrological factors on the movement along the two different sliding zones of the Taping landslide were ascertained. The computed significance values for each candidate conditional attribute to the displacement and displacement velocity along the double-sliding zones are presented in Tables 2, 3. The results show that the hydrological factors responsible for fast movement along the shallow and deep sliding zones are different for different subzones (i.e., toe and rear parts).
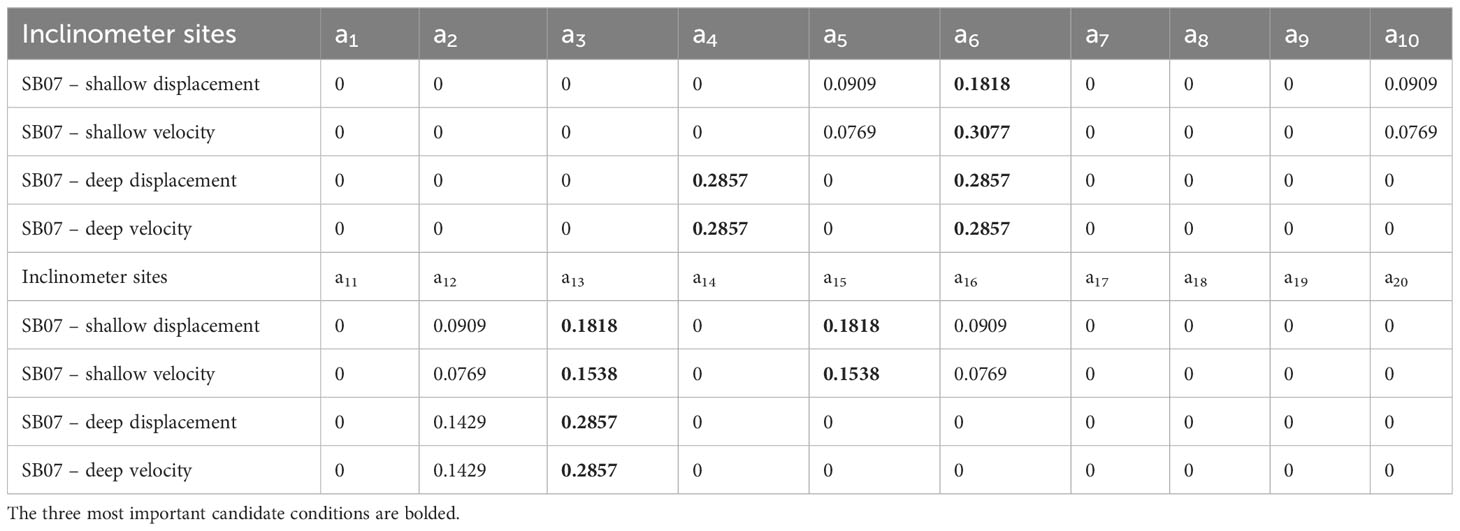
Table 2 Significance of candidate condition attributes to daily displacement and velocity of double-sliding zones at the toe part.
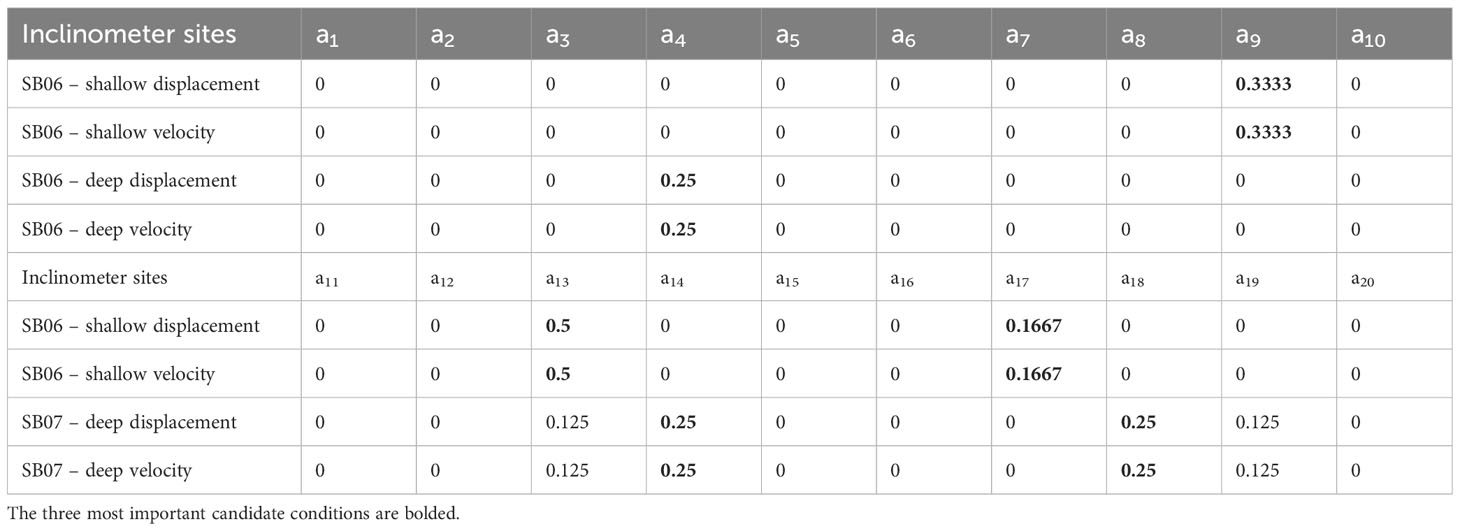
Table 3 Significance of candidate condition attributes to daily displacement and velocity of double-sliding zones at the rear part.
The quantitative analysis shows that, at the toe part, RWL and precipitation are two important factors driving deformation along the shallow and deep sliding zones. In terms of deformation along the shallow sliding zones, two of the three factors that have the greatest impact on the double-sliding zones are related to rainfall. Specifically, the average RWL variation velocity over the previous seven days (a6), the daily precipitation (a13), and accumulated precipitation over the previous fifteen days (a15) are three of the most important hydrologic factors affecting the slope movement along the shallow sliding zone (Table 2). However, for the deformation along the deep sliding zones, two of the three factors that have the greatest impact on the double-sliding zones are related to RWL. Specifically, the average RWL variation velocity on the current day (a4), the average RWL variation velocity over the previous seven days (a6), and the daily precipitation (a13) are three of the most significant hydrologic factors affecting the slope movement along the deep sliding zone. The discrepancy may be attributed to the fact that the buried depth of the shallow sliding zone is shallower than the deep sliding zone, and thus is more susceptible to rainfall. Moreover, quantitative result also shows that due to the landslide toe area is closer to the reservoir water, slope deformation along the double-sliding zones are both affected by the RWL variation firstly.
For the rear part, two of the three factors that have the greatest impact on the double-sliding zones are related to rainfall, which indicates that precipitation has a greater impact on the rear part than the RWL. This may be due to the fact that the middle part is a certain distance from the reservoir water, and the response of the GWL lags behind to the RWL, thereby weakening the impact on landslide deformation. In addition, it is not difficult to find that the daily precipitation (a13) is the first important hydrologic factor affecting the slope movement along the shallow sliding zone (Table 3). However, the accumulated precipitation over the previous seven days (a14) and maximum daily precipitation over the previous fifteen days (a18) are the second and third hydrologic factors affecting the slope movement along the deep sliding zone (Table 3). The difference may be attributed by that the deep sliding zone is buried in 65 m deep in the rear part. It takes longer for rainfall to infiltrate and affect the deep sliding zone than the shallow sliding zone.
Long-term field monitoring and quantitative analysis using attribute reduction algorithms reveal that the deformation of large-scale reservoir landslides with double-sliding zones is a complex process characterized by distinct failure mechanisms in different sliding zones and areas. The shallow sliding zone, due to its shallow burial depth and shorter rainfall infiltration path, is more susceptible to rainfall influence. Additionally, its high elevation leads to a more rapid response to RWL changes. As the RWL rapidly decreases, the buttressing effect from slope surface water pressure diminishes, resulting in a greater deformation velocity along the shallow sliding zone compared to the deep sliding zone. However, when the RWL drops to 145 m, below the elevation of the front edge, deformation along the shallow sliding zone ceases.
Our results show that the Taping landslide’s deformation is mainly governed by the deep sliding zone, evidenced by the greater deformation observed in the deep sliding zone than the shallow sliding zone. In contrast to the shallow sliding zone, the deep sliding zone is more deeply buried and less affected by rainfall. The RWL influences the deformation of the deep sliding zone by altering the GWL. Due to the deep burial and delayed GWL response, deformation velocity remains small in the early drawdown period of the RWL. However, when the RWL drops to 145 m, the water head difference at the slope toe part reaches its maximum, resulting in the highest downslope hydraulic gradient and, ultimately, the deformation velocity within the deep zone. Furthermore, the landslide’s extensive area creates significant differences in GWL responses between the toe and rear subzones concerning RWL changes. The toe part is more susceptible to RWL, while the rear part is more sensitive to rainfall. Deformation is most pronounced at the toe and diminishes towards the rear. Moreover, deformation in the toe occurs first, followed by the rear part with a 14-day lag. This suggests that the toe part will be the first to be impacted by RWL drops. The deep sliding zone at the front edge of the landslide is nearly horizontal, providing a sliding-resistant area relative to the rear sliding body. Once local failure occurs at the toe, they create space for the instability of the rear part of the landslide, and the resistance at the front edge vanishes, further inducing instability of the rear part. Therefore, the potential future failure pattern of the Taping landslide may be as follows: during the RWL drawdown period, the shallow sliding failure will initially occur at the toe induced by the de-buttressing effect, while the deep sliding failure will occur after the RWL reaches 145 m, induced by the downslope seepage force. Local damage and failure at the toe will provide space for the instability of the rear part, reducing the anti-sliding force. Consequently, failure will extend to the rear part.
This paper examines the Taping landslide in the TGR area, revealing its basic characteristics through field investigation and surface deformation characteristics in response to RWL and precipitation by analyzing in-situ monitoring data. Most importantly, the response characteristics of deformation along the double-sliding zones to RWL and precipitation are revealed for the first time through long-term inclinometer monitoring and the attribute reduction algorithm. The main conclusions of this paper are as follows:
• The Taping landslide exhibits a significant step-like consistent creep deformation pattern, marked by periodic fluctuations between short periods of rapid deformation and long periods of slow deformation. The rapid deformation periods typically occur from the end of May to the end of August each year, coinciding with the rainy season, rapid RWL drawdown, and low RWL periods.
• The subsurface displacement profile reveals that the Taping landslide is not a simple failure along a single sliding zone. Instead, it demonstrates failure along two distinct sliding zones. The depth of the shallow sliding zone ranges from 42–45 m at the toe part and 20–23 m at the rear part, while the depth of the deep sliding zone spans 57–61 m.
• Hydrological factors responsible for rapid movement vary between different sliding zones and subzones. In the toe region, RWL and precipitation emerge as two critical factors driving deformation. Shallow sliding is more susceptible to rainfall, whereas the deep sliding zone is more affected by RWL variation. In the rear part, precipitation has a greater impact than RWL. Daily precipitation is the primary hydrological factor affecting slope movement along the shallow sliding zone. However, accumulated precipitation over the previous seven days and maximum daily precipitation over the prior fifteen days are the most crucial precipitation factors influencing slope movement along the deep sliding zone.
• The potential failure pattern of the Taping landslide may be as follows: during the RWL drop period, shallow sliding failure will initially occur at the toe, induced by the de-buttressing effect. Conversely, deep sliding failure will transpire after the RWL reaches 145 m, induced by the downslope seepage force. Local damage and failure at the toe will create space for the instability of the rear part, reducing the anti-sliding force. Consequently, failure will extend to the rear part.
The raw data supporting the conclusions of this article will be made available by the authors, without undue reservation.
YY: Data curation, Methodology, Writing – original draft. CZ: Conceptualization, Investigation, Methodology, Resources, Supervision, Writing – review & editing. YL: Project administration, Resources, Supervision, Writing – original draft. ZD: Data curation, Funding acquisition, Investigation, Resources, Writing – original draft.
The author(s) declare financial support was received for the research, authorship, and/or publication of this article. The work was supported by funding from Chongqing Natural Science Key program: Key Technology for Treatment of Massive Hydraulic Landslide in Three Gorges Reservoir Area (ID: cstc2020jcyj-zdxmX0019).
Senior engineers Yan Hui and Tang Jungang from Chongqing 107 Geological Team provided assistance in the field investigation of the Taping landslide.
The authors declare that the research was conducted in the absence of any commercial or financial relationships that could be construed as a potential conflict of interest.
All claims expressed in this article are solely those of the authors and do not necessarily represent those of their affiliated organizations, or those of the publisher, the editors and the reviewers. Any product that may be evaluated in this article, or claim that may be made by its manufacturer, is not guaranteed or endorsed by the publisher.
Cossart E., Regis B., Monique F., Bourlès D. L., Carcaillet J. L. (2008). Slope instability in relation to glacial debuttressing in alpine areas (Upper Durance catchment, southeastern France): Evidence from field data and 10Be cosmic ray exposure ages. Geomorphology 95 (1-2), 3–26. doi: 10.1016/j.geomorph.2006.12.022
Huang D., Gu D. M., Song Y. X., Cen D. F., Zeng B. (2018). Towards a complete understanding of the triggering mechanism of a large reactivated landslide in the Three Gorges Reservoir. Eng. Geology 238, 36–51. doi: 10.1016/j.enggeo.2018.03.008
Huang X. H., Guo F., Deng M. L., Yi W., Huang H. F. (2020). Understanding the deformation mechanism and threshold reservoir level of the floating weight-reducing landslide in the Three Gorges Reservoir Area, China. Landslides 17, 2879–2894. doi: 10.1007/s10346-020-01435-1
Kafle L., Xu W. J., Zeng S. Y., Nagel. T. (2022). A numerical investigation of slope stability influenced by the combined effects of reservoir water level fluctuations and precipitation: A case study of the Bianjiazhai landslide in China. Eng. Geology 297, 106508. doi: 10.1016/j.enggeo.2021.106508
Lane P. A., Griffiths D. V. (2000). Assessment of stability of slopes under drawdown conditions. J. geotechnical geoenvironmental Eng. 126 (5), 443–450. doi: 10.1061/(ASCE)1090-0241(2000)126:5(443)
Li Y., Stefano U., David M., Chen L., Yin K. (2021). Chasing a complete understanding of the failure mechanisms and potential hazards of the slow moving Liangshuijing landslide. Eng. Geology 281, 105977. doi: 10.1016/j.enggeo.2020.105977
Liao K., Wu Y. P., Miao F. S., Li L. W., Xue. Y. (2021). Effect of weakening of sliding zone soils in hydro-fluctuation belt on long-term reliability of reservoir landslides. Bull. Eng. Geology Environ. 80, 3801–3815. doi: 10.1007/s10064-021-02167-9
Liao K., Wu Y., Miao F., Pan Y., Beer M. (2023). Probabilistic risk assessment of earth dams with spatially variable soil properties using random adaptive finite element limit analysis. Eng. Comput. 39 (5), 3313–3326. doi: 10.1007/s00366-022-01752-0
Luo S. L., Jin X. G., Huang. D. (2019). Long-term coupled effects of hydrological factors on kinematic responses of a reactivated landslide in the Three Gorges Reservoir. Eng. Geology 261, 105271. doi: 10.1016/j.enggeo.2019.105271
Paronuzzi P., Elia R., Alberto B. (2013). Influence of filling–drawdown cycles of the Vajont reservoir on Mt. Toc slope stability. Geomorphology 191, 75–93. doi: 10.1016/j.geomorph.2013.03.004
Pawlak Z. (1991). Rough sets: Theoretical aspects of reasoning about data Vol. 9 (Kluwer Academic Publishers, P.O. Box 17,3300 AA Dordrecht, the Netherlands: Springer Science & Business Media).
Segoni S., Luca P., Stefano L. G. (2018). A review of the recent literature on rainfall thresholds for landslide occurrence. Landslides 15 (8), 1483–1501. doi: 10.1007/s10346-018-0966-4
Seguí C., Hadrien R., Manolis V. (2020). On the stability of deep-seated landslides. The cases of Vaiont (Italy) and shuping (Three Gorges Dam, China). J. Geophysical Research: Earth Surface 125 (7), e2019JF005203. doi: 10.1029/2019JF005203
Song K., Wang F. W., Yi Q. L., Lu S. Q. (2018). Landslide deformation behavior influenced by water level fluctuations of the Three Gorges Reservoir (China). Eng. Geology 247, 58–68. doi: 10.1016/j.enggeo.2018.10.020
Takayama S., Fumitoshi I. (2023). Effects of coarse particles on downstream face erosion processes and outflow discharge during the overtopping of a landslide dam. Landslides 20 (2), 351–366. doi: 10.1007/s10346-022-01973-w
Tang H. M., Janusz W., Juang C. H. (2019). Geohazards in the three Gorges Reservoir Area, China–Lessons learned from decades of research. Eng. Geology 261, 105267. doi: 10.1016/j.enggeo.2019.105267
Tang H. M., Li C. D., Hu X. L., Wang L. Q., Robert C., Su A. J., et al. (2015). Deformation response of the Huangtupo landslide to rainfall and the changing levels of the Three Gorges Reservoir. Bull. Eng. Geology Environ. 74, 933–942. doi: 10.1007/s10064-014-0671-z
Tomás R., Li Z. H., Lopez-Sanchez J. M., Liu P., Singleton A. (2016). Using wavelet tools to analyse seasonal variations from InSAR time-series data: a case study of the Huangtupo landslide. Landslides 13, 437–450. doi: 10.1007/s10346-015-0589-y
Wang J. E., Daniel S., Liu Q. B., Su A. J., Hu X. L., Blum P. (2021). Three-dimensional landslide evolution model at the Yangtze River. Eng. Geology 292, 106275. doi: 10.1016/j.enggeo.2021.106275
Wang F. W., Zhang Y. M., Huo Z. T., Peng X. M., Araiba K., Wang G. H. (2008). Movement of the Shuping landslide in the first four years after the initial impoundment of the Three Gorges Dam Reservoir, China. Landslides 5, 321–329. doi: 10.1007/s10346-008-0128-1
Wilson D. R., Martinez T. R. (1997). Improved heterogeneous distance functions. J. Artif. Intell. Res. 11 (1), 1–34. doi: 10.1109/ISIE.1997.648935
Wu S., Hu X., Zheng W., Zhang G., Liu C., Xu C., et al. (2022). Displacement behaviour and potential impulse waves of the Gapa landslide subjected to the Jinping Reservoir fluctuations in Southwest China. Geomorphology 397, 108013. doi: 10.1016/j.geomorph.2021.108013
Yao W. M., Li C. D., Zuo Q. J., Zhan H. B., Robert E. (2019). Spatiotemporal deformation characteristics and triggering factors of Baijiabao landslide in Three Gorges Reservoir region, China. Geomorphology 343, 34–47. doi: 10.1016/j.geomorph.2019.06.024
Yin Y. P., Huang B. L., Wang W. P., Wei Y. J., Ma X. H., Ma F., et al. (2016). Reservoir-induced landslides and risk control in Three Gorges Project on Yangtze River, China. J. Rock Mechanics Geotechnical Eng. 8 (5), 577–595. doi: 10.1016/j.jrmge.2016.08.001
Yin Y. P., Wang H. D., Gao Y. L., Li. X. C. (2010). Real-time monitoring and early warning of landslides at relocated Wushan Town, the Three Gorges Reservoir, China. Landslides 7, 339–349. doi: 10.1007/s10346-010-0220-1
Zangerl C., Prager C., Chwatal W., Mertl S., Renk D., Schneider-Muntau B., et al. (2009). Process-based investigations and monitoring of deep-seated landslides. Sustain. Natural Hazard Manage. Alpine Environments, 135–178. doi: 10.1007/978-3-642-03229-5_5
Zhang C. Y., Dai Z. W., Tan W. J., Yang Y. T., Zhang L. H. (2022). Multiscale study of the deterioration of sandstone in the three gorges reservoir area subjected to cyclic wetting–cooling and drying–heating. Rock Mechanics Rock Eng. 55 (9), 5619–5637. doi: 10.1007/s00603-022-02929-1
Zhang C. Y., Yin Y. P., Dai Z. W., Huang B. L., Zhang Z. H., Jiang X. N., et al. (2021b). Reactivation mechanism of a large-scale ancient landslide. Landslides 18, 397–407. doi: 10.1007/s10346-020-01538-9
Zhang C. Y., Yin Y. P., Yan H., Li H. X., Dai Z. W., Zhang N. (2021a). Reactivation characteristics and hydrological inducing factors of a massive ancient landslide in the three Gorges Reservoir, China. Eng. Geology 292, 106273. doi: 10.1016/j.enggeo.2021.106273
Zhang C. Y., Yin Y. P., Yan H., Zhu S. N., Li B., Hou X. F., et al. (2023). Centrifuge modeling of multi-row stabilizing piles reinforced reservoir landslide with different row spacings. Landslides 20 (3), 559–577. doi: 10.1007/s10346-022-01994-5
Zhang L. M., Zhang J. (2017). Landslide stability analysis considering the influence of reservoir water level changes. Eng. Geology 221, 10–17. doi: 10.1016/j.enggeo.2017.03.00
Keywords: reservoir landslides, double-sliding zones, deformation characteristics, triggering factors, failure mechanism
Citation: Yang Y, Zhang C, Lu Y and Dai Z (2024) Mechanism of large-scale reservoir landslides with double-sliding zones: insights from long-term field monitoring. Front. Ecol. Evol. 11:1301261. doi: 10.3389/fevo.2023.1301261
Received: 24 September 2023; Accepted: 20 December 2023;
Published: 10 January 2024.
Edited by:
Beibei Yang, Norwegian Geotechnical Institute (NGI), NorwayReviewed by:
Kang Liao, Southwest Jiaotong University, ChinaCopyright © 2024 Yang, Zhang, Lu and Dai. This is an open-access article distributed under the terms of the Creative Commons Attribution License (CC BY). The use, distribution or reproduction in other forums is permitted, provided the original author(s) and the copyright owner(s) are credited and that the original publication in this journal is cited, in accordance with accepted academic practice. No use, distribution or reproduction is permitted which does not comply with these terms.
*Correspondence: Chenyang Zhang, emhhbmc5M0Boa3UuaGs=
Disclaimer: All claims expressed in this article are solely those of the authors and do not necessarily represent those of their affiliated organizations, or those of the publisher, the editors and the reviewers. Any product that may be evaluated in this article or claim that may be made by its manufacturer is not guaranteed or endorsed by the publisher.
Research integrity at Frontiers
Learn more about the work of our research integrity team to safeguard the quality of each article we publish.