 Xiaoqing Li
 Li Zhao
 Xinhan Chang4
- 1College of Land and Resources, Hebei Agricultural University, Baoding, China
- 2Research Center of Local Culture and Rural Governance, Hebei Agricultural University, Baoding, China
- 3Key Laboratory for Farmland Eco-environment of Hebei Province, Hebei Agricultural University, Baoding, China
- 4College of Resources and Environmental Sciences, Hebei Agricultural University, Baoding, China
The eco-efficiency of cultivated land use (ECLU) is an important indicator for ecological civilization construction in China. Exploring the spatiotemporal dynamic evolution of the ECLU is helpful for the sustainable use of arable land, ensuring food security and ecological security. However, previous studies have mostly focused on the use of a slacks-based measure (SBM) model for ECLU measurement, ignoring the more accurate epsilon-based measure (EBM) model. Therefore, in this study, first, we explored the conceptual framework of the ECLU, and then, based on 2005–2020 panel data covering the counties in the region around Beijing and Tianjin, we investigated the spatial and temporal evolution of the ECLU by using the Super-EBM model, kernel density estimation method, and spatial Markov chain model. The results show the following: 1) From 2005 to 2020, the ECLU in the region around Beijing and Tianjin displayed an increasing state, but the average value was only 0.55. 2) The temporal evolution of the ECLU has gradually polarized, and the internal gap has widened, but it tends to stabilize. 3) The ECLU in the region around Beijing and Tianjin was more inclined to remain the same, and there was a “club convergence” phenomenon, which was meaningfully affected by the background of neighboring areas. In this article, we emphasize the significance of the super‐efficient EBM model in measuring the ecological efficiency of arable land use, and discuss the spatiotemporal evolution of the ecological efficiency of arable land use at a deeper level. In light of local conditions, the government should reasonably formulate a path to optimize the ECLU, strengthen the linkage with surrounding cities, and bring into play the positive spillover effect.
1 Introduction
Cultivated land is a fundamental resource for human survival and social development (Wu et al., 2017). However, cultivated land is shrinking dramatically in many parts of the world, driven by population explosion, increasing food demand, and the overexploitation of land resources. Statistics show that since the 1960s, the global per capita area of arable land has declined from 0.41 ha to 0.21 ha. China’s per capita cultivated land area is one of the lowest in the world (Deng et al., 2010; Liu et al., 2018), and China supports approximately 21% of the world’s population with only 9% of the world’s cultivated land (Carter et al., 2012; Zhou et al., 2020). China’s agriculture has developed rapidly since the implementation of the policy of reform and opening up, and with the high speed of national economic operation and the rapid growth of industrialization and urbanization, the production model based on high input and high consumption has led to ecological problems such as environmental degradation with “undesired output” (Hawkesford, 2014), which will affect the sound development of farming and national grain security in China in the long run. To protect ecosystems and promote sustainable development, the United Nations has included cultivated land as one of the seven core areas in the Decade of Ecosystem Restoration. The No. 1 Central Government Document in 2023 proposed that we should boost green advancement in agriculture and stimulate the popularization and use of technology to reduce agricultural inputs and increase efficiency. Therefore, taking into account the comprehensive resources, economic, and ecological development, maximizing the desirable output and minimizing the undesirable output to enhance the ecological efficiency of the use of arable land have become key tasks for the comprehensive preservation of cultivated land in China.
In the 1990s, German researchers Schaltegger and Stum first developed the notion of eco-efficiency, which is defined as the proportion of the value added of a product to the environmental impact it has, emphasizing the coexistence of the economy and ecology (Schaltegger and Sturm, 1990). In 1996, this concept was further deepened, and the World Business Council for Sustainable Development (WBCSD) defined it as a competitive pricing of goods or services that provide demand and enhance the quality of life for humanity while reducing environmental and resource consumption to adhere to the carrying capacity of land (Yin et al., 2022). This concept effectively addresses the issue of economic and ecological coexistence; thus, it has gradually been applied to industry (Dahlström and Ekins, 2005), business (Côté and Booth, 2006), tourism (Gössling et al., 2005), agriculture (Akbar et al., 2021), and other fields.
As a notable index, eco-efficiency can be used to judge ecological civilization construction and reflects the state of coordination between resource use and the environment. However, it is still essential to attach importance to research on the eco-efficiency of cultivated land use (ECLU). There are many ways to assess the ECLU, such as the ratio method, the ecological footprint, the environmental sustainability value (ESV), life cycle accounting (LCA), data envelopment analysis (DEA), and stochastic frontier analysis (SFA) (Moutinho et al., 2018). Among them, the latter two methods are frequently applied. Compared to specific parametric SFA methods, non-parametric DEA does not require allocating functional forms or handling multiple input and output channels (Yu et al., 2018). In addition, to address the boundedness of traditional DEA, in 2010, Tone developed a slacks-based measure (SBM) model based on a non-radial relaxation measure, which averts the issue of the biased estimation of DEA models and effectively addresses slack in traditional DEA with excess inputs and insufficient outputs (Tone, 2001). In 2004, Tone extended the SBM model by considering production efficiency and undesirable output, making the results more realistic (Tone, 2016). The proportion of input or output target values obtained from the non-radial SBM model does not match the true value. Therefore, in 2010, Tone proposed the epsilon-based measure (EBM) model, effectively addressing the imitations of DEA and SBM models (Tone and Tsutsui, 2010). Currently, radial DEA models such as the Banker–Charnes–Cooper (BCC) model (Stępień et al., 2021) and non-radial DEA models such as the SBM model (Pishgar-Komleh et al., 2021) are often used to measure the ECLU. However, very few scholars have used the EBM model to measure the ECLU. This study holds great significance in that it reflects the real status quo of the region around Beijing and Tianjin.
In the current literature, from the perspective of study scales, studies on the ECLU have been conducted by scholars at the provincial (Ke et al., 2022), municipal (Hu et al., 2022), county (Wu et al., 2022), and village (Xiang et al., 2020) scales. From the perspective of study areas, the major grain-producing areas have been studied by numerous researchers. For example, the Yangtze River Basin and the black soil area in northeast China have been taken as study areas to explore the ECLU (Hou et al., 2019; Guo et al., 2022). From the perspective of study contents, researchers have focused on the construction of eco-efficiency index systems and the analysis of interfering factors. In terms of indicator system construction, the literature mostly takes the area of grain sown, the number of people employed in agriculture, the total power of agricultural machinery, the amount of fertilizer, pesticide, and film used, and the effective irrigation area as input indices, the agricultural output value and total grain output as desirable outputs, and carbon emissions as undesirable outputs (Fan et al., 2021; Yang et al., 2021). From the perspective of influencing factors, the literature has paid attention to the endowment of cultivated land resources, socioeconomic development, and agricultural production technology based on spatial measurement models (Zong et al., 2023) and Tobit models (Yang et al., 2022). In terms of research contents, scholars have mainly used the results of the ECLU to briefly analyze the temporal and spatial changes in the ECLU with the help of visualization tools (Coluccia et al., 2020). Additionally, some scholars have followed up with research on the regional differences in the ECLU, but scholars mostly use spatial autocorrelation to explore the changes in the ECLU (Ke et al., 2023). Unfortunately, this method cannot describe the process of the transfer of any change in the ECLU. This study analyzes the temporal evolution of the ECLU with the help of kernel density estimation, it uses a spatial Markov chain model to analyze in depth how changes in the ECLU spatially affect changes in surrounding cities, and it analyzes in depth the spatial and temporal evolution of the ECLU.
The region around Beijing and Tianjin is located in Hebei Province, neighboring Beijing and Tianjin. As municipalities directly under the central government, Beijing and Tianjin are significantly urbanized and have large populations. However, the development of urbanization has led to an increase in the pressure on the carrying capacity of the population and a decrease in the amount of arable land, which is a serious threat to local food security (Gong et al., 2020). Hebei Province is one of the main grain-producing areas in China and is rich in arable land resources, and as a part of it, the region around Beijing and Tianjin has a very important role to play in the coordinated development of the Beijing–Tianjin–Hebei region, as it has to guarantee the food security of Beijing and Tianjin while guaranteeing grain self-sufficiency. Thus, there is an urgent need to understand the status of arable land use in the region around Beijing and Tianjin to guarantee the sustainable use of arable land and food security. The main purpose of this article, using the region around Beijing and Tianjin as an example, is as follows: 1) to accurately measure the ECLU, and as the research method for doing so, the Super-EBM model is adopted to calculate the ECLU; 2) to describe the dynamic evolutionary characteristics of the ECLU, which is the content of this research, and kernel density estimation and spatial Markov chain models are used to explore the spatiotemporal differences in the ECLU; and 3) to achieve sustainable development in the region, and to that end, policy recommendations based on the research findings are provided. Ultimately, the aim of this paper is to investigate the evolutionary mechanism of the ECLU in the region around Beijing and Tianjin, with a view to promoting the sustainable development of cropland in the region and guaranteeing food security in the study area and Beijing and Tianjin.
2 Study area and data sources
2.1 Study area
The region around Beijing and Tianjin is adjacent to Beijing and Tianjin and is situated in the north-central part of Hebei Province. It is one of the 10 major grain-producing areas in China and includes six prefecture-level cities: Zhangjiakou, Chengde, Tangshan, Langfang, Baoding, and Cangzhou. The total land area is 133,000 km2, accounting for 70.4% of Hebei Province. The cultivated land area is 0.23 ha/person, and the agricultural population is 15.52 million, accounting for 51.77% of the total population. According to the national standard of cultivated land quality, the quality of arable land in the region around Beijing and Tianjin is at a medium level; the soil types are mainly chestnut-calcium soil, brown loamy brown soil, brown soil, semiarid soil, and saline tidal soil; and the main crops are wheat and corn. The landform types from northwest to southeast are coastal mud flats, plains, hills, mountains, plateaus, etc. As an important part of the Beijing–Tianjin–Hebei region, the region around Beijing and Tianjin plays a prominent part in ensuring food safety in Beijing and Tianjin. There are 71 counties (cities and districts) that were used as the study units in this paper (Figure 1).
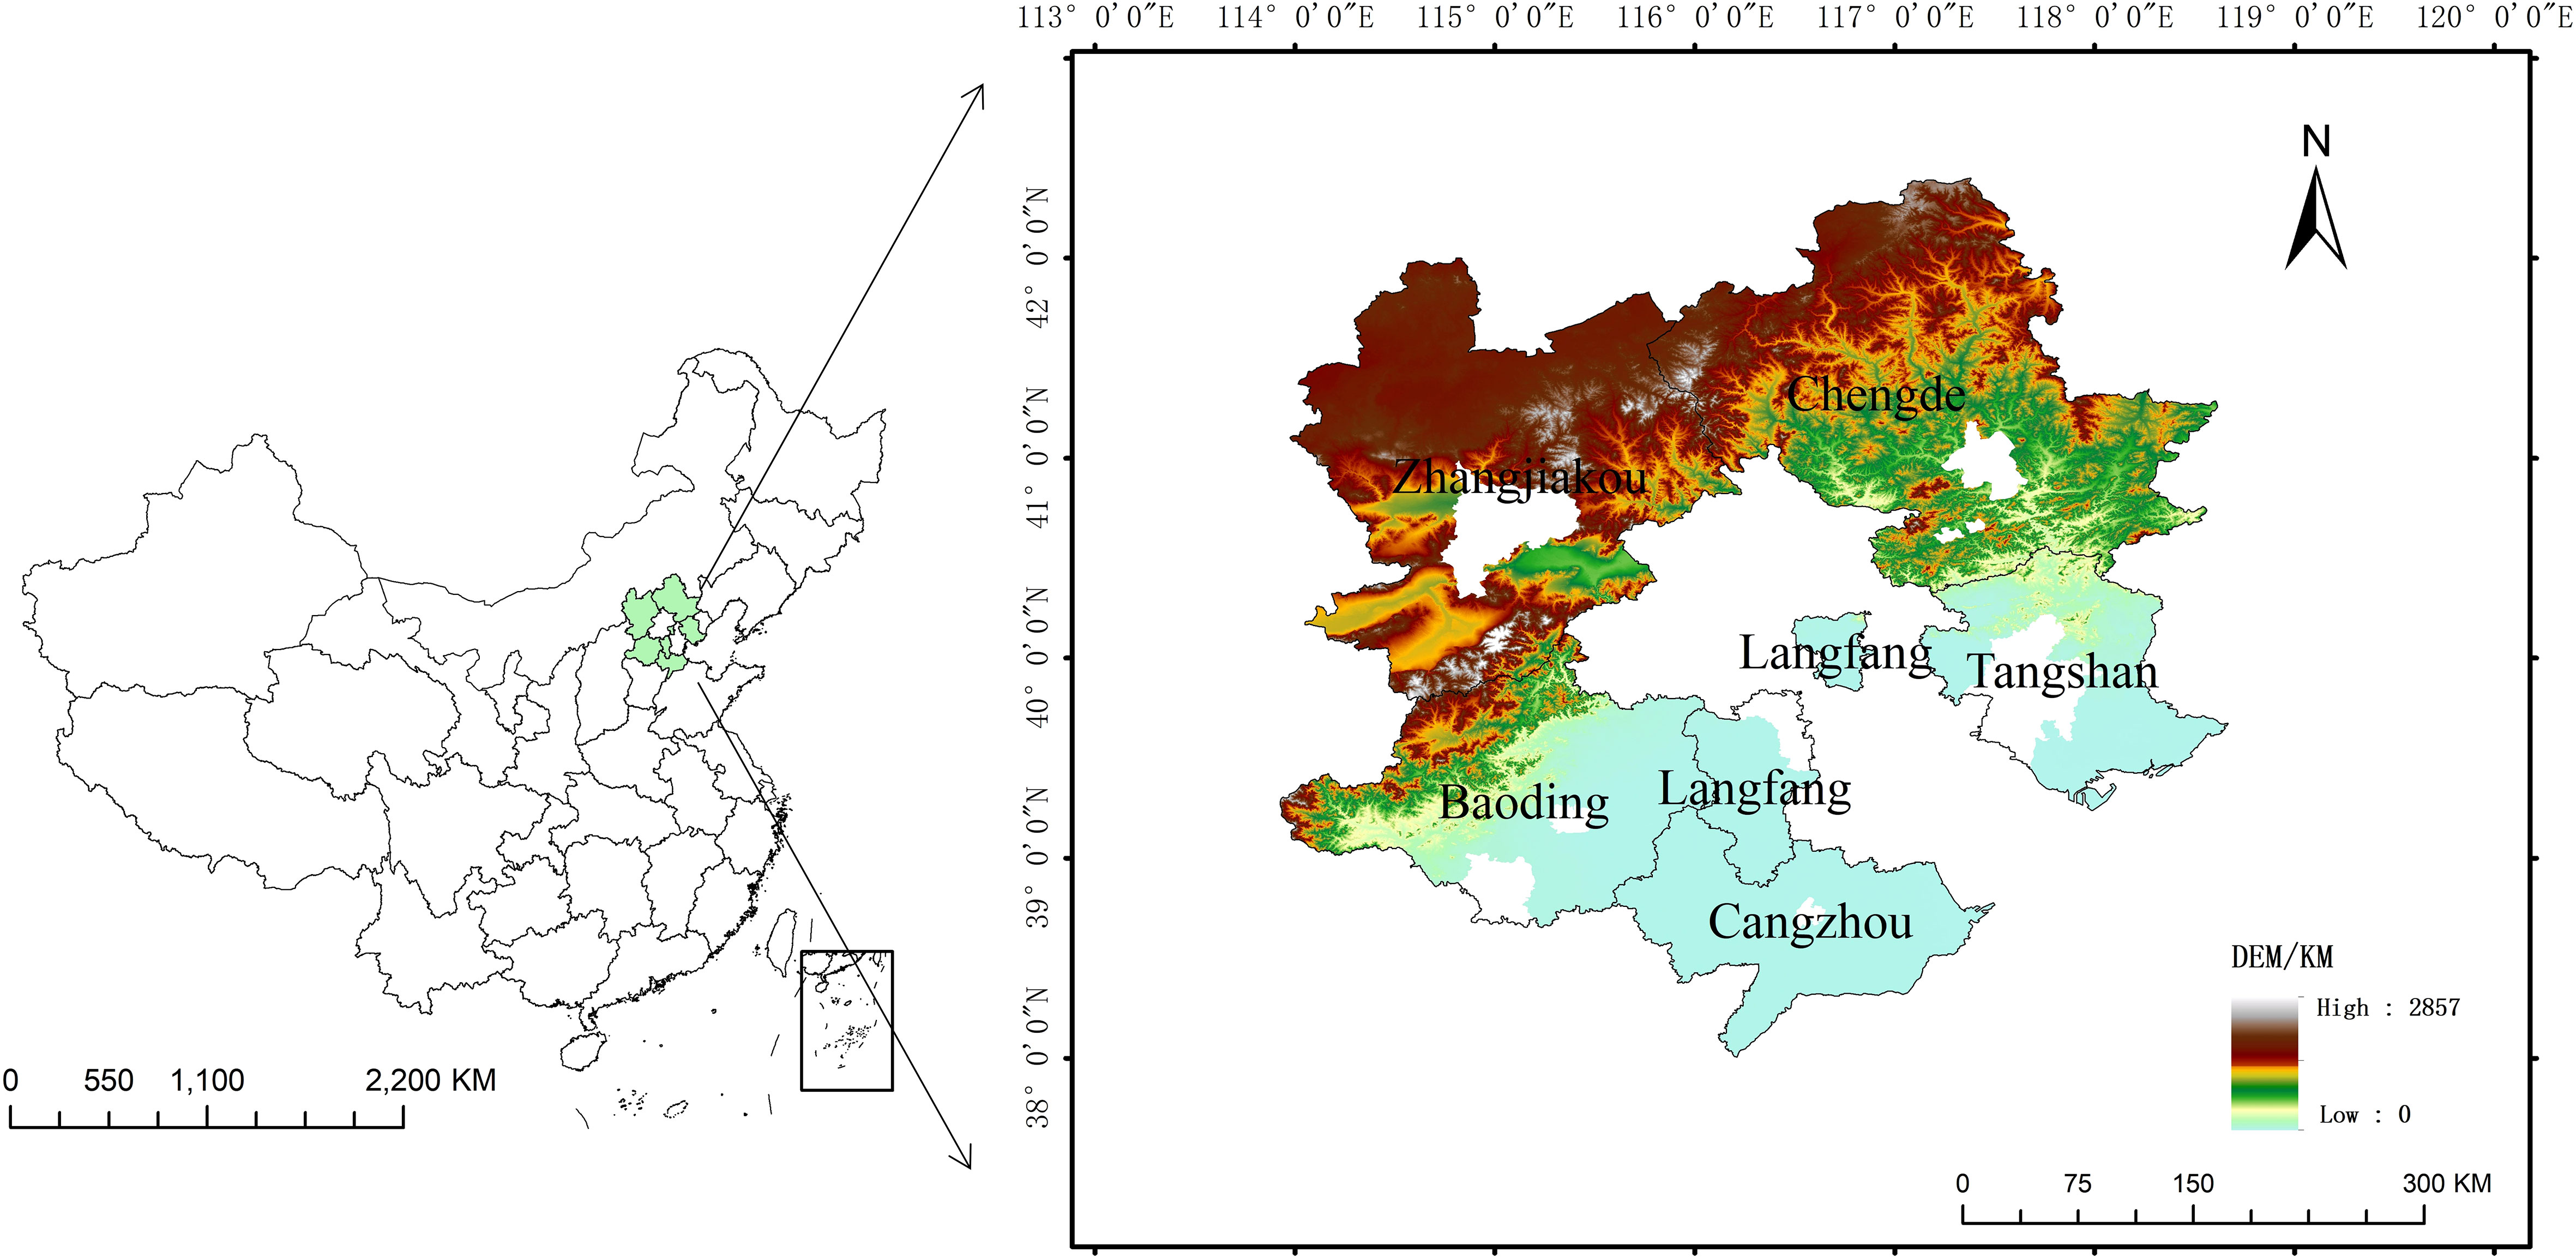
Figure 1 Overview map of the region around Beijing and Tianjin.
2.2 Data sources
The Hebei Rural Statistical Yearbook and Hebei Statistical Yearbook provided us with data from 2006 to 2021. To exclude the effect of prices, based on the consumer price index for rural residents, the value added of agriculture was converted to 2005 constant prices.
3 Research methodology
3.1 Connotation of the ECLU
Eco-efficiency has both economic and ecological meanings. The WBCSD and the Organisation for Economic Co-operation and Development (OECD) (OECD, 1998) discussed the definition of eco-efficiency. In human–earth systems, when human economic systems are moderately coupled with natural ecosystems, the system will develop toward positive succession and coordination; otherwise, the system will degrade or decline (Tan et al., 2023). This concept emphasizes the coordinated development of the economy and ecology (humans and nature) under the premise of the rational use of resources by human beings. Therefore, this paper defines the ECLU as the maximization of the output benefits of human beings with the minimum input of resources. The outputs of the economic and environmental systems per unit of cultivated land have reached a high degree of coordination, i.e., by investing an appropriate amount of production factors in the process of cultivated land utilization. The desirable outputs per unit of cultivated land are the maximum value added of agriculture, food production, and the minimum carbon emissions per unit of cultivated land. Specifically, the ECLU is divided into inputs and outputs, with the inputs corresponding to the resource system, which mainly refers to the use of means of production in cropland, such as land, machinery, labor, and fertilizers. The outputs are divided into desirable outputs and undesirable outputs, corresponding to the economic system and environmental system, which refer to the value added of agriculture and the gross food production value, on the one hand, and carbon emissions, on the other hand. If the ECLU is maximized, the two output systems should be highly coordinated under the premise of minimizing the consumption of production factors, i.e., the maximization of the economic system and the minimization of the environmental system should reach a coupled state at the same time. In addition, the rational input of resources helps to improve economic income, reduce environmental losses, and promote the output of cultivated land; efficient output will also promote more rational use. The two are the foundation and premise for each other, and the ultimate goal is to achieve coordinated resource, economic, and ecological development and symbiosis between humans and nature (Figure 2).
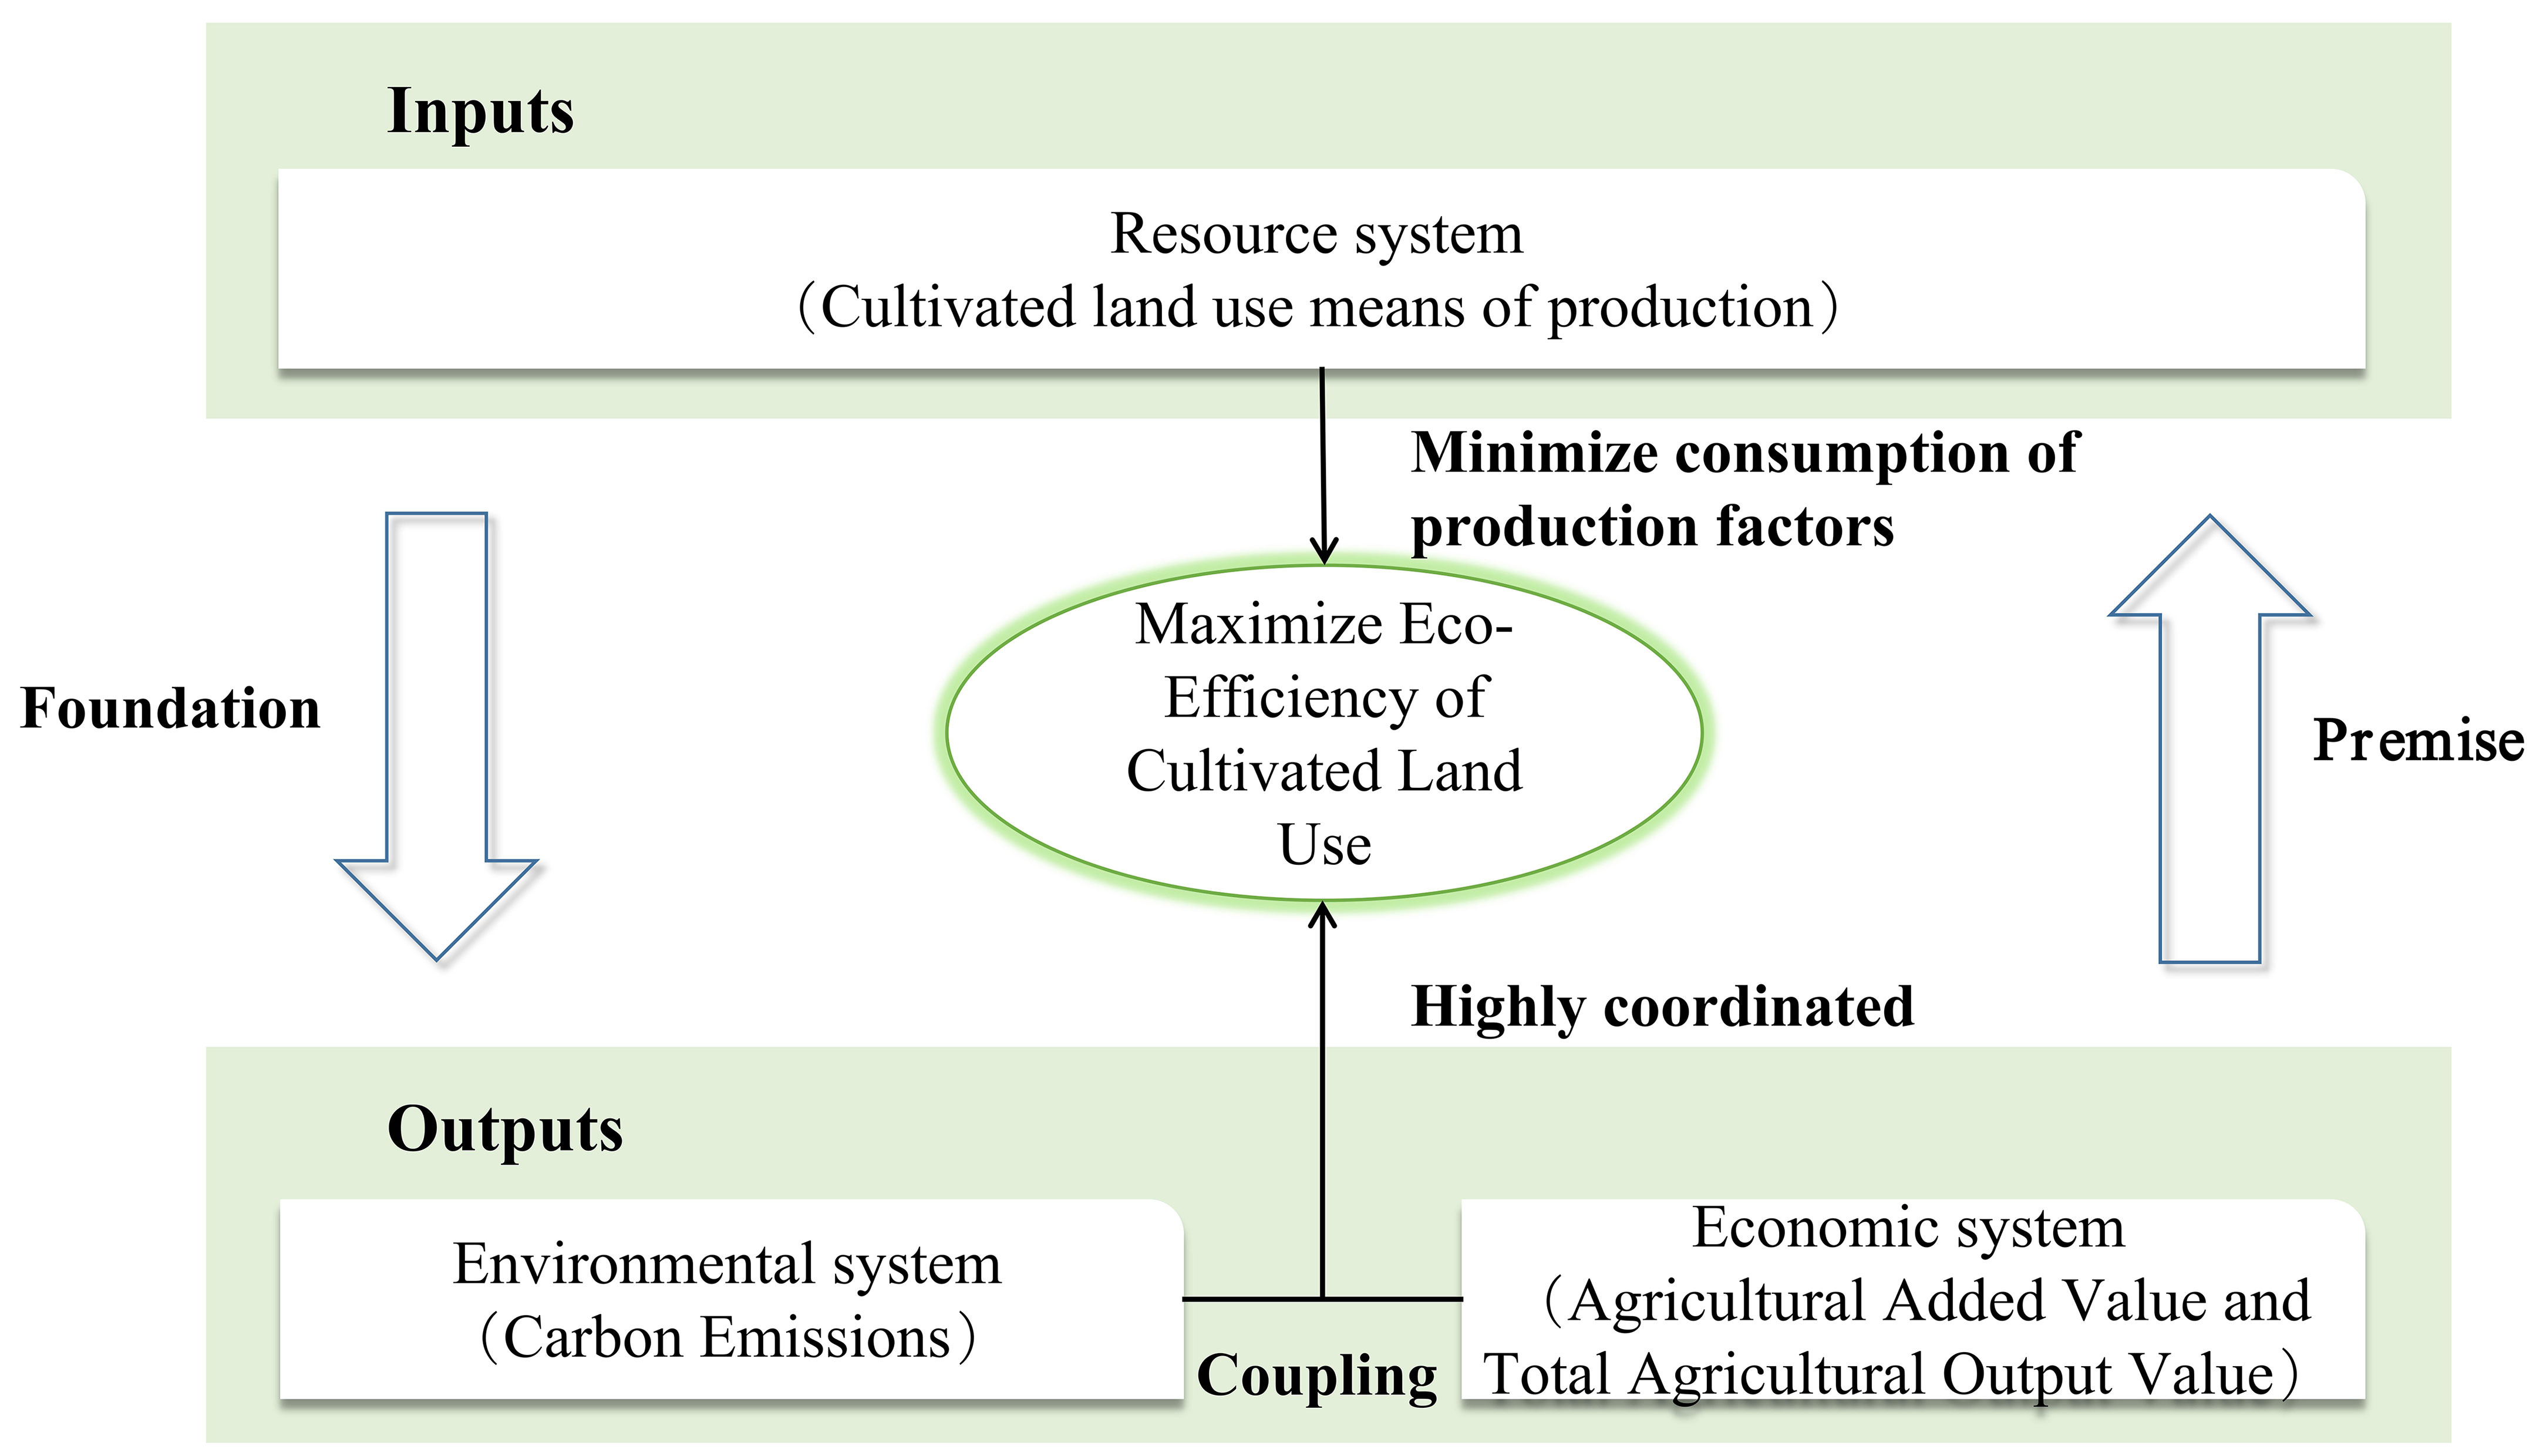
Figure 2 Map of the connotation mechanism of the ECLU. Note. ECLU, eco-efficiency of cultivated land use.
3.2 Index system construction
According to the Cobb–Douglas production function, the measurement of the ECLU is based on the inputs and outputs in the process of producing arable crops. Machinery, labor, fertilizers, pesticides, and agricultural films are taken as resource inputs. The value added to agriculture and the gross value of food production are considered desirable output indicators. Carbon emissions are considered an undesirable output indicator (Li et al., 2021; Cao et al., 2022). All indicators are divided by the crop sown area, which better describes the actual utilization of arable land (Liu et al., 2020), to obtain the unit values, as shown in Table 1.
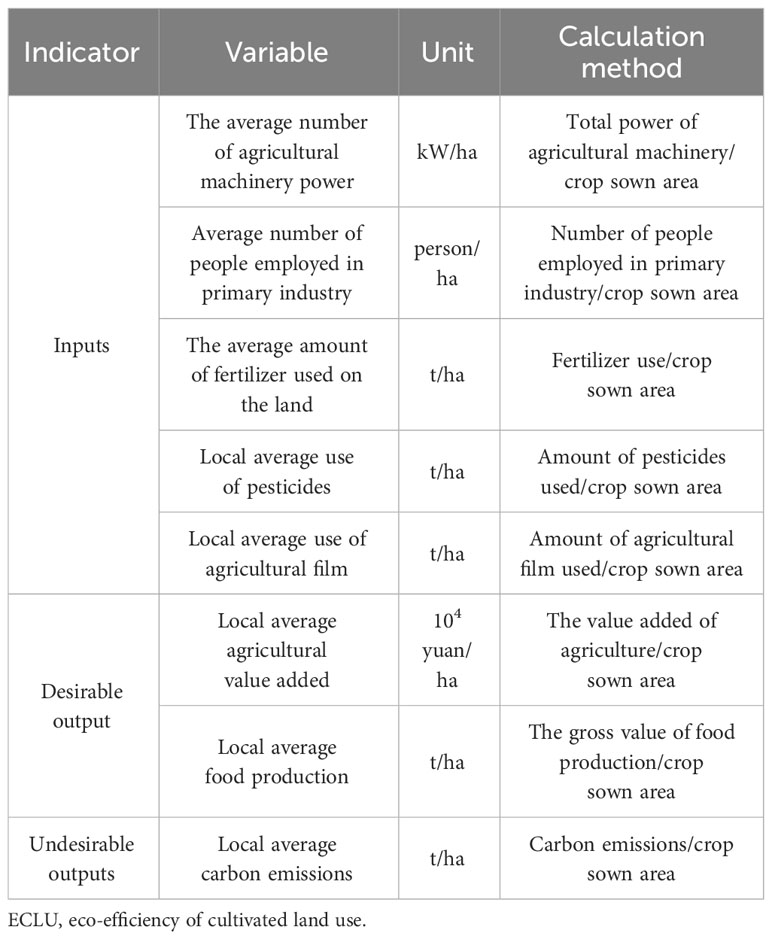
Table 1 Table of evaluation index system of the ECLU.
Based on the existing findings (Zou et al., 2020), the carbon emissions from the use of arable land are calculated as follows:
where E is carbon emission, Ei is the carbon emissions of a carbon source, Ti is the number of carbon sources, and δi is the carbon emission coefficient. Based on data from the Oak Ridge National Laboratory and the United Nations Intergovernmental Panel on Climate Change, the carbon emission coefficient of tillage is 312.6 kg/km2, the carbon emission coefficient of the total power of agricultural machinery is 0.18 kg/kW, the carbon emission coefficient of fertilizer is 0.8956 kg/kg, the carbon emission coefficient of pesticide is 4.9341 kg/kg, and the carbon emission coefficient of film is 5.18 kg/kg.
3.3 Super-EBM model
Tone developed the Super-EBM model, which considers both relaxation variables and the proportion of the obtained actual value to the target value (Tone and Tsutsui, 2010). In this article, the Super-EBM model is used to assess the ECLU in the region around Beijing and Tianjin, and the formula is as follows:
where γ* (0 ≤ γ* ≤ 1) is the optimal efficiency value; λj refers to the linear combination coefficient of DMU0; xi0, yr0, up0, and are the input, desirable output, undesirable output, and input relaxation of DMU0, respectively; n, m, s, and q are the number of DMU0, inputs, desirable outputs, and undesirable outputs, respectively; and are the desirable and undesirable output relaxation, respectively. are the importance of the inputs, desirable outputs, and undesirable outputs of various indicators. and are the radial programming parameters; is the kernel parameter of the importance of the non-radial part, which satisfies 0 .
3.4 Kernel density estimation
Kernel density estimation (KDE) is a non-parametric method that evaluates the density of the probability of random variables and reflects the distribution state of things. This paper uses the kernel density estimation method to analyze the temporal evolution of the ECLU in the region around Beijing and Tianjin, and its functional expression is as follows:
where f(x) is the density function of the ECLU, xi is the observed value of the ECLU in each county, is the overall mean efficiency, N is the sample size, h is the bandwidth, and K(·) is the core function.
3.5 Markov chain model
For the sake of reflecting dynamic changes in things, this paper adopts the Markov chain model to conduct a specific analysis of the change trend of things occurring. The traditional Markov chain model divides the ECLU into categories and constructs an N × N matrix to obtain the dynamic evolutionary characteristics of the ECLU in the region around Beijing and Tianjin through an N-order Markov probability transfer matrix. Assuming that Pij is the transfer probability of the ECLU in a region from i to j, we can estimate the probability of transfer using the frequency of transferring, which is calculated as follows:
where nij is the number of counties where the ECLU shifted from i to j during the study period and ni is the number of counties in i.
On this basis, the spatial Markov chain model introduces the concept of spatial lag, which further considers the impact of the spatial correlation of eco-efficiency between regions. In light of the spatial lag type at the beginning, the traditional N × N order probability transfer matrix is resolved into N N × N order probability transfer matrices, and Pij(N) is the probability that the transfer of the ECLU from type Ei to type Ej occurs when the spatial lag type is N. The spatial lag value is the spatially weighted mean of the ECLU of neighboring counties of county i. The spatial Markov transition matrix can better reveal the mechanism of geographic spatial patterns than the traditional matrix. The formula is as follows:
where is the spatial lag value of a county; is the ECLU in a region; n denotes the total number of counties; and is the spatial weight matrix, i.e., the spatial adjacency of counties i and j.
4 Results and analysis
4.1 Results of the determination of the ECLU based on the Super-EBM model
4.1.1 Analysis of annual change features of the ECLU
From Figure 3, the radial BCC model is more efficient than the non-radial SBM model, and the result of the SBM model without considering the internal undesirable output is higher than that of the SBM-Undesirable model considering the internal undesirable output. These results indicate that the non-radial model can overcome the shortcomings of the radial model and that not considering the internal undesirable output causes eco-efficiency to be overestimated. At the same time, in the case of considering internal undesirable output, the efficiency value of the SBM-Undesirable model is smaller than that of the EBM model. Combined with Tone’s 2010 proposal (Tone and Tsutsui, 2010) that the radial DEA model ignores slack variables leading to large measurements and the non-radial SBM model lacks the ratio of actual to target values leading to small measurements, through model comparison, this paper finds that the measurements are in line with Tone’s viewpoints. This result indicates that the EBM model integrates the advantages of radial and non-radial functions and has a better comparative advantage in eco-efficiency measurement. Therefore, this paper adopts a non-directed, scale-reward invariant, Super-EBM model to measure the ECLU in 71 counties in the region around Beijing and Tianjin from 2005 to 2020.
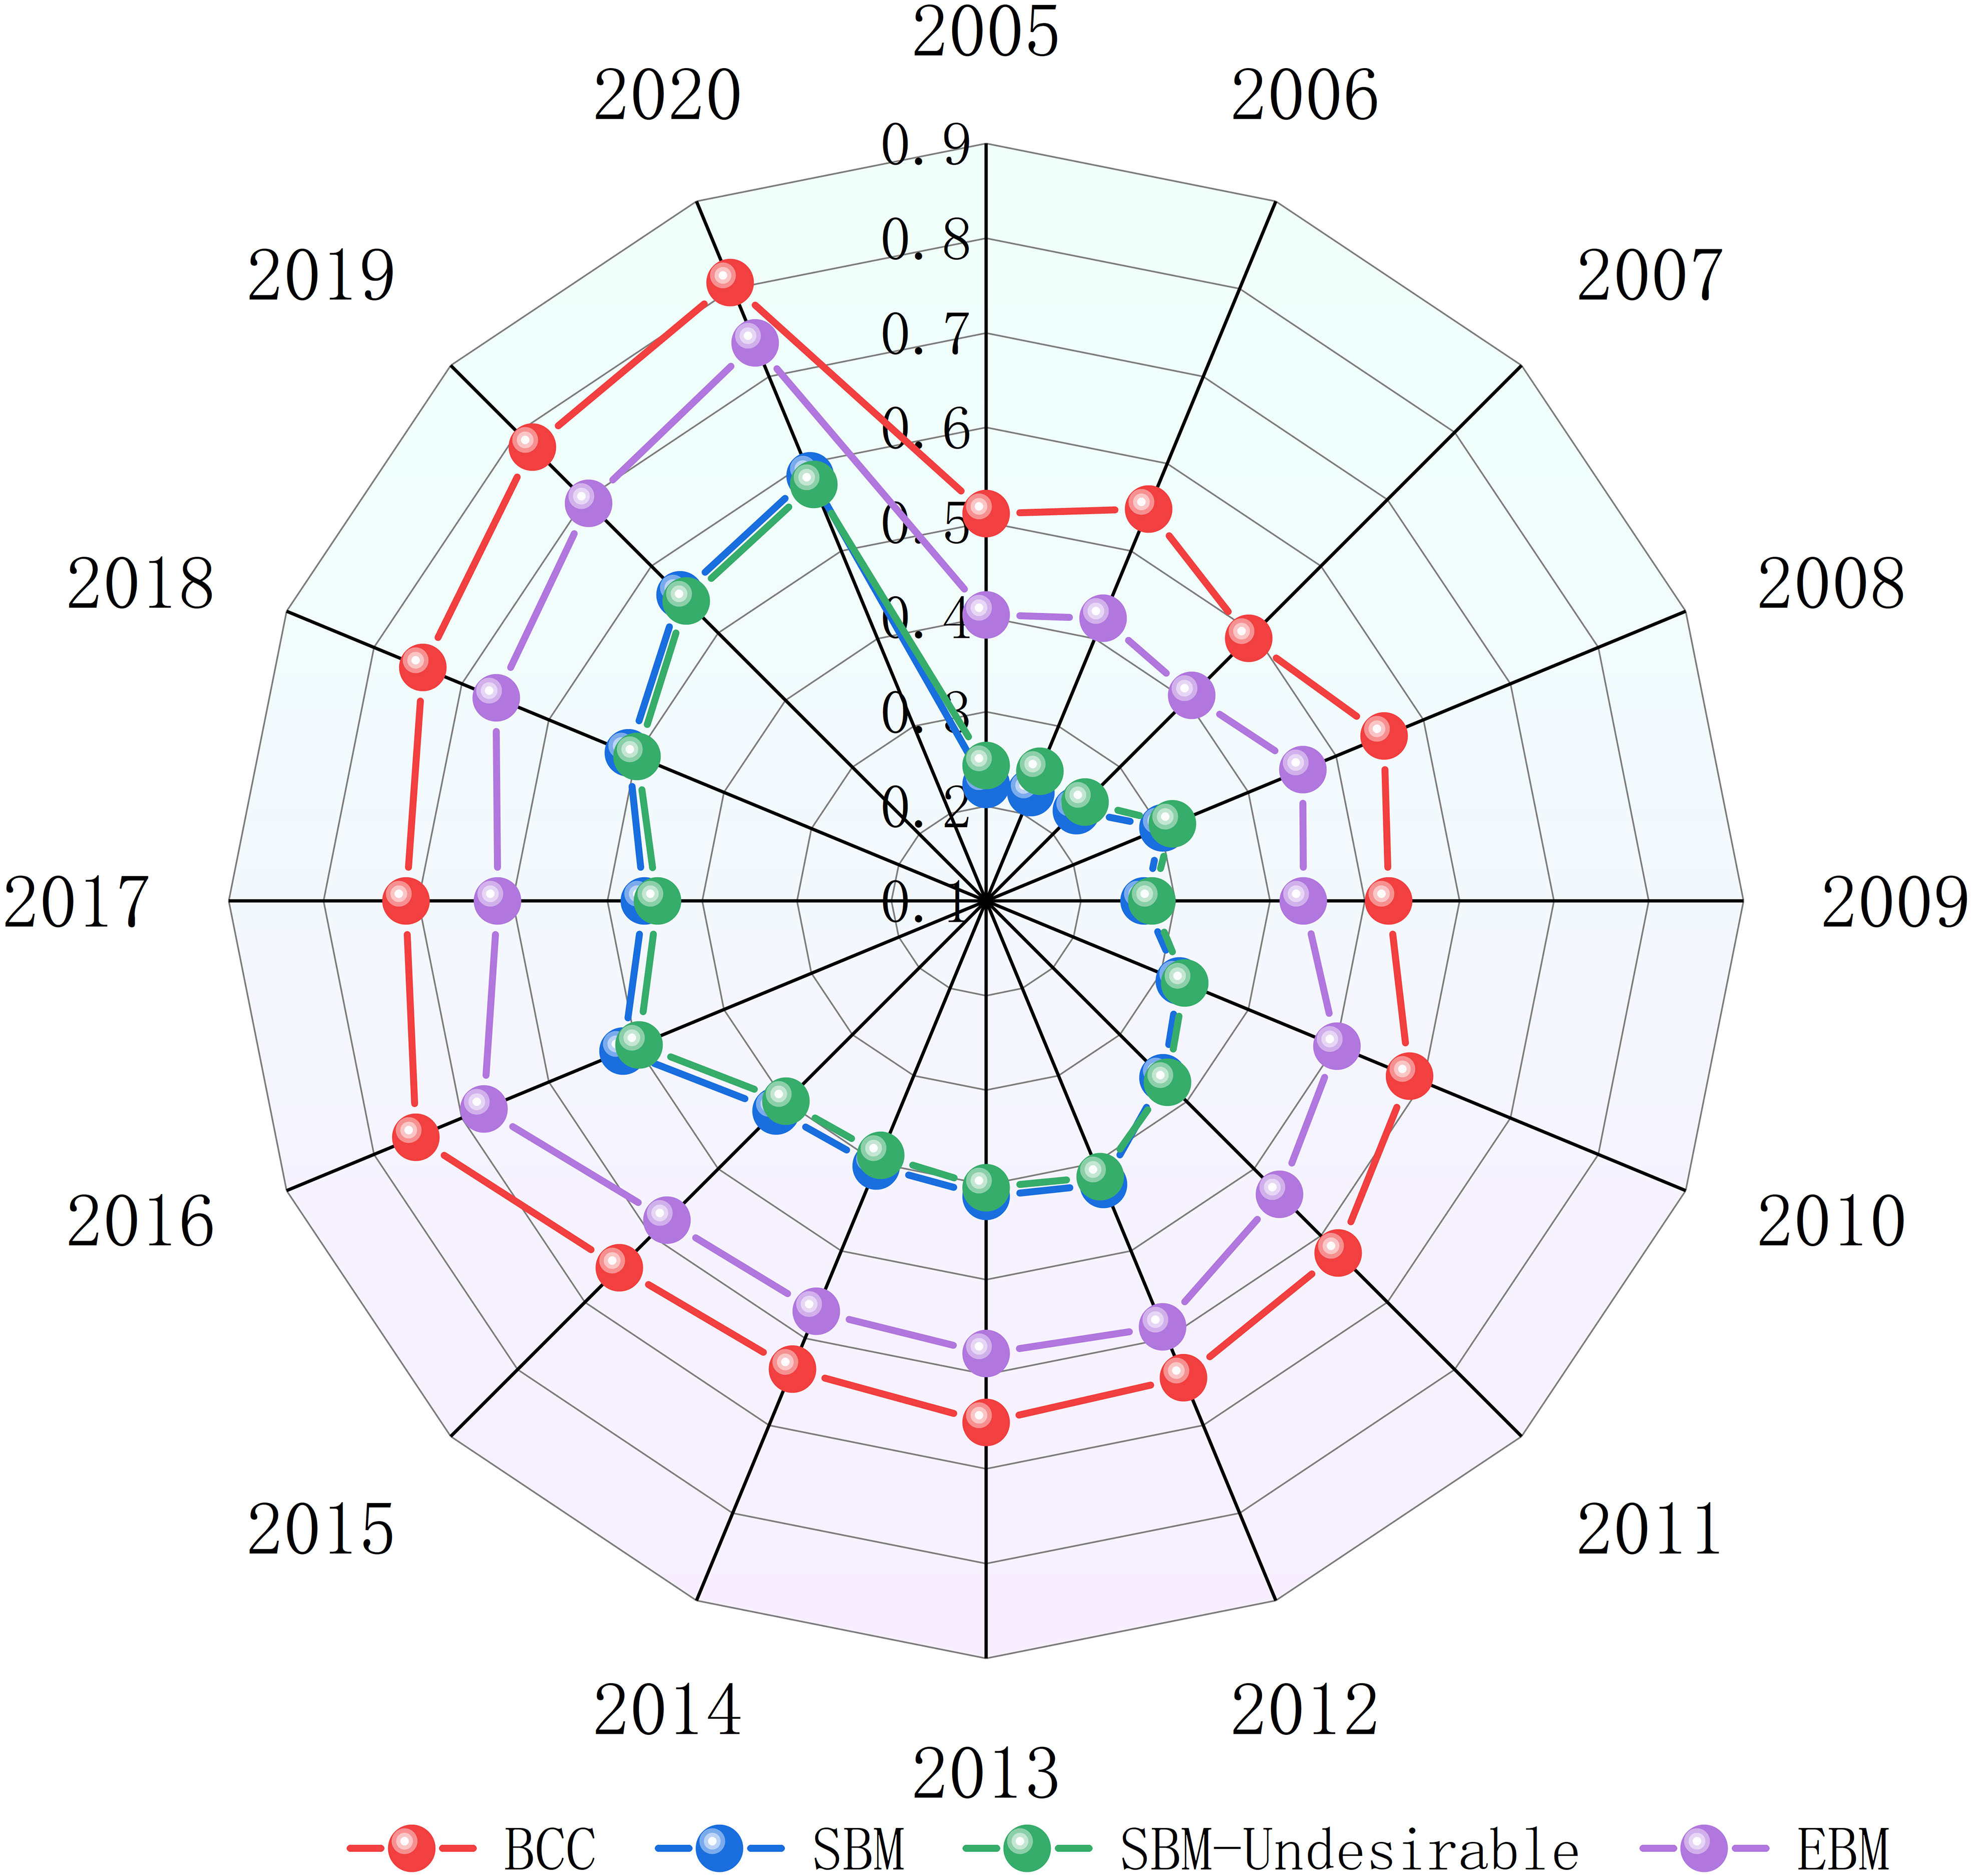
Figure 3 Comparison of the ECLU measured by each model in the region around Beijing and Tianjin. ECLU, eco-efficiency of cultivated land use.
As shown in Figure 4, the overall state of the ECLU in the study area from 2005 to 2020 expanded from 0.388 in 2005 to 0.727 in 2020, with a rate of increase of 87.37%. This trend is closely related to the protection of arable land in recent years. The rational use of chemical fertilizers, pesticides, and agricultural films has improved the ECLU, and the government has introduced policies related to the management of arable land, such as the return of farmland to forests, which plays an important role in maintaining the balance of the arable land ecosystem. However, a sharp decline occurred in 2017, mainly due to natural calamities such as abnormally high temperatures and low precipitation leading to drought, with an overall average value of only 0.55. The ECLU in the region around Beijing and Tianjin still has much room to grow. In the future process of cultivated land use, more importance needs to be attached to the rational investment and resource use of arable land to guarantee the sustainable use of cultivated land.
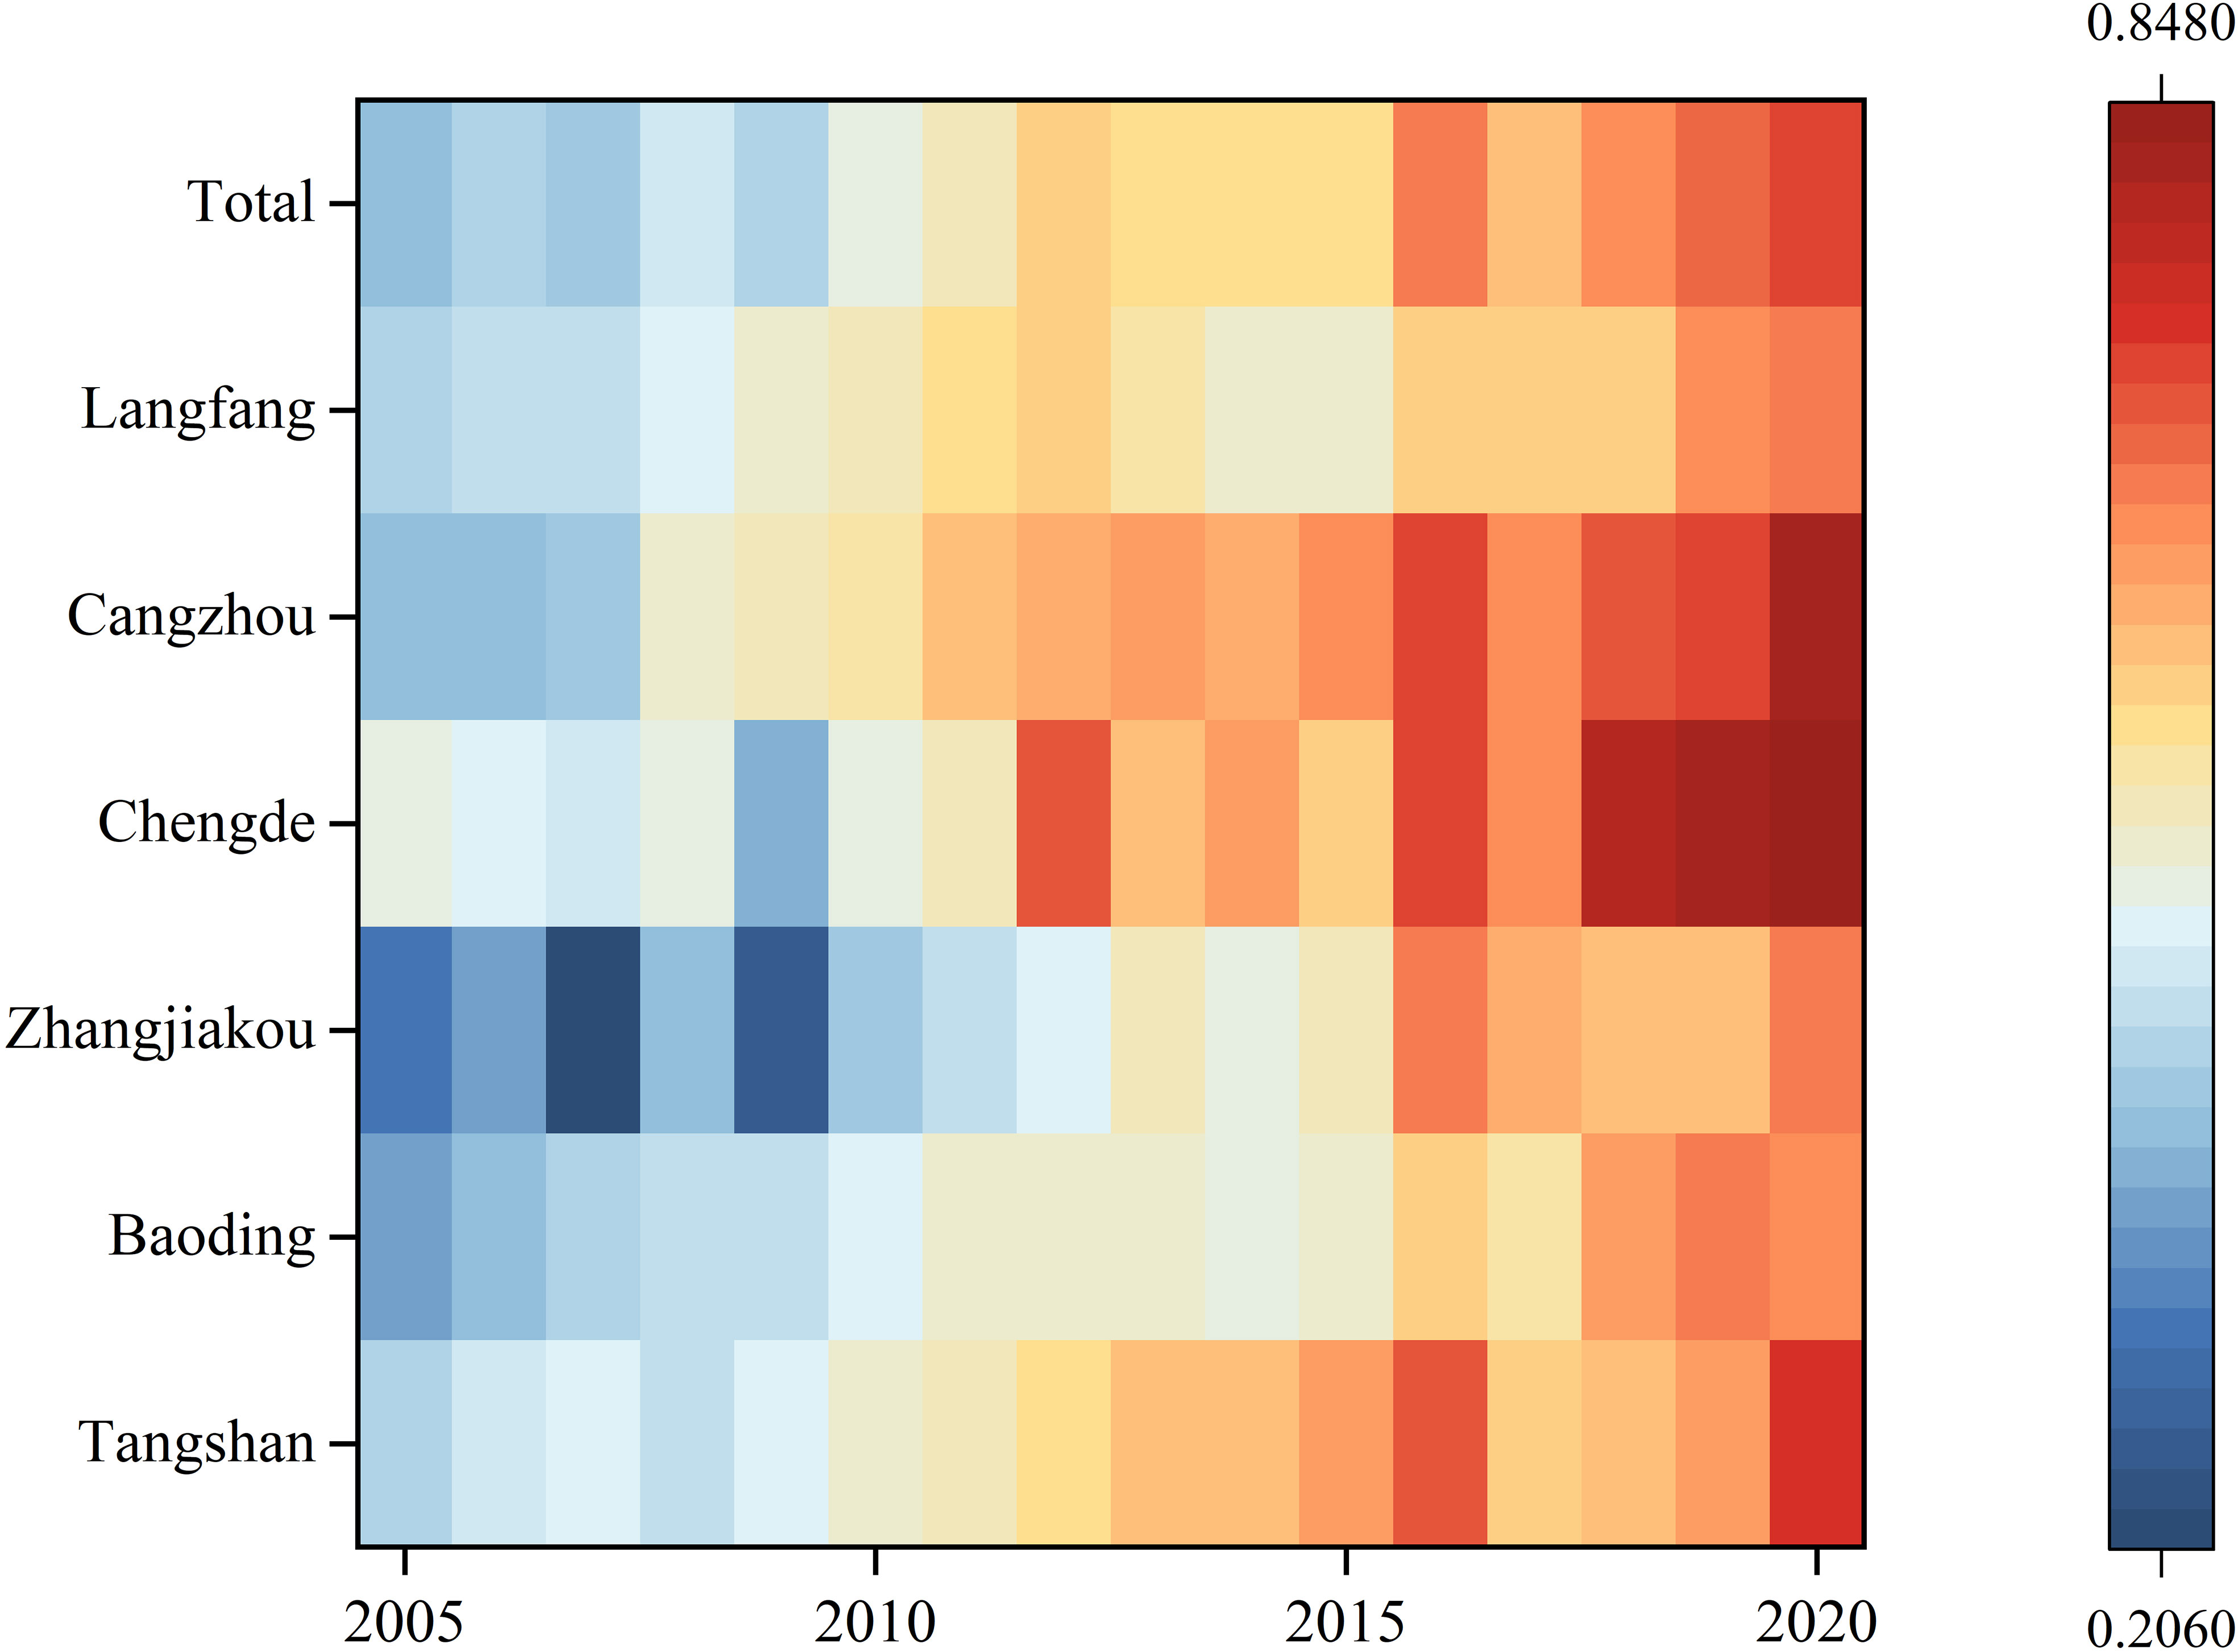
Figure 4 Changes in the ECLU in the region around Beijing and Tianjin as a whole and in each city from 2005 to 2020. ECLU, eco-efficiency of cultivated land use.
As shown in Figures 4, 5, the ECLU in the study area is consistent with the overall trend, but there are disparities among cities, and the disparities are more obvious over time. Regarding the average value, the ECLU in Chengde, Cangzhou, and Tangshan was relatively high, 0.609, 0.603, and 0.571, respectively, which is due to the obvious advantages of their local transportation location, developed advanced technology, more investment in agricultural machinery, and farmers’ strong awareness of ecological protection. Langfang, which borders Beijing and Tianjin, has the most stable development and is comparable to the overall average in terms of the ECLU, but its unique locational advantage has not been fully utilized. Zhangjiakou and Baoding are lower, with ECLU values of 0.476 and 0.517, respectively, mainly because Zhangjiakou and the western part of Baoding are mostly mountainous areas, with poor-quality cultivated land and poor agricultural infrastructure. From one year to the next, the ECLU of Chengde and Zhangjiakou changed significantly. The ECLU in Chengde declined significantly in 2009, mainly due to the impact of drought, which led to a 50.2% reduction in grain production and, thus, a sharp decrease in the ECLU. In 2012, the ECLU value rose sharply, which depended on the total power of agricultural machinery increasing by 5.9% compared with the previous year, and agricultural production conditions were greatly improved. The ECLU of Zhangjiakou fluctuated greatly from 2005 to 2010. The main reason for the decline in 2007 was the decrease in agricultural output value, which was 13.3% lower than that of the previous year, and the significant decrease in 2009 was due to the sudden decrease in grain production caused by drought.
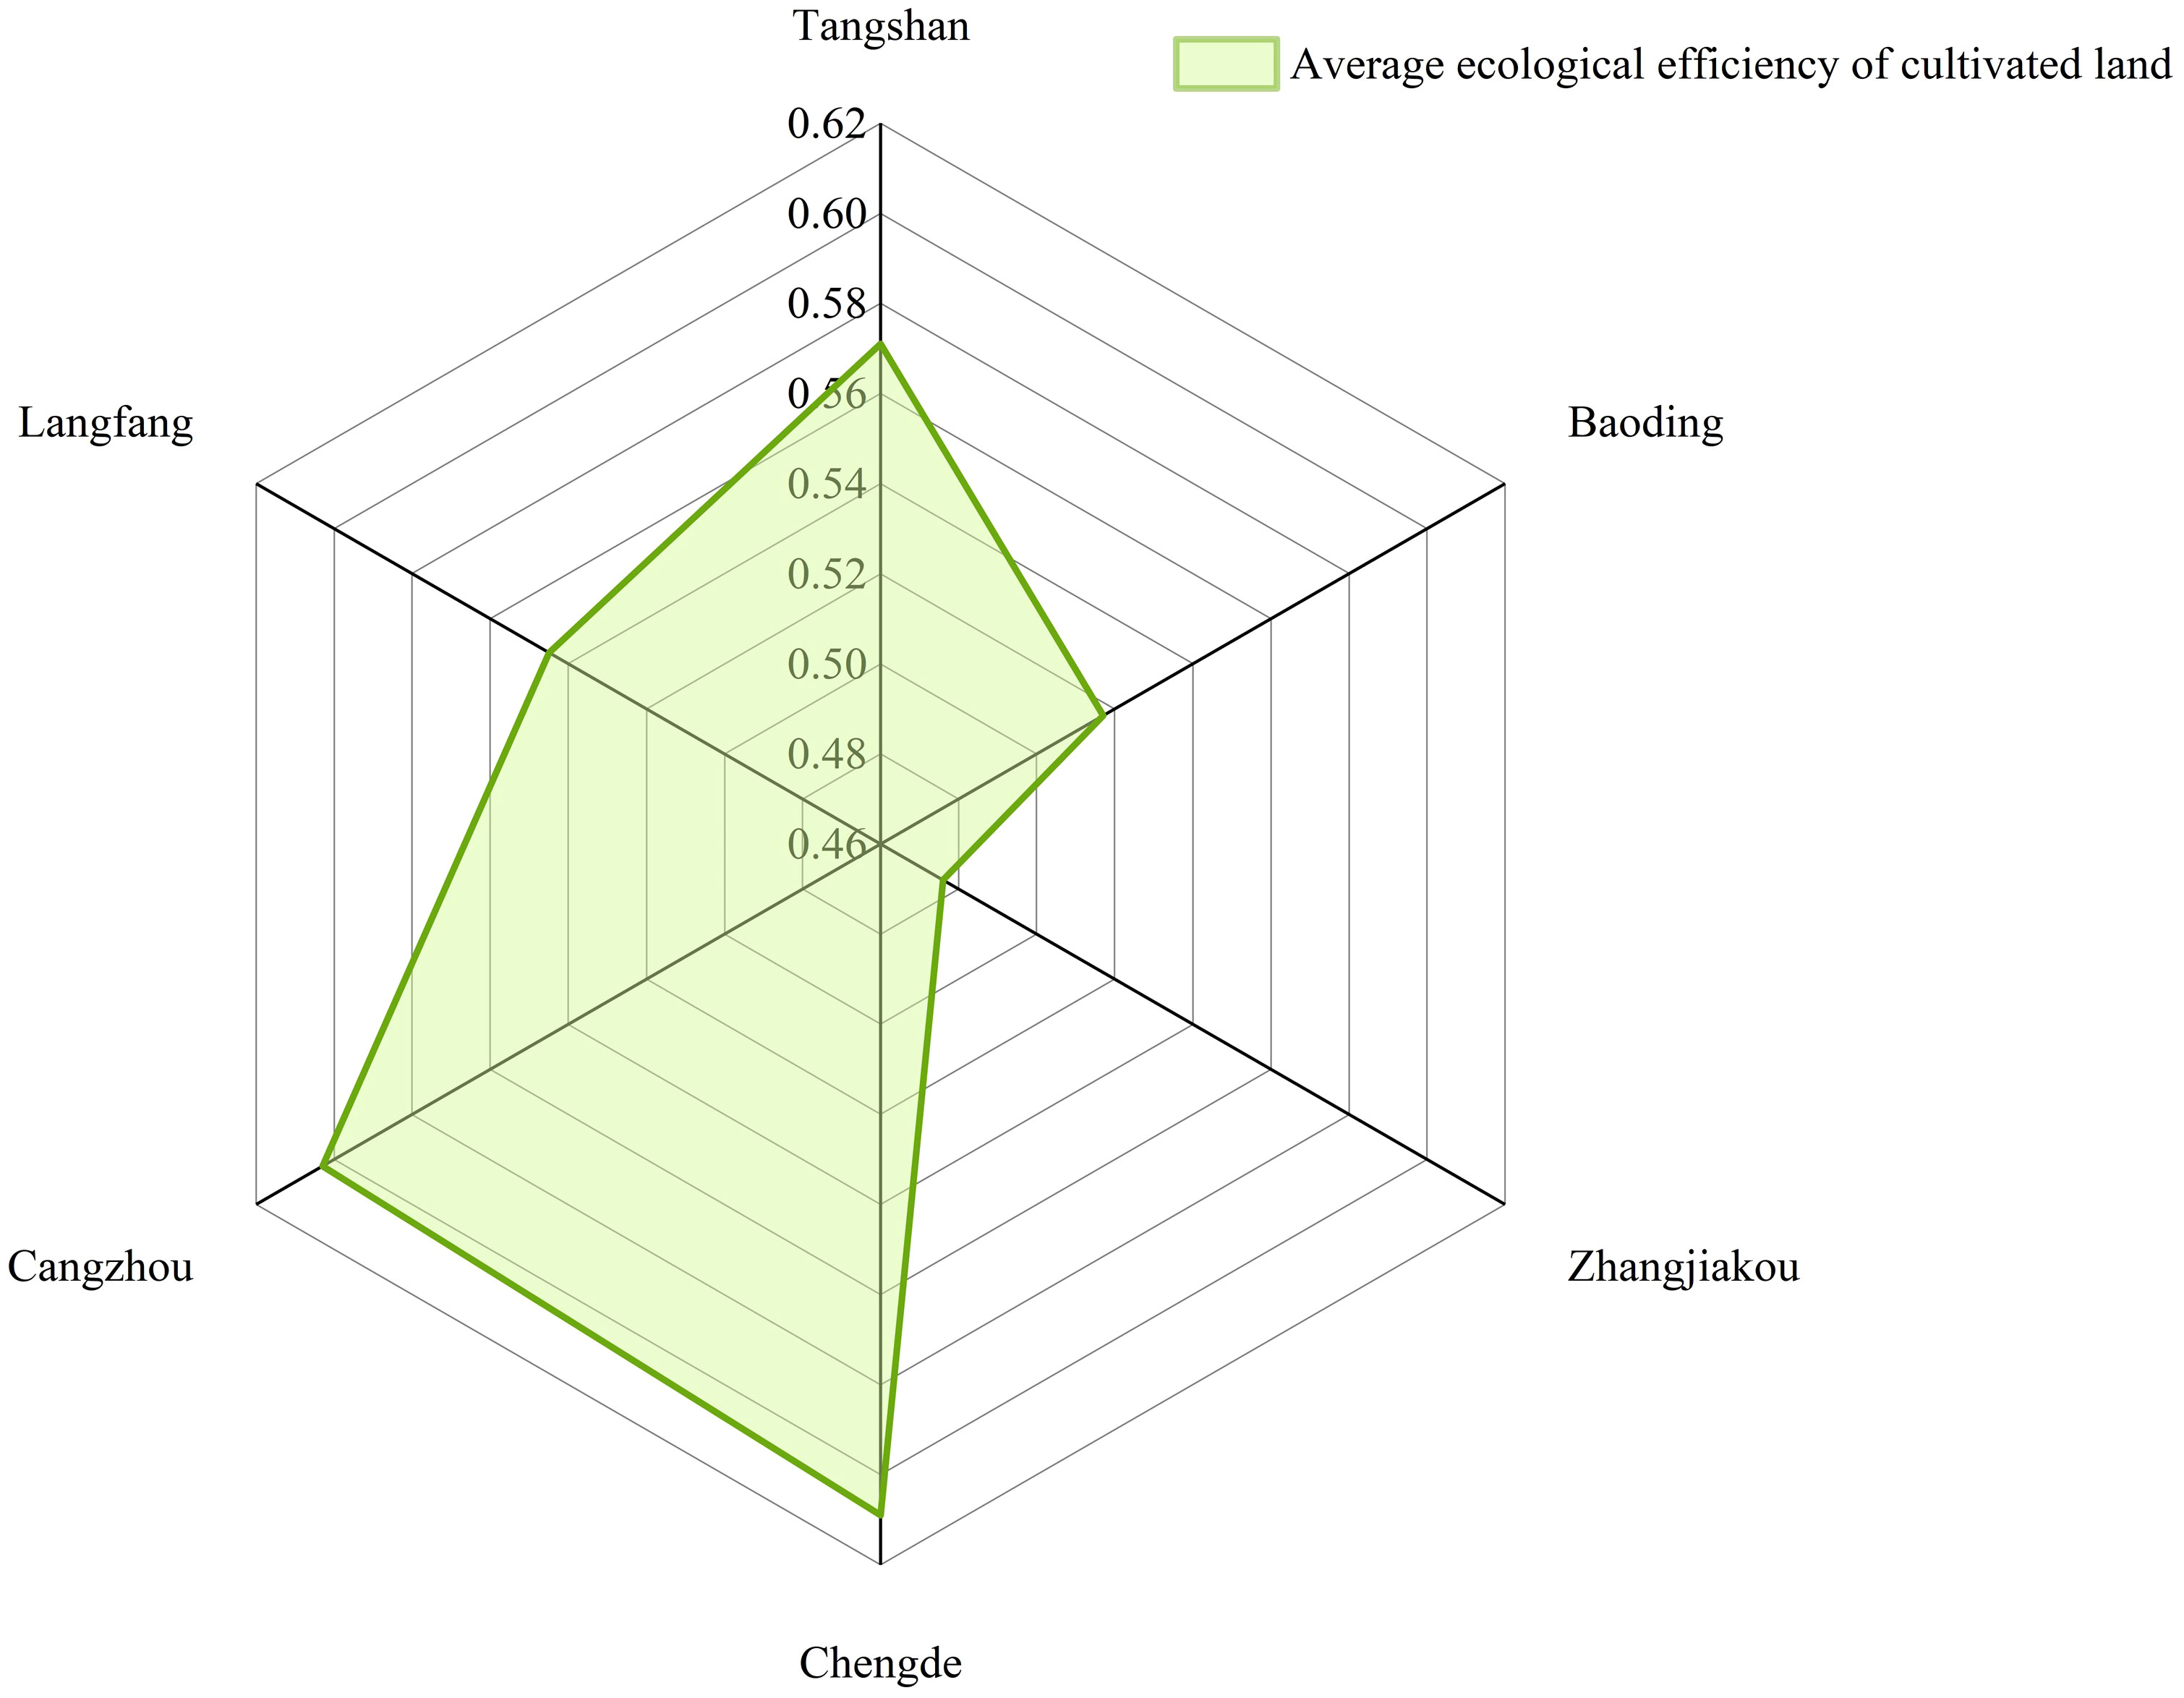
Figure 5 Comparison of the ECLU by cities in the region around Beijing and Tianjin. ECLU, eco-efficiency of cultivated land use.
As shown in Figure 6, from a county perspective, the average value of eco-efficiency in all counties did not reach an effective state. Comparison shows that the counties (cities and districts) with an overall high ECLU are Rongcheng County of Baoding; Longhua County of Chengde; Pingquan City, Yutian County, and the Caofeidian District of Tangshan; Da-chang Hui Autonomous County of Langfang; and Renqiu City, Cang County, and Qing County of Cangzhou, with mean efficiency values reaching 0.7 or more, of which 33.33% are in Cangzhou City, followed by Chengde City and Tangshan City and one county each in Baoding and Langfang. The reason is that the high ECLU of the three counties in Cangzhou City is related to their topography and location, as all three counties are in a plains area, and Renqiu City, Cangzhou County, and Qing County are bordered by the Xiong’an New Area, Cangzhou City, and Tianjin City, respectively; thus, they are more likely to be exposed to advanced agricultural farming technology and ideology. Rongcheng, which has the highest mean efficiency, is located in Baoding, which was designated the Xiong’an New Area in 2016; the scale and mechanization of land are constantly improving, and the awareness of environmental protection is advancing with the times to improve the ECLU. However, there are 29 counties with an average efficiency of less than 0.5, including Yangyuan County, Yu County, and Quyang County, with 34.48% in Baoding and 24.14% in Zhangjiakou, which are mainly located around the Taihang Mountains with high terrain, relatively poor soil, and poor agricultural irrigation conditions. Thus, there is more room for improvement.
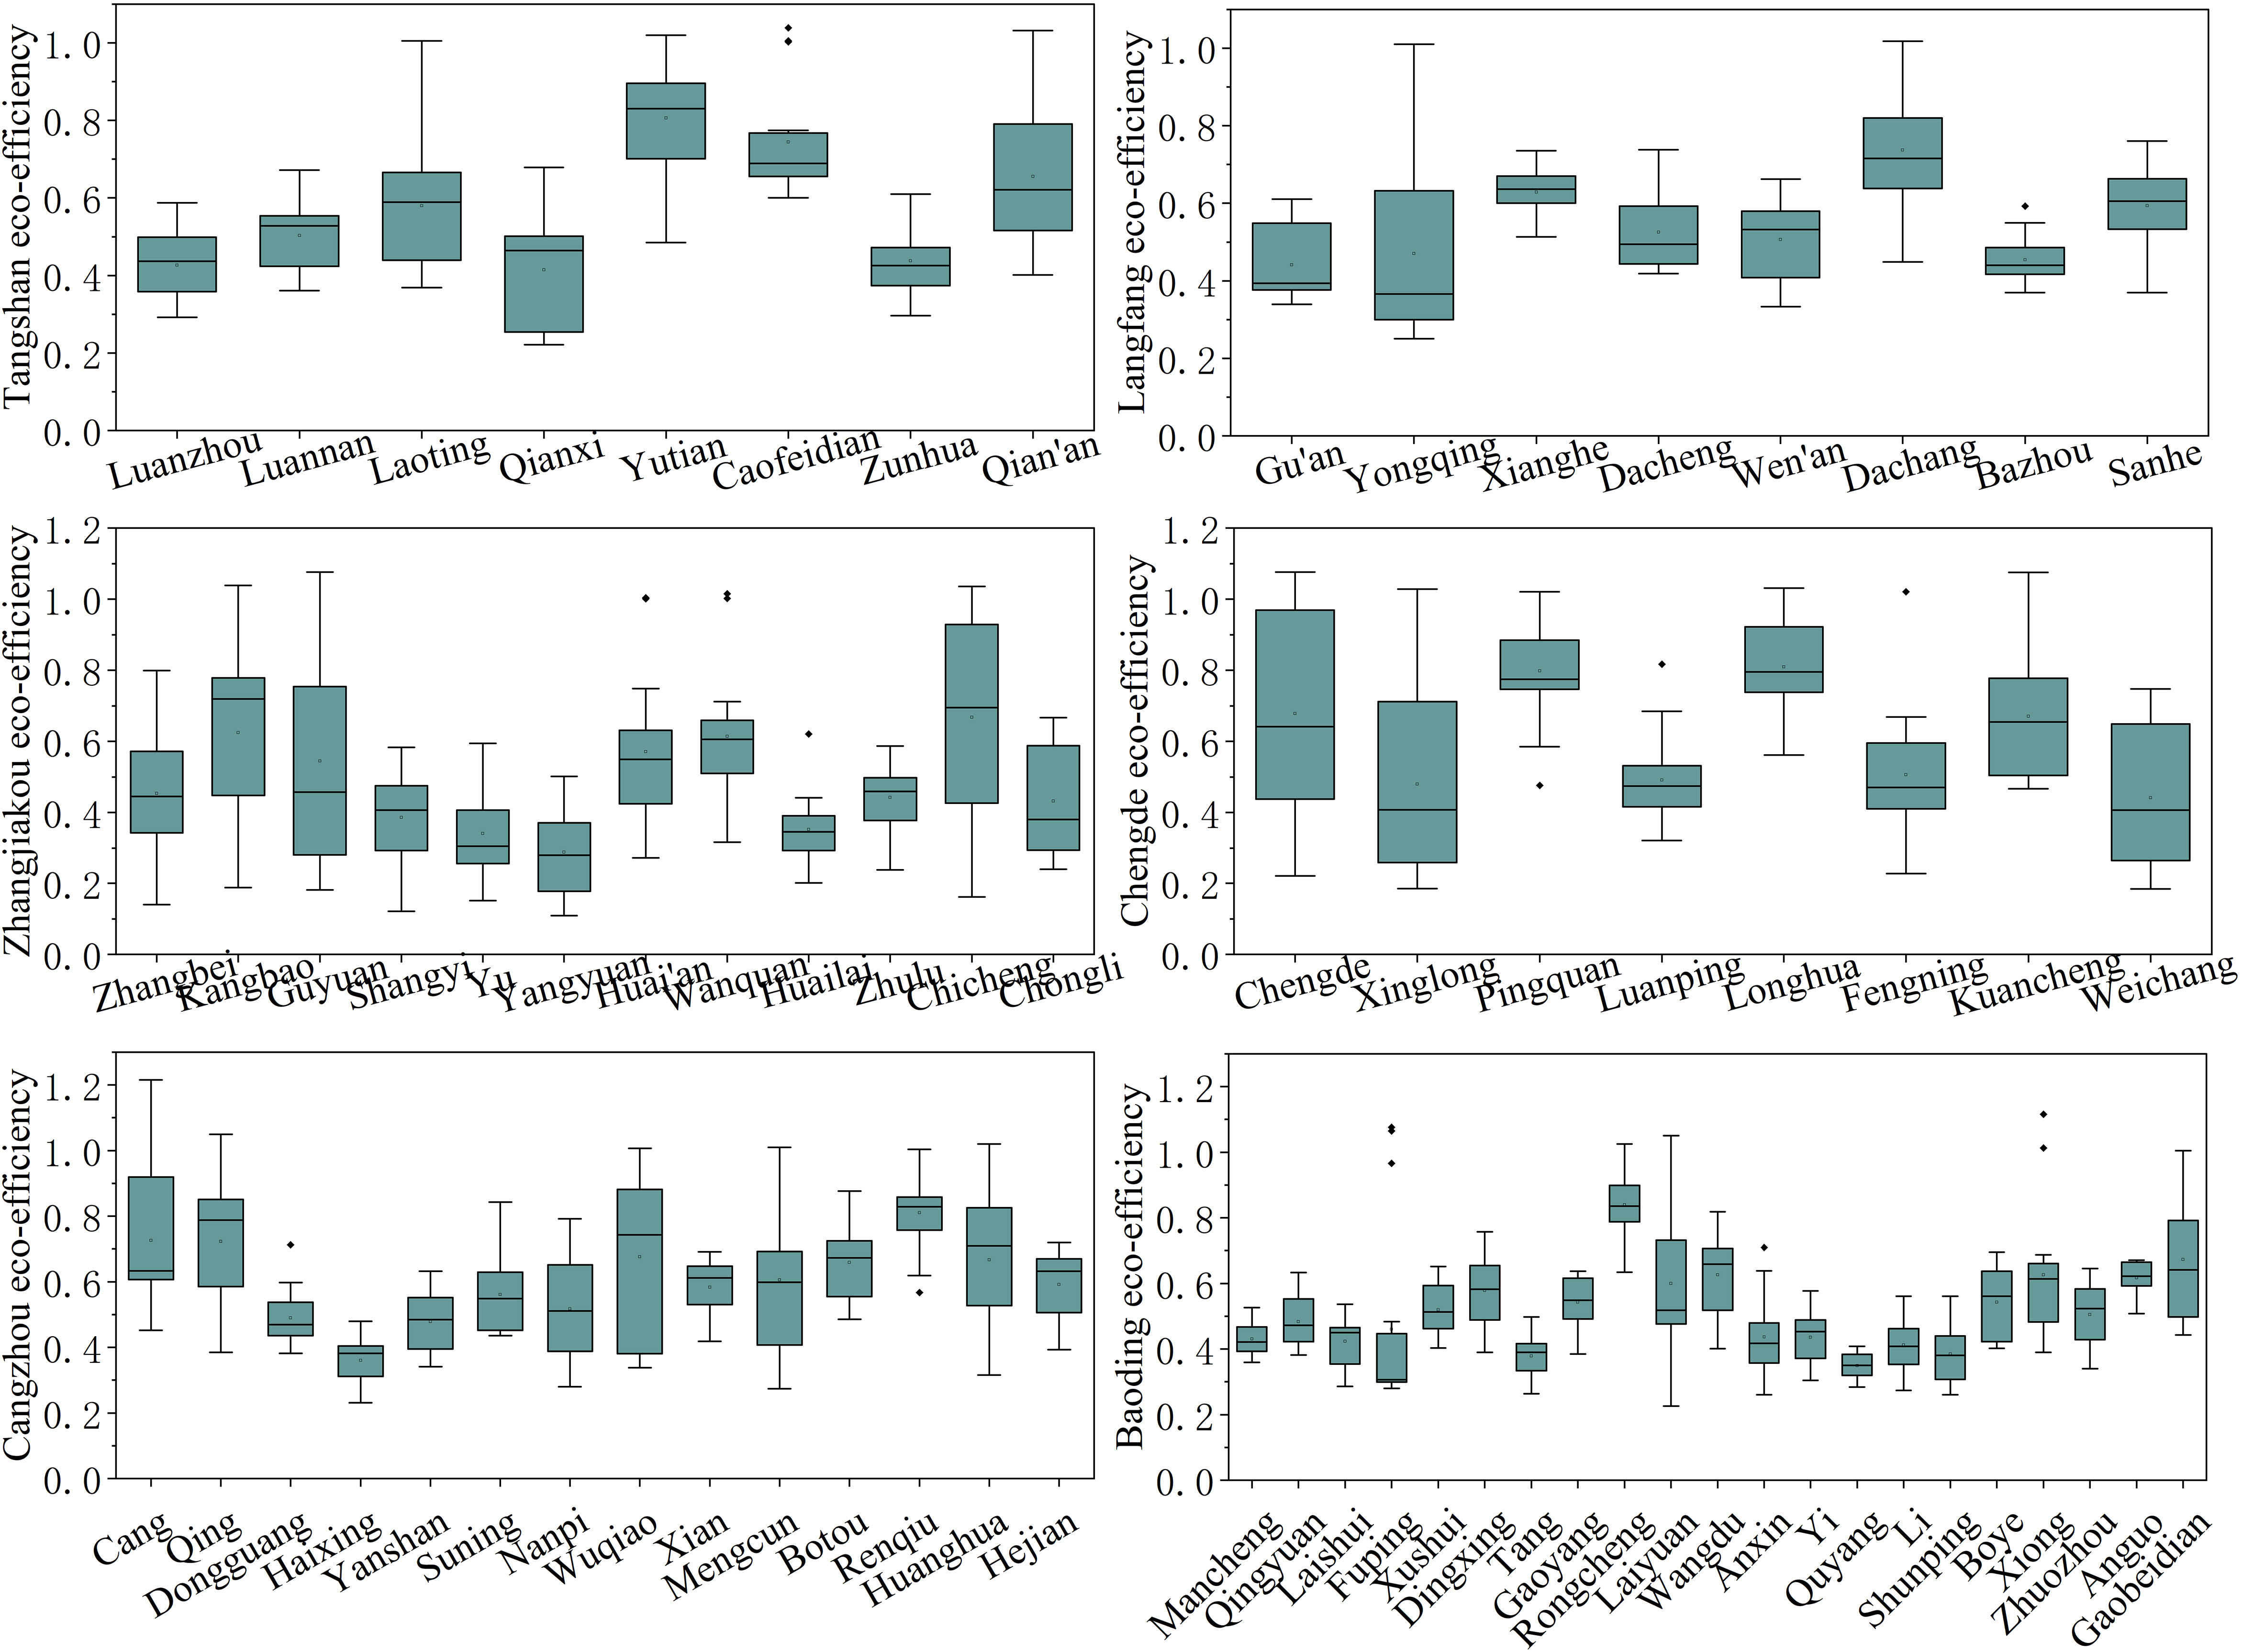
Figure 6 Mean value of the ECLU by counties in the region around Beijing and Tianjin. ECLU, eco-efficiency of cultivated land use.
4.1.2 Analysis of the spatial distribution features of the ECLU
Data on four periods of the ECLU in the region around Beijing and Tianjin, i.e., 2005, 2010, 2015, and 2020, were selected for analysis, and the data were visualized using ArcGIS 10.7. The natural break point method was used, and considering that an efficiency of 1 is an effective decision-making unit, each county unit was divided into five classes, i.e., (0, 0.5], (0.5, 0.6], (0.6, 0.7], (0.7, 1.0], and (1.0, 1.1], as shown in Figure 7.
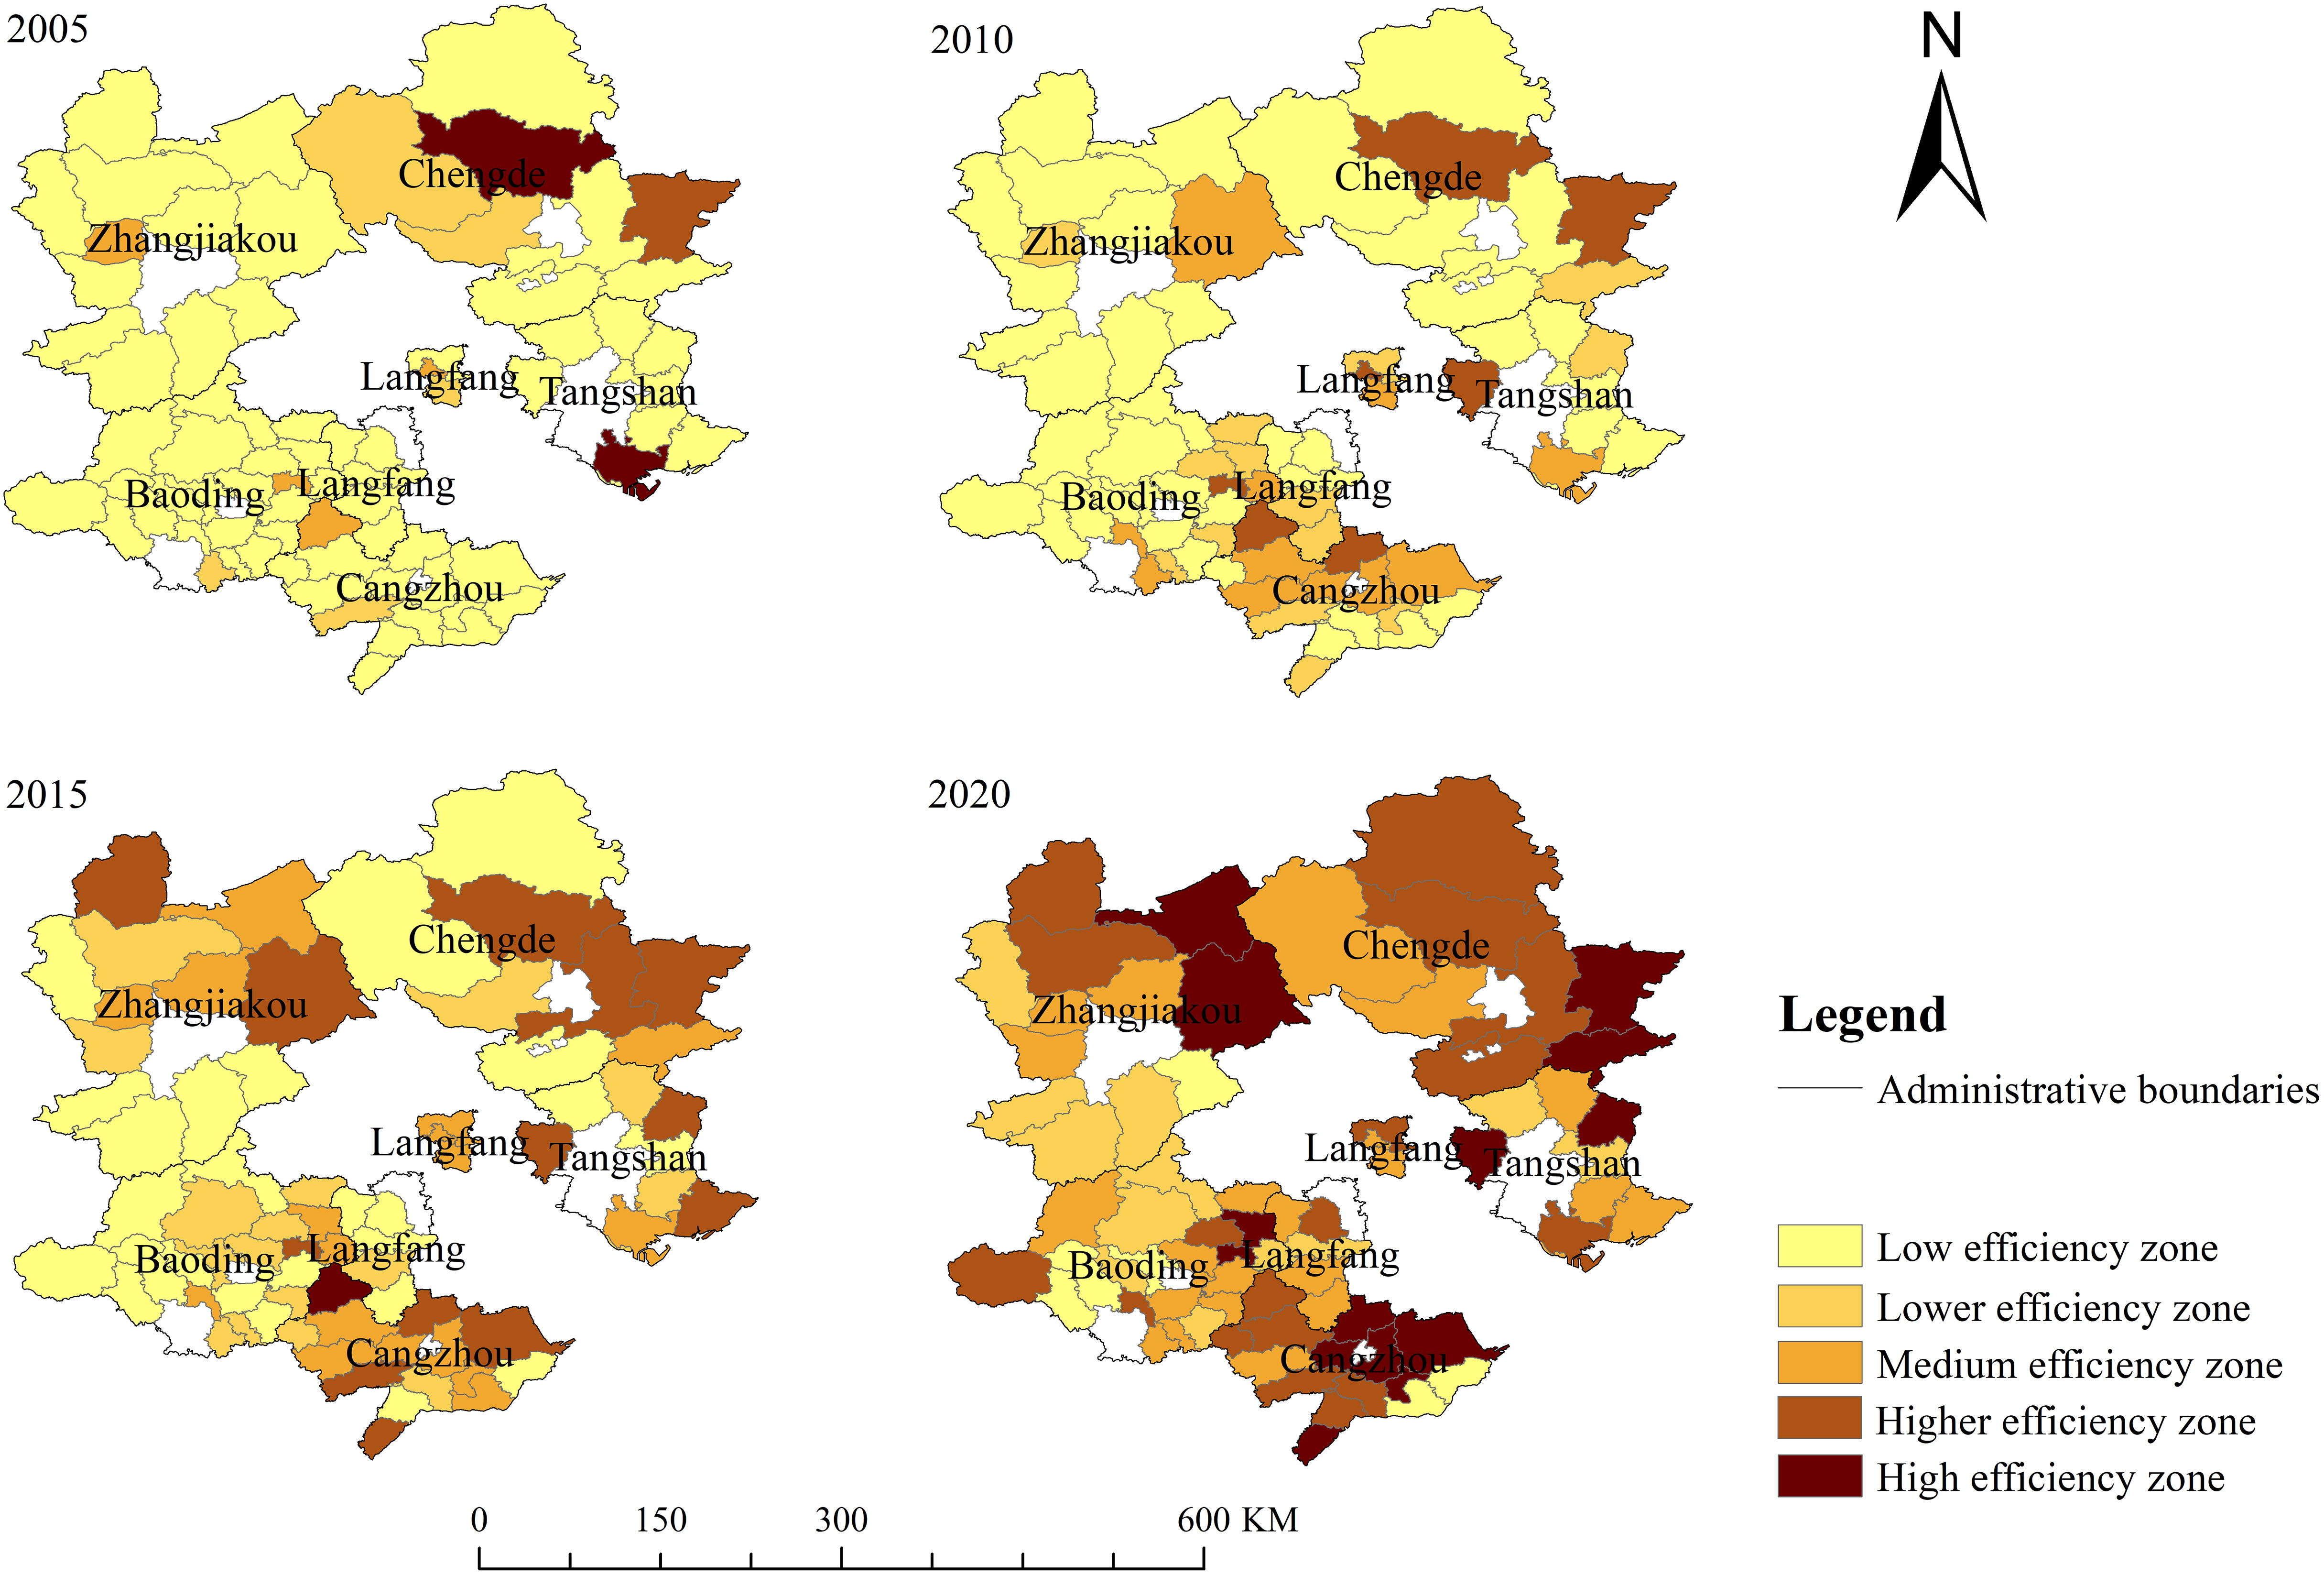
Figure 7 Spatial and temporal variations of the ECLU by counties in the region around Beijing and Tianjin. ECLU, eco-efficiency of cultivated land use.
We analyze the temporal features of the ECLU in each county. In general, the number of zones increased, but the number of inefficient zones gradually decreased. Fifty-nine out of 71 counties were inefficient zones in 2005, accounting for 83.1%, but only two counties, Longhua County and the Caofeidian District, were effective decision-making units, i.e., high-efficiency zones, accounting for only 2.82%. These results indicate that the spatial distribution of efficiency values in the study area was relatively homogeneous at this time, and there was a large potential for development. With the promotion of ecological civilization construction, the ECLU in several counties (cities and districts) in the region around Beijing and Tianjin increased to different degrees from 2005 to 2020. The year 2010 saw a slight improvement in the ECLU, but more than two-thirds of the counties were still in the inefficient zones. In 2015, the ECLU was further improved, the number of inefficient zones accounted for approximately one-third, and more than 40% of the areas were medium-high-efficiency zones. In 2020, the ECLU improved significantly, with only six counties being inefficient zones, mainly in southwest Zhangjiakou, southwest Baoding, and eastern Cangzhou, and those six counties had been low-efficiency zones for 16 years, with a poor resource endowment being the fundamental reason for their low ECLU. The number of counties in the lower-, medium-, and higher-efficiency zones are 12, 22, and 18, respectively, but the overall ECLU of the western area of the region around Beijing and Tianjin is low. Thirteen counties (cities and districts), including Qian’an City, Rongcheng County, Guyuan County, Pingquan City, and Cang County, have efficiency values greater than 1; i.e., they are in an effective state, indicating that these 13 counties attach more importance to the rational use of resources and have a stronger sense of ecological protection. The ECLU values of Longhua County and the Caofeidian District dropped from being high-efficiency zones in 2005 to being higher-efficiency zones. The efficiency value decreased significantly, which is mainly due to the increase in redundancy in essential productive factors such as pesticides, films, and chemical fertilizers.
From the distribution of the ECLU by county in 2020, the distribution of low- and lower-efficiency zones is concentrated, mainly distributed in the western part of the region around Beijing and Tianjin, with Zhangjiakou City and western Baoding City as the main part. Although the ECLU improved during the study period, the growth in the ECLU was slow, which was caused by the barren quality of cultivated land in the area, its high altitude, and the insufficient agricultural water supply. The low ECLU in Yanshan and Haixing counties in the southeastern part of Cangzhou City is mainly due to the extensive distribution of saline land, which leads to the low output rate of cultivated land and thus inhibits the ECLU. The distribution of medium-efficiency zones is relatively scattered. The higher-efficiency zones and high-efficiency zones, although involved in all municipalities, are mainly distributed in Cangzhou in the immediate south of Tianjin and Tangshan in the north, which are mainly related to their locational advantages and topographic conditions, which are flat and suitable for large-scale cultivation. As a municipality directly under the central government, Tianjin is an important transportation hub with obvious radiation effects on surrounding counties, and it is in the coastal zone, with relatively advanced production concepts and planting techniques introduced. Therefore, the use of cultivated land is more scientific and rationalized, thus enhancing the ECLU.
4.2 Analysis of temporal evolutionary features
The kernel density estimation method was used to analyze the temporal evolution of the ECLU in the region around Beijing and Tianjin from 2005 to 2020, and the outcomes are shown in Figure 8.
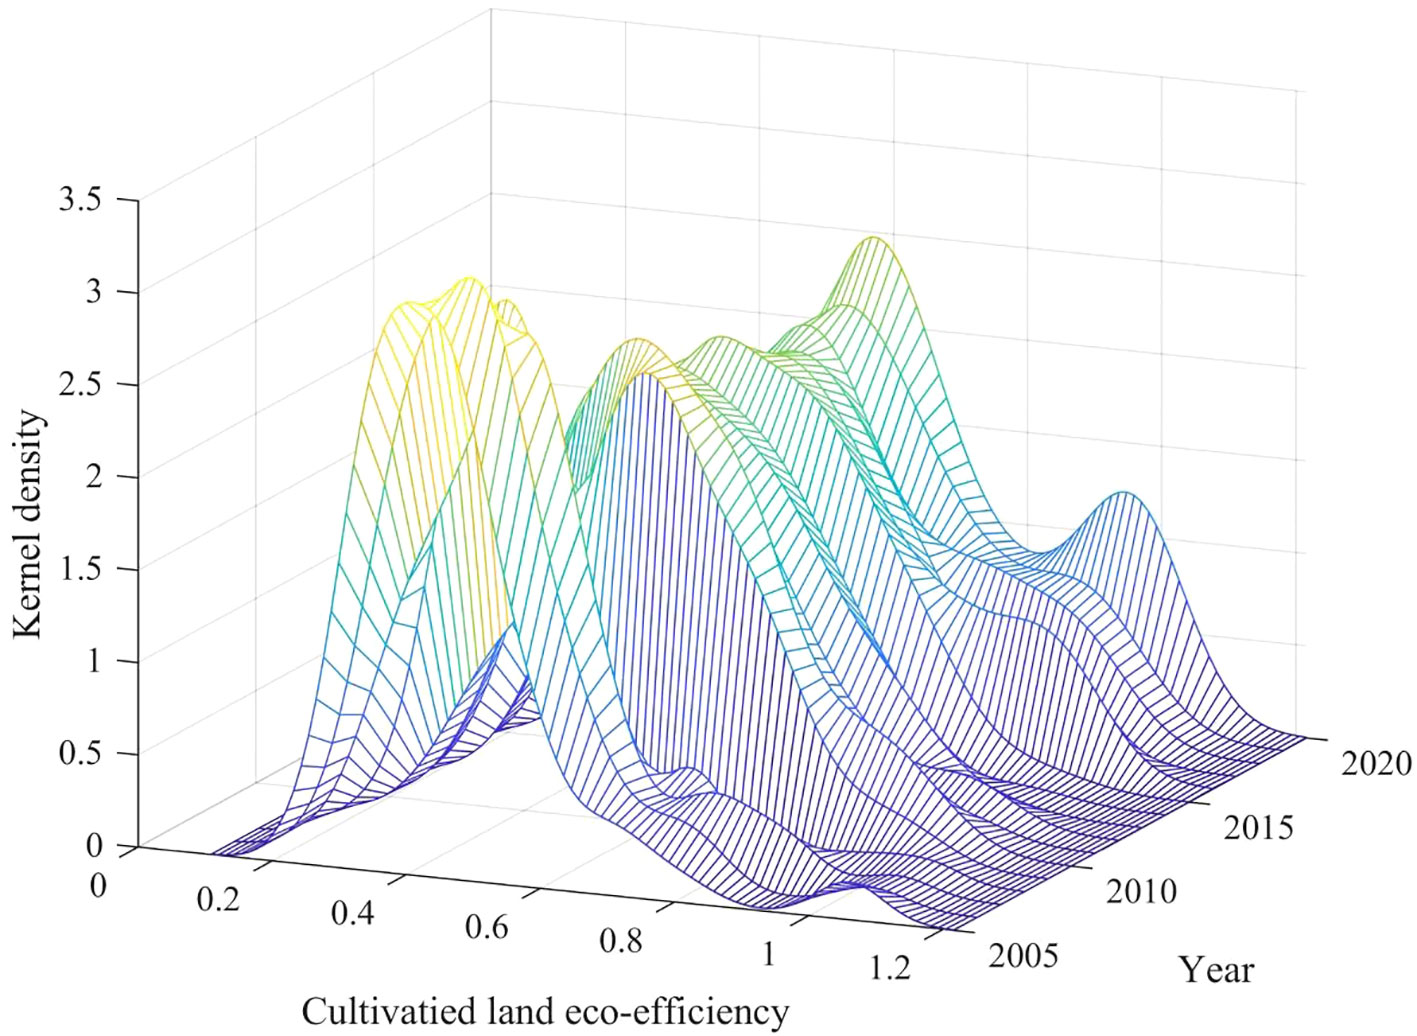
Figure 8 Estimation of kernel density of the ECLU. ECLU, eco-efficiency of cultivated land use.
From the overall state of the curve, the curve keeps moving right, indicating that the ECLU in the region around Beijing and Tianjin continuously increased during the study period. The distance between the curves shows that efficiency increases at different rates, with the ECLU interval increasing from [0.3, 0.4] in 2005 to [0.4, 0.5] in 2010, the ECLU value increasing but remaining at [0.4, 0.5] from 2010 to 2015, the ECLU interval increasing from [0.4, 0.5] to [0.6, 0.7] and approaching 0.7, and the overall efficiency showing a “fast–slow–fast” growth trend.
In terms of shape, the years 2005–2020 all show a “bimodal” pattern, but the “bimodal” pattern is not obvious in the 2005–2015 period, and the pattern is significant in 2020. These results indicate that there was polarization from 2005 to 2020 but significant polarization in 2020. The peak in the 2005–2015 period has a more obvious downward trend, and the peak in the 2015–2020 period is of the same height, which implies that the internal gap of the ECLU is expanding but gradually converging to a stable situation. The reason is the different resource endowments and levels of socioeconomic development, which cause different ways of utilizing arable land and different production management modes, leading to the differentiation of efficiency among counties in the process of cultivated land use.
From the interval of the kernel density curve, the left tail continues to shorten, indicating that there is a catching-up effect, with counties with lower eco-efficiency catching up with counties with higher eco-efficiency. Additionally, the right tail value initially decreases, but later continues to increase, implying that high-efficiency counties increase and the overall ECLU development momentum is better. Although the gap between counties in terms of the ECLU gradually expands, most counties show an increasing trend in efficiency values. The reason is that with the development of science, technology, and education, the level of agricultural science is constantly improving, and the management mode of cultivated land use is more scientific, which decreases the low-value area of the ECLU. However, to narrow the gap, it is necessary to invest a large amount of relevant talent, technologies, and policies so that the ECLU of the region around Beijing and Tianjin is synchronized with the increase in high quality.
4.3 Spatial evolutionary characteristics
4.3.1 Traditional Markov chain analysis
A Markov chain model will be used for analysis in this paper to reveal the spatial pattern of the ECLU in the region around Beijing and Tianjin. Based on the quantile division method, the ECLU values are divided into four states, i.e., low efficiency, medium-low efficiency, and medium-high efficiency, and are denoted high efficiency and expressed as I, II, III, and IV, respectively.
As shown in Table 2, the diagonal and non-diagonal values indicate that the ECLU has not shifted and has shifted, respectively. In this regard, the characteristics reflected are as follows: 1) On the diagonal line, the maximum and minimum values are 0.795 and 0.610, respectively, which means that there is at least a 61% probability that the ECLU in each county does not shift. However, on the non-diagonal line, the maximum value is much less, and the maximum value is 0.254; thus, the probability of shifting between different types is smaller. 2) The probability of the ECLU along the diagonal remaining unchanged is PIV–IV (0.795) > PI–I (0.715) > PIII–III (0.635) > PII–II (0.610), and the probability of the first and last of the diagonal are obviously larger, implying that the ECLU has a “high-high concentration and low-low concentration”. The main reason for this result may be that counties with a high ECLU will invest in more advanced management levels to make the inputs more reasonable and create more wealth but not at the cost of the environment, while counties with a low ECLU are economically underdeveloped due to poorer natural endowments and backward in their awareness of eco-environmental protection, which is not conducive to the development of the ECLU. 3) The probability of an adjacent diagonal is greater than others, e.g., PI–II (0.250) > PI–III (0.025) > PI–IV (0.011), implying that the transfer of the ECLU occurs mainly between adjacent types. As a result, it is difficult to realize a leapfrog shift. This result shows that improving the ECLU is a gradual process, and therefore, it is important to follow the law of development in the protection of arable land and not to achieve it overnight. 4) Among the probabilities on the adjacent sides of the diagonal, the probability on the right is higher than that on the left, e.g., PI–III (0.238) > PI–I (0.094), indicating that when a transfer occurs, it is easier to transfer in the direction of high efficiency. The reason is that in the context of ecological civilization construction, the idea of ecological environmental protection is deeply rooted in people’s hearts, and farmers’ behaviors will subconsciously change toward benign development, which will promote an improvement in the ECLU.
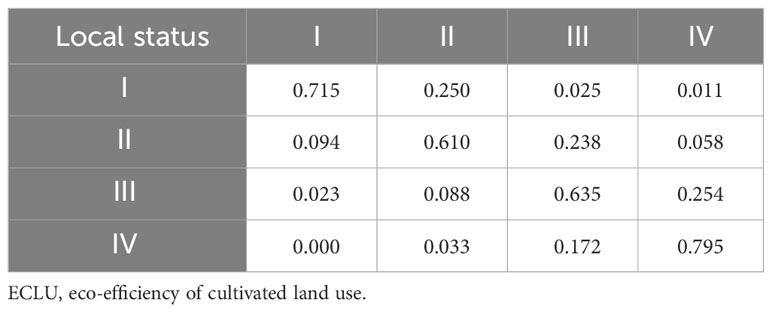
Table 2 Traditional Markov chain probability transfer matrix of the ECLU in the region around Beijing and Tianjin from 2005 to 2020.
4.3.2 Spatial Markov chain analysis
The spatial distribution of interrelated geographical objects or attributes is determined on the basis of the first law of geography. Therefore, in this paper, to explore the changes in the ECLU under diverse environments, the spatial lag is introduced, and a spatial Markov transfer matrix is constructed to further reflect the influence of neighboring environments on the high or low eco-efficiency of their own arable land use. Based on the quantile division method, the spatial lag types of the study area were divided into four types, i.e., low, medium low, medium high, and high, and are denoted as I, II, III, and IV, respectively.
According to Tables 2, 3, the characteristics reflected are as follows: 1) The geospatial pattern influences the shift probability of the ECLU. For example, without considering the geospatial pattern, the probability of switching from III to II is PIII–II = 0.088, while when a county borders a county of type I, PIII–II(I) = 0.259. The reason is that the behavior of farmers in counties is not closed, and the behavior of farmers in surrounding counties will have an impact on the county. 2) In general, the transfer of the same type of efficiency occurs, and if a county borders a county with lower eco-efficiency, the probability that it will shift in the direction of lower efficiency increases; for example, PII–I(I) = 0.200 > PII–I = 0.094. Conversely, if it borders a county with higher eco-efficiency, the probability that it will shift in the direction of high-efficiency increases, for example, PII–III(IV) = 0.294 > PII–III = 0.238. Taking the Caofeidian District of Tangshan City and Gu’an County of Langfang City as an example, the mean efficiency in the counties around the Caofeidian District from 2005 to 2020 is 0.54, which to some extent influenced the ECLU in Caofeidian District dropping from 1.04 to 0.77. The mean value in counties around Gu’an was 0.55, while the value of the ECLU in Gu’an County increased from 0.35 to 0.44.
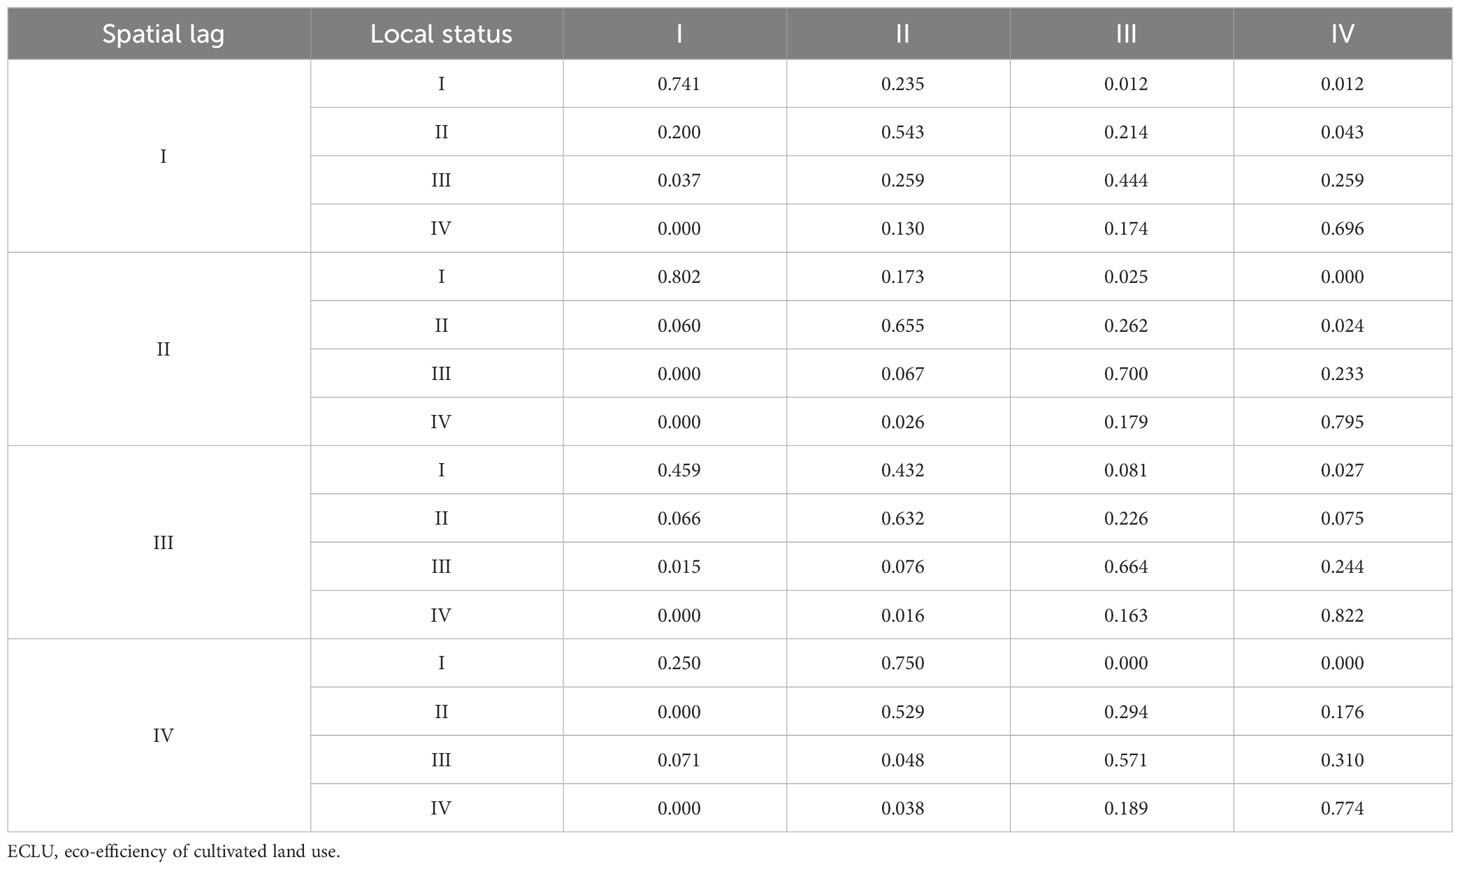
Table 3 Spatial Markov chain probability transfer matrix of the ECLU in the region around Beijing and Tianjin, 2005–2020.
The characteristics above show that the geospatial pattern greatly impacts the ECLU in the region around Beijing and Tianjin. Counties with higher eco-efficiency can promote the upward transfer probability of the ECLU in surrounding counties, having a positive spillover effect, while counties with lower eco-efficiency promote the downward transfer of the ECLU in surrounding counties, having a passive spillover effect. In the context of the geospatial pattern, the ECLU gradually forms a “club convergence” phenomenon of “high clustering and low clustering”.
5 Discussion
5.1 Understanding the results of the ECLU
In this paper, the ECLU in 71 counties in the region around Beijing and Tianjin is measured by using the Super-EBM model. In terms of research methodology, the radial BCC model, non-radial SBM model, and EBM model are compared and analyzed, and the results show that the radial BCC model > EBM model > SBM model > SBM-Undesirable model. The reason is that the radial model does not take into account the effect of slack variables, resulting in high results; the non-radial SBM model of the target value of inputs and outputs and the real value of the proportion of the problem of distortion result in low results; and the EBM model circumvents the defects of the two, with the value being in the middle of the two and being more suitable for the real situation. The results are in line with the research of Yu et al. (Yu et al., 2019).
During the study period, the ECLU presented a rising trend, which was consistent with the findings of Zhou et al. (Zhou et al., 2022). With the growth of urbanization in China, the proportion of GDP in the primary industry has gradually decreased, which implies that China’s agricultural society has gradually modernized. During this process, there were significant changes in input factors and agricultural production in the region around Beijing and Tianjin, and coupled with the effect of agricultural policies, the ECLU improved by 87.37% during the study period. However, the ECLU was 0.55, while the result of the ECLU of Hebei Province measured by Liao was 0.9 (Liao et al., 2021), with a difference of 0.45, which is in addition to the fact that the other municipalities in Hebei Province drove the whole ECLU. Liao used the equivalent factor method to calculate the value of ecosystem services and included this indicator in the desirable output, which is a positive indicator. However, the results obtained from this method were ecosystem service values much higher than others, which finally led to a large difference in the results (Turner et al., 2016).
Regarding the spatial variability, due to differences in resource endowments, spatial variability is characterized by the low productivity of arable land, poor arable land in the Taihang Mountains at high altitudes, and poor agricultural supporting equipment in Zhangjiakou and the western mountainous areas of Baoding. Thus, differences in their innate factors constrain the productivity of arable land. However, with the plains areas immediately adjacent to Tianjin, the ECLU in the Xiong’an New Area and coastal cities is higher because the city has a significant radiation effect on surrounding counties and therefore will lead to the rapid development of the transportation industry and the introduction of advanced production concepts and planting technology, which will greatly improve the efficiency of crops from production to sale. Yang took the Yangtze River Basin as the study area and divided it into upstream, midstream, and downstream areas, with the upstream area consisting of the Yunnan, Guizhou, Sichuan, and Chongqing regions, which have high altitude and poor farming conditions; thus, their ECLU is lower. The downstream includes five cities, such as Jiangsu, Zhejiang, and Shanghai, which have flat terrain, a developed economy, and convenient transportation, which is more conducive to the ECLU (Yang et al., 2021). The results of both studies agree that there is spatial variability in the ECLU and that terrain influences the development of the ECLU.
5.2 Implications of the characteristics of the temporal evolution of the ECLU
Analysis of the temporal evolution using kernel density estimation indicates that the ECLU shows a “fast–slow–fast” growth trend. The main reason is that the reduction and exemption of agricultural taxes in 2004 further mobilized farmers’ enthusiasm, which led to rapid growth in the ECLU. From 2010 to 2015, the problem of environmental pollution in agriculture was severe, and the awareness of environmental protection was weak, which led to slow growth in the ECLU. From 2015 to 2020, China paid more attention to sustainable agricultural development and promoted a virtuous cycle of ecosystems around key construction tasks, thus stimulating the rapid development of the ECLU.
From 2005 to 2020, there was a “double-peak” phenomenon, indicating that the ECLU has been polarized and has become more pronounced over time and that differences in the agricultural resource endowment, technological level, and management level between regions have increased the gap between regions. Moreover, to meet the growing demand for food in these less-endowed regions, the intensity of cropland use has been increasing, and agricultural chemicals have been overused, leading to a further widening of the gap in the ECLU. However, due to the “butterfly effect”, the technological level and management awareness of the better-endowed counties are more advanced, leading to an increase in the ECLU through the adoption of advanced cropland use patterns and moderately controlled intensity of agricultural inputs, which inevitably leads to the polarization of the ECLU over time.
5.3 Insights into the characteristics of the spatial evolution of the ECLU
This paper conducts analysis using the spatial Markov chain model and finds that the ECLU in the region around Beijing and Tianjin has the phenomenon of “high and high aggregation, low and low aggregation” in space. This result indicates that this polarization phenomenon is also affected by the geospatial pattern and that the ECLU in the region around Beijing and Tianjin has a significant spatial spillover effect. For example, a higher ECLU in neighboring areas will increase the probability of local ECLU growth, and vice versa. This result demonstrates the spatial correlation and spatial interaction pattern of the ECLU. The results are consistent with those of Chi M and Liu Y (Liu et al., 2020; Chi et al., 2022). Regional development patterns tend to influence land use patterns. Neighboring regions will have similar development patterns, and similar development patterns between regions show similar land resource demand and use patterns (Kresse and Krabben, 2022). The ECLU in one county and the ECLU in another county are not spatially independent of each other and are often influenced by the region in which they are located, indicating strong spatial aggregation and spatial interaction effects. In addition, on the basis of the theory of planned behavior, with the rapid growth of the information age, farmers’ cultivated land use depends not only on the farmers themselves (Ajzen, 1991) but also on the consistency of behavior due to geographical similarity. Thus, farmers’ subjects are also influenced by the behavior of neighboring farmers, and they learn and imitate the planting experience of neighboring farmers to adjust their own planting methods and maximize their benefits. At the same time, environmental protection strategies and intraregional economic development patterns are gradually converging, as factor flows and interconnecting infrastructure construction within a region tend to improve (Mao et al., 2020). The ECLU is affected by the geospatial pattern, and the spatial spillover effect is significant. In this context, the region around Beijing and Tianjin is facing the arduous task of avoiding low and low agglomeration, and the overall agricultural development is led by the high-ECLU region.
5.4 Suggestions
In response to the unbalanced development of the ECLU in the region around Beijing and Tianjin, local governments should develop differentiated paths to increase eco-efficiency based on the resource endowments of different regions.
Areas with high eco-efficiency, such as Cangzhou City, Tangshan City, and Chengde City, should make the best of their location and transportation superiority to further introduce advanced production technologies to enhance the local ECLU while driving the transition of agricultural production methods in the region around Beijing and Tianjin to realize an increase in the overall ECLU. It is important to actively cultivate new agricultural business entities while vigorously developing the rural secondary and tertiary industries to absorb the remaining agricultural workers.
Areas with medium eco-efficiency, such as Langfang, should fully take advantage of their location and topographic advantages in being close to Beijing and Tianjin, make full use of the linkage mechanism of Beijing and Tianjin, further improve the level of local agricultural scale and mechanization, form an agricultural radiation model with Langfang as the core, achieve the integration of agricultural production and marketing, and finally realize the maximum benefits.
For areas with lower eco-efficiency, mainly the mountainous areas in Zhangjiakou and the western part of Baoding, agricultural development plans should be formulated based on their own situation. Specifically, first, the government should meet the needs of local agricultural infrastructure. Second, local governments should enhance the quality of farmers, encourage them to use arable land efficiently with material rewards, and recommend the use of advanced agricultural production technologies. Third, local governments should stimulate the dynamism of agricultural development, relying on targeted poverty alleviation and rural revitalization strategies, to compensate for the regional disadvantages of agricultural development and to give full play to the advantages of lagging behind in agriculturally underdeveloped areas. For example, it is important to actively develop three-dimensional mountainous agriculture, develop the local economy in multiple ways, optimize the rural industrial structure, and achieve high-quality agricultural development.
In light of the fact that the ECLU is caused by the geospatial pattern, it is suggested that the transfer risk of regional eco-efficiency should be comprehensively evaluated, and for high-high agglomeration areas of the ECLU, local governments should strengthen the relationship between the regional ECLU and create more spatial spillovers through political and economic instruments. They should make use of their agglomeration and should further play a role in demonstration and leadership to move toward higher goals of green cultivated land use. For low-level agglomeration areas, the government should break the “vicious circle” through policy to eliminate the traditional concept of farming, actively adjust the use of arable land, and improve the ECLU level as the first task. The government should establish an early warning mechanism to prevent the transfer to low-level efficiency regions. In addition, it is essential to find a cultivated land use evaluation institution to provide guidance on resource investment in the process of cultivated land use to optimize resource allocation and ensure the harmonious development of cultivated land economy and ecology.
In addition, this paper has the following two limitations:
1) When constructing the index system in this paper, there is no absolute standard or unified measurement framework in existing research due to the complexity of arable land use and the limited availability of data. For example, the unreasonable use of chemical fertilizers, pesticides, and films, in addition to causing carbon emissions, will produce surface source pollution, while the distribution of surface source pollution is somewhat random, and the current correlation coefficients are difficult to accurately quantify. At this stage, most of the desirable outputs quantify the only socioeconomic outputs, while the process of cultivated land use, apart from the negative impact on the environment, will also produce ecological benefits that are beneficial for human beings. However, the accurate quantification of ecological benefits could be improved. Therefore, the subsequent studies should reasonably quantify source pollution and ecological benefits and include them in the index system.
2) This paper takes counties (cities and districts) as the research scale to research the ECLU in 71 counties in the region around Beijing and Tianjin. In the future, explorations can be carried out at the microscopic scale. In fact, based on the scale of the plot, it is possible to accurately understand the resource allocation of farmers in the process of cultivated land use, determine efficiency values more accurately, and provide more targeted recommendations. Doing so will provide a significant reference for sustainable development as well as ecological civilization construction in the future.
6 Conclusions
In this paper, on the basis of the relevant data from 2005 to 2020 in the counties in the region around Beijing and Tianjin, we measured the ECLU using the Super-EBM model, presented its temporal evolutionary characteristics using the kernel density estimation method, and studied its spatial evolution characteristics using the spatial Markov chain model. The core conclusions are as follows.
1) By comparing the four models, namely, the radial BCC model, SBM model, SBM-Undesirable model, and EBM model, the results show that the EBM model was more suitable for the actual situation; thus, this model was chosen to measure the ECLU. The results show that in the study period, the ECLU appeared to increase from 0.388 to 0.727, but the average value was only 0.55. The spatiotemporal pattern of the ECLU shows that the number of inefficient zones is gradually decreasing, and the number of medium-efficiency zones, higher-efficiency zones, and high-efficiency zones is increasing. Spatially, there are significant differences between regions, with the counties around Tianjin having higher eco-efficiency and the counties in the Taihang Mountains, mainly in Zhangjiakou City, and the western part of Baoding City having lower eco-efficiency.
2) Based on the temporal evolutionary characteristics, the ECLU in the region around Beijing and Tianjin shows an overall “fast–slow–fast” growth trend, as illustrated in the kernel density estimation graph. The internal gap in the ECLU widened but stabilized in the study period. The left tail end of the curve continues to shorten, while the right tail end first shortens and then grows, and the number of counties with high eco-efficiency increases.
3) Based on the spatial evolutionary characteristics, the geospatial pattern has an essential effect on the efficiency of a county, and it gradually forms a “club convergence” phenomenon of “high-high concentration and low-low concentration”. The probability of the ECLU in each county not shifting is much greater than the probability of shifting, and if shifting occurs mainly between adjacent types, it is difficult to realize a leapfrog shift. Additionally, the probability of shifting to high-value areas is greater, but the risk of shifting to low-value areas should be avoided.
Data availability statement
The original contributions presented in the study are included in the article/supplementary material, further inquiries can be directed to the corresponding author.
Author contributions
XL: Conceptualization, Data curation, Methodology, Visualization, Writing – original draft. LZ: Supervision, Writing – review & editing. XC: Writing – original draft. JY: Writing – original draft. XS: Writing – original draft. LZZ: Writing – original draft.
Funding
The author(s) declare financial support was received for the research, authorship, and/or publication of this article. The paper is funded by Hebei Social Science Foundation Project. (HB23GL014).
Acknowledgments
The authors would like to thank the reviewers for their constructive comments that improved this research.
Conflict of interest
The authors declare that the research was conducted in the absence of any commercial or financial relationships that could be construed as a potential conflict of interest.
Publisher’s note
All claims expressed in this article are solely those of the authors and do not necessarily represent those of their affiliated organizations, or those of the publisher, the editors and the reviewers. Any product that may be evaluated in this article, or claim that may be made by its manufacturer, is not guaranteed or endorsed by the publisher.
References
Ajzen I. (1991). The theory of planned behavior. Organ. Behav. Hum. Dec. 50 (2), 179–211. doi: 10.1016/0749-5978(91)90020-T
Akbar U., Li Q. L., Akmal M. A., Mohammed S., Wasim I. (2021). Nexus between agro-eco-efficiency and carbon emission transfer: evidence from China. Environ. Sci. pollut. Res. 28, 18995–19007. doi: 10.1007/s11356-020-09614-2
Cao W., Zhou W., Wu T., Wang X., Xu J. (2022). Spatial-temporal characteristics of cultivated land utilization eco-efficiency under carbon constraints and its relationship with landscape pattern dynamics. Ecol. Indic. 141, 109140. doi: 10.1016/j.ecolind.2022.109140
Carter C. A., Zhong F., Zhu J. (2012). Advances in Chinese agriculture and its global implications. Appl. Econ. Perspect. Policy 34 (1), 1–36. doi: 10.1093/aepp/ppr047
Chi M., Guo Q., Mi L., Wang G., Song W. (2022). Spatial distribution of agricultural eco-efficiency and agriculture high-quality development in China. Land 11 (5), 722. doi: 10.3390/land11050722
Coluccia B., Valente D., Fusco G., De Leo F., Porrini D. (2020). Assessing agricultural eco-efficiency in Italian Regions. Ecol. Indic. 116, 106483. doi: 10.1016/j.ecolind.2020.106483
Côté R., Booth A. (2006). Eco-efficiency and SMEs in nova scotia, Canada. J. Clean. Prod. 14 (6-7), 542–550. doi: 10.1016/j.jclepro.2005.07.004
Dahlström K., Ekins P. (2005). Eco-efficiency trends in the UK steel and aluminum industries. J. Ind. Ecol. 9 (4), 171–188. doi: 10.1162/108819805775247954
Deng X., Jiang Q. O., Su H., Wu F. (2010). Trace forest conversions in Northeast China with a 1-km area percentage data model. J. Appl. Remote Sens. 4 (1), 041893. doi: 10.1117/1.3491193
Fan Z., Deng C., Fan Y., Zhang P., Lu H. (2021). Spatial-temporal pattern and evolution trend of the cultivated land use eco-efficiency in the National Pilot Zone for ecological conservation in China. Int. J. Environ. Res. Public Health 19 (1), 111. doi: 10.3390/ijerph19010111
Gong Y., Li J., Li Y. (2020). Spatiotemporal characteristics and driving mechanisms of arable land in the Beijing-Tianjin-Hebei re-gion during 1990-2015. Socio-Economic Plan. Sci. 70, 100720. doi: 10.1016/j.seps.2019.06.005
Gössling S., Peeters P., Ceron J. P., Dubois G., Patterson T. (2005). The eco-efficiency of tourism. Ecol. Econ. 54 (4), 417–434. doi: 10.1016/j.ecolecon.2004.10.006
Guo Y., Tong L., Mei L. (2022). Spatiotemporal characteristics and influencing factors of agricultural eco-efficiency in Jilin agricultural production zone from a low carbon perspective. Environ. Sci. pollut. Res. 29 (20), 29854–29869. doi: 10.1007/s11356-021-16463-0
Hawkesford M. J. (2014). Reducing the reliance on nitrogen fertilizer for wheat production. J. Cereal Sci. 59 (3), 276–283. doi: 10.1016/j.jcs.2013.12.001
Hou X., Liu J., Zhang D., Zhao M. (2019). Impact of urbanization on the eco-efficiency of cultivated land utilization: A case study on the Yangtze River Economic Belt, China. J. Clean. Prod. 238, 117916. doi: 10.1016/j.jclepro.2019.117916
Hu Y., Liu X., Zhang Z., Wang S., Zhou H. (2022). Spatiotemporal heterogeneity of agricultural land eco-efficiency: a case study of 128 cities in the Yangtze River Basin. Water 14 (3), 422. doi: 10.3390/w14030422
Ke N., Zhang X., Lu X., Kuang B., Jiang B. (2022). Regional disparities and influencing factors of eco-efficiency of arable land utilization in China. Land 11 (2), 257. doi: 10.3390/land11020257
Ke X., Zhang Y., Zhou T. (2023). Spatio-temporal characteristics and typical patterns of eco-efficiency of cultivated land use in the Yangtze River Economic Belt, China. J. Geogr. Sci. 33, 357–372. doi: 10.1007/s11442-023-2086-x
Kresse K., Krabben E. (2022). Rapid urbanization, land pooling policies & the concentration of wealth. Land Use Policy 116, 106050. doi: 10.1016/j.landusepol.2022.106050
Li Z., Sarwar S., Jin T. (2021). Spatiotemporal evolution and improvement potential of agricultural eco-efficiency in Jiangsu province. Front. Energy Res. 9. doi: 10.3389/fenrg.2021.746405
Liao J., Yu C., Feng Z., Zhao H., Wu K., Ma X. (2021). Spatial differentiation characteristics and driving factors of agricultural eco-efficiency in Chinese provinces from the perspective of ecosystem services. J. Clean. Prod. 288, 125466. doi: 10.1016/j.jclepro.2020.125466
Liu Y., Li J., Yang Y. (2018). Strategic adjustment of land use policy under the economic transformation. Land Use Policy 74, 5–14. doi: 10.1016/j.landusepol.2017.07.005
Liu Y., Zou L., Wang Y. (2020). Spatial-temporal characteristics and influencing factors of agricultural eco-efficiency in China in recent 40 years. Land Use Policy 97, 104794. doi: 10.1016/j.landusepol.2020.104794
Mao X., Huang X., Song Y., Zhu Y., Tan Q. (2020). Response to urban land scarcity in growing megacities: Urban containment or inter-city connection? Cities 96, 102399. doi: 10.1016/j.cities.2019.102399
Moutinho V., Robaina M., Macedo P. (2018). Economic-environmental efficiency of European agriculture–a generalized maximum entropy approach. Agric. Econ. 64 (10), 423–435. doi: 10.17221/45/2017-agricecon
Pishgar-Komleh S. H., Čechura L., Kuzmenko E. (2021). Investigating the dynamic eco-efficiency in agriculture sector of the European Union countries. Environ. Sci. pollut. Res. 28 (35), 48942–48954. doi: 10.1007/s11356-021-13948-w
Schaltegger S., Sturm A. (1990). Ökologische rationalität: ansatzpunkte zur ausgestaltung von ökologieorientierten managemen-tinstrumenten. Die Unternehm. 44 (3), 273–290. doi: 10.2307/24180467
Stępień S., Czyżewski B., Sapa A., Borychowski M., Poczta W., Poczta-Wajda A. (2021). Eco-efficiency of small-scale farming in Poland and its institutional drivers. J. Clean. Prod. 279, 123721. doi: 10.1016/j.jclepro.2020.123721
Tan J., Duan Q., Xiao C., He C., Yan X. (2023). A brief review of the coupled human-Earth system modeling: Current state and challenges. Anthropocene Rev., 20530196221149121. doi: 10.1177/20530196221149121
Tone K. (2001). A slacks-based measure of efficiency in data envelopment analysis. Eur. J. Oper. Res. 130 (3), 498–509. doi: 10.1016/s0377-2217(99)00407-5
Tone K. (2016). Data envelopment analysis as a Kaizen tool: SBM variations revisited. Bul. Math. Sci. Appl. 16 (3), 49. doi: 10.18052/www.scipress.com/BMSA.16.49
Tone K., Tsutsui M. (2010). An epsilon-based measure of efficiency in DEA–a third pole of technical efficiency. Eur. J. Oper. Res. 207 (3), 1554–1563. doi: 10.1016/j.ejor.2010.07.014
Turner K. G., Anderson S., Gonzales-Chang M., Costanza R., Courville S., Dalgaard T., et al. (2016). A review of methods, data, and models to assess changes in the value of ecosystem services from land degradation and restoration. Ecol. Model. 319, 190–207. doi: 10.1016/j.ecolmodel.2015.07.017
Wu Y., Shan L., Guo Z., Peng Y. (2017). Cultivated land protection policies in China facing 2030: Dynamic balance system versus basic farmland zoning. Habitat Int. 69, 126–138. doi: 10.1016/j.habitatint.2017.09.002
Wu Y., Zhang P., Li J., Hou J. (2022). Spatial distribution evolution and optimization path of eco-efficiency of cultivated land use: a case study of hubei province, China. Sustainability 14 (18), 11417. doi: 10.3390/su141811417
Xiang H., Wang Y. H., Huang Q. Q., Yang Q. Y. (2020). How much is the eco-efficiency of agricultural production in west China? Evidence from the village level data. Int. J. Environ. Res. Public Health 17, 4049. doi: 10.3390/ijerph17114049
Yang B., Wang Z., Zou L., Zou L., Zhang H. (2021). Exploring the eco-efficiency of cultivated land utilization and its influencing factors in China's Yangtze River Economic Belt 2001-2018. J. Environ. Manage. 294, 112939. doi: 10.1016/j.jenvman.2021.112939
Yang B., Zhang Z., Wu H. (2022). Detection and attribution of changes in agricultural eco-efficiency within rapid urbanized areas: A case study in the Urban agglomeration in the middle Reaches of Yangtze River, China. Ecol. Indic. 144, 109533. doi: 10.1016/j.ecolind.2022.109533
Yin Y., Hou X., Liu J., Zhou X., Zhang D. (2022). Detection and attribution of changes in cultivated land use ecological efficiency: A case study on Yangtze River Economic Belt, China. Ecol. Indic. 137, 108753. doi: 10.1016/j.ecolind.2022.108753
Yu Y., Huang J., Zhang N. (2019). Modeling the eco-efficiency of Chinese prefecture-level cities with regional heterogeneities: A comparative perspective. Ecol. Model. 402, 1–17. doi: 10.1016/j.ecolmodel.2019.03.012
Yu Y., Zhang Y., Miao P. (2018). Impacts of dynamic agglomeration externalities on eco-efficiency: empirical evidence from China. Int. J. Environ. Res. Public Health 15 (10), 2304. doi: 10.3390/ijerph15102304
Zhou M., Zhang H., Ke N. (2022). Cultivated land transfer, management scale, and cultivated land green utilization efficiency in China: based on intermediary and threshold models. Int. J. Environ. Res. Public Health 19, 12786. doi: 10.3390/ijerph191912786
Zhou Y., Li X., Liu Y. (2020). Rural land system reforms in China: History, issues, measures and prospects. Land Use Policy 91, 104330. doi: 10.1016/j.landusepol.2019.104330
Zong Y., Ma L., Shi Z., Gong M. (2023). Agricultural eco-efficiency response and its influencing factors from the perspective of rural population outflowing: a case study in qinan county, China. Int. J. Environ. Res. Public Health 20 (2), 1016. doi: 10.3390/ijerph20021016
Keywords: eco-efficiency of cultivated land use, Super-EBM model, spatial-temporal evolution, Markov chain model, the region around Beijing-Tianjin
Citation: Li X, Zhao L, Chang X, Yu J, Song X and Zhang L (2023) Spatial and temporal evolution of the eco-efficiency of cultivated land use in the region around Beijing–Tianjin based on the Super-EBM model. Front. Ecol. Evol. 11:1297570. doi: 10.3389/fevo.2023.1297570
Received: 20 September 2023; Accepted: 14 November 2023;
Published: 29 November 2023.
Edited by:
Pan Yang, Guangdong University of Technology, ChinaReviewed by:
Yu Lu, Zhejiang Agriculture and Forestry University, ChinaAnlu Zhang, Huazhong Agricultural University, China
Copyright © 2023 Li, Zhao, Chang, Yu, Song and Zhang. This is an open-access article distributed under the terms of the Creative Commons Attribution License (CC BY). The use, distribution or reproduction in other forums is permitted, provided the original author(s) and the copyright owner(s) are credited and that the original publication in this journal is cited, in accordance with accepted academic practice. No use, distribution or reproduction is permitted which does not comply with these terms.
*Correspondence: Li Zhao, emhhb2xpQGhlYmF1LmVkdS5jbg==