- 1School of Earth, Environment and Society, McMaster University, Hamilton, ON, Canada
- 2Finite Carbon Canada, Calgary, AB, Canada
- 3Department of Geography & Environmental Studies, Toronto Metropolitan University, Toronto, ON, Canada
- 4World Wildlife Fund Canada, Toronto, ON, Canada
Anthropogenic climate change is contributing to increased insect infestation globally, leading to pest population growth, expansion of niche and geographic ranges as well as increased outbreak frequencies, resulting in economic losses and reduction in food security. In recent years, spongy moth (Lymantria dispar dispar), jack pine budworm (Choristoneura pinus pinus), large aspen tortrix (Choristoneura conflictana) and spruce budworm (Choristoneura fumiferana) caused widespread defoliation across one of Canada’s most forested provinces, Ontario. Observations of such outbreaks have been limited to field sightings around Ontario, with few studies focused on mapping of outbreak occurrence across the province or exploring potential anthropogenic and climatic drivers of infestation. Using random forest probability estimates and satellite data resampled to 1 km spatial resolution from the Moderate Resolution Imaging Spectroradiometer (MODIS), we reveal greater expansion of insect defoliation across Ontario between 2018 and 2020 than previously recorded. Much of the geographic expansion of outbreaks was driven by increasing temperature, and the proximity of roads. With ongoing global warming and growing economic development, infestations will not only continue to increase across Ontario but also expand northward due to their responses to accelerated warming at higher latitudes. This expansion presents an important and alarming new challenge for forest conservation and management in Ontario, in particular, and Canada in general.
1 Introduction
Understanding and predicting the consequences of climatic changes in forest ecosystems is emerging as one of the major challenges for global change scientists (Boisvenue and Running, 2006; Bonan, 2008). Globally, societies heavily rely on forests for essential services such as timber, watershed protection, and recreational and aesthetic benefits (Maroschek et al., 2009; Thom and Seidl, 2016). The effects of climate change on forests include both positive (e.g., increased forest growth from CO2 fertilization, increased water use efficiency, and longer growing seasons) and negative responses (e.g., increases in stress and tree mortality, and changes in dynamics of forest insect) (Ayres and Lombardero, 2000; Bachelet et al., 2003; Lucht et al., 2006; Scholze et al., 2006; Lloyd and Bunn, 2007; Seidl et al., 2017; Gonsamo et al., 2017; 2021).
With current best estimates of changes in climate indicating an increase in global mean annual temperatures of 1.5°C by 2025 and 4°C by the end of the next century (Baker et al., 2018), considerable uncertainty remains in modeling how these processes will affect current and future tree growth and mortality events and forest carbon budgets (Hanson and Weltzin, 2000; Bugmann, 2001; Hollaus and Vreugdenhil, 2019). Outbreaks of forest insects are major agents of mortality and ecosystem change in forests worldwide, with climate being an important driver of changes to disturbance regimes mediated by forest insects (Pureswaran et al., 2018). Changes in climate may result in changing geographical distribution, increased overwintering, changes in population growth rates, increases in the number of generations, extension of the development season, changes in crop–pest synchrony, changes in interspecific interactions and increased risk of invasion by migrant pests (see Porter and Coon, 1991; Pureswaran et al., 2018; Lehmann et al., 2020). Although a range of responses can and should be expected, recent cases of increased tree mortality and die-offs triggered by insect infestation raise the possibility that amplified forest mortality may already be occurring in some locations in response to global climate change (Allen et al., 2010).
As a landscape-scale disturbance event, insect outbreaks also play an important role in the carbon flux in boreal forests (Kurz and Apps, 1999; Volney and Fleming, 2000). Defoliation during insect outbreaks reduces the rate of carbon accumulation by the host trees via reducing their growth. This often results in tree mortality, which abruptly increases the mass of dead organic matter where carbon is transferred to the atmosphere through decomposition (Gray et al., 2007). Increasing concentrations of carbon dioxide in the atmosphere are a major cause of global warming, creating a feedback loop for further proliferation of insect infestations.
Across Ontario, Canada, several defoliators have expanded their range in recent years causing widespread outbreaks (Liebhold et al., 1992; Régnière et al., 2009; Tobin et al., 2004; NDMNRF, 2020). Species which have had recent moderate to severe forest disturbances have included the spongy moth (Lymantria dispar dispar), jack pine budworm (Choristoneura pinus pinus), large aspen tortrix (Choristoneura conflictana) and spruce budworm (Choristoneura fumiferana) (NDMNRF, 2022). Most of these species are native to Canada (jack pine budworm, spruce budworm and large aspen tortrix) while the spongy moth is an example of an invasive defoliator that expanded its current range across Eastern United States and Southeastern Canada (Liebhold et al., 1992; Régnière et al., 2009; Tobin et al., 2004). L. dispar moth is native to the temperate forests of Europe and Asia (Régnière et al., 2009).
Outbreaks often follow different trajectories associated with specific ecological traits and target tree species. For instance, large aspen tortrix infestations are short-lived (2–3 years) and found earlier in the season. This species targets trembling aspen (Populus tremuloides), white birch (Betula papyrifera), willow (Salix spp.) and alder (Alnus spp.) but can also be found on balsam poplar (Populus balsamifera) and chokecherry (Prunus virginiana). Jack pine budworm periodically reaches outbreak levels every 8–10 years and prefers jack pine (Pinus banksiana) and other conifers such as eastern white pine (Pinus strobus), red pine (Pinus resinosa) and Scots pine (Pinus sylvestris). Spruce budworm is the most destructive pest of balsam fir (Abies balsamea) and white spruce (Picea glauca) forests in Canada, which is a historically important timber species. The larvae of spruce budworm are considered wasteful feeders, as they only eat partial needles and then move on to other needles. L. dispar moth infestations maintain a cyclical pattern in which exponential population growth causes major infestations for 3–4 years, with the insect then lying dormant for 7–8 years (Benoit and Lachance, 1990). The larvae of this moth are voracious folivores that can feed nearly 300 species of broadleaf and coniferous trees during their peak feeding season (Elkinton and Liebhold, 1990), significantly affecting tree growth. This combination of outbreak dynamics, broad polyphagy and long larval duration grants these species the ability to rapidly expand across forested areas such as those found in Ontario, one of Canada’s most forested provinces.
Areas at risk of infestations in Canada are expected to double or triple over the next 50 years due to increasingly warmer summers, allowing the insect to complete its life cycle consistently in geographic areas that so far have been protected due to unfavorable climate. Across Canada, certain forest types seem more susceptible to infestation, such as deciduous, closed (dense) and open (thin) mixed forests (Cihlar et al., 2002). Forests across northern and eastern Canada has so far been protected from infestation by cold temperatures (Régnière et al 2009; 2012). but with increasing temperatures, the fate of these forests are unknown. Further, increasing human traffic may lead to deposition of eggs as some host plants flourish in disturbed areas (Lyons and Liebhold, 1992), triggering different dispersion pathways. However, little formal studies exist that explore probable drivers connected with insect infestation in Canada not associated with climatic studies.
Insect infestation has also been associated with other compounding ecological damages. For instance, the frass excreted by the L. dispar caterpillars contains a high concentration of nitrogen (N) because these defoliators are ineffective at assimilating foliar N (Lovett et al., 2002). As a result, this N-rich frass leaches into catchment basins, increasing the N concentration in lakes by an average of 0.03 mg L1 (Woodman et al., 2021), which in turn stimulates conditions for increased microbial activity. Growing microbial populations discharges CO2 as an element of egestion, resulting in a recurring pattern of increasing microbial activity and CO2 accumulation near the surface of lakes (Woodman et al., 2021). The presence of CO2 in large quantities near lake surfaces suppresses the growth of CO2 assimilating algae (Raven et al., 2012), further exacerbating CO2 concentrations.
Given the magnitude of damage caused by insects and their potential to spread over the next few years, early detection and monitoring of infestations throughout Ontario is crucial. As zones immediately adjacent to infested areas become more suitable because of rising temperatures, invasion will be fast if suitable hosts are present (Régnière et al., 2009). However, detecting and monitoring infestation levels in a vast landscape as Ontario requires extensive fieldwork. Thus far, only a limited number of field observations have been conducted in the province. Such studies also miss the opportunity to assess potential drivers of infestation across the landscape. The increased frequency of infestations and their ecological and economic impacts requires the use of advanced technologies. Remote sensing is a valuable tool that provides frequent and spatially continuous data on vegetation conditions and has been previously explored for detecting forest insect infestation (Niemann and Visintini, 2005; Hollaus and Vreugdenhil, 2019; Ye et al., 2021; Romeiro et al., 2022).
Freely accessible moderate-resolution satellite datasets such as the 250 m imagery from spatial resolution Moderate Resolution Spectroradiometer (MODIS) have great potential to characterize subtle changes in forest canopies by capturing low-magnitude spectral changes in seasonal observations. Here, we make use of the MODIS satellite observations and field data to comprehensively evaluate insect infestation across Ontario, Canada, over a 3-year period (2018–2020). We specifically consider the 1) magnitude of occurrence using a random forest classification, 2) the probability or likelihood of infestation occurrence, and 3) the human and environmental drivers of infestation events. These analyses provide foundational and critical insights into shifts in potential drivers of infestation and establish a barometer for evaluating the effectiveness of government intervention and management strategies.
2 Materials and methods
Our approach involved three steps: (i) identifying infestation occurrence using ground truth data and MODIS satellite observations; (ii) estimating likelihood of infestation using random forest probability; and (iii) determining probable drivers of infestation. Figure 1 provides an overview of methods used to process and analyze satellite observations and ground data.
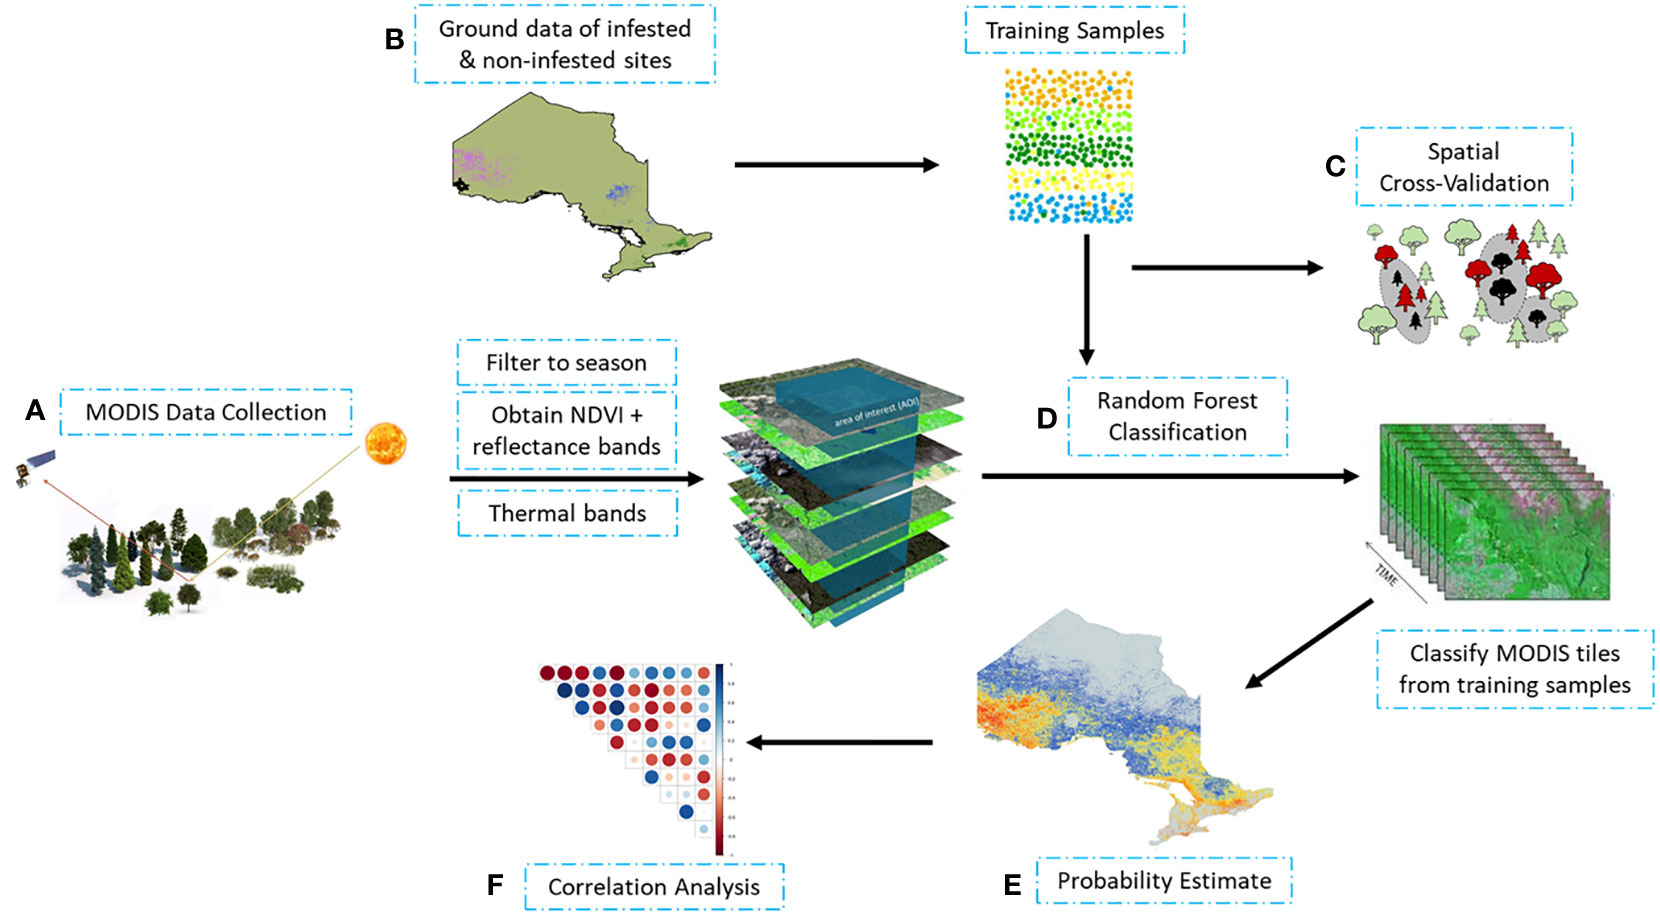
Figure 1 Schematic workflow of MODIS observation processing and data analysis: (A) processing of MODIS satellite observations; (B) obtaining of infested and non-infested training samples from ground measurements; (C) training random forest using spatial cross validation; (D) random forest classification using training sample to (E) estimate likelihood of occurrence (probability estimate); and (F) correlation analysis of the data.
2.1 Study region
The study area is the province of Ontario, Canada’s second-largest province, covering nearly 1 million km2 (Figure 2) with forest ecosystems ranging from temperate to subarctic forests. In summer, temperature ranges between 30−35°C, while winter can go below −40°C. Approximately 66% of Ontario is classified as forest lands (70 million ha), including the deciduous forest of southern Ontario, the Great Lakes – St. Lawrence Forest of central Ontario, the Boreal Forest and the Hudson Bay Lowlands Forest in the north. A very small region of southern Ontario also includes Carolinian forest.
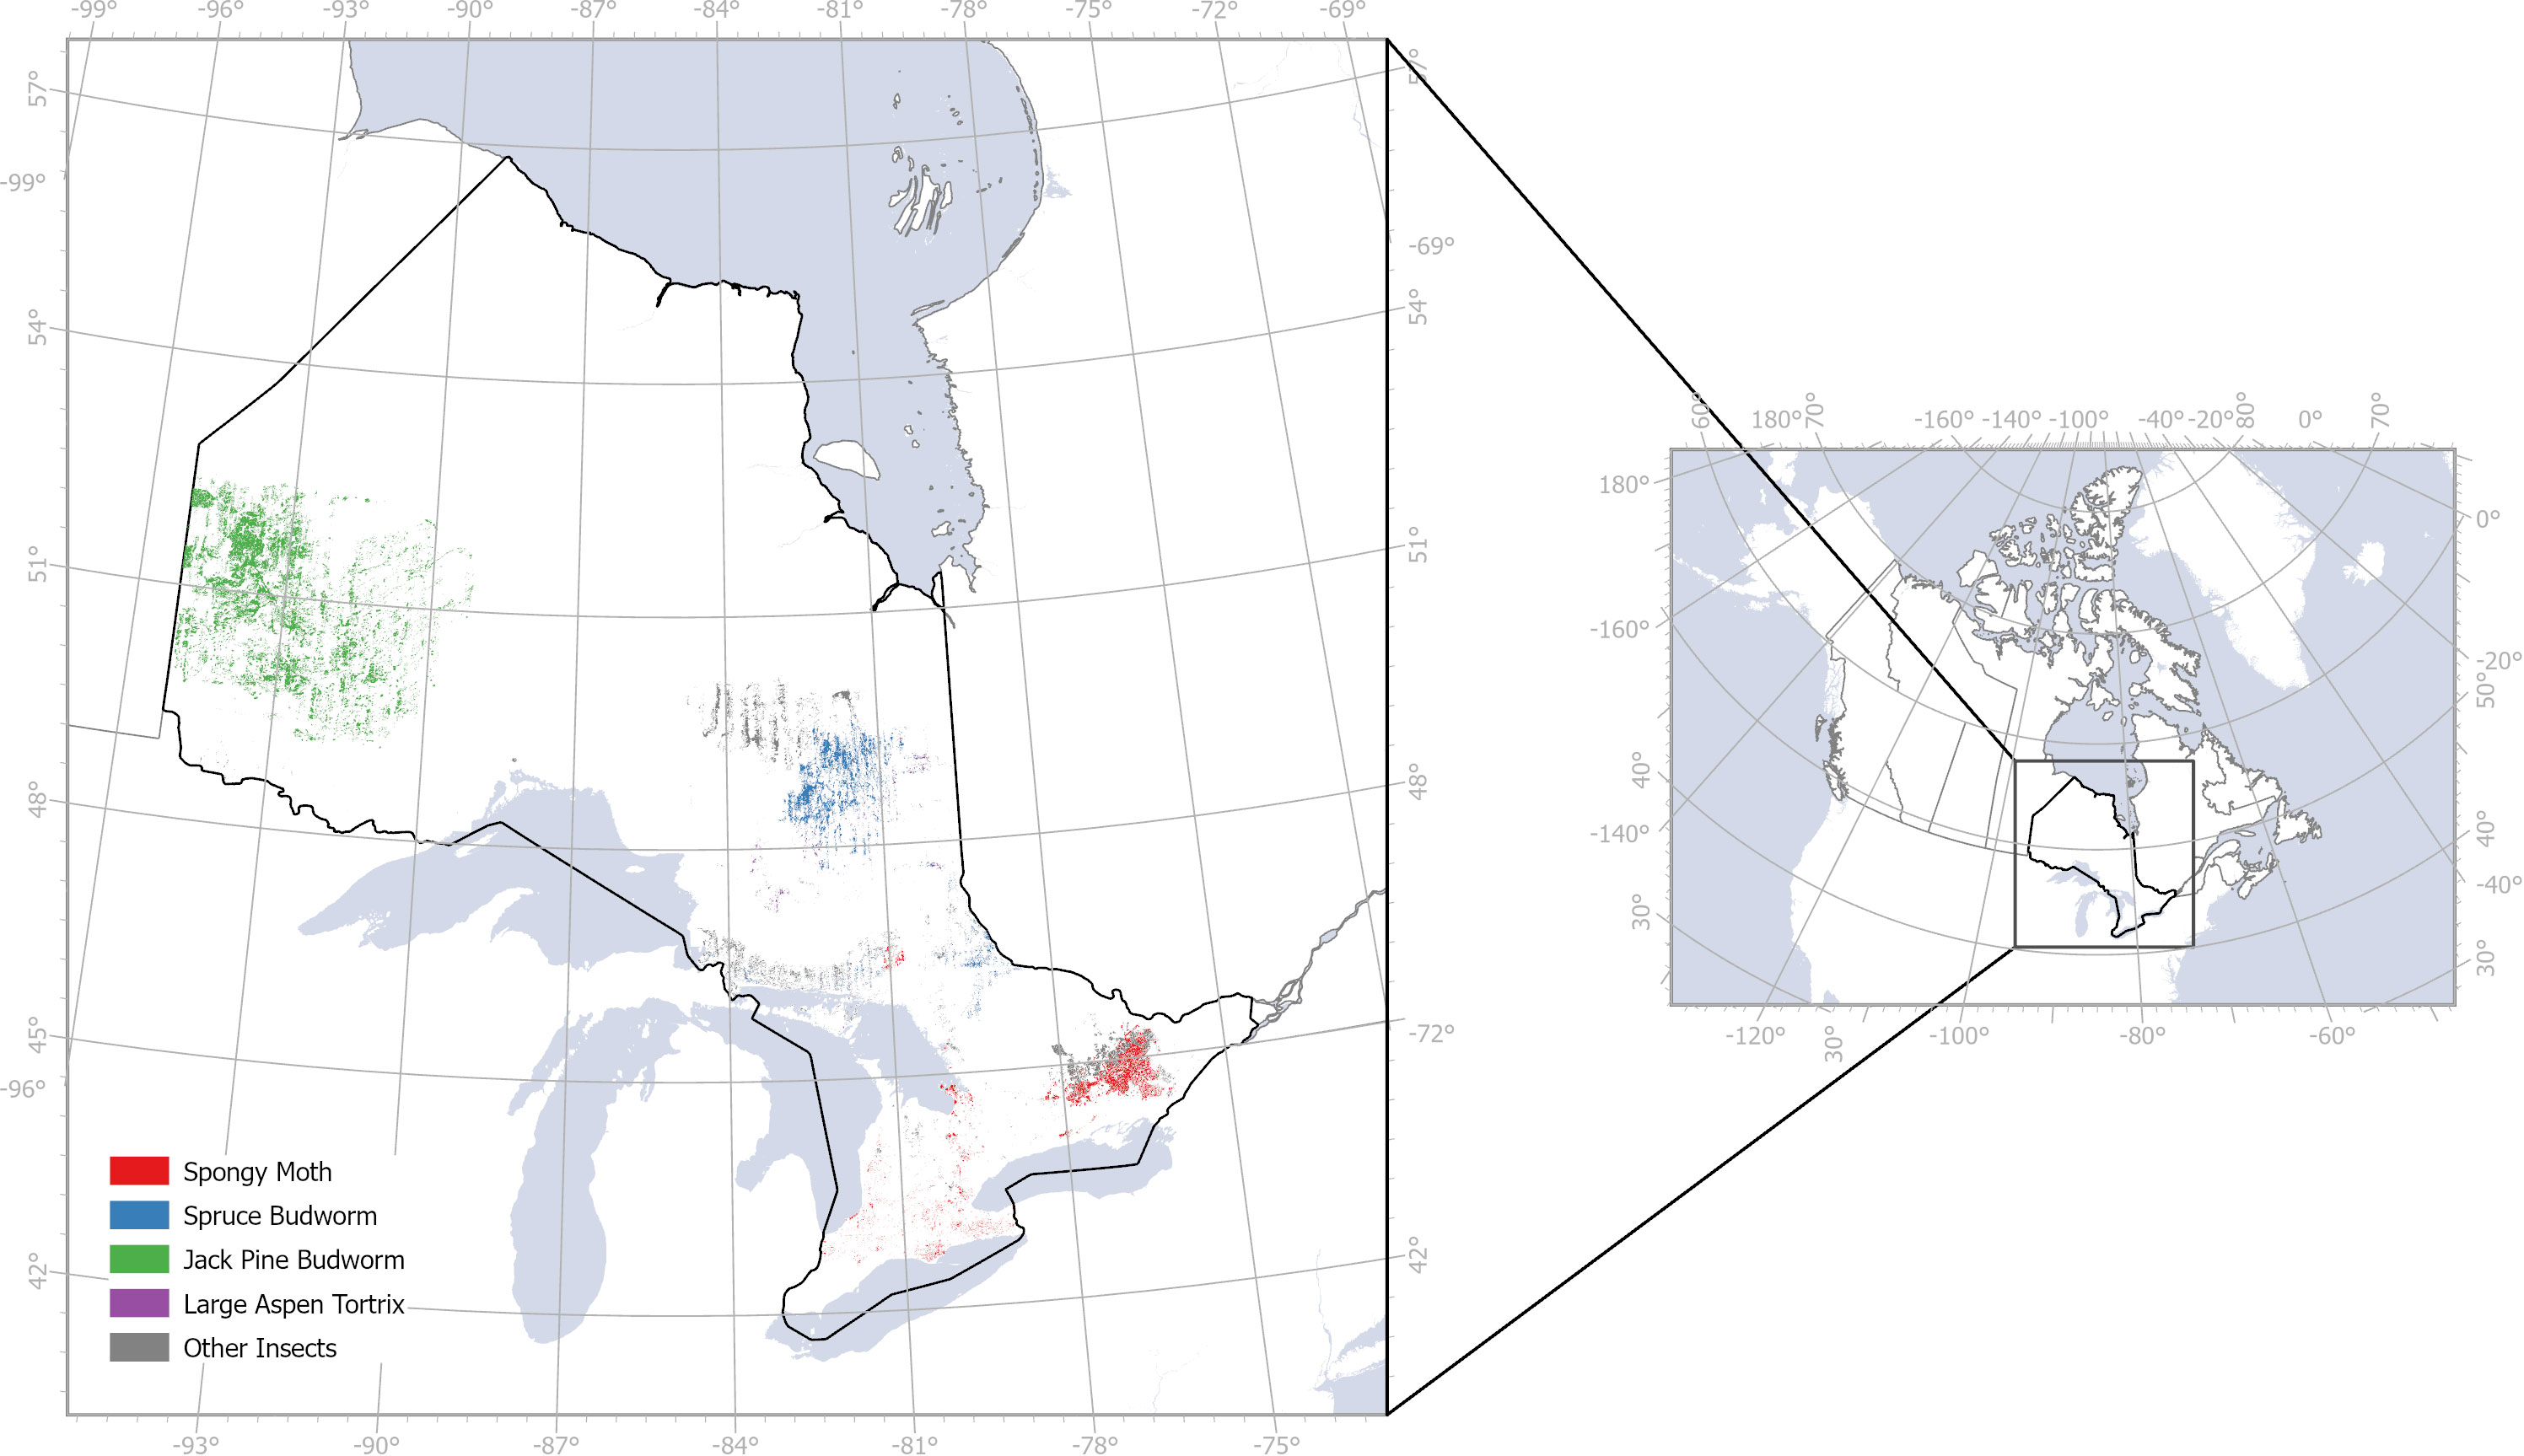
Figure 2 Insect infestation in Ontario, Canada from 2018 to 2020 based on field observations from Ontario GeoHub.
2.2 Infestation mapping
We acquired ground data of insect infestation from the Ontario GeoHub database (https://geohub.lio.gov.on.ca/documents/lio::forest-insect-damage-event/about), filtering the infestation by year (2018–2020) and damage severity (moderate to severe, 25–100% damage; severe, 75–100% damage; and mortality ranking). We assumed that the Ontario GeoHub database is indicative of all known infested and non-infested sites, even though this may not be the case in reality. Based on paucity of data points across all study years, several species were excluded from this analysis. Selected species for this study included L. dispar, C. pinus, C. conflictana and C. fumiferana. Due to the scarcity of samples of some species, we treated all of them as the “defoliators” class, turning the problem into a binary classification task.
To train our model, we used covariates from the 250 m spatial resolution Moderate Resolution Spectroradiometer (MODIS) satellite observations. Surface reflectance of red and near infrared were extracted from version 6 MOD09Q1 product while the normalized difference vegetation index (NDVI) was extracted from version 6 MOD13Q1 product and thermal bands were taken from version 6.1 MOD11A1 product (Figure 3). We created bi-monthly image composites (mean and standard deviation) from the reflectance, NDVI, and thermal MODIS products during the growing season, from April to August, resampling all products to 1 km spatial resolution to match the corresponding thermal product. We noted that infestation cycles can commence anywhere between April to August annually, contingent on species and temperature fluctuations. MODIS was selected as our primary satellite data source as it offered cloud free, high temporal resolution images to compose the bimonthly datasets while accounting for the spectral variability that may occur in the trees during the infestation cycle, including the budburst of leaves in many tree species across Ontario, between April and August. We also examined data from 30 m spatial resolution Landsat-8 and 10 m spatial resolution Sentinel-2 satellites. However, these satellites did not offer sufficient cloud free images across Ontario, resulting in significant mapping gaps and artifacts (results not presented here).
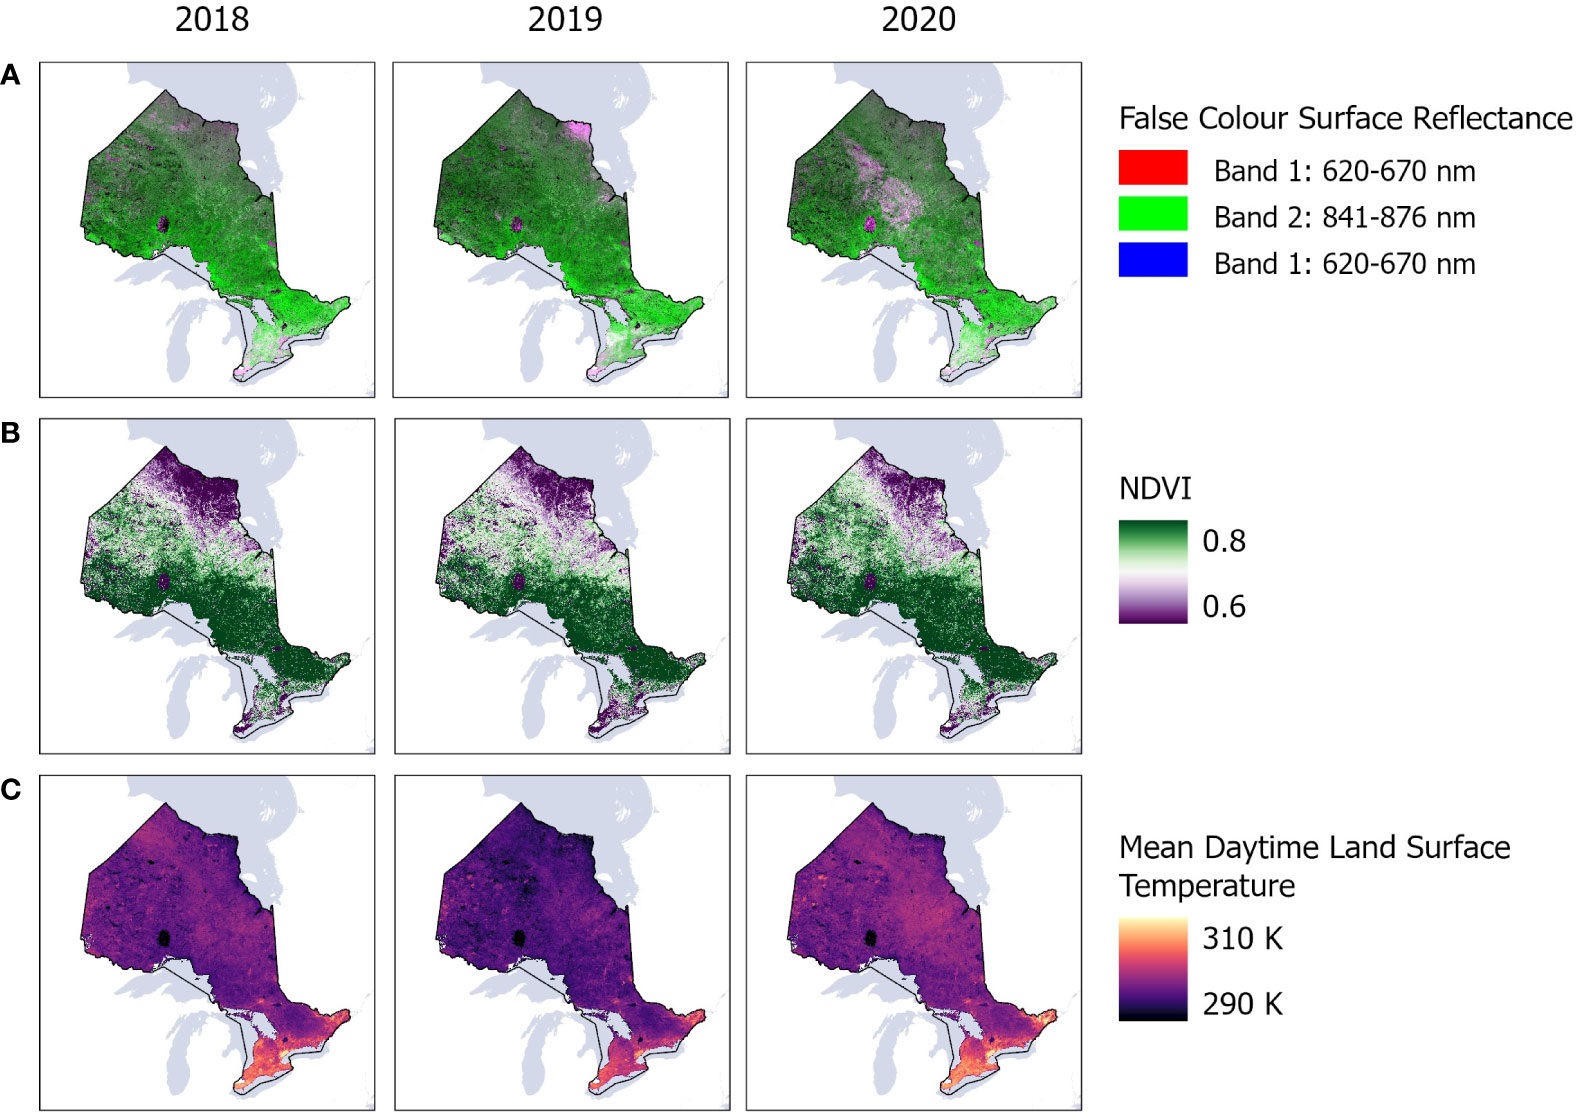
Figure 3 MODIS satellite observations showing mean (A) surface reflectance of red and near infrared bands; (B) normalized difference vegetation index (NDVI); and (C) thermal bands across Ontario, Canada between 2018 and 2020 in Google Earth Engine.
To generate the infestation maps, we uploaded the ground data from the Ontario geohub to the Google Earth Engine (GEE) platform. Then, we rasterized a mask containing 29,315 and 47,130 pixels from the infested and non-infested locations, respectively. The samples were extracted from 2020, the year with the highest infestation rate, and we trained the models using the data for this reference year.
Independent sample sets for each of the studied years were also created for validation. Here, the number of samples ranged from 9,900 to 20,000 pixels, depending on infestation levels.
2.3 Random forest probability estimate
A random forest algorithm (RF) (Breiman, 2001) was trained on the training samples from ground data and MODIS observations from each year to classify MODIS pixels by likelihood of insect infestation. RF combines a large number of trees trained upon random subsets of the available labeled samples and features. Each tree contributes only one class vote to each instance, and the result is determined by the majority votes of all the forest trees (Hastie et al., 2009). In our experiments, we set the number of trees in the “forest” (ntree), and the number of features/predictors considered for each node in the trees (mtry) to 500 and 5, respectively, after performing a grid search analysis.
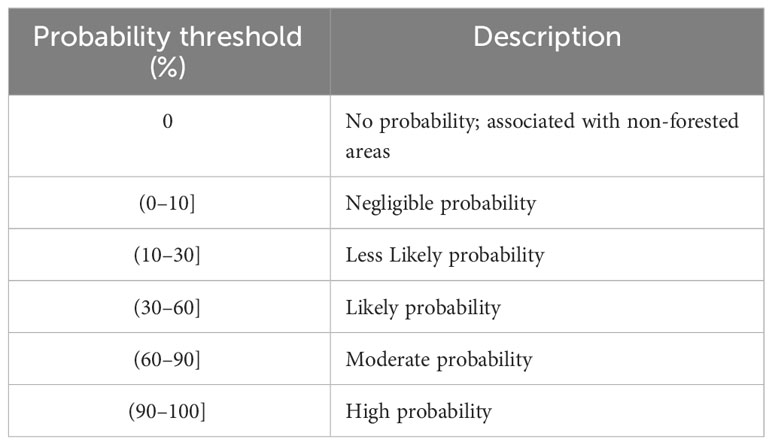
To avoid spatial autocorrelation among samples, we trained the RF algorithm by applying a 5-fold spatial cross-validation. In particular, we divided the pixels annotated as infected into five non-overlapping areas, where for each fold, an RF model was fitted using samples from four locations, and the pixels associated with the remaining area were employed to validate the model. To compute the probabilistic maps, all five trained RF models were evaluated during the cross-validation phase, generating the same number of maps for 2018, 2019, and 2020. We reported the median and standard deviation of probability maps. Probability thresholds were calculated based on the percentage of pixels (Table 1), and nonforest locations were masked out using the ALOS PALSAR forest/nonforest product.
2.4 Calculation of human and environmental drivers of infestation
Using the classified maps, we tested the correlation between the occurrence of infestation and six environmental and human factors, namely temperature, precipitation, elevation, land cover, distance to roads and location of protected areas (Figure 4). Temperature and precipitation data between April and August were obtained from TerraClimate (https://www.climatologylab.org/terraclimate.html) at 4 km spatial resolution and were used as proxies to climate, which plays a significant role on the ability of defoliants to complete their life cycle (Régnière et al., 2009).
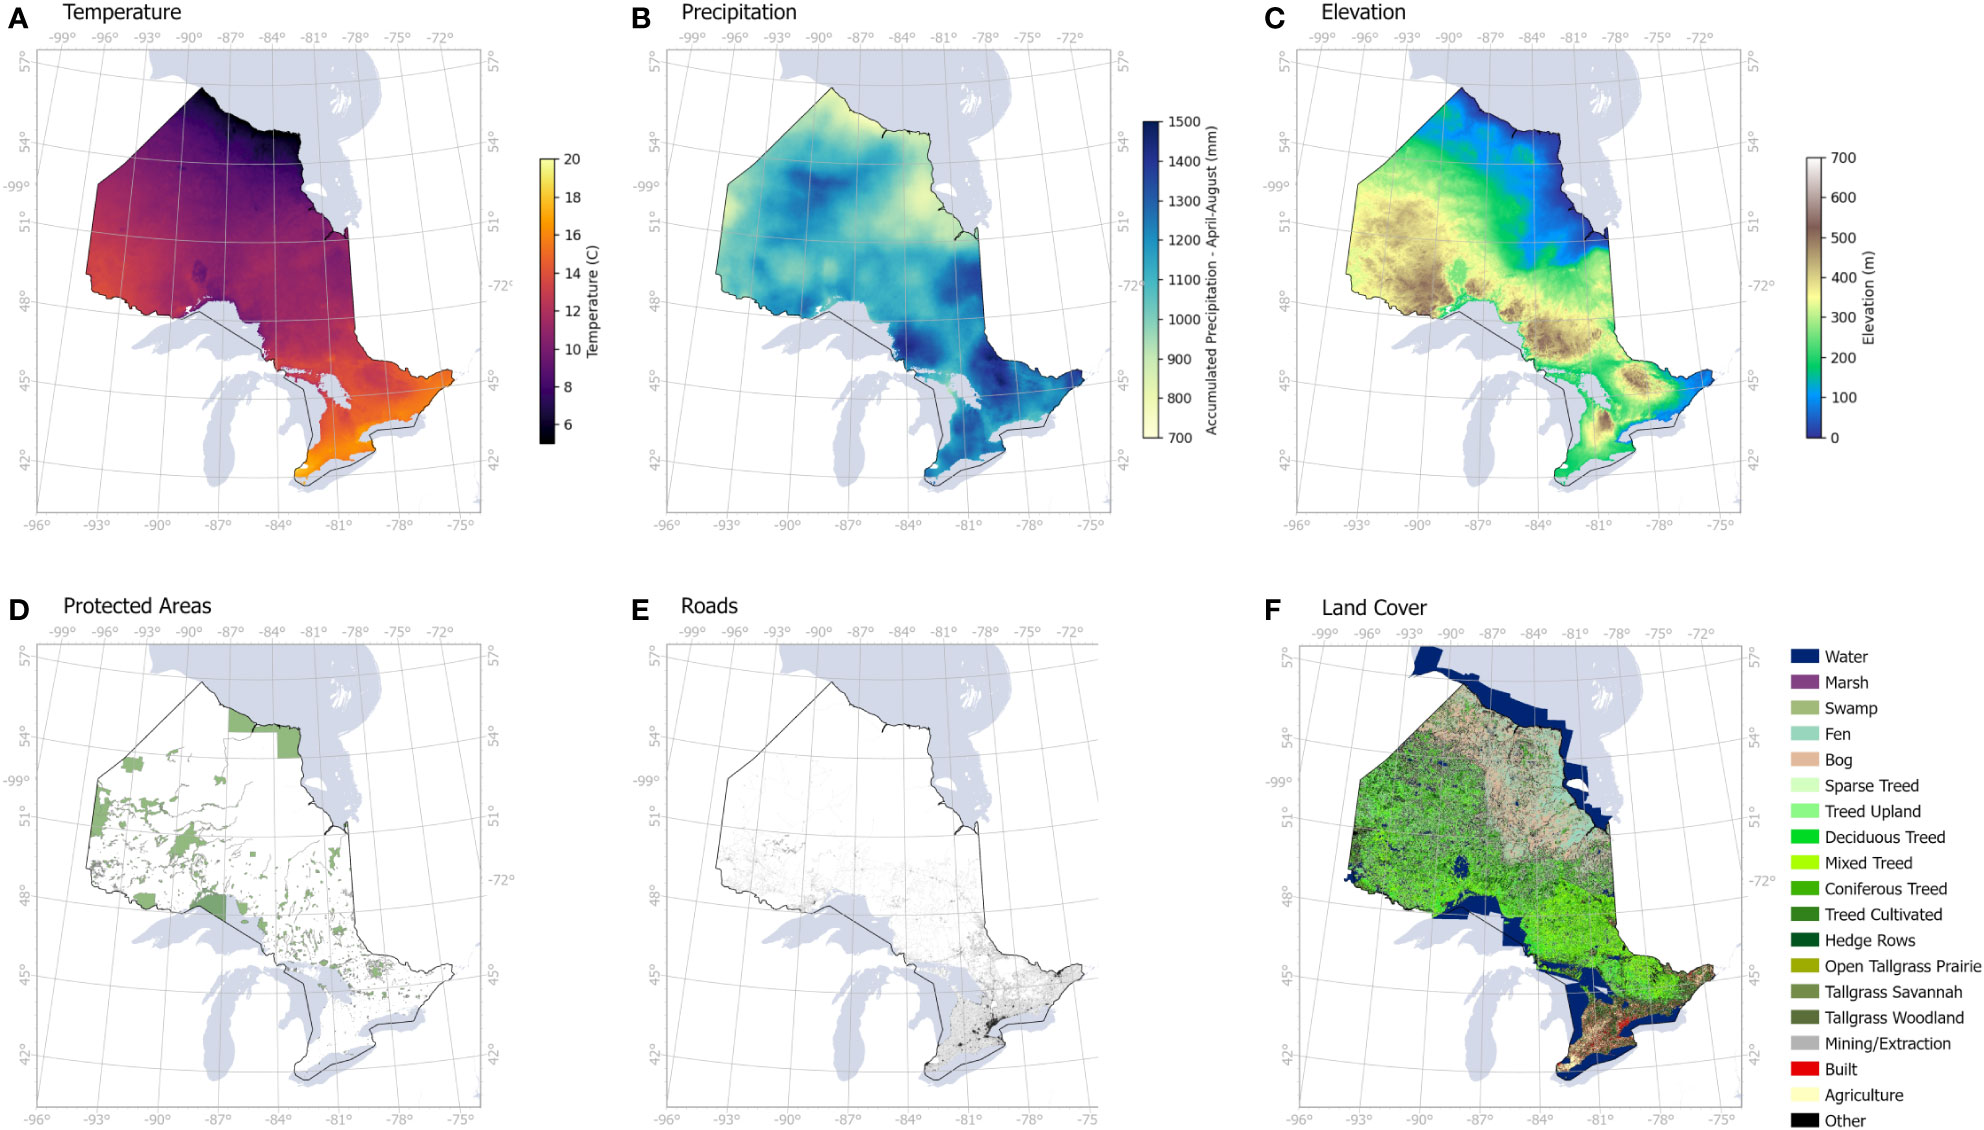
Figure 4 Human and environmental variables used to assess the drivers of infestation levels across Ontario: (A) average temperature from April to August, (B) accumulated precipitation from April to August, (C) elevation, (D) protected areas including all parks and conservation areas, (E) road networks, (F) land cover including coniferous and deciduous treed areas.
A digital elevation model (DEM) obtained from Advanced Land Observing Satellite (ALOS, https://developers.google.com/earth-engine/datasets/catalog/JAXA_ALOS_AW3D30_V3_2) was used to produce an elevation map at 30 m spatial resolution. Land cover data was obtained from the Ontario GeoHub database (https://geohub.lio.gov.on.ca/documents/lio::ontario-land-cover-compilation-v-2-0/about) to mask out the non-forest areas. We also included protected areas that were obtained from Environment and Climate Change Canada database (https://www.canada.ca/en/environment-climate-change/services/national-wildlife-areas/protected-conserved-areas-database.html) as a sign of human footprint in remote areas, such as camping, logging, hiking and other associated activities, that may favor the spread of infestation. Finally, proximity to roads (data obtained from Ontario GeoHub, https://geohub.lio.gov.on.ca/datasets/mnrf::ontario-road-network-orn-road-net-element/about) was used to evaluate the direct influence of human transportation on infestation occurrence. Initially, our environmental and human variables were overlaid on our probability maps, followed by a correlation analysis to determine the likelihood of contributing factors to infestation levels.
3 Results
3.1 Spatio-temporal occurrence of infestation
Our results reveal considerable increase in insect infestation across Ontario between 2018 and 2020 based on an RF probability using MODIS satellite observations (Figure 5A). Between 2018 and 2020, the total area classified as having a high probability of infestation across Ontario increased by >1,300%, from 2,900 km2 to over 42,000 km2 (Figure 6). Most of this expansion occurred in northwestern Ontario, along the border of neighboring province, Manitoba, while secondary incidences were observed in southern Ontario. Conversely, the proportion of pixels experiencing “moderate” (60–90%), “likely” (30–60%) and “less likely” (10–30%) probability thresholds decreased by 18%, 43% and 25.5% respectively during the same period (see Figure 6).
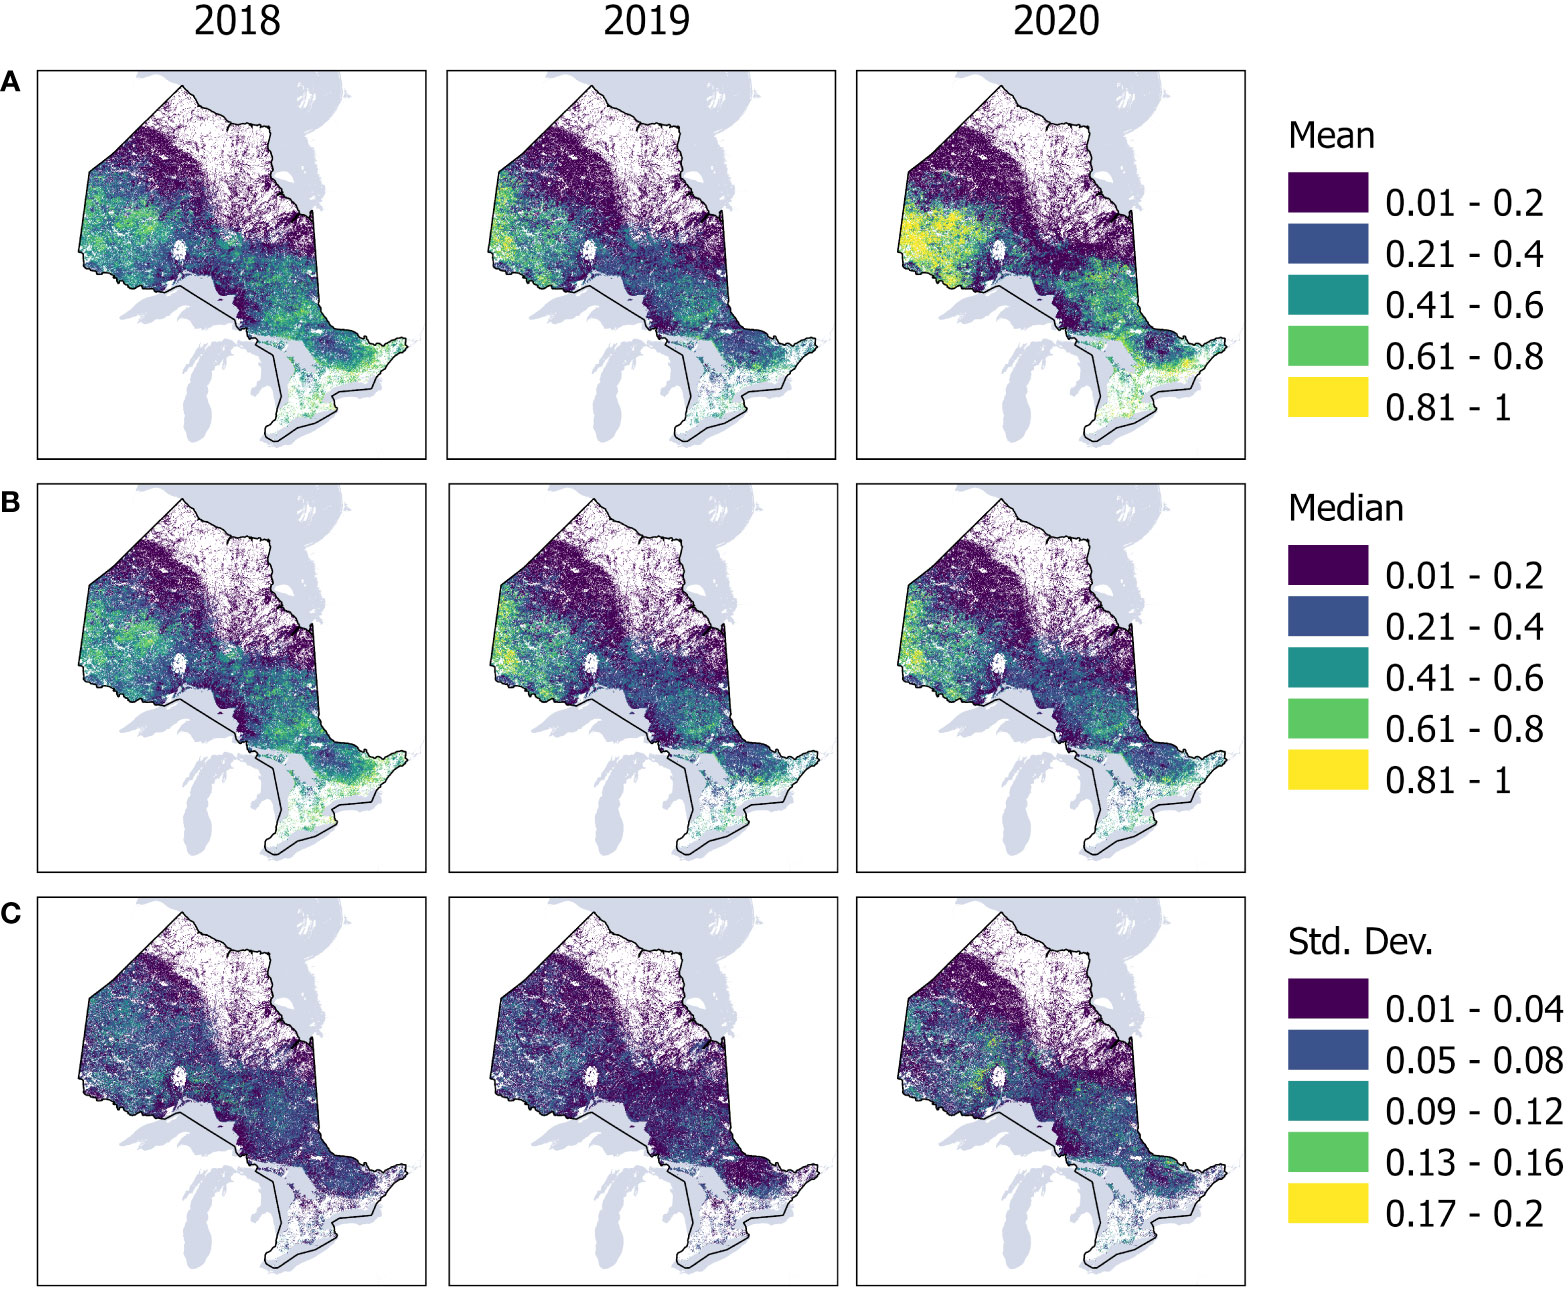
Figure 5 Annual (A) mean, (B) median and (C) standard deviation of our cross-validation maps from 2018 to 2020 using a k-fold of five. For mean and median, higher values indicate higher confidence of predictions (probability). Higher standard deviation values are associated with increasing uncertainty of each pixel of the model within our study region. White regions indicate non-forests.
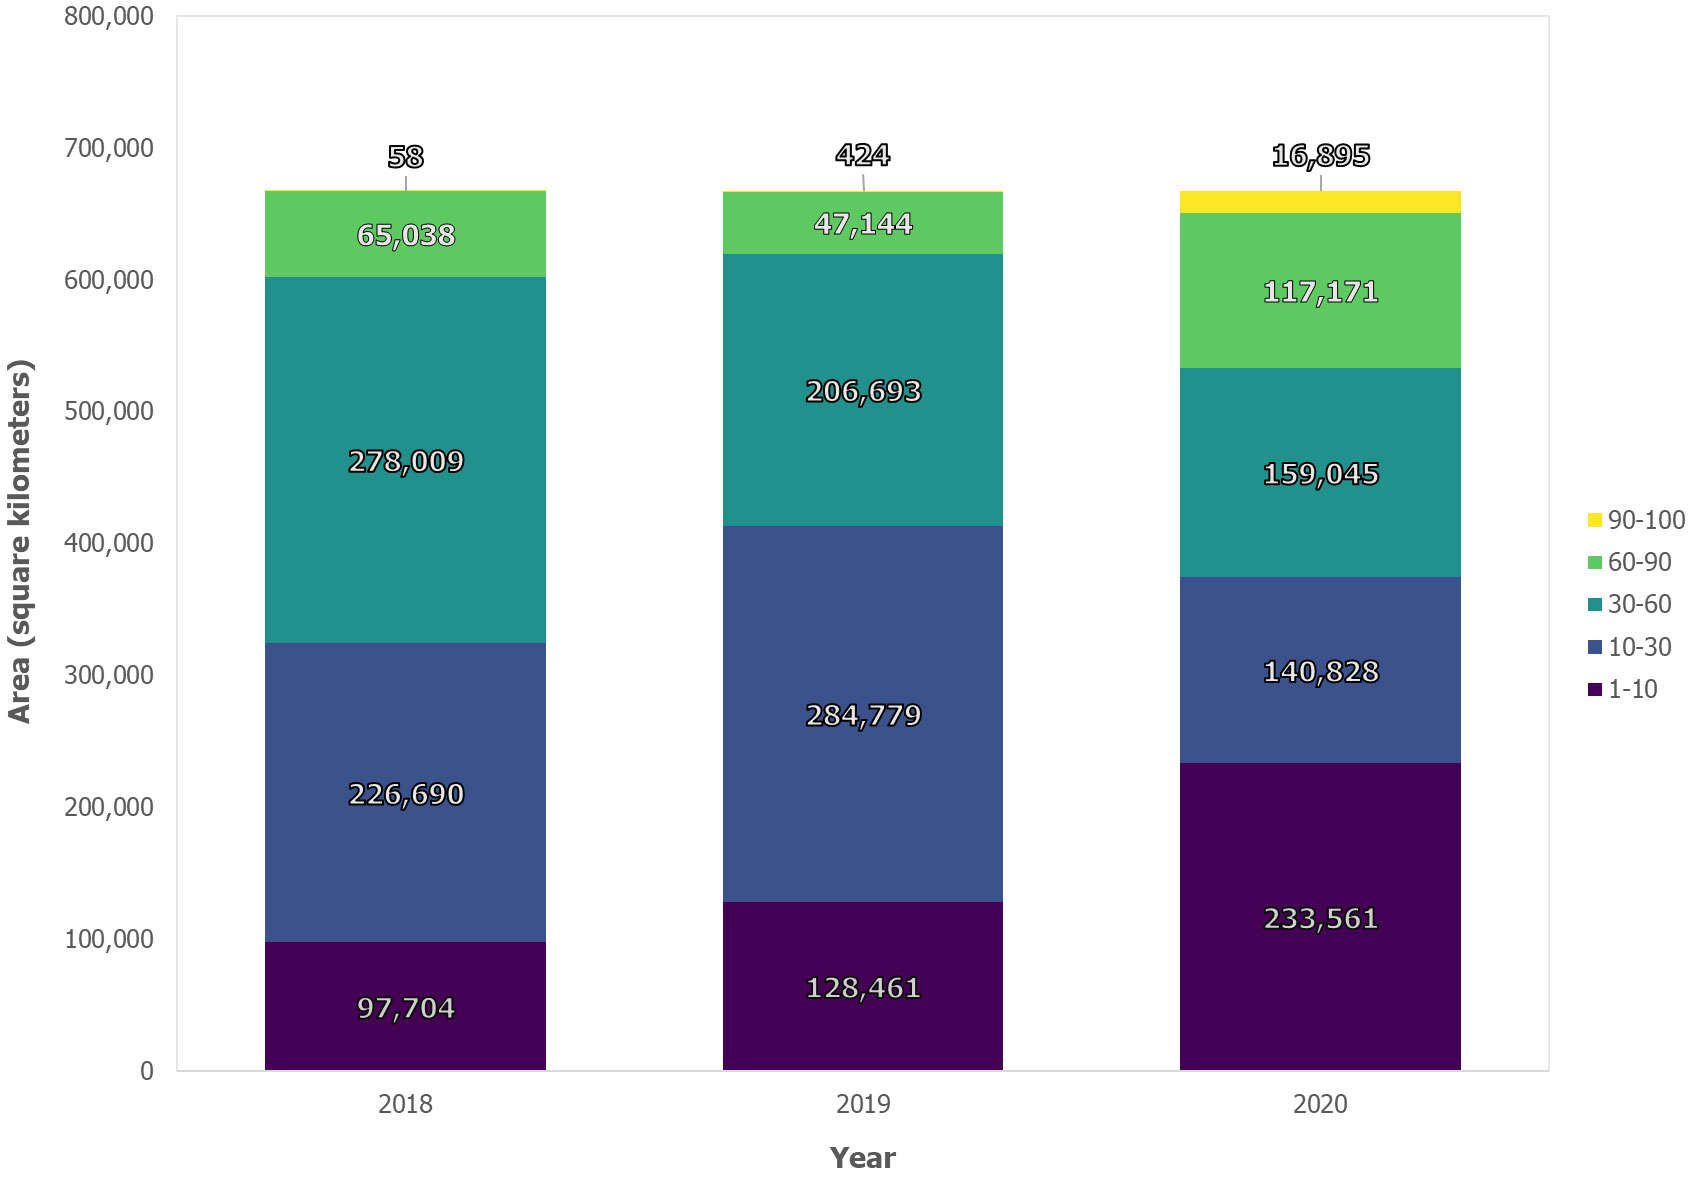
Figure 6 Area of annual infestation occurrence (km2) for Ontario from 2018 to 2020 based on random forest classification.
In 2018, spatial hotspots of infestation were concentrated along the northwestern Kenora, Rainy River and Thunder Bay, as well as in southern counties of Northumberland, Peterborough, Kawartha Lakes, extending into Sudbury and Timiskaming. In 2019, most of the infestation was concentrated along the northwestern part of the province. By 2020, the intensity of occurrence of hotspots increased along northwestern Ontario, extending southwesterly towards the “golden horseshoe”.
3.2 Human and environmental drivers of infestation
From our analysis, recurring patterns emerged across two regions, namely southern Ontario near the golden horseshoe, and northwestern Ontario. Among these regions, large deviations in average temperature, elevation, accessibility, and vegetation type exist. However, these areas being indicated as hotspots may suggest some correlation in drivers of infestation. By determining what factors drive infestation, we may be able to (a) predict how populations will expand in the future, and (b) find appropriate methods to mitigate and/or eliminate future proliferation.
Based on correlation analysis, proximity to roads and temperature were the most important drivers of infestation occurrence across Ontario (Figure 7). There was a strong negative correlation between the Ontario provincial road network and infestation levels, i.e., the closer the roads, the higher the likelihood of infestation (p < 0.001). This was particularly noticeable towards northwestern Ontario. On the other hand, our analysis showed strong positive correlation with temperature, i.e., the higher the temperature increase the higher the probability of infestation (p < 0.001).
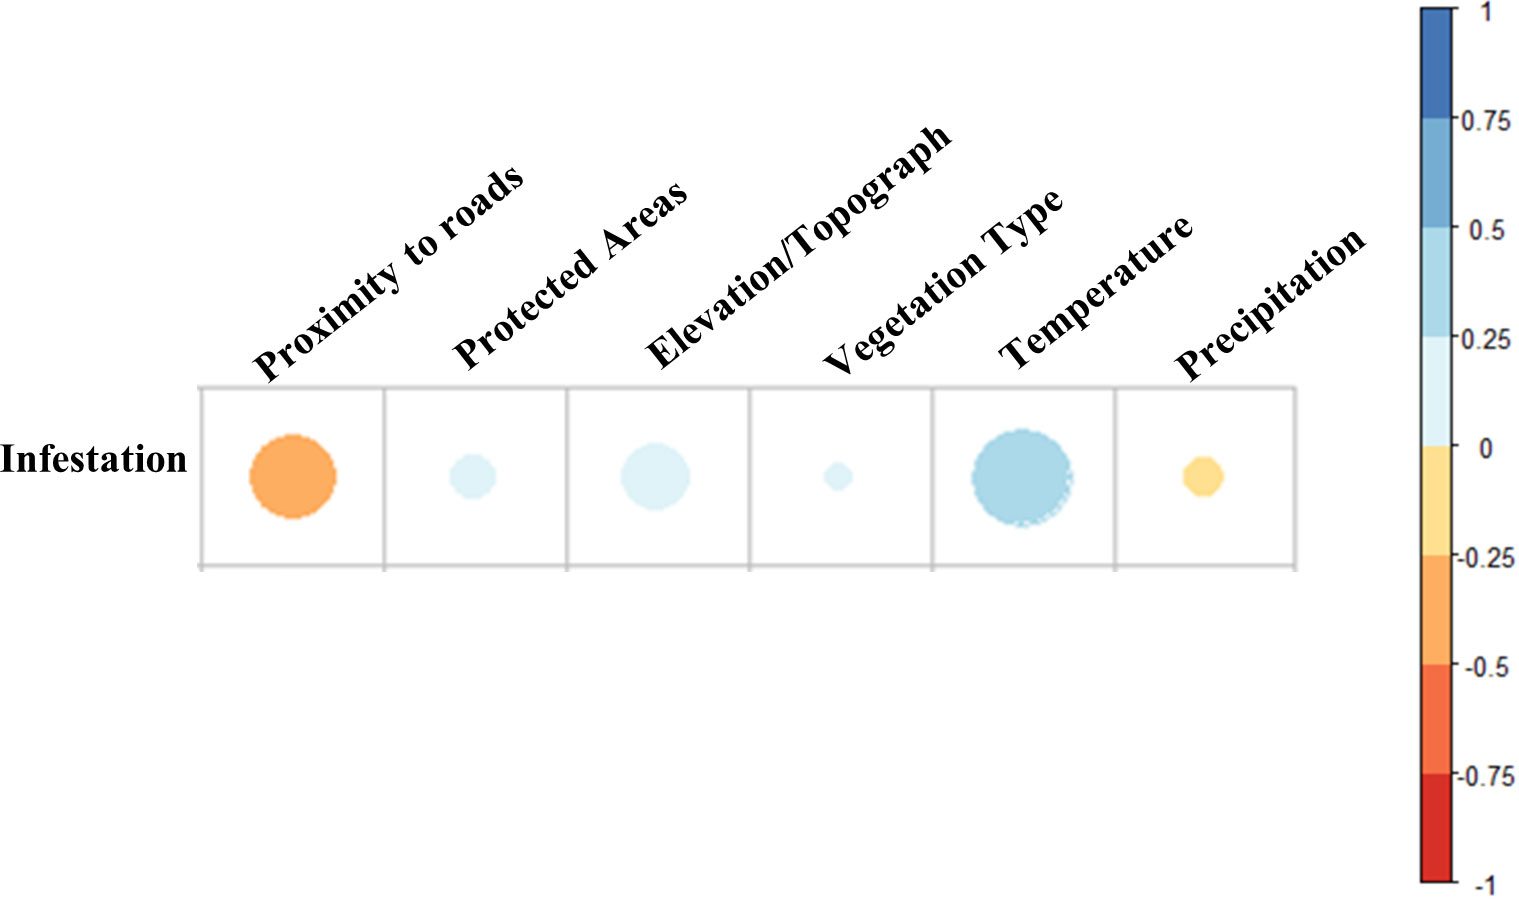
Figure 7 Correlation analysis of human and environmental drivers of infestation between 2018 and 2020. 0 to 1 (blue) indicates positive correlation, while 0 to −1 (orange–red) indicates negative correlation.
All other variables showed significant correlation (p < 0.01) albeit with smaller contributions to hotspots (see Figure 7). Precipitation emerged as having a weak negative correlation with infestation (correlation range > −0.25), while elevation, protected areas and land cover emerged as having positive but weak correlation (correlation range < 0.25) with infestation.
3.3 Accuracy analysis
The average overall accuracy of our probability estimate was 88%, while the recall, precision, and F1 score metrics were 92%, 94%, and 93%, respectively. Recall measures the model’s capability to identify the True samples, while precision quantifies the number of correct predictions. F1 score summarizes the model performance computing the harmonic mean between recall and precision. Figure 5 highlights the yearly mean, median and standard deviation of our cross-validation using a k-fold of five.
4 Discussion
Our findings paint a more complex picture of insect infestation than previously recorded across Ontario, Canada. While the reported observations in southern and some part of northern Ontario from government agencies have been captured in our analysis, we also documented larger, more widespread infestation across the northwest and northeast expanding into the southern part of the province.
By 2021, the Ontario government reported major outbreaks of insect infestation of L. dispar, C. pinus, C. conflictana and C. fumiferana and resulting moderate to severe defoliation in northwest, northeast and eastern districts (NDMNRF, 2022). In 2020, jack pine budworm defoliated approximately 10,658 km2 of forest, mainly in the northwest region (NDMNRF, 2021). This was a 41% increase from 2018 (6,275 km2, NDMNRF, 2019). Infestation levels of large aspen tortrix decreased to 228 km2 by 2020 from 392 km2 in 2018 and were primarily detected in Chapleau and Timmins districts in the northeast (NDMNRF, 2019; NDMNRF, 2021). Defoliation caused by spongy moth was mapped in only southern Ontario, increasing from 149 km2 in 2018 to 5,864 km2 by 2020 and was detected in southern districts including Northumberland, Hastings, Peterborough, and Kawartha Lakes counties (NDMNRF, 2019; NDMNRF, 2021). The area of spruce budworm defoliation increased from 1,371 km2 in 2018 to 4,424 km2 in 2020, mainly detected in northeast regions (NDMNRF, 2019; NDMNRF, 2021). An aggregate of 21,174 km2 of forests were defoliated by our study species by 2020. Although the above regions were captured within our analysis, our study also revealed considerable expansion of infestation (a total area of 239,603 km2 based on moderate to high probability estimates) in the north and south. Defoliation expanded in the districts of Cochrane, Timmins, Dryden, Sioux Lookout, Kenora, Nipigon, Fort France, Red Lake, Chapleau, Sudbury, Hearst, Kirkland Lake, North Bay, Sault Ste. Marie, southern parts of Wawa, North Bay, Parry Sound, Peterborough, Peterborough, Bancroft, Kemptville, Midhurst, Pembroke, Hastings, Aylmer, Guelp, Aurora, Northumberland, Kawartha Lakes. In 2020, defoliation was recorded in Algonquin Provincial Park, which corresponded to government reports in 2021 (NDMNRF, 2022).
The expansion of insect infestation across Ontario appears to be significantly correlated with the Ontario provincial road network, especially logging roads in the north, whereas roads in the south are used by a greater demographic of commuters (see Figure 7). Therefore, areas near roads will more likely be prone to increasing infestations. For instance, these findings confirm Benoit and Lachance’s (1990) reporting of species such as L. dispar where although wind is the primary, natural dispersal of their caterpillars, human transportation is responsible for their long-range dispersal. Ciesla and Kruse (2009) noted that outbreaks of large aspen tortrix may be associated with recreation sites and home sites in urban–wildland interface. Furthermore, our findings suggest that jack pine budworm and spruce budworm are the major species causing defoliation in the northwest and northeast of the province, and their expansion may be linked to proximity to roads. Government reports corroborated our findings (NDMNRF, 2019; NDMNRF, 2021) but we have found no papers which examine other drivers of infestation of these species outside of climatic analysis.
Additionally, high infestation showed a positive correlation with temperature across the province. With rising temperatures, geographical ranges of insect pests may shift or expand into new areas of suitable habitat at their northern limits and into higher elevations, and species may potentially move to secondary hosts (Williams and Liebhold, 1997; Candau and Fleming, 2011; Pureswaran et al., 2015; Hartl-Meier et al., 2017). Temperature anomalies may trigger early budburst of tree hosts, or cause late emergence of larval defoliators, leading to phenological asynchrony between species and their hosts (Jepsen et al., 2008; Régnière et al., 2012; Pureswaran et al., 2015; Jakoby et al., 2019). Species such as C. pinus and C. fumiferana are cold-blooded, with their body temperature being determined by the temperature of their surrounding environment. As temperature increases in the south, these species are extending their range farther north (Wellington et al., 1950; Greenbank, 1956; Pilon and Blais, 1961). Likewise, L. dispar moths cannot start their life cycle below −20°C and their life cycle is limited below 10°C (Benoit and Lachance, 1990). This may explain why they were previously unrecorded in northeast and some parts of southern Ontario. Then, suitable conditions are provided, as temperature increases, for their eggs and larvae to grow and develop, and this may explain why we saw increasing expansion in the province.
Our results also agree with predictions made by Régnière et al (2009; 2012). which predicted increasing migration northwards in Ontario for several species based on climate suitability. Régnière et al. (2009) indicated an increasing migration pattern of L. dispar moth infestation towards the north and east of Ontario by > 50% by 2030, and > 90% by 2070. Their predictions for 2020 are in line with our maps suggesting an infestation hotspot in western Ontario, on the border with Manitoba, an area only limited reported by ground data (see NDMNRF, 2019; NDMNRF, 2021; NDMNRF, 2022). However, our findings indicate a faster timeline for establishment of infestation across the province than predicted by Régnière et al. (2009). Additionally, Régnière et al. (2012) predicted that the distribution of spruce budworm outbreaks is likely to shift northward and towards higher elevations over the next 50 years in response to climate change but may vary considerably due to the current distribution of the insect’s three main host plants (balsam fir, white and red spruce).
While much of this expanding infestation may be linked to climate, for propagation to occur suitable tree types must be present. According to Cihlar et al. (2002), deciduous and mixed forests are more susceptible to, for example, L. dispar moth infestation, which is abundant in northern parts of Ontario, but colder temperatures may have previously prevented their spread. We examined whether forest type was linked with infestation levels, but our analysis showed no correlation between infestation and forest types. This may be because caterpillars of the L. dispar moths seldom feed on conifer trees but may do so if populations are high and most of the leaves on deciduous trees (Figure 8), such as oaks, have already been consumed. Likewise, the distribution of host plants for spruce budworms can also be expected to change, many shifting towards higher latitudes, over the longer term (Payette, 2007), and possibly exacerbating the insect’s increasing northern impact (see Régnière et al., 2012). With jack pine budworm, outbreaks patterns may be the result of inter-correlations between these abiotic variables and pollen-cone production (Nealis and Lomic, 1994).
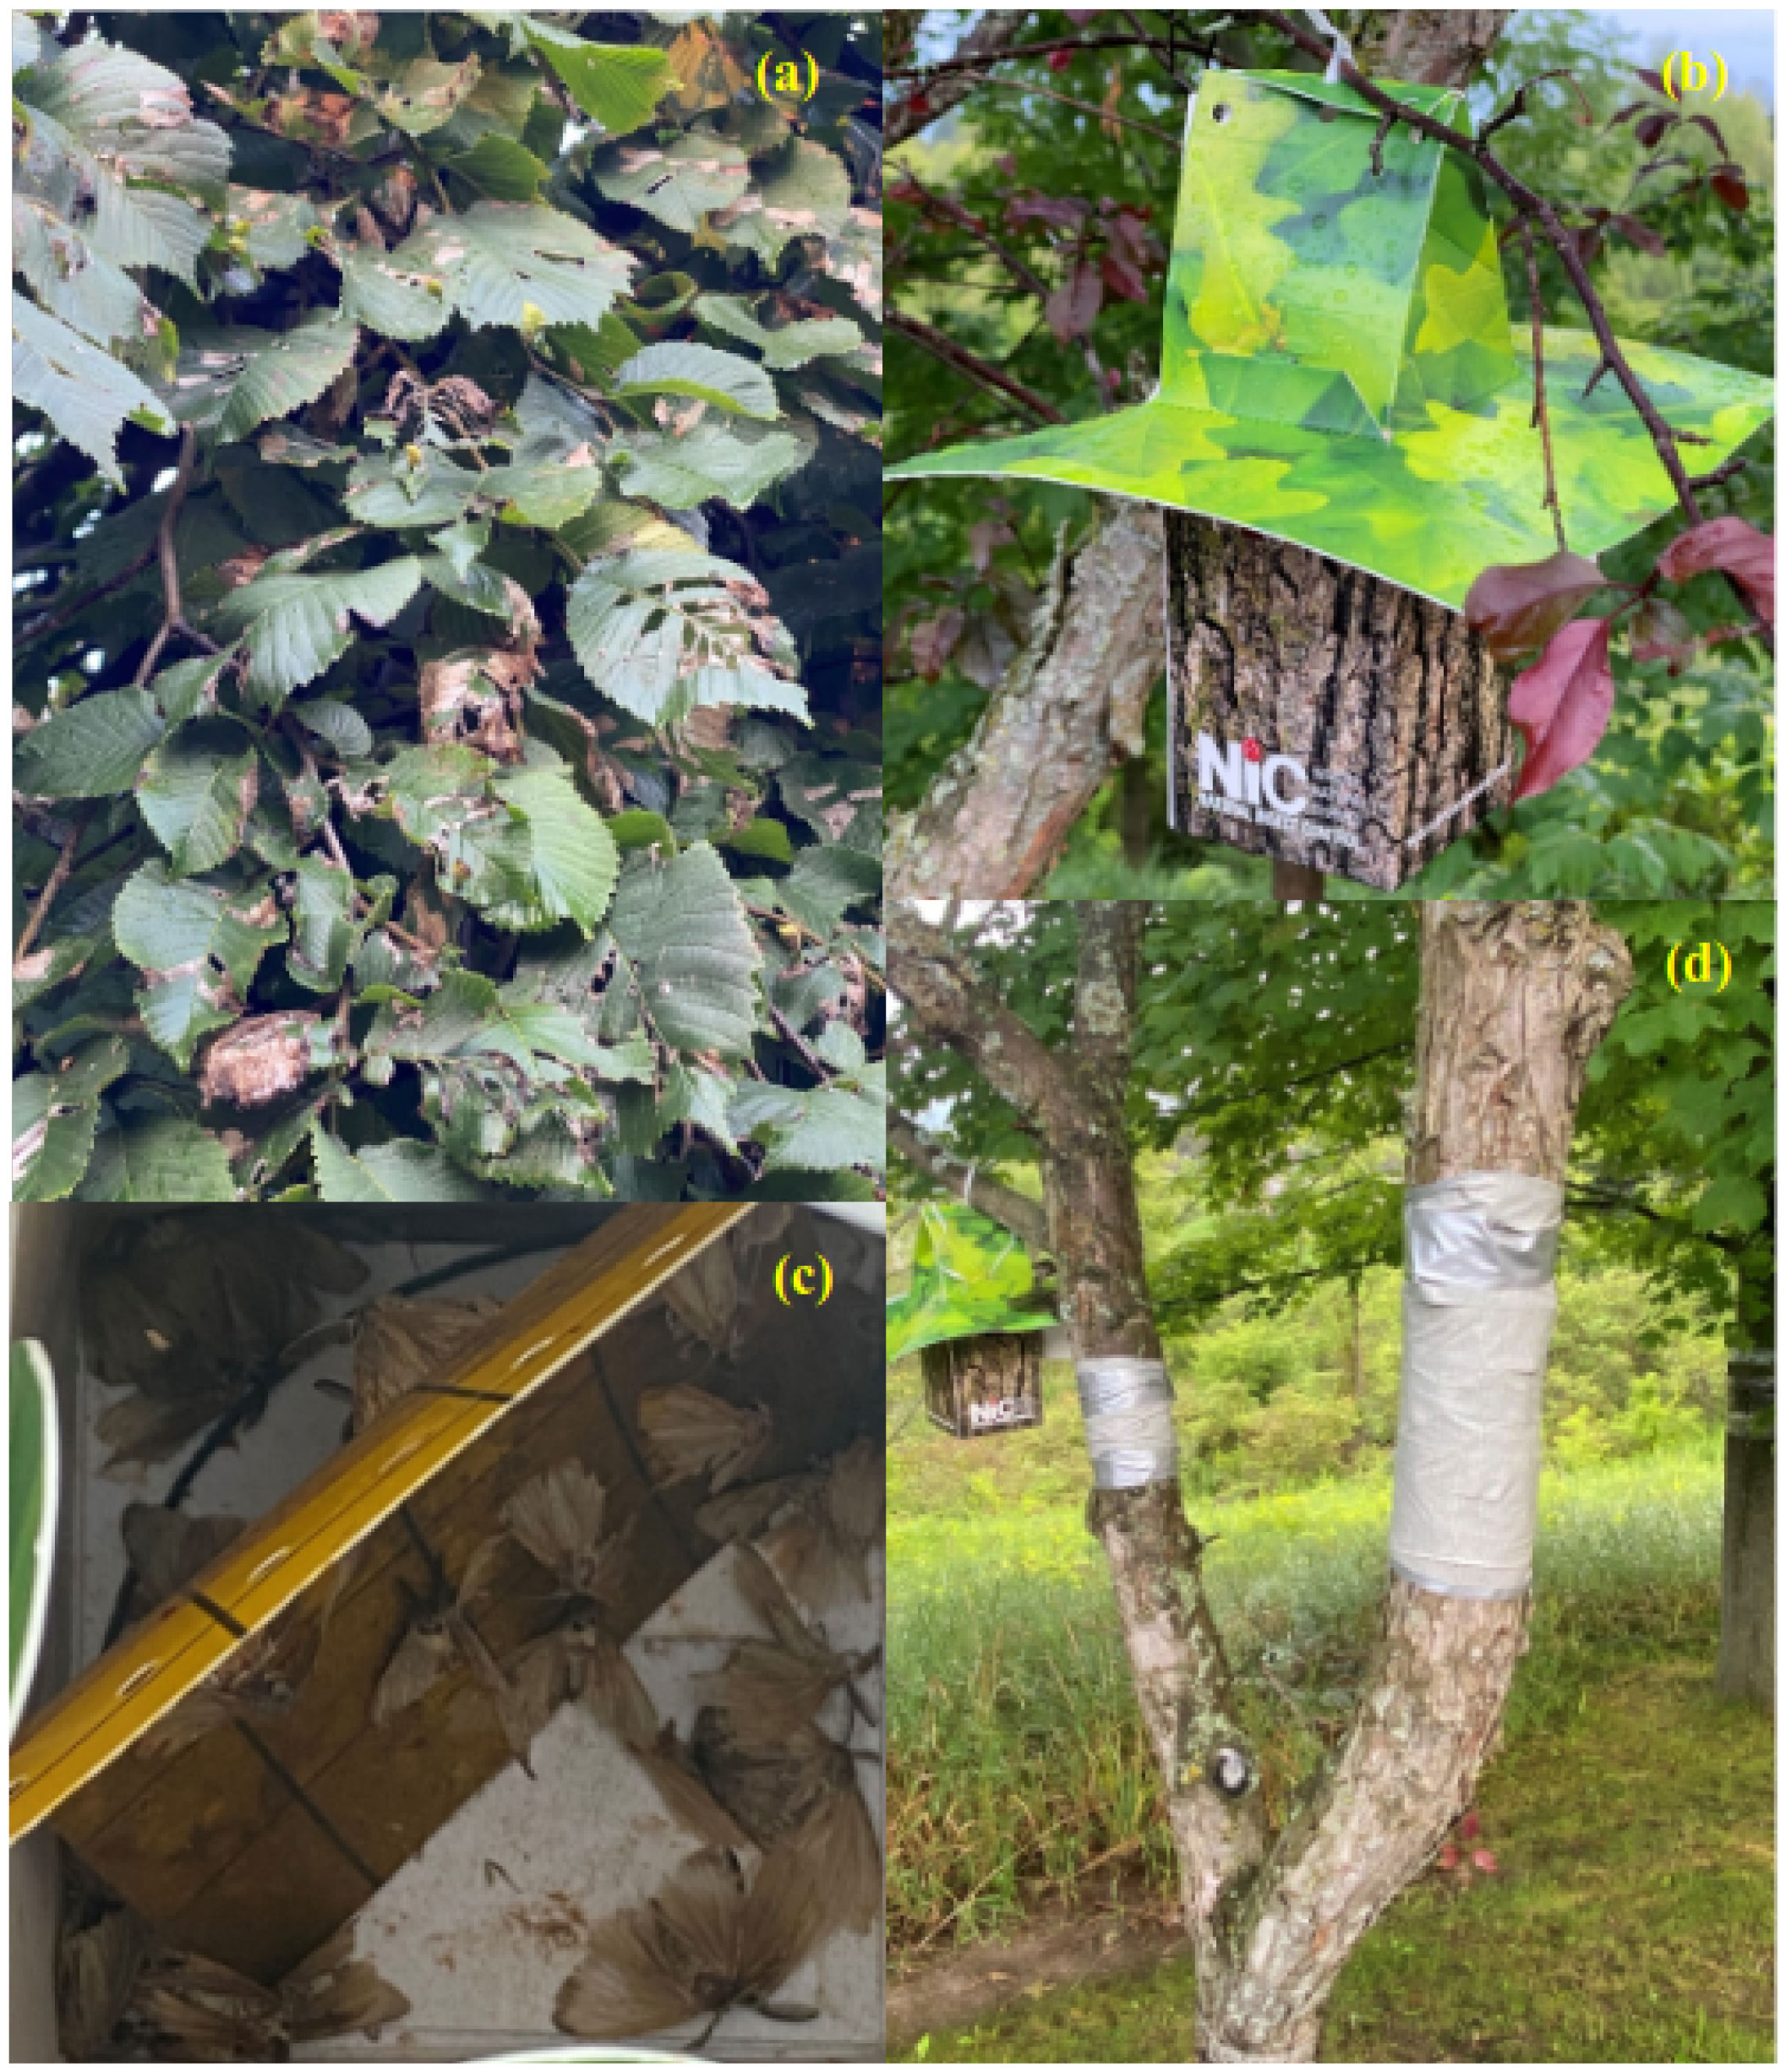
Figure 8 (A) Example of defoliation of a deciduous tree by L. dispar moths; (B) a pheromone trap placed by residents to capture moths from spreading; (C) captured moths in pheromone traps; (D) duct tape banding employed to offer a physical obstruction to the mobility of moths.
Although we did not find notable correlation between infestation and other factors such as precipitation, elevation, and land cover, other studies from agricultural experiments have shown that increasing patterns of rainfall increase development time for certain species of insects (Chen et al., 2019); while higher elevations increase patterns of infestation for others (see Azrag et al., 2018).
Our results suggest that the protected area networks and current federal management strategies have had limited success combating the pervasive spread of insect incursion across the province within our study period. Considerable mitigation strategies have been implemented by authorities and private landowners to restrict the expansion of infestation. These strategies encompass various forest stand management techniques, such as avoiding the creation of uneven-aged or multi-storied jack pine stands, steering clear of edge stands or forest islands, and implementing accelerated harvesting and salvage harvesting. Additionally, measures like aerial spraying of bio-insecticide in specific areas, physically scraping off larvae from infested tree trunks, establishing pheromone traps on infested trees (Figure 8), applying bacterial insecticide Btk (Foray 76B) to jack pine stands, and creating physical traps like burlap and duct tape banding (Figure 8D) around tree trunks have been employed (NDMNRF, 2019; NDMNRF, 2021; NDMNRF, 2022). Despite these efforts, our results suggest that the management strategies may either need revising or expanding to regions where current practices are not implemented to account for factors such as evolving insect behavior in response to changing environmental conditions and potential resistance to control measures.
Further, as proximity to roads emerged as a major driver of infestation, monitoring and management of transportation and human activities may be required across the province. For instance, Bigsby et al. (2011) showed that regulated activities by state and federal governments in the United States correlated with decreased presence of L. dispar moth, which could be implemented within Ontario. Altogether, our results raise awareness of increasing expansion of infestation that national-level statistics do not capture and pose new challenges for conservation of Ontario’s forests.
Additionally, incorporating indigenous knowledge in forest insect management practices, as proposed by Maloney (see Maloney, 2019), may prove instrumental in limiting outbreaks and infestation levels. To enhance the efficacy of these strategies, it may also be crucial to explore innovative approaches such as genetic modification of tree species for pest resistance and the integration of advanced remote sensing technologies for more precise monitoring and targeted intervention. Furthermore, fostering collaborations between researchers, policymakers, and industry stakeholders can lead to a more holistic and adaptive approach in tackling this persistent threat.
5 Conclusions
Our study unveils a nuanced understanding of insect infestation across Ontario, Canada. While government agencies captured observations in southern and northern parts of Ontario, our analysis revealed a larger and more widespread infestation level. By 2021, the Ontario government reported major outbreaks of infestation in various districts, corroborating our findings of more extensive infestation. The expansion of infestation correlated significantly with the provincial road network, particularly logging roads in the north, indicating areas near roads are more prone to increasing infestations.
Additionally, our results align with predictions of increasing migration northwards of several species based on climate suitability. Rising temperatures play a crucial role in the geographical range expansion of insect pests, further exacerbated by phenological shifts. Forest type did not emerge as a significant factor influencing infestation levels, highlighting the complexity of the interplay between insects and their host trees. While our study provides valuable insights, it is evident that current management strategies have had limited success in curbing the persistent spread of infestation. Adapting these strategies to evolving insect behavior and exploring innovation approaches, including advanced remote sensing for quick and effective monitoring, may offer more effective solutions. Collaboration between stakeholders will be instrumental in developing a holistic and adaptive approach to confront this ongoing threat.
Data availability statement
Publicly available datasets were analyzed in this study. This data can be found here: https://www.ontario.ca/page/land-information-ontario; https://developers.google.com/earth-engine/datasets/catalog/MODIS_061_MOD09GQ and https://developers.google.com/earth-engine/datasets/catalog/MODIS_061_MOD11A1.
Author contributions
MK: Conceptualization, Supervision, Methodology, Formal Analysis, Writing – original draft, Writing – review & editing. IG: Conceptualization, Data curation, Investigation. JC: Formal Analysis, Writing – review & editing. CS: Conceptualization, Methodology, Formal Analysis, Writing – review & editing. CR: Visualization, Writing – review & editing. JS: Resources, Writing – review & editing. AG: Conceptualization, Funding acquisition, Methodology, Project administration, Resources, Writing – review & editing.
Funding
The author(s) declare financial support was received for the research, authorship, and/or publication of this article. This work was supported by Natural Sciences and Engineering Research Council of Canada Discovery Grant (RGPIN-2020-05,708) and the Canada Research Chairs Program (CRC-2019-00139).
Acknowledgments
We would like to thank Andrew M. Kreklewich, Ricardo Barros Lourenço and Neil Murphy for their useful insight into insect infestation across Ontario. This work was supported by Natural Sciences and Engineering Research Council of Canada Discovery Grant (RGPIN-2020-05,708), the Canada Research Chairs Program and World Wildlife Fund Canada (WWF-Canada).
Conflict of interest
Author CS was employed by the company Finite Carbon Canada.
The remaining authors declare that the research was conducted in the absence of any commercial or financial relationships that could be construed as a potential conflict of interest.
Publisher’s note
All claims expressed in this article are solely those of the authors and do not necessarily represent those of their affiliated organizations, or those of the publisher, the editors and the reviewers. Any product that may be evaluated in this article, or claim that may be made by its manufacturer, is not guaranteed or endorsed by the publisher.
References
Allen C. D., Macalady A. K., Chenchouni H., Bachelet D., McDowell N., Vennetier M., et al. (2010). A global overview of drought and heat-induced tree mortality reveals emerging climate change risks for forests. For. Ecol. Manage. 259, 660–684. doi: 10.1016/j.foreco.2009.09.001
Ayres M. P., Lombardero M. J. (2000). Assessing the consequences of global change for forest disturbance from herbivores and pathogens. Sci. Total. Environ. 262, 263–286. doi: 10.1016/S0048-9697(00)00528-3
Azrag A. G., Pirk C. W., Yusuf A. A., Pinard F., Niassy S., Mosomtai G., et al. (2018). Prediction of insect pest distribution as influenced by elevation: Combining field observations and temperature dependent development models for the coffee stink bug, Antestiopsis thunbergii (Gmelin). PloS One 13, e0199569. doi: 10.1371/journal.pone.0199569
Bachelet D., Neilson R. P., Hickler T., Drapek R. J., Lenihan J. M., Sykes M. T., et al. (2003). Simulating past and future dynamics of natural ecosystems in the United States. Global Biogeochem. Cycles. 17, 1045. doi: 10.1029/2001GB001508
Baker H. S., Millar R. J., Karoly D. J., Beyerle U., Guillod B. P., Mitchell D., et al. (2018). Higher CO2 concentrations increase extreme event risk in a 1.5 °C world. Nat. Climate Change 8, 604–608. doi: 10.1038/s41558-018-0190-1
Benoit P., Lachance D. (1990). Gypsy moth in Canada: behavior and control. DPC-X-32 (Forestry Canada).
Bigsby K. M., Tobin P. C., Sills E. O. (2011). Anthropogenic drivers of gypsy moth spread. Biol. Invasions. 13, 2077–2090. doi: 10.1007%2Fs10530-011-0027-6
Boisvenue C., Running S. W. (2006). Impacts of climate change on natural forest productivity–evidence since the middle of the 20th century. Global Change Biol. 12, 862–882. doi: 10.1111/j.1365-2486.2006.01134.x
Bonan G. B. (2008). Forests and climate change: forcings, feedbacks, and the climate benefits of forests. science 320, 1444–1449. doi: 10.1126/science.115512
Bugmann H. (2001). A review of forest gap models. Clim. Change 51, 259–305. doi: 10.1023/A:1012525626267
Candau J.-N., Fleming R. A. (2011). Forecasting the response of spruce budworm defoliation to climate change in Ontario. Can. J. For. Res. 41, 1948–1960. doi: 10.1139/x11-134
Chen C., Harvey J. A., Biere A., Gols R. (2019). Rain downpours affect survival and development of insect herbivores: the specter of climate change? Ecology 100, e02819. doi: 10.1002/ecy.2819
Ciesla W. M., Kruse J. J. (2009). Large aspen tortrix (US Department of Agriculture, Forest Service, Pacific Northwest Region).
Cihlar J., Beaubien J., Latifovic R. (2002). Land cover of Canada 1998. Special publication, NBIOME project. Produced by the Canada Centre for Remote Sensing and the Canadian Forest Service. Natural Resour. Canada. Available. Canada. Centre. Remote Sensing. Ottawa. Ontario.
Elkinton J., Liebhold A. (1990). Population dynamics of gypsy moth in North America. Annu. Rev. Entomol. 35, 571–596. doi: 10.1146/annurev.en.35.010190.003035
Gonsamo A., Chen J. M., Colombo S. J., Ter-Mikaelian M. T., Chen J. (2017). Global change induced biomass growth offsets carbon released via increased forest fire and respiration of the central Canadian boreal forest. J. Geophys. Res.: Biogeosci. 122, 1275–1293. doi: 10.1002/2016JG003627
Gonsamo A., Ciais P., Miralles D. G., Sitch S., Dorigo W., Lombardozzi D., et al. (2021). Greening drylands despite warming consistent with carbon dioxide fertilization effect. Global Change Biol. 27, 3336–3349. doi: 10.1111/gcb.15658
Gray D., White C., Tomlinson G. (2007). Increasing security and reducing carbon emissions of the us transportation sector: a transformational role for coal with biomass.
Greenbank D. (1956). The role of climate and dispersal in the initiation of outbreaks of the spruce budworm in New Brunswick: I. The role of climate. Can. J. Zool. 34, 453–476. doi: 10.1139/z56-048
Hanson P. J., Weltzin J. F. (2000). Drought disturbance from climate change: response of United States forests. Sci. Total. Environ. 262, 205–220. doi: 10.1016/S0048-9697(00)00523-4
Hartl-Meier C., Esper J., Liebhold A., Konter O., Rothe A., Büntgen U. (2017). Effects of host abundance on larch budmoth outbreaks in the European Alps. Agric. For. Entomol. 19, 376–387. doi: 10.1111/afe.12216
Hastie T., Tibshirani R., Friedman J. (2009). Random Forests. In: The Elements of Statistical Learning. New York, NY: Springer Series in Statistics. Springer. doi: 10.1007/978-0-387-84858-7_15
Hollaus M., Vreugdenhil M. (2019). Radar satellite imagery for detecting bark beetle outbreaks in forests. Curr. Forestry. Rep. 5, 240–250. doi: 10.1007/s40725-019-00098-z
Jakoby O., Lischke H., Wermelinger B. (2019). Climate change alters elevational phenology patterns of the European spruce bark beetle (Ips typographus). Global Change Biol. 25, 4048–4063. doi: 10.1111/gcb.14766
Jepsen J. U., Hagen S. B., Ims R. A., Yoccoz N. G. (2008). Climate change and outbreaks of the geometrids Operophtera brumata and Epirrita autumnata in subarctic birch forest: evidence of a recent outbreak range expansion. J. Anim. Ecol. 77, 257–264. doi: 10.1111/j.1365-2656.2007.01339.x
Kurz W. A., Apps M. J. (1999). A 70-year retrospective analysis of carbon fluxes in the Canadian forest sector. Ecol. Appl. 9, 526–547. doi: 10.1890/1051-0761(1999)009[0526:AYRAOC]2.0.CO;2
Lehmann J., Hansel C. M., Kaiser C., Kleber M., Maher K., Manzoni S., et al. (2020). Persistence of soil organic carbon caused by functional complexity. Nat. Geosci. 13, 529–534. doi: 10.1038/s41561-020-0612-3
Liebhold A. M., Halverson J. A., Elmes G. A. (1992). Gypsy moth invasion in North America: a quantitative analysis. J. Biogeogr. 19 (5) 513–520. doi: 10.2307/2845770
Lloyd A. H., Bunn A. G. (2007). Responses of the circumpolar boreal forest to 20th century climate variability. Environ. Res. Lett. 2, 045013. doi: 10.1088/1748-9326/2/4/045013
Lovett G. M., Christenson L. M., Groffman P. M., Jones C. G., Hart J. E., Mitchell M. J. (2002). Insect defoliation and nitrogen cycling in forests: laboratory, plot, and watershed studies indicate that most of the nitrogen released from forest foliage as a result of defoliation by insects is redistributed within the ecosystem, whereas only a small fraction of nitrogen is lost by leaching. BioScience 52, 335–341. doi: 10.1641/0006-3568(2002)052[0335:IDANCI]2.0.CO;2
Lucht W., Schaphoff S., Erbrecht T., Heyder U., Cramer W. (2006). Terrestrial vegetation redistribution and carbon balance under climate change. Carbon. Balance. Manage. 1, 1–7. doi: 10.1186/1750-0680-1-6
Lyons D. B., Liebhold A. M. (1992). Spatial distribution and hatch times of egg masses of gypsy moth (Lepidoptera: Lymantriidae). Environ. Entomol. 21, 354–358. doi: 10.1093/ee/21.2.354
Maloney J. (2019). Insect management in Canada’s forest sector: strengthening national cooperation against current and future outbreaks. Rep. Standing. Committee. Natural Resour.
Maroschek M., Seidl R., Netherer S., Lexer M. (2009). Climate change impacts on goods and services of European mountain forests. Unasylva 60, 76–80.
NDMNRF (2019) Ministry of Northern Development, Mines, Natural Resources and Forestry. Available at: https://files.ontario.ca/mnrf-forest-health-conditions-report-2019-en-2020-07-31.pdf.
NDMNRF (2020) Ministry of Northern Development, Mines, Natural Resources and Forestry. Available at: https://files.ontario.ca/ndmnrf-forest-health-conditions-2020-en-2021-07-30.pdf.
NDMNRF (2021) Ministry of Northern Development, Mines, Natural Resources and Forestry. Available at: https://www.ontario.ca/files/2022-07/mnrf-srb-forest-health-conditions-ontario-2021-en-2022-07-20.pdf.
NDMNRF (2022) Ministry of Northern Development, Mines, Natural Resources and Forestry. Available at: https://www.ontario.ca/files/2023-05/mnrf-forest-health-conditions-2022-en-2023-05-09.pdf.
Nealis V., Lomic P. (1994). Host-plant influence on the population ecology of the jack pine budworm, Choristoneura pinus (Lepidoptera: Tortricidae). Ecol. Entomol. 19, 367–373. doi: 10.1111/j.1365-2311.1994.tb00254.x
Niemann K. O., Visintini F. (2005). Assessment of potential for remote sensing detection of bark beetle-infested areas during green attack: A literature review. Natural Resources Canada, Canadian Forest Service, Pacific Forestry Centre, Victoria, BC: Mountain Pine Beetle Initiative Working Paper 2005-02.
Pilon J., Blais J. (1961). Weather and outbreaks of the spruce budworm in the Province of Quebec from 1939 to 1956. Can. Entomol. 93, 118–123. doi: 10.4039/Ent93118-2
Payette S. (2007) Contrasted dynamics of northern Labrador tree lines caused by climate change and migration lag. Ecology 88, 770–780.
Porter T., Coon M. (1991). Cytochrome p-450. multiplicity of isoforms, substrates, and catalytic and regulatory mechanisms. J. Biol. Chem. 266, 13469–13472. doi: 10.1016/S0021-9258(18)92717-1
Pureswaran D. S., De Grandpré L., Paré D., Taylor A., Barrette M., Morin H., et al. (2015). Climate-induced changes in host tree–insect phenology may drive ecological state-shift in boreal forests. Ecology 96, 1480–1491. doi: 10.1890/13-2366.1
Pureswaran D. S., Roques A., Battisti A. (2018). Forest insects and climate change. Curr. Forestry. Rep. 4, 35–50. doi: 10.1007/s40725-018-0075-6
Raven J. A., Giordano M., Beardall J., Maberly S. C. (2012). Algal evolution in relation to atmospheric CO2: carboxylases, carbon-concentrating mechanisms and carbon oxidation cycles. Philos. Trans. R. Soc. B.: Biol. Sci. 367, 493–507. doi: 10.1098/rstb.2011.0212
Régnière J., Nealis V., Porter K. (2009). Climate suitability and management of the gypsy moth invasion into Canada. Ecol. Impacts. Non-native. Invertebrates. Fungi. Terrestrial. Ecosyst., 135–148. doi: 10.1007/978-1-4020-9680-8_10
Régnière J., Powell J., Bentz B., Nealis V. (2012). Effects of temperature on development, survival and reproduction of insects: experimental design, data analysis and modeling. J. Insect Physiol. 58, 634–647. doi: 10.1016/j.jinsphys.2012.01.010
Romeiro J. M. N., Eid T., Antón-Fernández C., Kangas A., Trømborg E. (2022). Natural disturbances risks in European boreal and temperate forests and their links to climate change–a review of modelling approaches. For. Ecol. Manage. 509, 120071. doi: 10.1016/j.foreco.2022.120071
Scholze M., Knorr W., Arnell N. W., Prentice I. C. (2006). A climate-change risk analysis for world ecosystems. Proc. Natl. Acad. Sci. 103, 13116–13120. doi: 10.1073/pnas.0601816103
Seidl R., Thom D., Kautz M., Martin-Benito D., Peltoniemi M., Vacchiano G., et al. (2017). Forest disturbances under climate change. Nat. Climate Change 7, 395–402. doi: 10.1038/nclimate3303
Thom D., Seidl R. (2016). Natural disturbance impacts on ecosystem services and biodiversity in temperate and boreal forests. Biol. Rev. 91, 760–781. doi: 10.1111/brv.12193
Tobin P. C., Sharov A. A., Liebhold A. A., Leonard D. S., Roberts A. E., Learn M. R. (2004). Management of the gypsy moth through a decision algorithm under the STS project. Am. Entomol. 50, 200–209. doi: 10.1093/ae/50.4.200
Volney W. J. A., Fleming R. A. (2000). Climate change and impacts of boreal forest insects. Agricult. Ecosyst. Environ. 82, 283–294. doi: 10.1016/S0167-8809(00)00232-2
Wellington W., Fettes J., Belyea R., Turner K. (1950). Physical and biological indicators of the development of outbreaks of the spruce budworm, Choristoneura fumiferana (Clem.) (Lepidoptera: Tortricidae). Can. J. Res. 28, 308–331. doi: 10.1139/cjr50d-021
Williams D., Liebhold A. (1997). Latitudinal shifts in spruce budworm (Lepidoptera: Tortricidae) outbreaksand spruce-fir forest distributions with climate change. Acta Phytopathol. Entomol. Hungarica. 32, 205–215.
Woodman S. G., Khoury S., Fournier R. E., Emilson E. J., Gunn J. M., Rusak J. A., et al. (2021). Forest defoliator outbreaks alter nutrient cycling in northern waters. Nat. Commun. 12, 6355. doi: 10.1038/s41467-021-26666-1
Keywords: spongy moth, jack pine budworm, spruce budworm, remote sensing, Ontario Canada, insect defoliation, climate change, machine learning
Citation: Kalamandeen M, Gulamhussein I, Castro JB, Sothe C, Rogers CA, Snider J and Gonsamo A (2023) Climate change and human footprint increase insect defoliation across central boreal forests of Canada. Front. Ecol. Evol. 11:1293311. doi: 10.3389/fevo.2023.1293311
Received: 12 September 2023; Accepted: 24 October 2023;
Published: 14 November 2023.
Edited by:
Prof-Maged Marghany, Syiah Kuala University, IndonesiaReviewed by:
Marcello Vitale, Sapienza University of Rome, ItalyAnneli Poska, Lund University, Sweden
Copyright © 2023 Kalamandeen, Gulamhussein, Castro, Sothe, Rogers, Snider and Gonsamo. This is an open-access article distributed under the terms of the Creative Commons Attribution License (CC BY). The use, distribution or reproduction in other forums is permitted, provided the original author(s) and the copyright owner(s) are credited and that the original publication in this journal is cited, in accordance with accepted academic practice. No use, distribution or reproduction is permitted which does not comply with these terms.
*Correspondence: Jose Bermudez Castro, YmVybXVkZWpAbWNtYXN0ZXIuY2E=; Michelle Kalamandeen, bWljaGVsbGVrYWxhbWFuZGVlbkBvdXRsb29rLmNvbQ==
 Michelle Kalamandeen
 Imran Gulamhussein
 Jose Bermudez Castro
 Camile Sothe2
 Cheryl A. Rogers
 James Snider