- 1Northwest Engineering Corporation Limited, Xi’an, China
- 2Shaanxi Union Research Center of University and Enterprise for River and Lake Ecosystems Protection and Restoration, Xi’an, China
As earth surface human activities become more frequent, global ecosystem service functions and especially biodiversity maintenance functions are challenged. This study aimed to analyze spatiotemporal changes in Xi‘an section of the northern foothills of the Qinling Mountains from 1990 to 2020. Temporal and spatial changes in habitat quality in the study area were visualized using InVEST model and land use data, and factors affecting habitat quality were analyzed using Geodetector. The results showed that during the study period, the cultivated land, grassland, and water decreased by 16.40%, 74.37%, and 35.39%, respectively, while the area of forest land and construction land increased, among which the construction land increased by 117.70%, the largest increase, and the forest land increased by 8.47%. The main changes in land use are the conversion of cultivated land into forest land and construction land, and the conversion of grassland into forest land and cultivated land. During the period 1990–2020, the average habitat quality index in the study area changed from 0.8617 to 0.8585, showing a slow decreasing trend. The spatial distribution of habitat quality showed a trend of “high in the south, moderate in the north, and low in the northwest”. The high habitat quality was mainly concentrated in the southern forest land, the middle habitat quality was mainly distributed in the northern cultivated land, and the low habitat quality was mainly distributed in the northwest construction land. The land use type has a great influence on habitat quality, and the interaction between any two factors is stronger than that of a single factor. The temporal and spatial variation of habitat quality is influenced by both natural and human factors. This study provides a theoretical basis for ecological protection and nature reserve planning in the Qinling Mountains region.
Introduction
Habitat quality (HQ) can represent the supply capacity of ecosystem services and biodiversity in a region and is an important basis for ensuring ecological security and reflecting the pros and cons of the human living environment (Silvis, 2012; Zhang et al., 2020). In recent years, with the rapid growth of population and the continuous development of the social economy, the excessive occupation of land resources and the rapid change of land use mode has caused a series of environmental problems, resulting in serious damage to ecosystem service functions and endangering human welfare (Newbold et al., 2015; Sallustio et al., 2017; Li et al., 2020a; Li et al., 2020b). Therefore, it is of great practical significance for realizing sustainable development of resources and maintaining ecosystem security to analyze and study the habitat quality in the region and evaluate the changing trend of the ecosystem service function.
The methods of habitat quality assessment are mainly divided into the quantitative index method and model method. The quantitative index method is to obtain the relevant parameters of habitat quality through field investigation and construct an evaluation index system for comprehensive evaluation (Wynne and Côté, 2007; Yang et al., 2021a). Due to the large amount of human and material resources invested in the evaluation process and the lack of universality, it is not suitable for large-scale regional and long-term time series research (Chen et al., 2019; Muñoz-Barcia et al., 2019). The model rule uses mathematical models to quantitatively assess habitat quality, which has the advantages of convenience, speed, and low cost (Moreina et al., 2018). ARtificial Intelligence for Ecosystem Services (ARIES), Social Values for Ecosystem Services (SoIVES), and Integrated Valuation of Ecosystem Services and Trade-offs (InVEST) are widely used in related research (Bagstad et al., 2011; Mushet et al., 2014; Sherrouse et al., 2014; Huang et al., 2020). Among these models, the InVEST model jointly developed by Stanford University, the World Wide Fund for Nature, and The Nature Conservancy is the most well-developed, with advantages such as easy access to data and strong visibility of results (Huang et al., 2020).
Qianqian et al. (2022) analyzed the habitat quality and degree of degradation in the Ebinur Lake Basin of Xinjiang from 1990 to 2020, and predicted the spatiotemporal changes in habitat quality in the Ebinur Lake Basin under inertial development and ecological protection scenarios. Cao et al. (2017) studied the impact of the urbanization process on ecosystem service function in Zhoushan Island and revealed the response relationship between urban expansion encroachment on other land use types and temporal and spatial changes in habitat quality. Pan et al. (2022) explored the temporal and spatial changes in habitat quality in the source region of the Yellow River and analyzed the effects of vegetation cover change and human activities on habitat quality combined with NDVI and land use data. Wang and Cheng (2022) conducted a study on the spatial aggregation characteristics of habitat quality under different topographies using DEM, and analyzed the distribution patterns of habitat quality in different altitude areas. At present, a large number of studies mainly explore the characteristics of habitat quality changes based on different land use, climate types, geomorphic features, and altitude (Arunyawat and Shrestha, 2016; Wu et al., 2021; Zhang et al., 2022a). However, there are relatively few studies on the spatiotemporal evolution of habitat quality in complex areas in geographical transition regions.
As an important natural geographical transition area in China, the Qinling Mountains plays a key role in water conservation and biodiversity maintenance, has important ecological service value, and is an indispensable natural ecological barrier in China (Li et al., 2013; Zhang et al., 2017; Zhang et al., 2019). However, the climate, terrain, and biological species of Qinling Mountain are complex and varied, and its ecological environment has obvious spatial differences under the dual influence of climate change and human activities (Shu-Yan, 2002), which has become the main focus of most studies at present (Ma et al., 2019; Zhao et al., 2021; Zhang et al., 2022b). Ting et al. (2014) evaluated the ecological benefits of soil and water conservation in the Qinling Mountains region using the InVEST model. Ning et al. (2020) analyzed the spatiotemporal changes in the water conservation function of the Qinling Mountains. These studies mostly focus on the evaluation of ecosystem service functions in the Qinling Mountains, lacking research on the spatiotemporal changes of habitat quality over a long time series. Xi’an, at the northern foothills of the Qinling Mountains, has always had a large population and high intensity of human activities, which have a profound impact on the natural environment. Especially in recent years, with the continuous advancement of urbanization and the rapid increase of urban construction land, the natural ecosystem and ecological functions in the region have been affected (Zhou and Li, 2017; Li et al., 2019). Therefore, based on NDVI, land use, night light, and other data, this paper uses InVEST model to analyze the temporal and spatial changes of habitat quality in the Xi’an section of the northern foothills of the Qinling Mountains from 1990 to 2020 and discusses the impact of urban expansion on habitat, to provide the scientific basis for ecological civilization construction in the Qinling Mountains.
Materials and methods
Study area
Referring to the narrow definition of the Qinling Mountains as defined in the “Overall Plan for Ecological Environment Protection in Qinling Mountains, Shaanxi Province” (http://www.shaanxi.gov.cn/zfxxgk/zfgb/2020/d17q/202009/t20200921_1728563.html), the northern and southern slopes of Qinling Mountain and the eastern and western borders of Shaanxi Province are defined as Qinling boundary. Combined with the administrative division of Xi’an City, the Xi’an section at the northern foothills of the Qinling Mountains was selected as the study area (Figure 1). The geographical range was 107°24′–109°49′E, 33°45′–34°22′N, the climate type is the warm temperate semi-humid climate, and the vegetation is mainly warm temperate deciduous broad-leaved forest.
Data source
The land use raster datasets with 30 m resolution ratio of the Qinling mountains in 1990, 2000, 2010 and 2020, the Normalized Differential Vegetation Index (NDVI), night light, temperature, and precipitation data resolution ratio were acquired from the Resource and Environment Science and Data Center (http://www.resdc.cn). Among them, land use data is obtained from the visual interpretation of landSat 8 remote sensing images, The annual dataset of night light is processed based on DMSP/OLS and NPP-VIIRS satellite night light remote sensing image data, precipitation and air temperature grid data is generated based on the spatial interpolation of Anuspl interpolation software, and NDVI data is obtained by the maximum synthesis method of remote sensing images. DEM data is downloaded from Geospatial data (http://www.gscloud.cn/). The population density data with 1 km resolution ratio are derived from the worldpop database (www.worldpop.org.uk). Traffic data are from the National Geographic Information Center of China (https://www.ngcc.cn). All raster data unified the resolution to 30 m using resampling and clipped by the study area for Geodetector analysis.
Methods
Assessment of habitat quality
Referring to the principle of InVEST model, the calculation formula of habitat quality is as follows:
Where: Dxj is the degree of habitat degradation in the grid cell x with habitat type j, and R is the number of potential threats. Yr is the grid number of r on the grid plot; ry is the strength of the grid cell y; ω rrepresents the weight of the threat source; the distance between the habitat and the threat source is represented by irxy. βx represents the antiinterference level of the grid cell x; Sjr indicates the relative sensitivity of habitat type j to the threat source r; dxy represents the distance between grid cells x and y; and dr max represents the maximum impact distance of the threat source.
Where: Qxj is the habitat quality of pixel x in land-use/cover type j, Dxj is the threat level of pixel x in land-use/cover type j, Hj is the habitat suitability of land-use/cover type j, and K is half the saturation constant (which is half of the maximum value of Dxj). z is a default parameter in the model and is set as 2.5 (Chen et al., 2021).
InVEST’s habitat quality model is based on land use data, habitat threat source data, habitat threat source weights, sensitivity of different land classes to threat sources, and habitat suitability of local classes. Many studies have selected different threats factors and related parameters, this study referred to the InVEST model manual (Sharp et al., 2020) and other relevant studies (Fan et al., 2021; Cui et al., 2022; Qianqian et al., 2022), based on the spatial scale of this study and expert consultation, the relevant parameters are determined as follows (Tables 1, 2):
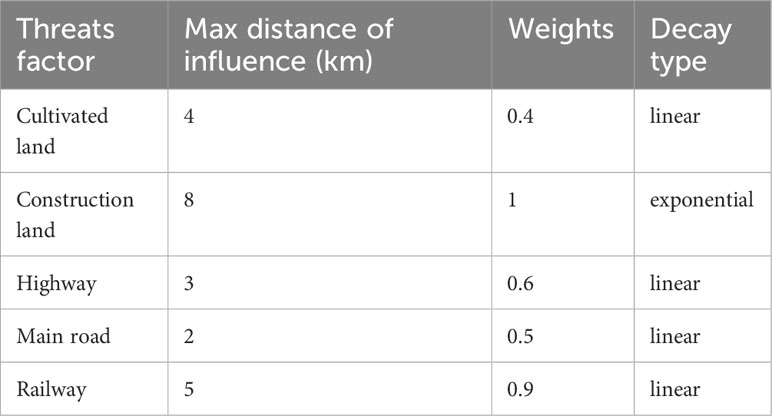
Table 1 Threat factors and maximum effect distances, weights of threat factors, and decay types identified in the study area.
Where: The max distance of influence is defined as the maximum range of the threats factors on the quality of surrounding habitats, the weight represents the relative destructiveness of threats factors to all habitats, which the value range is [0,1]. Decay type is used to describe the attenuation of environmental threats by threats factors as distance increases, divided into linear attenuation and exponential attenuation (Sharp et al., 2020).
Where: The sensitivity parameters included habitat suitability parameters for each land use type and sensitivity parameters of each land use type to stressors, all ranging from 0 to 1.
Geodetector
Geodetector is a model used to detect the spatial heterogeneity of geographical elements and identify the interaction between multiple factors. Through the analysis based on the spatial stratification characteristics of variables rather than linear relationships, the explanatory power and mutual relationship of different factors on habitat quality can be truly and accurately reflected (Ma et al., 2022; Chen et al., 2023). Detectors are divided into four types: factor detector, ecological detector, interaction detector, and risk detector, which are widely used in the ecological research field (Jing et al., 2017; Sun et al., 2021; Qu et al., 2022). In this study, an interaction detector was used to analyze the interaction between different factors. The calculation formula is as follows:
where i (i = 1, 2,…, l) is the stratification of dependent variable y or independent variable %, i.e., classification or partition; ni and n are the unit numbers of layer i and the whole region, respectively; and σ2 are the variances of layer i and region Y, respectively; SSW and SST are the sum of variances within the layer and the total variances of the whole region, respectively; and the value range of q is [0, 1], where the larger the value, the stronger the explanatory power of independent variable % to dependent variable y.
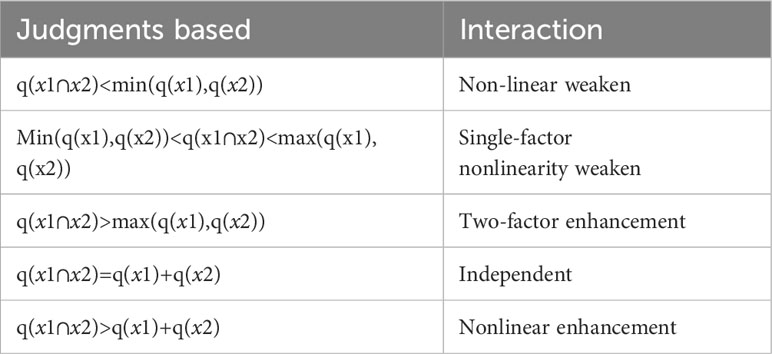
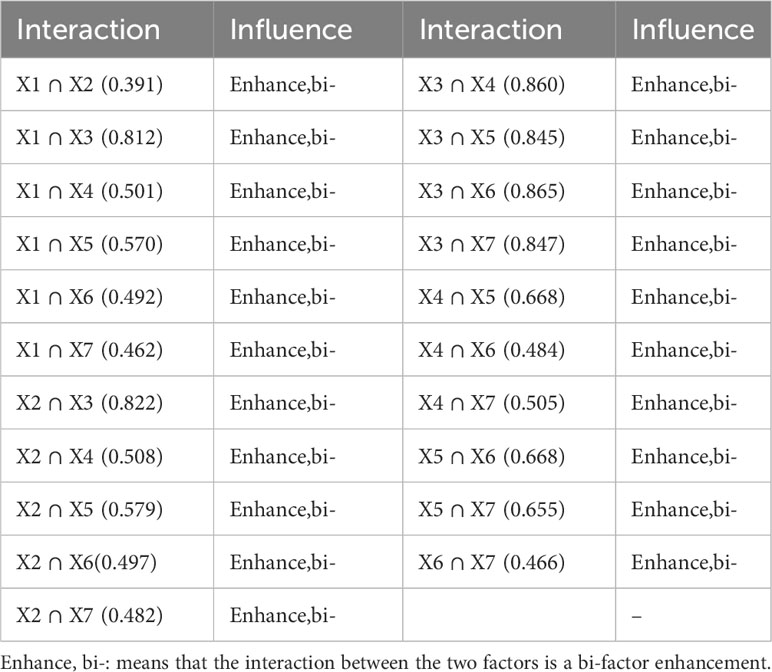
The interaction detector is to determine the interaction between various factors and assess whether multiple factors work together to increase or reduce the driving force of HQ, or whether there is an interaction between these factors (Table 3). The habitat quality of the ecosystem is the result of the interaction of multiple factors. In terms of natural factors, considering the influence of topography and climate, the distribution of vegetation is closely related to topography, and the distribution of vegetation in different land forms is quite different, which affects the habitat quality. Therefore, elevation are selected as influence factors in terms of topographic factors. Land use type influences the spatial distribution of habitat quality, so land use data was chosen as the influence factor. Climate factors on land cover affect habitat quality, so precipitation and temperature are selected as influence factors; vegetation can reflect habitat quality to some extent, and vegetation growth through the vegetation normalization index (NDVI). In terms of socioeconomic factors, population density and the night light index are important indicators of the intensity of human activity, which can also have an impact on habitat quality. The habitat quality is used as the dependent variable, and the natural break point method is used as the independent variable. Habitat quality was treated as dependent variable and each driver as independent variable and discretized by natural break point method. The ArcGIS software was used to create fishing nets, and the sampling interval was set at 1 km after multiple debugging. The spatial analyst-extraction analyst-sampling tool was used to input the independent variable and dependent variable layer. The sampling point was the fishing net point in the study area, and the values of the independent variables and dependent variables were extracted and input into the geographic detector model.
Results
Land-use change in the northern foothills of the Qinling Mountains
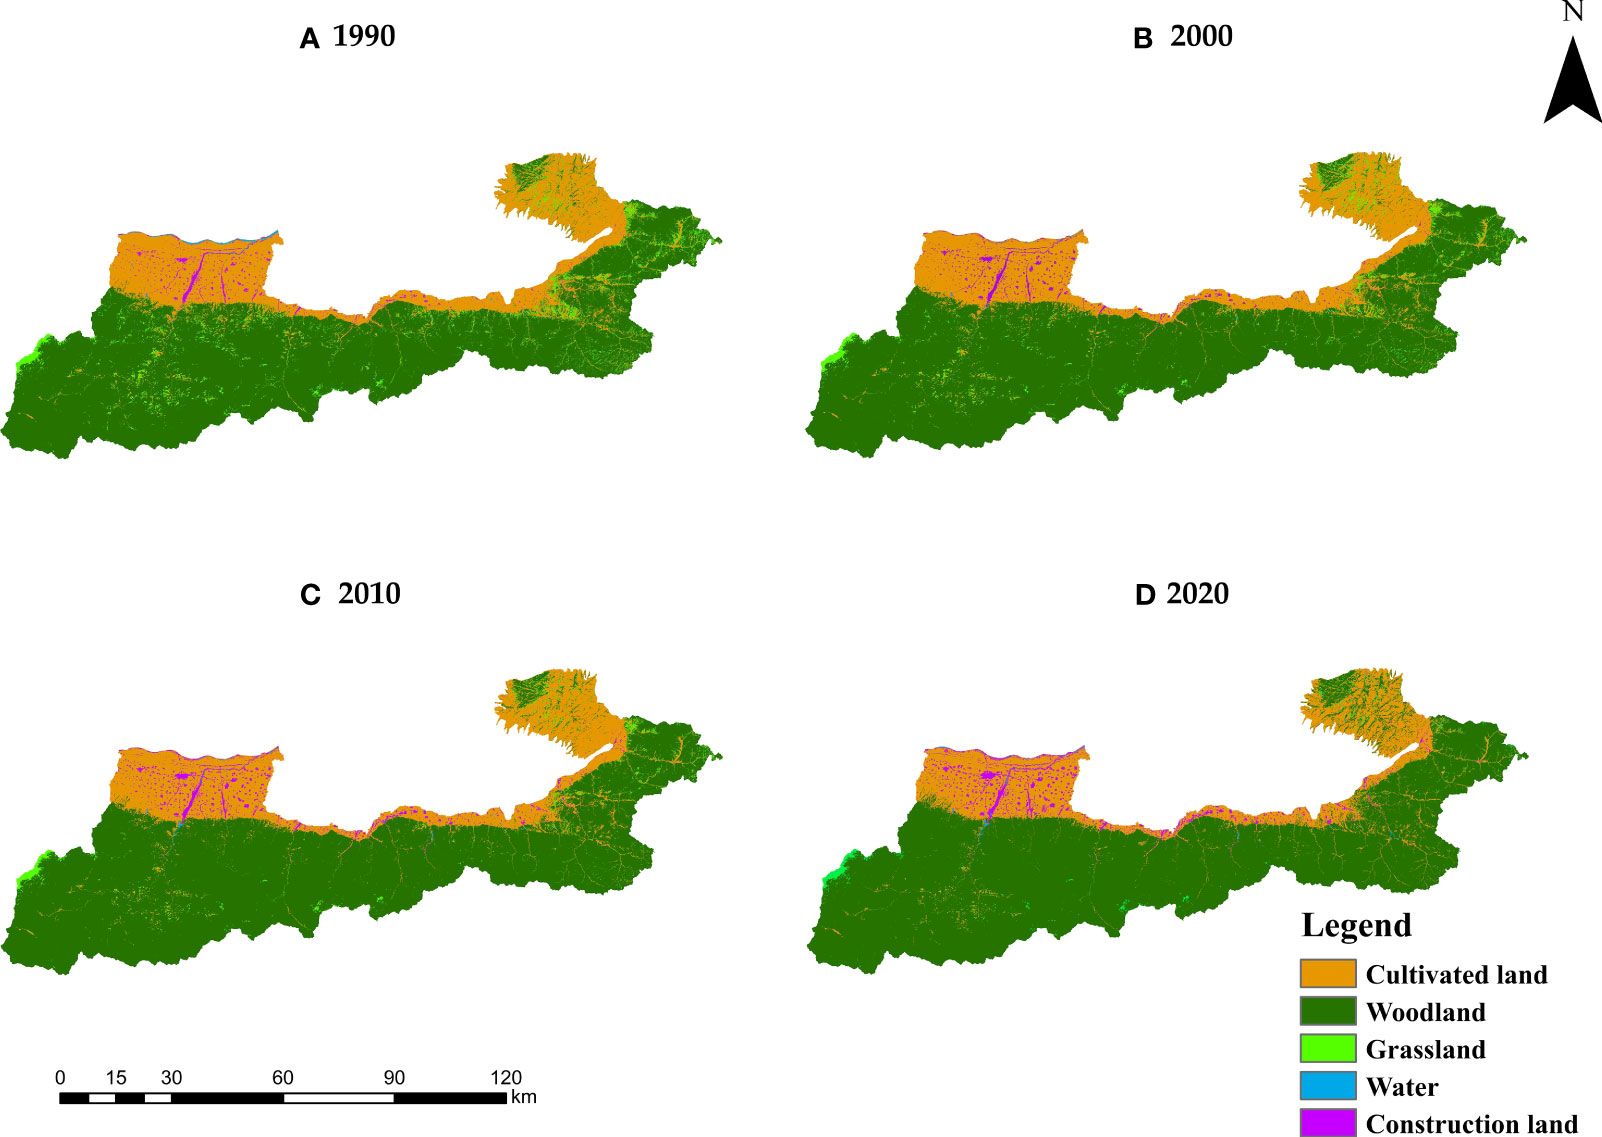
Land use changed dramatically during 1990–2020 as in Table 4. The cultivated land and grassland showed a continuous decreasing trend, decreasing by 16% and 74% respectively. Forest land and construction land showed a trend of continuous growth, increasing by 8% and 118% respectively. Water area shrank significantly during 1990 to 2000, however, it has increased between 2000 to 2020. As shown in the graph below, the major types of land use in the study are forest land and cultivated land. In the study cultivated land is mainly distributed in the north of the study area which account for about 24% of the total area; where forest land is primarily distributed in the southern part of the study area and it account for about 70% of the total area; The remainder grassland and water area is distributed dismissively. Lastly, the construction land is mainly distributed in the northwest of the study area.
This research is based on the four stages land use data (Figure 2), combined with the land use transfer matrix. From 1990 to 2020, land use transformation in the study area mainly involves cultivated land, forest land, grassland, and construction land (Table 5). The cultivated land was mainly changed into forest land of 240.22 m2, indicating that the project of returning farmland to forest was implemented in the local area during the study period. In addition, 90.35 km2 of cultivated land has been transformed into construction land, indicating that the urbanization of urban suburbs is relatively significant. The forestland mainly flows into cultivated land, which accounts for about 77% of the forestland outflow area. 190.05 km2 and 38.64 km2 of grassland were mainly converted into forest land and cultivated land. The water area is mainly converted into cultivated land and construction land, both of which are 4.87 km2. Construction land was mainly converted into cultivated land, with an area of 8.23 km2, accounting for 79% of the transferred area.
Temporal and spatial variation of habitat quality
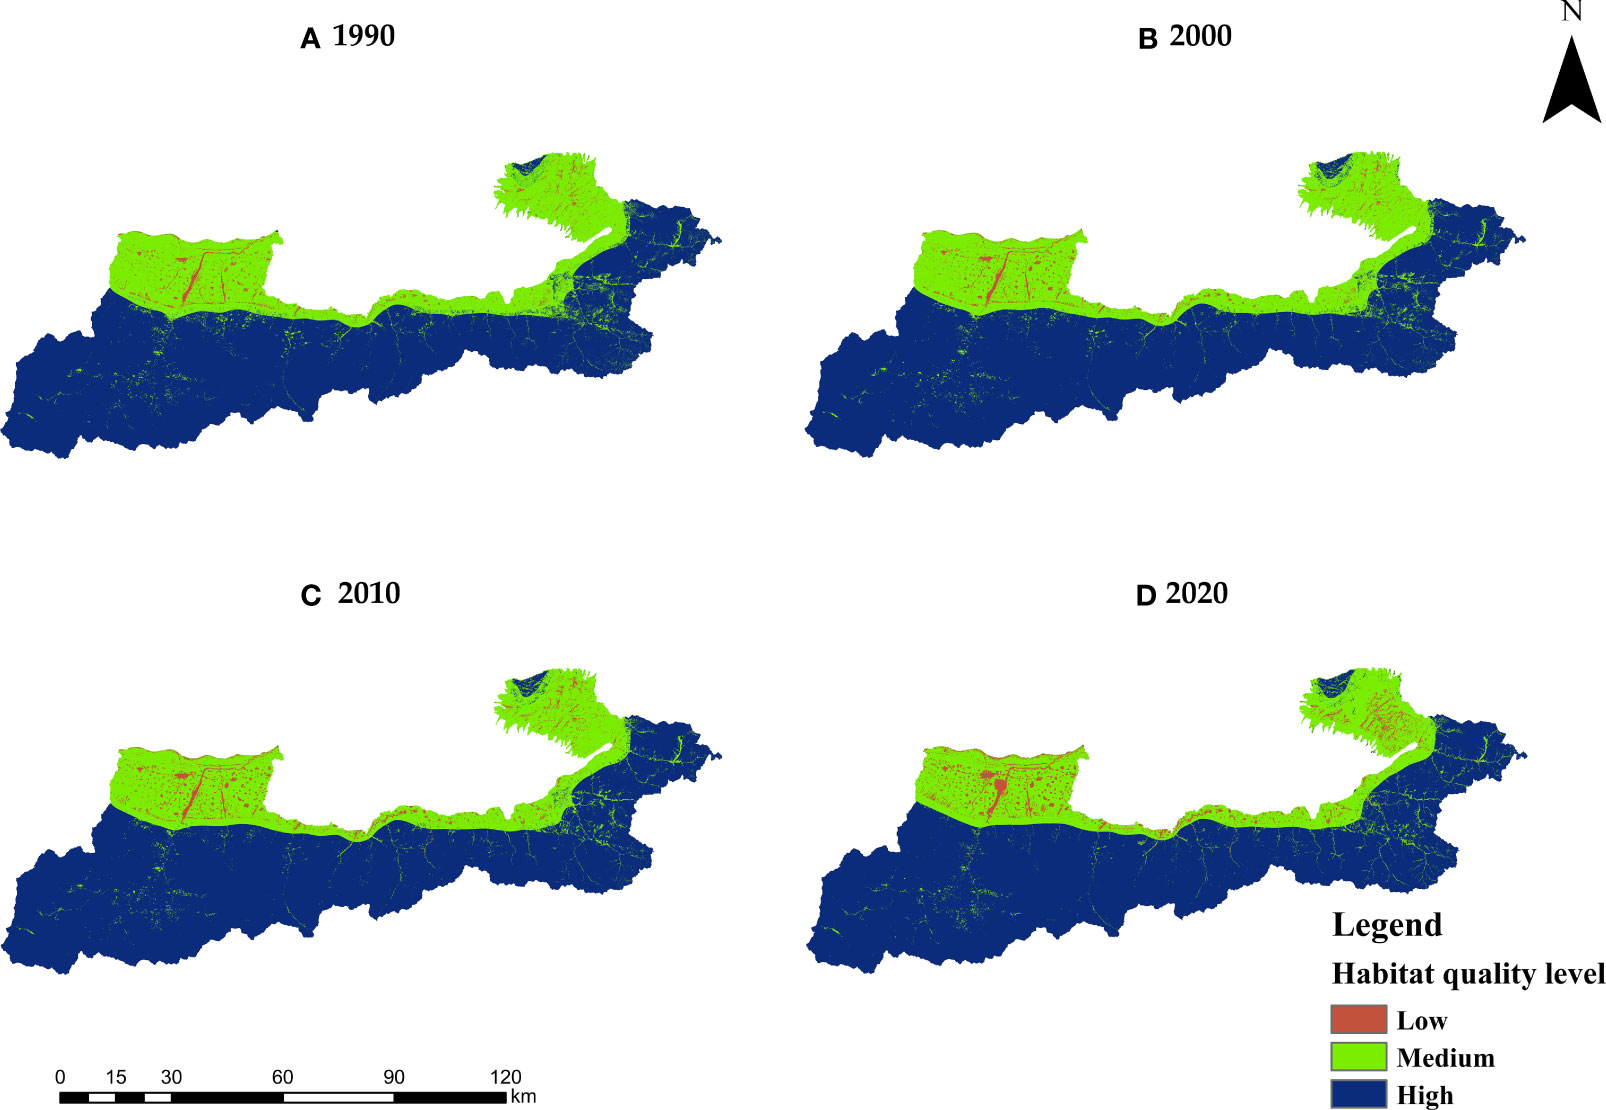
Natural break-point method is often used for grading the results of habitat quality, most studies generally classify the habitat quality level into 3 or 5 levels (Fan et al., 2021; Yang et al., 2021b; Cui et al., 2022; He et al., 2023). Using the natural breakpoint method, based on the calculation results of the habitat quality and the range of the study area, the habitat quality retention at 1 decimal point from 1990 to 2020 was divided into three levels: low (0–0.4), medium (0.4–0.8), and high (0.8–1.0). Habitat area and percentage at each level in the four periods are summarized below (Table 6). From the perspective of time scale, the mean value of habitat quality in the study area decreased slightly during 1990–2020, but the range of change was small. The mean values were 0.8617, 0.8629, 0.8604, and 0.8585. Overall, the area proportion of high-quality habitat increased, the area of medium-quality habitat gradually decreased, and the area of low-quality habitat increased slowly.
From a spatial perspective (Figure 3), regions with high habitat quality were mainly distributed in the southern mountains of the study area, where regions with low habitat quality were mainly distributed in the northwestern part of the study area, and regions with medium habitat quality were mainly distributed in the northern part of the study area. The habitat quality of construction land is low. The land type of the region with high habitat quality is mainly forest land, the land type of the region with medium habitat quality is mainly cultivated land, and the land type of the region with low habitat quality is mainly construction land.
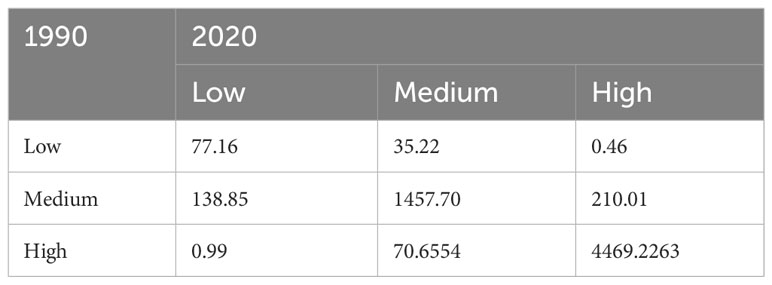
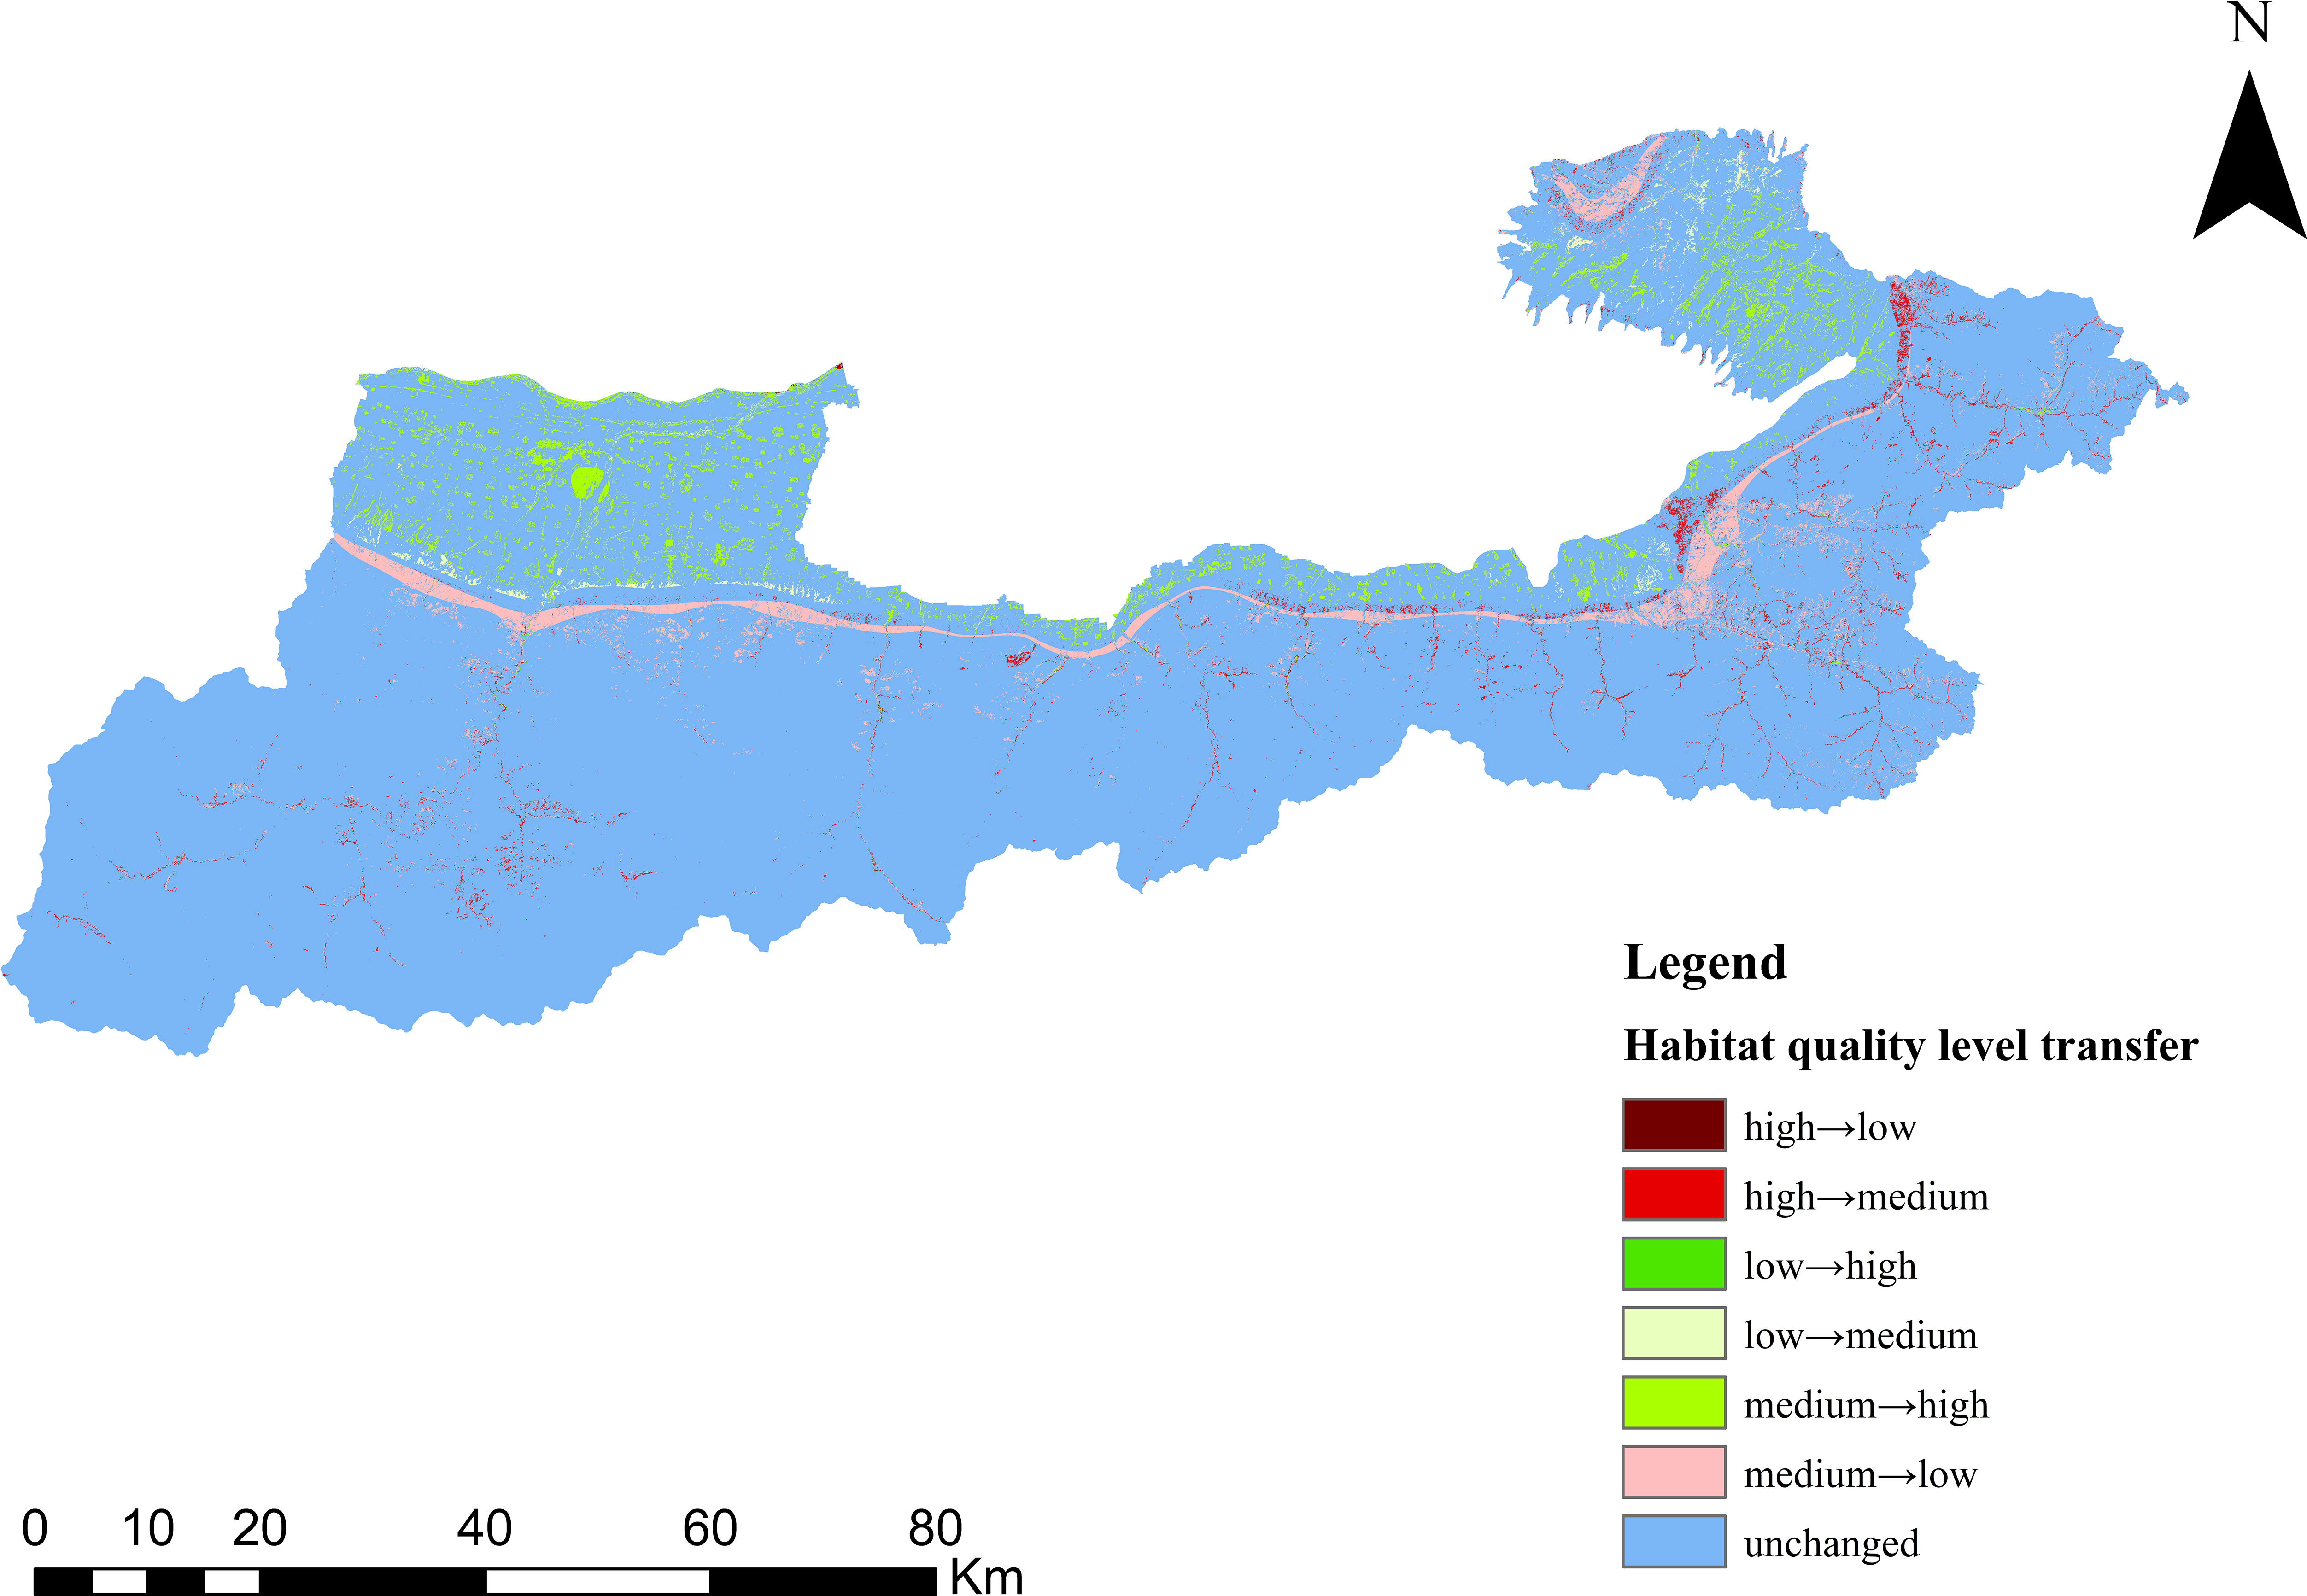
To further understand the spatiotemporal variation characteristics of habitat quality in the study area, the arcgis10.8 software was used to make the spatiotemporal variation map of habitat quality levels in the study area from 1990 to 2020 (Figure 4). During 1990–2020, habitat quality levels in most areas of the study area remained stable (Table 7). About 93% of the total area of the habitat quality grade remained unchanged, about 5% of the total area of the habitat quality grade increased, and about 2% of the total area of the habitat quality grade decreased. medium to high area accounts for about 3% of the total area, showing an east-west zonal distribution in space, mainly distributed in the area of human production and living and the border zone of high-altitude mountains. Low to medium areas are mainly distributed in the northeast of the study area, and High to medium areas account for about 2% of the total area, mainly distributed in the eastern part of the study area and scattered in the southern mountain settlements. The area of Medium to low is mainly distributed in the northern part of the study area where the altitude is lower and the population is denser.
Factors influencing spatial variations in HQ
Single factor analysis
The results of the geographic detector analysis (Table 8) show that there are differences in the driving forces (q values) of various factors affecting the change of HQ. The order of q value is land use type (X3) > NDVI (X5) > altitude (X4) > temperature (X6) > precipitation (X7) > population density (X2) > night light index (X1). Thus, land use type was identified as the key factor affecting HQ change (q = 0.788), followed by NDVI (q = 0.467). Temperature, rainfall, population density, elevation, and night light index are weak in explaining the spatial variation of habitat quality, but these factors need to be considered. In general, natural factors (land use type, NDVI) had a significant impact on the spatial distribution pattern of habitat quality, and its q value was greater than that of terrain (altitude), meteorological (precipitation, temperature), and social economy (night light index, population density).
Analysis of interactions between bi-factors
The driving force of two-factor interaction on HQ was analyzed using the interaction detector of the geographical detector. The results (Table 9) show that the q value of two-factor interaction is greater than that of a single factor. The interaction was characterized by two-factor enhancement. The most significant interaction effect on spatial variation of habitat quality is land use ∩ temperature (0.865), followed by land use ∩ altitude (0.860). When one dominant single factor (land use type) is combined with another factor, the interaction of dominant factors is most significant, indicating that different land use types determine the distribution pattern of ecosystem types. The interaction of NDVI with precipitation, temperature, and elevation showed a considerable driving force, indicating that natural factors such as temperature, precipitation, and slope had a certain impact on the change of land use type and habitat quality. While the single-factor drivers of nighttime lighting and population density are low, interactions with other factors outweigh the single-factor drivers.
Discussion
In this study, the InVEST habitat quality model and interactive detector were applied to analyze the temporal and spatial changes and influencing factors of habitat quality in the Xi’an section of the northern foothills of the Qinling Mountains from 1990 to 2020, which has great practical significance in the protection of ecological diversity and the construction of ecological civilization in the Qinling Mountains.
The relationship of land use change and habitat quality
Land use change is the direct reflection of the interaction between humans and the natural environment, it is also an important reason for changes in habitat quality (Li S. et al., 2020a). Research shows that the land use of the northern foot of the Qinling Mountains has changed enormously in the past 30 years; cultivated land, forest land, and construction land are the main types of land use in the region.And the area of cultivated land and grassland continued to decrease between 1990 and 2020, while the area of construction land continued to increase, the development of social economy and the rapid expansion of cities have been the main reasons for the rapid changes in land use in China in recent decades (Ma et al., 2022; Qu et al., 2022).
There is a certain response relationship between the spatiotemporal changes in habitat quality and land use changes. From 1990 to 2020, the mean value of habitat quality in the northern foot of the Qinling Mountains decreased slightly, showing an overall trend of first increasing and then decreasing. The areas with improved habitat quality are mainly concentrated in the north and central regions, these areas are supported by a series of ecological protection policies such as returning farmland to forests, naturally protected forest (Liu et al., 2018). Therefore, the land use in this region has mostly shifted from arable land to forest land. The areas with declining habitat quality are mainly concentrated in the densely populated areas of Xi’an, including the northern urban areas and towns in the southern mountainous areas, during the period from 1990 to 2020, the area of construction land more than doubled. The rising industry of tourism in the northern foot of the Qinling Mountains has promoted the construction of rural infrastructure and economic development in the area on one side; on the other side, it negatively impacted on the local ecosystem which resulting in the decline of habitat quality (Zhang S. et al., 2022; Han et al., 2023).
Despite the support of various government policies, the habitat quality of the northern foothills of the Qinling Mountains continued to decline from 1990 to 2020, mainly due to the continuous increase in construction land. However, there is a clear boundary between medium and high habitat quality in the northern foothills of the Qinling Mountains, distributed in the central region, and the habitat quality in this region is continuously improving. This indicates that the government has to some extent clarified the boundary between human activities and nature, and has constrained the scope of human activities through a series of measures such as returning farmland to forests, demolishing illegal buildings, and establishing nature reserves (Liu et al., 2018; Chen, 2019). In addition, as the growth rate of China’s population slows down, the scale of urban expansion tends to stabilize (Hou et al., 2022), which will provide favorable conditions for the continuous improvement of habitat quality in the region.
Driving factors of habitat quality
During the study period, land use type was the main determinant of habitat quality, this is consistent with previous research results (Cui et al., 2022). followed by the NDVI index, which had a strong impact on habitat quality and was an important parameter reflecting vegetation growth status and coverage in the region. NDVI is closely related to habitat quality, which is different from Zhang X. et al. (2022a). Differences in the geographical environment of the study area led to different drivers of habitat quality. The interaction test results show that natural factors and social factors have a significant influence on the temporal and spatial changes of habitat quality in the study area. The interaction of all factors enhanced the impact on habitat quality, indicating that the interaction of two factors was much greater than that of single factors. The interaction between land use and other factors was significantly stronger than the interaction between other factors, indicating that land use was the main factor affecting habitat quality change. This indicates that the biodiversity maintenance function of the ecosystem is affected by many factors, but the land bearing the ecosystem is a decisive factor for the habitat quality of the ecosystem.
Limitations
In this study, the quantitative and computational results of HQ are visualized by the InVEST-HQ model. However, there are some limitations to our study. First of all, the regional scale results can only be used as a reference for the relationship between LULC changes and HQ changes in the northern foot of the Qinling Mountains. It is necessary to carry out large-scale and more comprehensive research on the study area to formulate appropriate ecological protection measures. Secondly, due to the limitation of data, this study only considers the impact of internal threat sources on the headquarters but does not evaluate the impact of threat sources outside the study area, so it may affect the evaluation results of HQ. Similarly, previous studies have shown that the internal mechanisms of habitat quality are complex and vary greatly in different regions, which may lead to unclear results. Further research is needed on the accuracy of regional headquarters assessments based on field survey data parameters. In addition, due to the limited data collected, although the resolution of the driver layer data is unified by resampling, there are still some uncertainties in the analysis of the geographic detector model, which needs to be further explored in future studies.
Conclusions
This research is completed using the InVEST-HQ model and Geodetector were used to study the spatiotemporal changes of the Xi’an section at the northern foothills of the Qinling Mountains and the factors driving the changes of the headquarters.The main conclusions are as follows:
During 1990–2020, the main land use types in the northern foothills of the Qinling Mountains are forest land, cultivated land, and grassland. The area of cultivated land, grassland, and water area decreased by 16.40%, 74.37%, and 35.39%, respectively, while the area of forest land, construction land, and water increased by 8.47% and 117.70%, respectively.
During 1990–2020, the average habitat quality index in the study area first increased and then decreased. The spatial distribution of habitat quality was high in the south, moderate in the north, and low in the northwest.
The single interactive factor detection results of the geodetic detector show that LULC is the main driving force for the change of HQ, followed by natural factors such as NDVI and altitude. Socioeconomic factors such as population density and GDP are secondary drivers of HQ.
Data availability statement
The original contributions presented in the study are included in the article/Supplementary Material. Further inquiries can be directed to the corresponding author.
Author contributions
LM: Conceptualization, Funding acquisition, Writing – review & editing. CW: Conceptualization, Writing – review & editing. LW: Formal analysis, Methodology, Visualization, Writing – original draft. SJ: Formal analysis, Visualization, Writing – original draft. XK: Software, Writing – original draft.
Funding
The author(s) declare financial support was received for the research, authorship, and/or publication of this article. This work was jointly supported by the Natural Science Basic Research Program of Shaanxi (Program No.2021JLM-56).
Conflict of interest
Authors LM, CW, LW, SJ, and XK were employed by Northwest Engineering Corporation Limited.
Publisher’s note
All claims expressed in this article are solely those of the authors and do not necessarily represent those of their affiliated organizations, or those of the publisher, the editors and the reviewers. Any product that may be evaluated in this article, or claim that may be made by its manufacturer, is not guaranteed or endorsed by the publisher.
Supplementary material
The Supplementary Material for this article can be found online at: https://www.frontiersin.org/articles/10.3389/fevo.2023.1284281/full#supplementary-material
References
Arunyawat S., Shrestha R. P. (2016). Assessing land use change and its impact on ecosystem services in northern Thailand. Sustainability 8 (8), 768. doi: 10.3390/su8080768
Bagstad K. J., Villa F., Johnson G. W. (2011). ARIES— artificial intelligence for ecosystem services: A guide to models and data, version 1.0[R/OL] (Burlington, VT: ARIES).
Cao W., Li R., Chi X., Chen N., Chen J., Zhang H., et al. (2017). Island urbanization and its ecological consequences: A case study in the Zhoushan Island, East China. Ecol. Indic. 76 (may), 1–14. doi: 10.1016/j.ecolind.2017.01.001
Chen M., Bai Z., Wang Q., Shi Z. (2021). Habitat quality effect and driving mechanism of land use transitions: a case study of henan water source area of the middle route of the south-to-north water transfer project. Land 10. doi: 10.3390/land10080796
Chen M., Su X. L., Huang H. M., Gao T. (2019). Assessment of river habitat quality in the Three Gorges Reservoir Region. Acta Ecologica Sin. 39 (1), 192–201.
Chen Y. P. (2019). Significance and strategies on the ecological civilization construction at Qinling Mountains . J. Earth Environ. 10 (1), 1–11. doi: 10.7515/JEE182056
Chen X., Qin J., Yao J., Yang Z., Li X. (2023). The distribution and impact characteristics of small-scale carbon emissions in the Chengdu–Chongqing Region. Atmosphere 14, 216. doi: 10.3390/atmos14020216
Cui G., Zhang Y., Shi F., Jia W., Pan B., Han C., et al. (2022). Study of spatiotemporal changes and driving factors of habitat quality: a case study of the agro-pastoral ecotone in Northern Shaanxi, China. Sustainability. 14 (9), 5141. doi: 10.3390/su14095141
Fan X., Gu X., Yu H., Long A., Tiando D. S., Ou S., et al. (2021). The spatial and temporal evolution and drivers of habitat quality in the hung river valley. Land. 10, 1369. doi: 10.3390/land10121369
Han R., Chen C., Li Y., Wen Z., Li Z., Li W., et al. (2023). Response of vegetation coverage to climate changes in the qinling-daba mountains of China. Forests 14 (2), 425. doi: 10.3390/f14020425
He N., Guo W., Wang H., Yu L., Cheng S., Huang L., et al. (2023). Temporal and spatial variations in landscape habitat quality under multiple land-use/land-cover scenarios based on the PLUS-InVEST model in the Yangtze River Basin, China. Land 12, 1338. doi: 10.3390/land12071338
Hou Y., Kuang W., Dou Y. (2022). Analysis of urban expansion and fractal features in global 33 megacities from 2000-2020. Acta Geographica Sinic. 77 (11), 2687–2702.
Huang M. Y., Yue W. Z., Feng S. R., Zhang J. H. (2020). Spatial-temporal evolution of habitat quality and analysis of landscape patterns in Dabie Mountain area of west Anhui Province based on InVEST model. Acta Ecologica Sinic. 40 (9), 2895–2906. doi: 10.5846/stxb201904260858
Jing Y., Maogui H. U., Shaoying Z. (2017). Influencing mechanism of spatial distribution difference in national γ Radiation dose rate based on geographical detector. J. Geo-Information Sci. 19 (5), 625–634. doi: 10.3724/SP.J.1047.2017.00625
Li C. X., Gao X., Xi Z. L. (2019). Characteristics, hazards, and control of illegal villa (houses): evidence from the Northern Piedmont of Qinling Mountains, Shaanxi Province, China. Environ. Sci. pollut. Res. 26, 21059–21064. doi: 10.1007/s11356-019-05515-1
Li S., Zhang H., Zhou X., Yu H., Li W. (2020b). Enhancing protected areas for biodiversity and ecosystem services in the Qinghai–Tibet Plateau. Ecosystem Services 43, 101090. doi: 10.1016/j.ecoser.2020.101090
Li S., Liu J., Lin J., Fan S. L. (2020a). Spatial and temporal evolution of habitat quality in Fujian Province, China based on the land use change from 1980 to 2018. Chin. J. Appl. Ecol. 31 (12), 4080–4090. doi: 10.13287/j.1001-9332.202012.019
Li Y., Vina A., Yang W., Chen X. D., Zhang J. D., Ouyang Z. Y., Liang Z., Liu J. G. (2013). Effects of conservation policies on forest cover change in giant panda habitat regions, China. Land Use Policy. 33, 42–53. doi: 10.1016/j.landusepol.2012.12.003
Li Z., Hou P., Jiang W. G., Wang X Y., Hou J. (2023). The driving effect of land use changes on ecosystem services:a case study at the Qinling Natural Reserve. J. Beijing Normal Univ. (Natural Science) 59 (02), 196–205. doi: 10.12202/j.0476-0301.2022034
Liu S. T., Niu X., Wang B., Song Q. F., Tao Y. Z. (2018). An ecological benefit assessment of the Grain for Green Project in Shaanxi Province. ActaEcologicaSinica 38 (16), 5759–5770. doi: 10.5846/stxb201707261342
Ma L., Hong Y., Chen X., Quan X. (2022). Can green innovation and new urbanization be synergistic development empirical evidence from yangtze river delta city group in China. Sustainability 14 (10), 1–21. doi: 10.3390/su14105765
Ma X., Bai H., Deng C., Wu T. (2019). Sensitivity of vegetation on alpine and subalpine timberline in qinling mountains to temperature change. Forests 10 (12), 1105. doi: 10.3390/f10121105
Moreina M., Fonseca C., Vengilio M., Calado H., Gil A. (2018). Spatial assossment of habitat conservation status in a Macaronesian island based on theInVEST model: a case study of Pico Island ( Azores, Portugal). Land Use Policy. 78, 637–649. doi: 10.1016/j.landusepol.2018.07.015
Muñoz-Barcia C. V., Lagos L., Blanco-Arias C. A., Díaz-Varela R., Fagúndez J. (2019). Habitat quality assessment of Atlantic wet heathlands in Serra do Xistral, NW Spain. Cuadernos Investigación Geográfica. 45 (2), 533–549. doi: 10.18172/cig.3628
Mushet D. M., Neau J. L., Euliss N. H. (2014). Modeling effects of conservation grassland losses on amphibian habitat. Biol. Conserv. 174, 93–100. doi: 10.1016/j.biocon.2014.04.001
Newbold T., Hudson L. N., Hill S. L. L., Contu S., Lysenko L., Senior R. A., et al. (2015). Global effects of land use on local terrestrial biodiversity. Nature 520 (7545), 45–50. doi: 10.1038/nature14324
Ning Y. Z., Zhang F. P., Feng Q., Wei Y. F., Ding J. B., Zhang Y. (2020). Temporal and spatial variation of water conservation function in Qinling Mountain and its influencing factors. Chin. J. Ecol. 39 (9), 3080–3091. doi: 10.13292/j.1000-4890.202009.031
Pan Y., Yin Y., Hou W., Han H. (2022). Spatiotemporal variation of habitat quality in the source region of the Yellow River based on land use and vegetation cover changes. Acta Ecologica Sin. 32 (19), 1–11. doi: 10.5846/stxb202105131254
Qianqian W., Mukadasi A., Abudureheman H., Kaixuan Y., Lei Y., Hua T., et al. (2022). Temporal and spatial variation analysis of habitat quality on the PLUS-InVEST model for Ebinur Lake Basin, China. Ecol. Indicators. 145, 109632. doi: 10.1016/j.ecolind.2022.109632
Qu Z., Zhao Y., Luo M., Han L., Yang S., Zhang L. (2022). The effect of the human footprint and climate change on landscape ecological risks: A case study of the loess plateau, China. Land. 11 (2), 1–19. doi: 10.3390/land11020217
Sallustio L., De Toni A., Strollo A., Febbraro M. D., Gissi E., Casella L., et al. (2017). Assessing habitat quality in relation to the spatial distribution of protected areas in Italy. J. Environ. Management. 201 (oct.1), 129. doi: 10.1016/j.jenvman.2017.06.031
Sharp R., Douglass J., Wolny S., Arkema K., Bernhardt J., Bierbower W., et al. (2020). InVEST 3.8.7. User's Guide; Collaborative Publication by the Natural Capital Project, Stanford University, University of Minnesota, the Nature Conservancy, World Wildlife Fund. (Stanford, CA, USA: Stanford University).
Sherrouse B. C., Semmens D. J., Clement J. M. (2014). An application of Social Values for Ecosystem Services (SolVES) to three national forests in Colorado and Wyoming. Ecol. Indic. 36, 68–79. doi: 10.1016/j.ecolind.2013.07.008
Shu-Yan Y. (2002). Studies on the climate changes in the northern and the southern regions of the qinling mountains and correlated analysis between climate changes and el nino/la nina phenomenon during the recent 40 years. J. Mountain Res. 20 (4), 493–496. doi: 10.1002/mop.10502
Silvis H. (2012). The economics of ecosystems and biodiversity in national and international policy making. Eur. Rev. Agric. Economic 39 (1), 186–188. doi: 10.1093/erae/jbr052
Sun Y., Guan Q., Wang Q., Yang L., Pan H., Ma Y., et al. (2021). Quantitative assessment of the impact of climatic factors on phenological changes in the Qilian Mountains, China. For. Ecol. Management. 499 (7), 119594. doi: 10.1016/j.foreco.2021.119594
Ting L., Liu K., Sheng H. U., Bao Y. B. (2014). Soil erosion andecological benefits evaluation of Qinling Mountains based on the InVEST model. Resour. Environ. Yangtze Basin 23 (9), 1242–1250.
Wang B., Cheng W. (2022). Effects of land use/cover on regional habitat quality under different geomorphic types based on InVEST model. Remote Sens. 14, 1279. doi: 10.3390/rs14051279
Wu L., Sun C., Fan F. (2021). Estimating the characteristic spatiotemporal variation in habitat quality using the inVEST model—A case study from Guangdong–Hong Kong–Macao greater bay area. Remote Sens. 13 (5), 1008. doi: 10.3390/rs13051008
Wynne S. P., Côté I. M. (2007). Effects of habitat quality and fishing on Caribbean spotted spiny lobster populations. Appl. Ecol. 44, 488–494. doi: 10.1111/j.1365-2664.2007.01312.x
Yang H., Huang Q., Zhang J., Songer M., Liu J. (2021a). Range-wide assessment of the impact of China's nature reserves on giant panda habitat quality. Sci. Total Environment. 769, 145081. doi: 10.1016/j.scitotenv.2021.145081
Yang Z., Wang S., Guo M., Tian J., Zhang Y. (2021b). Spatiotemporal differentiation of territorial space development intensity and its habitat quality response in Northeast China. Land. 10, 573. doi: 10.3390/land10060573
Zhang H. J., Gao Y., Hua Y. W., Zhang Y., Liu K. (2019). Assessing and mapping recreationists’ perceived social values for ecosystem services in the Qinling Mountains, China. Ecosystem Services. 39, 101006. doi: 10.1016/j.ecoser.2019.101006
Zhang X., Zhang B., Yao Y., Wang J., Yu F., Liu J., et al. (2022b). Dynamics and climatic drivers of evergreen vegetation in the Qinling-Daba Mountains of China. Ecol. Indicators. 136, 108625. doi: 10.1016/j.ecolind.2022.108625
Zhang X., Lyu C., Fan X., Bi R., Xia L., Xu C., et al. (2022a). Spatiotemporal variation and influence factors of habitat quality in loess hilly and gully area of yellow river basin: a case study of Liulin County, China. Land. 11 (1), 1–17. doi: 10.3390/land11010127
Zhang X., Zhou J., Li M. (2020). Analysis on spatial and temporal changes of regional habitat quality based on the spatial pattern reconstruction of land use. Acta Geographica Sinica. 75 (1), 160–178. doi: 10.11821/dlxb202001012
Zhang Y. B., Wang Y. Z., Phillips N., Ma K. P., Li J. S., Wang W. (2017). Integrated maps of biodiversity in the Qinling Mountains of China for expanding protected areas. Biol. Conserv. 210, 64–71. doi: 10.1016/j.biocon.2016.04.022
Zhang S. H., Zhou Y. K., Yu Y., Li F., Zhang R., Li W. (2022). Using the Geodetector method to characterize the spatiotemporal dynamics of vegetation and its interaction with environmental factors in the Qinba Mountains, China. Remote Sens. 14 (22), 5794. doi: 10.3390/rs14225794
Zhao F., Lan X., Li W., Zhu W., Li T. (2021). Influence of land use change on the surface albedo and climate change in the qinling-daba mountains. Sustainability 13 (18), 1–15. doi: 10.3390/su131810153
Keywords: habitat quality, InVEST model, land use change, spatiotemporal change, Geodetector
Citation: Ma L, Wang C, Wang L, Jin S and Kou X (2023) Study of spatiotemporal variation and driving factors of habitat quality in the northern foothills of the Qinling Mountains: a case study of Xi’an, China. Front. Ecol. Evol. 11:1284281. doi: 10.3389/fevo.2023.1284281
Received: 28 August 2023; Accepted: 24 November 2023;
Published: 13 December 2023.
Edited by:
Xue-Chao Wang, Beijing Normal University, ChinaReviewed by:
Zhe Feng, China University of Geosciences, ChinaCaige Sun, South China Normal University, China
Copyright © 2023 Ma, Wang, Wang, Jin and Kou. This is an open-access article distributed under the terms of the Creative Commons Attribution License (CC BY). The use, distribution or reproduction in other forums is permitted, provided the original author(s) and the copyright owner(s) are credited and that the original publication in this journal is cited, in accordance with accepted academic practice. No use, distribution or reproduction is permitted which does not comply with these terms.
*Correspondence: Ling Ma, bnd1MjAxOTIwODMzQHN0dW1haWwubnd1LmVkdS5jbg==
 Ling Ma
 Chuanming Wang1,2

