 Panxing Zhang1,2
 Songsong Li1*
- 1School of Economics and Management, Harbin Institute of Technology, Harbin, China
- 2China Classification Society (CCS), Wuhan, China
Introduction: Climate change caused by carbon emission and their impact on social and economic system have garnered global attention, particularly from the world's largest emitters. Therefore, knowledge of both driving factors and reduction potential for carbon emission is crucial to revise climate policies. The transportation industry plays a major in global carbon emissions, mostly due to the excessive utilization of fossil fuels for combustion purposes.
Methods: The goal of this study is to investigate the underlying causes that drive carbon emissions in China's Yangtze River Basin. Additionally, this study seeks to anticipate the future potential reduction in carbon emission. To achieve these, our research used a combination of the LMDI method and Monte Carlo simulation.
Results and discussion: The results indicate that, during 2006 to 2020, transportation carbon emission increased from 48.41 Mt to 104.37 Mt, following an annual growth rate of 5.64%, which suggests that energy strategies are not fully implemented as planned. The greatest positive impact on carbon emission is attributed to economic development, as the increase in resident income has led to the vigorous development of the transportation sector. Moreover, energy intensity and transportation efficiency have a negative influence on carbon emissions. The decrease of carbon emissions can be accomplished by the continued advancement of novel energy technologies and the optimization of energy systems. According to the baseline scenario, it is projected that carbon emissions from the transport sector will reach 198.76 Mt by the year 2030. Under the moderate scenario, there is a possibility for reducing emissions by 18.6 Mt, and under the advanced scenario, the potential reduction is estimated to be 48.84 Mt. As a view to suppress the increase of carbon emission from transportation, a set of plans and policies must be implemented from demand-side and supply-side, including improving transportation efficiency, and optimizing energy structure, etc.
1 Introduction
Over the past decades, there has been increasing global concern regarding the phenomenon of global warming, which is mostly attributed to the release of greenhouse gases (Falkner, 2014). There has been a global consensus about the significance of constraining greenhouse gas emissions. China, as the foremost user of energy and emitter of carbon dioxide, bears responsibility for around 30 of global emissions (Shan et al., 2018). Based on data provided by the International Energy Agency, China’s transportation sector, in isolation, contributed to around 23% of the nation’s overall carbon emissions, trailing solely behind the United States (IEA, 2018). The Intergovernmental Panel on Climate Change has highlighted transportation as one of the industries characterized by significant energy use and rapid growth in carbon emissions. Currently, 60% of global oil consumption is allocated to the transportation sector. The combustion of fossil fuels, particularly oil, constitutes the primary contributor to carbon emissions within this industry (IPCC, 2014). In response to this challenge, China’s central government has expressed its dedication to achieving the objectives of reaching the peak of carbon emissions by 2030 and attaining carbon neutrality by 2060 (Mi et al., 2017). However, these targets have placed enormous pressure on the transition and adjustment of industrial structure, particularly in terms of achieving synergy and balance between the economy, energy, and technology. As a result, uncertainties and practical challenges remain regarding China’s ability to achieve the “30·60” decarbonization goal.
Many countries, such as China, have recognized the need of mitigating carbon emissions originating from the transportation industry. China has carried out a range of low-carbon transportation practices in response to the issue. These practices include the implementation of pilot projects with the objective of establishing an environmentally friendly mode of transportation, as well as the execution of demonstration projects focused on green freight distribution. Similarly, other countries are also taken steps to reduce carbon emissions in transportation, such as UK’s “Road to Zero Strategy” (Brand et al., 2020), Japan’s “Zero Emission Tokyo” (Toh, 2022) and emission trading scheme (Sheu and Li, 2014). However, despite these efforts, research has indicated that the efficacy of traffic control measures in reducing carbon emissions is unsatisfactory (Wang et al., 2022). The global concern about climate change has been on the rise due to the carbon emissions resulting from transportation activities. Achieving a decarbonized transport sector is crucial not only to disentangle economic activity from transportation modes but also to address the contradiction between carbon emissions and environmental carrying capacity.
Since the 2000s, China has undergone rapid urbanization and industrialization, resulting in significant economic growth, an increased demand for fossil energy, and an upsurge in energy consumption (Bai et al., 2020; Chen et al., 2020). The transportation industry is vital to the advancement and expansion of the country’s economy and relevance to the preparation of mitigation policies related to climate change. However, The correlation between economic advancement and increased energy consumption is evident, with the transportation sector emerging as a prominent contributor to both energy consumption and carbon emissions (Gambhir et al., 2015; Lu et al., 2017; Friedlingstein et al., 2019). The transportation industry acts as a mirror reflecting societal activity through the physical movement of goods and services, as well as individual transportation preferences, which are influenced by factors such as income level and network influence (Geng et al., 2013).
Many studies have tried to explain emission changes in transportation emission in China (Fan and Lei, 2016; Wang et al., 2018). It is of great importance to explore driving factors of transportation carbon emission, and understand the future reduction potential behind the consumption of fossil-based fuels. In this study, we aim to ascertain the primary factors that may have played a role in the escalating carbon emissions in transport sector from 2006 to 2020. Additionally, we intend to establish various scenarios to model potential future carbon emissions. Our contributions to existing research are mainly presented as follows: First, it can be seen from the available research that academic interest has generally centered on exploring the driving factors for a country. Our study aims to ascertain the primary factors of transportation carbon emission in pilot zone of development in China, and to some extent contribute to the study in this field. Second, we provide a new perspective for understanding the future reduction potential by establishing various scenarios to model potential future carbon emissions considering China’s cross-cycle policy adjustment. Monte Carlo simulation avoids the previous practice of using discrete values as simulation parameters, making the results more reliable. Finally, we give specific mitigation recommendation according to scenarios simulation, providing scientific support for mitigation tactic designs.
The subsequent portions of this study are outlined below. In Section 2, related researches are reviewed and discussed. Section 3 mainly presents details about study area and methodology. Analytical results and highlight the potential for carbon emission reduction are presented in Section 4 followed by Section 5, where we summary the conclusion and put up policy recommendations.
2 Review
The issue of low carbon development has significant importance in the context of the energy crisis and global warming, which has become the consensus of most countries (Kwon, 2005; Wang and Zhao, 2015). Transportation businesses are a primary contributor to carbon emissions (Chen and Lei, 2017). The transportation industry has driven economic activities and provides support to many other industries throughout all stages of production, distribution, organization, and consumption (Lian et al., 2020). On the other hand, however, due to its huge energy consumption, the transportation industry is more difficult to decarbonize than other industries, making it the most challenging industry to achieve carbon neutrality (Umar et al., 2021). In that respect, understanding the driving factors that drive transportation emissions is imperative due to its potential for reduction and increasing prominence in the context of economic development.
Several studies have been conducted to investigate various aspects of the transport industry in order to provide relative reference for future mitigation policy designs. Achour and Belloumi (2016) decompose analyzed five different driving mechanisms affecting transportation energy consumption. Their study emphasized the dominant role of energy intensity for decreasing energy consumption (Achour and Belloumi, 2016). Timilsina and Shrestha attributed carbon emission into six factors and pointed out that income growth and population increase are responsible for transportation emission (Timilsina and Shrestha, 2009). These studies differed in driving factors given the data availability and regional disparity. However, up to the knowledge of the authors, the upward trend in carbon emissions is commonly ascribed to several influential factor, namely economic development, population growth, and energy consumption (Eng-Larsson et al., 2012; Azlina et al., 2014; Xu and Xu, 2021). As the economic development level advances, people strive for an enhanced standard of living and have a higher demand for transportation. The expansion of the population has, to a certain degree, resulted in a rise in the need for transportation. Thus, it can be observed that both the process of economic development and population increase have exerted a substantial influence in facilitating the escalation of transportation-related carbon emissions. In Chinese context, the relationship between energy consumption on carbon emissions holds particular significance, as oil products are the dominant energy consumed causing large amount of carbon emission (Lin and Xie, 2014). Considering the substantial growth in transportation demand and its close relationship with socio-economic development, the adoption of new energy is crucial, as it serves the dual purpose of enhancing energy efficiency and mitigating carbon emissions within the broader economic framework (Shukla and Chaturvedi, 2012; Wang et al., 2022).
Decomposition methods and other econometric model are often employed to ascertain the underlying determinants of greenhouse emission (Li et al., 2013; Yang et al., 2019). Although no common accepted opinion indicates which method is better, the LMDI method, proposed by Ang (2005); Ang (2015), is favored due to its wide applicability, flexible operation, and direct to the effect. At present, The LMDI approach has been extensively adopted for the purpose of examining the influencing factors and conducting analysis of structural changes (Ang, 2015; Kim, 2019; Isik et al., 2020). In contrast to alternative econometric approaches, the LMDI model is valid under the timereversal tests and facilitates the decomposition of factor effects over the duration of the study period. Various studies use this methodology to analyze and describe the changes in carbon emissions within diverse industries, regions, or countries. For example, Solaymani (2019) conducted a study that examined the prevailing patterns and characteristics of carbon emissions from transport sector in seven leading carbon-emitting countries. Fan and Lei (2016) contributed to a decomposition model utilizing Kaya identity framework to evaluate the impact of various variables on carbon emissions.
The application of decomposition analysis combined with scenario analysis has been employed in several studies to examine carbon emissions (Guan et al., 2008; Ağbulut, 2022). The decomposition analysis allows for an understanding of the temporal pattern of carbon emissions throughout time, thereby enabling the identification of the historical influence of various sources. Meanwhile, scenario prediction investigates the potential differential impact of various factors and their evolution across distinct policy and economic contexts, offering insights into the future trajectory of carbon emissions. Furthermore, it facilitates a quantitative exploration of the pathway to achieve future carbon emission reduction goals. Monte Carlo simulation, recognized for its comprehensiveness and flexibility, is extensively applied as an uncertainty analysis method (Vithayasrichareon and MacGill, 2012). By randomly assigning values to each variable according to its probability of occurrence and combining them with the random values of other variables (Johansen, 2010), the simulation based on the Monte Carlo method takes into consideration the variation in the distribution characteristics of each variable, enabling a more accurate prediction. Moreover, the integration of the Monte Carlo method and computer simulation enhances the scientific nature and reasonableness of the research process.
This study aims to enhance the conventional decomposition analysis by combining LMDI and Monte Carlo simulation to explore the driving factors and dynamic structural changes. Using LMDI and Monte Carlo simulation, we identify the key factors behind increased carbon emission from transport sector and forecast the carbon emission in 2030 under different scenarios. Based on past experience, we propose several policy implication for important issues concerning future development in economic growth, structural transformation, technology, and more.
3 Materials and methods
3.1 Study area
Covering 11 provinces (as shown in Figure 1), the Yangtze River Basin is situated in China’s central area. With its economic strength, industrial scale, and urban construction, the Yangtze River Basin has emerged as a major national strategic development area. It enjoys regional leading advantages, exceeding 40% of the country in terms of both total population and gross regional product. Since the central government proposed a major strategic of the Yangtze River Basin since 2000s, this region has gradually shifted towards high-quality development, embarking on a fast, stable, and sustainable development path. However, certain provinces within this region still rely on an extensive growth model, therefore intensifying the inherent conflict between preservation of ecological environments and the pursuit of economic development. Therefore, it is necessary to build a green energy industry belt along the Yangtze River, and facilitate the transition towards more sustainable modes. These involve imposing higher requirements for energy production and consumption in various provinces and cities along the Yangtze River.
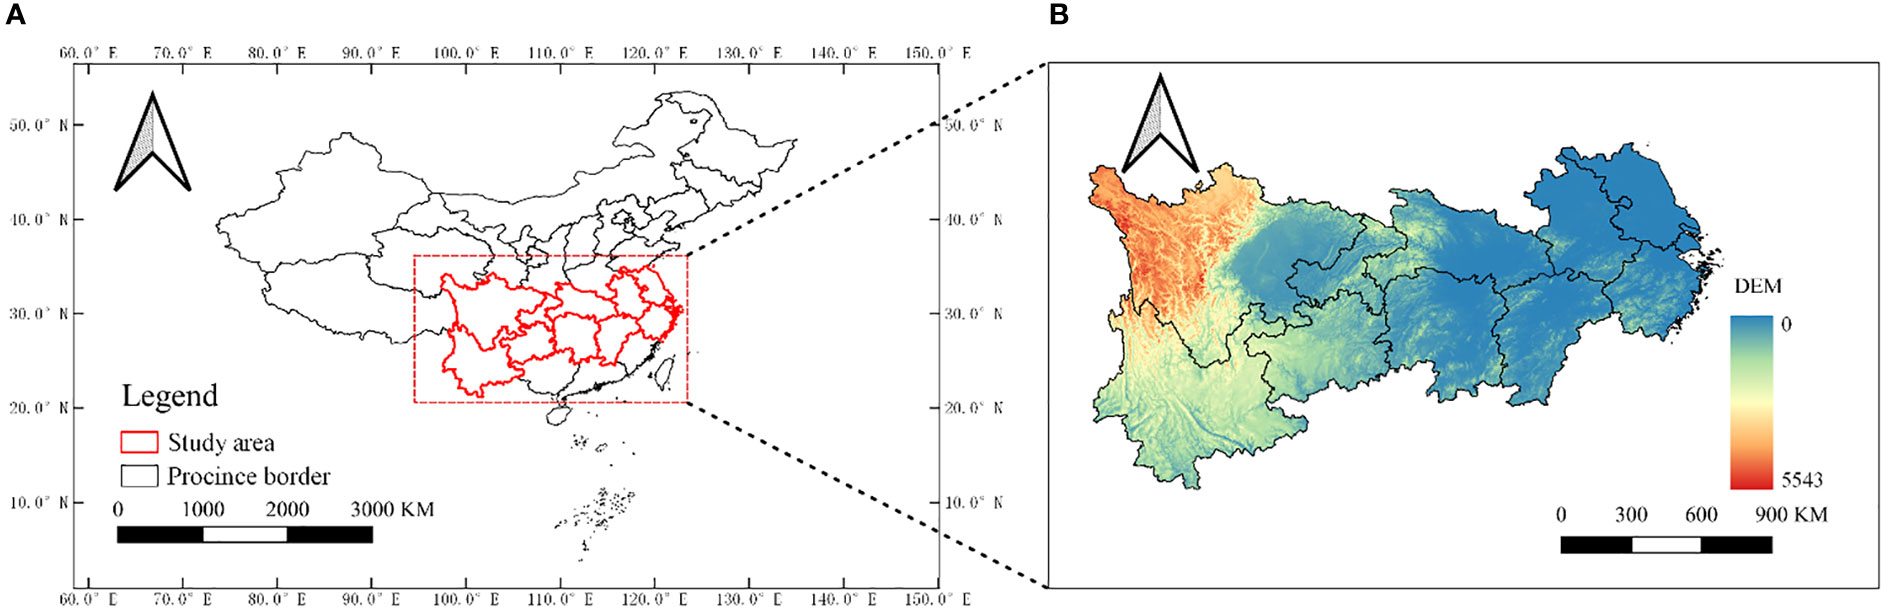
Figure 1 Location and DEM of study area. (A) The location of the Yangtze River Basin in China. (B) Digital elevation model (DE) of the Yangtze River Basin.
3.2 Methodology
3.2.1 Calculation of carbon emission
There exist two basic approaches for estimating CO2 emissions in the transportation sector: the bottom-up approach and the top-down approach. The bottom-up process analysis utilizing the microscopic method entails the examination and evaluation of the composition and structure of vehicles. Sampling approaches and field interviews are the typical ways to collect data (Liimatainen and Pöllänen, 2010). The macro approach of top-down input-output is based on total energy consumption, and then further divided according freight or passenger modes (Liao et al., 2010). Given the absence of mileage and unit energy consumption for various transportation modes in China, the later approach is employed to approximate carbon emissions (Wang and Zhao, 2015):
Where CE represents the total carbon emission; NCVi is the physical consumption energy by the ith category; CEFi denotes the conversion standard factor from physical ith unit to coal equivalent (Liu et al., 2021); the carbon emission coefficient of the ith fuel denoted as COFi; and is conversion coefficient from carbon element to carbon dioxide.
3.2.2 Decomposition of components
The IPAT model combines environmental issues with human driving factors, reflecting the influence of population growth P, economic progress A, and technology innovation T on environment impact shown in Eq.(2) (Ehrlich and Holdren, 1971; Waggoner and Ausubel, 2002).
The carbon emissions are widely recognized as a significant metric for assessing the environmental impact (Wang et al., 2011). The relationship between carbon emissions and contributing factors can be analyzed using Kaya identity as shown in Eq.(3). In this equation, variables C, E, GDP, and P indicate carbon emissions, energy consumption, GDP, and population size respectively (Kaya, 1989).
Based on Kaya model, the carbon emission from transport sector can be broken into 5 factors shown in Eq.(4).
In the Eq.(4), TT reflects the transportation turnover volume; is the energy intensity of carbon emission, which refers to the carbon emissions generated per unit of energy consumed in the transportation sector, and this ratio exhibits a strong correlation with the energy structure of the industry; denotes the energy consumption per unit of the overall turnover within the transportation sector, serving as an indicator of energy conservation and emission reduction technologies; indicates the intensity of transportation and serves as an indicator of transportation efficiency; is the per capita GDP of the region; P is the population.
According to Ang (2005); Ang et al. (2015), the difference in carbon emissions from base period to t period is called the total effect as shown in Eq.(5). In this way, the variation in carbon emissions from the transportation sector between the initial year and target year may be analyzed by considering 5 impacts, as shown in Eq.(6)–(11).
3.2.3 Scenario simulation
The determinants of carbon emission changed within transport sector in the Yangtze River Basin can be estimated using decomposition analysis. To assess the possible reduction potential of carbon emission associated with energy consumption, we further conduct the scenario simulation. According to Eq.(6), the carbon emission in target year T may be predicted shown in Eq.(12).
We assume that α, β, γ, δ, σ are the change rates of the energy intensity (), emission reduction technology (), intensity of transportation (), GDP (), and population (), respectively. Thus, , , , , . Therefore, the rate of change in carbon emissions could be expressed mathematically as Eq.(13), based on this equation, the future carbon emission can be predicted.
This study utilizes relevant data spanning from 2006 to 2020, and divides the research period into three distinct time intervals to enhance data organization and management: 2006–2010, 2011–2015, 2016–2020. The set of time intervals is set because time interval for China’s national economic development plan is five years (Zhang et al., 2011). This article establishes three distinct scenarios for future development: a baseline scenario, a moderate emission scenario, and an advanced emission scenario. These scenarios are formulated by considering historical trends of influential factors within the transportation industry, the potential for reducing emissions, and the challenges associated with implementing emission reduction policies.
3.3 Data source
The metric standard of coal equivalent is used to denote the unit consumption of each form of energy. This study utilizes data from Yangtze River basin spanning the years 2006 to 2020 to assess the factors influencing carbon emissions. Additionally, scenario simulations are conducted to further analyze the potential outcomes. The measurement of energy consumption within the transport sector encompasses energy consumption from the transportation, storage, and postal industries. These data could be obtained from “China Energy Statistical Yearbook” published by China Statistic Press. The primary focus of this study revolves around the emissions resulting from fossil fuels, hence excluding the consideration of electricity. Carbon emission coefficients was collected from “IPCC Guidelines for National Greenhouse Gas Inventories”. Social and economic development data including population size and GDP of each province have been derived from the National Bureau of Statistics.
4 Results and discussion
4.1 Total calculation of carbon emission
Figure 2 presents the trend of GDP and carbon emission of the Yangtze River basin over the period from 2006 to 2020. Our calculation reveals that there was a significant surge in carbon emissions attributed to the transportation industry, as indicated by the rise from 48.41 Mt to 104.37 Mt. This increase may be attributed to an annual growth rate of 5.64%. The Figure 2 also illustrates the strong correlation between carbon dioxide emissions from transportation activities and the corresponding levels of economic growth. Notably, in 2020, there was a significant decrease in carbon emissions from transportation, marked by a deceleration of −4.69%. Such reduction can be ascribed to two primary sources. Firstly, China’s government has started adjusting its extensive transportation mode and incorporating carbon emission indicators into its development plans, and emphasizing green travel, leading a significant decrease in carbon emissions. Specifically, the adoption and endorsement of new energy cars on a nationwide scale have contributed to the reduction in carbon emissions from diesel and gasoline vehicles. Secondly, the decline in carbon emissions can also be ascribed to the traffic reduction resulting from the influence of the Covid-19 pandemic (Le Quéré et al., 2020).
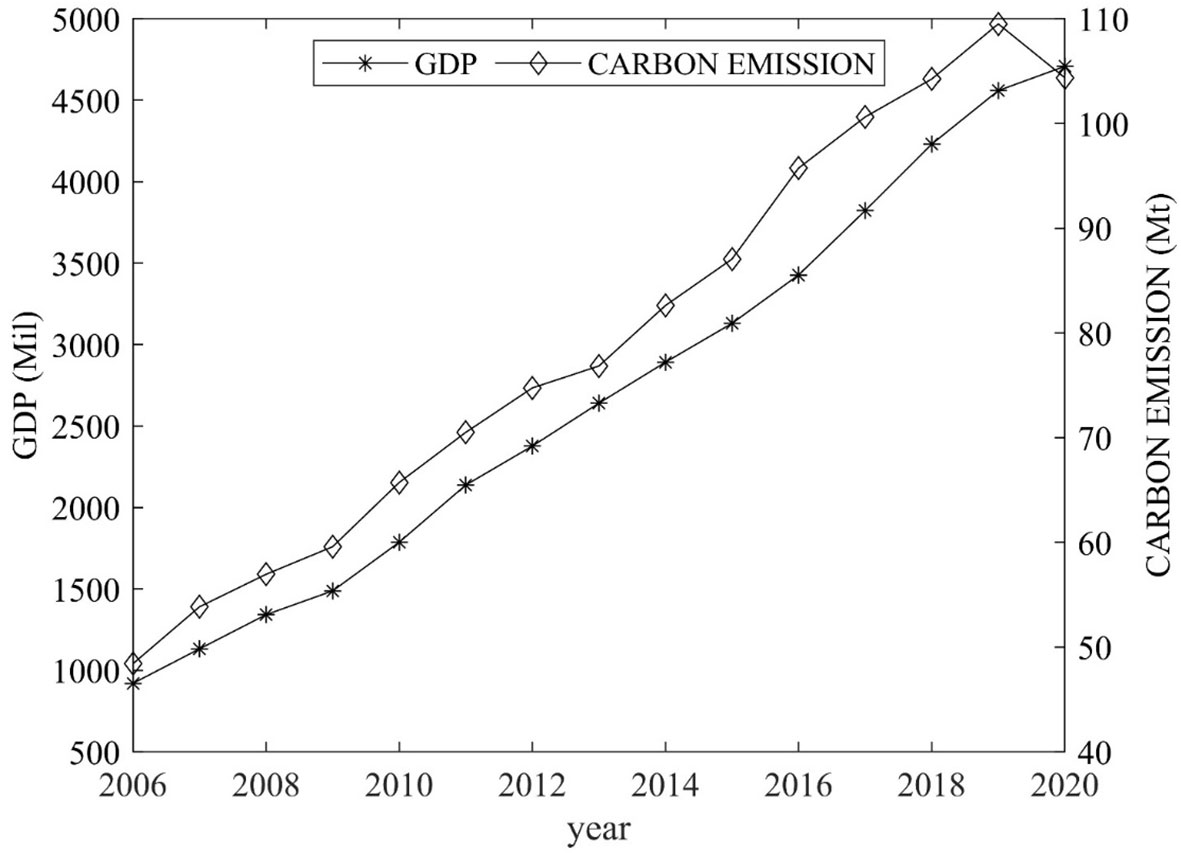
Figure 2 Carbon emission and GDP over 2006 to 2020.
4.2 Decomposition of carbon emission
This study used the LMDI method to conduct a decomposition analysis of the key factors contributing to carbon emissions in the transport sector on an annual basis. The results are shown in Table 1. In the Yangtze River Basin, the rise in the amount of carbon emissions caused by transport may be attributed, in large part, to the increased energy intensity of transport. This suggests that a substantial quantity of energy has been consumed during the previous decade, resulting in a subsequent rise in carbon emissions. The technical advancements primarily account for the enhancement in energy consumption efficiency, with the carbon intensity of transportation energy serving as a suitable indicator of technical impacts. Table 1 reveals that the technological effects manifest as reduction in emission. This suggests that China’s transportation industry has been gradually shifted towards green transformation, by enhancing energy utilization efficiency and achieving emission reduction effects. On one hand, the transformation of China’s transportation industry can be attributed to this phenomenon. The mitigation of carbon emissions has been partially achieved through the intensification of transportation, indicating a notable enhancement in the efficiency of transportation inside China throughout recent years. Moreover, the efficacy of transport system planning is crucial in facilitating the attainment of emission reduction objectives (Wang et al., 2011). Conversely, the progress made in the development of environmentally-friendly modes of transportation has diminished the dependence on fossil fuels, leading to the preservation of energy and reduction in emissions. This has expedited technological advancements and enhanced the transportation infrastructure, finally leading the decline in carbon emissions (Shah et al., 2021).
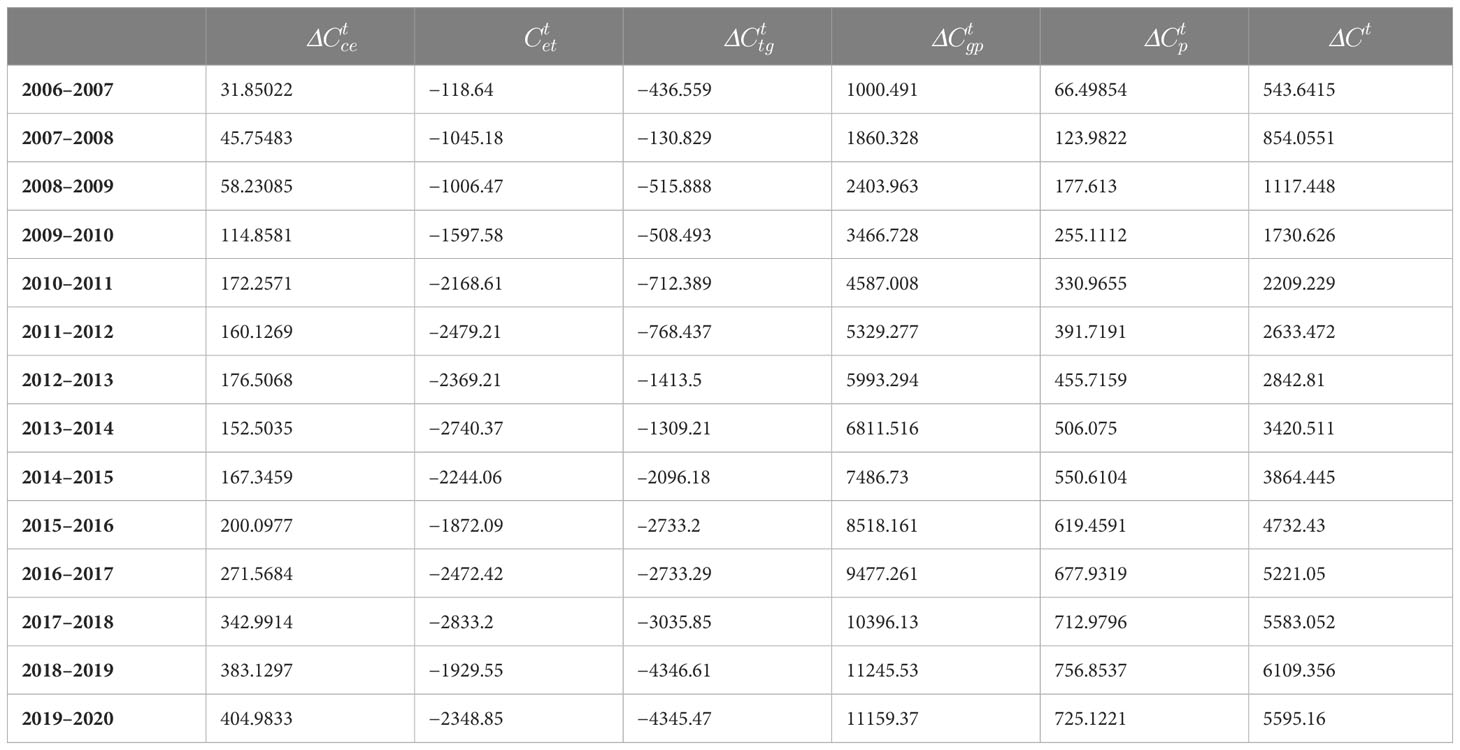
Table 1 Decomposition results of LMDI by year, 2006–2020 (unit: 104 tone).
Besides, regional population expansion and economic development significantly contribute to the escalation of carbon emissions stemming from transportation activities. As the result shows in Table 1, the primary determinant of the transportation sector’s robust development is the growth of per capita GDP, leading to a rise in resident income. These findings align with previous research in this field (Wang et al., 2018; Kim, 2019; Umar et al., 2021). The primary drivers contributing to the escalation of carbon emissions are the simultaneous growth of the economy and population. The level of economic output is contingent upon the amount of energy input, while the utilization of energy resources is associated with a corresponding rise in carbon emissions. The increase in individual discretionary income per person is expected to result in lifestyle modifications as a consequence of the continuous improvement in living conditions. The large-scale transportation of goods, the proliferation of private automobiles, and the growing frequency of residents’ travel will undoubtedly result in a substantial increase in carbon emissions from transportation. Currently, China has implemented appropriate strategies in order to address environmental preservation, energy efficiency, and the reduction of emissions (Lin and Liu, 2013; Li et al., 2019). The enhancement in the efficiency of energy utilization in transportation has been notable; nonetheless, it is important to note that there continues to exist a substantial positive association between economic growth and the production of carbon dioxide resulting from transportation activities. While the importance of technology developments in mitigating carbon emissions has been significant, it is not feasible to rely solely on such advancements to achieve “30·60” decarbonization goal.
Figure 3 illustrates the cumulative impact of five key driving influences on carbon emissions within the transport sector throughout the designated research timeframe. Among them, the rise in per capita GDP has resulted in a cumulative increase of 897.36 Mt in transportation carbon emissions. The impact of economic development is significantly greater than the total impact of the remaining four components. The cumulative rise in carbon emissions resulting from population changes has reached 63.5 Mt. Due to the relatively small changes in the population over the past decade, the contribution effect of population size is not very significant. Similarly, the increase in energy intensity has increased carbon emissions by 26.8 Mt, and its influence on carbon emissions is deemed to be insubstantial. It is generally accepted that there exists a negative relationship between energy intensity and carbon emissions. Energy intensity largely is mostly influenced by advancements in technology. By employing energy-saving innovative items and implementing efficient processes, it is possible to decrease the proportion of fossil energy consumption and enhance energy usage efficiency. However, our analysis reveals that the emission reduction of China’s technology effect remains inconsistent, indicating a lack of adequate green innovation capabilities within the transportation sector.

Figure 3 Cumulative contribution of carbon emission drivers.
The energy consumption per unit turnover and transport intensity have a detrimental effect on the rise of carbon emissions from transport in the Yangtze River Basin. The decrease in energy consumption per unit turnover reduces carbon emissions by 272.25 Mt. This factor has the potential to assist a reduction in energy consumption, so indicating an enhancement in the transportation energy consumption framework. The deceleration of carbon emissions growth can be ascribed to the persistent decrease in the proportion of conventional coal fossil fuels and a corresponding rise in the share of renewable energy sources. China has been producing new energy vehicles since 2005, such technology is the focus of future automotive industry development. Over the past decade, the government has enacted comprehensive subsidy policies and facilitated the widespread integration of new energy vehicles within the public sector via government procurement (Liu et al., 2017; Zhang and Bai, 2017). The results show that this has indeed promoted carbon reduction in the transportation industry. Therefore, in the future years, it is crucial to augment the share of environmentally friendly and low-emission transportation modalities. Additionally, it is important to progress the advancement of transport systems that have low carbon footprints.
The results in Figure 3 also indicate a progressive increase in the adverse impact of transportation energy intensity on carbon emissions during recent years. The decrease in transportation intensity mostly derives advantages from the ongoing enhancement of transportation infrastructure. The series of railway and highway plans formulated by China have greatly promoted the revolution of passenger and freight transportation from long-distance to short distance, effectively improving transportation efficiency. As a response, the escalation in transportation demand exerts a substantial influence on carbon emissions associated with transportation. The transportation infrastructure’s continuous improvement has boosted overall economic activity and subsequently reduced fluctuations in transportation-related carbon emissions. It should be noted that this is also related to changes in the transportation structure. The increase in the ratio of highway turnover is anticipated to result in a corresponding rise in carbon emissions from transportation (Gan et al., 2020), potentially compromising the energy efficiency and hinder endeavors to mitigate carbon emissions. Hence, the reconfiguration of the transport infrastructure is a critical factor to be taken into account in order to achieve energy conservation and emission reduction within the sector.
4.3 Potential of carbon reduction
The Monte Carlo simulation is employed and indicated by Eq.(13), to stochastically sample the annual average change rate of carbon emissions within the transportation industry. This approach enables the prediction of carbon emission fluctuations from the year 2021 to 2030. Firstly, the shape of variable distribution has to be discussed. At present, scholars have not reached an agreement on the choice of probability distribution, and the assumptions of discrete distribution and normal distribution have certain defects. For parameters where there is some certainty about the expected value and the maximum and minimum but it is not possible to know the shape of the data distribution, we use triangular distribution (Ramírez et al., 2008). As we noted above, different scenarios are combined to obtain the future tendency of carbon emission.
Figure 4 represents the changing tendency of , , , and . We choose the average growth of each variables over the period from 2006–2020 as the baseline scenario, which is familiar with some researches such as Shukla and Chaturvedi (2012); Lin and Xie (2014). In other words, within the baseline scenario, every factor will sustain its average growth rate, assuming the preservation of the current economic environment and technology level, and the absence of any further steps aimed at reducing emissions. It is a possible scenario extrapolated based on the inertia trend of transportation industry development.
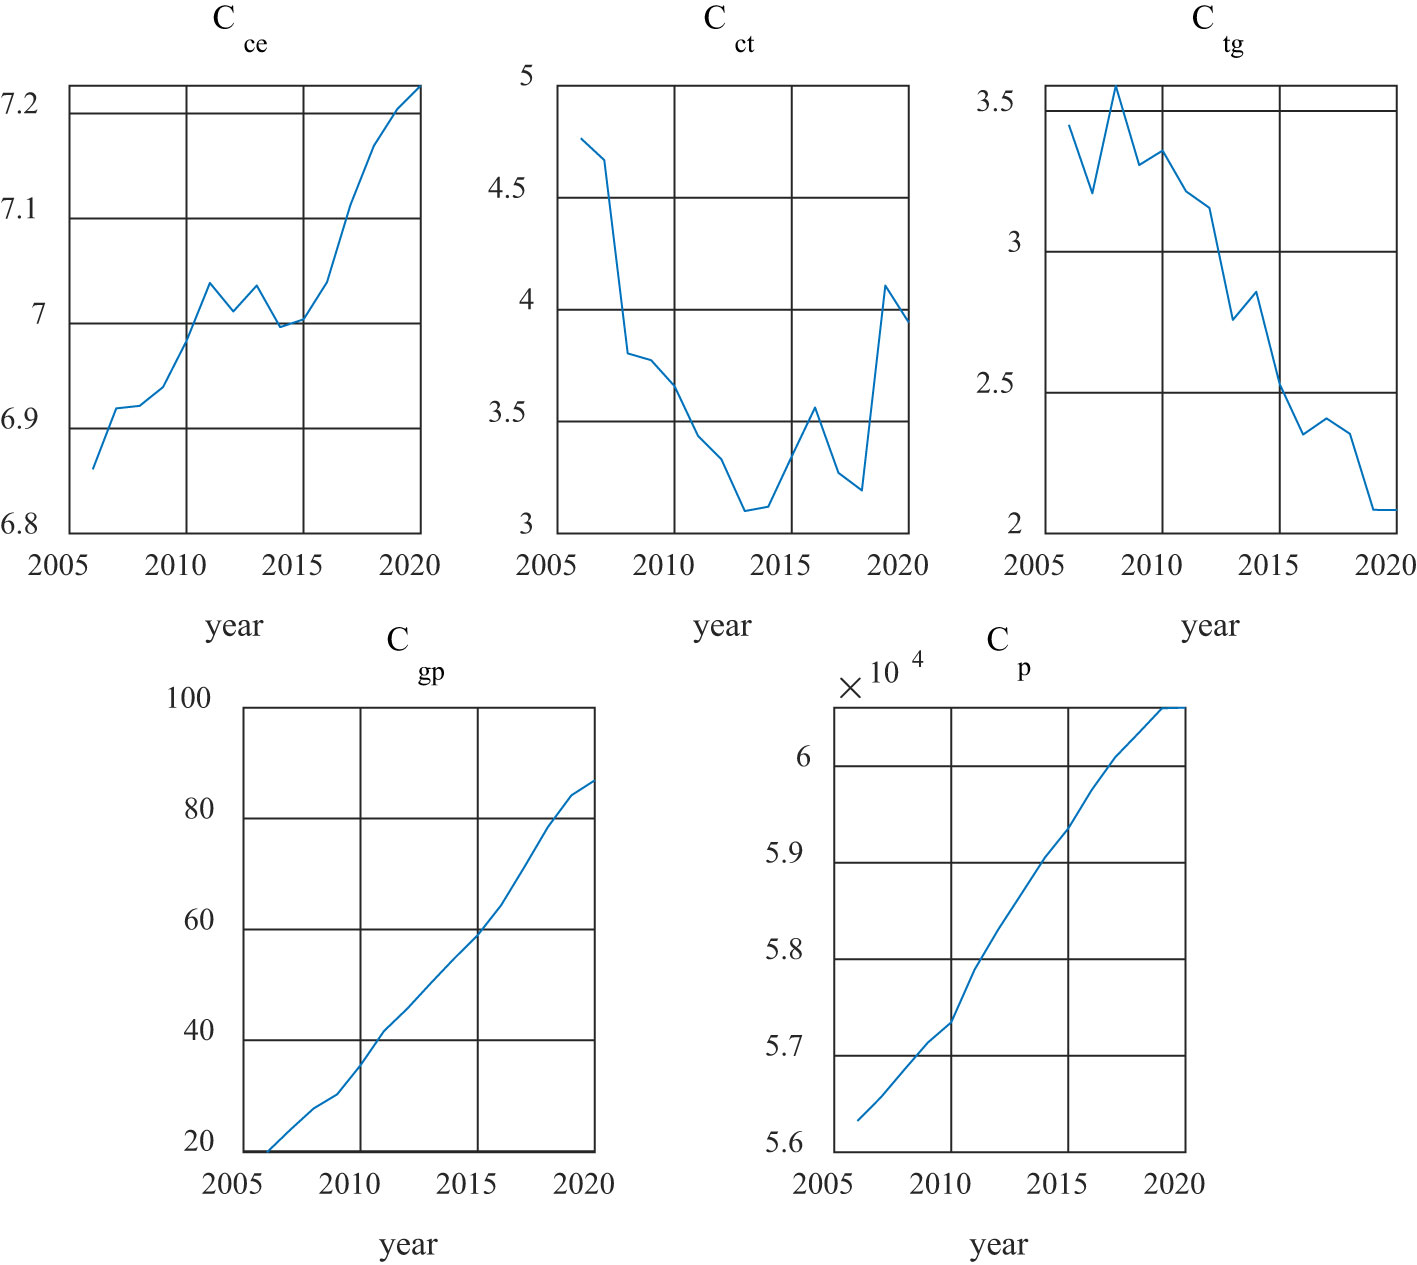
Figure 4 Five driving factors of transport industry over 2006 to 2020.
Based on the baseline scenario as well as the Eq.(13), carbon emission from transport sector in 2030 is predicted, which is 200 Mt. That is to say, under the baseline scenario, it is anticipated that carbon emissions would almost double in the future compared to current levels. Consequently, by the year 2030, China is projected to fall short of its objective to reach peak carbon emissions. The above forecasting is derived by determining the annual changing rate for each driving elements. The annual growth rate, however, is uncertain for each independent variables. There can be many possibilities for their annual growth. Therefore, it is more appropriate to make a prediction that encompasses a range of outcomes, taking into account the probability distribution of the data. Accordingly, we centers on the mean value of the most likely carbon emission from transportation sector and the corresponding probability in the future through risk analysis.
The fundamental procedure of Monte Carlo involves the use of random sampling, specifically dependent on the distribution of each variable. Matlab R2020b is applied to test the distribution of growth rates for each driving factor from 2006 to 2020. Giving the cyclical adjustment character of China’s five-year development strategy, we set the maximum, median, and minimum potential annual variation rates of each factors from 2021 to 2030 based on their historical variation rates from 2006 to 2010, from 2011 to 2015, from 2016 to 2020. The potential change rate of each variable is determined by selecting the maximum and minimum values matching to their respective maximum and minimum values seen in the three specified periods. The median value, on the other hand, is determined based on the annual average variation rate observed over the entire study period. As a note, considering the average value Cp is larger than the maximum observed over three periods, the maximum of Cp is set to the historical maximum over the years. The specific parameter values are shown in Table 2.
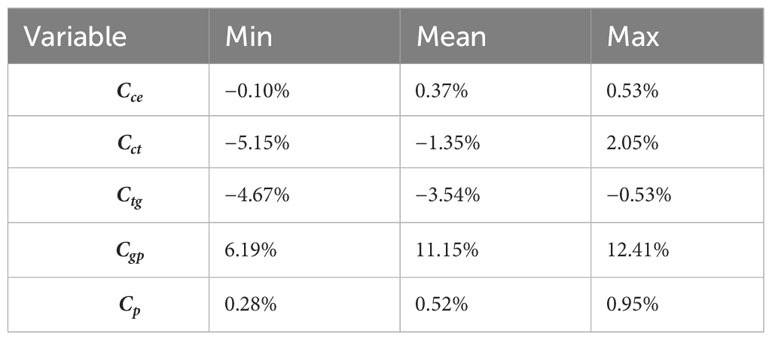
Table 2 Statistical property of each independent variable.
The derivation of the triangular distribution for the yearly growth rate of each variable involves using the mean and extreme values connected with such variable. Subsequently, the Monte Carlo simulation generates random numbers, which are employed as the yearly growth rate for each variable, taking into account their respective distributions. Thus, based on these simulations, the values of the future explanatory variable (carbon emissions from transportation industry) can be calculated. Repeating this process 10 000 times will generate 10 000 sets of random numbers, resulting in 10 000 possible values of the explanatory variables for 2030 (also for 2022, 2024, 2026 and 2028), and finally obtaining the probability distribution of predicted emissions over the next 10 years.
The Monte Carlo simulation was employed to obtain the probability distribution simulation results for future carbon emissions within the transportation sector. These findings were achieved under the baseline scenario and are depicted in Figure 5. Due to the lack of improvement in the baseline scenario, economic scale remains the largest driving factor, and the carbon emissions showed a rapid growth from 2021 to 2030. The maximum possible average carbon emissions in 2030 are 198.76 Mt. China’s transportation industry experienced its first negative increase in carbon emissions due to the Covid-19 pandemic in 2020. However, from the baseline scenario simulation result, without any policy intervention, the emission reduction effect caused by this short-term impact is unsustainable (Le Quéré et al., 2020). After the epidemic, with the orderly progress of resuming work and production, it may even cause larger scale emissions. Therefore, government policy intervention is essential for achieving peak goals.
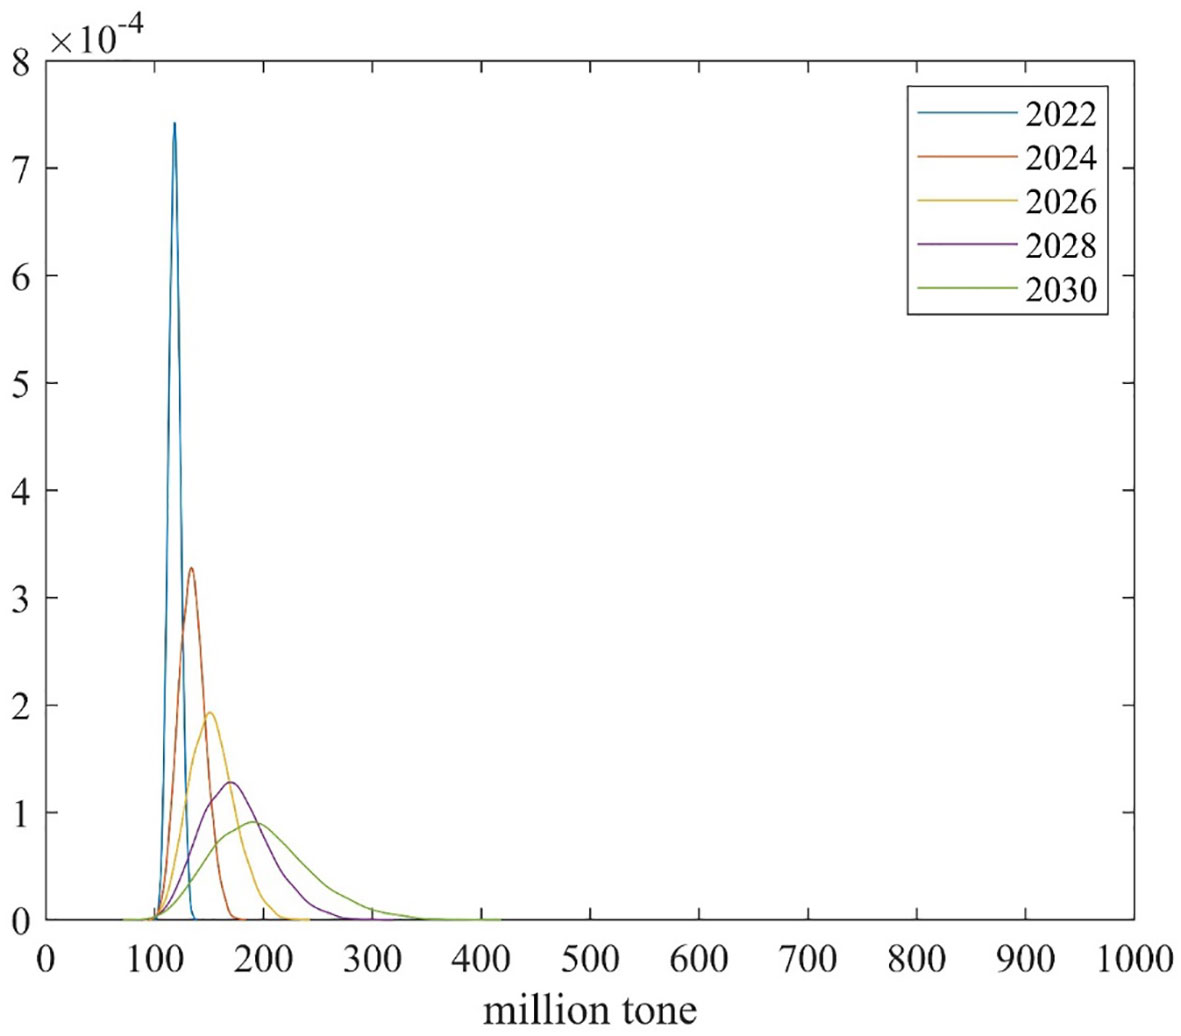
Figure 5 Carbon emission result of distribution shape under baseline scenario.
This study employed a methodology that integrated two distinct scenarios, namely the moderate scenario and advanced scenario, in conjunction with the baseline condition, to assess China’s potential for decarbonization. Technological innovation is necessary to save energy and reduce emissions. Under the moderate condition, this study assumes that there are only impacts brought about by technological innovation but no other impacts. In this scenario, both energy carbon intensity and transportation intensity will be improved. This article assumes that both energy carbon intensity and transportation energy intensity will decrease by 1.0% compared to the baseline scenario, and their maximum and minimum values will be obtained by a range of 2%. The concept of advanced scenario refers to a situation wherein certain legislative incentives and economic limitations lead to a reduction carbon emissions as a consequence of the collective impact of several factors. In order to attain carbon neutrality, it is imperative to implement modifications to the existing energy infrastructure, adopt more sustainable energy sources, and improve energy efficiency in consumption. The mode of energy carbon intensity decreases by 1% compared to the baseline condition. Regarding the growth rate of GDP and population, the upper and lower bounds of population are modified within a range of 0.1%, whereas the upper and lower bounds of economic scale are altered within a range of 1.0%. Both parameters setting are shown in Table 3.
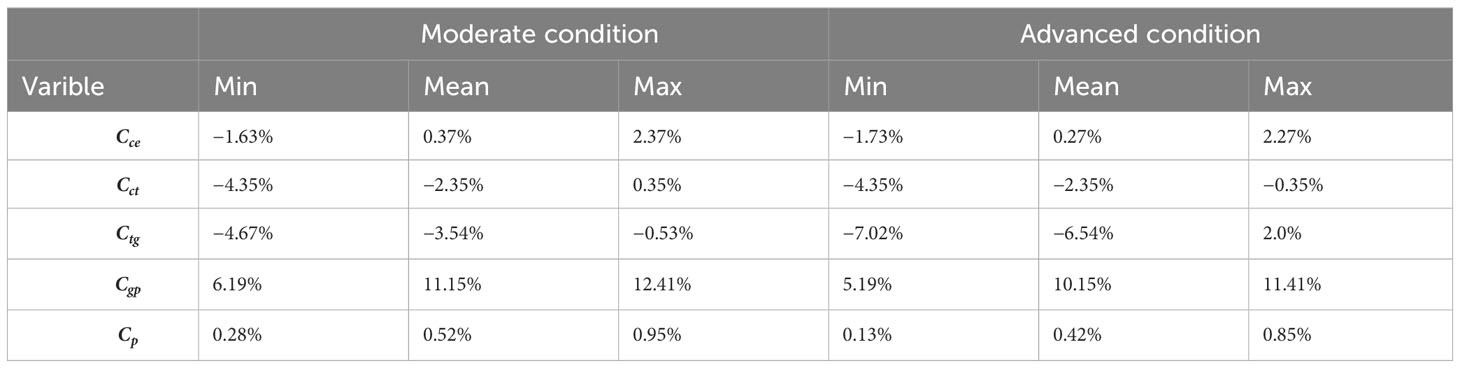
Table 3 Growth rate assumptions under different scenarios.
Based on different scenarios, the carbon emission from the Yangtze River Basin’s transport sector is predicted, as is shown in Figure 6. The forecasted carbon emissions sector in 2030 are estimated to be 180.16 Mt in the moderate condition and 149.92 Mt in the advanced scenario. These values are both lower than the forecasted emissions under the baseline scenario. In two different reduction scenarios, carbon emission decreased by 9.36% and 24.57% respectively compared to the baseline scenario in 2030. As is shown in Figure 6, there is enormous potential for carbon reduction in the future. If the policy pattern is altered from the baseline to the advanced scenario, by the year 2030, it is anticipated that the transport industry would achieve a reduction of 48.84 Mt in carbon emissions. Under baseline scenario, carbon emission transforms to moderate-reduction scenario. Additionally, under the moderate scenario, the carbon emissions shifts to the advanced scenario.

Figure 6 Forecast of carbon emission in different scenarios.
The advanced scenario exemplifies China’s most dedicated approach to mitigating carbon emissions, when a multitude of influential elements culminate in the most substantial decrease of carbon dioxide. This outcome is achieved through specific legislative incentives and economic limitations. In contrast, the moderate scenario can be characterized as a comparatively gentle scenario, taking into account the prevailing state of economic development. This scenario can be viewed as an intermediary between the baseline and advanced scenarios. In alternative terms, the advanced scenario exemplifies China’s utmost dedication to carbon emission reduction, whilst the moderate scenario signifies the policy commitment at an average level.
5 Conclusion and police implication
China, as the biggest developing country, is a party to the Paris Agreement, and has carried out policy design projects to achieving its decarbonization goals for the future. In that respect, this paper makes a significant contribution to addressing policy issues related to carbon reduction caused by transportation. This study centers on the key determinants that impact carbon emissions and the potential avenues for reducing carbon emissions in the future. In this study, the dependent variable is carbon emissions from transport sector, and the effect contribution of five components is calculated using LMDI method. Monte Carlo simulation is then used to predict carbon emissions, and the implementation of proactive emission reduction strategies is necessary in order to effectively mitigate the limited potential for carbon emissions reduction. Based on these findings, we highlight the main conclusions of our research.
First, in the Yangtze River Basin, the transportation sector have shown a consistent upward trend over the past decades, except the year influenced by the Covid-19 outbreak. Second, the primary driver for the increase in carbon emissions is the general economic expansion. Nonetheless, focusing on transportation efficiency and energy intensity presents significant potential for substantial reductions. Consequently, a wide range of options exists in terms of reducing transportation intensity, transitioning to sustainable alternatives, and advancing technological improvements. Finally, an examination of various scenarios for the analyzed period indicates heterogeneous carbon abatement potential. The Monte Carlo simulation findings provide evidence that the implementation of ambitious policies has the ability to effectively mitigate carbon emissions in the Yangtze River Basin. However, careful planning is necessary to determine the optimal production locations, material demands, and their correlation with population and economic growth. Therefore, it is essential to adopt relevant policies aimed at decreasing per capita transportation demand to drive long-term dynamic changes within the social economy.
Based on conclusions of this study, it is possible to ascertain the direction of future policies aimed at reducing emissions. In light of the rapid expansion of China’s economy and the accelerated pace of urbanization, it is now essential to expedite the reconfiguration of the industrial framework inside the Yangtze River Basin. First, it is now essential to expedite the reconfiguration of the industrial framework inside the Yangtze River Basin. The optimization of the energy structure is a crucial determinant in the endeavor to reduce carbon emissions and achieve sustainable growth in the transportation sector over a prolonged duration. This is an effective mitigation plan derived from the previous scenario simulation. Second, the implementation of financial incentives and carbon trading legislation holds promise as viable tools for promoting technological research and development within the transportation sector. The implementation of a carbon tax is widely recognized as a very successful strategy for substantially mitigating carbon emissions and curbing energy use. It is considered an essential component of tax systems aimed at promoting energy conservation and reducing emissions. Finally, it is recommended that the government give precedence to the transmission of public awareness campaigns, cultivate an increased level of environmental consciousness among individuals, and actively endorse the utilization of environmentally friendly transportation alternatives, such as public transit and electric vehicles, for commuting purposes. Enterprises should engage in active research and development of new energy vehicles as a viable alternative to the extensive use of petrol in transportation, owing to the favorable attributes of clean energy, such as low carbon emissions and minimal environmental contamination.
In practice, Chinese governmental establishments encounter a deficiency of comprehensive data pertaining to the distinct categories of energy utilized by diverse transportation modes across numerous provinces. If the detailed data of energy consumption can be obtained in combination with big data in future research, the conclusions from future research will be more robust. Additionally, it would be beneficial to consider regional differences in transportation structure and energy consumption. Studies have highlighted the importance of considering regional variations to provide more specific policy guidance for carbon reduction strategies in different areas (Yang et al., 2019; Liu et al., 2021). This is also crucial for identifying potential sources of energy consumption.
Data availability statement
The raw data supporting the conclusions of this article will be made available by the authors, without undue reservation.
Author contributions
PZ: Conceptualization, Methodology, Software, Writing – original draft. SL: Funding acquisition, Supervision, Writing – review & editing.
Funding
The author(s) declare financial support was received for the research, authorship, and/or publication of this article. National Natural Science Foundation of China (Grant No. 71773024) Natural Science Foundation of Heilongjiang Province of China (Grant No. G2018006), Heilongjiang Postdoctoral Scientific Research Developmental Fund (LBH-Q18064).
Conflict of interest
The authors declare that the research was conducted in the absence of any commercial or financial relationships that could be construed as a potential conflict of interest.
Publisher’s note
All claims expressed in this article are solely those of the authors and do not necessarily represent those of their affiliated organizations, or those of the publisher, the editors and the reviewers. Any product that may be evaluated in this article, or claim that may be made by its manufacturer, is not guaranteed or endorsed by the publisher.
Supplementary material
The Supplementary Material for this article can be found online at: https://www.frontiersin.org/articles/10.3389/fevo.2023.1283605/full#supplementary-material
References
Achour H., Belloumi M. (2016). Decomposing the influencing factors of energy consumption in Tunisian transportation sector using the LMDI method. Transport Policy 52, 64–71. doi: 10.1016/j.tranpol.2016.07.008
Ağbulut Ü. (2022). Forecasting of transportation-related energy demand and CO2 emissions in Turkey with different machine learning algorithms. Sustain. Production Consumption 29, 141–157. doi: 10.1016/j.spc.2021.10.001
Ang B. W. (2005). The LMDI approach to decomposition analysis: a practical guide. Energy Policy 33, 867–871. doi: 10.1016/j.enpol.2003.10.010
Ang B. W. (2015). LMDI decomposition approach: A guide for implementation. Energy Policy 86, 233–238. doi: 10.1016/j.enpol.2015.07.007
Ang B. W., Xu X. Y., Su B. (2015). Multi-country comparisons of energy performance: The index decomposition analysis approach. Energy Economics 47, 68–76. doi: 10.1016/j.eneco.2014.10.011
Azlina A. A., Law S. H., Nik Mustapha N. H. (2014). Dynamic linkages among transport energy consumption, income and CO2 emission in Malaysia. Energy Policy 73, 598–606. doi: 10.1016/j.enpol.2014.05.046
Bai C., Zhou L., Xia M., Feng C. (2020). Analysis of the spatial association network structure of China’s transportation carbon emissions and its driving factors. J. Environ. Manage. 253, 109765. doi: 10.1016/j.jenvman.2019.109765
Brand C., Anable J., Ketsopoulou I., Watson J. (2020). Road to zero or road to nowhere? Disrupting transport and energy in a zero carbon world. Energy Policy 139, 111334. doi: 10.1016/j.enpol.2020.111334
Chen W., Lei Y. (2017). Path analysis of factors in energy-related CO2 emissions from Beijing’s transportation sector. Transportation Res. Part D: Transport Environ. 50, 473–487. doi: 10.1016/j.trd.2016.11.027
Chen F., Zhao T., Liao Z. (2020). The impact of technology-environmental innovation on CO2 emissions in China’s transportation sector. Environ. Sci. pollut. Res. 27, 29485–29501. doi: 10.1007/s11356-020-08983-y
Ehrlich P. R., Holdren J. P. (1971). Impact of population growth. Science 171, 1212–1217. doi: 10.1126/science.171.3977.1212
Eng-Larsson F., Lundquist K.-J., Olander L.-O., Wandel S. (2012). Explaining the cyclic behavior of freight transport CO2-emissions in Sweden over time. Transport Policy 23, 79–87. doi: 10.1016/j.tranpol.2012.05.014
Falkner R. (2014). Global environmental politics and energy: Mapping the research agenda. Energy Res. Soc. Sci. 1, 188–197. doi: 10.1016/j.erss.2014.03.008
Fan F., Lei Y. (2016). Decomposition analysis of energy-related carbon emissions from the transportation sector in Beijing. Transportation Res. Part D: Transport Environ. 42, 135–145. doi: 10.1016/j.trd.2015.11.001
Friedlingstein P., Jones M. W., O’Sullivan M., Andrew R. M., Hauck J., Peters G. P., et al. (2019). Global carbon budget 2019. Earth System Sci. Data 11, 1783–1838. doi: 10.5194/essd-11-1783-2019
Gambhir A., Tse L. K. C., Tong D., Martinez-Botas R. (2015). Reducing China’s road transport sector CO2 emissions to 2050: Technologies, costs and decomposition analysis. Appl. Energy 157, 905–917. doi: 10.1016/j.apenergy.2015.01.018
Gan Y., Lu Z., Cai H., Wang M., He X., Przesmitzki S. (2020). Future private car stock in China: current growth pattern and effects of car sales restriction. Mitig Adapt Strateg Glob Change 25, 289–306. doi: 10.1007/s11027-019-09868-3
Geng Y., Ma Z., Xue B., Ren W., Liu Z., Fujita T. (2013). Co-benefit evaluation for urban public transportation sector – a case of Shenyang, China. J. Cleaner Production 58, 82–91. doi: 10.1016/j.jclepro.2013.06.034
Guan D., Hubacek K., Weber C. L., Peters G. P., Reiner D. M. (2008). The drivers of Chinese CO2 emissions from 1980 to 2030. Global Environ. Change 18, 626–634. doi: 10.1016/j.gloenvcha.2008.08.001
IEA. (2018). CO2 Emissions from Fuel Combustion (Paris: International Energy Agency). doi: 10.1787/co2_fuel-2018-en
IPCC. (2014). “Climate change 2013: the physical science basis,” in Contribution of Working Group to the Fifth Asassessment Report of the Intergovernmental Panel on Climate Change (Cambridge: Cambridge University Press).
Isik M., Sarica K., Ari I. (2020). Driving forces of Turkey’s transportation sector CO2 emissions: An LMDI approach. Transport Policy 97, 210–219. doi: 10.1016/j.tranpol.2020.07.006
Johansen A. M. (2010). “Monte carlo methods,” in International Encyclopedia of Education, 3rd ed. Eds. Peterson P., Baker E., McGaw B. (Oxford: Elsevier), 296–303. doi: 10.1016/B978-0-08-044894-7.01543-8
Kaya Y. (1989). Impact of Carbon Dioxide Emission on GNP Growth: Interpretation of Proposed Scenarios (Paris: Response Strategies Working Group, IPCC).
Kim S. (2019). Decomposition analysis of greenhouse gas emissions in Korea’s transportation sector. Sustainability 11, 1986. doi: 10.3390/su11071986
Kwon T.-H. (2005). Decomposition of factors determining the trend of CO2 emissions from car travel in Great Britain, (1970–2000). Ecol. Economics 53, 261–275. doi: 10.1016/j.ecolecon.2004.06.028
Le Quéré C., Jackson R. B., Jones M. W., Smith A. J. P., Abernethy S., Andrew R. M., et al. (2020). Temporary reduction in daily global CO2 emissions during the COVID-19 forced confinement. Nat. Clim. Change 10, 647–653. doi: 10.1038/s41558-020-0797-x
Li J., Liu H., Du K. (2019). Does market-oriented reform increase energy rebound effect? Evidence from China’s regional development. China Economic Rev. 56, 101304. doi: 10.1016/j.chieco.2019.101304
Li H., Lu Y., Zhang J., Wang T. (2013). Trends in road freight transportation carbon dioxide emissions and policies in China. Energy Policy 57, 99–106. doi: 10.1016/j.enpol.2012.12.070
Lian L., Lin J., Yao R., Tian W. (2020). The CO2 emission changes in China’s transportation sector during 1992–2015: a structural decomposition analysis. Environ. Sci. pollut. Res. 27, 9085–9098. doi: 10.1007/s11356-019-07094-7
Liao C.-H., Tseng P.-H., Cullinane K., Lu C.-S. (2010). The impact of an emerging port on the carbon dioxide emissions of inland container transport: An empirical study of Taipei port. Energy Policy 38, 5251–5257. doi: 10.1016/j.enpol.2010.05.018
Liimatainen H., Pöllänen M. (2010). Trends of energy efficiency in Finnish road freight transport 1995–2009 and forecast to 2016. Energy Policy 38, 7676–7686. doi: 10.1016/j.enpol.2010.08.010
Lin B., Liu X. (2013). Reform of refined oil product pricing mechanism and energy rebound effect for passenger transportation in China. Energy Policy 57, 329–337. doi: 10.1016/j.enpol.2013.02.002
Lin B., Xie C. (2014). Reduction potential of CO2 emissions in China's transport industry. Renewable Sustain. Energy Rev. 33, 689–700. doi: 10.1016/j.rser.2014.02.017
Liu C., Huang W., Yang C. (2017). The evolutionary dynamics of China’s electric vehicle industry – Taxes vs. subsidies. Comput. Ind. Eng. 113, 103–122. doi: 10.1016/j.cie.2017.08.026
Liu J., Li S., Ji Q. (2021). Regional differences and driving factors analysis of carbon emission intensity from transport sector in China. Energy 224, 120178. doi: 10.1016/j.energy.2021.120178
Lu S., Jiang H., Liu Y., Huang S. (2017). Regional disparities and influencing factors of Average CO2 Emissions from transportation industry in Yangtze River Economic Belt. Transportation Res. Part D: Transport Environ. 57, 112–123. doi: 10.1016/j.trd.2017.09.005
Mi Z., Meng J., Guan D., Shan Y., Song M., Wei Y.-M., et al. (2017). Chinese CO2 emission flows have reversed since the global financial crisis. Nat. Commun. 8, 1712. doi: 10.1038/s41467-017-01820-w
Ramírez A., de Keizer C., van der Sluijs J. P., Olivier J., Brandes L. (2008). Monte Carlo analysis of uncertainties in the Netherlands greenhouse gas emission inventory for 1990–2004. Atmospheric Environ. 42, 8263–8272. doi: 10.1016/j.atmosenv.2008.07.059
Shah K. J., Pan S.-Y., Lee I., Kim H., You Z., Zheng J.-M., et al. (2021). Green transportation for sustainability: Review of current barriers, strategies, and innovative technologies. J. Cleaner Production 326, 129392. doi: 10.1016/j.jclepro.2021.129392
Shan Y., Guan D., Zheng H., Ou J., Li Y., Meng J., et al. (2018). China CO2 emission accounts 1997–2015. Sci. Data 5, 170201. doi: 10.1038/sdata.2017.201
Sheu J.-B., Li F. (2014). Market competition and greening transportation of airlines under the emission trading scheme: A case of duopoly market. Transportation Sci. 48, 684–694. doi: 10.1287/trsc.2013.0473
Shukla P. R., Chaturvedi V. (2012). Low carbon and clean energy scenarios for India: Analysis of targets approach. Energy Economics 34, S487–S495. doi: 10.1016/j.eneco.2012.05.002
Solaymani S. (2019). CO2 emissions patterns in 7 top carbon emitter economies: The case of transport sector. Energy 168, 989–1001. doi: 10.1016/j.energy.2018.11.145
Timilsina G. R., Shrestha A. (2009). Transport sector CO2 emissions growth in Asia: Underlying factors and policy options. Energy Policy 37, 4523–4539. doi: 10.1016/j.enpol.2009.06.009
Toh C. K. (2022). Tokyo’s city sustainability: Strategy and plans for net zero emissions by 2050. IET Smart Cities 4, 81–91. doi: 10.1049/smc2.12033
Umar M., Ji X., Kirikkaleli D., Alola A. A. (2021). The imperativeness of environmental quality in the United States transportation sector amidst biomass-fossil energy consumption and growth. J. Cleaner Production 285, 124863. doi: 10.1016/j.jclepro.2020.124863
Vithayasrichareon P., MacGill I. F. (2012). A Monte Carlo based decision-support tool for assessing generation portfolios in future carbon constrained electricity industries. Energy Policy 41, 374–392. doi: 10.1016/j.enpol.2011.10.060
Waggoner P. E., Ausubel J. H. (2002). A framework for sustainability science: A renovated IPAT identity. Proc. Natl. Acad. Sci. 99, 7860–7865. doi: 10.1073/pnas.122235999
Wang W. W., Zhang M., Zhou M. (2011). Using LMDI method to analyze transport sector CO2 emissions in China. Energy 36, 5909–5915. doi: 10.1016/j.energy.2011.08.031
Wang Y., Zhao T. (2015). Impacts of energy-related CO2 emissions: Evidence from under developed, developing and highly developed regions in China. Ecol. Indic. 50, 186–195. doi: 10.1016/j.ecolind.2014.11.010
Wang K., Zheng L. J., Zhang J. Z., Yao H. (2022). The impact of promoting new energy vehicles on carbon intensity: Causal evidence from China. Energy Economics 114, 106255. doi: 10.1016/j.eneco.2022.106255
Wang Y., Zhou Y., Zhu L., Zhang F., Zhang Y. (2018). Influencing factors and decoupling elasticity of China’s transportation carbon emissions. Energies 11. doi: 10.3390/en11051157
Xu X., Xu H. (2021). The driving factors of carbon emissions in China’s transportation sector: A spatial analysis. Front. Energy Res. 9. doi: 10.3389/fenrg.2021.664046
Yang W., Wang W., Ouyang S. (2019). The influencing factors and spatial spillover effects of CO2 emissions from transportation in China. Sci. Total Environ. 696, 133900. doi: 10.1016/j.scitotenv.2019.133900
Zhang X., Bai X. (2017). Incentive policies from 2006 to 2016 and new energy vehicle adoption in 2010–2020 in China. Renewable Sustain. Energy Rev. 70, 24–43. doi: 10.1016/j.rser.2016.11.211
Keywords: transport sector, emission factors, decomposition analysis, scenario simulation, Yangtze River Basin (YRB)
Citation: Zhang P and Li S (2023) Driving factors and scenario prediction of carbon emission from transport sector in the Yangtze River Basin of China. Front. Ecol. Evol. 11:1283605. doi: 10.3389/fevo.2023.1283605
Received: 26 August 2023; Accepted: 20 October 2023;
Published: 08 November 2023.
Edited by:
Jiexun Li, Western Washington University, United StatesReviewed by:
He Huang, Tsinghua University, ChinaShao Wu, Southwest Minzu University, China
Yanhong Tu, Hunan University of Technology, China
Copyright © 2023 Zhang and Li. This is an open-access article distributed under the terms of the Creative Commons Attribution License (CC BY). The use, distribution or reproduction in other forums is permitted, provided the original author(s) and the copyright owner(s) are credited and that the original publication in this journal is cited, in accordance with accepted academic practice. No use, distribution or reproduction is permitted which does not comply with these terms.
*Correspondence: Songsong Li, bGlzb25nc29uZ0BoaXQuZWR1LmNu