Abstract
Confining pressure is an important factor affecting the strength and deformation characteristics of rock mass, it is of great significance to study the mechanical and deformation characteristics of jointed rock mass under confining pressure for the construction of deep underground engineering and the prevention of geological disasters. In order to study the mechanical and deformation characteristics of filled jointed rock under confining pressure, based on the laboratory experiment results of static uniaxial compression of filled jointed rock samples, the Particle Flow Code is used to conduct the numerical simulation. The strength characteristics, failure characteristics and micro-cracks development characteristics of filled jointed rock under different confining pressure levels, different joint inclination angles and different sample sizes are analyzed. The results show that the peak stress and peak strain increase with the increase of confining pressure level, and there is a strong linear relationship between peak stress and confining pressure level. The peak stress and initiation stress decrease first and then increase with the increase of joint inclination angle. With the increase of confining pressure level, the change law of initiation stress of filled jointed rock under different joint inclination angles is different. The confining pressure will prolong the development process of micro-cracks in filled jointed rock, which will make the distribution of micro-cracks more dispersed and the total number of micro-cracks increase. The failure mode changes from splitting failure to shear failure with the increase of confining pressure level. The change of joint inclination angle will seriously affect the failure mode and micro-cracks development characteristics of filled jointed rock.
1 Introduction
With the continuous progress of deep underground engineering construction, geological disasters and engineering accidents occur from time to time. These accidents are often closely related to the mechanical and deformation characteristics of deep rock mass under the in-situ stress environment. The in-situ stress environment of rock mass will have a certain impact on its mechanical behavior and stability (Cai, 2013; Ghorbani et al., 2020; Xiao et al., 2021). However, the rock mass is often composed of intact rock blocks and joints. The existence of joints causes the discontinuity and inhomogeneity of rock mass. The mechanical property and deformation and failure characteristics of rock mass depend on the characteristics of joints to a great extent (Bahaaddini et al., 2013a; Liu et al., 2018; Li, J. C et al., 2022; Wang et al., 2022). Therefore, it is of great significance to study the mechanical and deformation characteristics of jointed rock mass under confining pressure for the construction of deep underground engineering and the prevention of geological disasters.
At present, a lot of researches have been conducted on the influence of confining pressure on the mechanical properties of jointed rock (Lu et al., 2012; Ghazvinian and Hadei, 2012; Xiang et al., 2019; Tang et al., 2022). For example, Arzúa et al. (2014) and Alejano et al. (2017) conducted triaxial compression tests on jointed granite samples to study the influence of confining pressure and joint number on the peak strength and elastic modulus of massive jointed rock. Zhu et al. (2021) found that the strength and elastic modulus of columnar jointed rocks increase with the increase of confining pressure through laboratory physical tests, and there are four different failure modes of columnar jointed rocks with the change of joint inclination under confining pressure. Xie et al. (2023) used the improved SHPB device to carry out the dynamic impact test of rock samples with cross joints, and studied the effects of loading rate and confining pressure on the dynamic characteristics and failure characteristics of jointed rock. The results showed that confining pressure had a certain impact on the failure mode and degree of fracture of jointed rock, showing splitting failure under low confining pressure and compression shear failure under high confining pressure, and the fragmentation degree of rock sample gradually decreases with the increase of confining pressure. Through experiments, Chen et al. (2023) found that water-rock interaction, confining pressure effect and joint inclination angle have a great influence on the failure mode of intermittent jointed sandstone, which is mainly manifested in crack length, crack initiation position, radial angle between crack and sample, crack number, failure type and so on. The above studies all adopt the method of laboratory physical test. Due to the high production cost of rock samples, the complexity of internal defects in rocks, and the difficulty of observing and analyzing the development of cracks in jointed rocks from the microscopic level in laboratory tests, there are some shortcomings in using the laboratory test alone.
In recent years, with the continuous development of computer technology, numerical simulation methods have become an important research tool for solving scientific and engineering problems. The commonly used numerical simulation methods include Finite Element Method, Finite Difference Method, Boundary Element Method, Discrete Element Method, etc. For studying and analyzing the deformation and failure behavior of rock and soil engineering, the Discrete Element Method has great advantages and has been widely applied. In particular, the Particle Flow Code (short for PFC) program based on particle discrete element method can effectively simulate the mechanical behavior and crack propagation of discontinuous media such as jointed rock mass, which has been favored by many researchers (Ghazvinian et al., 2012; Bahaaddini et al., 2013b; Bahaaddini et al., 2016; Jin et al., 2017; Zhang et al., 2022). For example, Zhang and Wong (2012; 2013) used the PFC2D program to study the influence of fracture inclination angle on crack propagation in single and double fractured rocks during uniaxial compression. Yang et al. (2014) conducted PFC simulation of sandstone with two non-parallel fractures under uniaxial compression to investigate the strength, deformation and crack propagation behavior of fractured sandstone. The influence of confining pressure on the strength, deformation and failure mode of double fractured sandstone was further studied (Huang et al., 2016; Huang et al., 2019; Li et al., 2022; Yuan et al., 2023a; Yuan et al., 2023b). The research showed that the development process and failure mode of microcracks in sandstone with two non-parallel fractures ware related to the fracture inclination angle and confining pressure. Under low confining pressure, the failure mode is mainly affected by the fracture inclination angle, while under high confining pressure, the failure mode is mainly affected by confining pressure. Chen et al. (2022) established a numerical model of rock with three groups of parallel intermittent joints and studied the influence of confining pressure on stress-strain curve, fracture mode and contact force distribution. Gao and Meguid (2022) carried out the PFC numerical simulation of jointed rock under confining pressure and analyzed the mechanical and deformation behavior of jointed rock with the help of acoustic emission.
The jointed rocks in the above research objects are all set as non-filling jointed rocks, but the joints in engineering rock masses often contain certain filling materials. Compared with non filled joints, filled joints have worse mechanical strength and deformation characteristics due to their good fracture connectivity and low strength of filling materials. Under the action of external load, the filled joint layer is easy to produce normal and tangential deformation, which is easy to cause geological disasters and instability and failure of underground cavern engineering (Jiang et al., 2018; Chang et al., 2020; Huang et al., 2020a; Huang et al., 2020b; Huang et al., 2020c). In recent years, the researches on the mechanical behavior of filled jointed rock have been increasing (Li and Ma, 2009; Li et al., 2010; Tang and Wong, 2016; Han et al., 2020), the effects of joint filling materials characteristics and environmental degradation on the static, dynamic, shear and other mechanical properties of filled jointed rock are mainly studied (Chai et al., 2020; Su et al., 2021; Chai et al., 2022a; Chai et al., 2023; Luo et al., 2023). However, there are relatively few studies on filled jointed rock under confining pressure. In particular, there are few reports on PFC simulation of filled jointed rock under confining pressure.
Based on this, the PFC2D program is used to study the mechanical and deformation characteristics of filled jointed rock under confining pressure. Firstly, the numerical model of filled jointed rock is constructed in PFC2D program, according to the laboratory physical static uniaxial compression test results of filled jointed rock, the micro-mechanical parameters calibration and rationality verification are carried out, and the strength characteristics, deformation failure characteristics and micro-cracks development characteristics of filled jointed rock under different confining pressure levels, joint inclination angles and size effects are further studied. This study can deepen the understanding of mechanical properties of jointed rock and provide reference for engineering stability analysis of jointed rock under confining pressure.
2 Laboratory test of filled jointed rocks
Considering the difficulty and high cost of sampling filled jointed rock mass in practical engineering, this experiment used filling mortar to simulate the filling of jointed layer in practical engineering according to the similarity principle. The rock sample used in the test is selected from a granite with good texture in Weinan City, Shaanxi Province, and the filling mortar is composed of lime, sand and water in proportion. In actual engineering rock masses, the filled jointed layer is a mixture of rock debris and minerals with certain viscosity, which is formed by differentiation and bonding during the sedimentation process. Its physical and mechanical properties such as density and strength are between the original rock and clay. In previous research work (Chai et al., 2020a; Chai et al., 2020b), four different filling materials were used to prepare filled jointed rock samples. They can approximate the simulation of different characteristics of filled jointed layer in actual practice. Although there are differences in mineral composition from the actual filled joints, the mechanical properties of the filled joints are similar. Therefore, this method of artificially preparing filled jointed rock has a certain feasibility. This paper only focuses on studying one type of filled jointed rock. The preparation of filled jointed rock sample is carried out according to these references (Chai et al., 2020; Chai et al., 2022b). The filled jointed rock sample is composed of granite on both sides and the filling joint layer in the middle. The basic mechanical and deformation parameters of granite and filling mortar are shown in Table 1. Three types of samples with different sizes are prepared. Though the thickness of the filled jointed layer is one of the main factors affecting the mechanical properties of jointed rocks, in this study the thickness of the filling joint layer is 5 mm, and the diameter of the granite on both sides is 50 mm, and the thickness is 15, 25 and 35 mm, respectively, as shown in Figure 1. During the preparation process, the outer surfaces of granite on both sides are polished and leveled (the flatness error is within 0.02 mm), and the inner surfaces of granite samples on both sides are grooved with equal spacing and depth, so as to ensure the consistency of joint roughness coefficient and joint matching coefficient. The WAW31000 universal testing machine was used to carry out the static uniaxial compression test. Before each compression test, the filled jointed rock sample is placed in the center of the pressure plate of the testing machine, and the ball joint base of the testing machine is adjusted to ensure that the rock sample is compressed vertically. The GTC350 electro-hydraulic servo control system is then used to apply a constant pressure to ensure the accuracy of the test. During the uniaxial compression test, the test force loading was used to control the loading rate of 50 N/s. The stress-strain curve and deformation failure characteristics of filled jointed rock samples during the uniaxial compression process were recorded. In order to improve the reliability of the test results, parallel tests were conducted, with three samples being repeated in one group.
Table 1
| Type | Density (kg/m3) | Strength (MPa) | Young’s Modulus (GPa) |
|---|---|---|---|
| granite | 2430 | 67 | 57 |
| filling mortar | 1593 | 1.62 | 1.60 |
The basic mechanical and deformation parameters of granite and filling mortar.
Figure 1
The failure process of filled jointed rock with different sample sizes is similar, as shown in Figure 2, which shows the deformation and failure characteristics of samples with dimensions of 50 mm × 35 mm in the process of uniaxial compression. Through the experimental phenomenon, it can be found the filled joint layer is compressed first in the process of uniaxial compression of filled jointed rock, and some small cracks appear in the filled joint layer, and the edges of the filled jointed rock bulge outward with debris falling off. With the application of load, the cracks in the filled joint layer continue to develop and the filling joint layer reaches the compaction state. The rocks on both sides begin to be compressed and cracks appear. After continuous loading, the cracks on both sides of the rock will continue to expand and connect, ultimately leading to the instability and failure of the filled jointed rock.
Figure 2
3 Establishment and verification of PFC numerical model
The numerical model built in PFC2D program is composed of a series of two-dimensional circles, which simulate the mechanical properties of granular media through the motion and interaction of circular granular media. In order to compare and verify with the laboratory test results, three numerical models of filled jointed rock consistent with the same sizes as the actual samples are established in the PFC2D program, as shown in Figure 3. Considering the calculation efficiency and the selection of particle size in the references (Lee and Jeon, 2011; Yang et al., 2014; Chen et al., 2022), Rmin is set to 0.3mm, Rmax is set to 0.5 mm, porosity is 1.2%, and particle density is 2700 kg/m3. The numerical models with sizes of 50 mm × 35 mm, 50 mm × 55 mm and 50 mm × 75 mm generate 3370, 5288 and 7232 particles, and the number of contacts is 7675, 12084 and 16471, respectively. In the PFC program, the contact model is used to describe the physical characteristics of the contact between particles. There are several built-in contact models in the PFC program, among which the parallel bond model has been proven to better simulate the mechanical behavior of rock materials (Lee et al., 2011). Therefore, this numerical model adopts the parallel bond model.
Figure 3
The parameters that determine the contact characteristics of particles in the PFC software are called micro-mechanical parameters. Micro-mechanical parameters calibration is the key to establish an accurate particle flow numerical model. The “trial-and-error method” (Yoon, 2007; Lee and Jeon, 2011) is used to calibrate the micro-mechanical parameters. The idea of “trial-and-error method” is to calibrate the elastic modulus by adjusting the pb_emod and the emod of micro-mechanical parameters, and then calibrate the Poisson’s ratio by adjusting the pb_krat and the krat of micro-mechanical parameters and calibrate the peak stress by adjusting the pb_coh and the pb_ten of micro-mechanical parameters. Through extensive trial calculations and repeated adjustments to the micro-mechanical parameters, the stress-strain curves and failure mode results of numerical simulation test and laboratory physical test are close to each other.
In the process of establishing the numerical model, micro-mechanical parameters calibration considered the mechanical properties of the filled jointed layer and the rock layer, as well as their interactions. In addition, there is a certain bonding force between the filled jointed layer and the rock layer, and the magnitude of the bonding force is basically the same as the internal bonding force in the filled jointed layer. In order to more accurately simulate the real engineering rock masses, the micro-mechanical parameters between the rock layer and the filled jointed layer are consistent with the micro-mechanical parameters of the contact between particles within the filled jointed layer.
Taking the filled jointed rock with dimensions of 50 mm × 35 mm as an example, the comparison results of stress-strain curves between numerical simulation and laboratory physical tests are shown in Figure 4. It can be seen that the uniaxial compression stress-strain curves of numerical simulation and laboratory test are highly similar in the later stage, except for the difference in the early stage. This is because the numerical model in PFC2D program has reached the dense state through the servo mechanism in the initial state, it is unable to simulate the initial compaction stage of rock sample in the compression process (Yang et al., 2016). Therefore, when comparing and analyzing the numerical simulation results and the laboratory test results, the compression deformation generated by the filled joint layer in the laboratory test compaction stage is ignored, while the difference between the peak stress and the elastic modulus in the elastic stage as well as the final failure mode are mainly compared. The comparison of numerical simulation and laboratory physical test compression failure mode results are shown in Figure 4. It is found that the final failure mode of the numerical model is relatively consistent with that of the actual physical test filled jointed rock. The micro-mechanical parameters of the numerical model calibrated through the “trial-and-error method” are shown in Table 2. Further comparing the peak stress and elastic modulus values of the numerical simulation and laboratory physical test results in Table 3, it can be found that the relative error range of the peak stress is within 4.5%, and the relative error range of the elastic modulus is within 1.5%. The numerical results show a good agreement, indicating that the numerical model can more accurately simulate the actual filled jointed rock. Thus, the correctness and reliability of the numerical model and the selection of micro-mechanical parameters are also verified.
Figure 4
Table 2
| Group | pb_emod/GPa | pb_krat | pb_ten/MPa | pb_coh/MPa | pb_fa | emod/GPa | krat |
|---|---|---|---|---|---|---|---|
| Filled jointed rock | 0.125 | 1.65 | 2.76 | 2.76 | 25 | 0.125 | 1.65 |
| Rock | 2.0 | 1.8 | 46 | 46 | 27.4 | 2.0 | 1.8 |
Micro-mechanical parameters table of numerical model of filled jointed rock.
Table 3
| Sample size | Peak stress/MPa | Elasticity modulus/GPa | ||||
|---|---|---|---|---|---|---|
| physical experiment | numerical simulation | relative error | physical experiment | numerical simulation | relative error | |
| 50mm×35mm | 47.35 | 45.26 | 4.4% | 0.845 | 0.851 | 0.7% |
| 50mm×55mm | 40.84 | 42.41 | 3.7% | 1.017 | 1.030 | 1.3% |
| 50mm×75mm | 50.15 | 49.12 | 2.1% | 1.201 | 1.214 | 1.1% |
Comparison of mechanical parameters between physical test and numerical simulation results.
The development of micro-cracks in the numerical model of filled jointed rock during uniaxial compression are recorded at equal intervals, as shown in Figure 5. It can be seen that there are a few micro-cracks in the filled joint layer in the first stage of compression process. Afterwards, micro-cracks continue to occur and mostly appear in the outer region of the filled joint layer. With the increase of time step, the micro-cracks in the filled joint layer continue to expand towards the central region. At the same time, it can be seen that the particles outside the filled joint layer are squeezed and displaced, leading to the phenomenon of “escape”. With the continuous compression process, the filled joint layer is filled with micro-cracks, and micro-cracks begin to appear on both sides of the rock. The micro-cracks on both sides of the rock continue to expand and converge, and then the cracks continue to develop along the radial direction, ultimately forming through cracks that cause damage to the filled jointed rock. By comparing Figure 2, it can be seen that PFC2D program can accurately simulate the entire failure process of filled jointed rock, which is consistent with the observation results of laboratory physical test, further verifying the feasibility and accuracy of PFC2D program simulating filled jointed rock.
Figure 5
4 Analysis of results
4.1 Analysis of strength characteristic
The confining pressure levels are respectively set as 2, 4, 6 and 8 MPa to simulate the biaxial compression of filled jointed rock under different confining pressures. Then the influence of confining pressure on the strength characteristics of filled jointed rock are accordingly explored. Figure 6 shows the stress-strain curves of filled jointed rock with different sample sizes.
Figure 6
It can be seen from Figure 6 that the shape of stress-strain curves under different confining pressure levels are basically the same. Compared to the uniaxial compression test, when the confining pressure level is increased to 2 MPa, the slope of the stress-strain curve increases to a certain extent. This is because the lateral wall of the numerical model provides a restraining effect, which limits the lateral deformation of filled jointed rock, resulting in an increase in the elastic modulus of the numerical model, manifested as an increase in the slope of the stress-strain curve. As the confining pressure level continues to increase, the slope of the stress-strain curve remains basically unchanged, indicating that the continuous increase in confining pressure level has little effect on the elastic modulus of the filled jointed rock. It is also found that the peak stress and peak strain of filled jointed rock with different sizes continuously increase with the increase of confining pressure. Taking the sample with the dimension of 50 mm × 35 mm as an example, the peak stress of filled jointed rock under uniaxial compression is 44.51 MPa. When the confining pressure is 2, 4, 6 and 8 MPa, the peak stress of filled jointed rock increased by 11.78%, 21.65%, 31.25% and 39.73%, respectively, while the peak strain increased by 7.77%, 20.20%, 26.63% and 34.46%, respectively. Comparing the peak stress of samples with different sizes under the same confining pressure level, as shown in Figure 7, it can be seen that the peak stress of filled jointed rock increases with the increase of sample size.
Figure 7
In addition, taking the sample with the dimension of 50 mm × 35 mm as an example, biaxial compression simulation is carried out for filled jointed rocks with different joint inclination angles (0°, 15°, 30°, 45°, 60°, 75° and 90°) under different confining pressure levels. The stress-strain curve is shown in Figure 8. It can be found that the change of joint inclination angle has a significant influence on the shape of stress-strain curve, and the slope of stress-strain curve decreases first and then increases with the increase of joint inclination angle. The variation curves of peak stress of filled jointed rock with joint inclination angle under different confining pressure levels are shown in Figure 9. It can be seen that under the same confining pressure level, the peak stress shows a trend of first decreasing and then increasing with the increase of joint inclination angle. Under the same confining pressure level, when the joint inclination angle is 30°, the peak stress value is the smallest, while when the joint inclination angle is 90°, the peak stress value is the largest. It can be seen that when the joint inclination angle is 30°, the filled jointed rock has the weakest resistance to load.
Figure 8
Figure 9
Further analyze the variation pattern of peak stress with the change of confining pressure level under different joint inclination angles, as shown in Figure 10. Through the data fitting, it can be found that there is a strong linear relationship between peak stress and confining pressure level under different joint inclination angles, and the peak stress continuously increases with the increase of confining pressure level. It can also be seen from Figure 10 that with the increase of confining pressure level, the slope of fitting curve of peak stress varies under different joint inclination angles, it means that the growth rate of peak stress is different. When the joint inclination angle is 0°, 15°, 30°, 45°, 60°, 75° and 90°, the slope of the fitting curve for the peak stress of filled jointed rock is 2.245, 1.901, 1.036, 3.090, 3.054, 2.812 and 2.964, respectively. Obviously, when the joint angle inclination angle is 30°, the slope of the fitting curve is the smallest. when the joint inclination angle is larger (joint inclination angle >30°), the slope of the fitting curve is higher, and the slope values are all greater than 2.80. This indicates that the peak stress growth rate is higher when the joint inclination angle is larger, it means that the confining pressure effect of peak stress is more obvious when the joint inclination angle is larger.
Figure 10
The initiation stress is introduced for in-depth analysis, and the axial stress corresponding to 1% of the number of micro-cracks when the number of micro-cracks is the peak stress during uniaxial compression is defined as the initiation stress (Potyondy and Cundall, 2004). The initiation stress of filled jointed rock under different confining pressure levels is listed in Table 4.
Table 4
| Joint angle | Confining pressure level | ||||
|---|---|---|---|---|---|
| 0 MPa | 2 MPa | 4 MPa | 6 MPa | 8 MPa | |
| 0° | 8.05 | 7.53 | 5.86 | 4.09 | 3.39 |
| 15° | 7.52 | 6.86 | 5.76 | 4.01 | 3.27 |
| 30° | 4.06 | 5.15 | 5.17 | 4.43 | 4.09 |
| 45° | 5.24 | 10.05 | 12.30 | 12.53 | 12.72 |
| 60° | 10.65 | 18.09 | 22.30 | 24.36 | 27.44 |
| 75° | 17.24 | 24.94 | 29.91 | 32.88 | 33.39 |
| 90° | 30.61 | 32.46 | 33.48 | 34.20 | 35.57 |
Initiation stress of filled jointed rock under confining pressure.
It can be seen from Table 4 that with the increase of confining pressure level under different joint inclination angles, the variation laws of initiation stress of filled jointed rock is different. When the joint inclination angle is less than 30°, the initiation stress decreases with the increase of confining pressure level. When the joint inclination angle is 30°, the initiation stress is basically unchanged with the increase of confining pressure level. When the joint inclination angle is greater than 30°, the initiation stress increases with the increase of confining pressure level. This is because when the joint inclination angle is small, the existence of confining pressure improves the stiffness of the upper and lower rock layers, making the filled joint layer more prone to failure in the compression process. When the joint inclination angle is large, the confining pressure restricts the lateral deformation of the filled jointed rock, so that the vertical pressure is mainly borne by the left and right rock layers, which reduce the stress concentration in the filled jointed layer and delays the failure of the filled jointed layer. It can be seen that the high confining pressure environment can inhibit the cracking behavior of filled jointed rock when the joint inclination is large, and the initiation stress under confining pressure depends on the angle between the loading direction and the joint surface. In addition, at the same confining pressure level, the initiation stress of filled jointed rock decreases first and then increases with the increase of joint inclination, initiation stress follows the same variation pattern as the peak stress. The increase of confining pressure level has the greatest influence on filled jointed rock with the joint inclination of 0° and 45°. When the confining pressure level is increased to 8 MPa, the initiation stress of the filled jointed rock decreases by 57.89% for a joint inclination angle of 0°, while it increases by 142.75% for joint inclination angle of 90°. At any confining pressure level, the initiation stress is the largest when the joint inclination is 90°, which indicates that the filled joined rock is the least prone to crack when the joint inclination is 90°.
4.2 Analysis of deformation and failure form
The final failure morphology of filled jointed rock with different sample sizes under confining pressure is shown in Table 5. It can be observed that under uniaxial compression, all the filled jointed rocks with different sample sizes have macro cracks. With the increase of confining pressure level, the width of macro cracks decreases continuously and the distribution of micro-cracks becomes more dispersed. Obviously, the confining pressure can suppress the generation of macro fracture surface. It can also be seen that the failure mode of filled jointed rock under uniaxial compression is mostly splitting failure. With the increase of confining pressure level, the failure mode changes from splitting failure to shear failure, indicating that the increase in confining pressure level causes the failure of filled jointed rock to transition from brittleness to ductility, while the change of sample size has little effect on the failure mode of filled jointed rock.
Table 5
| Sample size | Confining pressure level | ||||
|---|---|---|---|---|---|
| 0 MPa | 2 MPa | 4 MPa | 6 MPa | 8 MPa | |
| 50mm ×35mm | 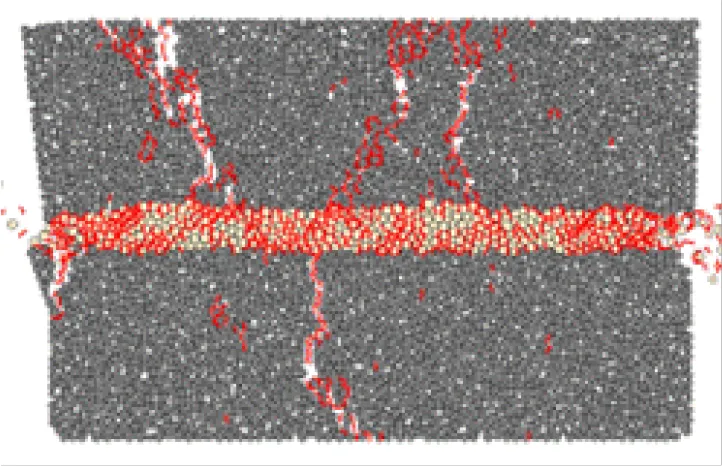 | 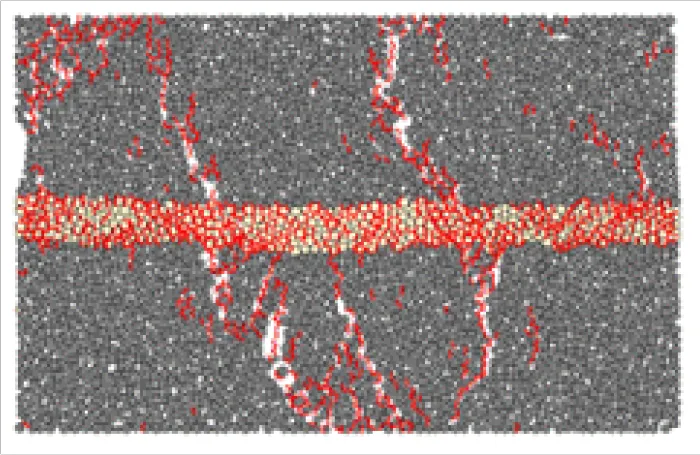 | 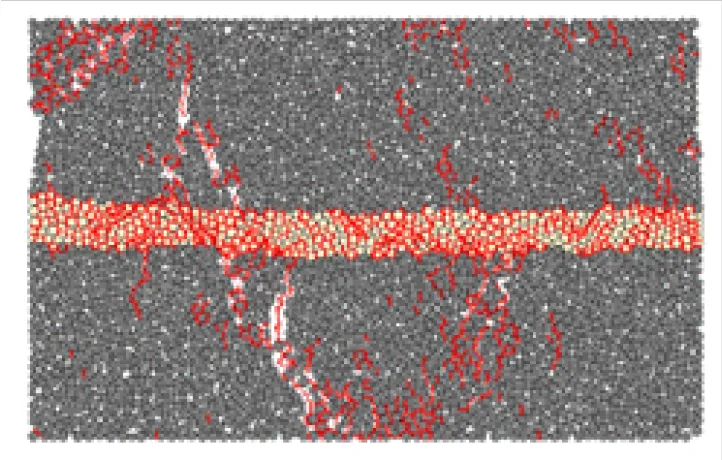 | 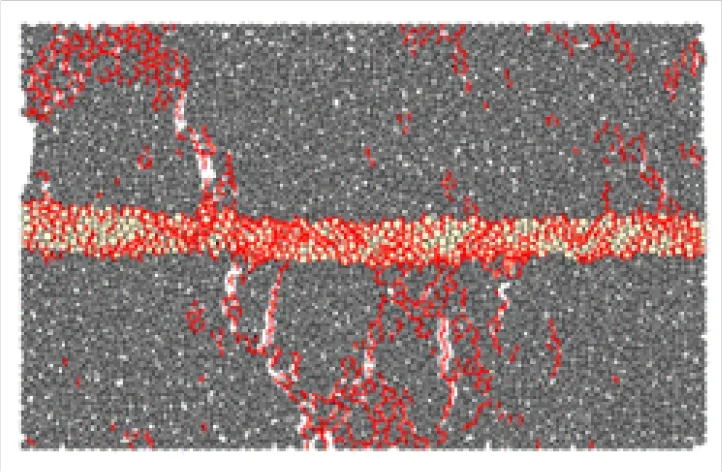 | 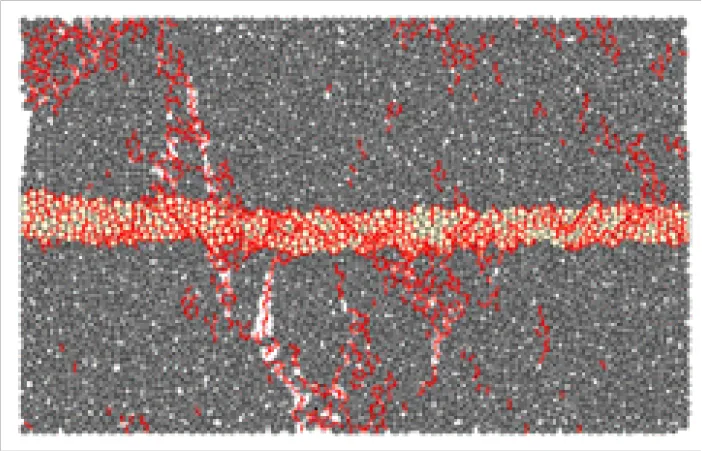 |
| 50mm ×55mm | 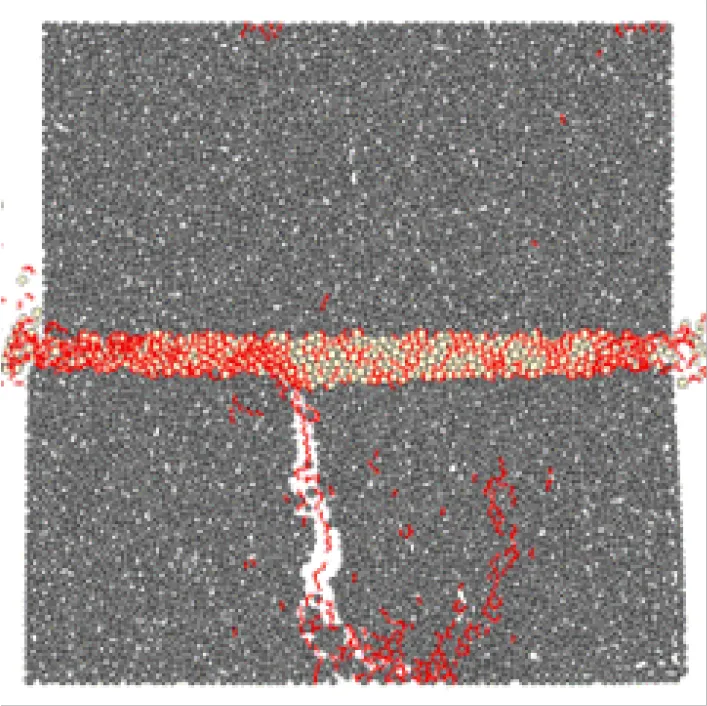 | 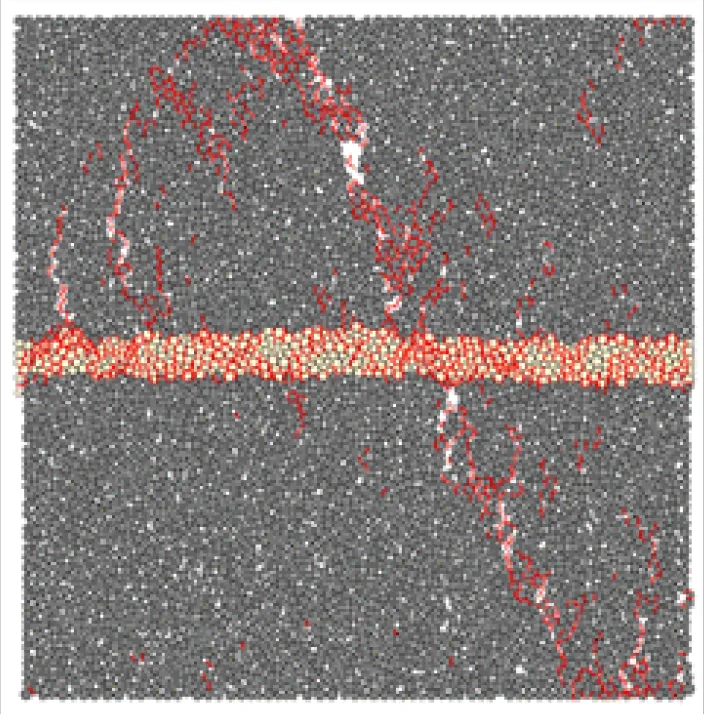 | 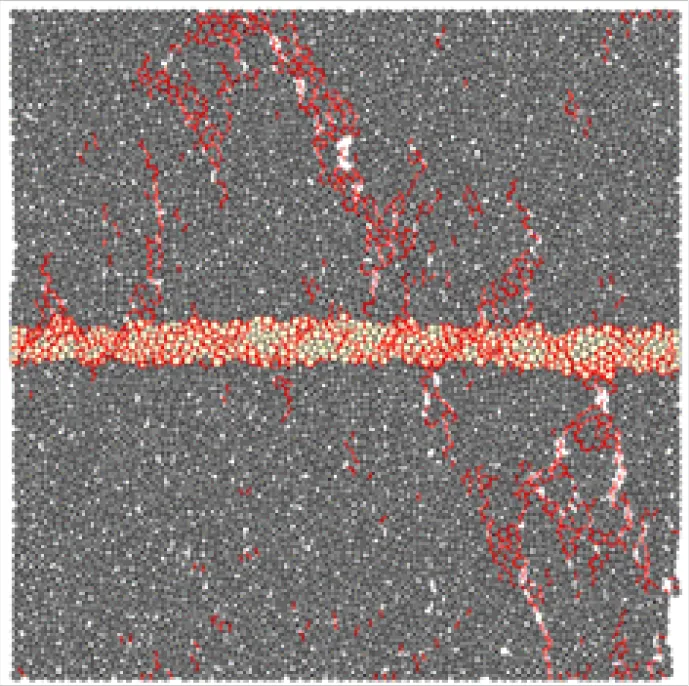 | 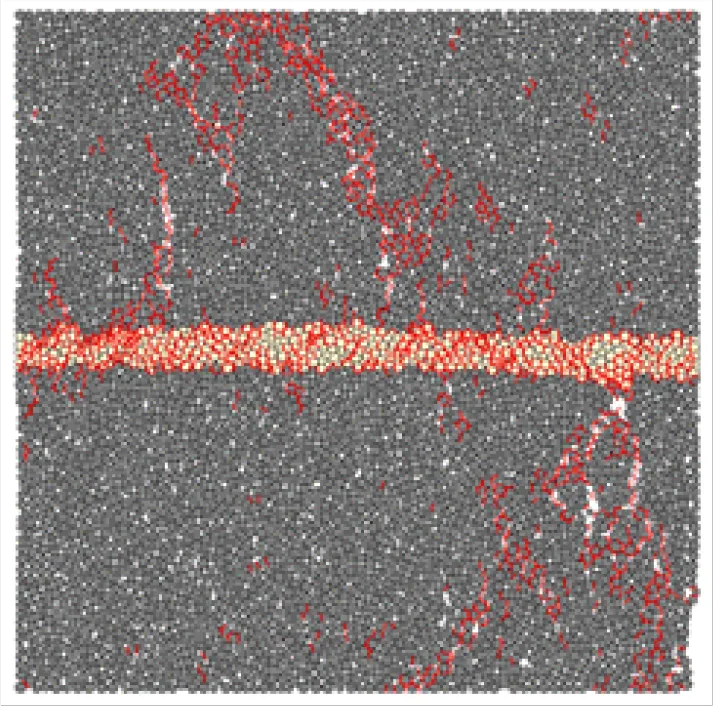 | 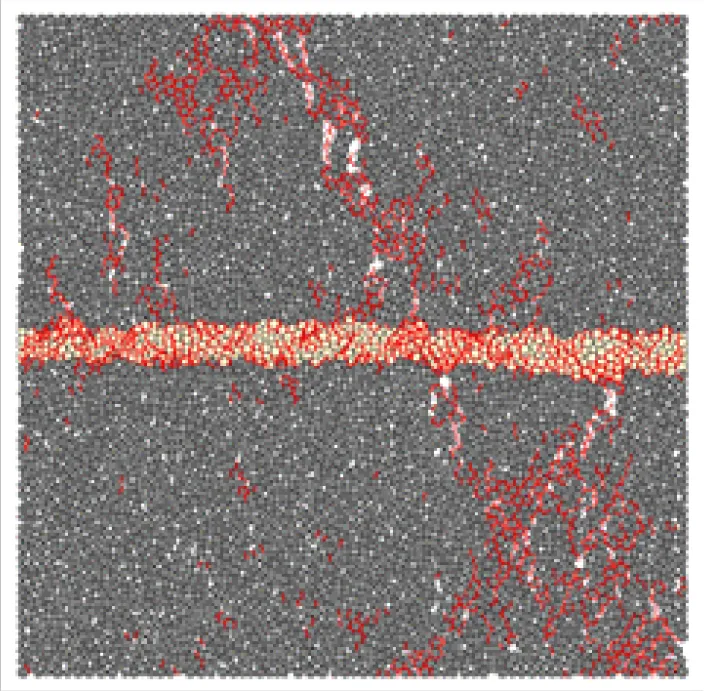 |
| 50mm ×75mm | 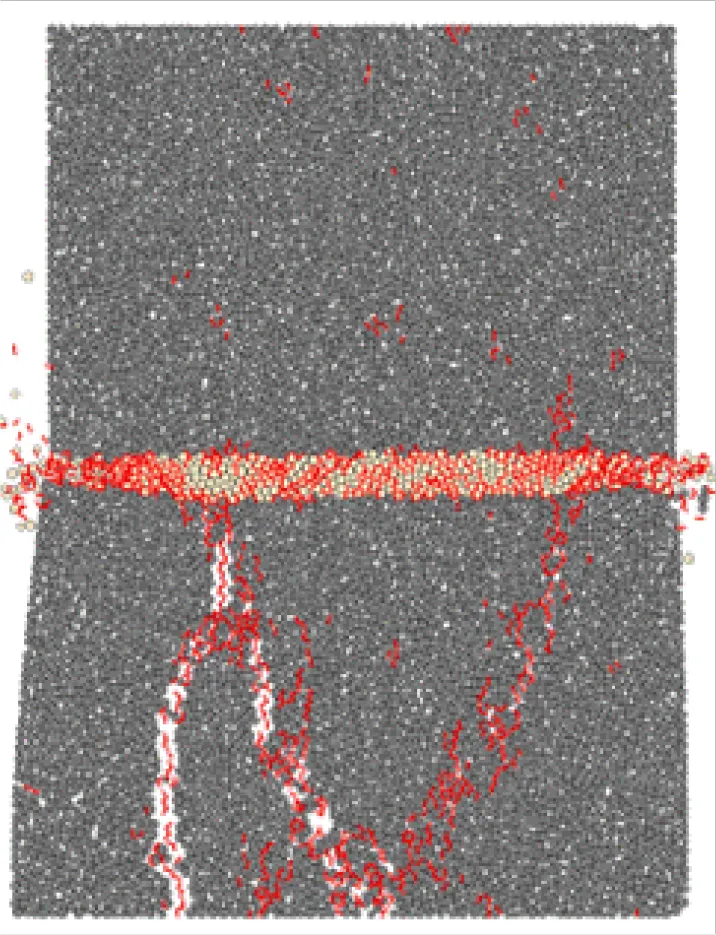 | 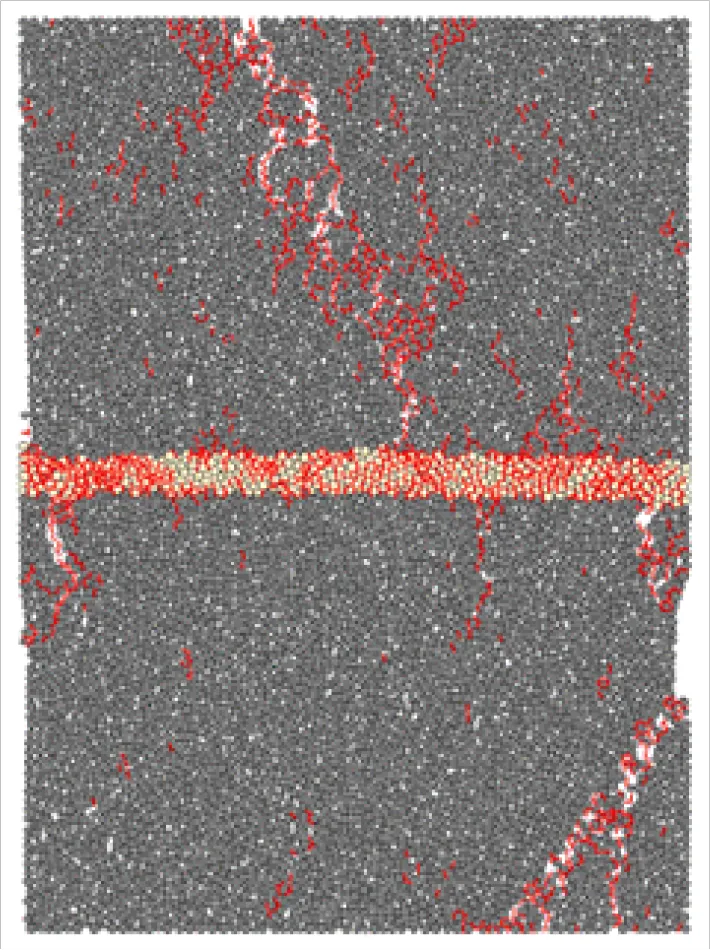 | 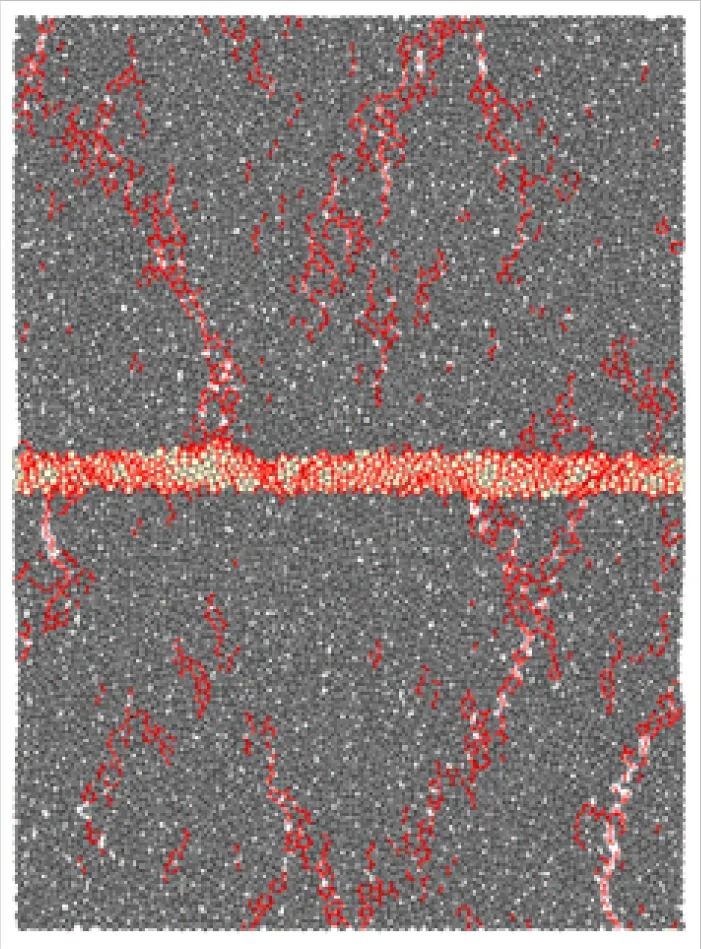 | 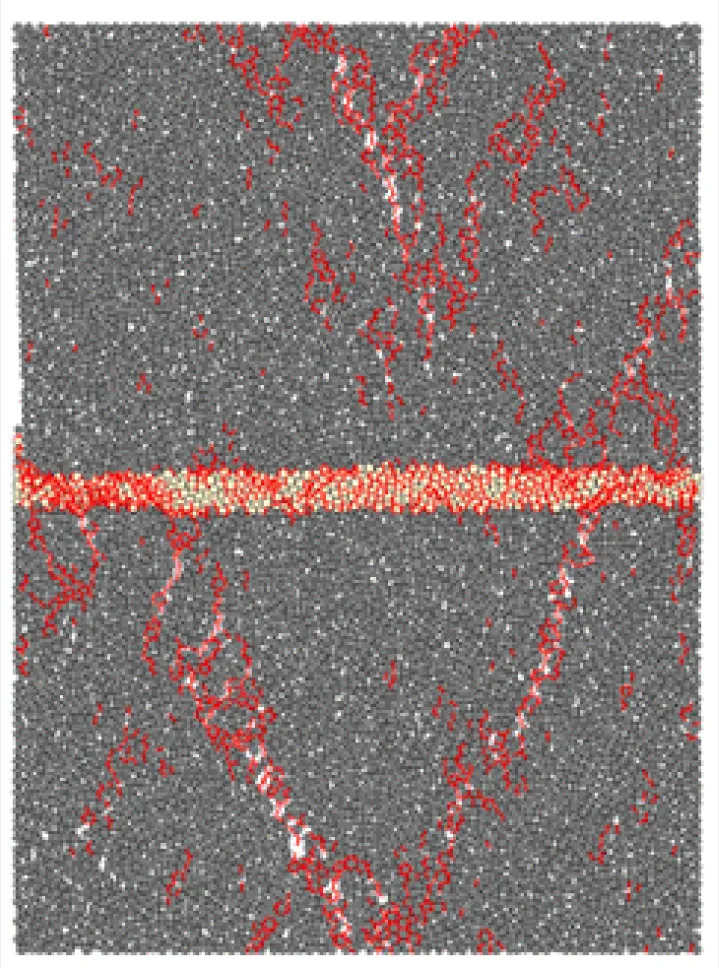 | 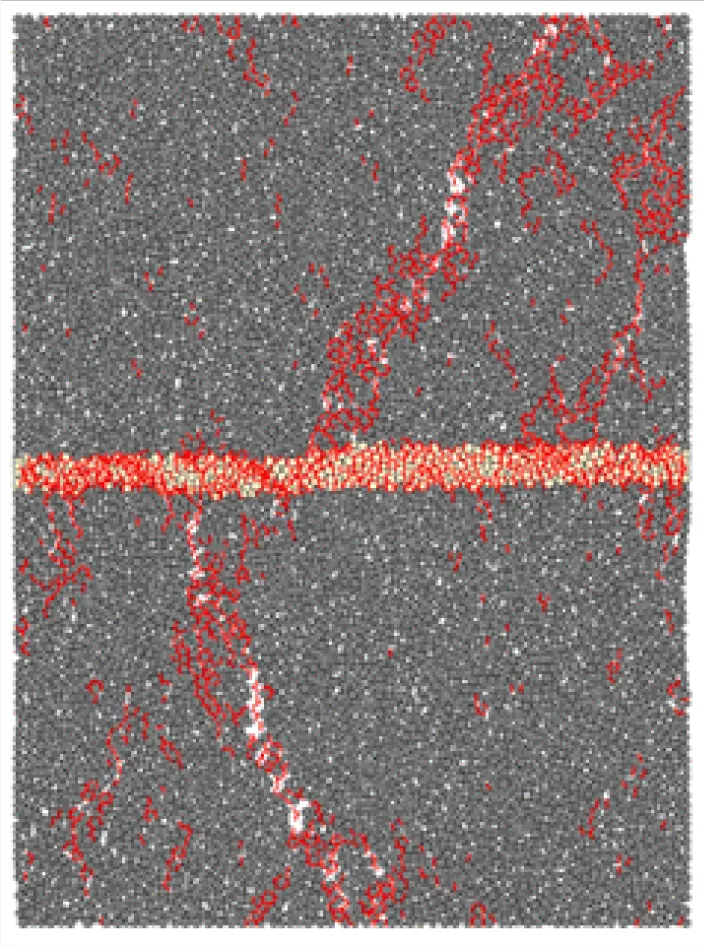 |
Final failure patterns of filled jointed rock with different dimensions under confining pressure.
The final failure modes of filled jointed rock with different joint inclination angles under confining pressure are shown in Table 6 (only the final failure modes with joint inclination angles of 30°, 60° and 90° are listed, and the final failure modes with joint inclination angles of 0° are shown in the first row of Table 5). Through observation, it can be seen that the joint inclination angle will significantly affect the final failure mode of the filled jointed rock. Taking the confining pressure of 0 MPa as an example, when the filled joint layer is in the horizontal position, the final failure mode is characterized by significant vertical compression of the filled joint layer and the occurrence of through cracks in the rocks on both sides. When the joint inclination angle is 30°, the micro-cracks are concentrated in the filled joint layer while the rock layer is undamaged. As the joint inclination angle increases, the compression magnitude of the filled joint layer decreases. When the joint inclination angle is 60°, the total number of micro-cracks in the filled jointed rock significantly decreases, and the filled joint layer is separated from the rock layer to a certain extent. A macro connected large crack appears in the rock layer, finally leading to the failure of the sample. As the joint inclination angle continues to increase, the number of micro-cracks in the rock layer continues to increase. When the joint inclination angle is 90°, it can be seen that the damage of the rock layer is the most serious. From the above, it can be inferred that when the joint inclination angle is 90°, the peak stress and initiation stress of the filled jointed rock are the largest. Therefore, it can be inferred that when the joint inclination angle is small, the vertical pressure is mainly borne by the filled joint layer and the rock layers. When the joint inclination angle is large, the vertical pressure is mainly borne by the rock layers on both sides. At the same joint inclination, the total number of micro-cracks increases continuously with the increase of confining pressure level, and the distribution of micro-cracks becomes more dispersed.
Table 6
| Joint angle | Confining pressure level | ||||
|---|---|---|---|---|---|
| 0 MPa | 2 MPa | 4 MPa | 6 MPa | 8 MPa | |
| 30° | 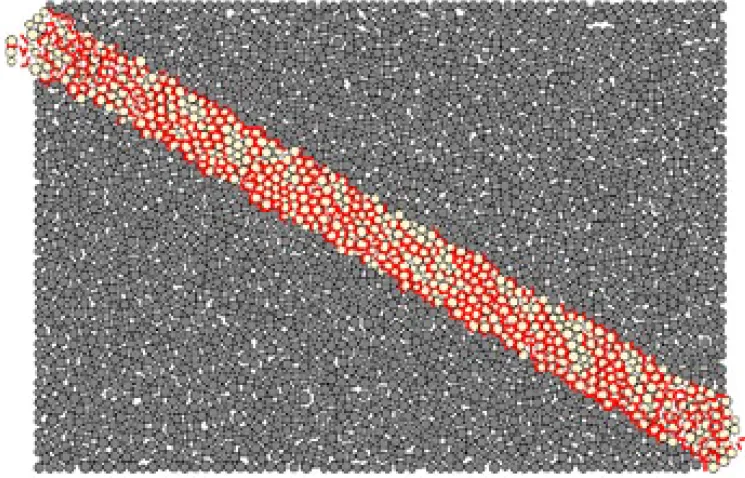 | 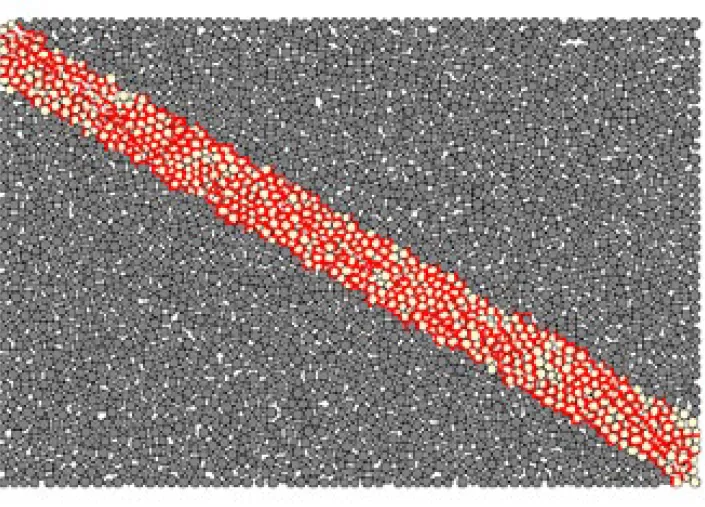 | 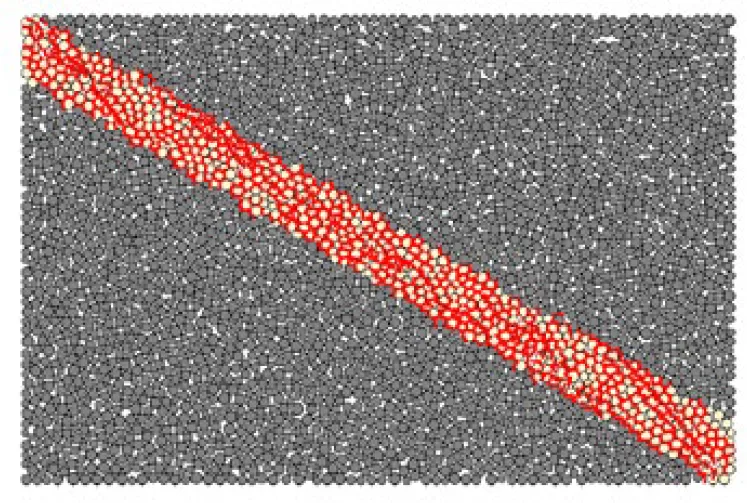 | 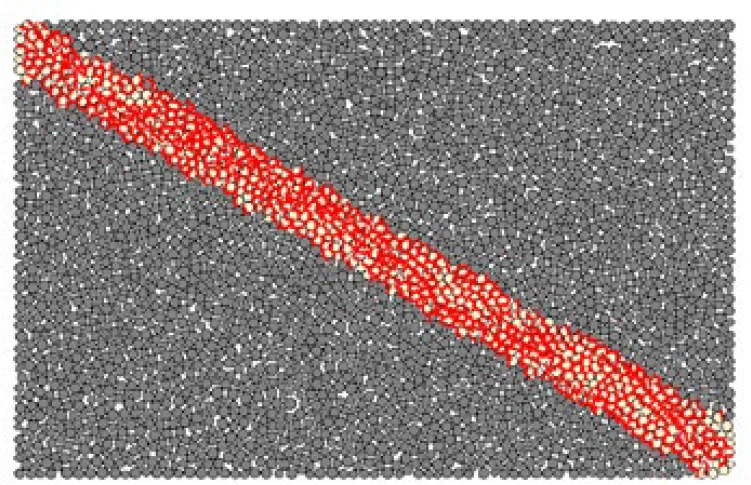 | 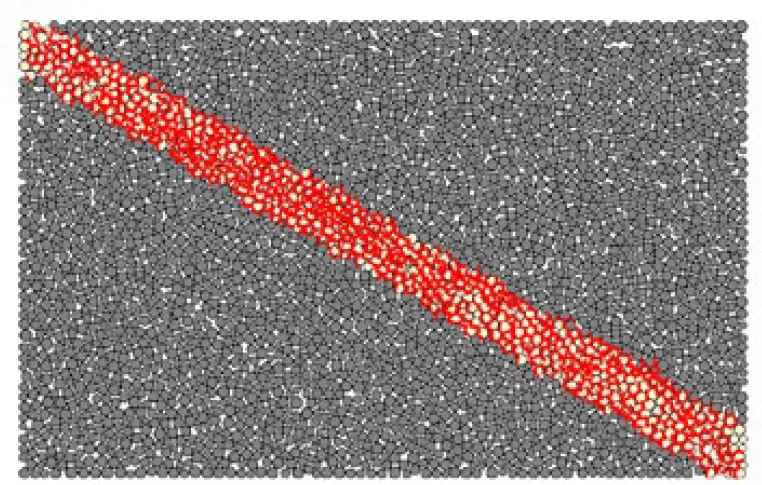 |
| 60° | 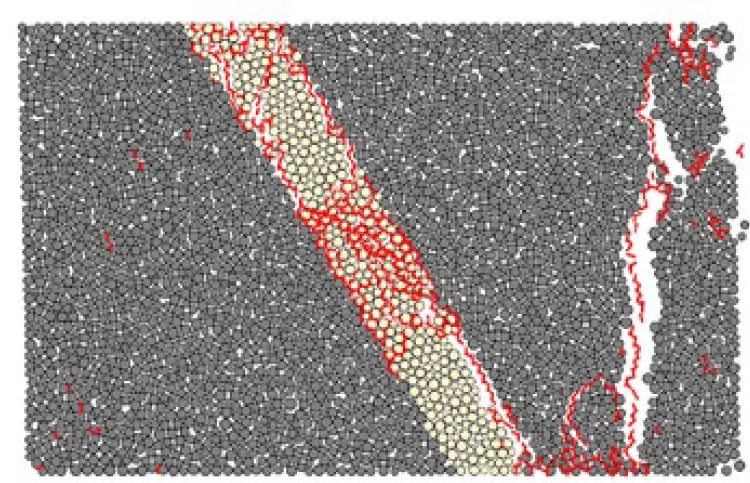 | 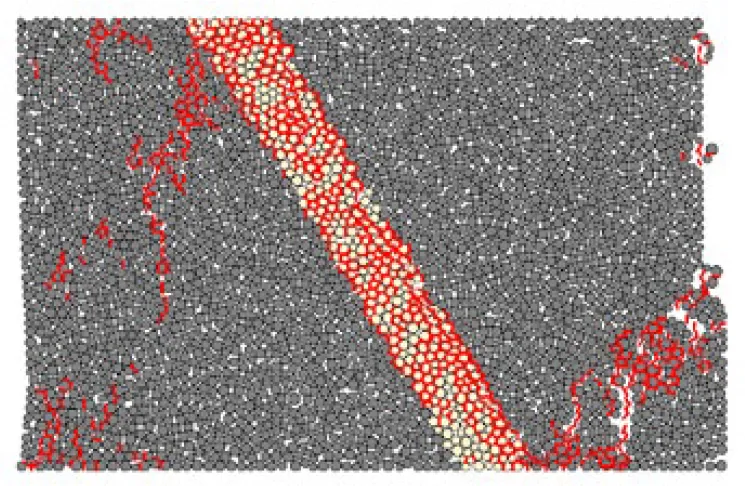 | 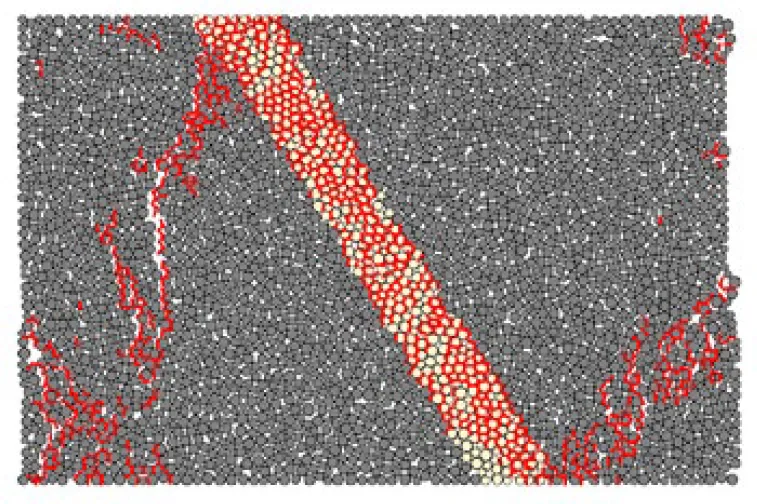 | 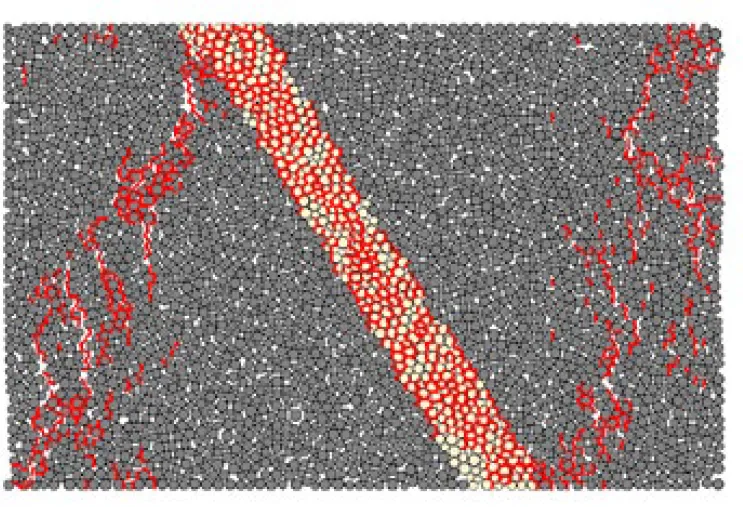 | 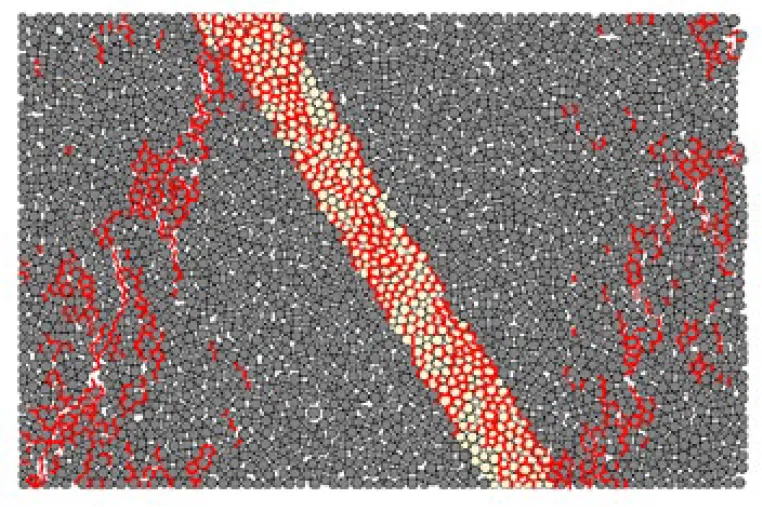 |
| 90° | 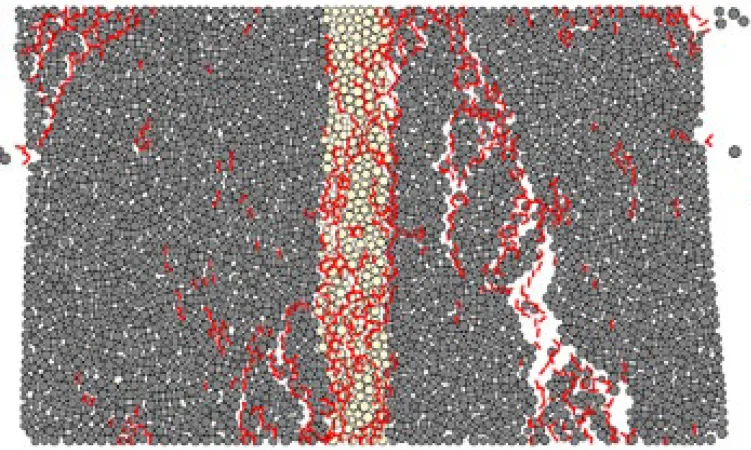 | 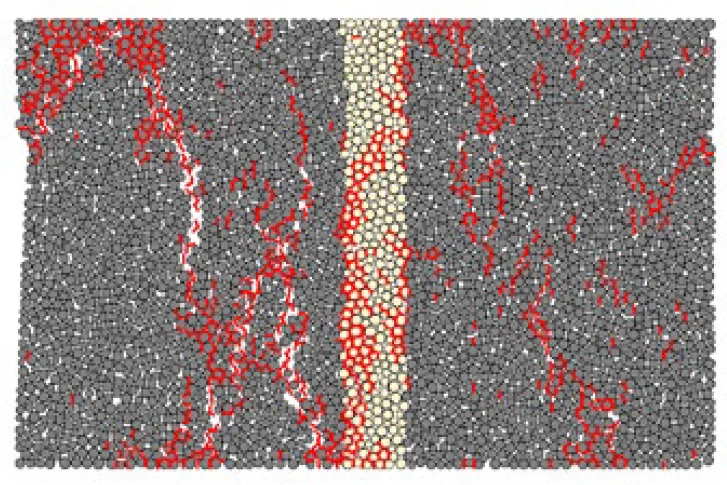 | 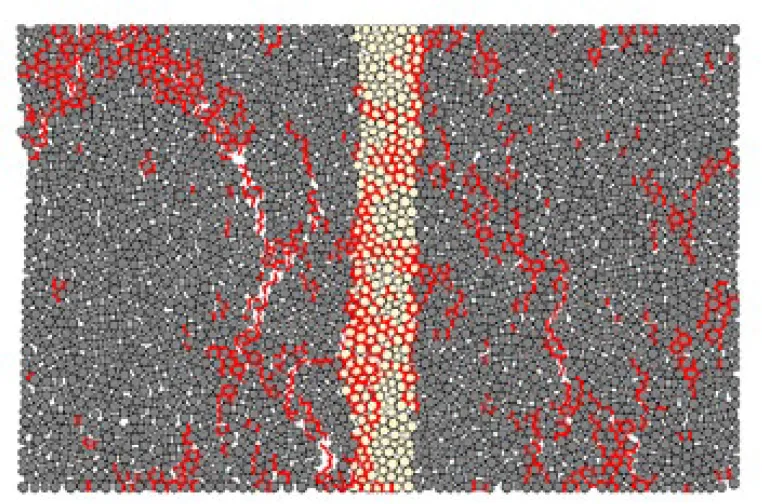 | 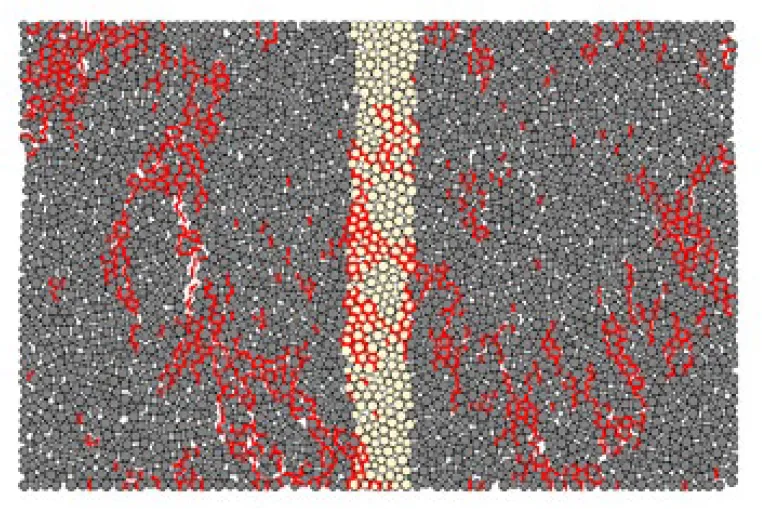 | 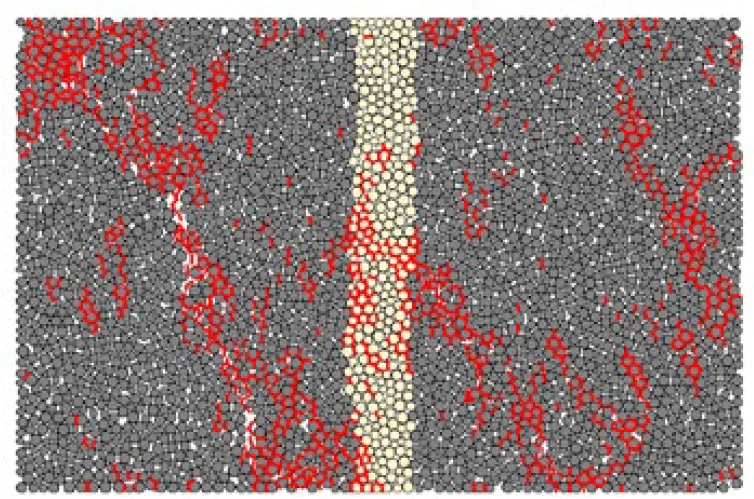 |
Final failure patterns of filled jointed rock with different joint inclination angle s under confining pressure.
4.3 Analysis of micro-cracks development characteristics
In PFC program, the change of micro-cracks can be monitored by compiling the command flow code. Studying the variation rule of micro-cracks is helpful to reveal the deformation and failure mechanism of filled jointed rock. In order to visually display the change of the number of micro-cracks in filled jointed rock under confining pressure, the data points of the number of micro-cracks and strain during compression are extracted, as shown in Figure 11. Only the variation curves of microcrack quantities are listed for joint inclination angles of 0°, 30°, 60°, and 90°.
Figure 11
Figure 11 shows that as the confining pressure level increases, the curve of micro-crack development gradually becomes longer and shifts towards the right. It can be seen that confining pressure prolongs the development process of micro-cracks in filled jointed rock but has little effect on the development shape of micro-cracks. However, the morphology of the micro-cracks development curve is significantly different when the joint inclination changes. From Figure 11A, it can be seen that when the joint inclination is 0°, the development curve of micro-cracks is mainly divided into three stages, showing a characteristic of rapid growth in the early stage, slow growth in the middle stage, and rapid growth in the later stage. Combined with Figure 5, the characteristics of the three stages can be explained as follows. Because the strength and modulus of the filled joint layer are low and the joint surface is perpendicular to the loading direction, under pressure, the cracks are more likely to occur and crack propagation is faster in low strength materials. Thus, the growth of cracks is relatively rapid in the early stage. The main reason for the slow growth of cracks in the middle stage is that the cracks in the filled joint layer no longer increase, and the crack generation location gradually shifts to the rock layer on both sides. The main reason for the rapid growth in the later stage is that the cracks in both sides of the rock layer continuously converge and expand under the action of pressure until the sample ultimately destroyed. The variation of micro-cracks in the filled jointed rock is obviously different from that in the intact rock sample in Figure 11A. The development of micro-cracks in the intact rock sample shows a trend of slow growth in the early stage and rapid growth in the late stage. Meanwhile, the strain corresponding to the initial micro-cracks is significantly higher than that of the filled jointed rock sample, indicating that the filled jointed rock sample is more likely to initiate micro-cracks in the early stage under compression. In addition, it can be seen that the total number of micro-cracks in the filled jointed rock is significantly higher than that in the intact rock due to the existence of low-strength filled joint layer.
When the joint inclination angle increases, the shape of the micro-cracks development curve changes obviously. In Figure 11B, when the joint inclination angle is 30°, the micro-cracks development speed is rapid in the early stage, and gradually slows down with the compression. The explanation for this is as follows. Based on the displacement field and velocity field of the particles in the numerical model in Figure 12 and the final failure morphology shown in Table 6, it can be seen that during compression progress, the particles in the rock layers on both sides move in reverse along the joint plane, causing sliding phenomena in the rock layers on both sides, resulting in shear failure of the filled joint layer. The vertical force required for shear failure is relatively small, so in the early stage of the compression process, obvious structural damage will occur in the filled joint layer, accompanied by the rapid development of micro-cracks. With the continuous compression, the shear failure of the filled joint layer is approaching completion, so the development speed of micro-cracks gradually slows down. With the continuous increase of joint inclination angle, the development of micro-cracks shows the characteristics of slow growth in the early stage and rapid growth in the late stage, which is similar to the development of micro-cracks in intact rock samples. This phenomenon can be explained in combination with the force chain diagram and contact force distribution diagram between particles of the numerical model when the joint inclination is 90° as shown in Figure 13. It can be seen from Figure 13A that the contact force chain between particles of the rock layer is relatively dense and contact force chain approximately parallel to the vertical loading direction when the joint inclination angle is large. In addition, from Figure 13B, it can be seen that the contact force value of the rock layer is large and the contact force value of the filled joint layer is relatively small, indicating that the stress concentration degree of the filled joint layer is weakened and the load bearing proportion is relatively small during the compression process. The rock layer serves as the main load-bearing framework, but a significant vertical force is required to generate micro-cracks in the contact between the particles in the rock layer, so the development of micro-cracks in the early stage of the compression process is relatively slow. From the above, it can be seen that the change in joint inclination angle will seriously affect the development characteristics of micro-cracks in filled jointed rock.
Figure 12
Figure 13
The relationship between the total number of micro-cracks in filled jointed rock and the confining pressure level during final failure is shown in Figure 14. It can be seen that under the same confining pressure level, the total number of micro-cracks is the highest when the joint inclination angle is 0°, while the total number of micro-cracks is the least when the joint inclination angle is 30°. At the same joint inclination, as the confining pressure level increases, the total number of micro-cracks in the final failure of filled jointed rock continues to increase. Through fitting, it is found that there is a good linear relationship between the total number of micro-cracks and confining pressure level. When the joint inclination angles are 0°, 30°, 60° and 90°, the slopes of the fitting curve of the total number of micro-cracks are 29.65, 28.00, 34.10 and 30.25, respectively, with values ranging from 29.5 to 30.5, which shows that the slope of the fitting curve of the total number of micro-cracks has little change with the change of joint inclination angle.
Figure 14
5 Conclusions
Based on the previous uniaxial compression test of filled jointed rock, a series of numerical simulations are carried out by using PFC2D program to verify the feasibility and accuracy of the simulation of the filled jointed rock. Then, through the PFC numerical simulation, the strength characteristics, deformation and failure characteristics and micro-cracks development characteristics of filled jointed rock with different confining pressure levels, joint inclination angles and sample sizes are analyzed. The main conclusions are as follows:
(1) The peak stress and peak strain continuously increase with the increase of confining pressure level, and there is a strong linear relationship between the peak stress and confining pressure level. However, the continuous increase of confining pressure level has little effect on the elastic modulus of filled jointed rock. In addition, the peak stress increases with the increase of sample size.
(2) The change in joint inclination angle has a great influence on the shape of stress-strain curve. The peak stress and initiation stress show a trend of first decreasing and then increasing with the increase of joint inclination angle. The peak stress value is the smallest when the joint inclination angle is 30°, and the peak stress value is the largest when the joint inclination angle is 90°. With the increase of confining pressure level, the variation pattern of initiation stress of filled jointed rock under different joint inclination angles is different. When the joint inclination angle is large, the high confining pressure environment can inhibit the crack behavior of filled jointed rock, and the initiation stress under confining pressure depends on the angle between the loading direction and the joint surface.
(3) As the level of confining pressure increases, the width of macro cracks decreases and the distribution of micro-cracks becomes more dispersed during the final failure of filled jointed rocks, indicating that the effect of confining pressure can suppress the generation of macroscopic fracture surfaces. The failure mode changed from splitting failure to shear failure with the increase of confining pressure. In addition, the change in sample size has little effect on the failure mode of filled jointed rock, while the joint inclination angle significantly influences the final failure mode of the filled jointed rock.
(4) The effect of confining pressure will prolong the development process of micro-cracks in filled jointed rocks. As the level of confining pressure increases, the total number of micro-cracks in the final failure of filled jointed rocks continues to increase. However, the effect of confining pressure has little effect on the development morphology of micro-cracks. The development curves of micro-cracks vary significantly under different joint inclination angles, indicating that changes in joint inclination angles can seriously affect the development characteristics of micro-cracks in filled jointed rock.
Statements
Data availability statement
The original contributions presented in the study are included in the article/supplementary material. Further inquiries can be directed to the corresponding author.
Author contributions
LS: Data curation, Formal Analysis, Investigation, Methodology, Software, Supervision, Validation, Writing – original draft. SC: Funding acquisition, Methodology, Resources, Software, Supervision, Validation, Visualization, Writing – original draft, Writing – review & editing. JL: Data curation, Investigation, Software, Validation, Writing – original draft. BS: Software, Writing – original draft. LC: Data curation, Writing – original draft.
Funding
The author(s) declare financial support was received for the research, authorship, and/or publication of this article. The work described in this paper was supported by the National Natural Science Foundation of China (No. 41902277 & No. 42172302) and Fundamental Research Funds for the Central Universities, CHD (No. 300102282201), and for which the authors are very thankful.
Conflict of interest
Author JL is employed by China Coal Aerial Photogrammetry and Remote Sensing Group Co., Ltd.
The remaining authors declare that the research was conducted in the absence of any commercial or financial relationships that could be construed as a potential conflict of interest.
Publisher’s note
All claims expressed in this article are solely those of the authors and do not necessarily represent those of their affiliated organizations, or those of the publisher, the editors and the reviewers. Any product that may be evaluated in this article, or claim that may be made by its manufacturer, is not guaranteed or endorsed by the publisher.
References
1
AlejanoL. R.ArzuaJ.BozorgzadehN.HarrisonJ. P. (2017). Triaxial strength and deformability of intact and increasingly jointed granite samples. Int. J. Rock. Mech. Min.95, 87–103. doi: 10.1016/j.ijrmms.2017.03.009
2
ArzúaJ.AlejanoL. R.WaltonG. (2014). Strength and dilation of jointed granite specimens in servo-controlled triaxial tests. Int. J. Rock. Mech. Min.69, 93–104. doi: 10.1016/j.ijrmms.2014.04.001
3
BahaaddiniM.HaganP. C.MitraR.KhosraviM. H. (2016). Experimental and numerical study of asperity degradation in the direct shear test. Eng. Geol.204, 41–52. doi: 10.1016/j.enggeo.2016.01.018
4
BahaaddiniM.SharrockG.HebblewhiteB. K. (2013a). Numerical investigation of the effect of joint geometrical parameters on the mechanical properties of a non-persistent jointed rock mass under uniaxial compression. Comput. Geotech.49, 206–225. doi: 10.1016/j.compgeo.2012.10.012
5
BahaaddiniM.SharrockG.HebblewhiteB. K. (2013b). Numerical direct shear tests to model the shear behaviour of rock joints. Comput. Geotech.51, 101–115. doi: 10.1016/j.compgeo.2013.02.003
6
CaiM. (2013). Principles of rock support in burst-prone ground. Tunn. Undergr. Sp. Tech.36, 46–56. doi: 10.1016/j.tust.2013.02.003
7
ChaiS. B.JiaY. S.DuY. X.HuB.LiX. P. (2022a). Experimental study on compression mechanical characteristics of filled rock joints after multiple pre-impacts. Sci. Rep.12 (1), 1–11. doi: 10.1038/s41598-022-15849-5
8
ChaiS. B.LiuH.SongL.LiX. P.FuX. D.ZhouY. Q. (2023). Static pressure and dynamic impact characteristics of filled jointed rock after frozen-thaw cycle damage. Front. Ecol. Evol.11, 1–15. doi: 10.3389/fevo.2023.1222676
9
ChaiS. B.SongL.LiuH.AbiE. D.ChaiL. Z. (2022b). Experimental study on deterioration characteristics of filled jointed rock under dry-wet cycles in acidic environment. Rock. Soil. Mech.43 (11), 2993–3002. doi: 10.16285/j.rsm.2022.0046
10
ChaiS. B.WangH.YuL. Y.ShiJ. H.AbiE. (2020a). Experimental study on static and dynamic compression mechanical properties of filled rock joints. Lat. Am. J. Solids. Stru.17 (3), 1–15. doi: 10.1590/1679-78255988
11
ChangZ. L.DuZ.ZhangF.HuangF. M.ChenJ. W.LiW. B.et al. (2020). Landslide susceptibility Prediction based on remote sensing images and GIS: Comparisons of supervised and unsupervised machine learning models. Remote Sens.12 (3), 502. doi: 10.3390/rs12030502
12
ChenG. B.LiY.LiT.ZhangG. H. (2023). Experimental study on the mechanical properties of intermittent jointed sandstone considering water-rock interaction and confining pressure effect. B. Eng. Geol. Environ.82, 113. doi: 10.1007/s10064-023-03156-w
13
ChenM.ZangC. A. W.DingZ. W.ZhouG. L.JiangB. Y.ZhangG. C.et al. (2022). Effects of confining pressure on deformation failure behavior of jointed rock. J. Cent. South. Univ.29 (4), 1305–1319. doi: 10.1007/s11771-022-4991-z
14
GaoG.MeguidM. A. (2022). Microscale characterization of fracture growth in increasingly jointed rock samples. Rock. Mech. Rock. Eng.55 (10), 6033–6061. doi: 10.1007/s00603-022-02965-x
15
GhazvinianA.HadeiM. R. (2012). Effect of discontinuity orientation and confinement on the strength of jointed anisotropic rocks. Int. J. Rock. Mech. Min.55, 117–124. doi: 10.1016/j.ijrmms.2012.06.008
16
GhazvinianA.SarfaraziV.SchubertW.BlumelM. (2012). A study of the failure mechanism of planar non-persistent open joints using PFC2D. Rock. Mech. Rock. Eng.45 (5), 677–693. doi: 10.1007/s00603-012-0233-2
17
GhorbaniM.ShahriarK.SharifzadehM.MasoudiR. (2020). A critical review on the developments of rock support systems in high stress ground conditions. Int. J. Min. Sci. Techno.30 (5), 555–572. doi: 10.1016/j.ijmst.2020.06.002
18
HanZ. Y.LiD. Y.ZhouT.ZhuQ. Q.RanjithP. G. (2020). Experimental study of stress wave propagation and energy characteristics across rock specimens containing cemented mortar joint with various thicknesses. Int. J. Rock. Mech. Min.131, 104352. doi: 10.1016/j.ijrmms.2020.104352
19
HuangF. M.CaoZ. S.GuoJ. F.JiangS. H.ShuL.GuoZ. Z. (2020a). Comparisons of heuristic, general statistical and machine learning models for landslide susceptibility prediction and mapping. Catena191, 104580. doi: 10.1016/j.catena.2020.104580
20
HuangF. M.CaoZ. S.JiangS. H.ZhouC. B.HuangJ. S.GuoZ. Z. (2020b). Landslide susceptibility prediction based on a semi-supervised multiple-layer perceptron model. Landslides17 (12), 2919–2930. doi: 10.1007/s10346-020-01473-9
21
HuangY. H.YangS. Q.TianW. L. (2019). Crack coalescence behavior of sandstone specimen containing two pre-existing flaws under different confining pressures. Theor. Appl. Fract. Mec.99, 118–130. doi: 10.1016/j.tafmec.2018.11.013
22
HuangY. H.YangS. Q.ZhaoJ. (2016). Three-dimensional numerical simulation on triaxial failure mechanical behavior of rock-like specimen containing two unparallel fissures. Rock. Mech. Rock. Eng.49 (12), 4711–4729. doi: 10.1007/s00603-016-1081-2
23
HuangF. M.ZhangJ.ZhouC. B.WangY. H.HuangJ. S.ZhuL. (2020c). A deep learning algorithm using a fully connected sparse autoencoder neural network for landslide susceptibility prediction. Landslides17 (01), 217~229. doi: 10.1007/s10346-019-01274-9
24
JiangS. H.HuangJ.HuangF. M.YangJ. H.YaoC.ZhouC. B. (2018). Modelling of spatial variability of soil undrained shear strength by conditional random fields for slope reliability analysis. Appl. Math. Model.63, 374–389. doi: 10.1016/j.apm.2018.06.030
25
JinJ.CaoP.ChenY.PuC. Z.MaoD. W.FanX. (2017). Influence of single flaw on the failure process and energy mechanics of rock-like material. Comput. Geotech.86, 150–162. doi: 10.1016/j.compgeo.2017.01.011
26
LeeH.JeonS. (2011). An experimental and numerical study of fracture coalescence in pre-cracked specimens under uniaxial compression. Int. J. Solids. Struct.48 (6), 979–999. doi: 10.1016/j.ijsolstr.2010.12.001
27
LiJ. C.MaG. W. (2009). Experimental study of stress wave propagation across a filled rock joint. Int. J. Rock. Mech. Min.46 (3), 471–478. doi: 10.1016/j.ijrmms.2008.11.006
28
LiJ. C.MaG. W.HuangX. (2010). Analysis of wave propagation through a filled rock joint. Rock. Mech. Rock. Eng.43 (6), 789–798. doi: 10.1007/s00603-009-0033-5
29
LiJ. C.YuanW.LiH. B.ZouC. J. (2022). Study on dynamic shear deformation behaviors and test methodology of sawtooth-shaped rock joints under impact load. Int. J. Rock. Mech. Min.158, 105210. doi: 10.1016/j.ijrmms.2022.105210
30
LiuY.DaiF.DongL.XuN. W.FengP. (2018). Experimental investigation on the fatigue mechanical properties of intermittently jointed rock models under cyclic uniaxial compression with different loading parameters. Rock. Mech. Rock. Eng.51 (1), 47–68. doi: 10.1007/s00603-017-1327-7
31
LuW. B.ZhuZ. D.HeY. X.QueX. C. (2021). Strength characteristics and failure mechanism of a columnar jointed rock mass under uniaxial, triaxial, and true triaxial confinement. Rock. Mech. Rock. Eng.54 (5), 2425–2439. doi: 10.1007/s00603-021-02400-7
32
LuoZ. Y.ZhengW.DuS. G.HuangM.WangC. S. (2023). Experimental study on normal deformation characteristics of filled rock joints with typical fluctuation morphology. Front. Earth. Sci.10. doi: 10.3389/feart.2022.982939
33
PotyondyD. O.CundallP. A. (2004). A bonded-particle model for rock. Int. J. Rock. Mech. Min.41 (8), 1329–1364. doi: 10.1016/j.ijrmms.2004.09.011
34
SuQ. Q.MaQ. Y.MaD. D.YuanP. (2021). Dynamic mechanical characteristic and fracture evolution mechanism of deep roadway sandstone containing weakly filled joints with various angles. Int. J. Rock. Mech. Min.137, 104552. doi: 10.1016/j.ijrmms.2020.104552
35
TangZ. C.WongL. N. Y. (2016). Influences of normal loading rate and shear velocity on the shear behavior of artificial rock joints. Rock. Mech. Rock. Eng.49 (6), 2165–2172. doi: 10.1007/s00603-015-0822-y
36
TangJ. Z.YangS. Q.TianW. L.TaoY. (2022). Effect of confining pressure on mechanics and deformation behavior of sandstone containing a single inclined joint. Eur. J. Environ. Civ. En.26 (3), 1022–1045. doi: 10.1080/19648189.2019.1694076
37
WangS. W.LiJ. C.LiX.HeL. (2022). Dynamic photoelastic experimental study on the influence of joint surface geometrical property on wave propagation and stress disturbance. Int. J. Rock. Mech. Min.149, 104985. doi: 10.1016/j.ijrmms.2021.104985
38
XiangZ. P.WangH. L.XuW. Y.LiL. Q.CaiM. (2019). Mechanical behavior of rock-like specimens with hidden smooth joints under triaxial compression. J. Mater. Civil. Eng.31 (7). doi: 10.1061/(asce)mt.1943-5533.0002787
39
XiaoP.LiD. Y.ZhaoG. Y.LiuH. X. (2021). New criterion for the spalling failure of deep rock engineering based on energy release. Int. J. Rock. Mech. Min.148, 104943. doi: 10.1016/j.ijrmms.2021.104943
40
XieX. K.LiJ. C.ZhengY. L. (2023). Experimental study on dynamic mechanical and failure behavior of a jointed rock mass. Int. J. Rock. Mech. Min.168, 105415. doi: 10.1016/j.ijrmms.2023.105415
41
YangS. Q.HuangY. H.JingH. W.LiuX. R. (2014). Discrete element modeling on fracture coalescence behavior of red sandstone containing two unparallel fissures under uniaxial compression. Eng. Geol.178, 28–48. doi: 10.1016/j.enggeo.2014.06.005
42
YangS. Q.TianW. L.HuangY. H.RanjithP. G.JuY. (2016). An experimental and numerical study on cracking behavior of brittle sandstone containing two non-coplanar fissures under uniaxial compression. Rock. Mech. Rock. Eng.49 (4), 1497–1515. doi: 10.1007/s00603-015-0838-3
43
YoonJ. (2007). Application of experimental design and optimization to PFC model calibration in uniaxial compression simulation. Int. J. Rock. Mech. Min.44 (6), 871–889. doi: 10.1016/j.ijrmms.2007.01.004
44
YuanC. M.LiQ. H.NieW.YeC. Y. (2023a). A depth information-based method to enhance rainfall-induced landslide deformation area identification. Measurement219, 113288. doi: 10.1016/j.measurement.2023.113288
45
YuanC. M.NieW.LiQ. H.GengJ. B.DaiB. B.GaoJ. W. (2023b). Automatic batch recognition of rock deformation areas based on image segmentation methods. Front. Earth. Sci.10. doi: 10.3389/feart.2022.1093764
46
ZhangX. P.WongL. N. Y. (2012). Cracking processes in rock-like material containing a single flaw under uniaxial compression: A numerical study based on parallel bonded-particle model approach. Rock. Mech. Rock. Eng.45 (5), 711–737. doi: 10.1007/s00603-011-0176-z
47
ZhangX. P.WongL. N. Y. (2013). Crack initiation, propagation and coalescence in rock-like material containing two flaws: a numerical study based on bonded-particle model approach. Rock. Mech. Rock. Eng.46 (5), 1001–1021. doi: 10.1007/s00603-012-0323-1
48
ZhangT.YuL. Y.SuH. J.ZhangQ.ChaiS. B. (2022). Experimental and numerical investigations on the tensile mechanical behavior of marbles containing dynamic damage. Int. J. Min. Sci. Techno.32 (1), 89–102. doi: 10.1016/j.ijmst.2021.08.002
49
ZhuZ. D.LuW. B.HeY. X.QueX. C. (2021). Experimental study on the strength failure characteristics of columnar jointed rock masses under three-dimensional stress. Ksce. J. Civ. Eng.25 (7), 2411–2425. doi: 10.1007/s12205-021-0821-3
Summary
Keywords
filled rock joint, confining pressure, strength, failure characteristic, PFC numerical simulation, mechanical properties, crack evolution
Citation
Song L, Chai S, Li J, Song B and Chai L (2023) Numerical study on compressive mechanical characteristics of filled jointed rock under confining pressure based on PFC. Front. Ecol. Evol. 11:1283479. doi: 10.3389/fevo.2023.1283479
Received
26 August 2023
Accepted
29 September 2023
Published
13 October 2023
Volume
11 - 2023
Edited by
Faming Huang, Nanchang University, China
Reviewed by
Baoyun Zhao, Chongqing University of Science and Technology, China; Qihang Li, Chongqing University, China; Hengjie Luan, Shandong University of Science and Technology, China
Updates
Copyright
© 2023 Song, Chai, Li, Song and Chai.
This is an open-access article distributed under the terms of the Creative Commons Attribution License (CC BY). The use, distribution or reproduction in other forums is permitted, provided the original author(s) and the copyright owner(s) are credited and that the original publication in this journal is cited, in accordance with accepted academic practice. No use, distribution or reproduction is permitted which does not comply with these terms.
*Correspondence: Shaobo Chai, shbchai@chd.edu.cn
Disclaimer
All claims expressed in this article are solely those of the authors and do not necessarily represent those of their affiliated organizations, or those of the publisher, the editors and the reviewers. Any product that may be evaluated in this article or claim that may be made by its manufacturer is not guaranteed or endorsed by the publisher.