 Matthew D. Schlesinger1*
 Erin L. White1Jeffrey D. Corser1
 Bryan N. Danforth2Melissa K. Fierke3Carmen M. Greenwood4Richard G. Hatfield5Katie G. Hietala-Henschell1,5Jonathan R. Mawdsley6
 Kent P. McFarland7
 Robyn Niver8Jerome G. Rozen Jr.9
 Maria Van Dyke2Timothy G. Howard1
- 1New York Natural Heritage Program, State University of New York College of Environmental Science and Forestry, Albany, NY, United States
- 2Department of Entomology, Cornell University, Ithaca, NY, United States
- 3Department of Environmental Biology, State University of New York College of Environmental Science and Forestry, Syracuse, NY, United States
- 4Department of Fisheries, Wildlife, and Environmental Science, State University of New York Cobleskill, Cobleskill, NY, United States
- 5Endangered Species Program, Xerces Society for Invertebrate Conservation, Portland, OR, United States
- 6Cooperative Fish and Wildlife Research Unit Program, United States Geological Survey, Reston, VA, United States
- 7Vermont Atlas of Life, Vermont Center for Ecostudies, Norwich, VT, United States
- 8New York Field Office, U.S. Fish and Wildlife Service, Cortland, NY, United States
- 9Division of Invertebrate Zoology, American Museum of Natural History, New York, NY, United States
The worldwide decline of insects calls for understanding the conservation status of key insect groups at local and regional scales. Pollinators are widely recognized as especially important to native ecosystems and agriculture and their declines have been met with calls for inventory and monitoring. In New York State, we conducted a four-year survey effort to document the distribution and status of key native pollinators in four insect orders: Coleoptera, Diptera, Hymenoptera, and Lepidoptera. In this paper, we describe the process of designing and implementing the study in the hopes that other jurisdictions could follow a similar model. We combined systematic field inventories, surveys of special habitats, target species surveys, community science observations, and museum and partner data to create a comprehensive look at the distribution of each of 457 species in two time periods (2000 to present and 1999 and earlier). We used the conservation status ranking system developed by NatureServe and generated ranks and a series of distribution maps and phenology charts for each species. We describe the effort needed to carry out the study, as well as reasons for its success and areas for improvement.
1 Introduction
The global “insect apocalypse” (Dirzo et al., 2014; Wagner, 2020; Wagner et al., 2021) that has made headlines worldwide represents an astonishing loss of biodiversity. By nature these global trends are composed of smaller regional faunal changes (e.g., Hallmann et al., 2017), but few studies at the country or state/province scales have documented the current status of their insect faunas. Smaller scale efforts like these are critical for developing conservation actions now, while we wait for rigorous data on trends to arise from new or ongoing standardized monitoring efforts.
Insect pollinators are a group of particular concern because of their interdependence with native floras and agricultural crops (Wagner, 2020). A longstanding concern for pollinator populations and their importance to native ecosystems and agriculture worldwide (Buchmann and Nabhan, 1996; Allen-Wardell et al., 1998; Kearns et al., 1998) ratcheted up in the early 2000s in the US with news-making reports of declines in western honey bee (Apis mellifera) (vanEngelsdorp et al., 2009) and native pollinators (National Research Council, 2007; Colla and Packer, 2008; Cameron et al., 2011; Brower et al., 2012).
In New York State, the need to conduct a comprehensive survey to understand the status of native pollinators was made explicit in the state’s Pollinator Protection Plan (NYS DEC and AGM, 2016). The New York State Department of Environmental Conservation selected the New York Natural Heritage Program (NYNHP) to lead the pollinator survey. NYNHP consulted with ecologists from state and federal agencies, conservation organizations, museums, and academia to develop a sampling design to determine the conservation status of native insect pollinators throughout New York. The agreed-upon goal of the project was to determine the conservation status of a wide array of native insect pollinators in nonagricultural habitats.
A species’ conservation status is a rank that informs policy makers and land managers of its relative risk of extirpation from a particular jurisdiction, or extinction from the wild. Two quite similar methods are used to assess conservation status globally: G-ranks maintained by NatureServe (NatureServe, 2022), whose corollary is the S-rank at the subnational level, and the Red List process overseen by the International Union for the Conservation of Nature (IUCN, 2022). Both methods rely on data pertinent to a species’ rarity, trends, and threats. Determining conservation status (Figure 1) ideally entails collating current distributional data from recent published and unpublished field observations and new field surveys (rarity), historical distributional data from museums and other sources (trends), and reviews of literature and discussions with experts (threats). Status can be determined with a subset of this information when, for instance, information on historical distribution is unavailable. We determined this was an appropriate end goal for the project because it has implications for future inventory and monitoring by Natural Heritage programs and others, as well as state and federal listing under endangered species laws.
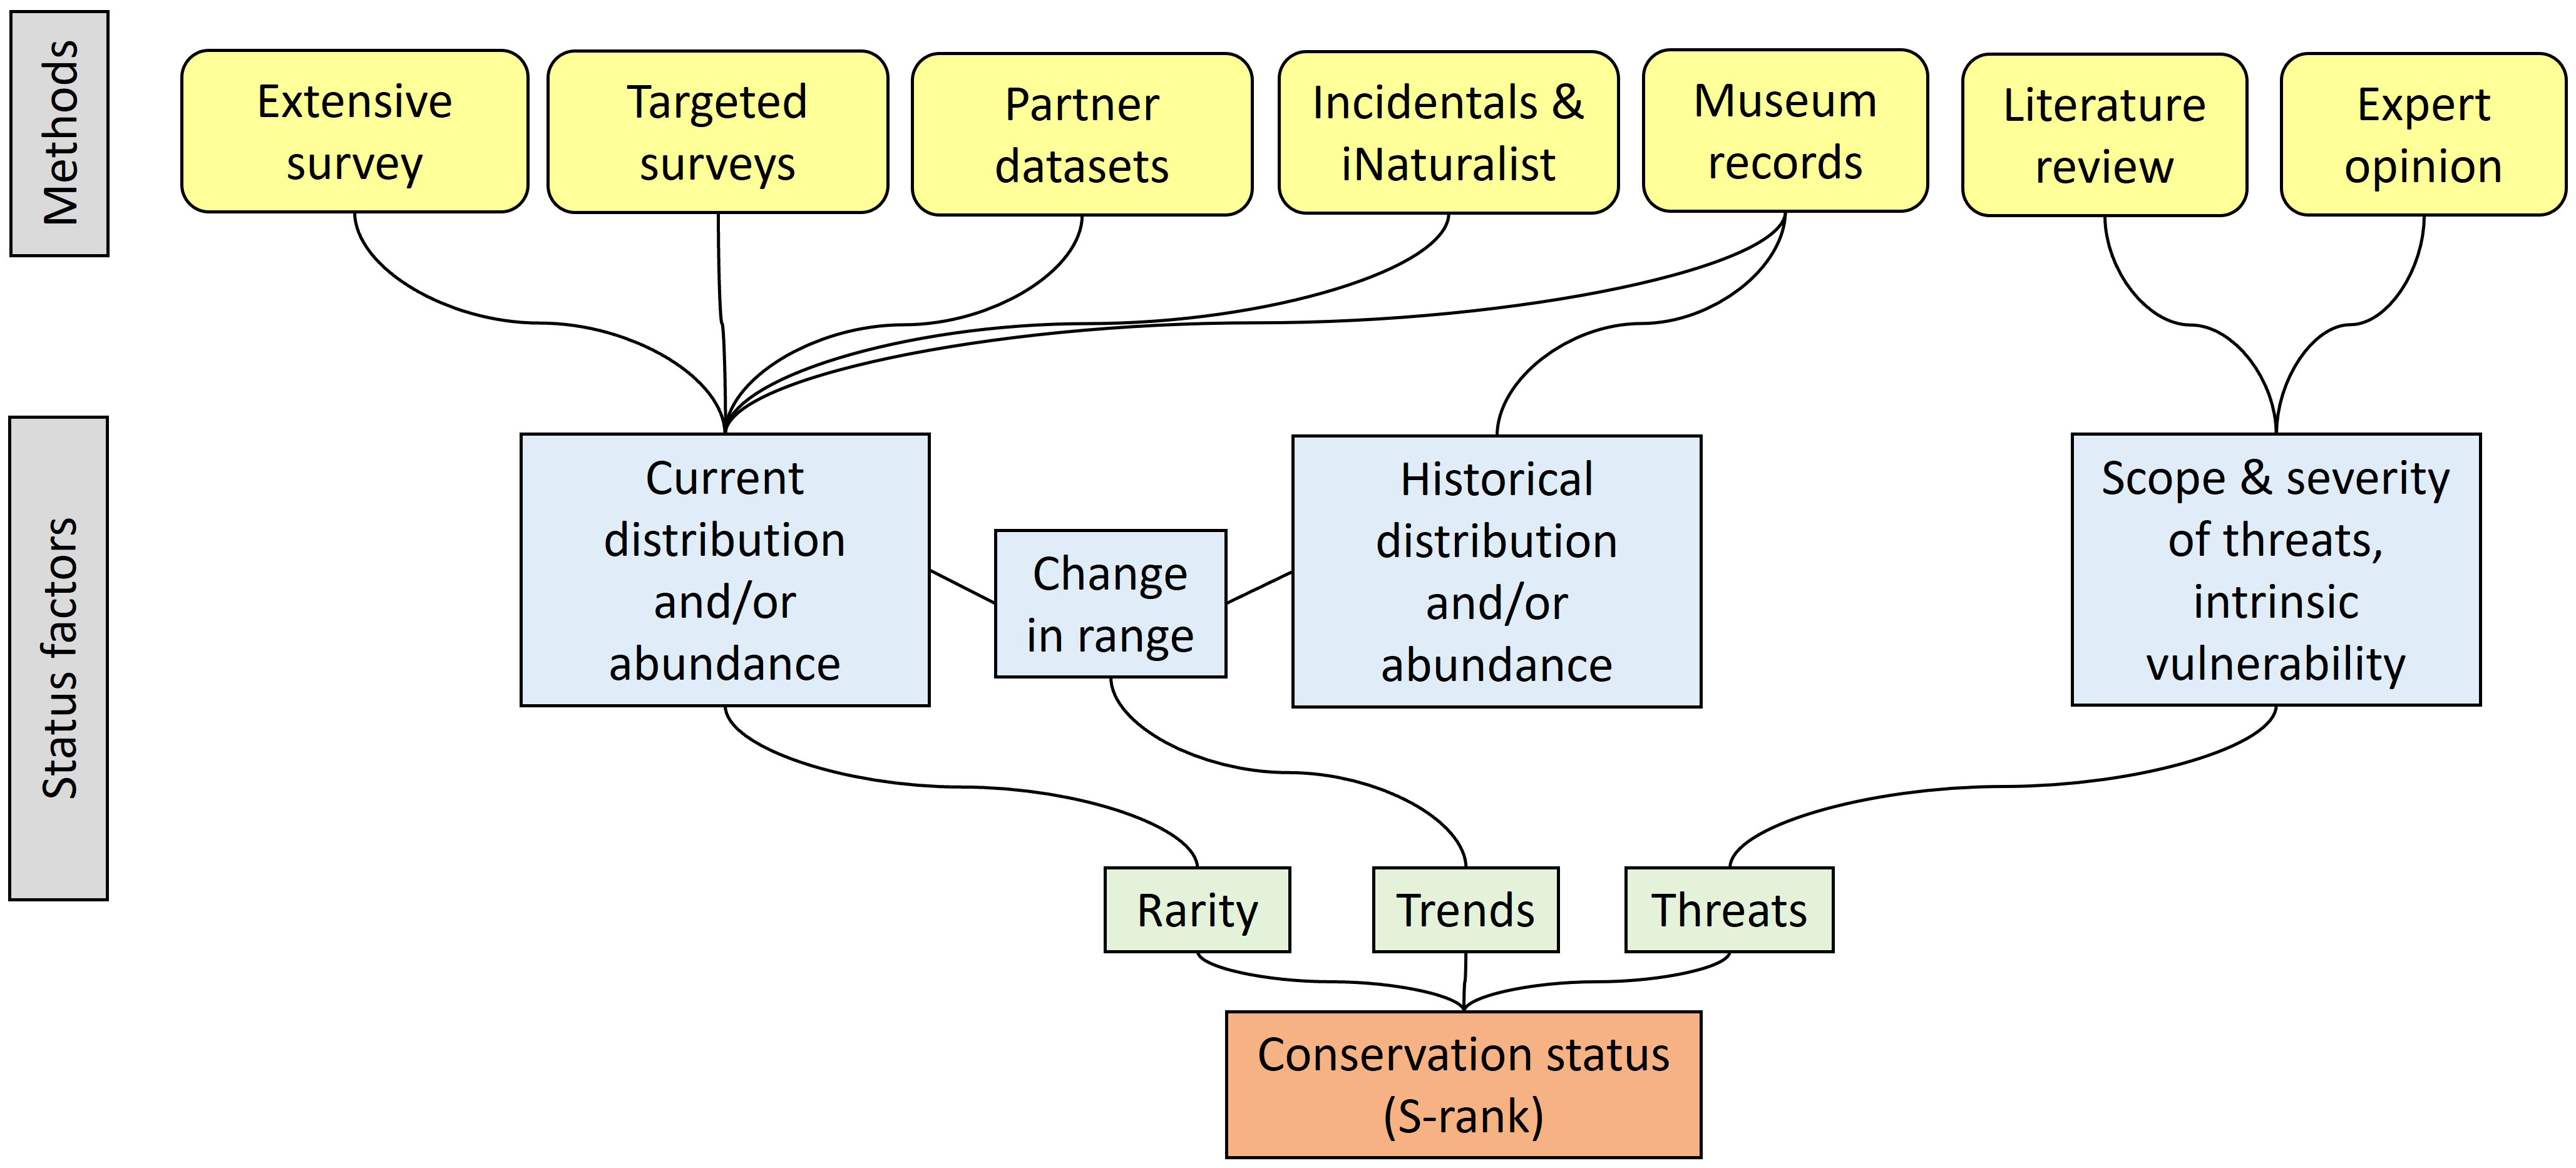
Figure 1 The approach for determining conservation status rank (S-rank) for native pollinators in New York, based on NatureServe methodology (Faber-Langendoen et al., 2012; Master et al., 2012).
Our focus on “native insect pollinators” distinguished the targets of this survey from the western honey bee, a managed pollinator in agricultural systems that is the focus of many other research efforts. It can be argued that confusion about honey bees as a suitable focus of “conservation” efforts (as opposed to their being a valid agricultural concern) has caused misdirection of public attention and resources from efforts to protect native species (Colla and MacIvor, 2017; Geldmann and González-Varo, 2018; Ford et al., 2021; Iwasaki and Hogendoorn, 2021), another reason we chose to focus on native pollinators.
In this paper, we document the process, data collection methodology, and lessons learned from the project, with detailed findings being published separately. In essence, we combined field inventory with compilations of museum and partner data and community (a.k.a. “citizen”) science observations to determine the status of as many native pollinating insects as possible in New York State. Community science has grown exponentially in recent decades (McKinley et al., 2017; Wehn et al., 2021; Fraisl et al., 2022) and has proven valuable in surveys covering large geographic areas. Incorporation of community science was intended to allow a comparison with data collected by trained technicians, and also to bolster the number of observations for species that are easily and consistently identifiable using photographs.
2 Methods
2.1 Focal taxa
New York is home to thousands of native insect pollinator species, so determining the conservation status of all of them in one four-year project would have been an untenable goal. We therefore developed a set of “focal taxa”—species or groups of species on which to concentrate our efforts. To highlight the important role a variety of native insects play in pollination, we included at least one species group from each of the primary insect orders known to pollinate native plants (National Research Council, 2007): Hymenoptera (sawflies, bees, ants, and wasps), Diptera (flies), Coleoptera (beetles), and Lepidoptera (moths and butterflies). We use the term “pollinator” broadly to include flower-visiting insects known or suspected to move pollen among flowers. Within these orders, we selected groups of species that 1) had been documented or were suspected to be important pollinators; 2) had poorly understood conservation status (although some knowledge of regional or global status was helpful for context); 3) contained known or suspected at-risk species in the Northeast or elsewhere, including those that are naturally rare and those whose populations had declined or distributions had decreased; 4) were not so diverse that determining the conservation status of most of the species would have been an unreachable goal; 5) could feasibly be identified to species by trained biologists, experts who may be project partners, and/or community scientists; and 6) would be appealing for a community science effort. In addition, we identified individual species of known or suspected conservation concern for targeted surveys. Sometimes these focal species were also members of species groups selected as focal taxa, but for whom our standardized survey would not likely provide sufficient information. Final selection of focal taxa relied on literature review, conversations with taxonomic experts, and the input of our advisory committee.
Based on these criteria, we identified 10 focal insect groups: four clades of bees, one of flies plus a functional group, two of beetles, and two of moths (Table 1). The conservation status of most butterflies has previously been assessed (i.e., they have S-ranks) so that group was not selected for the statewide surveys. Known rare species from any of the focal taxa not expected to be detected with sufficient frequency using standard field collection methods, particularly species needing resurveys of specific locations, were the focus of Target Species Surveys (below). For bees, for which our chosen methods (below) are known to sample most species well, designating specific focal taxa within the sampled groups informed which specimens would be prioritized for identification to species, as sorting and identification of specimens represented most of our time and costs.
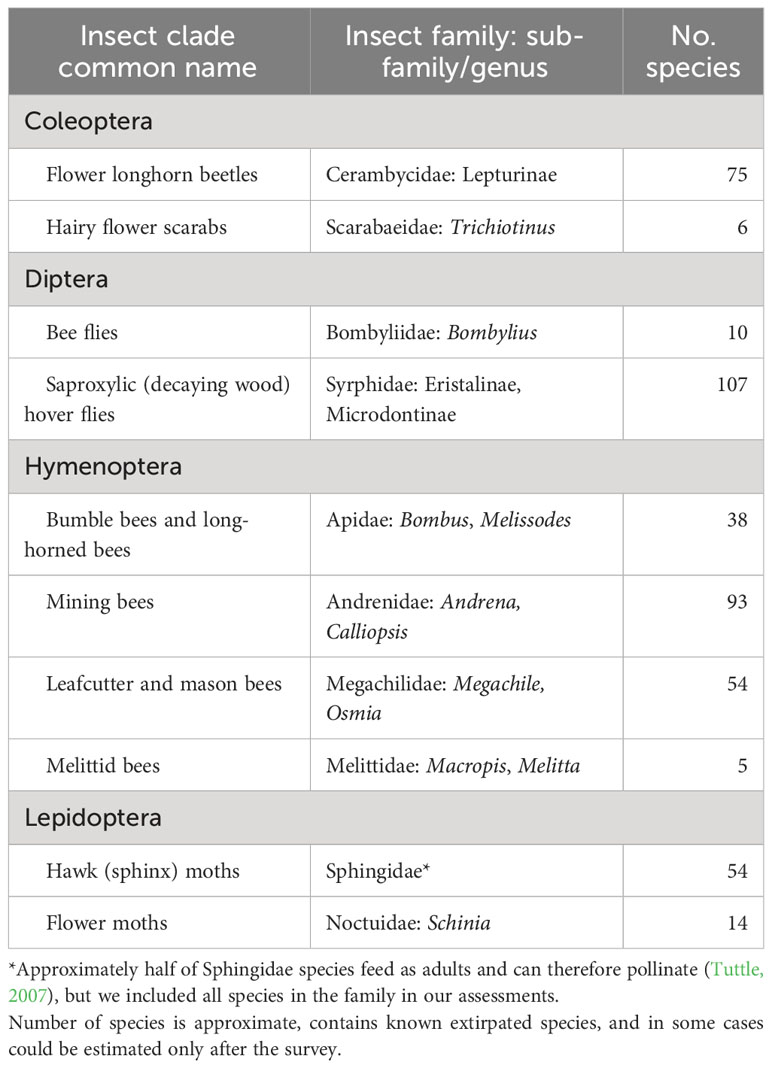
Table 1 Focal taxa selected for the Empire State Native Pollinator Survey.
2.2 Survey design and methodology
We assessed the current and historical distribution of native pollinators with three field sampling strategies—an Extensive Survey, Target Habitat Surveys, and Target Species Surveys—plus compilation of partner, community science, and museum data. Field crews of two technicians each year completed most of the surveys and specimen pinning, supplemented with help from other NYNHP staff.
2.2.1 Extensive survey
The goal of the Extensive Survey was to generate data on the distribution of individual species of pollinators whose conservation status was poorly known. It was designed to allow a rigorous statistical comparison across time and space using a standard field protocol with consistent effort at a network of representative sampling locations.
We concentrated our sampling on protected lands, including those owned by universities, land trusts, and federal, state, and local governments. This strategy had a number of advantages over a purely systematic or random approach: 1) These lands are typically of higher biodiversity value to pollinators than random places in the landscape; 2) We suspected owners and managers of protected lands would be interested in data on their pollinator fauna, and more likely to implement pollinator-friendly management; 3) They had staff who could assist with sampling; 4) Access for sampling was more straightforward in most cases than contacting individual landowners; and 5) For the last two reasons, costs were substantially lower than in a truly random design. Disadvantages included 1) Reduced ability to extrapolate to the entire state; 2) Greater likelihood of sampling in less anthropogenically disturbed habitats and areas already managed for pollinators, thus potentially overestimating the health of the state’s pollinator fauna.
Two facets of our sampling design ensured sampling in a variety of habitats in all of New York’s diverse landscapes. First, we stratified sample site selection by TNC terrestrial ecoregion (https://geospatial.tnc.org/). Ecoregions are large areas with similar geology, soils, climate, and vegetation (Bailey, 1998) and are a coarse-scale reflection of habitat diversity. Ensuring all ecoregions were represented adequately in the sampling design went a long way toward knowing insects associated with a broad array of environmental conditions would be accounted for. Importantly, protected lands are well-distributed throughout New York State in every major ecoregion (Table 2; Figure 2).
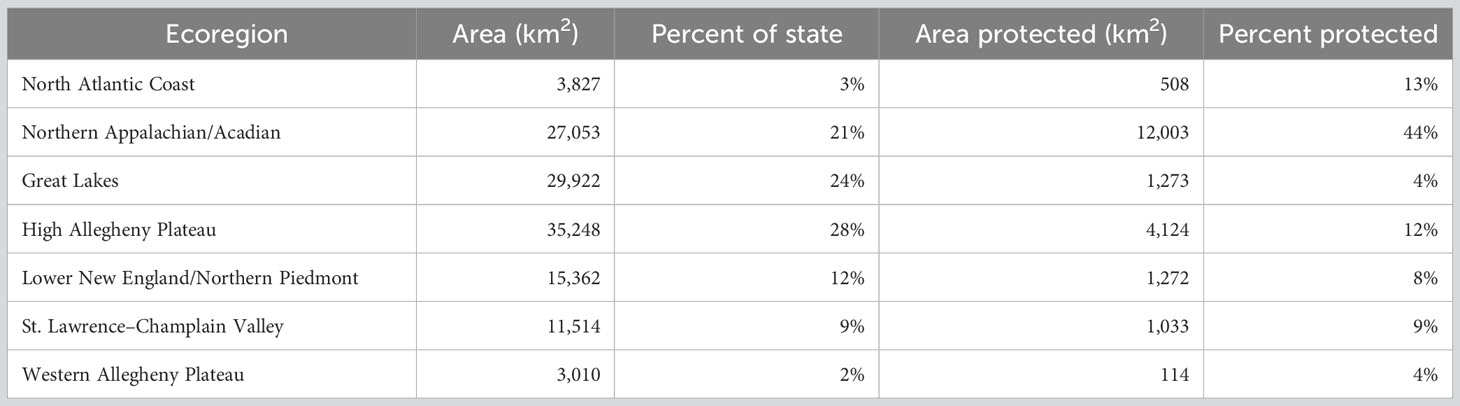
Table 2 Area of each TNC terrestrial ecoregion and percent protected from the New York Protected Areas Database.
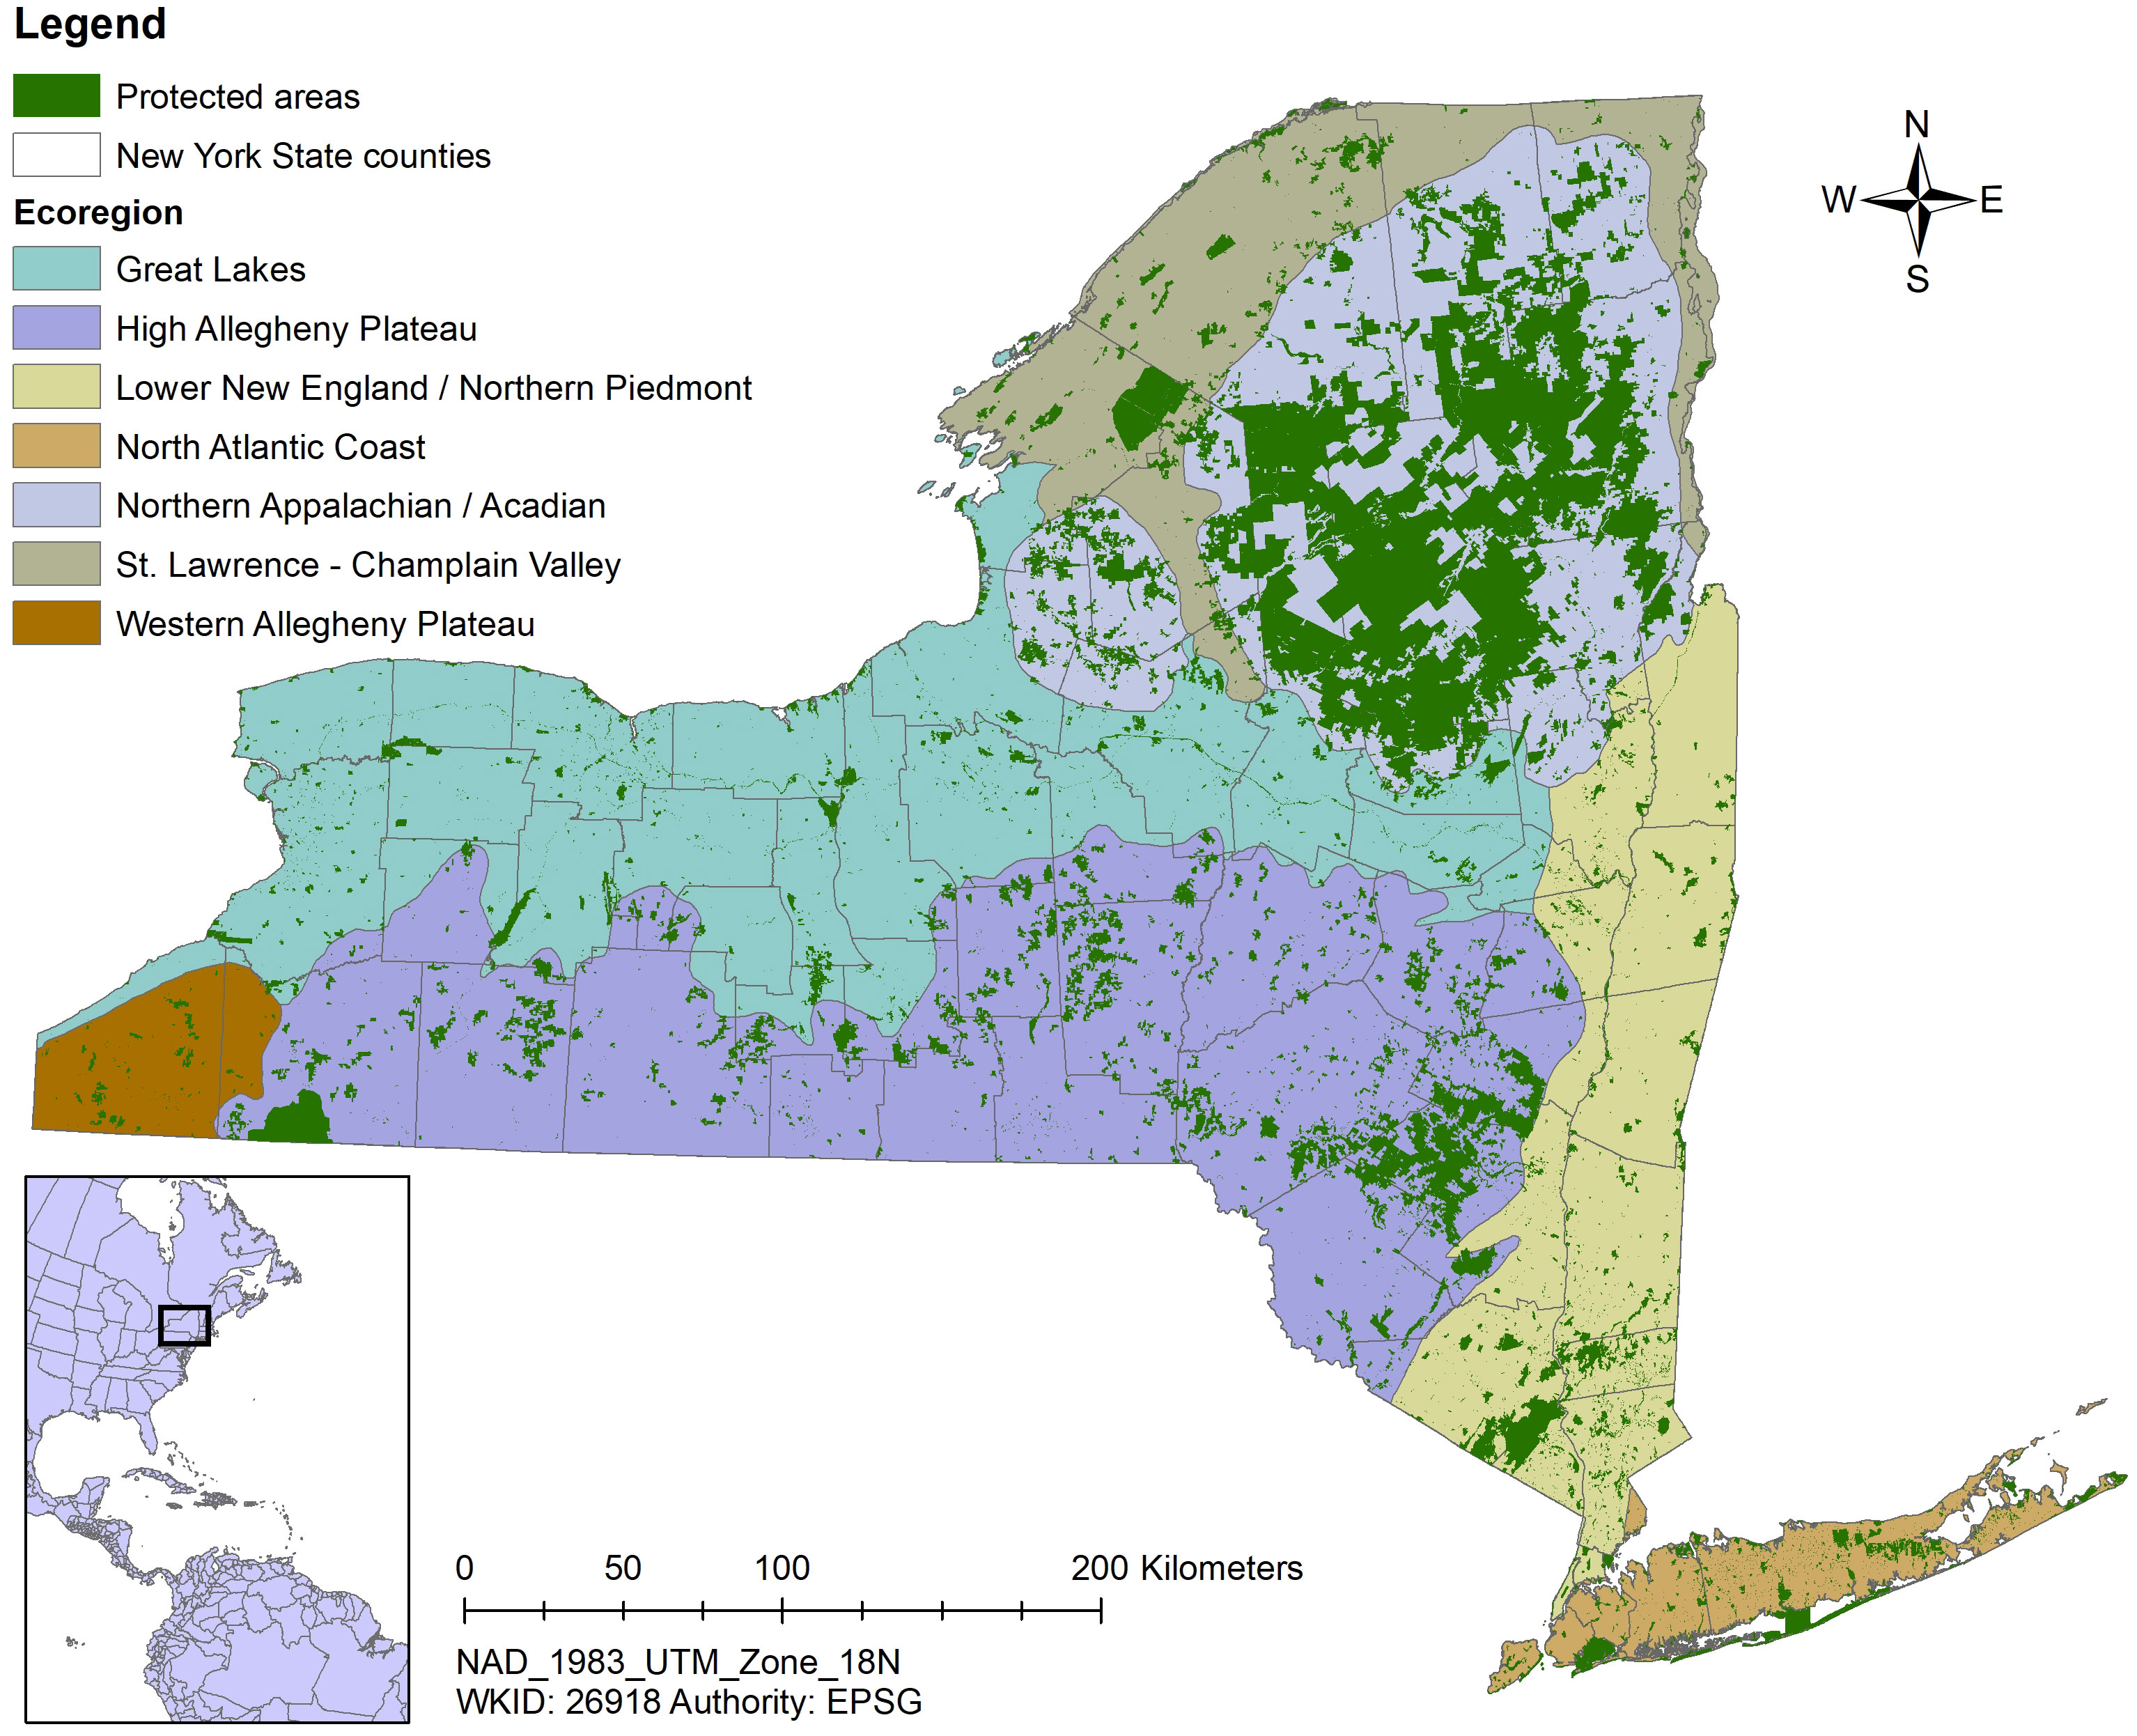
Figure 2 Map indicating New York protected areas from the United States Geological Service’s Protected Areas Database overlying The Nature Conservancy’s terrestrial ecoregions.
Second, at each site, we sampled from multiple habitat types, or sampling “stations.” Our goal was to sample each of three habitat types—meadow/grassland, forest, and wetland—as well as a roadside, which can function as an easily accessible miniature meadow. While we aimed to sample all four types at each site, in some areas of the State, like the heavily forested Adirondack Park, habitat diversity was limited. In practice, we allowed a site to be sampled if at least two of the main habitat types were available within 250 m of the sample point (see below) and allowed sampling multiple representatives of certain habitat types (e.g., two meadow stations) in these cases. Roadside stations could fall outside of the 250-m radius. We used land cover data layers such as the National Land Cover Database (Fry et al., 2011) and Northeast Terrestrial Habitat Map (Ferree and Anderson, 2013), combined with aerial photography interpretation and field reconnaissance, to determine station locations within sites (Figure 3), but the final selection was made in the field. Some specific or rare habitat types important for our focal taxa were the focus of Target Habitat Surveys (described below).
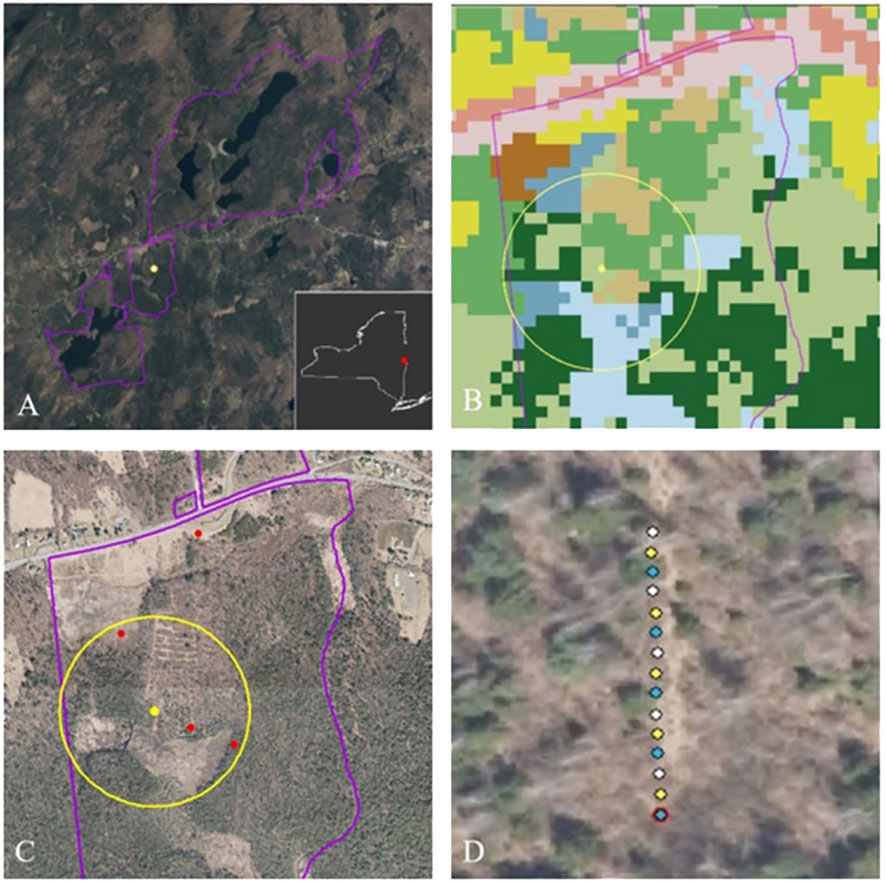
Figure 3 Example of sample site selection and sampling station locations. (A) Grafton Lakes State Park in eastern New York, with a yellow dot marking a random sample point located within the park boundary. The sample point was moved slightly to ensure a representation of habitat types within 250 m. (B) Land cover surrounding the adjusted sample point and within a 250-m radius; blue = wetlands; green = forests; brown = open, pink = developed. (C) Aerial photo of same location, with red stars indicating potential sampling stations in wetland, forest, meadow/grassland, and roadside. (D) Example layout of pan traps at a station.
We used the Environmental Protection Agency’s Generalized Random Tessellation Stratified spatially explicit sampling methodology (Stevens and Olsen, 2003; Stevens and Olsen, 2004) to ensure a geographic spread of sample locations throughout each ecoregion. We generated 150 spatially balanced random points, stratified by ecoregion, within protected area polygons for the entire study, with 50 sites to be subsampled each year for temporal balance and 300 “overdraw” sites to consider if we were not able to sample the first round of selected sites.
2.2.2 Target habitat surveys
Alpine meadows, barrens, coastal dunes, peatlands, and late-successional forests were target habitats expected to contain unique species whose distribution (and therefore, conservation status) would not likely be adequately documented using the Extensive Survey. Maps of the best examples of these habitat types in New York were generated from three primary sources: NYNHP element occurrence database (New York Natural Heritage Program, 2017), which included mapped occurrences of significant natural communities as defined by our state classification (Edinger et al., 2014), the Northeast Terrestrial Habitat Map (NETHM; Ferree and Anderson, 2013), and the habitat classification prepared for the New York State Wildlife Action Plan (Howard et al., 2015). Late-successional forests were identified from McMartin (1994), New York Natural Heritage Program (2017), and other sources. Sample sites were chosen for accessibility and to maximize their geographic spread (additional details in Appendix A). As with the Extensive Surveys, we sampled four stations at each Target Habitat site, but they were all located in the target habitat, i.e., not the four different habitat types at each Extensive Survey site.
2.2.3 Principal field methods
Two field protocols, pan (or bowl) trapping and a timed search (Droege, 2015), were employed at each Extensive Survey and Target Habitat Survey station during an Apr–Oct sampling window. Field crews first scouted for the four stations, then deployed a transect of pan traps at each station, conducted timed searches at each of the stations, and retrieved the pan traps. If all habitat types were not available at a given Extensive Survey site, field staff used their judgment to place the transects. For Target Habitat Surveys, station locations were chosen to maximize the diversity of floral resources and substrates in the target habitat. Wetland habitats were sampled along edges.
Pan traps were used primarily to sample focal bees and flies. We used clear 3.25-oz. plastic soufflé cups painted white, fluorescent blue, and fluorescent yellow, up to two-thirds full of soapy water. Fifteen cups per habitat type (60 per site) were arrayed on the ground in a transect contained within the habitat type, with cups spaced 3 m apart (Droege, 2015), for a transect length of approximately 42 m. Transects were deployed for at least the warmest part of the day, typically between 10 a.m. and 3 p.m. Captured specimens were strained, pooled across each station, and transferred to Whirl-Pak bags containing 70% ethanol.
We conducted a 30-min timed visual and netting survey to capture flying insects and flower visitors at each of the four stations. Field technicians (typically two) walked throughout the station, with no defined radius, targeting bees, flies, moths, and beetles on flowering plants to net. Insects were killed with cyanide and as with pan traps, were pooled by station.
In late-successional forests, we employed an additional survey protocol, malaise trapping, targeting focal hover flies. We set paired traps along an ecotone adjacent to the forest stand, or within a forest gap with floral resources. We emptied traps approximately once a week throughout the trapping period. On-site handling was minimized because the specimens were stored in ethanol within collecting jars. On good weather days, collection was supplemented with targeted hand-netting on floral resources. Specimens were stored in ethanol until focal taxa could be sorted, pinned, and identified to species.
2.2.4 Target species surveys
We identified several at-risk species and taxonomic groups that we expected would not be captured well by the Extensive and Target Habitat Surveys. Netting directly off flowers was the primary method for these surveys, which were unconstrained by time or area searched. Appropriate meadow and roadside habitats with flowering plants in or near previously documented sites (recognizing that some historical locations were vague) were surveyed for nine rare bumble bees (Bombus), five melittid bees (Melitta, Macropis), and an oil bee brood parasite (Epeoloides pilosula). Coastal dune habitats were targeted on the shore of Lake Ontario for ghost bee fly (Bombylius incanus) in 2019 after the species was documented in our surveys in 2018 in that region. Rare saproxylic syrphids from our focal fly list were targeted in late-successional forests, especially along ecotones, forest gaps, and hilltops at sites other than those targeted with malaise trapping.
2.3 Specimen processing and identification
NYNHP staff, technicians, and volunteers completed lab processing of specimens including drying, pinning, individually labeling, and sorting specimens to taxonomic group (workflow illustrated in Figure 4). We used field tablets equipped with software allowing us to tag custom forms to georeferenced site locations. These electronic field forms were imported into a custom Microsoft Access database, which we queried using a custom R script to generate spreadsheets. These spreadsheets were imported into Microsoft Excel and used to generate labels with QR codes with unique specimen numbers using a mail merge in Microsoft Word. Pinned insects were labeled and then distributed for identification.
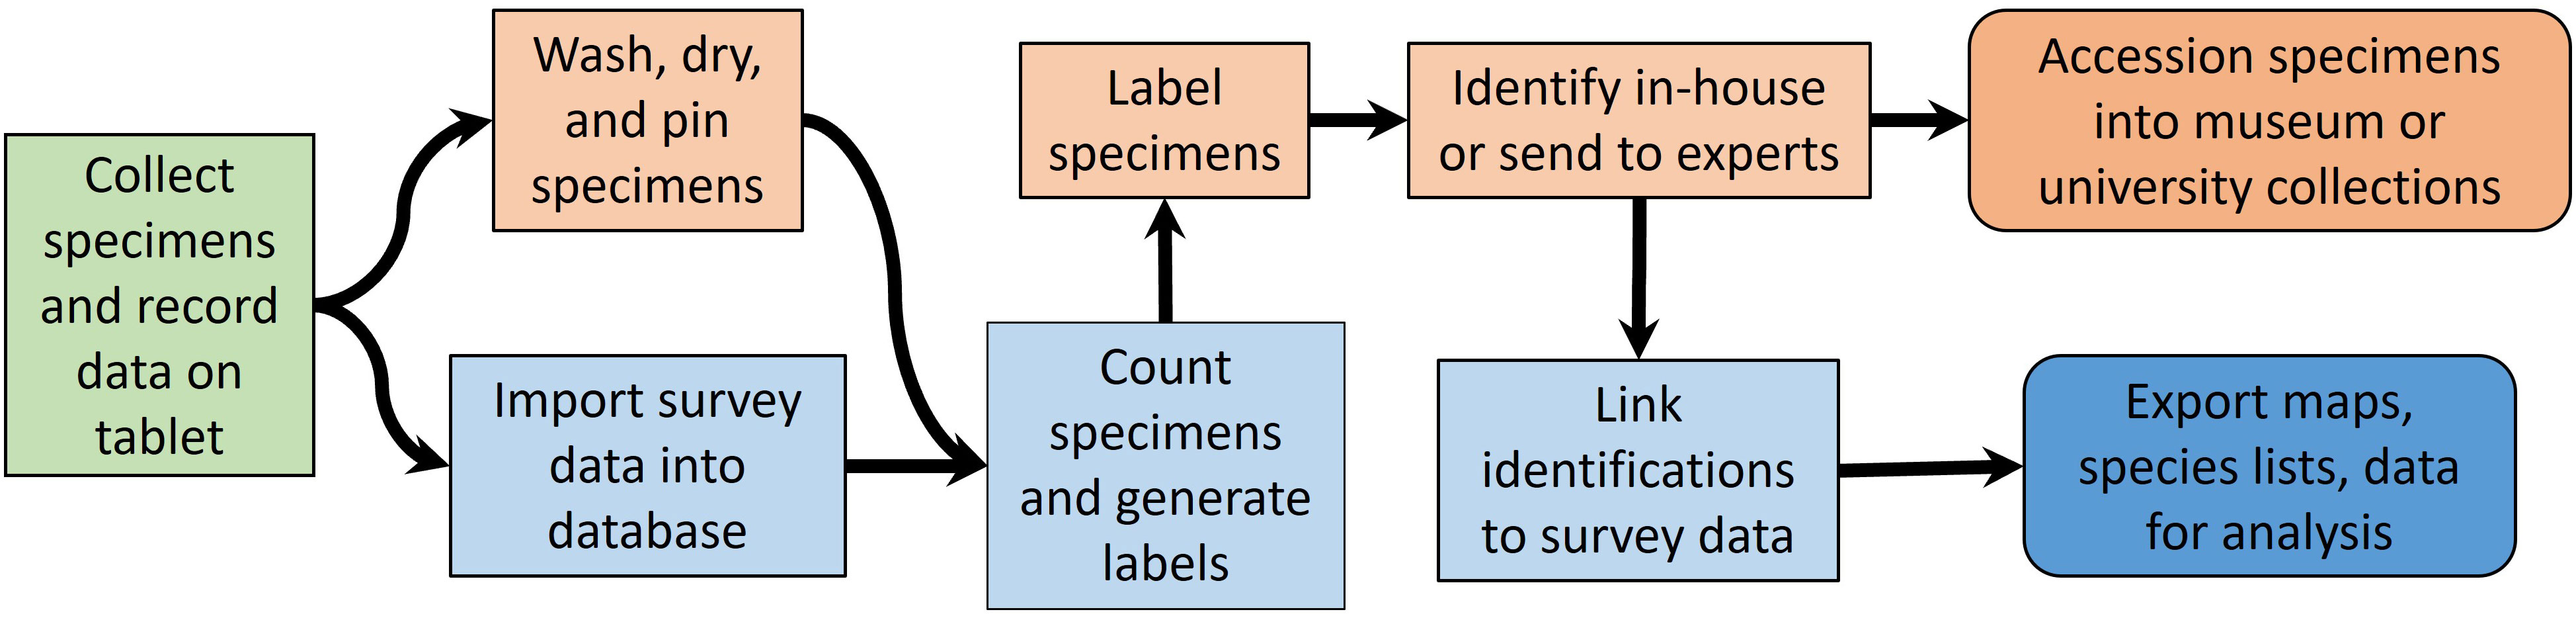
Figure 4 Workflow from field to reporting in the Empire State Native Pollinator Survey. Field work (green box) leads to specimen processing (orange boxes) and database operations (blue boxes). Outputs (rounded boxes) include accessioned specimens and a variety of data products.
Specimens were identified by NYNHP staff, the B. Danforth laboratory at Cornell University, the C. Greenwood laboratory at SUNY Cobleskill, and J. Klymko of the Atlantic Canada Conservation Data Centre. Some Andrena and Melissodes specimens, which are especially challenging to identify to species, underwent DNA barcoding at the Danforth Lab to confirm identifications. Final determinations of specimens were added to the project database.
We archived snapshot versions of the database to enhance data recovery and built scripts to ensure data uploads were as consistent, efficient, and error free as possible.
2.4 Community science via iNaturalist
We set up a members-only (“traditional”) project at iNaturalist.org, which required users to join to submit observations, in early 2018. Having participants join a project allowed for direct communication plus leader boards for motivation. Accepted observations were limited to Coleoptera, Diptera, Hymenoptera, and Lepidoptera in New York State. Because the taxonomic filter allowed records of many species that were not focal taxa (to ensure all potential focal species were captured and so as not to stem participant enthusiasm), we queried the entire iNaturalist database for our focal taxa for downloading and analysis. We downloaded data on December 29, 2021, and used “Research Grade” observations (which had a location, date, photograph, and community agreement on identification), plus ones we could confirm ourselves, in our analyses. Where possible, we independently confirmed identifications, but we could not do so for all observations.
2.5 Partner data and museum records
The third major source of pollinator records after specimen collection and community science photographic observations was existing collections and datasets. We compiled recent data from a variety of academic, not-for-profit, and government partners and scientific papers. To build upon a recent collaborative effort to database North American bees from collections (Ascher, 2016), we also visited insect collections at several museums with extensive New York holdings, databasing unique combinations of species, date, and locality for our focal taxa. In most cases we accepted specimen determinations in these collections. Finally, we digitized records from published works including books and the primary scientific literature (Leonard, 1928; MacKenzie and Eickwort, 1996; Fetridge et al., 2008; Matteson et al., 2008; Bried and Dillon, 2012; Ascher et al., 2014; Tumminello et al., 2018; Graystock et al., 2020). These records were combined with the iNaturalist data in a custom Access database (hereafter, the “compiled database”).
2.6 Volunteer recruitment and participation
During initial stages of the project, we reached out to partner organizations, colleagues, and previous NYNHP volunteers to announce the ESNPS and recruit volunteers. As with many community science projects, ESNPS did not require participants to have a scientific background or specialized experience. We provided the necessary training to participate in our effort, including native pollinator biology, general taxonomy, survey methodology (practice capturing in the field), specimen preservation or photo submission, and record collection. We trained over 200 community scientists through day-long workshops in various regions of the state in 2018 and 2019. Volunteers were provided with a Participant Handbook (White et al., 2018) as a companion guide to material presented at the workshop. The handbook included detailed information on the survey protocol and how to submit data and/or specimens. We required either a photographic or specimen voucher for each field observation to ensure verification of records, and participants were encouraged, but not required, to use our Extensive Survey protocol.
2.7 Data QC, analysis, mapping, and ranking
Quality control of our datasets required several steps. Current taxonomy was used for the ESNPS survey data and iNaturalist data; however, some of the museum and partner data proved challenging to reconcile. Museum specimens were often labeled with the taxonomy in place at the time of accessioning, which in some cases changed several times since the collection. And there was no guarantee that partners from whom we obtained data used the same taxonomy we were using. We came up with a project species list that used current taxonomy from the Integrated Taxonomic Information System (ITIS, 2021) and NatureServe Explorer (NatureServe, 2021) and compared our datasets to this standard. When we found discrepancies, we consulted a variety of sources to help us reconcile them, including Discover Life (https://discoverlife.org/), Wikipedia (https://en.wikipedia.org/wiki/Main_Page), the Systema Diptorum Nomenclator (http://www.diptera.org/Nomenclator), and the New World Cerambycidae Catalog (http://bezbycids.com/).
Occurrence data from both the ESNPS data and compiled database formed the basis for species maps, phenology charts, and most of the “rank factors” used in NatureServe’s conservation status ranking methodology (Faber-Langendoen et al., 2012; Master et al., 2012). We used January 1, 2000 as our cutoff for “recent” versus “historical” records; the cutoff is arbitrary but we chose it as a means to better capture known declines in bumble bees in the 1990s (Colla and Packer, 2008). We extracted data from the databases using R (R Core Team, 2021) scripts to ensure repeatability and to allow for quality control checks. We plotted our specimen and iNaturalist data in ArcGIS 10.3 to check coordinate accuracy and confirmed assigned counties matched provided locations from coordinates.
2.7.1 Sampling completeness
To determine how well our field sampling covered New York State, we built a sample-based rarefaction curve (Gotelli and Colwell, 2001) to visualize how species accrued with additional sites sampled. For this purpose, a “site” was an Extensive Survey or Target Habitat Survey site with 3–5 stations. Thus, incidental surveys and sites with fewer stations were excluded from the dataset. All focal taxa were included. We also built rarefaction curves for each ecoregion to highlight the value of additional sampling, although fully representing the fauna of each ecoregion was beyond the scope of the project. We used the BiodiversityR (Kindt and Coe, 2005) and ggplot2 packages in R 4.2.2 (R Core Team, 2022) to build and plot curves.
2.7.2 Maps and phenology charts
We created three maps for each species: 1) historical distribution at the county level overlain by ESNPS specimen records, iNaturalist observations, and partner records; 2) the current (2000 to present) records from the three sources on top of ecoregions; and 3) historical (1999 and earlier) and current (2000 to present) distribution by county. Phenology charts displayed the proportion of occurrence records by half months, plotted separately for the two time periods.
2.7.3 Conservation status ranking
NatureServe’s conservation status ranks are used throughout the western hemisphere as measures of species’ degree of imperilment or security. They are calculated at global, national, and subnational levels and range from 1 to 5. In North America, state and provincial natural heritage programs maintain subnational ranks (S-ranks) for a wide variety of animals, plants, and natural communities. NatureServe’s ranking methodology (Faber-Langendoen et al., 2012; Master et al., 2012) involves assessments of three main factor groups: rarity, threats, and trends (Appendix B). Rarity factors include Range Extent (areal extent of all recent records), Area of Occupancy (area within the range occupied by the species), and Number of Occurrences (number of discrete populations as defined by taxonomically specific population separation distances). Other rarity factors exist in the methodology, but we did not use them for lack of data. Threats are assessed using the Conservation Measures Partnership by one of three methods: 1) complex calculation of overall Threat Impact via enumeration of the scope and severity of all threats; 2) assignment of overall Threat Impact based on expert opinion; or 3) assignment of Intrinsic Vulnerability as high, moderate, or low based on life-history characteristics. Finally, Trends are assessed as short-term (over the last 10 years, or three generations) or long-term (up to 200 years previous).
We used the NatureServe rank “calculator” (NatureServe, 2020), an Excel workbook, to generate S-ranks (as defined in Appendix B). This approach allowed for consistency among species and was repeatable and transparent. Ultimately, conservation status ranks need to be reviewed by experts and for this reason our process was iterative. We aimed for a set of ranks that we felt fairly reflected each species’ imperilment or security but were also appropriately distributed across rank values. To these ends, we adjusted the rank factor values suggested by strict calculation and in some cases included or excluded rank factors to arrive at ranks that better reflected the status of the species based on expert opinion. Details of rank factor calculations and assignments are in Appendix B. We adopted calculated ranks in most cases, while making some adjustments based on expert opinion. Species with no recent (since 2000) records were assigned an SH (Possibly Extirpated).
3 Accomplishments and products
3.1 Sites visited and surveys conducted
We completed 50 Extensive Surveys in 2018, 49 in 2019, and 52 in 2020 (Figure 5), for a total of 151 Extensive Surveys during the three years. Target Habitat Surveys were conducted at 10 alpine sites, 25 barrens sites, 8 coastal dune sites, 15 peatland sites, and 16 late-successional forest sites. We sampled three sites with Malaise traps in the 2017 pilot year, five sites in 2018, three sites in 2019, and five sites in 2020. We conducted over 40 Target Species surveys.
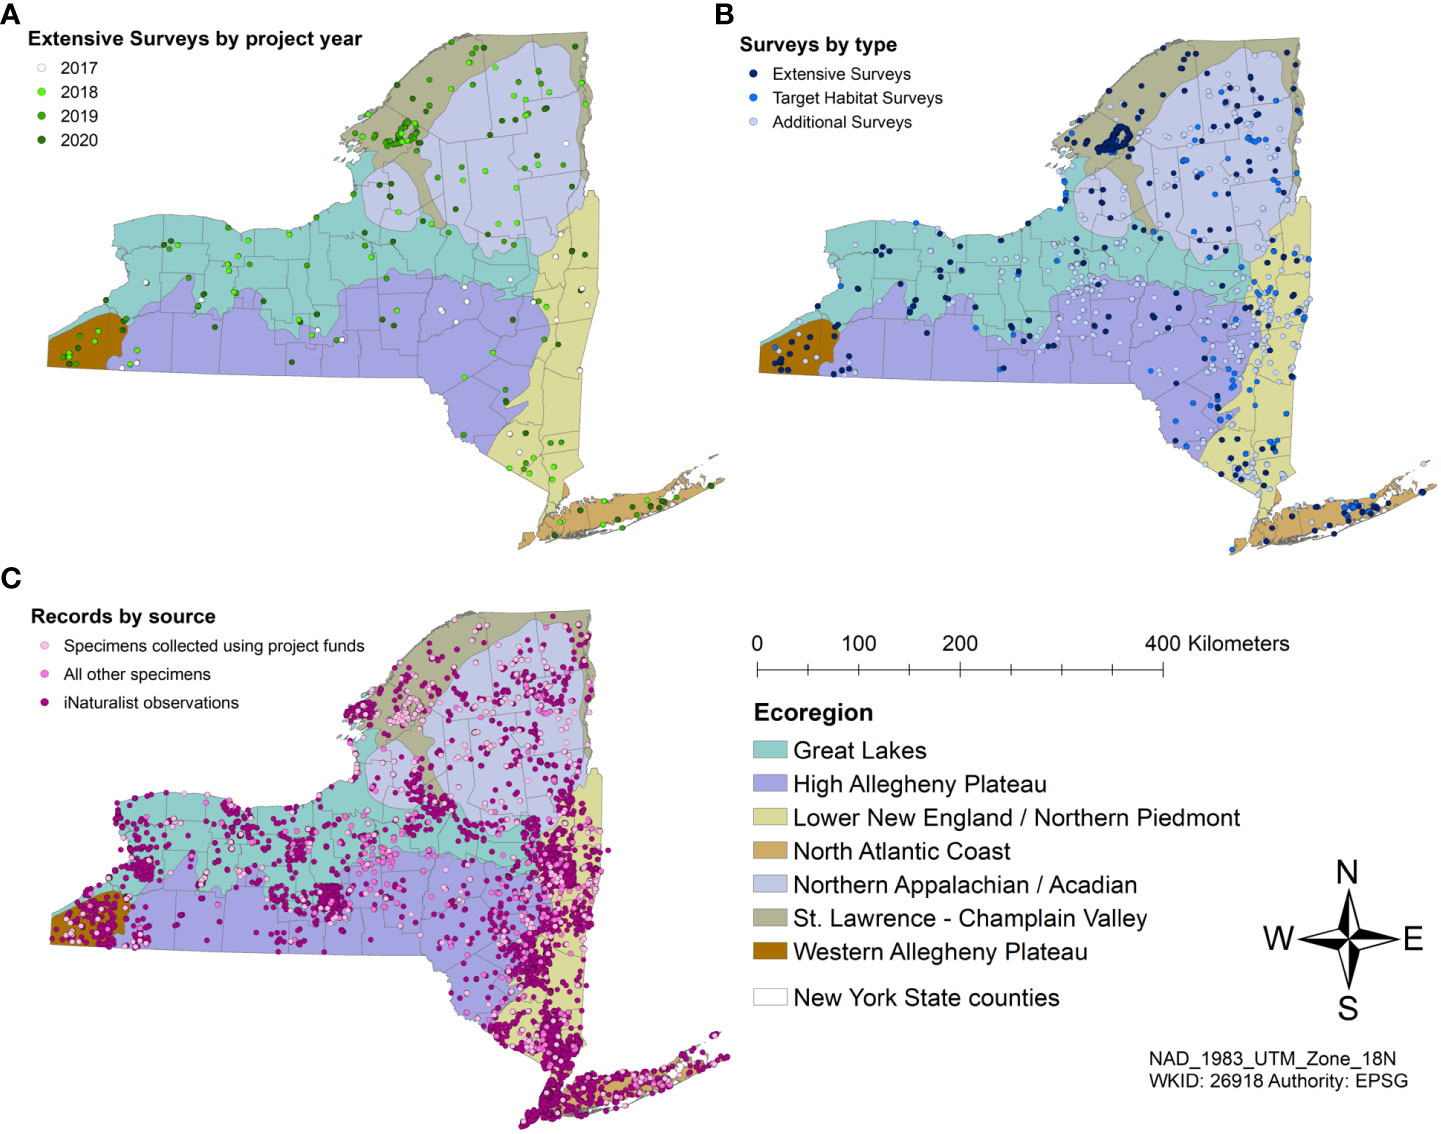
Figure 5 ESNPS surveys and partner data by Ecoregion. (A) Extensive Surveys from 2017 to 2020; (B) Extensive Surveys, Target Habitat Surveys, and Incidental Surveys; (C) Records from specimens collected by trained technicians, those from partners and community scientists, and photographic records from iNaturalist.
Species richness increased with survey effort, but never reached an asymptote (Figure 6), matching our finding that other data sources yielded focal species not detected in our sampling. Species accumulation curves by ecoregion (Figure 6) indicated that additional sampling is needed to fully document each ecoregion’s focal pollinators. Even in the St. Lawrence–Champlain Valley ecoregion, where we conducted two years of additional sampling, we continued to add new species.
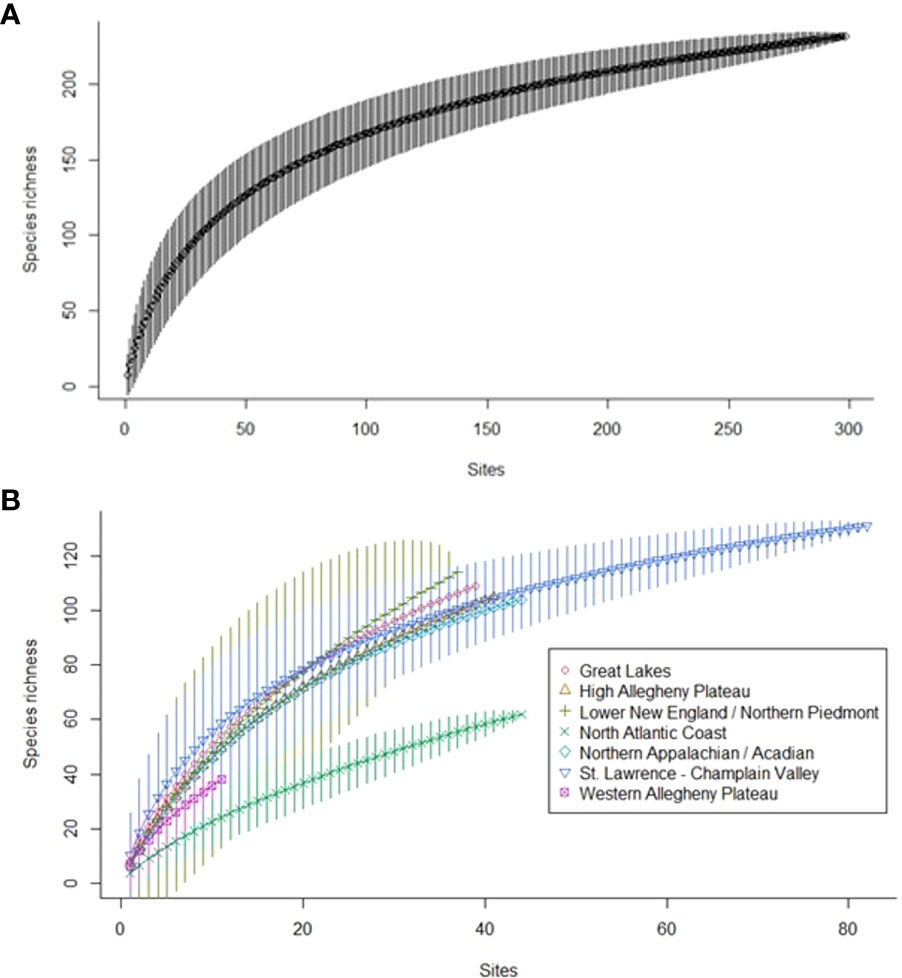
Figure 6 Sample-based rarefaction curves for focal pollinator species (A) detected during Extensive Surveys and Target Habitat Surveys and (B) by major ecoregion, detected during Extensive Surveys and Target Habitat Surveys with three or more stations from 2018–2020 in New York.
Our members-only iNaturalist project included 357 members, who contributed 31,705 photographic observations of 2,008 species. Some of these species were not focal (e.g., butterflies, western honey bees), and many observations of focal species were reported to iNaturalist by users that were not members of our project, so we queried the entire iNaturalist database for our focal taxa.
Combined with partner and museum data, these data sources yielded over 100,000 records of our focal taxa (Table 3).
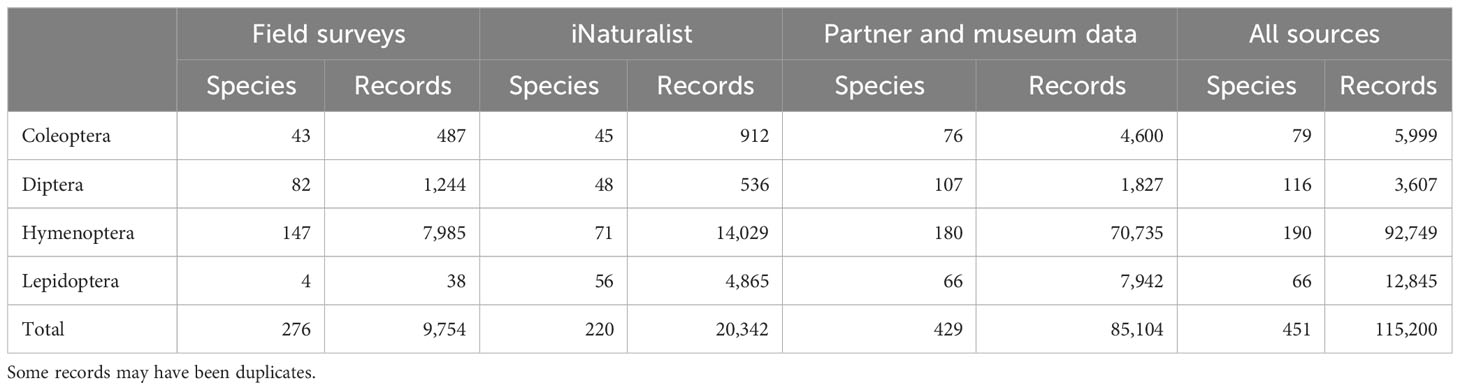
Table 3 Numbers of focal species and focal species records in each of three primary sources of information for a survey of pollinators in New York.
3.2 Species distribution maps
We compiled historical and current records for our focal taxa to inform rarity and trend analyses for the status assessment. We used these data to build a one-page species account for each of 451 species containing distributional maps and phenology charts (e.g., Figure 7). Each species account has a map showing historical presence by county and current records as points. In cases where the location was designated by two or more counties (e.g., a location bordering counties or with locality denoted as a region like “Catskills”), possible counties were denoted with a different shading. Regions appearing in collection information that could be attributed to a group of counties included Long Island (Counties: Nassau, Suffolk, Queens, Kings), NYC (Bronx, Kings, New York, Queens, Richmond), Catskills (Sullivan, Delaware, Greene, Ulster), and Adirondacks (Essex, Hamilton, Saratoga, Franklin, Washington, Warren, Clinton, Herkimer, Lewis, Fulton, Oneida, St. Lawrence). We distinguished ESNPS specimen records from iNaturalist and partner records using different colors.
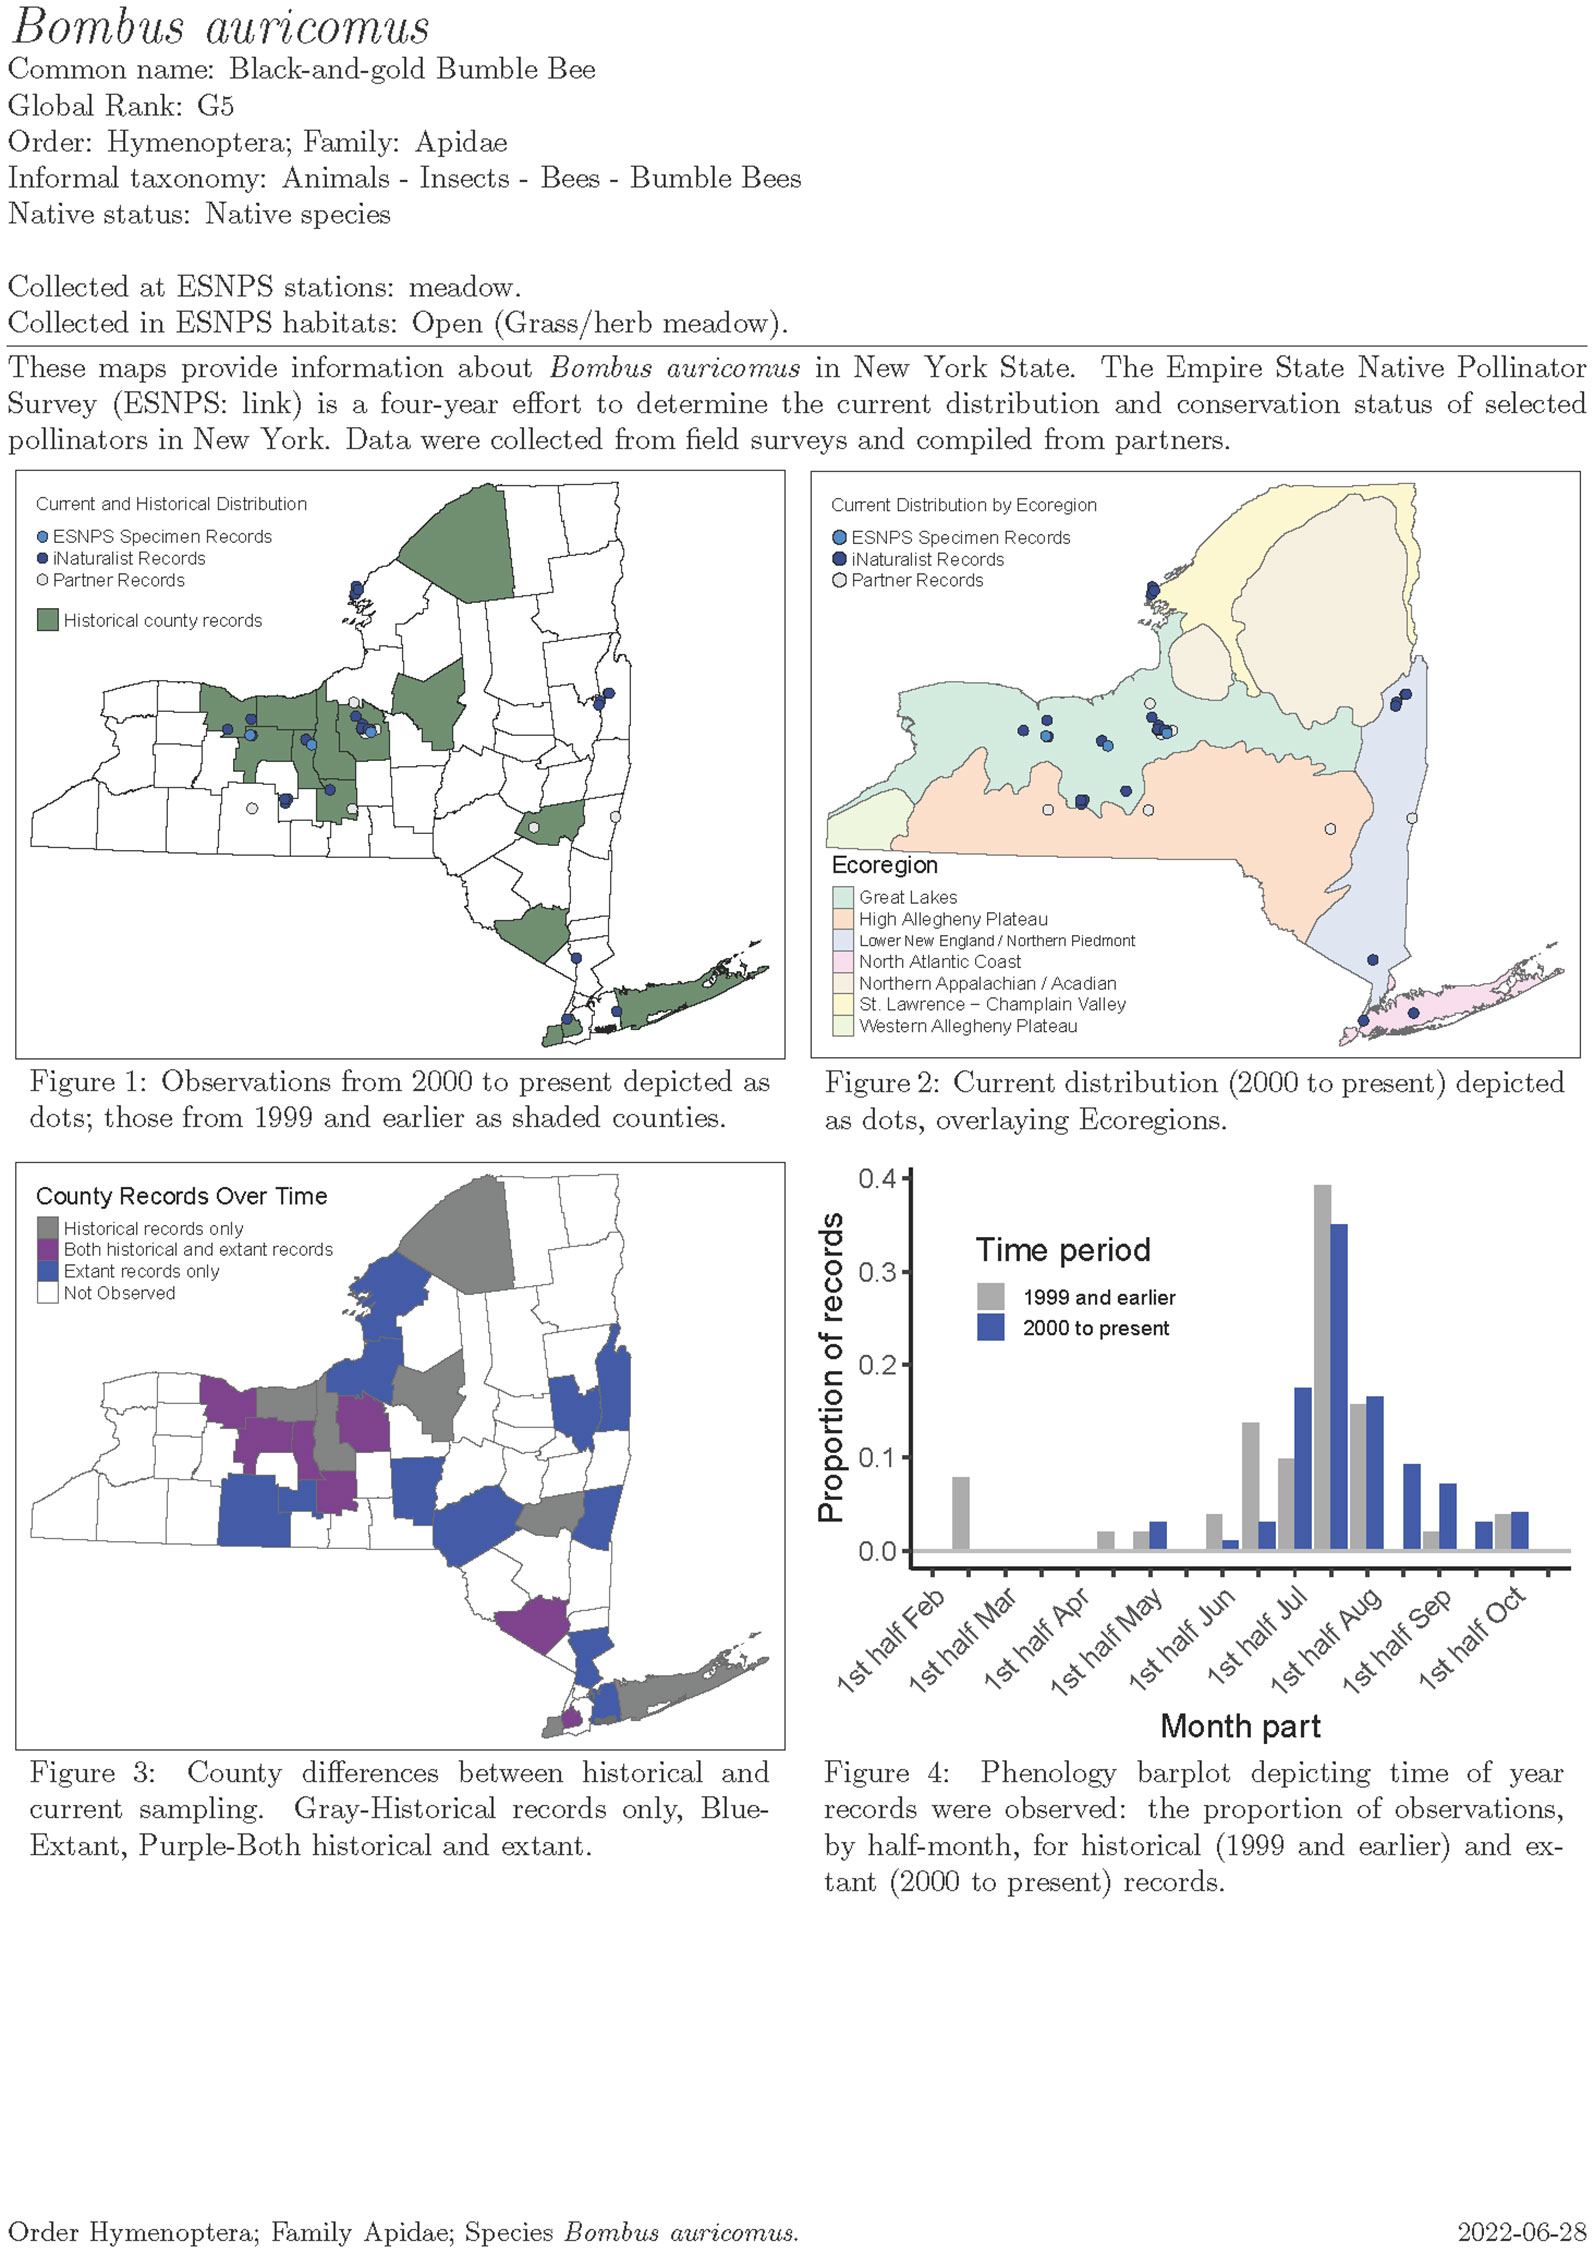
Figure 7 Example map and phenology chart output for Bombus auricomus from the Empire State Native Pollinator Survey.
Another map in each species account displayed current distribution overlaying TNC’s ecoregions, which was part of our sample frame stratification for the Extensive Surveys. A third map displayed county differences between historical and current sampling with color shadings depicting observations by County. Finally, a phenology chart—a column chart depicting the proportion by time period of records (ESNPS, iNaturalist, and other records for which collection or observation date was known) in half-month increments (1st–15th, 16th–end of month) throughout the season for current and historical confirmed observations. The proportion of records displayed may have included multiple specimens from a given site rather than solely unique records from various sites.
3.3 Conservation status ranking
We were able to assign conservation status ranks (S-ranks) to 426 species (out of 457 total; 93.2%): 73 beetles, 100 flies, 190 bees, and 63 moths (Table 4). We were unable to rank (SU) species (31 species; 6.8%) due to lack of information.
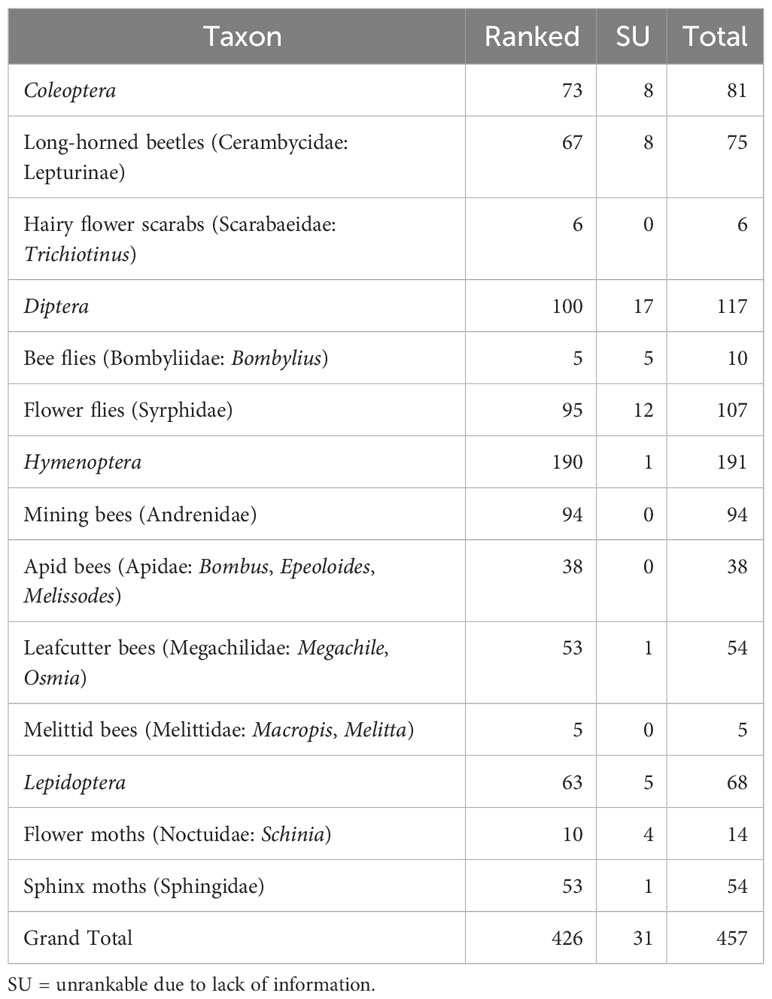
Table 4 Number of species of pollinating insects of New York State ranked as a result of the Empire State Native Pollinator Survey.
4 Discussion
4.1 Reasons for success
As the recognized need for assessing and monitoring pollinators grows (Montgomery et al., 2020; Wagner, 2020; Woodard et al., 2020; Wagner et al., 2021), we present the successful program we designed as a model to help move this important inventory process forward. Some features we believe made it a success were as follows: 1) Clear goal. Our study focused on the endpoint of generating S-ranks, but distribution, abundance, diversity, or even simply a species list may be a suitable target. Our goal also made explicit that we were surveying natural areas, not agricultural lands. 2) Diverse focal taxa. It may seem obvious, but surveying for all pollinating insects would be infeasible, so narrowing to certain key taxa was a critical early step. With the possible exception of the monarch butterfly (Danaus plexippus) bees have gotten the most recent attention in surveys and conservation efforts. This makes some sense, as they are known as the most important pollinators and there have been documented declines, but bees are not the only group of pollinators warranting conservation attention. For example, recent studies examining the conservation status of hover flies (Klymko et al., 2023) and hawk moths (Young et al., 2017) of our region indicate there are species of conservation concern in those groups. We encourage multi-taxonomic approaches to pollinator inventory and conservation whenever possible. 3) Multiple data sources. We recognized early on that a single study, even one over several years, could not adequately document the distribution of focal taxa. Therefore, we supplemented our field data collection with data from partners, museum collections, and community scientists. These data sources added tremendously to our knowledge of species’ distributions. 4) Multiple field data collection approaches. The stratified random design of the Extensive Survey in combination with Target Habitat Surveys appeared to yield a suitable representation of habitats important to pollinators. These georeferenced surveys could be repeated periodically to provide monitoring data. Target Species Surveys were useful in following up on historical locations, or targeting new suitable habitat, for the rarest species. 5) Multiple insect collection methods. Droege (2015) recommended combining pan traps with netting for sampling bees, the latter of which we standardized as a timed search. Malaise traps and blue vane traps (Hall, 2018) yield a lot of insects, which take time to process and sort, but may be a helpful supplement for certain taxa, though concerns have been expressed about overcollection with these methods (e.g., Gibbs et al., 2017). Nocturnal surveys with blacklight traps to sample moths and some beetles were a component of our initial design but funding did not allow deploying this technique at scale. 6) Careful and thorough data curation. The full workflow for data, specimens, and specimen labels needs to be carefully vetted at the beginning of the project to minimize duplication, data loss, or other disruption. Regular backups and automatic quality control steps should be enacted as part of the process.
4.2 Modifications
While on the whole we believe that our study yielded a solid dataset to inform species’ distribution and conservation status, we did identify some areas for improvement and modification: 1) Abundance data collection. In retrospect, we wish we had done more to be able to estimate abundance of select taxa, beyond what can be obtained from standardized pan trap arrays. Changes in abundance are generally mirrored by changes in occupancy or contractions in distribution (Gaston et al., 2000), but recent studies have documented considerable declines in insect biomass, without obvious corollary changes rangewide (Hallmann et al., 2017). Rigorously collected abundance data would also provide a stronger basis for long-term monitoring. Abundance measurements must also account for annual fluctuations many insect populations undergo (Solomon, 1957; Nicholson, 1958; Kuno, 1991) by drawing inferences across multiple sampling years. 2) Collection of host plant and/or habitat data. We made a conscious decision to focus all our field effort on insect collection to obtain records of our focal species’ presence, but some practitioners may wish to take advantage of field time to document forage plants or collect habitat data. Some species’ host plant associations are well documented in some regions (e.g., Fowler, 2016) and this information can be useful for conservation. 3) Improved confidence in identifications. Some museum collections have been examined by taxonomic experts (or their curators are the experts themselves), leading to confidence that specimen identifications are determined correctly. One shortcoming of our study was that the people databasing collections did not always have the expertise to know if specimens had been misidentified. Thus, errors may have been introduced in cases where the label determination was trusted and imported into our database, but the specimen was, in fact, another species. A similar issue arises with published literature and partner data, and even some “Research Grade” observations from iNaturalist. We recommend that future studies have taxonomic experts review at least a proportion of all specimen-based and photographic datasets for accuracy. 4) Taxonomic reconciliation. This took considerably longer than expected. In surveys where only new, field-collected data are being used, the only issue may be the occasional misspelling. In our project, reconciling taxonomy across 150 years and multiple data sources was a burden. One must be a detective in some cases to sleuth out modern-day taxonomic equivalencies, though there are some online resources to help. Taxonomic splits in which one species is divided into two or more, with multiple species now occurring within the geographic area of the study, are especially challenging. For a handful of records from museums or old literature, we could not comfortably assign the record to a species using modern nomenclature and omitted those records from analyses. 5) Accessioning. Another onerous, but necessary, task is specimen curation and accessioning to curated collections. Our specimens are finding homes at the Cornell University Insect Collection and the New York State Museum, but accessioning will need to continue beyond the life of our project and its funding. To this end, good organization of specimens after they are pinned and labeled is key.
4.3 Resources needed and scaling the project
Inventory and monitoring projects are limited less by their visions than by their budgets and person-power that can be dedicated. Because this is primarily a methods paper, we think an understanding of the resources needed to carry out a project like ours will help others attempting similar efforts. We started scoping the project in fall 2016 and conducted a pilot field season in 2017. Our 4.5 years of project funding (Jan 2018–June 2022; our original end date was December 2021 but the COVID-19 pandemic led to delays) covered a half-time project coordinator, 10% of the time of the Principal Investigator, small portions of time for staff for participation in field work and specimen preparation, a 15-wk field crew of two in each of three main project years, contracts for bee identification and fly sampling plus identification, supplies, travel expenses, and indirect costs. Supplementing this were generous donations of time from project volunteers and conservation partners, loaned laboratory space, and some time and travel for field surveys permitted as part of our ongoing inventory partnerships with state agencies. Factors that will influence budgets of similar efforts will include dependence on volunteers versus paid staff, focal taxa chosen and available expertise in those taxa, existing knowledge about the status of those taxa, and of course, the size of the area being studied.
Our survey design can be readily scaled up to larger regions or countries, or down to parks, counties, or townships that wish to understand their pollinator fauna more thoroughly than a single survey per site permits. For example, we designed a scaled-down version of the survey for Fort Drum Military Installation, which we conducted over two years. It was similar to the statewide survey in its stratification by (level IV) ecoregion, field methodology, field-to-data workflow, and specimen database, plus we incorporated iNaturalist records. Similarly, our design could be scaled up, a consideration for the in-progress development of a national bee monitoring program (Woodard et al., 2020). How species accumulate across sites at other spatial scales will depend on the chosen focal taxa, habitats surveyed, field methodology, and sampling design, but in our study, nearly 300 sites sampled with 3–5 pan trap transects and timed aerial netting yielded > 200 focal species. Contributions to distribution maps and conservation status ranks of the different data collection methodologies and details on species diversity by different taxon groupings will be provided in other publications.
Author’s Note
The findings and conclusions in this article are those of the author(s) and do not necessarily represent the views of the U.S. Fish and Wildlife Service, the U.S. Geological Survey, or the other authors’ organizations.
Data availability statement
The original contributions presented in the study are included in the article/Supplementary Files, further inquiries can be directed to the corresponding author/s.
Ethics statement
The manuscript presents research on animals that do not require ethical approval for their study.
Author contributions
MS: Conceptualization, Data curation, Formal analysis, Funding acquisition, Investigation, Methodology, Project administration, Supervision, Writing – original draft, Writing – review & editing. EW: Conceptualization, Data curation, Investigation, Methodology, Project administration, Supervision, Writing – original draft, Writing – review & editing. JC: Conceptualization, Investigation, Methodology, Supervision, Writing – review & editing. BD: Conceptualization, Data curation, Investigation, Methodology, Supervision, Writing – review & editing. MF: Investigation, Methodology, Supervision, Writing – review & editing. CG: Data curation, Investigation, Methodology, Supervision, Writing – review & editing. RH: Methodology, Writing – review & editing. KH-H: Data curation, Investigation, Writing – review & editing. JM: Methodology, Writing – review & editing. KM: Investigation, Methodology, Writing – review & editing. RN: Methodology, Writing – review & editing. JR: Data curation, Investigation, Methodology, Writing – review & editing. MV: Data curation, Investigation, Methodology, Supervision, Validation, Writing – review & editing. TH: Conceptualization, Data curation, Formal analysis, Funding acquisition, Investigation, Methodology, Supervision, Validation, Writing – original draft, Writing – review & editing.
Funding
The author(s) declare financial support was received for the research, authorship, and/or publication of this article. This study was funded by New York State’s Environmental Protection Fund via an MOU between the NYS Department of Conservation and the Research Foundation for SUNY.
Acknowledgments
Thanks to NYSDEC’s Division of Fish and Wildlife for providing funding from New York State’s Environmental Protection Fund. Additional funding came from the U.S. Department of Defense. S. Droege, T. McCabe, and K. O’Brien served on our Advisory Committee along with many of this paper’s authors. J. Klymko, L. Somers, Z. Jacobson, J. Maxwell, G. Keal, A. Eastman, J. Pipino, and many other technicians collected, identified, and curated bee and fly specimens. A. Ballou, A. Conley, L. Shappell, A. Chaloux, L. Sweeney, A. van Keuren, C. Markus, A. Jago, L. Natalie, K. Fierke, J. Giulian, C. Wilson, J. Rushton, S. Lindsay, J. Memmer, M. Wybron, E. Hanan, M. Jacobson, C. Czarnecki, and B. Newkirk (RIP) conducted extensive surveys statewide and/or processed specimens. M. Buff built the ESNPS database and maintained the project website. DJ Evans and F. McKinney provided administrative support. J. Kirchman, J. Hart, and B. Ferenac allowed the use of lab space at the NYS Museum to house and process project specimens. Museum curators, collection managers, and contributors to identification and curation at the American Museum of Natural History, Cornell University Insect Collection, Staten Island Museum, SUNY College of Environmental Science and Forestry, Carnegie-Mellon University, Buffalo Museum of Science, and Yale Peabody Museum were hospitable and accommodating during our visits. The NYS Office of Parks, Recreation, and Historic Preservation and J. Lundgren facilitated our work on State Parks. Data partners included the authors, A. Dillon, C. Vispo and D. Cipkowski, J. Mihuc, S. Kornbluth, M. Buckner, K. Urban-Mead, M. Jacobson, L. Richardson, P. Sharp and R. Eatman, B. Young and M. Ormes, and curators of and contributors to the websites Butterflies and Moths of North America, BugGuide, the Global Biodiversity Information Facility, iNaturalist, and Facebook. We extend special recognition and thanks to iNaturalist identifiers who verified photographs on our iNaturalist project page (https://www.inaturalist.org/projects/empire-state-native-pollinator-survey), including, but not limited to, J. Ascher, B. Dagley, R. Burlew, T. Roberts, L. Shappell, H. McGuinness, W. Fidler, E. Dankowicz, S. Wolkenberg, J. Neylon, B. Cacace, J. Klymko, J. Dombroskie, Z. Dankowicz, C. Hale, H. Holm, C. Scholtens, M. Buck, A. Santos, S. Heideman, R. Calderon, R. Westerduijn, N. Block, D. Bruce, and “hadel”.
Conflict of interest
The authors declare that the research was conducted in the absence of any commercial or financial relationships that could be construed as a potential conflict of interest.
Publisher’s note
All claims expressed in this article are solely those of the authors and do not necessarily represent those of their affiliated organizations, or those of the publisher, the editors and the reviewers. Any product that may be evaluated in this article, or claim that may be made by its manufacturer, is not guaranteed or endorsed by the publisher.
Supplementary material
The Supplementary Material for this article can be found online at: https://www.frontiersin.org/articles/10.3389/fevo.2023.1274680/full#supplementary-material
References
Allen-Wardell G., Bernhardt P., Bitner R., Burquez A., Buchmann S., Cane J., et al. (1998). The potential consequences of pollinator declines on the conservation of biodiversity and stability of food crop yields. Conserv. Biol. 12, 8–17. doi: 10.1111/j.1523-1739.1998.97154.x
Ascher J. (2016). Collaborative databasing of North American bee collections within a global informatics network. Available at: https://www.idigbio.org/portal/recordsets/8919571f-205a-4aed-b9f2-96ccd0108e4c.
Ascher J. S., Kornbluth S., Goelet R. G. (2014). Bees (Hymenoptera: apoidea: anthophila) of gardiners island, suffolk county, New York. Northeast. Nat. 21, 47–71. doi: 10.1656/045.021.0105
Bailey R. G. (1998). Ecoregions: The ecosystem geography of the oceans and continents (New York: Springer-Verlag).
Bried J. T., Dillon A. M. (2012). Bee diversity in scrub oak patches 2 years after mow and herbicide treatment. Insect Conserv. Divers. 5, 237–243. doi: 10.1111/j.1752-4598.2011.00154.x
Brower L. P., Taylor O. R., Williams E. H., Slayback D. A., Zubieta R. R., Ramírez M. I. (2012). Decline of monarch butterflies overwintering in Mexico: is the migratory phenomenon at risk? Insect Conserv. Divers. 5, 95–100. doi: 10.1111/j.1752-4598.2011.00142.x
Cameron S. A., Lozier J. D., Strange J. P., Koch J. B., Cordes N., Solter L. F., et al. (2011). Patterns of widespread decline in North American bumble bees. Proc. Natl. Acad. Sci. 108, 662–667. doi: 10.1073/pnas.1014743108
Colla S. R., MacIvor J. S. (2017). Questioning public perception, conservation policy, and recovery actions for honeybees in North America. Conserv. Biol. 31, 1202–1204. doi: 10.1111/cobi.12839
Colla S. R., Packer L. (2008). Evidence for decline in eastern North American bumblebees (Hymenoptera: Apidae), with special focus on Bombus affinis Cresson. Biodivers. Conserv. 17, 1379–1391. doi: 10.1007/s10531-008-9340-5
Dirzo R., Young H. S., Galetti M., Ceballos G., Isaac N. J. B., Collen B. (2014). Defaunation in the anthropocene. Science 345, 401–406. doi: 10.1126/science.1251817
Droege S. (2015). The very handy manual: How to catch and identify bees and manage a collection. Available at: https://www.usgs.gov/media/files/how-catch-and-identify-bees-and-manage-a-collection.
Edinger G. J., Evans D. J., Gebauer S., Howard T. G., Hunt D. M., Olivero A. M. (2014). Ecological communities of New York State. 2nd ed. (Albany, New York: New York Natural Heritage Program). Available at: https://www.nynhp.org/ecological-communities/.
Faber-Langendoen D., Nichols J., Master L., Snow K., Tomaino A., Bittman R., et al. (2012). NatureServe conservation status assessments: methodology for assigning ranks (Arlington, Virginia: NatureServe). Available at: https://www.natureserve.org/publications/natureserve-conservation-status-assessments-methodology-assigning-ranks.
Ferree C. E., Anderson M. G. (2013). A map of terrestrial habitats of the northeastern United States: Methods and approach. Available at: https://www.conservationgateway.org/ConservationByGeography/NorthAmerica/UnitedStates/edc/Documents/HabitatMap_Methods.pdf.
Fetridge E. D., Ascher J. S., Langellotto G. A. (2008). The bee fauna of residential gardens in a suburb of New York City (Hymenoptera: Apoidea). Ann. Entomol. Soc Am. 101, 1067–1077. doi: 10.1603/0013-8746-101.6.1067
Ford A. T., Ali A. H., Colla S. R., Cooke S. J., Lamb C. T., Pittman J., et al. (2021). Understanding and avoiding misplaced efforts in conservation. FACETS 6, 252–271. doi: 10.1139/facets-2020-0058
Fowler J. (2016). Specialist bees of the northeast: host plants and habitat conservation. Northeast. Nat. 23, 305–320. doi: 10.1656/045.023.0210
Fraisl D., Hager G., Bedessem B., Gold M., Hsing P.-Y., Danielsen F., et al. (2022). Citizen science in environmental and ecological sciences. Nat. Rev. Methods Primer 2, 1–20. doi: 10.1038/s43586-022-00144-4
Fry J. A., Xian G., Jin S., Dewitz J. A., Homer C. G., Yang L., et al. (2011). Completion of the 2006 national land cover database for the conterminous United States. Photogramm. Eng. Remote Sens. 77, 858–864.
Gaston K. J., Blackburn T. M., Greenwood J. J. D., Gregory R. D., Quinn R. M., Lawton J. H. (2000). Abundance-occupancy relationships. J. Appl. Ecol. 37, 39–59. doi: 10.1046/j.1365-2664.2000.00485.x
Geldmann J., González-Varo J. P. (2018). Conserving honey bees does not help wildlife. Science 359, 392–393. doi: 10.1126/science.aar2269
Gibbs J., Joshi N. K., Wilson J. K., Rothwell N. L., Powers K., Haas M., et al. (2017). Does passive sampling accurately reflect the bee (Apoidea: Anthophila) communities pollinating apple and sour cherry orchards? Environ. Entomol. 46, 579–588. doi: 10.1093/ee/nvx069
Gotelli N. J., Colwell R. K. (2001). Quantifying biodiversity: procedures and pitfalls in the measurement and comparison of species richness. Ecol. Lett. 4, 379–391. doi: 10.1046/j.1461-0248.2001.00230.x
Graystock P., Ng W. H., Parks K., Tripodi A. D., Muñiz P. A., Fersch A. A., et al. (2020). Dominant bee species and floral abundance drive parasite temporal dynamics in plant-pollinator communities. Nat. Ecol. Evol. 4, 1358–1367. doi: 10.1038/s41559-020-1247-x
Hall M. (2018). Blue and yellow vane traps differ in their sampling effectiveness for wild bees in both open and wooded habitats. Agric. For. Entomol. 20, 487–495. doi: 10.1111/afe.12281
Hallmann C. A., Sorg M., Jongejans E., Siepel H., Hofland N., Schwan H., et al. (2017). More than 75 percent decline over 27 years in total flying insect biomass in protected areas. PloS One 12, e0185809. doi: 10.1371/journal.pone.0185809
Howard T. G., Schlesinger M. D., Edinger G. J. (2015). Extent and condition of habitats for New York’s Species of Greatest Conservation Need (Albany, NY: New York Natural Heritage Program, State University of New York College of Environmental Science and Forestry). Available at: https://www.dec.ny.gov/animals/7179.html.
ITIS. (2021). Integrated Taxonomic Information System. Available at: www.itis.gov.
IUCN. (2022). The IUCN List of Threatened Species. Available at: https://www.iucnredlist.org/.
Iwasaki J. M., Hogendoorn K. (2021). How protection of honey bees can help and hinder bee conservation. Curr. Opin. Insect Sci. 46, 112–118. doi: 10.1016/j.cois.2021.05.005
Kearns C. A., Inouye D. W., Waser N. M. (1998). Endangered mutualisms: the conservation of plant-pollinator interactions. Annu. Rev. Ecol. Syst. 29, 83–112. doi: 10.1146/annurev.ecolsys.29.1.83
Kindt R., Coe R. (2005). Tree Diversity Analysis: A Manual and Software for Common Statistical Methods for Ecological and Biodiversity Studies (Nairobi, Kenya: World Agroforestry Centre).
Klymko J., Schlesinger M. D., Skevington J. H., Young B. E. (2023). Low extinction risk in the flower fly fauna of northeastern North America. J. Insect Conserv. 27, 657–668. doi: 10.1007/s10841-023-00488-6
Kuno E. (1991). Sampling and analysis of insect populations. Annu. Rev. Entomol. 36, 285–304. doi: 10.1146/annurev.en.36.010191.001441
MacKenzie K. E., Eickwort G. C. (1996). Diversity and abundance of bees (Hymenoptera: Apoidea) foraging on highbush blueberry (Vaccinium corymbosum L) in central New York. J. Kans. Entomol. Soc 69 Suppl, 185–194.
Master L. L., Faber-Langendoen D., Bittman R., Hammerson G., Heidel B., Ramsay L., et al. (2012). NatureServe conservation status assessments: Factors for evaluating species and ecosystem risk (Arlington, VA: NatureServe). Available at: https://www.natureserve.org/publications/natureserve-conservation-status-assessments-factors-evaluating-species-and-ecosystem.
Matteson K. C., Ascher J. S., Langellotto G. A. (2008). Bee richness and abundance in New York City urban gardens. Ann. Entomol. Soc Am. 101, 140–150. doi: 10.1603/0013-8746(2008)101[140:braain]2.0.co;2
McKinley D. C., Miller-Rushing A. J., Ballard H. L., Bonney R., Brown H., Cook-Patton S. C., et al. (2017). Citizen science can improve conservation science, natural resource management, and environmental protection. Biol. Conserv. 208, 15–28. doi: 10.1016/j.biocon.2016.05.015
Montgomery G. A., Dunn R. R., Fox R., Jongejans E., Leather S. R., Saunders M. E., et al. (2020). Is the insect apocalypse upon us? How to find out. Biol. Conserv. 241, 108327. doi: 10.1016/j.biocon.2019.108327
National Research Council. (2007). Status of pollinators in North America (Washington D.C: National Academies Press).
NatureServe. (2020). NatureServe conservation status assessments: Rank calculator version 3.2. Available at: https://www.natureserve.org/products/conservation-rank-calculator/download.
NatureServe. (2021). NatureServe Explorer. Available at: https://explorer.natureserve.org/.
NatureServe. (2022). NatureServe Network Biodiversity Location Data accessed through NatureServe Explorer. Available at: https://explorer.natureserve.org/.
New York Natural Heritage Program. (2017). Element occurrence database (Albany, NY: New York Natural Heritage Program).
Nicholson A. J. (1958). Dynamics of Insect Populations. Annu. Rev. Entomol. 3, 107–136. doi: 10.1146/annurev.en.03.010158.000543
NYS DEC and AGM. (2016). New York State pollinator protection plan (Albany, NY: NYS Departments of Environmental Conservation and Agriculture and Markets). Available at: www.dec.ny.gov/docs/administration_pdf/nyspollinatorplan.pdf.
R Core Team. (2021). R: A Language and Environment for Statistical Computing. Available at: https://www.R-project.org/.
R Core Team. (2022). R: A language and environment for statistical computing. Available at: http://www.R-project.org.
Solomon M. E. (1957). Dynamics of insect populations. Annu. Rev. Entomol. 2, 121–142. doi: 10.1146/annurev.en.02.010157.001005
Stevens D. L., Olsen A. R. (2003). Variance estimation for spatially balanced samples of environmental resources. Environmetrics 14, 593–610. doi: 10.1002/env.606
Stevens D. L., Olsen A. R. (2004). Spatially balanced sampling of natural resources. J. Am. Stat. Assoc. 99, 262–278. doi: 10.1198/016214504000000250
Tumminello G., Volk T. A., McArt S. H., Fierke M. K. (2018). Maximizing pollinator diversity in willow biomass plantings: A comparison between willow sexes and among pedigrees. Biomass Bioenergy 117, 124–130. doi: 10.1016/j.biombioe.2018.07.013
Tuttle J. P. (2007). Hawk moths of North America. (Washington, D.C.: Wedge Entomological Research Foundation).
van Engelsdorp D., Evans J. D., Saegerman C., Mullin C., Haubruge E., Nguyen B. K., et al. (2009). Colony collapse disorder: A descriptive study. PloS One 4, e6481. doi: 10.1371/journal.pone.0006481
Wagner D. L. (2020). Insect declines in the anthropocene. Annu. Rev. Entomol. 65, 457–480. doi: 10.1146/annurev-ento-011019-025151
Wagner D. L., Grames E. M., Forister M. L., Berenbaum M. R., Stopak D. (2021). Insect decline in the Anthropocene: Death by a thousand cuts. Proc. Natl. Acad. Sci. 118, e2023989118. doi: 10.1073/pnas.2023989118
Wehn U., Gharesifard M., Ceccaroni L., Joyce H., Ajates R., Woods S., et al. (2021). Impact assessment of citizen science: state of the art and guiding principles for a consolidated approach. Sustain. Sci. 16, 1683–1699. doi: 10.1007/s11625-021-00959-2
White E. L., Schlesinger M. D., Corser J. D. (2018). Empire State Native Pollinator Survey Participant Handbook (Albany, NY: New York Natural Heritage Program, SUNY College of Environmental Science and Forestry). Available at: https://www.nynhp.org/projects/pollinators/.
Woodard S. H., Federman S., James R. R., Danforth B. N., Griswold T. L., Inouye D., et al. (2020). Towards a U.S. national program for monitoring native bees. Biol. Conserv. 252, 108821. doi: 10.1016/j.biocon.2020.108821
Keywords: pollinator, conservation status, distribution, survey, bees, flies, beetles, moths
Citation: Schlesinger MD, White EL, Corser JD, Danforth BN, Fierke MK, Greenwood CM, Hatfield RG, Hietala-Henschell KG, Mawdsley JR, McFarland KP, Niver R, Rozen JG Jr., Van Dyke M and Howard TG (2023) A multi-taxonomic survey to determine the conservation status of native pollinators. Front. Ecol. Evol. 11:1274680. doi: 10.3389/fevo.2023.1274680
Received: 08 August 2023; Accepted: 31 October 2023;
Published: 17 November 2023.
Edited by:
David Jack Coates, Department of Biodiversity, Conservation and Attractions (DBCA), AustraliaReviewed by:
Edina Török, Hungarian Academy of Sciences, HungaryConstanza Schapheer, University of Chile, Chile
Copyright © 2023 Schlesinger, White, Corser, Danforth, Fierke, Greenwood, Hatfield, Hietala-Henschell, Mawdsley, McFarland, Niver, Rozen, Van Dyke and Howard. This is an open-access article distributed under the terms of the Creative Commons Attribution License (CC BY). The use, distribution or reproduction in other forums is permitted, provided the original author(s) and the copyright owner(s) are credited and that the original publication in this journal is cited, in accordance with accepted academic practice. No use, distribution or reproduction is permitted which does not comply with these terms.
*Correspondence: Matthew D. Schlesinger, mdschles@esf.edu