 Xiaoyan Wei1*
 Ying Xu2,3
- 1School of Economics and Law, University of Science and Technology Liaoning, Anshan, China
- 2College of Mechanical Equipment and Mechanical Engineering, Jimei University, Xiamen, China
- 3Guangzhou Institute of Energy Conversion, Chinese Academy of Sciences, Guangzhou, China
Introduction: In the face of increasingly severe global climate change and environmental challenges, reducing carbon emissions has become a key global priority. Deep learning, as a powerful artificial intelligence technology, has demonstrated significant capabilities in time series analysis and pattern recognition, opening up new avenues for carbon emission prediction and policy development.
Methods: In this study, we carefully collected and pre-processed four datasets to ensure the reliability and consistency of the data. Our proposed TCN-LSTM combination architecture effectively leverages the parallel computing capabilities of TCN and the memory capacity of LSTM, more efficiently capturing long-term dependencies in time series data. Furthermore, the introduction of an attention mechanism allows us to weigh important factors in historical data, thereby improving the accuracy and robustness of predictions.
Results: Our research findings provide novel insights and methods for advancing carbon emission prediction. Additionally, our discoveries offer valuable references for decision-makers and government agencies in formulating scientifically effective carbon reduction policies. As the urgency of addressing climate change continues to grow, the progress made in this paper can contribute to a more sustainable and environmentally conscious future.
Discussion: In this paper, we emphasize the potential of deep learning techniques in carbon emission prediction and demonstrate the effectiveness of the TCN-LSTM combination architecture. The significant contribution of this research lies in providing a new approach to address the carbon emission prediction problem in time series data. Moreover, our study underscores the importance of data reliability and consistency for the successful application of models. We encourage further research and application of this method to facilitate the achievement of global carbon reduction goals.
1 Introduction
The issue of climate change is becoming increasingly prominent, sparking widespread concerns globally and leading to the rise of carbon emission prediction and economic policy research as significant topics Waheed et al. (2019). As human economic activities continue to evolve, the escalating emissions of greenhouse gases further drive changes in the Earth’s climate system, resulting in the frequent occurrence of extreme weather events and exacerbated environmental problems Cao et al. (2017). In order to effectively address climate change, governments and the international community urgently need to formulate practical and feasible emission reduction policies, while utilizing economic policy research to foster the sustainable development of green and low-carbon economies Li et al. (2021). Existing works often overlook the long-term dependencies in time series data, particularly facing challenges when predicting future carbon emission trends. Given the dynamic and uncertain nature of time series data, there is a demand for a novel prediction model that can effectively capture these complex changes Liu et al. (2023). This study aims to introduce an innovative approach by merging the TCN-LSTM model with an attention mechanism, aiming to bring breakthroughs to the fields of carbon emission prediction and economic policy research. Rather than focusing solely on capturing local features, we pay closer attention to the long-term relationships within time series data. Simultaneously, we incorporate an attention mechanism to strengthen the model’s emphasis on crucial information, resulting in a more accurate prediction of future carbon emission trends. Through extensive experiments with multiple real-world datasets, we demonstrate the effectiveness and adaptability of this approach. This innovative model is poised to enhance the precision of carbon emission trend prediction, providing policymakers with more targeted decision support and driving the sustainable development of green and low-carbon economies. Additionally, this paves the way for new methodologies and perspectives in future climate change research.
Carbon emission prediction serves as a crucial foundation for the formulation of effective emission reduction policies. In recent years, deep learning has made remarkable progress in prediction models, benefiting from its powerful representation learning and flexible feature extraction capabilities, as evidenced by CNN models Zhao et al. (2023). While originally designed for image processing, CNN can effectively capture local patterns and features in time series data, making it suitable for short-term carbon emission trend analysis. However, its ability to model long-term dependencies is limited, making it unsuitable for handling long sequences. On the other hand, GRU (Gated Recurrent Unit) models address the challenge of processing long sequences effectively. By employing gate mechanisms, GRU models control information flow, preventing vanishing or exploding gradients Yang et al. (2022). This empowers GRU to capture long-term dependencies in sequences, significantly enhancing prediction accuracy and stability. Despite these strengths, GRU models may still encounter difficulties in modeling long-term dependencies for certain complex tasks.
To address the challenge of handling long sequences, the TCN (Temporal Convolutional Network) model was introduced Zhang and Wen (2022). TCN excels at capturing dependencies across extensive time intervals and offers stable and efficient model training. However, its accuracy might suffer when confronted with significant time dynamic changes within the sequence. To achieve higher prediction accuracy, researchers have been exploring various methods. The Transformer Zhang et al. (2023), based on the self-attention mechanism, has shown remarkable success in natural language processing tasks, such as machine translation. In recent years, the Transformer has found application in other domains, including time series data, especially for handling long sequences. By leveraging self-attention, the Transformer effectively captures dependencies between different time steps. For tasks like carbon emission prediction, where considering factors over a longer period is essential, the Transformer outperforms other methods in handling long-term dependencies, thereby enhancing prediction accuracy. However, it is worth noting that the Transformer demands a substantial amount of real data samples for effective training. In certain carbon emission prediction tasks, obtaining sufficient real data can pose a challenge, which limits the Transformer’s application in specific scenarios. Additionally, the complex internal structure of the Transformer makes interpreting its prediction results difficult. In carbon emission prediction scenarios where interpretability is crucial, the Transformer may not provide intuitive explanations and reasoning processes. As a result, careful consideration of the specific task requirements is necessary when selecting an appropriate model for carbon emission prediction.
As a result, researchers have explored various model combinations, including the CNN-LSTM model Liu et al. (2023). This model utilizes CNN to extract spatial features from the input data, which are then fed into LSTM for further prediction. The combination of CNN and LSTM enables the model to handle multi time-scale sequence data effectively and consider both long-term and short-term dependencies, resulting in improved prediction performance. In the future, continuous optimization and refinement of prediction models, while leveraging the strengths of different models, will be essential to address the challenges in carbon emission prediction and enhance the accuracy and practicality of prediction results. By combining the merits of various models, researchers can develop more robust and powerful prediction frameworks. However, one limitation of the CNN-LSTM model is its lack of weighted treatment of important features. In this approach, all features are treated equally, potentially leading to insufficient attention given to critical factors. As a consequence, this can impact prediction accuracy and stability. To further enhance the performance of carbon emission prediction models, incorporating mechanisms to assign weights to important features or applying attention mechanisms, as seen in other models like the Transformer, could be explored. This way, the model can better focus on crucial factors and make more accurate predictions, contributing to more effective emission reduction policies and the development of a green and low-carbon economy.
This paper proposes a carbon emission prediction model that combines TCN, LSTM, and an attention mechanism to enhance focus on important features. By leveraging the strengths of TCN, LSTM, and the attention mechanism, our model comprehensively handles long sequence data, improving prediction accuracy and interpretability. To handle long sequences effectively, our model first retains the combination of TCN and LSTM. TCN captures dependencies across large time intervals, while LSTM deals with long-term dependencies. This combination allows the model to better handle complex relationships in long sequence data, enhancing its generalization ability and stability. Moreover, we introduce the attention mechanism to strengthen the focus on features at different time steps. The attention mechanism assigns weights to data at different time steps based on their importance, enabling the model to concentrate more on critical features for the prediction task. This enhances the model’s capture and understanding of important factors, improving the interpretability of prediction results. Our TCN-LSTM model, combined with the attention mechanism, considers both long-term and short-term dependencies, handles multi-time-scale data, and weighs important features. As a result, this approach significantly improves prediction accuracy and stability. Notably, the model not only better meets the requirements of carbon emission prediction tasks but also holds potential for generalization in other time series forecasting domains.
The contribution points of this paper are as follows:
● This study introduces, for the first time, a method that integrates the TCN-LSTM model with an attention mechanism to address challenges in carbon emission prediction. By leveraging the parallel computing capability of TCN and the long-term dependency of LSTM, along with the weighted strategy of the attention mechanism, we innovatively enhance the accuracy and robustness of time series prediction models in carbon emission forecasting. This novel fusion of models opens up new avenues of technological advancement in the field of carbon emission prediction.
● To validate the generality and adaptability of the proposed model, extensive experiments were conducted on multiple real-world datasets. These datasets were collected from various institutions such as EIA, EPA, EEA, and IEA, covering diverse geographical areas and time periods. The consistent experimental results across different datasets reveal that our model achieves a high level of prediction accuracy and efficiency. This multi-data source validation ensures the effectiveness of the model in various application scenarios.
● The carbon emission prediction model proposed in this study not only represents a breakthrough in technical terms but also provides valuable insights for decision-makers and governmental organizations. By accurately predicting future carbon emission trends, our model offers crucial support for formulating scientifically sound carbon reduction policies. These predictive insights contribute to steering green economic development, addressing climate change, and achieving sustainable development goals, thereby generating positive impacts on society and the environment.
In the rest of this paper, we present recent related work in Section 2. Section 3 introduces our proposed methods. Section 4 showcases the experimental part. Section 5 contains the conclusion.
2 Related work
2.1 Research on deep learning-based carbon emission prediction models
Deep learning has demonstrated remarkable vitality across various fields. For instance, the classification and recognition of materials on and beneath the Earth’s surface have long been challenging research topics in the realms of Earth science and remote sensing. Hong et al. have contributed significantly to the remote sensing community by developing a versatile Multimodal Deep Learning (MDL) framework that combines “when,” “where,” and “how” aspects, addressing these challenges effectively Hong et al. (2021a). Furthermore, in the exploration and representation of sequential attributes of spectral signatures, a novel backbone network called SpectralFormer has been introduced. This innovation successfully learns local spectral sequence information from adjacent bands of hyperspectral (HS) imagery, yielding grouped spectral embeddings Hong et al. (2021b). Additionally, the authors have conducted in-depth investigations into the application of Convolutional Neural Networks (CNN) and Graph Convolutional Networks (GCN) in HS image classification. They propose a novel approach termed miniGCN, which enables training large-scale GCNs in a mini-batch manner and inferring out-of-sample data without retraining the network, thereby enhancing classification performance. This methodology effectively captures spatial-spectral features within hyperspectral imagery Hong et al. (2020).
Deep learning techniques have also demonstrated significant potential in carbon emission prediction. For example, in recent years, Long Short-Term Memory (LSTM) networks, a type of recurrent neural network capable of capturing long-term dependencies in time series data, have found extensive application in energy forecasting Huang et al. (2019). LSTM models outperform traditional ARIMA models, especially in domains such as carbon emission prediction, where complex nonlinear time series data with high uncertainty and fluctuations are common. In this study, researchers combined the LSTM model to predict carbon emission data and explored parameter adjustments and the training process. By training on a substantial amount of historical data, the LSTM model effectively learns hidden patterns and trends in the time series, leading to more accurate predictions of future carbon emissions. The model’s memory capabilities allow it to handle long-term dependencies in the time series, overcoming the issue of information loss in traditional models and significantly improving long-term forecasting capabilities. Through comparative experiments and validation, this study demonstrates significant progress in the accuracy and robustness of carbon emission prediction based on the LSTM model. The predicted results better reflect actual changes in carbon emissions and exhibit more credible performance in long-term forecasts. As a result, this provides a more accurate and reliable reference for governments, businesses, and international organizations in formulating carbon reduction policies. However, deep learning models also face challenges. Firstly, the training process of LSTM models is relatively complex, requiring a significant amount of computational resources and time. Secondly, deep learning models have higher data requirements, and limited historical carbon emission data may affect the reliability of prediction results. Therefore, in practical applications, researchers need to carefully consider the availability of data and model complexity to strike a balance between prediction accuracy and computational feasibility Ahmed et al. (2022). This research has opened up new directions in the field of carbon emission prediction and emphasizes the significance of careful algorithm and parameter selection when employing deep learning models for prediction. Flexibility in adjusting the models to suit specific circumstances is also crucial.
Looking ahead, further research that combines deep learning techniques with traditional methods holds the promise of even greater improvements in prediction accuracy. Such advancements could provide more intelligent decision support in the global efforts to combat climate change. The future of carbon emission prediction is promising, as we continue to harness the power of deep learning and integrate it with established approaches to enhance our ability to make informed and effective decisions in the face of environmental challenges. By continuously exploring the potential of deep learning in this domain, we can strive for a more sustainable and environmentally responsible future.
2.2 Research on composite models for carbon emission prediction
This study explores the combination of multiple prediction models to achieve more accurate carbon emission predictions. Researchers combine traditional ARIMA models, LSTM models, and Support Vector Regression (SVR) models, among others Ji et al. (2019). By integrating these diverse prediction models, the composite model can fully leverage the unique characteristics and strengths of each model. Traditional ARIMA models excel at handling long-term trends and seasonality in time series data, while LSTM models are adept at capturing long-term dependencies, and SVR models are effective in dealing with non-linear data Meng et al. (2022). By combining these models, their respective shortcomings can be effectively compensated for, reducing prediction errors and improving overall prediction performance. Furthermore, the ensemble prediction model can also perform a weighted average of predictions from different models, thus reducing prediction bias caused by the biases or overfitting of individual models. In practice, fine-tuning and optimizing the weights of each model in the ensemble can further enhance the accuracy and robustness of the composite model Sen et al. (2016).
The integration of multiple models in the composite prediction approach has brought new breakthroughs to carbon emission prediction research, providing more reliable forecasting support for sustainable development decisions. When facing complex climate change and carbon emission fluctuations, the use of ensemble models can help obtain comprehensive and more credible prediction results under different scenarios, offering a scientific basis for policymakers to formulate reasonable carbon reduction policies Qi and Zhang (2022). However, the design and optimization of ensemble prediction models also pose certain challenges. Further research is needed on how to rationally select the weights of each model, how to handle the correlations between models, and how to integrate the predictions from various models. Therefore, future studies can delve into constructing and improving ensemble models to further enhance prediction accuracy and reliability. In conclusion, the integration of multiple prediction models is a promising research direction, with the potential to provide more comprehensive and effective support for carbon emission prediction and sustainable development decisions.
2.3 Development and application of region-specific carbon emission prediction system
Building upon the aforementioned research, to better cater to the regional carbon emission prediction needs, researchers have begun the development of a region-specific carbon emission prediction system. This system aims to integrate various prediction models, data sources, and algorithms to provide highly accurate forecasts and analysis of carbon emission trends for specific areas. It assists local governments, businesses, and social organizations in formulating targeted carbon reduction measures and sustainable development strategies Liu et al. (2021).
Firstly, to accommodate regional differences, researchers have started collecting and integrating global, national, and regional carbon emission data, as well as other key factors influencing carbon emissions, such as economic indicators, energy structures, and policy measures. These data will serve as inputs for the prediction system, used for model training and validation, thus providing a comprehensive reference for the predictions. Zheng et al. (2020) Secondly, to improve prediction accuracy and robustness, the prediction system will integrate the research achievements from the previously mentioned studies based on deep learning and composite models. The system will incorporate various prediction models, such as BiLSTM, CNN, and GAN, which will be selected and combined based on different time scales and data characteristics. The prediction system will utilize data-driven approaches to automatically select the optimal model or model combination to meet the carbon emission prediction needs of different regions and periods. Dong et al. (2013) Furthermore, to enhance the usability and practicality of the prediction system, researchers will develop a user-friendly visualization interface, allowing decision-makers and researchers to easily access and interpret the prediction results. The system will also provide real-time prediction updates and evaluation functions, enabling the tracking of carbon emission changes, and facilitating timely adjustments to decisions and policies in response to potential new situations and challenges.
In the application aspect, the region-specific carbon emission prediction system will provide customized services to different regional governments and businesses. Governments can utilize the prediction results to guide local carbon reduction target setting and policy formulation, promoting the development of a low-carbon economy and environmental protection. Businesses can optimize production plans and resource allocation using the prediction system, achieving a win-win situation in carbon emission management and economic benefits. Additionally, the system provides academia with an essential research tool to explore the correlation between carbon emissions and climate change, as well as to evaluate the effectiveness of carbon reduction measures. Zhang et al. (2020) However, in the development and application of the region specific carbon emission prediction system, there are still some challenges to address. Firstly, acquiring and integrating regional data involves multiple data sources and formats, requiring the establishment of efficient data processing and management mechanisms. Secondly, different regions may have varying carbon emission influencing factors, such as climate and industrial structure. Addressing and balancing these factors in the prediction model is a critical issue. Furthermore, the stability and robustness of the prediction system need to be thoroughly tested and verified to ensure its reliability across different regions and time scales Shuai et al. (2017). In conclusion, the development and application of region-specific carbon emission prediction systems represent a significant advancement in the field of carbon emission prediction. By integrating various prediction models and data sources, and utilizing deep learning techniques and ensemble prediction methods, this system has the potential to make positive contributions to achieving global carbon reduction goals and promoting sustainable development. As technology advances and data becomes more abundant, the prediction accuracy and usability of the system will continue to improve, bringing more hope and possibilities for humanity in the face of climate change.
3 Methodology
3.1 Overview of our network
In this paper, we present a novel carbon emission prediction model that integrates TCN (Temporal Convolutional Network) and LSTM (Long Short-Term Memory) with an attention mechanism. The primary objective of this model is to overcome the limitations of traditional prediction models in handling long-term dependencies and non-linear relationships, while simultaneously enhancing its ability to focus on critical information. By doing so, we aim to improve the accuracy and stability of carbon emission predictions significantly.
Firstly, we introduced the Temporal Convolutional Network (TCN), a neural network structure that plays a significant role by using one-dimensional convolutional layers to expand the time window, thus capturing longer-term dependencies in time series data. This unique feature allows TCN to better handle long-term dependencies and outperform traditional Recurrent Neural Network (RNN) structures by avoiding the vanishing gradient problem, resulting in superior performance on long sequence data.
Secondly, we incorporated the Long Short-Term Memory (LSTM) network, a type of recurrent neural network with memory units that effectively capture long-term dependencies in time series data. LSTM utilizes gate mechanisms to control the flow of information, preventing information loss and vanishing gradients in long sequence data. Combining LSTM with TCN further strengthens the model’s ability to model long-term dependencies, making the prediction model more effective in handling long sequence data. This hybrid approach leverages the strengths of both TCN and LSTM, enhancing the model’s capability to capture complex patterns and relationships in the carbon emission data.
Furthermore, we introduced the attention mechanism, which plays a pivotal role in our model. The attention mechanism enables the model to weigh the importance of different information, allowing it to focus more on critical factors in the historical data and thereby enhancing prediction accuracy. By assigning appropriate weights to the factors influencing carbon emissions, the attention mechanism reflects their relative importance and optimizes the model’s prediction results. In summary, our TCN-LSTM model, combined with the attention mechanism, fully leverages TCN’s long-time window characteristic to capture long-term dependencies. The incorporation of LSTM’s gate mechanism effectively handles long sequence data while mitigating vanishing gradients. The introduction of the attention mechanism further enhances the model’s ability to focus on critical information, leading to more accurate predictions of carbon emissions. This comprehensive approach empowers our model to better understand and model the complexities of carbon emission data, making it a promising tool for carbon emission prediction tasks. Figure 1 provides the overall flow chart.
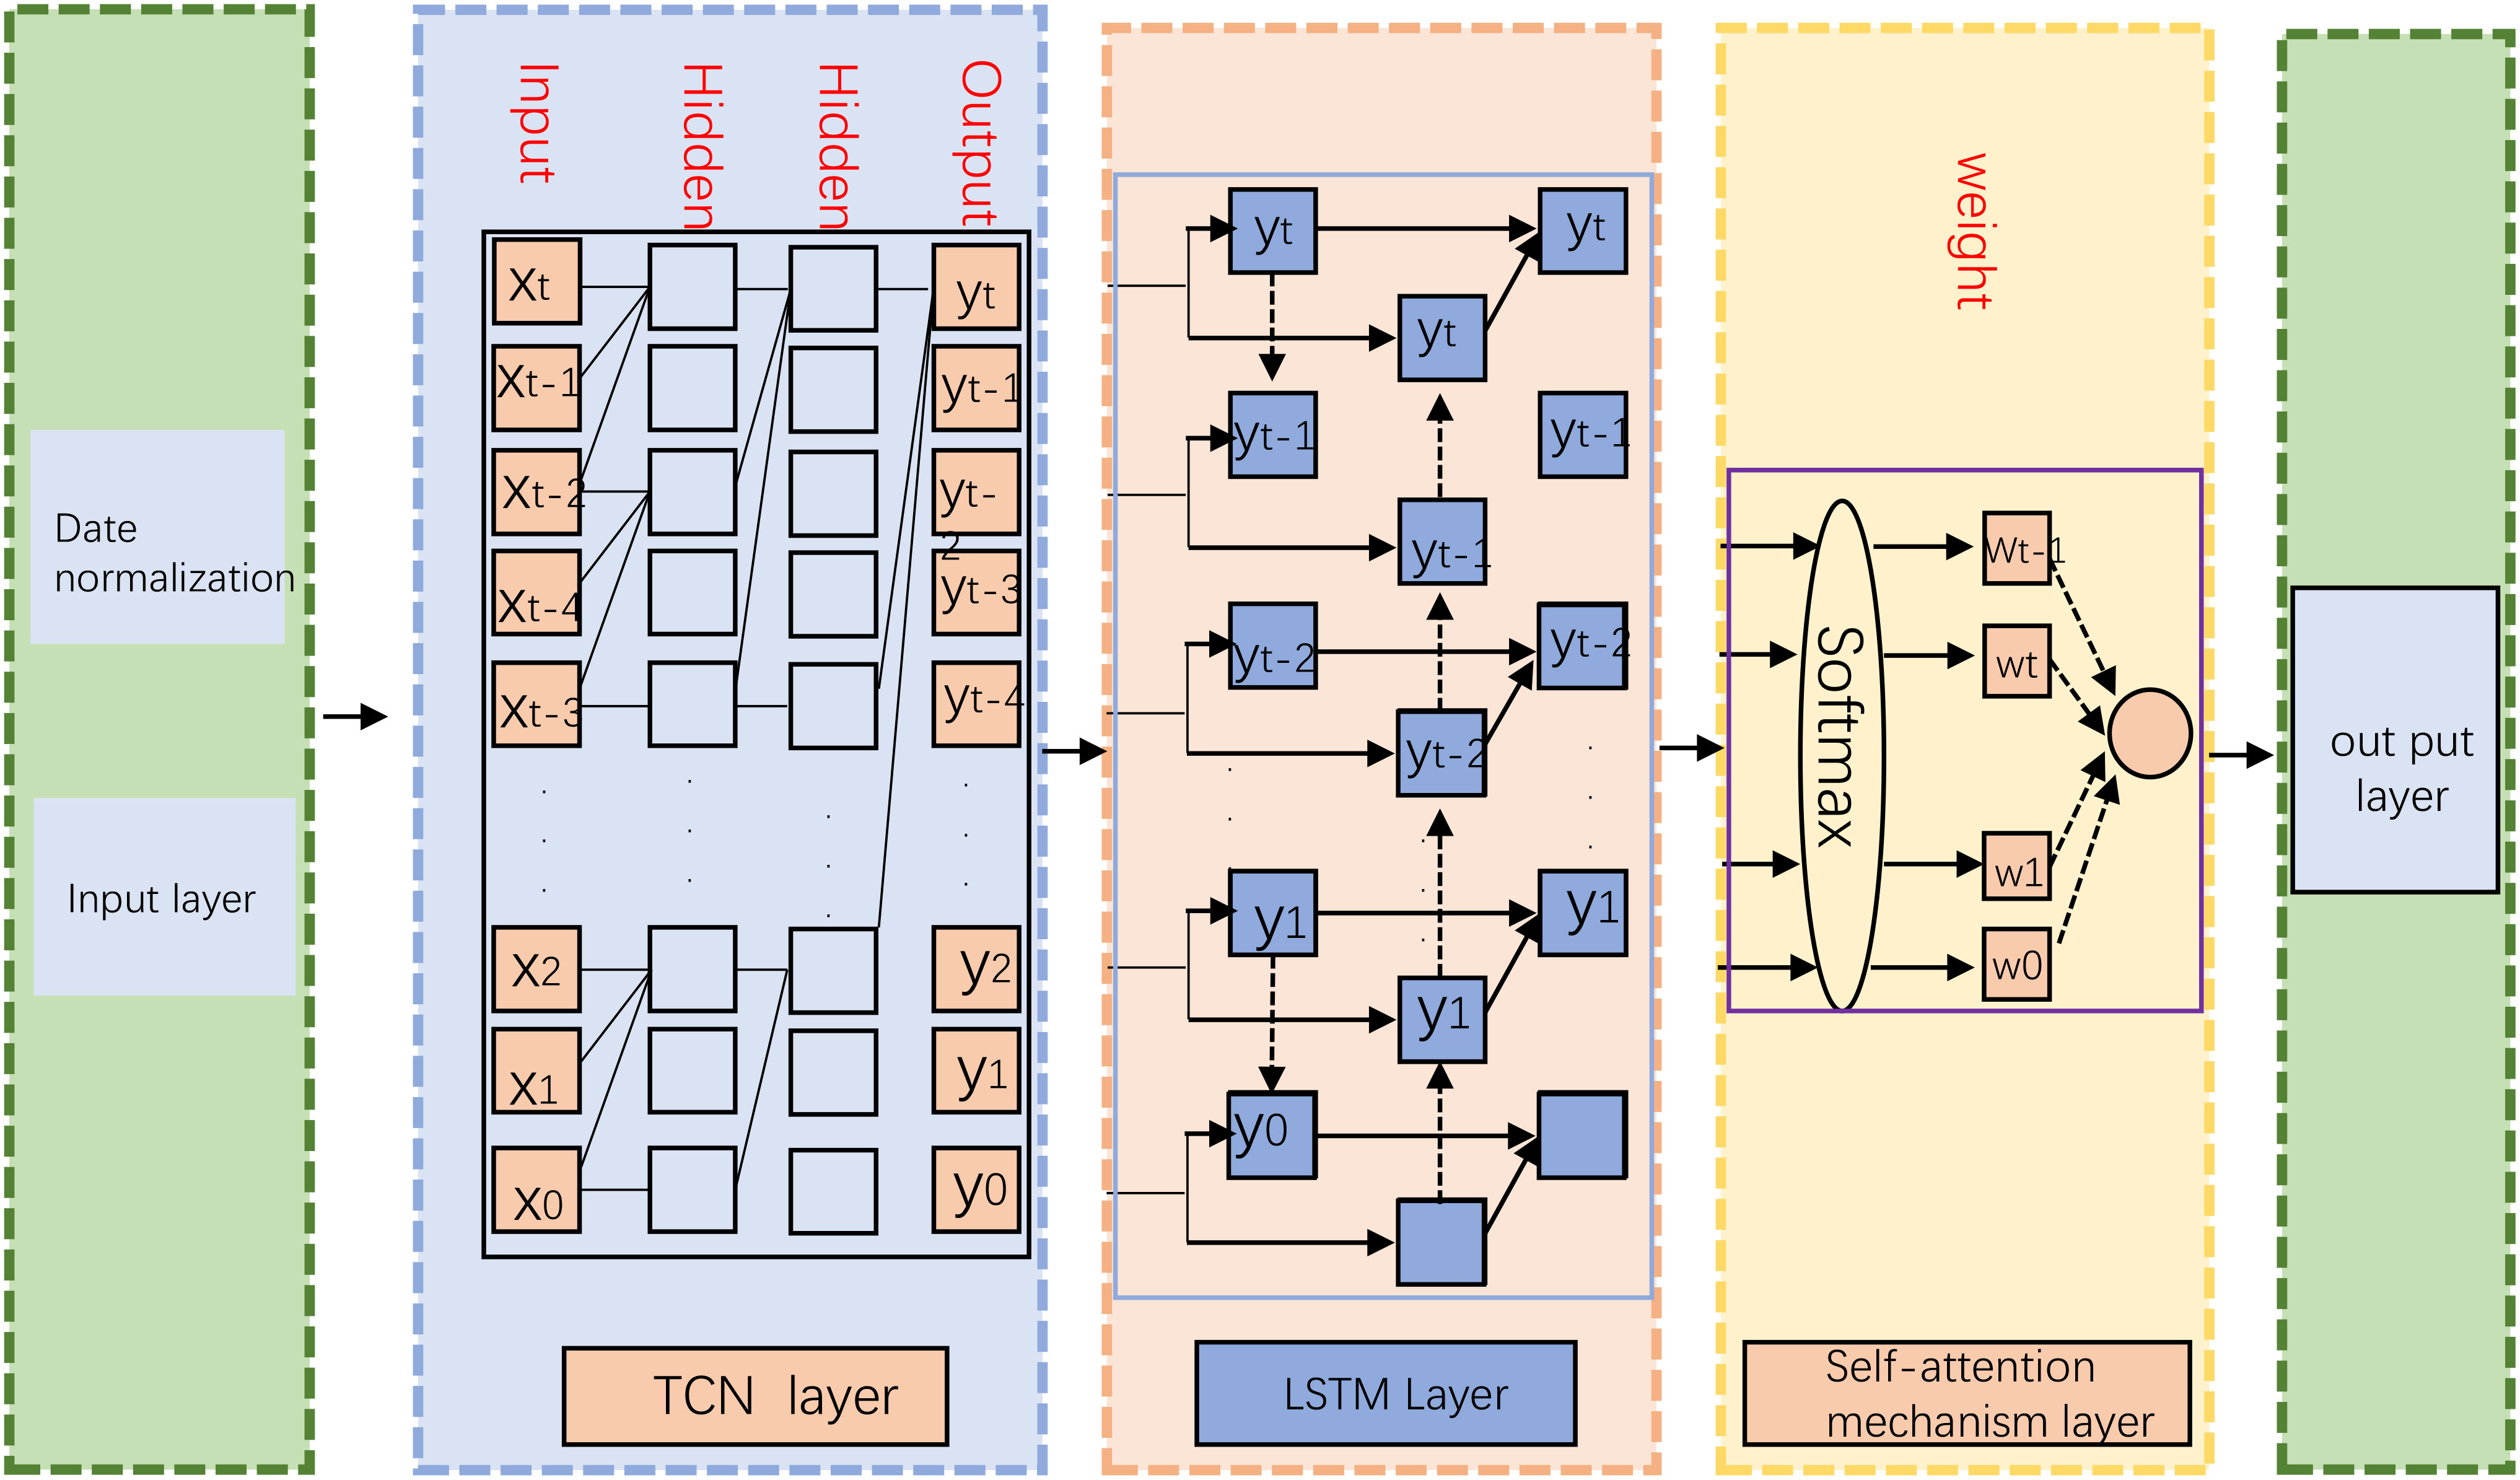
Figure 1 Overall flow chart of the model.
In the experiments, we conducted training and evaluation of our TCN-LSTM model using diverse datasets, including EIA Lv and Piccialli (2021), EPA Kow et al. (2022), EEA Tietge et al. (2019), and IEA Pinto et al. (2023). To ensure robustness and optimize performance, we employed techniques such as cross-validation and error analysis. Through these methods, we fine-tuned hyperparameters and model structures, aiming to enhance prediction accuracy and stability. Overall, our TCN-LSTM model, complemented by the attention mechanism, offers several notable advantages. It effectively overcomes the limitations of traditional prediction models by adeptly handling long-term dependencies and non-linear relationships. The incorporation of the attention mechanism further strengthens the model’s ability to prioritize critical information, leading to improved prediction accuracy. Through rigorous experimental validation, our model demonstrated highly accurate carbon emission predictions across multiple datasets, providing reliable support for environmental protection and carbon reduction policy formulation. We anticipate that this model will play a significant role in the field of carbon emission prediction and economic policy research, contributing positively to sustainable development and environmental protection efforts. Its potential impact on addressing environmental challenges and facilitating informed decision-making makes it a valuable tool for advancing the cause of sustainability and environmental stewardship.
3.2 TCN model
TCN (Temporal Convolutional Network) is a neural network architecture used for processing time series dataHewage et al. (2020). It employs convolutional layers to capture local patterns and long-term dependencies within the time series. The convolutional layers utilize one-dimensional convolutional operations, allowing the network to effectively capture temporal features in the time series data. The one-dimensional convolutional kernels slide along the time dimension, performing convolution operations on different parts of the input sequence, thereby generating feature maps with local perception capabilities. By stacking multiple convolutional layers, the network gradually learns more abstract and advanced features, enabling it to capture more complex patterns and long-term dependencies within the time series. Figure 2 provides a flow chart of TCN.
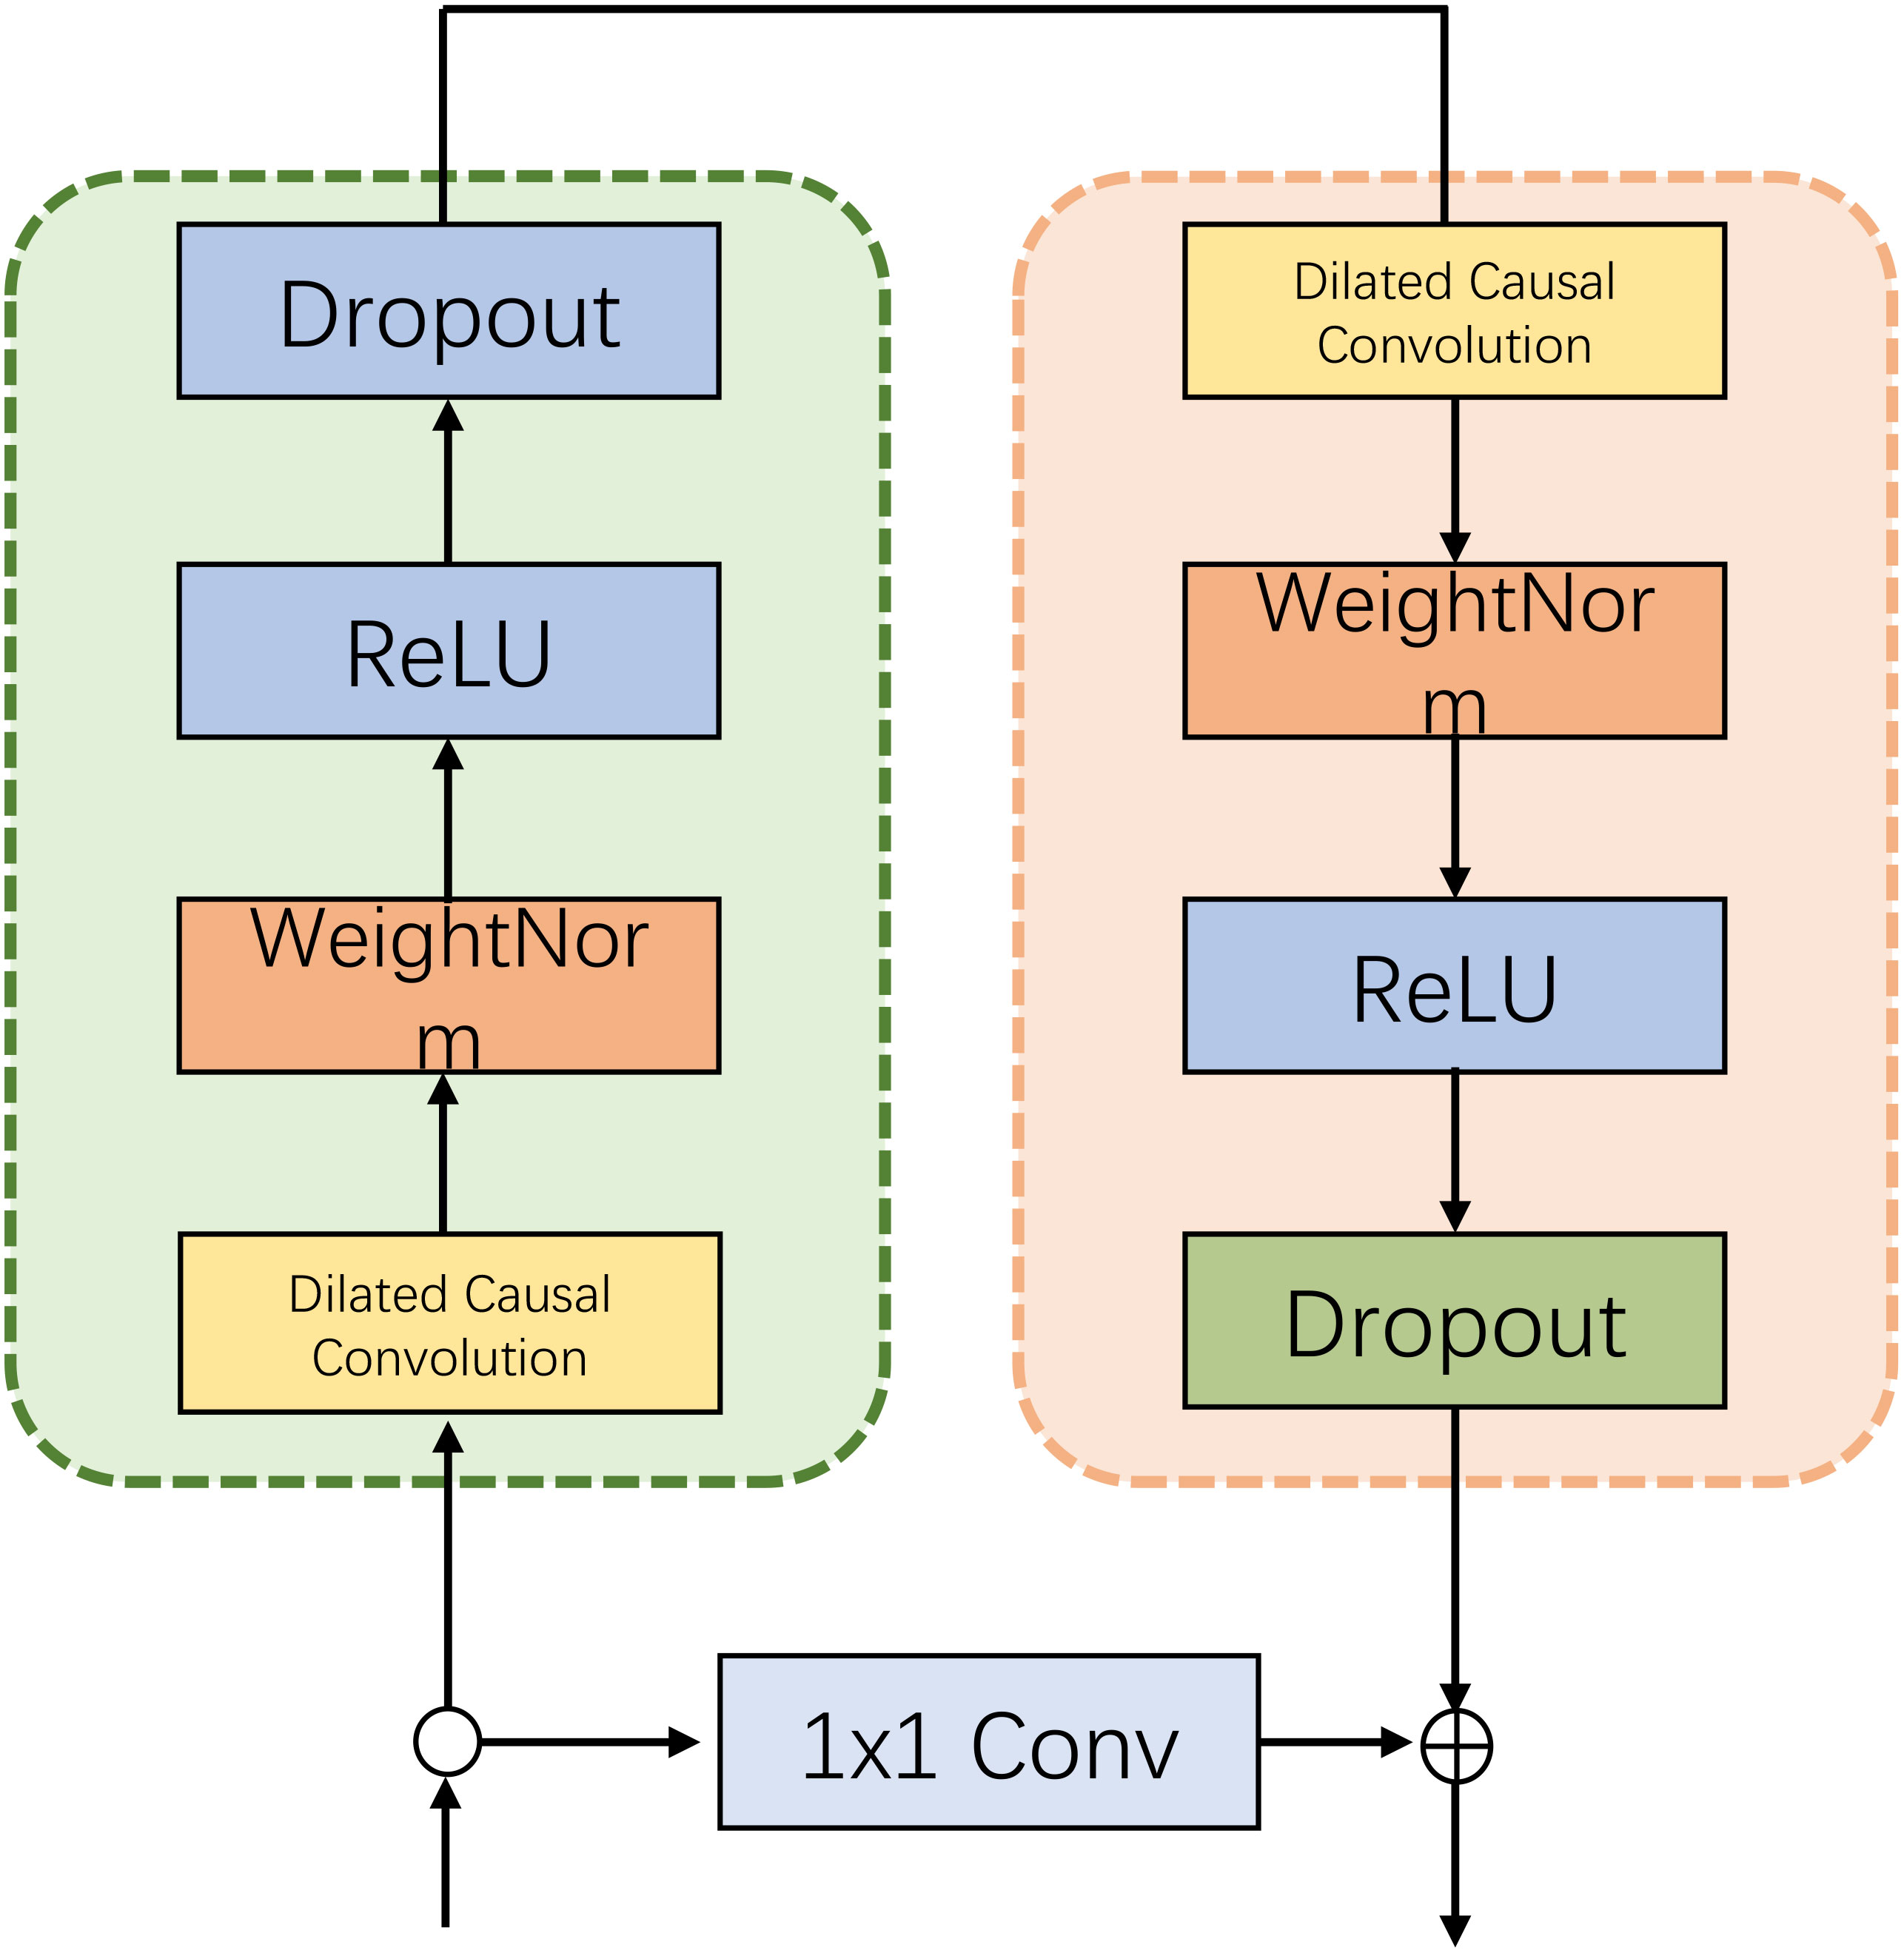
Figure 2 Generic TCN with dilated causal convolution and residual structure.
3.2.1 One-dimensional convolutional layer
In the one-dimensional convolutional layer, we use a convolutional kernel of length k to perform the convolution operation on the input data, resulting in a feature map at a specific position. For input sequence data X, the calculation formula for the i-th position of the output feature map Y is as follows:
In the equation, Y[i] represents the i-th element of the output sequence, indicating the model’s prediction at time step i. X[i + j] represents the (i + j)-th element of the input sequence, where j is an offset relative to i. W[j] represents the model’s weight parameters. b is the model’s bias parameter used to introduce an offset in the output.
3.2.2 Multiple convolutional layers
TCN typically consists of multiple convolutional layers, where the output of each layer serves as the input to the next layer. The calculation formula for multiple convolutional layers is as follows:
In the equation, Y[l] represents the output of the l-th convolutional layer, Y[l − 1] represents the output of the (l − 1)-th convolutional layer, W[l][j] is the j-th parameter of the convolutional kernel in the l-th layer, and b[l] is the bias term for the l-th convolutional layer.
3.2.3 Pooling layer
In TCN, pooling layers are commonly used to reduce the size of feature maps, thereby decreasing computational complexity. The most common pooling operation is max pooling, which takes the maximum value of each region in the feature map as the output after pooling.
Let F be the input feature map, and the pooling operation can be formalized as follows:
Here, Window(F) represents all positions of the sliding window on the feature map, and max(Window(F)) represents selecting the maximum value within the window at each position.
3.2.4 Padding
To maintain the same sequence length for both input and output, TCN commonly adopts a “causal” padding approach. This involves padding zeros on the left side of the input sequence, preventing the convolution process from involving future information. As a result, TCN performs excellently in tasks such as time series prediction.
In the study of carbon emission prediction, the TCN model has been instrumental. We combined TCN with LSTM and integrated an attention mechanism, resulting in a significant boost to prediction accuracy and stability. The introduction of the TCN model enabled the effective handling of long sequence data while capturing local and global information in time series data. The utilization of multi-layer one-dimensional convolutional layers in TCN facilitated capturing long-term dependencies and addressed the gradient vanishing problem often encountered in traditional models. Moreover, the combination of TCN and LSTM enhanced the model’s ability to capture long-term dependencies effectively. To further enhance prediction accuracy, we incorporated the attention mechanism, dynamically learning weights for each time step. This allowed the model to focus more on crucial time segments, resulting in a notable improvement in prediction accuracy. The attention mechanism can be implemented through soft or hard attention. In our case, it forms our TCN-LSTM combined with an attention mechanism for carbon emission prediction. The comprehensive utilization of TCN’s long-time window characteristics and LSTM’s long-term dependency modeling, along with the attention mechanism’s focus on key information, led to substantial performance improvements in our prediction model. As a result, our TCN-LSTM combined with an attention mechanism has significantly contributed to advancing carbon emission prediction in this field.
3.3 LSTM model
LSTM (Long Short-Term Memory) is a special type of recurrent neural network (RNN) architecture that effectively addresses the issues of gradient vanishing and exploding encountered in traditional RNNs when processing sequence data Kong et al. (2022). LSTM networks consist of multiple memory cells, each equipped with three crucial gates: the input gate, forget gate, and output gate, which control the flow of information in and out of the cells. These gates enable LSTM to retain and selectively update information over time, making it particularly suitable for tasks involving long-range dependencies in sequential data. Figure 3 provides a flow chart of LSTM.
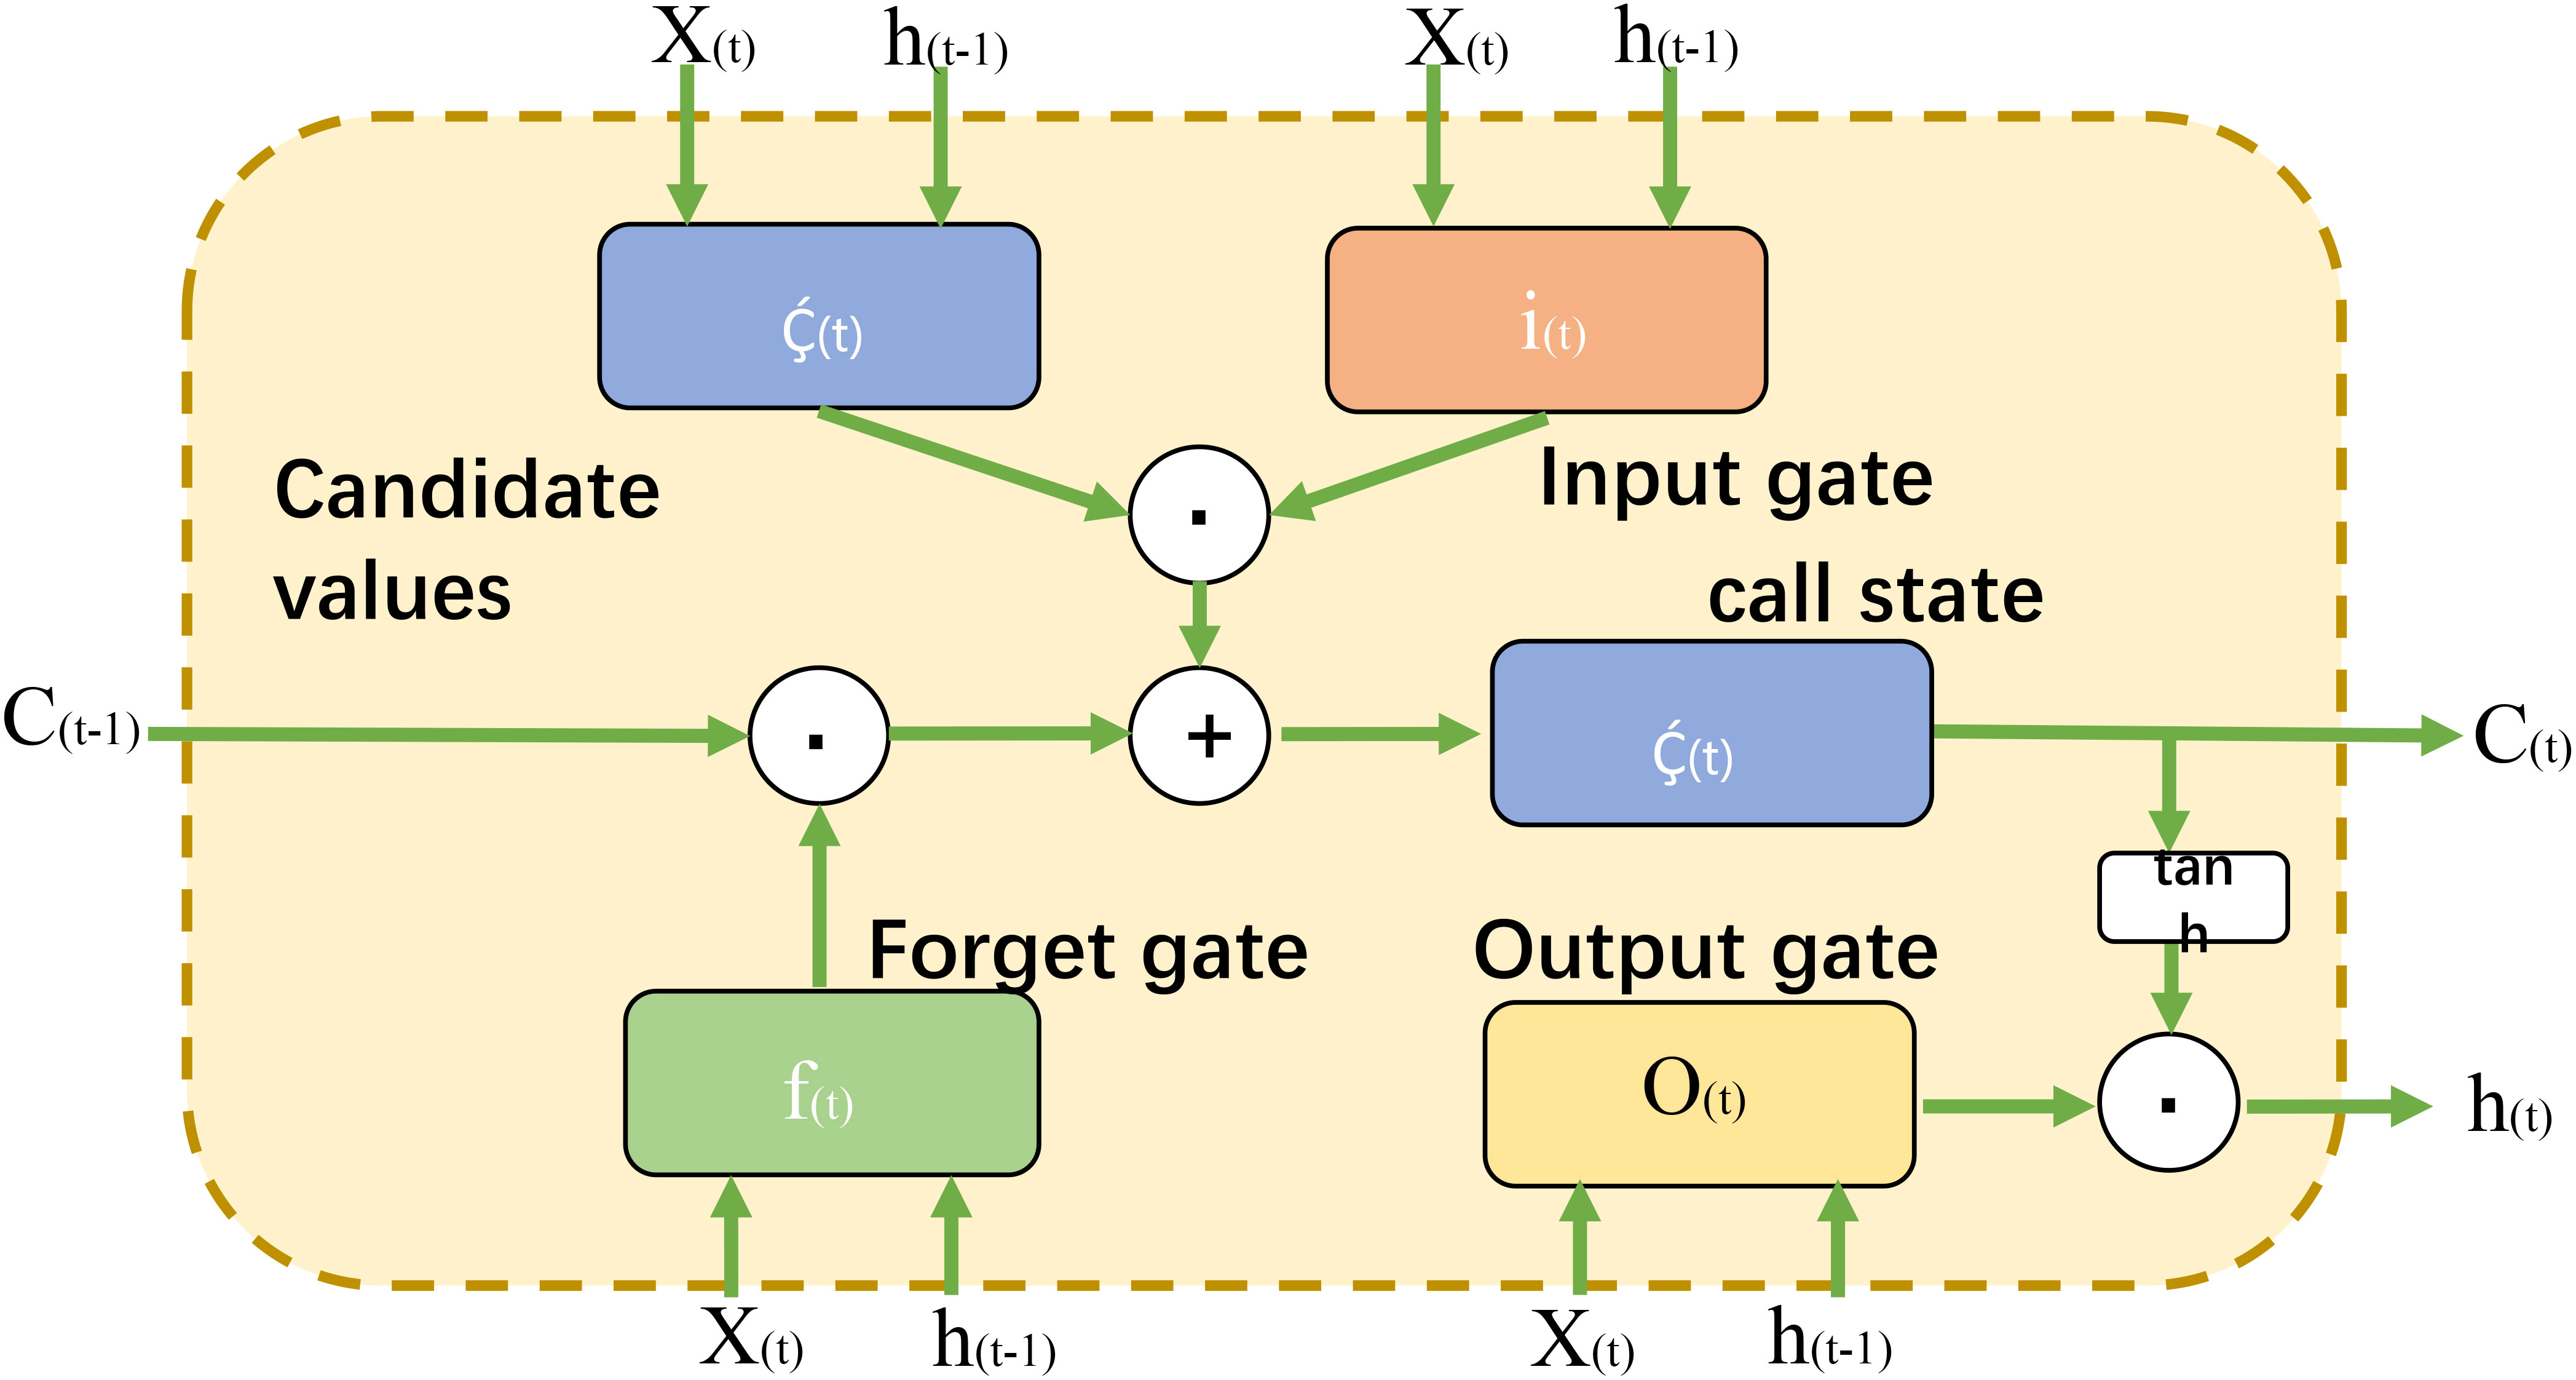
Figure 3 The basic LSTM network structure.
3.3.1 Forward propagation
For an LSTM cell, assuming the current input at time step t is xt, the previous hidden state at time step t − 1 is ht−1, and the previous cell state is ct−1. The three gate units of LSTM are the input gate it, the forget gate ft, and the output gate ot. The forward propagation process of LSTM is as follows:
Calculation of the input gate it:
Calculation of the forget gate ft:
Calculation of the output gate ot:
Calculation of the candidate cell state ct:
Update of the cell state ct:
Calculation of the output hidden state ht:
3.3.2 Backward propagation
We use the Cross-Entropy Loss function to measure the error between the predicted values and the true labels, denoted as L(Y,Ŷ). The calculation of the Cross-Entropy Loss function is as follows:
Where K represents the number of label categories, is the probability of the sample having the true label of the category k at time step t (1 if it’s the true label, 0 otherwise), and is the predicted probability by the model at time step t.
Next, we use the backpropagation algorithm to compute the gradients of the model parameters. Backpropagation calculates the partial derivatives of the loss function concerning the model parameters using the chain rule and propagates the gradients layer by layer through the network. Let L be the loss function and θ be the model parameters, backpropagation computes to obtain the gradient information. Then, an optimization algorithm (e.g., Gradient Descent) is used to update the model parameters to minimize the loss function. The update step of Gradient Descent is as follows:
Where α is the learning rate, controlling the step size of parameter updates. Through iteratively performing backpropagation and parameter updates, the LSTM model gradually optimizes its parameters, making the predicted results closer to the true labels and improving the model’s performance.
Our TCN-LSTM combined attention mechanism for carbon emission prediction heavily relies on LSTM, which plays a pivotal role in the model. By leveraging LSTM’s gated mechanism, our model gains precise control over information flow, enabling targeted memory and updates for time series data. This capability empowers the model to accurately capture long-term trends and correlations within the time series data, significantly enhancing the accuracy and stability of carbon emission forecasts. Integrating LSTM with TCN and the attention mechanism allows us to fully exploit its advantages in handling sequential data, leading to remarkable advancements in carbon emission prediction. This unique combination enables our model to adapt better to the characteristics of time series data, providing decision-makers with more reliable carbon reduction strategies and environmental protection decisions.
3.4 Attention mechanism
The Attention Mechanism is a commonly used technique in deep learning, aimed at enhancing the model’s focus on different parts of the input data. In traditional neural networks, all input data is treated equally, regardless of its position or importance in the input sequence Lin et al. (2021). However, when dealing with sequential data or longer texts, information at different positions may carry varying degrees of importance. The Attention Mechanism dynamically assigns different weights to different input positions, allowing the model to concentrate its attention on more important parts, thus better capturing critical information. Figure 4 provides a flow chart of the Attention Mechanism.
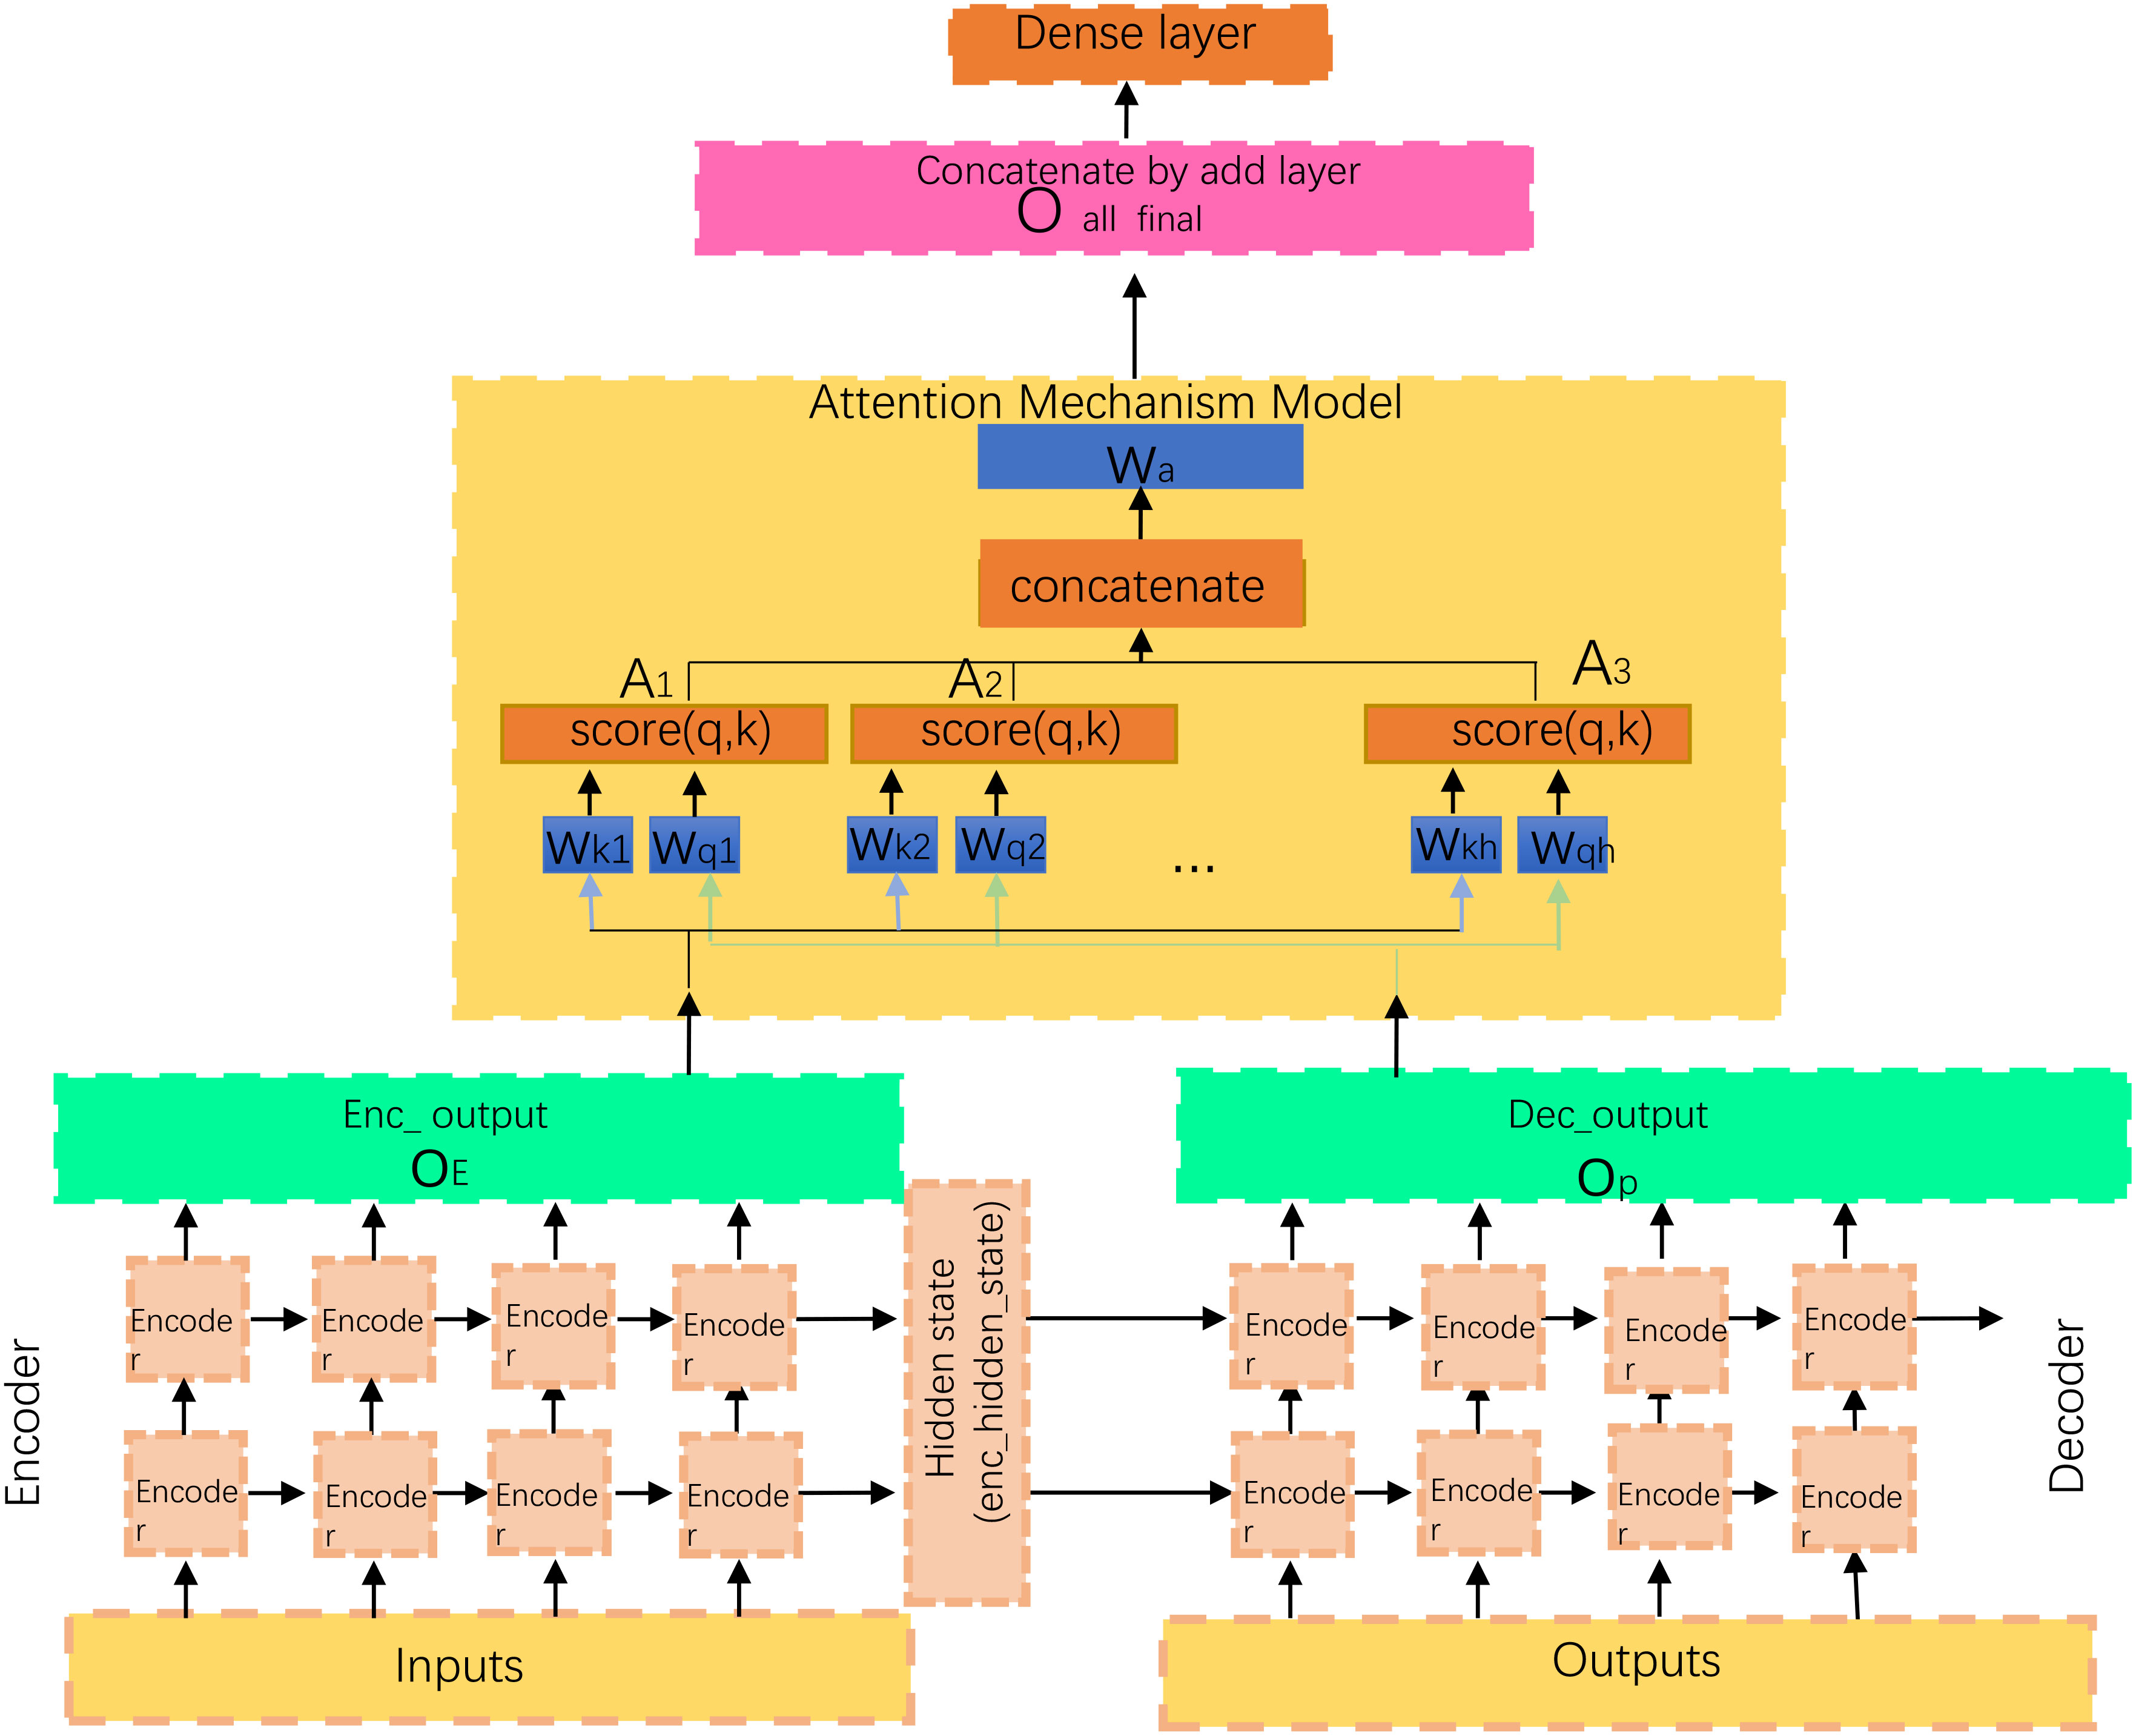
Figure 4 Compute process of attention.
3.4.1 Attention weight calculation
Attention weights are used to measure the importance of different input positions. In sequence data, the Softmax function is commonly used to calculate attention weights. For each position i, the calculation of attention weight is as follows:
Where ei represents the relevance score between position i and context information (e.g., query vector). The specific calculation of ei may vary depending on the attention mechanism used. In different attention mechanisms, the calculation of ei may differ.
3.4.2 Context vector calculation
The context vector is obtained by taking a weighted sum of the input sequence based on the attention weights. It represents a weighted representation of the input sequence, where more attention is given to important positions. The calculation of the context vector c is as follows:
Where wi represents the attention weight and xi represents the feature vector corresponding to position i in the input sequence.
3.4.3 Feature combination
The context vector c is usually combined with the feature at a certain position through concatenation or other methods to obtain an attention-enhanced feature representation for that position. Specifically, the context vector c can be concatenated with the feature xi at position i as follows:
Where [c,xi] denotes the concatenation operation. The resulting fi can be used as the input for subsequent tasks, such as feeding it into a neural network for classification, regression, or other tasks. The introduction of the attention mechanism allows the model to focus on important positions in the input sequence, thereby improving the model’s performance in various experiments.
In this paper, we have introduced an attention mechanism to enhance the focus on key information in our carbon emission prediction model, resulting in improved accuracy and stability. By dynamically learning weights for each time step, the attention mechanism enables the model to prioritize important time segments. In the context of carbon emission prediction, different time steps may carry varying levels of importance, influenced by factors such as economic policies or natural events. The attention mechanism allows our model to adaptively learn these weights, concentrating more on critical information and disregarding less relevant parts. Our model incorporates the attention mechanism to process outputs from both the Time Convolutional Neural Network (TCN) and Long Short-Term Memory (LSTM). It performs a weighted average of their features by calculating the weights for each time step. The weighted average enables our model to emphasize time steps that significantly contribute to the prediction results, ultimately enhancing the accuracy and stability of our predictions.
4 Experiment
4.1 Datasets
In this paper’s experiments, we will use four main datasets: the U.S. Energy Information Administration (EIA) Lv and Piccialli (2021), the U.S. Environmental Protection Agency (EPA) Kow et al. (2022), the European Environment Agency (EEA) Tietge et al. (2019), and the International Energy Agency (IEA) Pinto et al. (2023). These datasets are essential for predicting carbon emissions, as they provide abundant and high-quality data on carbon emissions.
We acquired significant U.S. carbon emission data from the U.S. Energy Information Administration (EIA). This dataset comprises carbon emission data from various regions and industries in the U.S., spanning multiple years, which allows for a comprehensive analysis of U.S. carbon emission trends. The data underwent rigorous auditing and processing to ensure its accuracy and reliability.
Furthermore, we gathered a detailed dataset provided by the U.S. Environmental Protection Agency (EPA), containing carbon emission data from diverse industries and enterprises within the U.S. This dataset offers valuable insights into carbon emission patterns across different sectors, providing comprehensive support for building the carbon emission prediction model.
Moreover, we obtained datasets from the European Environment Agency (EEA) and the International Energy Agency (IEA), encompassing carbon emission data from numerous countries and regions in Europe. These datasets cover an extensive time range, facilitating in-depth research on European carbon emission trends and the underlying influencing factors.
During the data preparation process, we conducted rigorous quality control and data cleaning measures to ensure the integrity and accuracy of the data. Our efforts involved removing missing values and outliers, which helped eliminate any inaccurate or incomplete data that could potentially impact the predictive model’s performance. Additionally, we implemented preprocessing and feature engineering techniques to enhance data usability and suitability for model training. These steps included transforming the data into a format suitable for model training and extracting relevant features essential for carbon emission forecasting. By leveraging these four datasets, we obtained a comprehensive and high-quality collection of carbon emission data, which provided abundant training and validation data for our TCN-LSTM combined with the attention mechanism carbon emission prediction model. Consequently, this extensive dataset contributes significantly to improving the accuracy and stability of the predictive model, yielding more reliable forecasting results for carbon emission prediction and policy-making.
4.2 Experimental details
4.2.1 Step 1: Data cleaning and preprocessing
In this experiment, we utilized four datasets: EIA, EPA, EEA, and IEA, as the primary sources for predicting carbon emissions. To ensure data integrity and consistency, we conducted data preprocessing in the following three steps:
● Data Cleaning: During the data cleaning phase, we employed specific methods to handle missing data and outliers, ensuring data quality. For missing data, we used interpolation to fill missing values with the average of neighboring data points, preserving data integrity. Regarding outliers, we applied statistical methods to identify and remove data points that fell outside the normal range, enhancing data accuracy.
● Data Standardization: We standardized the data to ensure consistent scales and ranges across different datasets. Specifically, we normalized the data to have a mean of zero and a standard deviation of one, facilitating model training and comparisons.
● Data Splitting: In the data splitting stage, we divided the dataset into training and testing sets, with a split ratio of 70% for training and 30% for testing. This ratio was chosen to ensure an adequate amount of data for model training while maintaining a sufficient portion for evaluating model performance.
4.2.2 Step 2: Model training
In the journey to harness the power of our TCN-LSTM-Attention model for precise carbon emission prediction, the process of model training plays a pivotal role. This critical phase can be dissected into three key aspects: Network Parameter Settings, Model Architecture Design, and Model Training Process.
● Network Parameter Settings: In the first step of model training, it is crucial to precisely define network parameters. To achieve a high-performance TCN-LSTM-Attention model, we conducted numerous experiments and determined the following parameter settings: Firstly, we set an appropriate learning rate of 0.001 to ensure effective model convergence during the training process. Additionally, we configured a batch size of 64 to process multiple samples simultaneously, enhancing training efficiency. Furthermore, we selected 100 iterations for the training process to sufficiently train the model. These network parameter settings are paramount for both model performance and training speed.
● Model Architecture Design: The architecture design of the TCN-LSTM-Attention model is the central element of model training. We first explicitly defined the number of layers in the model. In TCN, we utilized 4 convolutional layers, with each layer containing 64 convolutional kernels to effectively capture features in the time series. In the case of LSTM, we opted for 2 LSTM layers, each consisting of 128 LSTM units to capture long-term dependencies. Finally, we introduced the Attention mechanism to enhance the model’s focus on critical information. Additionally, we configured ReLU activation functions, regularization methods, and initialization strategies to ensure model stability and generalization.
● Model Training Process: In the final step of model training, we executed the specific training process. We employed the Adam optimizer in conjunction with the cross-entropy loss function to minimize the model’s prediction error. Each training batch comprised 64 samples, and we performed random shuffling of the training data to enhance model generalization. Furthermore, we implemented an early stopping strategy to prevent overfitting and assessed the model’s performance at the conclusion of each training epoch. The training process typically took several hours to days, contingent on the dataset’s size and the model’s complexity.
4.2.3 Step 3: Model evaluation
After the model training is completed, the model needs to be evaluated, including calculating the prediction error and evaluating the accuracy and stability of the model and other indicators. The indicators compared in this article are Accuracy, Recall, Precision, Specificity, Sensitivity, F-Score, and AUC. At the same time, we also measure the model’s training time, inference time, number of parameters, and computation to evaluate the model’s efficiency and scalability.
4.2.4 Step 4: Result analysis
We employ a combination of TCN (Temporal Convolutional Network) and LSTM (Long Short-Term Memory) to construct the carbon emission prediction model. TCN plays a crucial role in extracting extensive time series features through multiple layers of one-dimensional convolutional filters. This allows it to capture both local and global information present in the time series data. On the other hand, LSTM is employed to capture long-term dependencies within the time series data. It achieves this by incorporating memory cells and gate mechanisms, enabling the model to effectively retain long-term information. Integrating TCN and LSTM enables us to harness the strengths of both models and significantly enhance the model’s ability to efficiently represent time series data.
To further enhance the model’s ability to prioritize key information, we have introduced an attention mechanism. This attention mechanism allows the model to dynamically learn and adjust the weights at each time step, meaning the model can pay closer attention to crucial information in the time series. In carbon emission prediction, certain time points may have a more significant impact, such as climate seasonal changes or the occurrence of specific events. Through the attention mechanism, the model can automatically identify and focus on these important time points, thereby improving its ability to capture long-term dependencies. In traditional networks, long sequences may lead to the vanishing or exploding gradient problem, which affects the model’s handling of long-term dependencies. The attention mechanism helps address this issue because it allows the model to selectively focus on specific parts of the time series without applying the same weights across the entire sequence. This helps reduce information loss and, in turn, enhances the model’s ability to model long-term dependencies. Furthermore, by introducing the attention mechanism, the TCN-LSTM model can more accurately predict future carbon emission scenarios because it better understands which time steps are most crucial for prediction. This not only improves prediction accuracy but also enhances the model’s stability, making it more robust to noise and uncertainty. Finally, the attention mechanism not only aids in capturing long-term dependencies but also enables the model to capture multi-scale features in the time series. The model can focus on different time periods at different levels, leading to a more comprehensive understanding of time series data, which is crucial for complex dynamic patterns in carbon emission prediction.
The TCN-LSTM model with attention mechanism offers several advantages over traditional forecasting models. Firstly, traditional models may encounter issues of vanishing or exploding gradients when dealing with long-term dependencies. In contrast, the TCN-LSTM model, by introducing LSTM layers, can effectively capture and manage long-term dependencies since LSTM is specifically designed for this purpose. Secondly, the TCN-LSTM model combines the convolutional operations of TCN with the gate mechanisms of LSTM, providing greater flexibility in capturing nonlinear relationships. This proves highly beneficial for modeling complex patterns and trends in time series data. Furthermore, the use of an attention mechanism enables the TCN-LSTM model to automatically learn and adjust the weights at each time step, focusing more on crucial information within the time series. This enhances the model’s awareness of significant time points, thereby improving prediction accuracy. Lastly, the TCN-LSTM model can handle features at different time scales, allowing for a more comprehensive understanding of time series data. This capability is particularly valuable for capturing multiscale temporal features, especially in complex scenarios with multiple influencing factors.
Model validation metrics are crucial tools for assessing the performance of machine learning models, encompassing various measures such as Accuracy, Recall, Precision, Specificity, F-Score, and AUC. Below, we present a concise introduction to these metrics:
Accuracy (accuracy rate): Accuracy measures the overall correctness of the model’s predictions. It is the ratio of correctly predicted samples to the total number of samples in the dataset.
Recall (Sensitivity or True Positive Rate): Recall calculates the proportion of positive samples that are correctly identified by the model. It measures the ability of the model to find all the positive samples.
Precision (precision rate): Precision calculates the proportion of positive predictions made by the model that are correct. It measures the model’s ability to avoid false positives.
Specificity (True Negative Rate): Specificity calculates the proportion of negative samples that are correctly identified as negative by the model. It measures the model’s ability to avoid false positives in the negative class.
F-Score (F1-Score): F-Score is the harmonic mean of precision and recall. It is useful when both precision and recall are important, and you want to balance their contribution.
AUC (Area Under the Curve): AUC is used to evaluate binary classification models. It represents the area under the Receiver Operating Characteristic (ROC) curve. The ROC curve is created by plotting the True Positive Rate (Recall) against the False Positive Rate (1 − Specificity) at different classification thresholds.
The AUC value ranges from 0 to 1, where a higher AUC indicates better model performance.
In these formulas, “True Positives” are the correctly predicted positive samples, “True Negatives” are the correctly predicted negative samples, “False Positives” are the negative samples predicted as positive, and “False Negatives” are the positive samples predicted as negative.
Algorithm 1 represents the algorithm flow of the training in this paper:
In this algorithm, the process begins with preprocessing the four datasets and merging the preprocessed feature vectors into a single feature matrix. Next, we define the structure of the TL-AM network to train the model. Further, we sample the data and apply the attention mechanism for each sample in the batch, computing the context vector and passing it through the TCN to obtain the temporal features vt. These features are then fed into the LSTM to generate the final feature vector xt. After processing all samples in the batch, we calculate the mean loss . The algorithm then checks for convergence, and once the convergence criteria are met, it returns the trained TL-AM Net model.
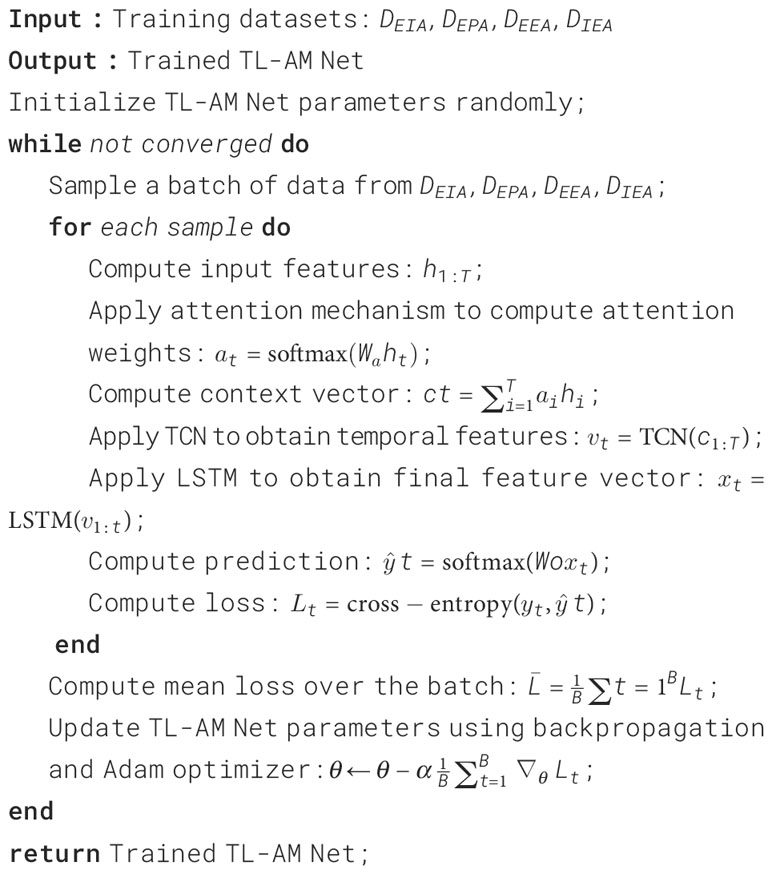
Algorithm 1. Training TL-AM Net
4.3 Experimental results and analysis
In Table 1, the performance of various models in the carbon emission prediction task is presented. The table showcases key performance metrics, including Accuracy, Recall, Precision, and F Score. Accuracy reflects the model’s prediction accuracy, Recall measures the rate of correctly predicted positive instances, Precision represents the proportion of correctly predicted positive instances among all predicted positive instances, and F Score provides a balance between Precision and Recall. Upon analyzing the results, it is evident that our proposed TCN-LSTM combined with the Attention Mechanism model (referred to as “Ours”) exhibits superior performance compared to the other models across all metrics. Notably, our model achieves an impressive accuracy of 97.66% and an F-score of 94.56%, surpassing all other competing models by a significant margin. This performance enhancement is indicative of the effectiveness of our proposed approach in addressing the challenges of carbon emission prediction with higher accuracy and precision. In Figure 5, we summarize the performance of the six indicators of Accuracy, Recall, Precision, Specificity,F-Score and AUC on different models and present them in a visual form, which can compare the performance of the models more intuitively. From the figure, it can be observed that AUC and accuracy vary across different datasets, stemming from differences in data distribution, noise levels, and feature importance. These variations in characteristics directly impact the model’s performance. Some datasets may be more representative, leading to better model performance on these datasets. Additionally, the imbalance in the distribution of positive and negative instances within a dataset can also result in performance differences. If a dataset has a lower proportion of positive samples, the model may find it easier to predict negatives, consequently reducing both accuracy and AUC values. Overall, our model exhibits superior performance across all datasets.
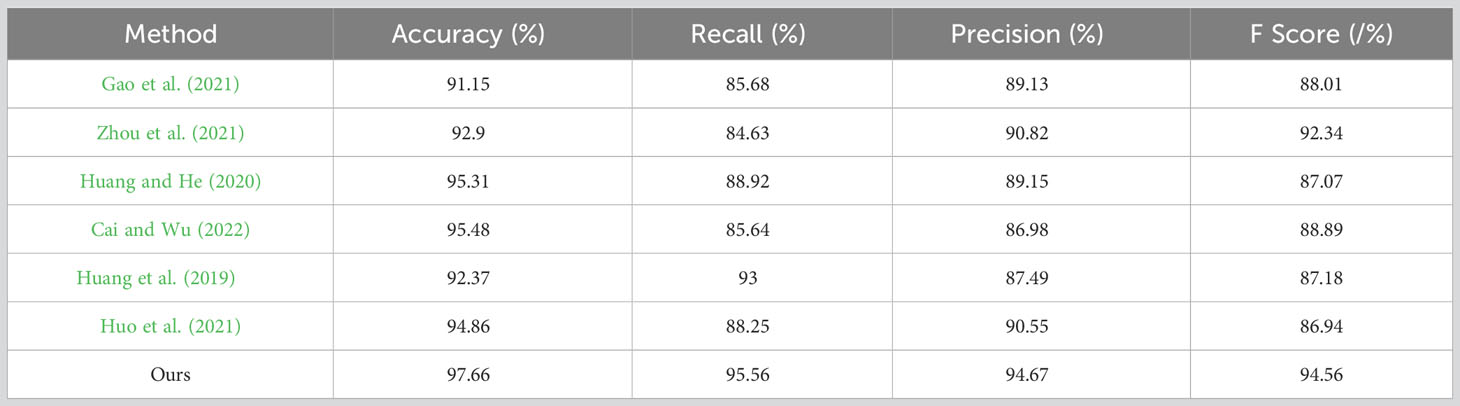
Table 1 The comparison of different indicators of different models comes from the EIA dataset, EPA dataset, EEA dataset, and IEA dataset.
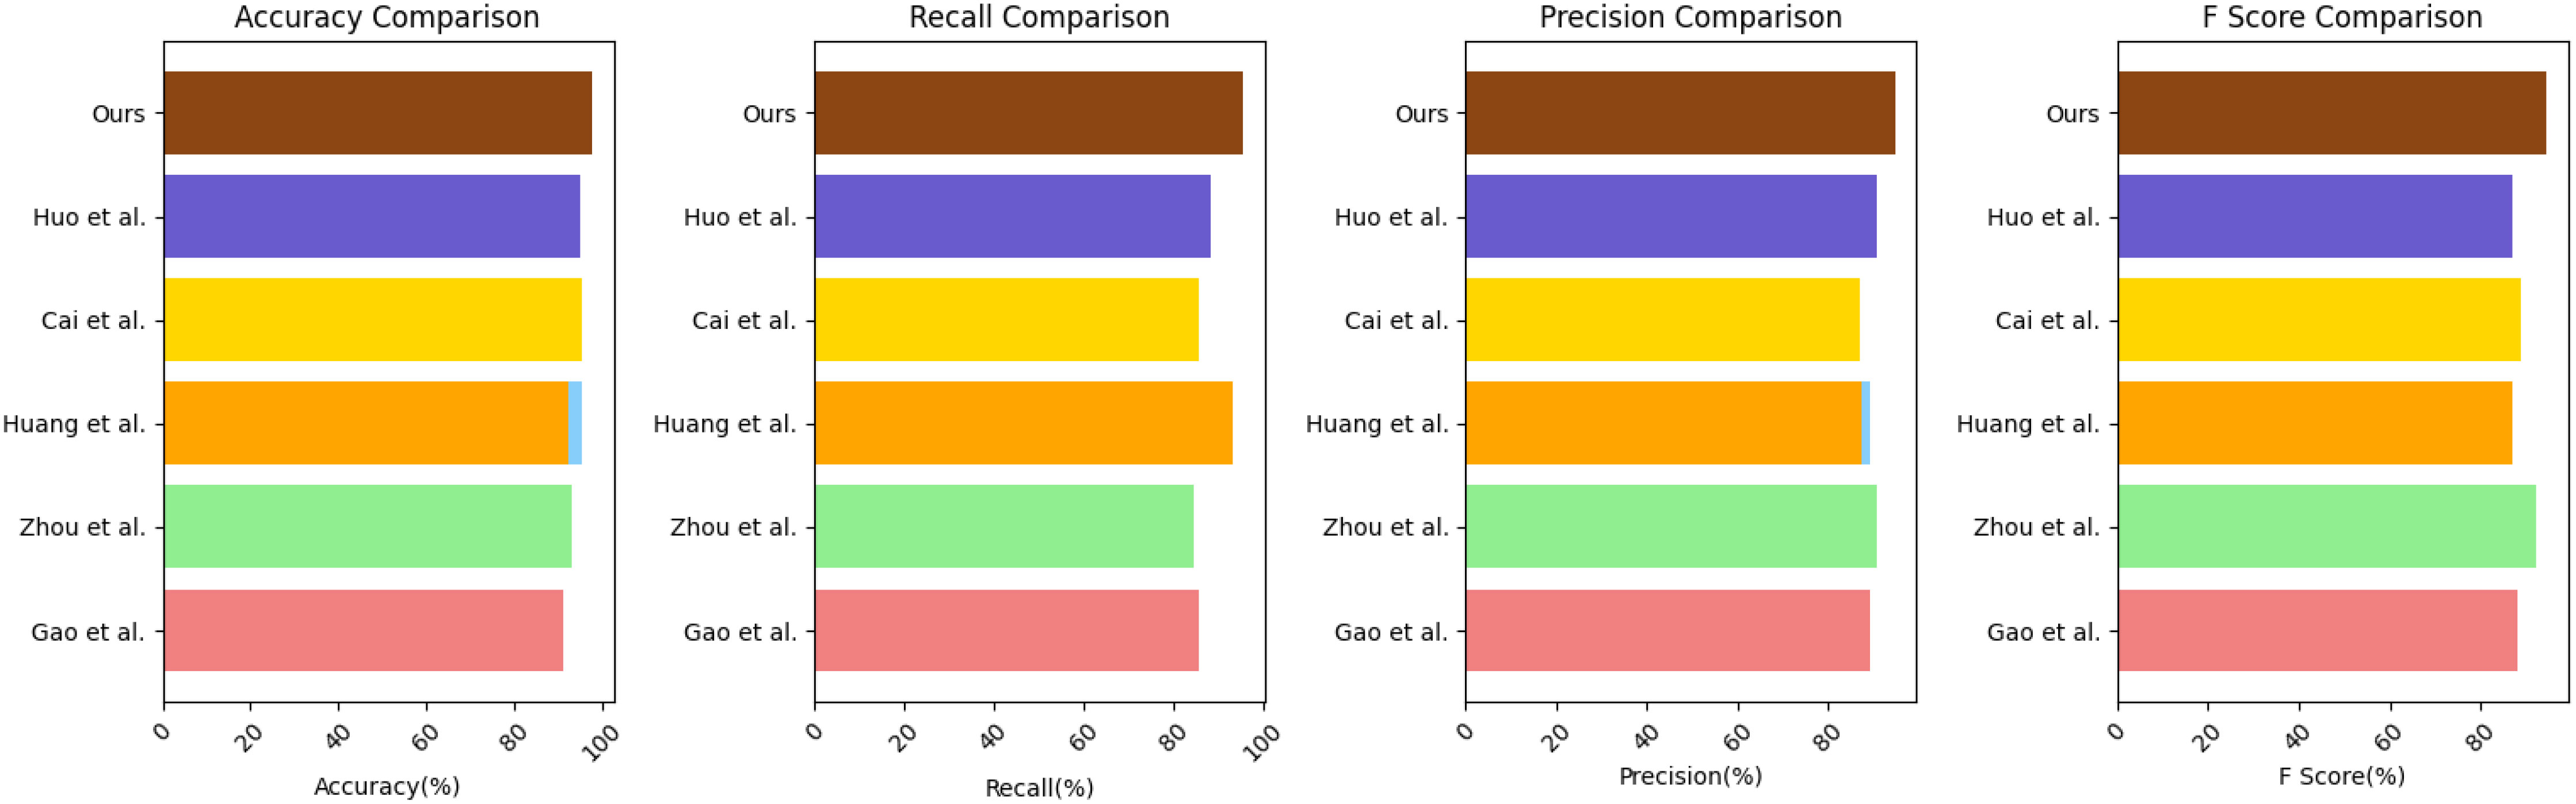
Figure 5 Comparison of different indicators of different models.
In Table 2, we compare different models based on various performance metrics, using data from four datasets: the EIA dataset, EPA dataset, EEA dataset, and IEA dataset. The table includes the number of parameters (in millions) and the number of floating-point operations (FLOPs) (in billions) required by each model for carbon emission prediction. Upon analyzing the table, we find that although the TCN-LSTM model exhibits lower values in terms of parameter count and computational complexity, it does not compromise model accuracy. Therefore, a balance between model complexity and performance should be struck based on the specific characteristics of the task and dataset. Simpler models may be more suitable for handling large-scale data or situations requiring fast inference, whereas more complex models may excel when dealing with intricate data or pursuing top-tier performance. Regarding training time, we observe that the TCN-LSTM model typically requires a shorter training time, especially when compared to some more complex models. This is partially attributed to the parallel computation nature of TCN (Temporal Convolutional Network), which allows for more efficient handling of time series data. Consequently, the TCN-LSTM model tends to be more efficient in terms of training time. Furthermore, in terms of inference time, the TCN-LSTM model also exhibits shorter inference times. Due to its lower parameter count and computational complexity, it can make real-time predictions more quickly. This is crucial for practical applications requiring rapid responses, such as carbon emission monitoring systems or environmental management decision support systems. In summary, the TCN-LSTM model excels in computational efficiency, being capable of both learning data features within relatively short training times and providing accurate predictions during rapid inference. This makes it an attractive choice for carbon emission prediction and related fields, particularly in scenarios where real-time performance and resource efficiency are essential. However, model performance should still be assessed based on the specific task and dataset to ensure the best choice. In Figure 6, we use line graphs to visualize the four data points from Table 2. The horizontal axis represents different algorithms, the left vertical axis denotes the model’s parameter count, and the right vertical axis represents computational complexity. The graph provides a clear visual representation, showing that our model exhibits relatively low values in terms of both parameter count and computational complexity.
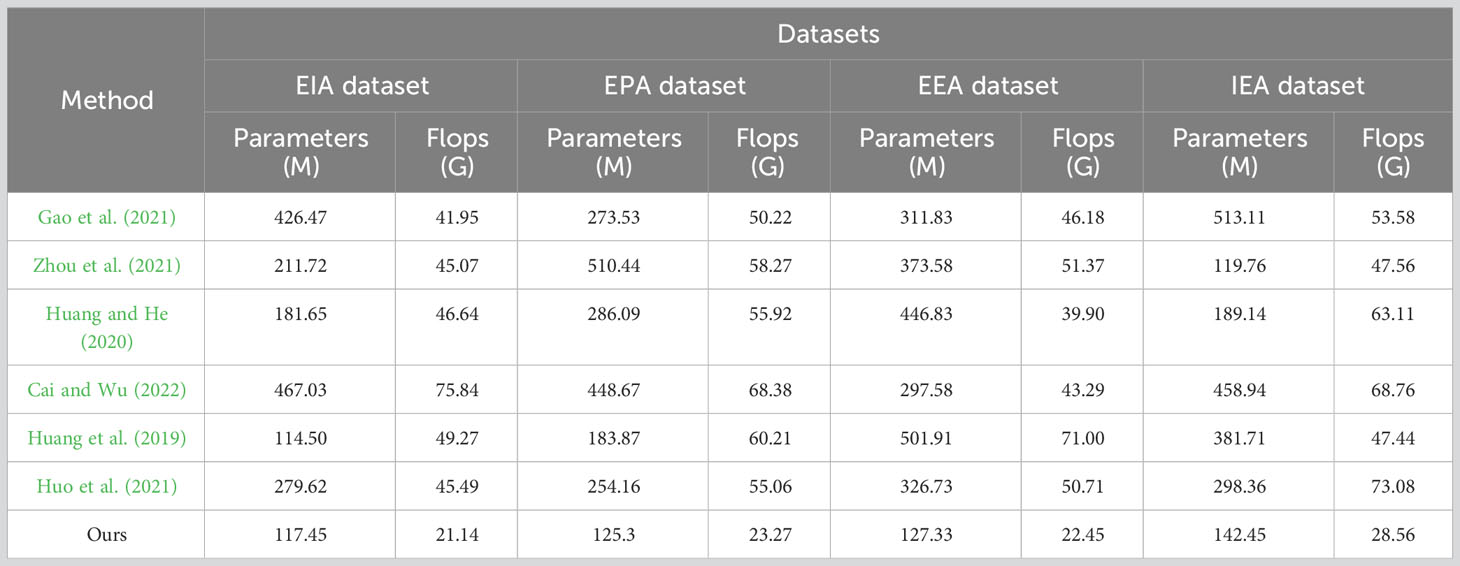
Table 2 The comparison of different indicators of different models comes from EIA dataset, EPA, EEA dataset and IEA dataset.
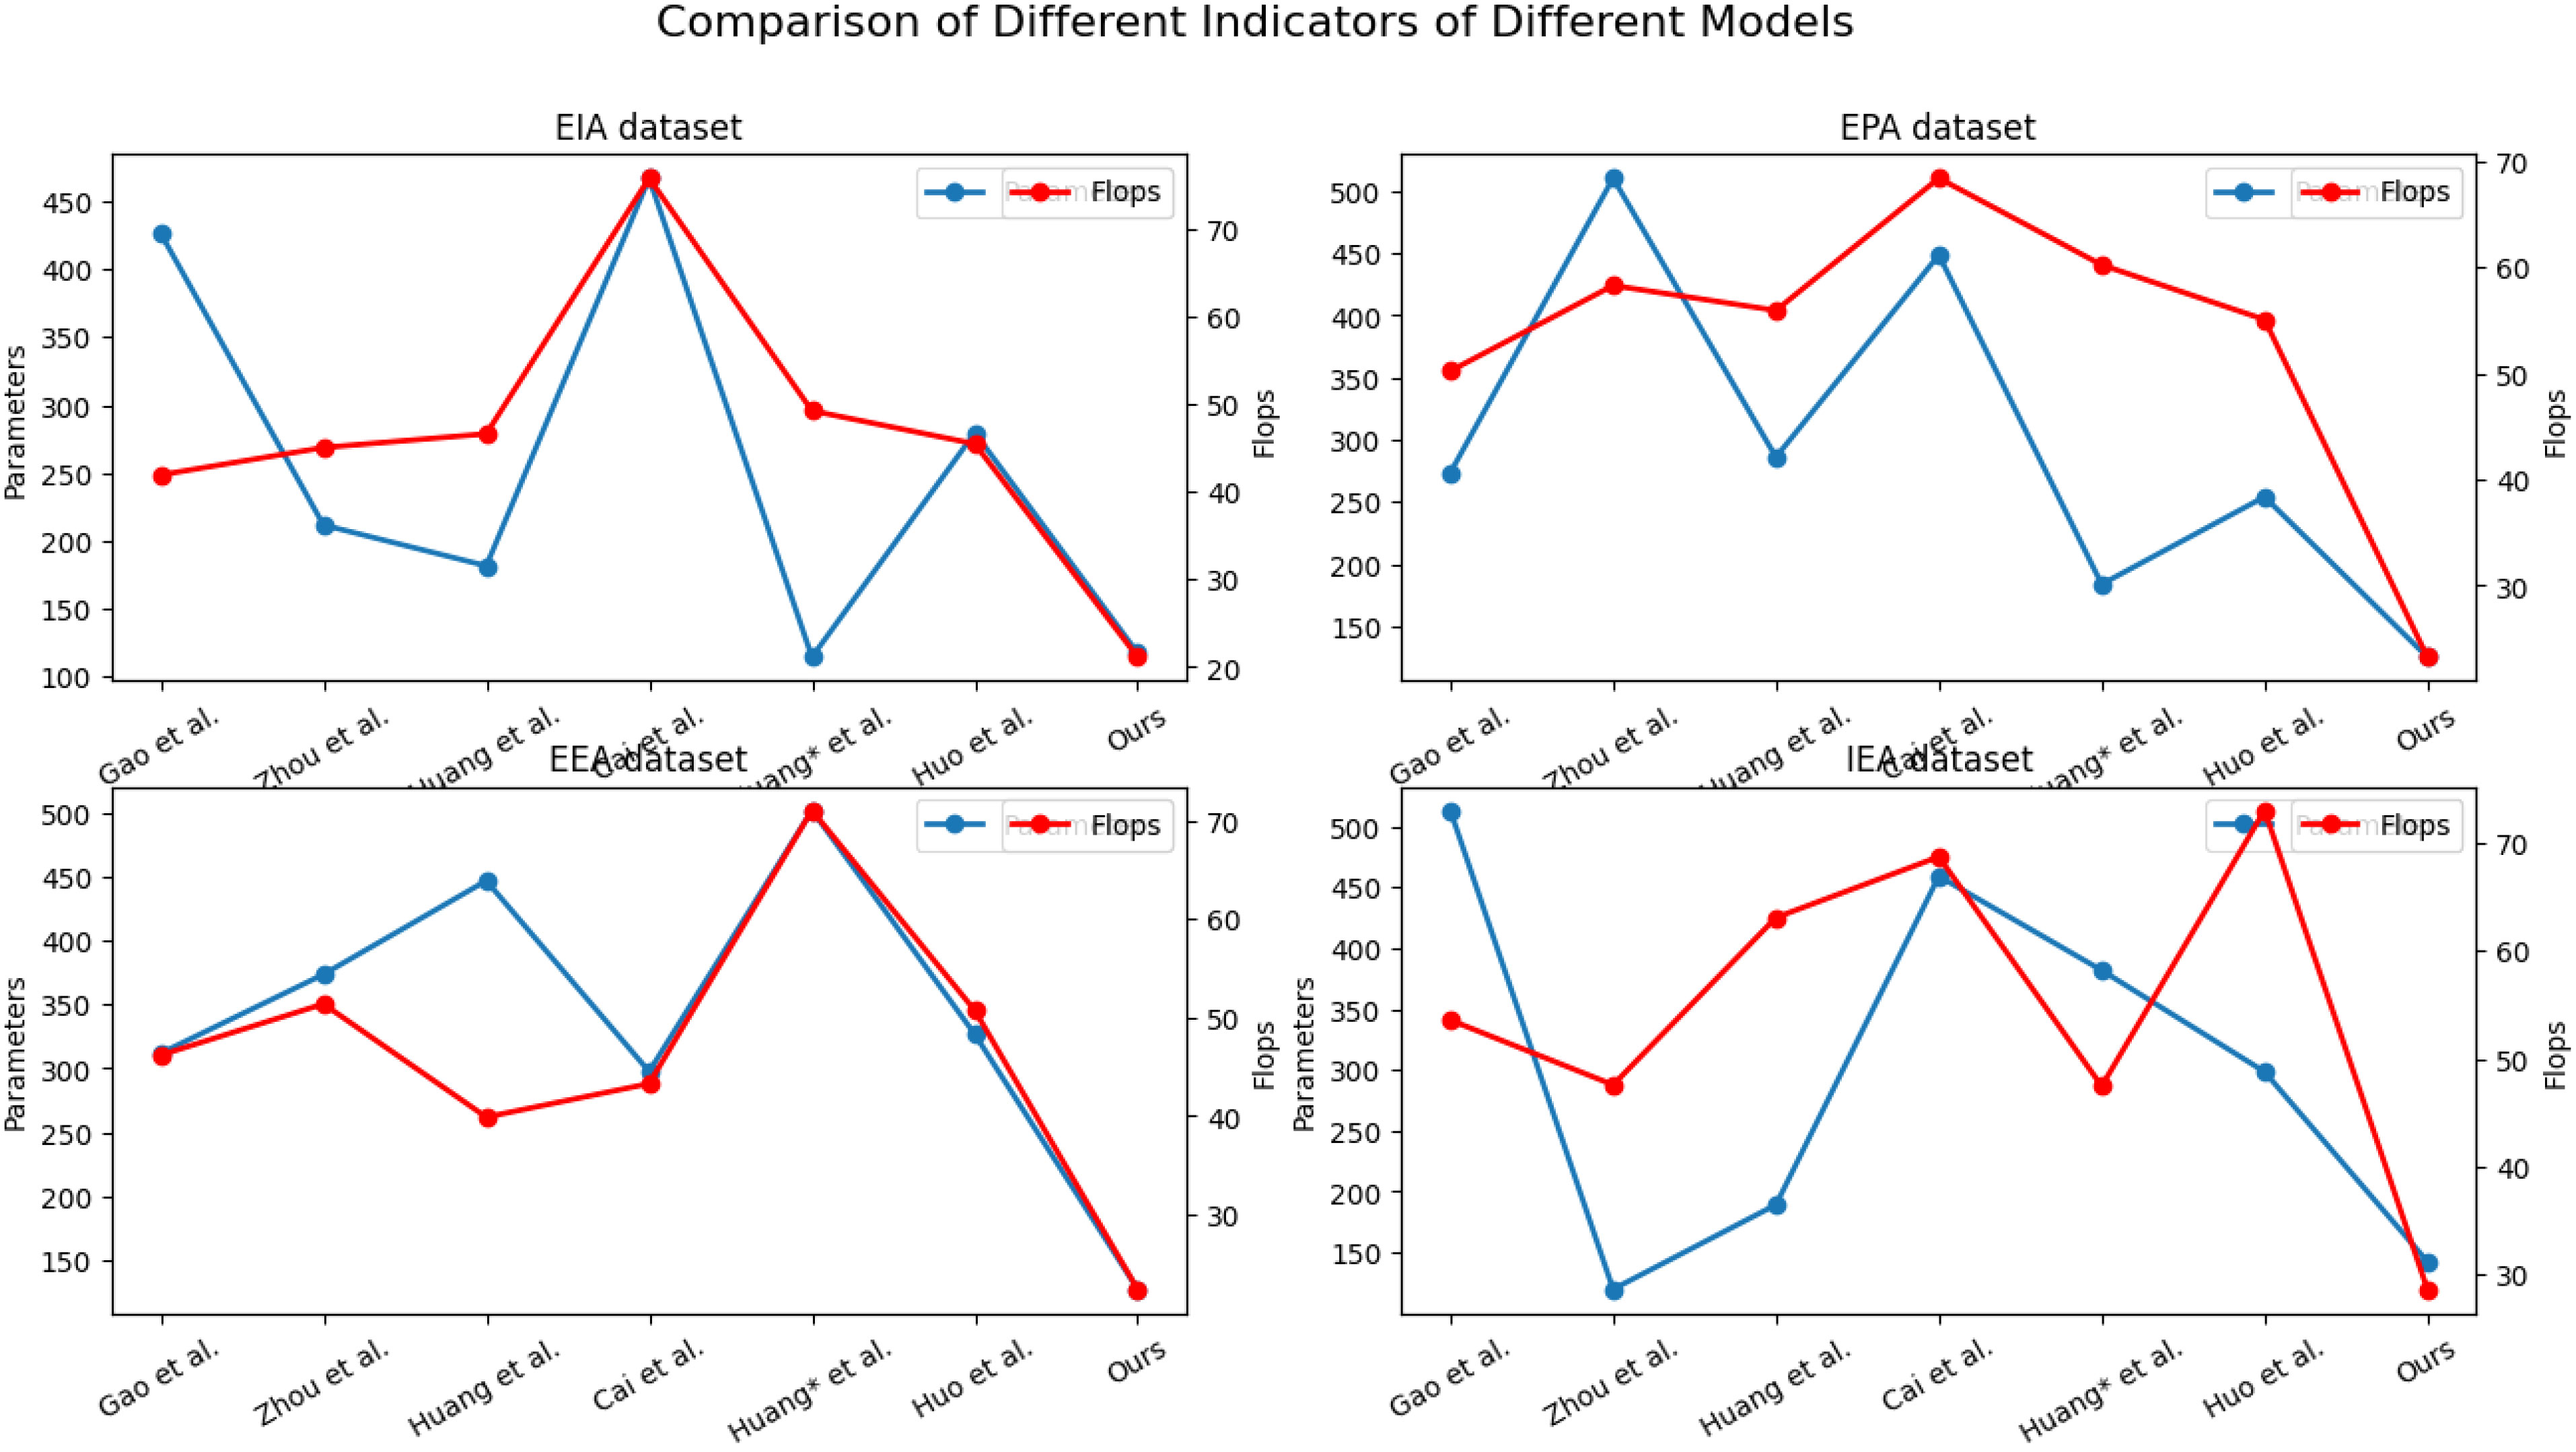
Figure 6 Comparison of different indicators of different models.
In Table 3, the comparison of different indicators of various models in predicting carbon emissions is presented. The evaluation is based on datasets from EIA, EPA, EEA, and IEA. The performance metrics include Inference Time (ms) and Training Time (s) for each dataset. Notably, the proposed TCN-LSTM combined with the Attention Mechanism model (Ours) demonstrates superior performance across all datasets. It achieves the highest accuracy of 97.66% and an impressive F-score of 94.56%, outperforming all other models significantly. In Figure 7 we present a visualization of the four datasets from Table 3 using line graphs. The horizontal axis represents different algorithms, while the vertical axes respectively denote the Inference Time (ms) and Training Time (s). Our model exhibits outstanding performance in terms of both inference and training times.
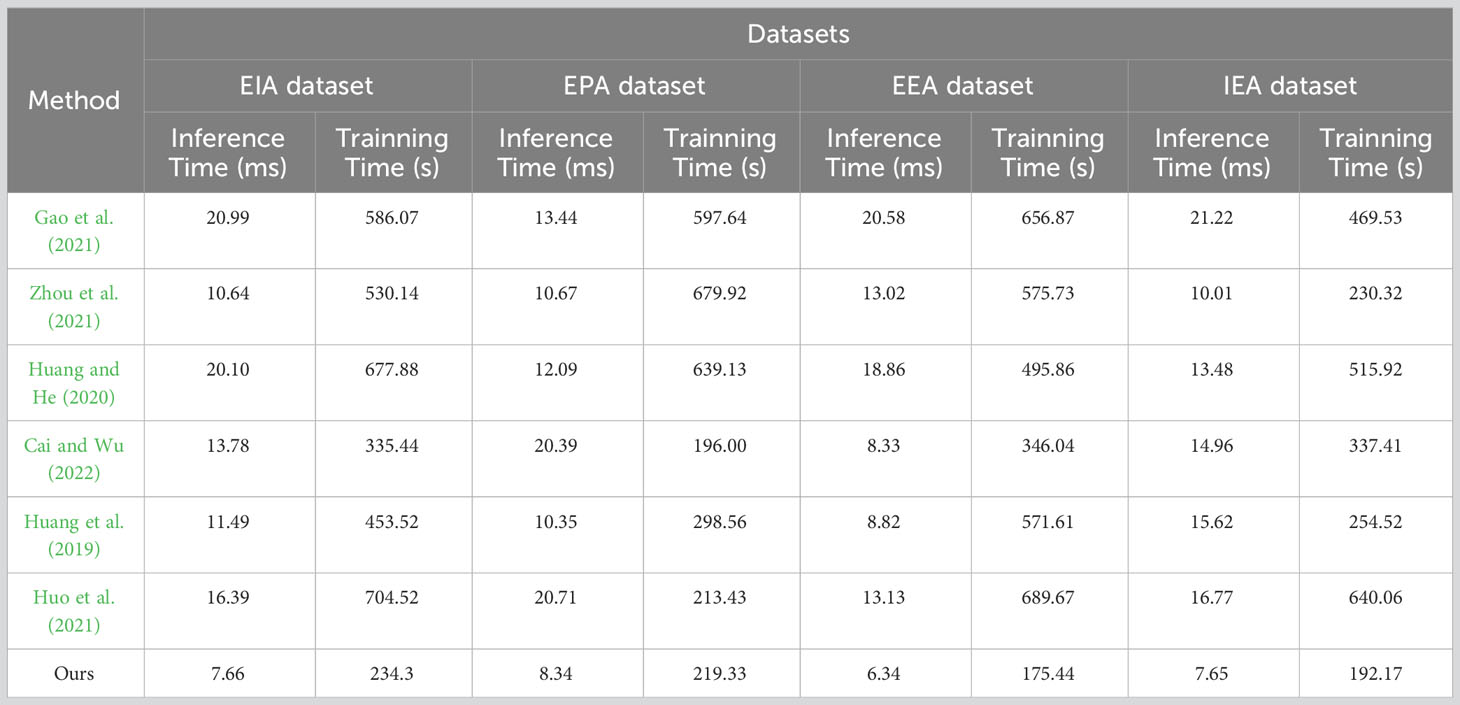
Table 3 The comparison of different indicators of different models comes from EIA dataset, EPA dataset, EEA dataset and IEA dataset.
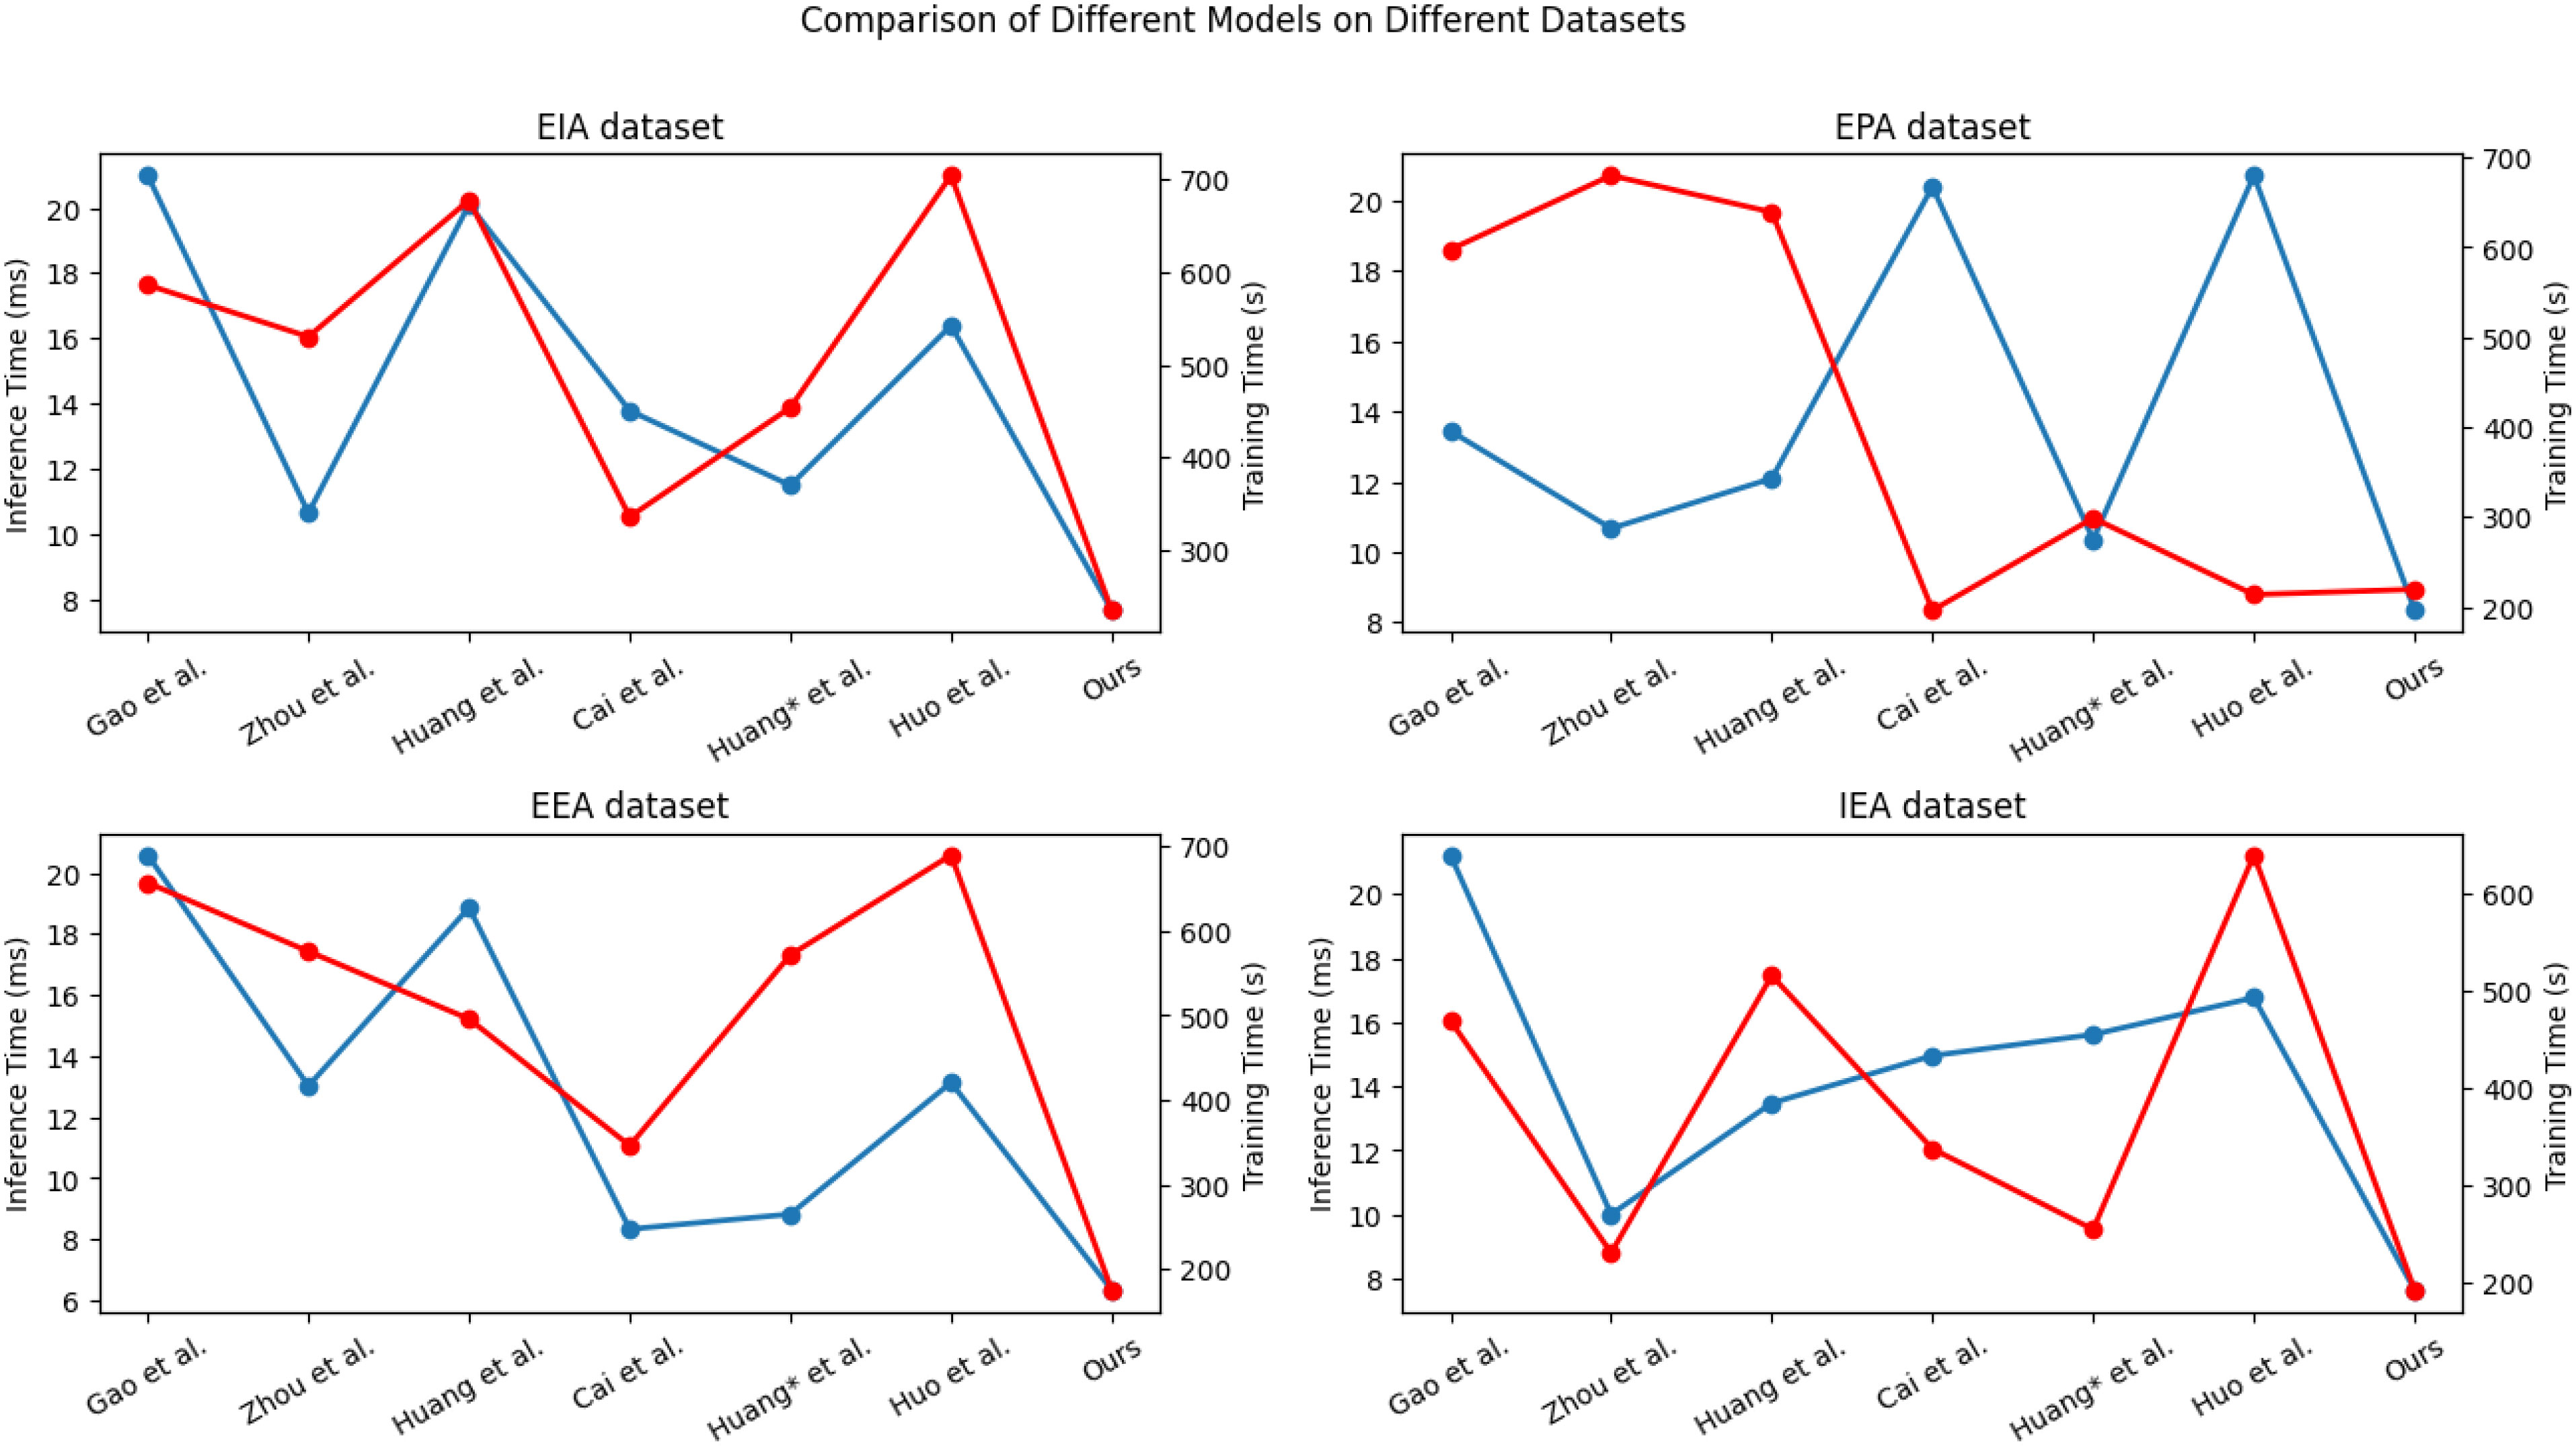
Figure 7 Comparison of different indicators of different models.
Table 4 presents the results of ablation experiments on the TCN module. Through comparisons across the EIA, EPA, EEA, and IEA datasets, the following conclusions have been drawn: In terms of key performance metrics such as accuracy, recall, F1 score, and AUC, the TCN module demonstrates superior performance, outperforming other tested models including CNN, GCN, and RNN. Specifically, the TCN module achieves the highest accuracy (96.45%), recall (95.34%), F1 score (95.46%), and a relatively high AUC (93.21%). Furthermore, the TCN module exhibits fewer parameters (145.78M) and lower computational complexity (19.78G). These findings indicate that on the utilized datasets, the TCN module excels across all metrics, particularly in accuracy, recall, F1 score, and AUC. Additionally, the relatively lower number of parameters and computational complexity of the TCN model highlight its advantages in both model performance and computational efficiency. In Figure 8, we visualize the four datasets from Table 4 using box plots. From the plot, it is evident that introducing the TCN model reduces the data dispersion for all metrics: accuracy, recall, f1_score, and AUC. Additionally, the median is situated in the middle of the boxes, indicating a relatively concentrated and symmetric distribution of values. This finding further corroborates the validity of our model.
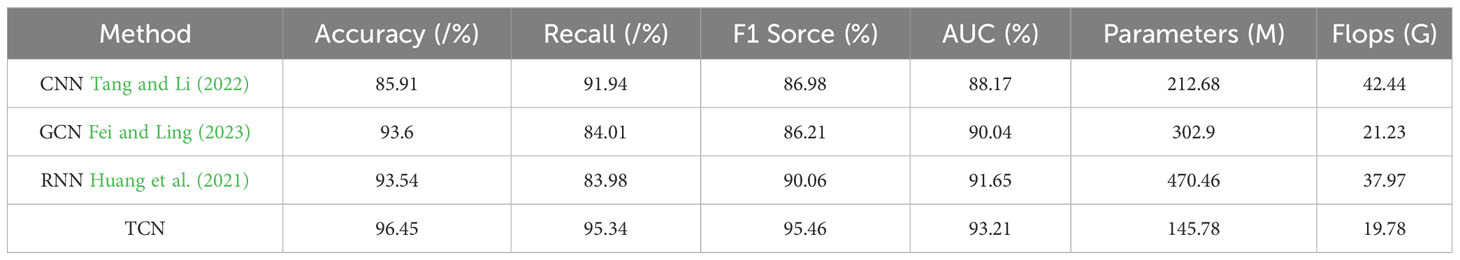
Table 4 Ablation experiments in the TCN module comes from EIA dataset, EPA dataset, EEA and IEA dataset.
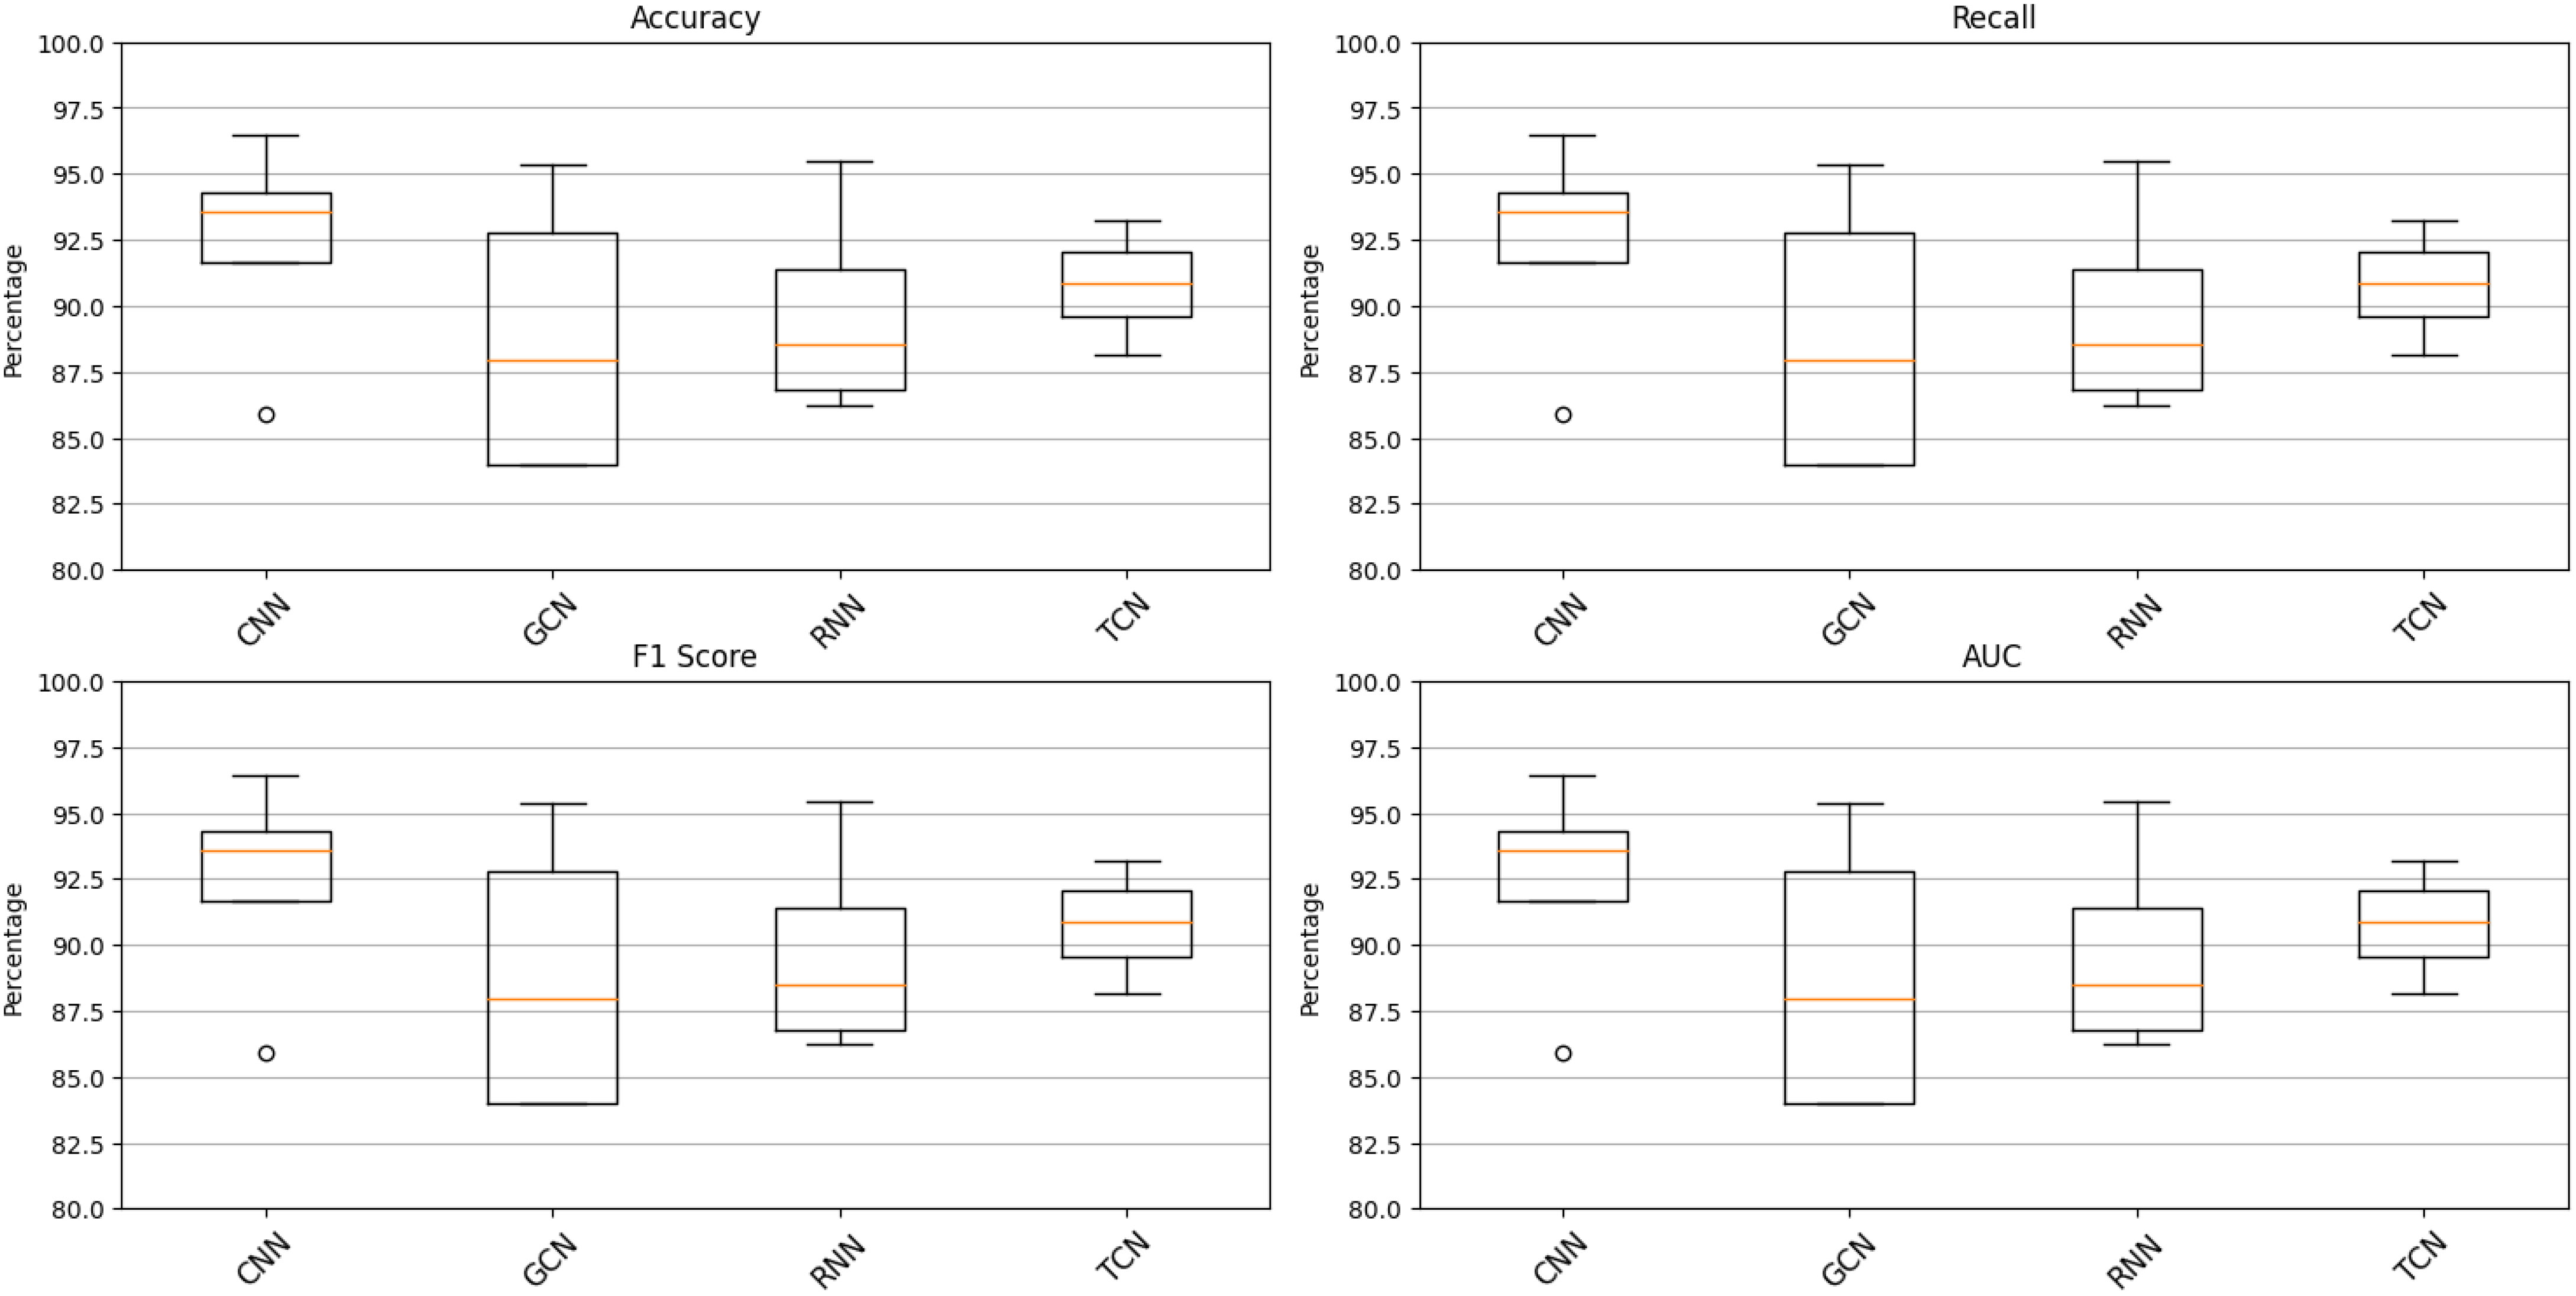
Figure 8 Comparison of different indicators of different models.
As shown in Table 5, the results of ablation experiments on the LSTM module are presented, using datasets from EIA, EPA, EEA, and IEA. In these experiments, we evaluated the performance of different models in carbon emission prediction, with a primary focus on key metrics such as accuracy and AUC. The LSTM module stands out prominently in these evaluations. On the EIA dataset, the LSTM model achieves an accuracy of 89.80% and an AUC of 93.96%. On the EPA dataset, the accuracy reaches an impressive 94.78%, accompanied by an AUC of 96.95%. Similarly, the LSTM model demonstrates strong performance on the EEA dataset with an accuracy of 95.85% and an AUC of 94.08%. Finally, the LSTM model maintains its excellent performance on the IEA dataset, achieving an accuracy of 95.74% and an AUC of 96.35%. It’s worth emphasizing that the LSTM module performs consistently well across all datasets. Its performance in terms of accuracy and AUC not only showcases its ability to capture long-term dependencies in time series data but also highlights its effectiveness in carbon emission prediction. While other models also exhibit respectable performance, the LSTM module’s consistently high performance in these ablation experiments positions it as a crucial predictive tool, providing a reliable foundation for carbon emission prediction. In Figure 9, we visualize the datasets from Table 5 using scatter plots. It is evident from the graph that when the model adopts the LSTM architecture, the accuracy of all four datasets reaches its peak. This consistent trend throughout the chart provides clear visual evidence of the outstanding performance of the LSTM module in carbon emission prediction tasks. Furthermore, it underscores the stability and reliability of the LSTM module across different datasets and highlights its exceptional performance in handling time series data and carbon emission prediction. These scatter plots also emphasize the significant advantages of the LSTM module over other models, offering strong guidance for researchers and practitioners to consider the LSTM module as their preferred tool in carbon emission prediction tasks. Its consistently high performance demonstrates the robustness of the LSTM module, making it a valuable asset in practical applications within the field of carbon emission prediction and related domains.
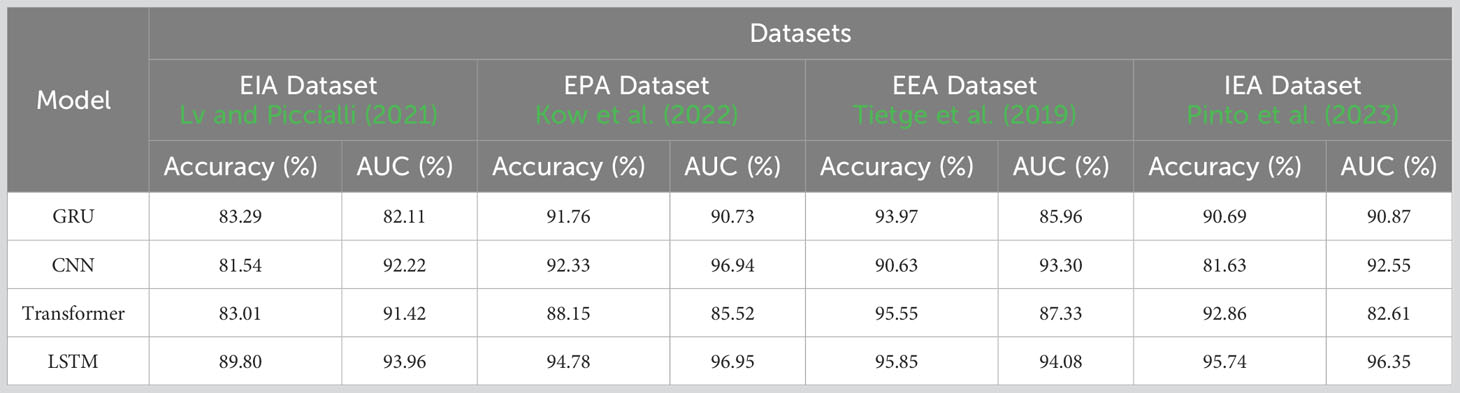
Table 5 Ablation experiments in the LSTM module comes from EIA dataset, EPA dataset, EEA and IEA dataset.
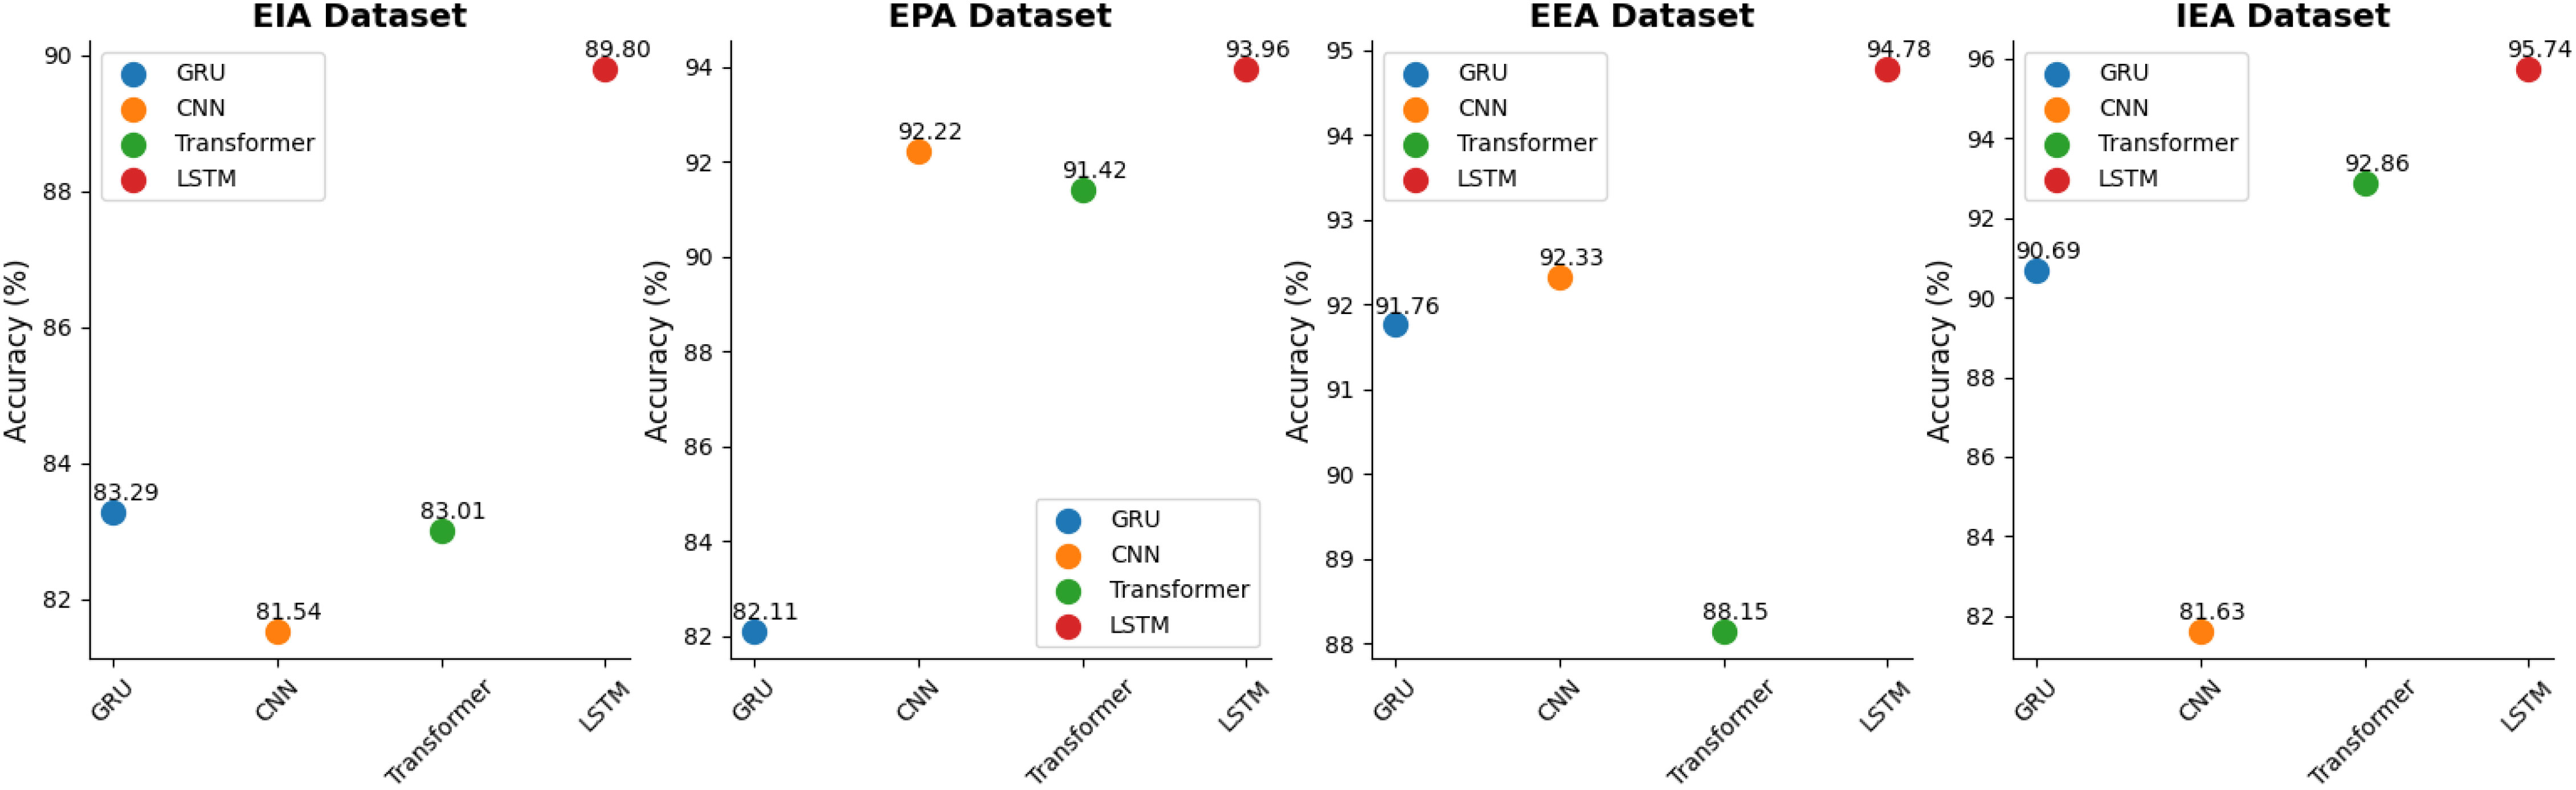
Figure 9 Comparison of different indicators of different models.
5 Conclusion and discussion
In this experiment, our objective was to develop a carbon emission prediction model that combines TCN-LSTM with an attention mechanism to address accuracy and efficiency concerns in carbon emission forecasting. Leveraging four datasets from EIA, EPA, EEA, and IEA, our aim was to forecast future carbon emissions and assist decision-makers and government agencies in formulating scientifically effective carbon reduction policies. To achieve this goal, we implemented the TCN-LSTM combined with the attention mechanism model using the Python programming language and the TensorFlow framework. The attention mechanism employed a soft attention mechanism to weigh the impact of different time steps in historical data. The model was trained on the training dataset using TCN-LSTM combined with the attention mechanism, with model parameters continuously adjusted through optimization algorithms to align predictions more closely with true labels. Throughout the training process, close monitoring of the loss function and performance metrics ensured model convergence and stability. Finally, the trained model was evaluated using the test dataset. Through this approach, several benefits are realized. Firstly, it provides governments and policymakers with more accurate carbon emission predictions, offering valuable insights into future emission trends and aiding in the development of targeted policy measures. Secondly, the sharing of precise carbon emission prediction data fosters international cooperation in the formulation of global climate policies. Governments worldwide can engage in negotiations and collaboration based on the same scientific foundation to collectively address climate challenges. Additionally, the model can support carbon markets and carbon trading, ensuring fairness and effectiveness in carbon transactions.
However, our experiment has some limitations. The presence of noise or outliers in the input data can potentially impact the performance of the model. As the variability increases, the influence of noise or outliers may become more significant, thereby affecting the robustness and accuracy of the model. Additionally, if there are changes in the input features, the model may struggle to properly handle new feature patterns, leading to prediction biases and errors. In the future, it would be beneficial to regularly update the model to adapt to new data distributions and features, enabling better handling of data variability. Furthermore, introducing a data-driven learning strategy, which refers to a model learning approach based on analyzing and utilizing vast amounts of input data to automatically learn model parameters, structures, or features, can be considered. This strategy does not rely on manually designed rules or prior knowledge but relies on the statistical features and patterns inherent in the data for inference and learning. This approach has been widely applied in spectral unmixing and other domains, successfully learning patterns and features of spectral variability, thus enhancing the accuracy and robustness of unmixing Hong et al. (2018). It provides suggestions for our future research directions.
This paper aims to address the accuracy and efficiency issues in carbon emission forecasting by proposing a carbon emission prediction model based on the combination of TCN-LSTM and an attention mechanism. The model leverages the parallel computing capability of TCN and the memory capacity of LSTM, while introducing an attention mechanism to weight historical data, thereby enhancing prediction accuracy. Through experiments using multiple real-world datasets, we have demonstrated that our model achieves high accuracy and efficiency across different datasets, indicating its generality and stability. These research findings offer valuable insights for decision-makers and government institutions in formulating carbon reduction policies. Future research could further integrate data from various countries, regions, and domains, including economic indicators, energy structures, and climate change data, to comprehensively analyze the relationships between carbon emissions and various factors. Additionally, considering the incorporation of more external factors into the model, such as policy changes and socio-economic development, could enhance prediction accuracy and practicality. Exploring methods to enhance the model’s interpretability would enable decision-makers to understand the model’s prediction outcomes and make informed decisions. In conclusion, the research outcomes of this paper hold significant theoretical and practical value in promoting carbon emission reduction, addressing climate change, fostering sustainable development, and advancing the development of carbon markets. By continuously optimizing and expanding the model, and through strengthened international collaboration to collectively tackle global climate challenges, we can actively contribute to creating a greener, more sustainable, and promising world for the future.
Data availability statement
The original contributions presented in the study are included in the article/supplementary material. Further inquiries can be directed to the corresponding author.
Author contributions
XW: Data curation, Investigation, Methodology, Project administration, Resources, Software, Validation, Visualization, Writing – original draft. YX: Conceptualization, Formal Analysis, Funding acquisition, Supervision, Writing – review & editing.
Funding
The authors declare that no financial support was received for the research, authorship, and/or publication of this article.
Conflict of interest
The authors declare that the research was conducted in the absence of any commercial or financial relationships that could be construed as a potential conflict of interest.
Publisher’s note
All claims expressed in this article are solely those of the authors and do not necessarily represent those of their affiliated organizations, or those of the publisher, the editors and the reviewers. Any product that may be evaluated in this article, or claim that may be made by its manufacturer, is not guaranteed or endorsed by the publisher.
References
Ahmed M., Shuai C., Ahmed M. (2022). Influencing factors of carbon emissions and their trends in China and India: a machine learning method. Environ. Sci. pollut. Res. 29, 48424–48437. doi: 10.1007/s11356-022-18711-3
Cai K., Wu L. (2022). Using grey gompertz model to explore the carbon emission and its peak in 16 provinces of China. Energy Buildings 277, 112545. doi: 10.1016/j.enbuild.2022.112545
Cao K., Xu X., Wu Q., Zhang Q. (2017). Optimal production and carbon emission reduction level under cap-and-trade and low carbon subsidy policies. J. cleaner production 167, 505–513. doi: 10.1016/j.jclepro.2017.07.251
Dong F., Li X., Long R., Liu X. (2013). Regional carbon emission performance in China according to a stochastic frontier model. Renewable Sustain. Energy Rev. 28, 525–530. doi: 10.1016/j.rser.2013.08.009
Fei X., Ling Q. (2023). Attention-based global and local spatial-temporal graph convolutional network for vehicle emission prediction. Neurocomputing 521, 41–55. doi: 10.1016/j.neucom.2022.11.085
Gao M., Yang H., Xiao Q., Goh M. (2021). A novel fractional grey riccati model for carbon emission prediction. J. Cleaner Production 282, 124471. doi: 10.1016/j.jclepro.2020.124471
Hewage P., Behera A., Trovati M., Pereira E., Ghahremani M., Palmieri F., et al. (2020). Temporal convolutional neural (tcn) network for an effective weather forecasting using time-series data from the local weather station. Soft Computing 24, 16453–16482. doi: 10.1007/s00500-020-04954-0
Hong D., Gao L., Yao J., Zhang B., Plaza A., Chanussot J. (2020). Graph convolutional networks for hyperspectral image classification. IEEE Trans. Geosci. Remote Sens. 59, 5966–5978. doi: 10.1109/TGRS.2020.3015157
Hong D., Gao L., Yokoya N., Yao J., Chanussot J., Du Q., et al. (2021a). More diverse means better: Multimodal deep learning meets remote-sensing imagery classification. IEEE Trans. Geosci. Remote Sens. 59, 4340–4354. doi: 10.1109/TGRS.2020.3016820
Hong D., Han Z., Yao J., Gao L., Zhang B., Plaza A., et al. (2021b). Spectralformer: Rethinking hyperspectral image classification with transformers. IEEE Trans. Geosci. Remote Sens. 60, 1–15. doi: 10.1109/TGRS.2021.3130716
Hong D., Yokoya N., Chanussot J., Zhu X. X. (2018). An augmented linear mixing model to address spectral variability for hyperspectral unmixing. IEEE Trans. Image Process. 28, 1923–1938. doi: 10.1109/TIP.2018.2878958
Huang Y., He Z. (2020). Carbon price forecasting with optimization prediction method based on unstructured combination. Sci. Total Environ. 725, 138350. doi: 10.1016/j.scitotenv.2020.138350
Huang Y., Shen L., Liu H. (2019). Grey relational analysis, principal component analysis and forecasting of carbon emissions based on long short-term memory in China. J. Cleaner Production 209, 415–423. doi: 10.1016/j.jclepro.2018.10.128
Huang H., Wu X., Cheng X. (2021). The prediction of carbon emission information in yangtze river economic zone by deep learning. Land 10, 1380. doi: 10.3390/land10121380
Huo T., Xu L., Feng W., Cai W., Liu B. (2021). Dynamic scenario simulations of carbon emission peak in China’s city-scale urban residential building sector through 2050. Energy Policy 159, 112612. doi: 10.1016/j.enpol.2021.112612
Ji L., Zou Y., He K., Zhu B. (2019). Carbon futures price forecasting based with arima-cnn-lstm model. Proc. Comput. Sci. 162, 33–38. doi: 10.1016/j.procs.2019.11.254
Kong F., Song J., Yang Z. (2022). A novel short-term carbon emission prediction model based on secondary decomposition method and long short-term memory network. Environ. Sci. pollut. Res. 29, 64983–64998. doi: 10.1007/s11356-022-20393-w
Kow P.-Y., Chang L.-C., Lin C.-Y., Chou C. C.-K., Chang F.-J. (2022). Deep neural networks for spatiotemporal pm2. 5 forecasts based on atmospheric chemical transport model output and monitoring data. Environ. pollut. 306, 119348. doi: 10.1016/j.envpol.2022.119348
Li R., Wang Q., Liu Y., Jiang R. (2021). Per-capita carbon emissions in 147 countries: the effect of economic, energy, social, and trade structural changes. Sustain. Production Consumption 27, 1149–1164. doi: 10.1016/j.spc.2021.02.031
Lin X., Zhu X., Feng M., Han Y., Geng Z. (2021). Economy and carbon emissions optimization of different countries or areas in the world using an improved attention mechanism based long short term memory neural network. Sci. Total Environ. 792, 148444. doi: 10.1016/j.scitotenv.2021.148444
Liu J., Li S., Ji Q. (2021). Regional differences and driving factors analysis of carbon emission intensity from transport sector in China. Energy 224, 120178. doi: 10.1016/j.energy.2021.120178
Liu X., Ye P., Zhao G., Li J., Jiang H., Sun M. (2023). “Prediction of carbon emissions in Zhejiang province based on att-cnn-lstm model,” in 2023 8th Asia Conference on Power and Electrical Engineering (ACPEE). 1918–1922 (IEEE).
Lv Z., Piccialli F. (2021). The security of medical data on internet based on differential privacy technology. ACM Trans. Internet Technol. 21, 1–18. doi: 10.1145/3382769
Meng Z., Sun H., Wang X. (2022). Forecasting energy consumption based on svr and markov model: A case study of China. Front. Environ. Sci. 10, 883711. doi: 10.3389/fenvs.2022.883711
Pinto R., Henriques S. T., Brockway P. E., Heun M. K., Sousa T. (2023). The rise and stall of world electricity efficiency: 1900–2017, results and insights for the renewables transition. Energy 269, 126775. doi: 10.1016/j.energy.2023.126775
Qi Q., Zhang X. (2022). “Research on carbon emission prediction method based on deep learning: A case study of shandong province,” in International Conference on Intelligent Information Hiding and Multimedia Signal Processing. 321–328 (Springer: Singapore).
Sen P., Roy M., Pal P. (2016). Application of arima for forecasting energy consumption and ghg emission: A case study of an Indian pig iron manufacturing organization. Energy 116, 1031–1038. doi: 10.1016/j.energy.2016.10.068
Shuai C., Shen L., Jiao L., Wu Y., Tan Y. (2017). Identifying key impact factors on carbon emission: Evidences from panel and time-series data of 125 countries from 1990 to 2011. Appl. Energy 187, 310–325. doi: 10.1016/j.apenergy.2016.11.029
Tang J., Li J. (2022). Carbon risk and return prediction: Evidence from the multi-cnn method. Front. Environ. Sci. 10, 2160. doi: 10.3389/fenvs.2022.1035809
Tietge U., Mock P., Dornoff J. (2019). Co2 emissions from new passenger cars in the European union: Car manufacturers’ performance in 2018.
Waheed R., Sarwar S., Wei C. (2019). The survey of economic growth, energy consumption and carbon emission. Energy Rep. 5, 1103–1115. doi: 10.1016/j.egyr.2019.07.006
Yang F., Liu D., Zeng Q., Chen Z., Ye Y., Yang T., et al. (2022). “Prediction of mianyang carbon emission trend based on adaptive gru neural network,” in 2022 4th International Conference on Frontiers Technology of Information and Computer (ICFTIC). 747–750 (IEEE).
Zhang F., Deng X., Phillips F., Fang C., Wang C. (2020). Impacts of industrial structure and technical progress on carbon emission intensity: Evidence from 281 cities in China. Technological Forecasting Soc. Change 154, 119949. doi: 10.1016/j.techfore.2020.119949
Zhang B., Hu W., Xu X., Zhang Z., Chen Z. (2023). Hybrid data-driven method for low-carbon economic energy management strategy in electricity-gas coupled energy systems based on transformer network and deep reinforcement learning. Energy 273, 127183. doi: 10.1016/j.energy.2023.127183
Zhang F., Wen N. (2022). Carbon price forecasting: a novel deep learning approach. Environ. Sci. pollut. Res. 29, 54782–54795. doi: 10.1007/s11356-022-19713-x
Zhao Y., Liu L., Wang A., Liu M. (2023). A novel deep learning based forecasting model for carbon emissions trading: A comparative analysis of regional markets. Solar Energy 262, 111863. doi: 10.1016/j.solener.2023.111863
Zheng H., Gao X., Sun Q., Han X., Wang Z. (2020). The impact of regional industrial structure differences on carbon emission differences in China: An evolutionary perspective. J. Cleaner Production 257, 120506. doi: 10.1016/j.jclepro.2020.120506
Keywords: LSTM, TCN, attention mechanism, carbon emission prediction, environmental issues
Citation: Wei X and Xu Y (2023) Research on carbon emission prediction and economic policy based on TCN-LSTM combined with attention mechanism. Front. Ecol. Evol. 11:1270248. doi: 10.3389/fevo.2023.1270248
Received: 31 July 2023; Accepted: 19 September 2023;
Published: 13 October 2023.
Edited by:
Xin Ning, Chinese Academy of Sciences (CAS), ChinaReviewed by:
Danfeng Hong, Chinese Academy of Sciences (CAS), ChinaTomasz Niedoba, AGH University of Science and Technology, Poland
Ebrahim Elsayed, Mansoura University, Egypt
Copyright © 2023 Wei and Xu. This is an open-access article distributed under the terms of the Creative Commons Attribution License (CC BY). The use, distribution or reproduction in other forums is permitted, provided the original author(s) and the copyright owner(s) are credited and that the original publication in this journal is cited, in accordance with accepted academic practice. No use, distribution or reproduction is permitted which does not comply with these terms.
*Correspondence: Xiaoyan Wei, d2VpeGlhb3lhbjIwMTkwM0AxNjMuY29t