 Huifang Yang*
 Xiang Zhou
- School of International Business, Hunan University of Information Technology, Changsha, China
Introduction: This article proposes a method for assessing the economic benefits of carbon-neutral digital platforms, which promote sustainable development by reducing carbon emissions through digital technology and data platforms.
Methods: The proposed method combines the GPT (Generative Pre-trained Transformer) and QRCNN (Quantile Regression Convolutional Neural Network) models. Firstly, the GPT model is utilized to extract features from platform data. Then, these features are combined with the QRCNN model for sequence modeling, enhancing prediction accuracy and generalization ability.
Results: The method's effectiveness is demonstrated through experimental verification using actual platform data. The results highlight the practical significance and application value of the proposed method in evaluating the economic benefits of carbon-neutral digital platforms.
Discussion: By leveraging digital technology and data platforms, carbon-neutral digital platforms aim to reduce carbon emissions and promote sustainable development. The proposed method provides a means to accurately predict and analyze the economic benefits associated with these platforms. The combination of the GPT and QRCNN models enhances the accuracy and generalization ability of economic benefit predictions, enabling informed decision-making and policy formulation.
1 Introduction
The concept of carbon-neutral digital platform economic benefits refers to the utilization of digital platform technology to facilitate carbon neutrality and achieve economic gains in the process (Xu et al., 2020). By providing services such as carbon emission data management, energy trading, and credit trading, digital platforms can assist companies and individuals in reducing carbon emissions, achieving neutrality goals, and obtaining economic returns (Li and Zhang, 2022). Despite the potential benefits, the information and data available on carbon-neutral digital platforms are often underutilized, leading to limited conversion of data into tangible benefits. Therefore, this paper proposes a study on the economic benefits of carbon-neutral digital platforms using the GPT-QRCNN model, aiming to enhance our understanding of the platform’s performance in generating economic gains and promoting its further development.
The GPT-QRCNN model, as a deep learning model, possesses several advantages, including strong question-answering and natural language generation capabilities, as well as the ability to learn complex language patterns. In the context of studying the economic benefits of carbon-neutral digital platforms, the GPT-QRCNN model demonstrates strong performance. It automates the acquisition and processing of carbon emission data, energy trading data, and carbon credit trading data, enabling evaluation of the economic performance of carbon-neutral digital platforms. Additionally, the model can generate personalized questions based on platform data and provide accurate answers through its question-answering capability, thereby facilitating a deeper understanding of the platform’s economic performance. Moreover, the model offers more precise and comprehensive data for stakeholders, such as governments and research institutions, to assess the economic benefits of carbon-neutral digital platforms, thereby facilitating the promotion of carbon-neutral sustainable development.
The main methods commonly used to assess the environmental performance of carbon-neutral companies are statistical models, time series models, and deep learning models.
Statistical model: A statistical model is a model built based on statistical principles and methods, usually including statistical methods such as parameter estimation, hypothesis testing, variance analysis, and regression analysis (Zhang et al., 2023). The model discovers the relationship and regularity between the data by analyzing and modeling the data, which can be applied to fields such as prediction, classification, and control.
Common statistical models include linear regression, logistic, variance analysis, and time series models. The advantages of the statistical model are obvious: it can explain the relationship and regularity between the data and has high interpretability (Torres Cabán et al., 2022). The statistical model has strong applicability, can handle various data types and problem types, and has applications in prediction, classification, control, etc. Statistical models are based on statistical principles and methods and have high reliability and accuracy. In the study of the economic benefits of carbon-neutral digital platforms, the application of statistical models also has some disadvantages: the assumptions made by the model on the data distribution may not be in line with the actual situation, which will affect the accuracy and generalization ability of the model. Statistical models are sensitive to outliers and noise data and require data cleaning and preprocessing. When the amount of data is large, the calculation of the statistical model will be larger, more complex, and take longer.
Time series model: The time series model is a modeling method based on time series data, often used to predict future trends and change the law of data. The model is usually based on historical data and models the trend, cycle, seasonality, etc., to predict future environmental data (Zou et al., 2022a).
Common time series models include the autoregressive moving average model, autoregressive integral moving average model, seasonal autoregressive integral moving average model, and seasonal autoregressive integrated moving average model. The advantages of the time series model are obvious. It can capture the trend, cycle, and seasonality of time series data and better predict the direction of future data changes. It can handle nonlinear and non-stationary time series data and has high flexibility (Xu et al., 2023), and adaptability; it can also perform long-term and short-term forecasts and is suitable for modeling and forecasting various time series data. However, there are also some disadvantages in applying time-series models in the study of the economic benefits of carbon-neutral digital platforms: time-series models usually assume that future trends and patterns are the same as those in the past, but carbon-neutral digital platform economic development is subject to many Factors such as policy, technology, market, etc. These factors may change in the future, affecting the model’s accuracy (Zou et al., 2022b). Time series models also require stable and continuous data for forecasting, and there may be missing data in the carbon-neutral digital platform economic development process, which will affect the forecasting accuracy of the model.
Deep learning model: The deep learning model is a machine learning model based on artificial neural networks. Its main features are multi-layer nonlinear transformation and learning capabilities. It can automatically learn features and laws from a large amount of data and perform tasks such as classification, prediction, and control (Desai et al., 2022). A deep learning model usually consists of multiple neural network layers, and each layer includes various neurons, which can process and transform the input data layer by layer to obtain the final output result.
Common deep learning models include convolutional neural networks, recurrent neural networks, generative confrontation networks, and auto encoders. Compared with the traditional machine learning model, the deep learning model has many advantages: it can automatically learn features, does not need to extract features manually, and reduces the cost and error of manual intervention. It can also handle large-scale data, and the model’s accuracy will gradually improve as the amount of data increases (Liao et al., 2023). In addition, the deep learning model has good generalization ability, can be applied to different data sets and scenarios, can handle nonlinear relationships, and has a better fitting effect on complex data patterns. Although the deep learning model has many advantages, there are also some disadvantages when it is applied to the analysis of the economic benefits of carbon-neutral digital platforms: the deep learning model requires a large amount of data for training, and the research in the field of carbon-neutral digital platform economy may There are missing or insufficient data, which will affect the accuracy and reliability of the model. In particular, the model’s decision-making process is difficult to understand, and the prediction results are difficult to explain, so it is unsuitable for some application scenarios requiring interpretability.
Table 1 is a comparison chart of the advantages and disadvantages of the above models.
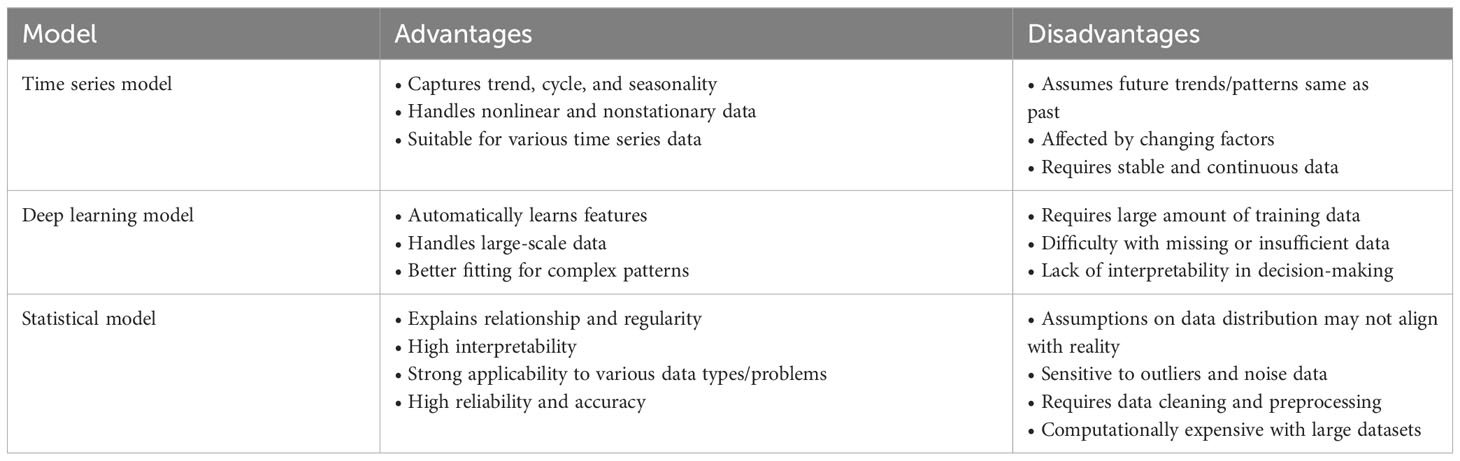
Table 1 Comparison of time series, deep learning, and statistical models.
Based on the advantages and disadvantages of the above models, this paper proposes a GPT-QRCNN based model to study the economic benefits of carbon-neutral digital platforms. First, the data on the economic benefits of carbon-neutral digital media are cleaned and normalized for subsequent model training and prediction. The GPT model transforms the data into text, and the reader is subjected to operations such as word separation, word vector embedding, and sequence coding to extract feature information from the data. Then the QRCNN model performs functions such as convolution and pooling on the values to remove feature information from the data, completes the study of the data by learning and analyzing the historical data, and finally outputs the data.
The contributions of this paper are as follows:
● Compared with the statistics model, our proposed model can learn the data characteristics adaptively, thus improving the prediction accuracy and stability of the model, which is suitable for more complex environmental performance data prediction tasks. It is also ideal for studying the economic benefits of carbon-neutral digital platforms with stronger nonlinear data processing ability, model generalization ability, and interpretability of prediction results;
● Compared with the time series model, our proposed model can perform adaptive learning and feature extraction on text data while combining the advantages of the convolutional neural network of the QRCNN model, which can better extract feature information from data and improve prediction accuracy and stability;
● Compared with the deep learning model, our proposed model has stronger interpretability and can visually present the prediction results to users through visual analysis and interpretation, which helps users better understand and apply the prediction results of the model.
In the remainder of this paper, we present recent related work in Section 2. Section 3 presents our proposed method: overview, GPT, and QRCNN models. Section 4 introduces the experimental part, including experimental details, group experiment comparison. Section 5 provides the summary and discussion.
2 Related work
2.1 Random Forest
Random Forest is a commonly used machine learning method. This ensemble learning method uses multiple decision trees to make predictions and averages or votes their results to obtain the final result (Chen et al., 2021). When building each decision tree, Random Forest uses random subsets of features and samples to avoid overfitting and improve the model’s generalization ability.
In the research on carbon and digital platform economic benefits, the Random Forest model can predict carbon trading market prices and carbon emissions and evaluate the economic benefits of carbon reduction projects. The Random Forest model can predict future trends by training on historical data and help enterprises or governments make more informed decisions (You and Yi, 2022). However, some drawbacks of the Random Forest model may limit its application in carbon and digital platform economic benefits research. For example, the model may have interpretability issues, making it difficult to intuitively explain the contribution of each variable in the model results. Additionally, the model’s performance in dealing with high-dimensional and sparse data may need improvement, requiring specific data preprocessing methods to handle such data. Moreover, the Random Forest model requires special treatment when dealing with time series data to consider the autocorrelation and trend of the time series data.
2.2 K-Nearest Neighbors
K-Nearest Neighbors (k-NN) is a common supervised learning algorithm that can be used for classification and regression problems (Liao et al., 2022). In k-NN, a sample’s predicted label or output value is determined by searching for the k most similar neighbors in training set to the model to be expected. For classification problems, k-NN finds the k nearest samples to a new piece in the training set and then predicts the result based on the most frequent class among these k samples. For regression problems, k-NN also finds the k nearest pieces to a new model and predicts the result based on the average value of these k samples.
In research on carbon and digital platform economic benefits, k-NN can be used to predict carbon trading market prices, predict carbon emissions, and evaluate the economic benefits of carbon reduction projects. However, the following disadvantages of k-NN significantly limit its application in research on carbon and digital platform economic benefits: k-NN may require specific data preprocessing methods when dealing with high-dimensional and sparse data, increasing its use’s complexity and difficulty (Wang et al., 2023b). The algorithm is also sensitive to noise and outliers and requires appropriate data cleaning and processing. Additionally, the algorithm’s computational complexity increases with the dataset’s size, requiring specific algorithm optimization methods. Furthermore, k-NN may suffer from overfitting or underfitting problems, which can be addressed by adjusting the k value and using specific distance metrics.
2.3 Q-Learning
Q-Learning is a reinforcement learning algorithm that can be used to learn how to make optimal decisions in an environment. In reinforcement learning, an agent can maximize cumulative rewards by interacting with the environment (Zhang et al., 2022). In Q-Learning, the agent knows an optimal policy using a Q-value function, representing the cumulative reward for taking a specific action in a given state. The algorithm learns the optimal policy by continuously updating the Q-value part.
Q-Learning can be used to optimize the economic benefits of carbon reduction projects in research on carbon and digital platform economic benefits. The algorithm can model carbon reduction projects as a reinforcement learning problem, where the agent learns how to make optimal reduction decisions at each time step to maximize cumulative rewards (such as reducing emissions and obtaining carbon credits) (Zha, 2023). However, the drawbacks of the Q-Learning algorithm are also apparent: the algorithm may suffer from the “curse of dimensionality,” where the number of Q-values that need to be learned grows exponentially in high-dimensional state spaces, resulting in a sharp increase in computational complexity. Additionally, Q-Learning is sensitive to the design and selection of reward signals in the environment and requires careful tuning and planning to achieve the desired effect. Moreover, the initialization of the Q-value function and the choice of learning rate can also affect the algorithm’s performance and stability, requiring appropriate algorithm optimization methods to improve this issue.
3 Methodology
3.1 Overview of our network
This paper proposes a GPT-QRCNN-based model for assessing the economic benefits of carbon-neutral digital platforms, which can help realize the carbon-neutral benefits of carbon-neutral digital platforms in an economic context and provide a strong help for the transformation and enhancement of the economic benefits of carbon-neutral digital platforms.
Digital platforms can help realize the carbon-neutral benefits of carbon-neutral digital platforms in the economic context and provide a powerful help for the transformation and enhancement of the economic benefits of carbon-neutral digital platforms.
The first step is to collect data related to the economic benefits of the carbon-neutral digital platform, such as energy consumption, carbon emission data, market data, and financial data. Also, direct and indirect carbon emission data are included, as well as the sources and consumption of carbon emissions. These data will be used as input data for model construction and evaluation. The data will then be cleaned, normalized, and features extracted to facilitate subsequent model training and prediction. The processed data are to be trained and partly removed using GPT to obtain a feature representation of the text data. The sequential data is then classified and modeled using QRCNN, and finally, the prediction results are output. In the application stage of the model, the model can be used to study the economic benefits of the carbon-neutral digital platform and select the optimal benefit transformation scheme based on the research results to maximize the benefits of resource transformation of the carbon-neutral digital platform.
The research model of the economic benefits of carbon-neutral digital platforms based on GPT-QRCNN consists of two parts, the GPT module and the QRCNN module, which can complete the research of the economic benefits of a carbon-neutral digital platform through their respective advantages. The overall structure of the model is shown in Figure 1.
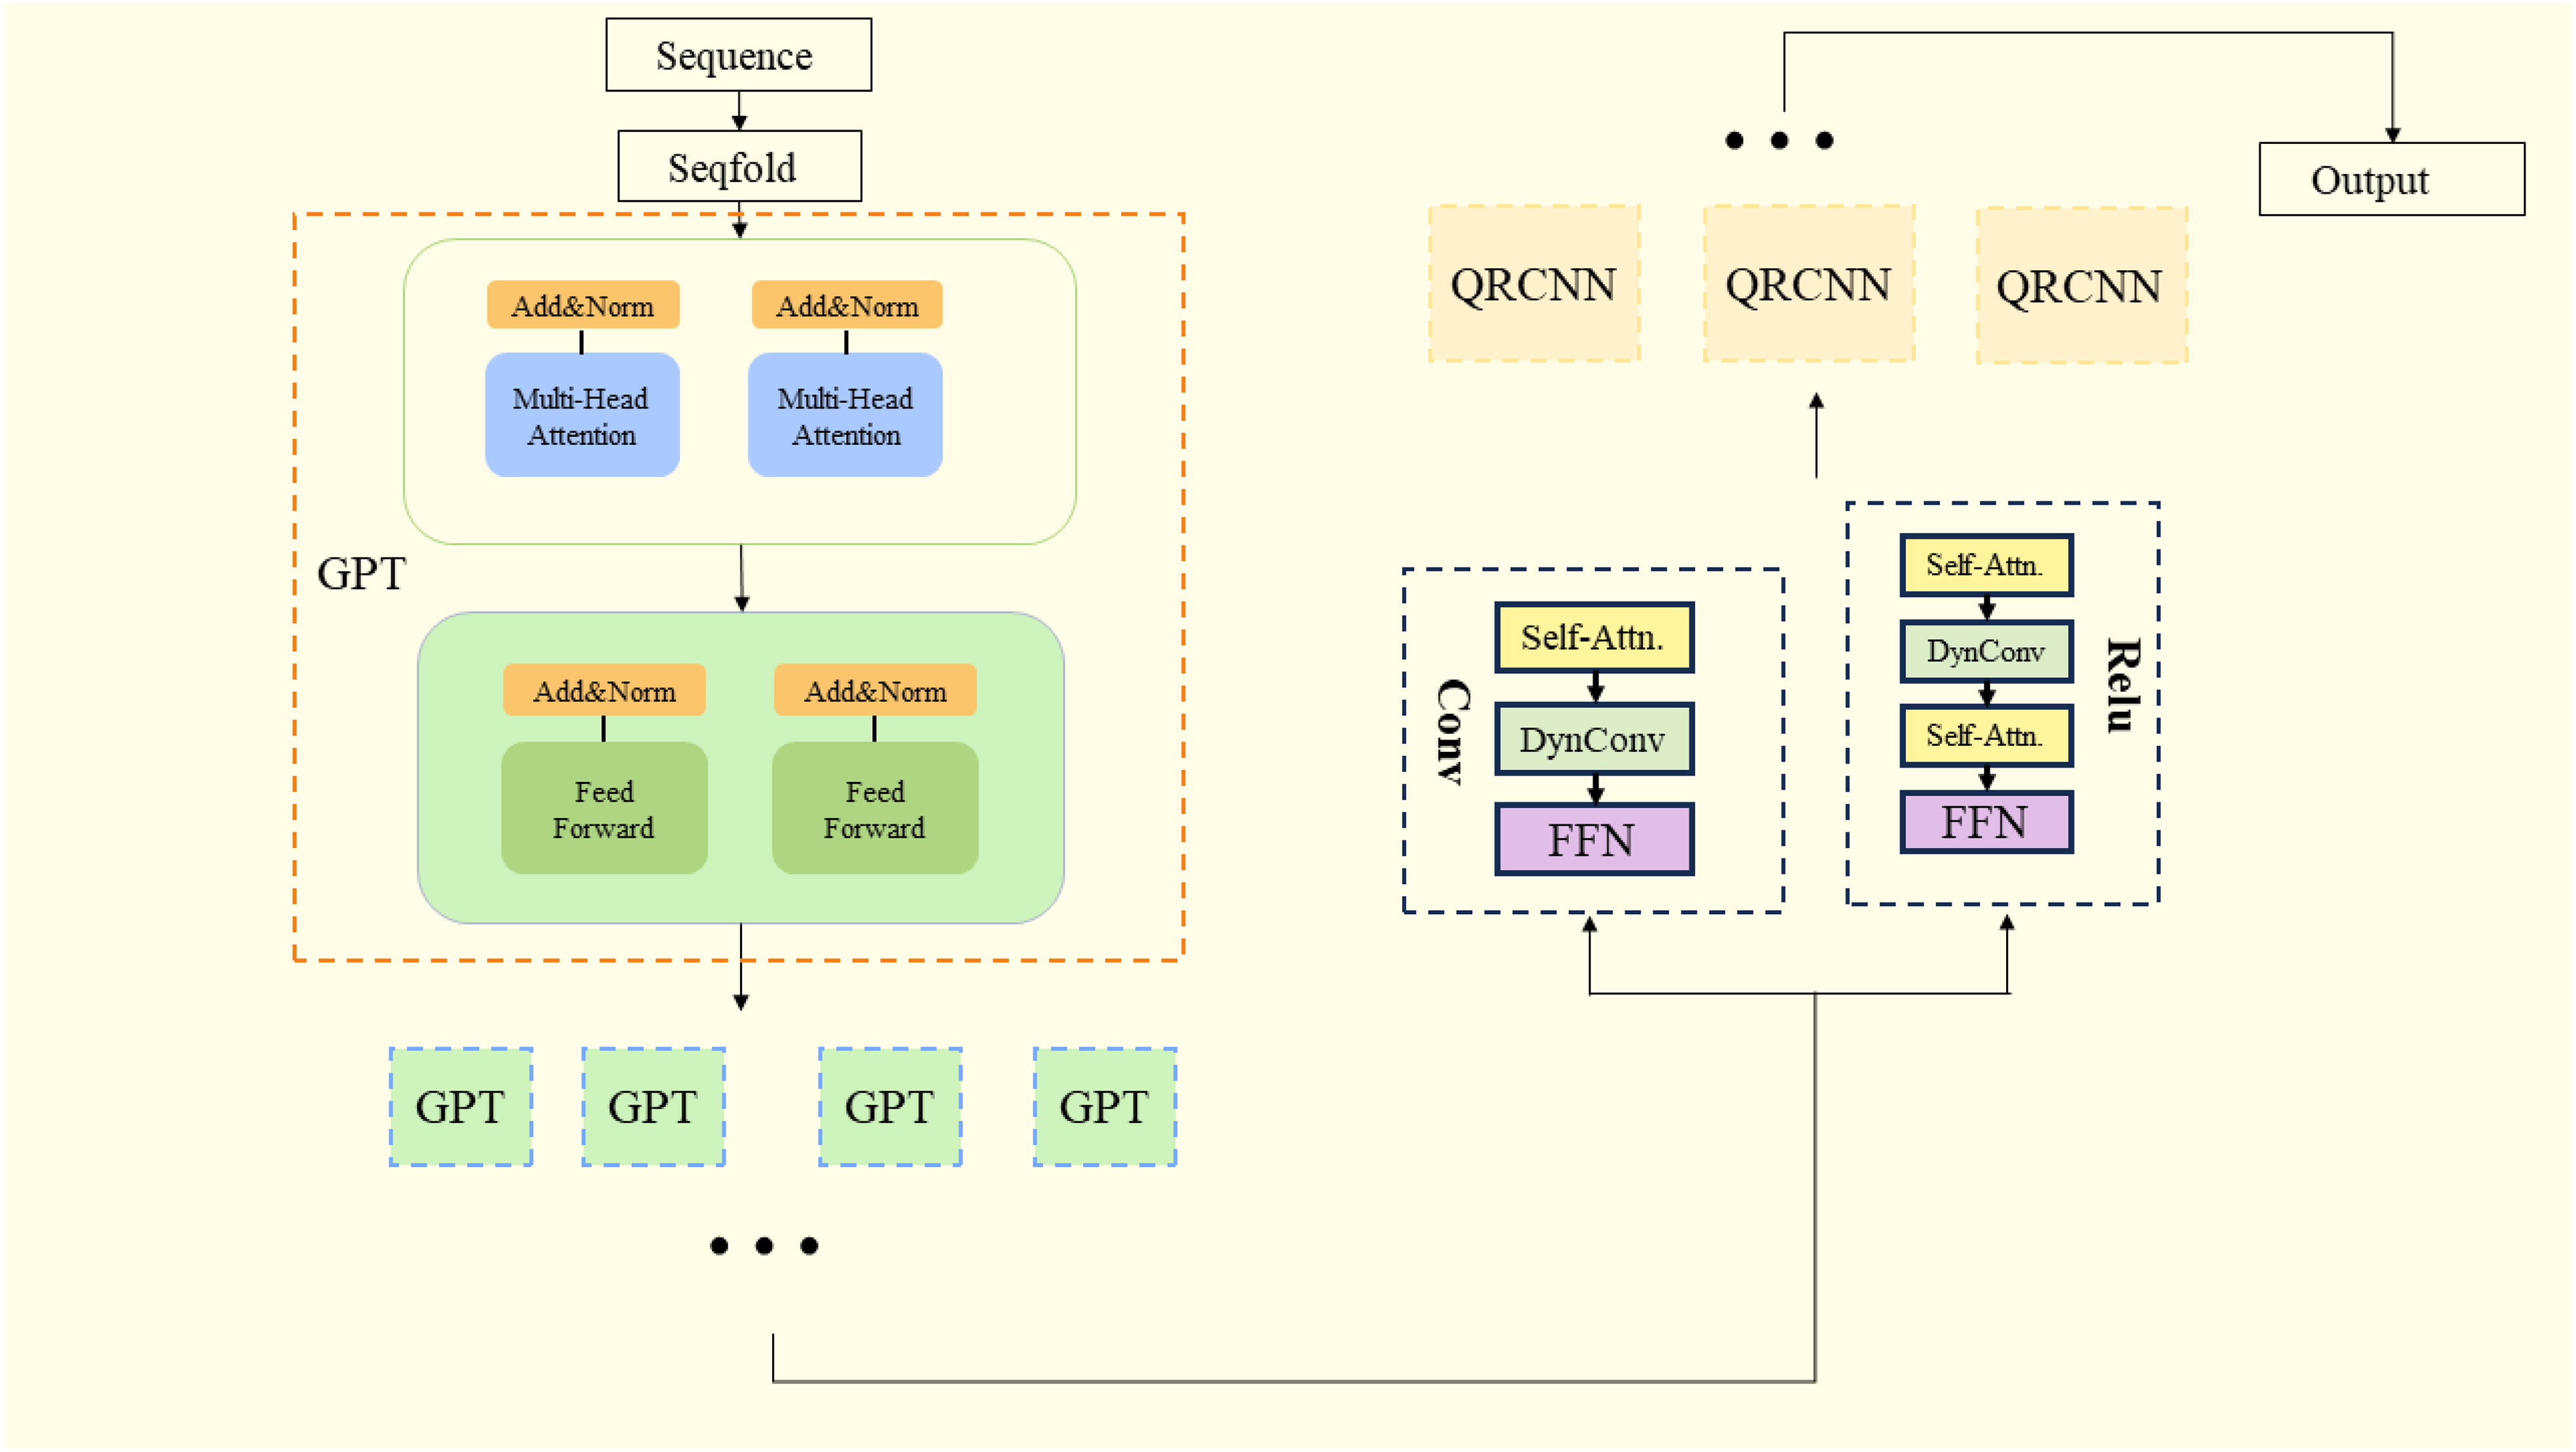
Figure 1 GPT-QRCNN structural unit.
Algorithm 1 is the algorithmic flow of the model; first input the data of carbon-neutral digital platform, preprocess and normalize the data in the data input layer, then put the data set into GPT module for learning and feature classification, then put the classified feature data into QRCNN module, through quantile regression and convolution pooling, finally get the model optimal parameters and output the prediction results.
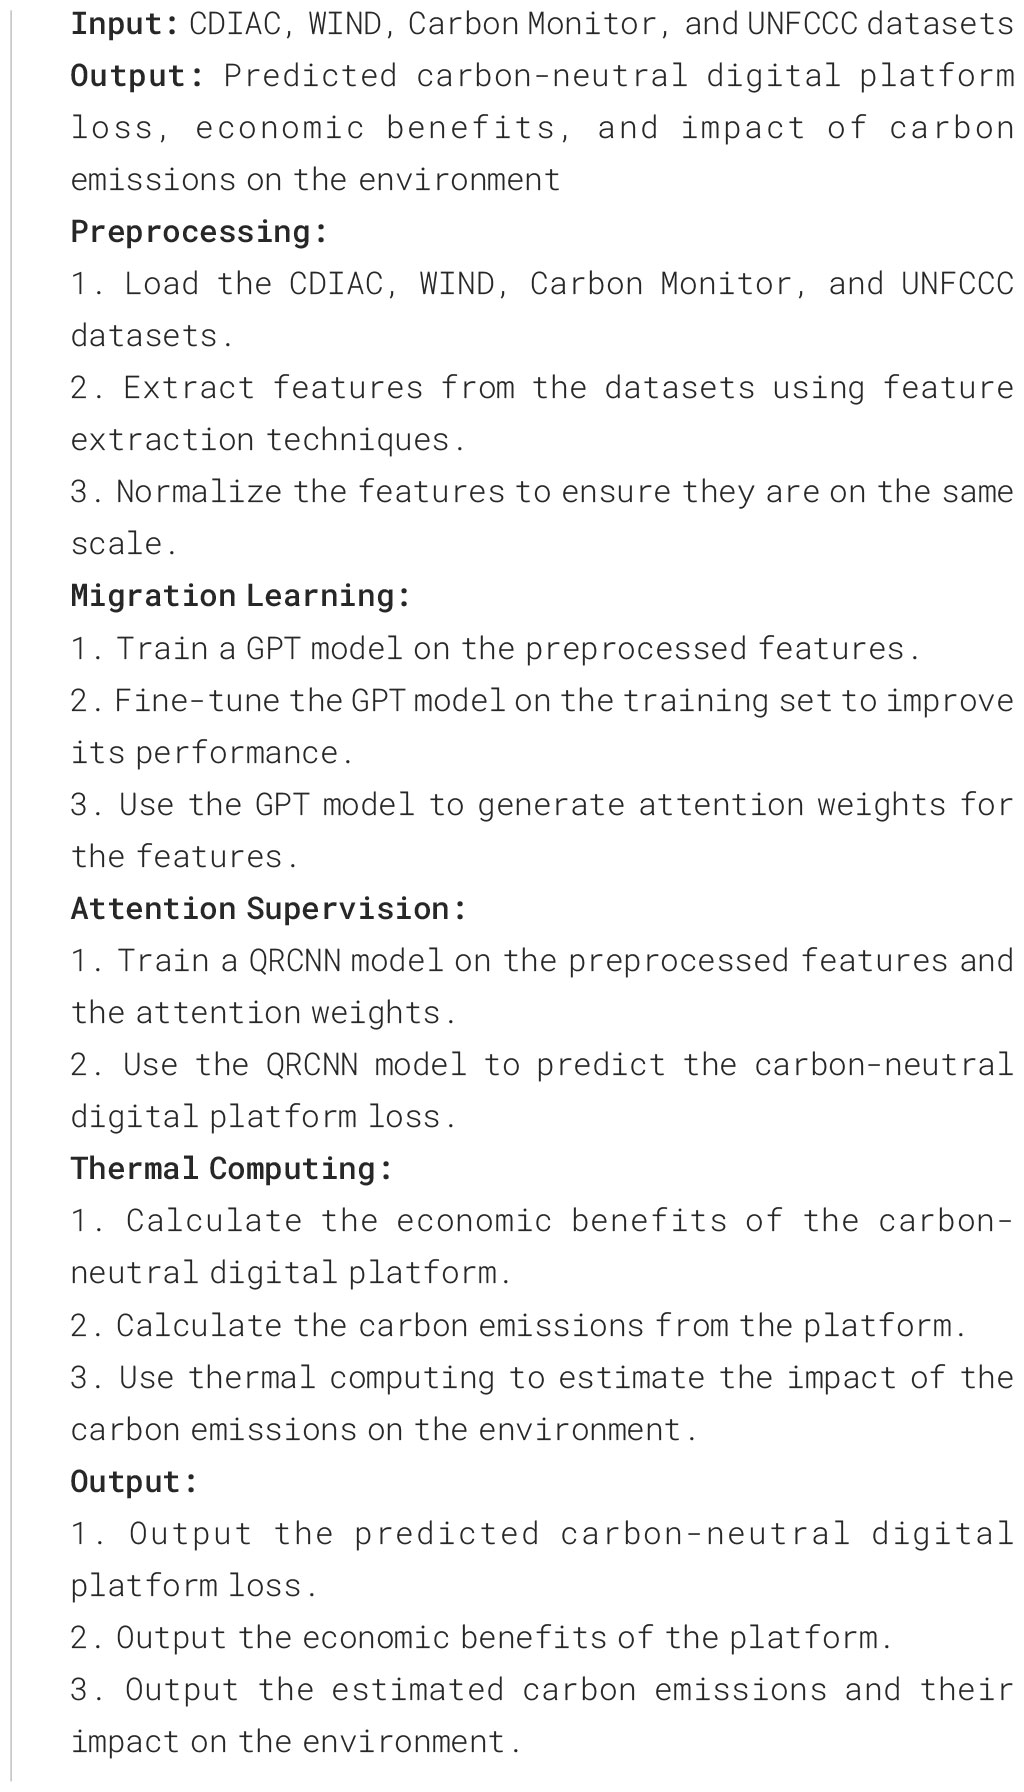
Algorithm 1. GPT-QRCNN model training.
3.2 GPT model
The GPT model is a type of deep learning natural language processing model that uses a large amount of unlabeled data for pre-training and fine-tuning for specific tasks. In the context of carbon and digital platform economic benefits research, the GPT model has the advantage of being able to more accurately predict future price trends and market changes, analyze user behavior and market trends, and help businesses and investors make better decisions, optimize operations, and improve economic efficiency (Xing et al., 2023). Additionally, the GPT model can automate the analysis of large amounts of data, improve decision-making efficiency, reduce time and cost expenses for businesses and investors, and provide more comprehensive analysis by simultaneously processing multiple natural language processing tasks and data, helping businesses and investors better understand market and user demands, optimize operations, and improve economic efficiency.
However, the GPT model requires a large amount of pre-training data to fully leverage its advantages, and if the pre-training data is insufficient or unsuitable, the model’s performance may be limited (Zhao et al., 2021). Furthermore, due to potential biases in the sources and features of pre-training data, the GPT model may exhibit biases in fine-tuning for specific tasks and requires careful handling.
In our research, we preprocess the raw data by transforming it into a format that the GPT model can process, and perform cleaning and deduplication. We then pre-train the GPT model with a large amount of unlabeled data to learn language patterns and relationships, fine-tune the pre-trained model for specific tasks to adapt to specific data and task characteristics, evaluate the fine-tuned model for accuracy and efficiency, and finally apply the well-evaluated model to actual data analysis and decision-making, constantly optimizing and updating the model to improve its performance and adaptability. Its model structure diagram is shown in Figure 2. The principle of GPT can be simplified by Equation (1).

Figure 2 GPT structural unit.
where wirepresents the ith word, w1,w2,…,wi−1 represent the first i − 1 generated words, P(wj|w1,w2,…,wj−1) represents the probability of generating the jth word wjunder the conditions of the first j − 1 words that have been generated. The parameters in the formula include w′, representing all possible next words, and the logarithmic probability logP(wj|w1,w2,…,wj−1), representing the given. Given the condition of the first j − 1 words, the logarithm of the probability of generating the jth word. In the actual model, these probabilities are calculated by a neural network.
3.3 QRCNN model
Quantile Regression Convolutional Neural Network (QRCNN) is a deep learning regression algorithm used to predict continuous variables (Zhu et al., 2022a). It combines the powerful functionalities of Convolutional Neural Networks (CNN) and quantile regression to model and predict data distribution. The QRCNN algorithm can handle various uncertainties, including carbon market price fluctuations and changes in digital platform user behavior.
The data used in carbon and digital platform economic benefit research is typically multidimensional, and QRCNN can process multidimensional data and extract useful features from it. The algorithm uses quantile regression to handle noise and outlier data in the research, improving the robustness of the model. QRCNN also has the feature extraction ability of CNN and can efficiently process large-scale data. In carbon and digital platform economic benefit research, prediction accuracy is crucial, and QRCNN can simultaneously predict multiple quantiles, better reflecting data distribution and improving prediction accuracy. However, the QRCNN model requires a large amount of training data to achieve good performance. This means that if the data is insufficient or not sufficiently diverse, the performance of the QRCNN model may be limited. The diagram is shown in Figure 3.
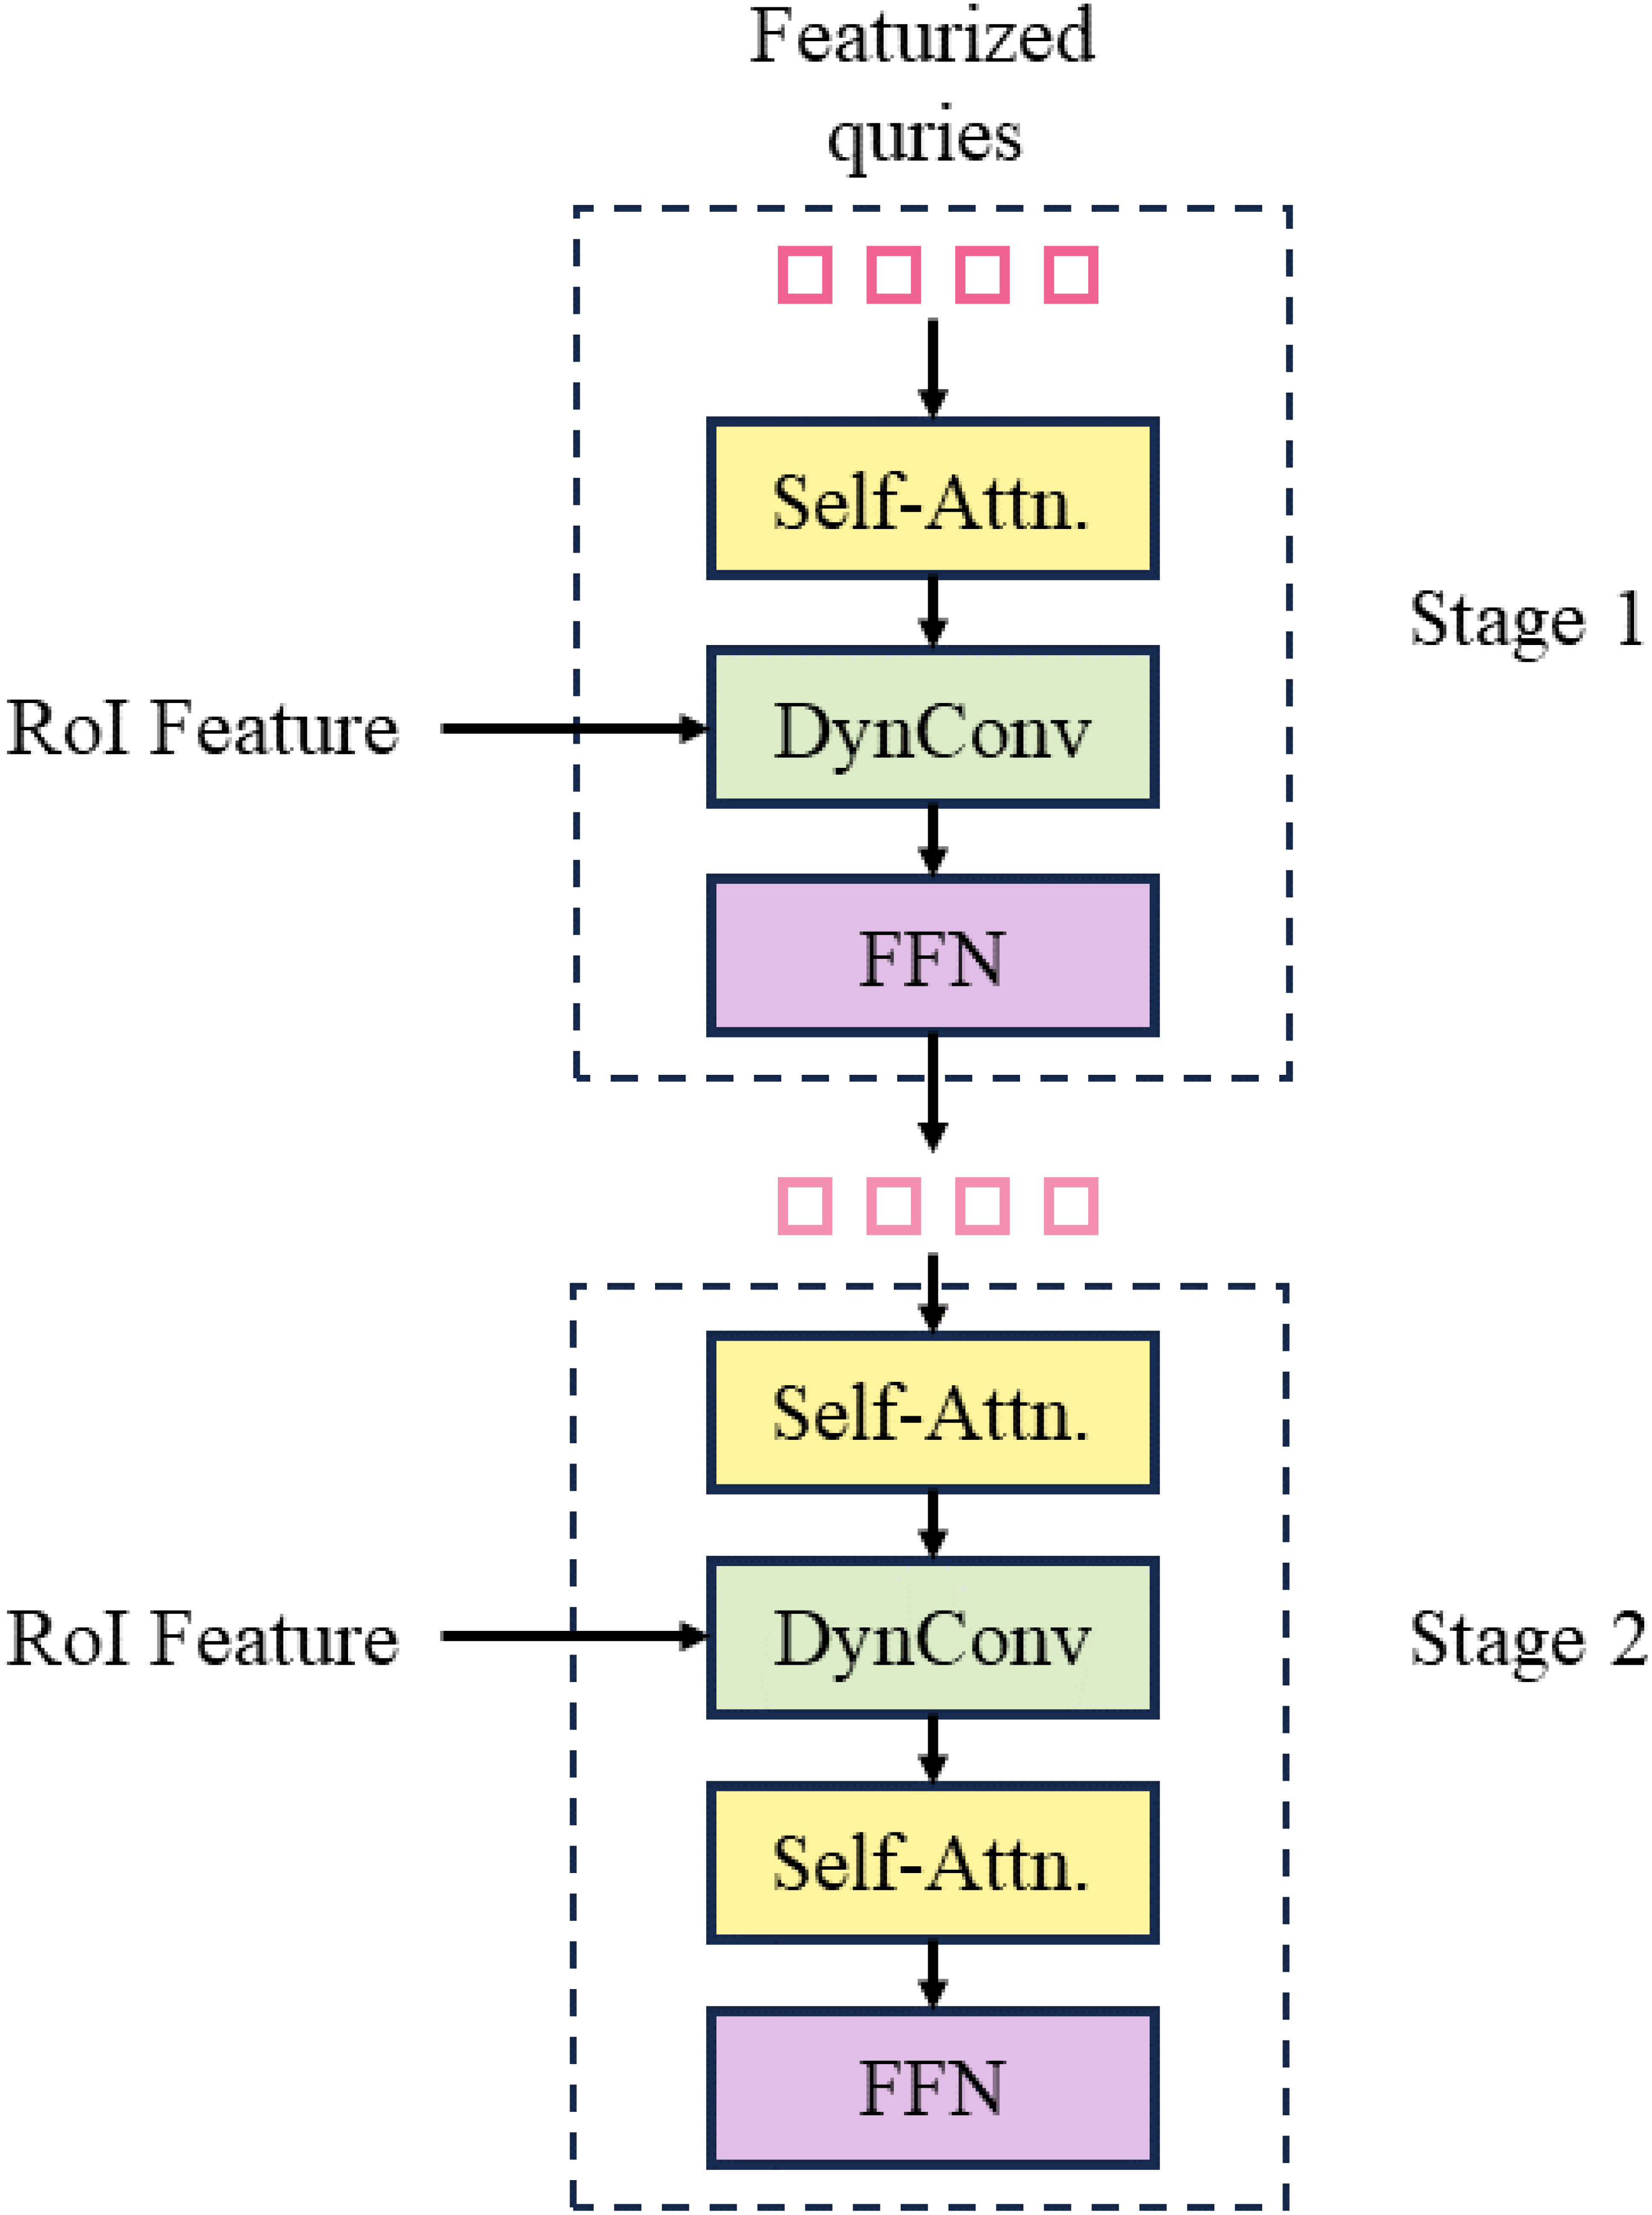
Figure 3 QRCNN structural unit.
The following is the formula of QRCNN model operation. Equation (2) represents the convolutional layer operation process of QRCNN:
where hi,j(l) represents the feature map of the lth layer, the ith row, and the jth column; Wk,p,q,j(l) represents the kth channel, the pth row, and the qth column of the jth convolution kernel of the lth layer; the weight of represents l−1 layer, i+p−1 row, the feature map of the j +q −1 column; bj(l) represents the bias item of the l layer; and f represents the activation function. This formula expresses the convolution operation in the quantile regression CNN, and the output tensor is obtained by convolving different channels of the input tensor with different convolution kernels. Equation (3) represents the fully connected layer operation process of QRCNN:
where represents the predicted value when the quantile is τ, gτ is a quantile loss function, W(L) is the weight matrix of the last layer, h(L−1) is the output of the penultimate layer, b(L) is the bias vector of the last layer. This formula expresses the fully connected operation in the quantile regression CNN. The final output is obtained by multiplying the output vector of the penultimate layer with the weight matrix and adding the bias vector.
4 Experiment
4.1 Datasets
In this paper, the data we use come from WIND, Carbon Monitor, CDIAC and UNFCCC databases as the original data.
WIND: Wind Carbon, Emission Reduction Database, is a carbon-neutral database product launched by Wind Information Co. (Komninos, 2022). The database is designed to provide investors, government agencies, enterprises, and other users with comprehensive, accurate, and reliable carbon-neutral data and analysis tools to help users make carbon-neutral investments and decisions.
WAND Carbon Neutral Database contains rich carbon emission data and emission reduction data, including carbon emission situation, carbon emission trend, carbon emission reduction policy, carbon market price, and other information on most countries and regions in the world. The database also provides a series of carbon-neutral indicators and assessment tools to help users make carbon-neutral investments and decision analyses, such as carbon emission intensity, emission reduction potential, cost, etc. At the same time, the WANT Carbon Neutral Database provides data visualization and reporting tools to help users understand and analyze carbon-neutral data and trends more intuitively and clearly (Kang et al., 2022). Users can use WANT Carbon Neutral Database to conduct multi-dimensional and multi-faceted carbon-neutral analysis and research and make carbon-neutral investment and decision plans.
Carbon Monitor: Carbon Monitor is a real-time carbon data product developed with Harvard University, the University of Exeter (UK), and Forschungszentrum Julich (Qiao et al., 2021). By integrating data from thousands of data sources worldwide, the database monitors and estimates global carbon emissions in real-time, providing important data to support the development and implementation of international carbon reduction policies.
The Carbon Monitor database is updated frequently, once a day, to provide real-time carbon emissions data from around the world. The database uses advanced technologies and models, including satellite remote sensing technology, ground monitoring data, industrial production data, energy consumption data, and other data sources, to estimate global carbon emissions through data fusion and model extrapolation.
The Carbon Monitor database provides various data visualization and analysis tools that allow users to visualize carbon emissions and trends worldwide through interactive maps and charts, as well as to conduct spatial and temporal analysis and comparison of carbon emissions (Wen et al., 2023). The database also provides a series of APIs and data download interfaces to facilitate data extraction and processing to support users’ various carbon emission analyses and studies.
CDIAC: The Carbon Dioxide Information Analysis Centre (CDIAC) database at Oak Ridge National Laboratory is a long-term database dedicated to collecting, organizing, managing, and publishing global greenhouse gas emissions data (Sen et al., 2022). The database is one of CDIAC’s core products. It contains international, national, and regional greenhouse gas emissions data, including carbon dioxide, methane, nitrogen oxides, fluorine, and other greenhouse gases, and related meteorological and energy data.
The CDIAC database is based on various data sources, including international agencies, government agencies, research institutions, large corporations, and other sources. The database is regularly verified and updated to ensure the accuracy and reliability of the data. In addition, the CDIAC database provides multiple versions of data, including raw data, corrected data, and integrated data, to meet the needs of different users.
UNFCCC: The United Nations Framework Convention on Climate Change (UNFCCC) database is a global climate change information and data platform maintained by the UNFCCC secretariat (Ahunbay et al., 2021). The database collects, organizes, and publishes climate change data and information from countries worldwide, including data on greenhouse gas emissions, climate change impacts and adaptation, clean energy and energy efficiency, and many other aspects.
The UNFCCC database is a very important climate change data resource that supports global climate change research and policy development. The database collects data through multiple channels, including national communications, country inventories, transparency reports submitted by governments, and relevant data published by other international agencies and research institutions (Wang et al., 2023a). The main purpose of the UNFCCC database is to provide information on climate change to the public, policymakers, and scientists. The database also provides a platform for cooperation among countries and international organizations to share climate change-related data and knowledge, facilitating coordination and collaboration in the global response to climate change.
Here we use these four databases as raw data; our own database is shown in Table 2. We use the first 85% of the data in the selected database as the training set, and the last 15% of the data as the test set. Giving the model more training data can make our model prediction results more accurate and the prediction results more convincing.
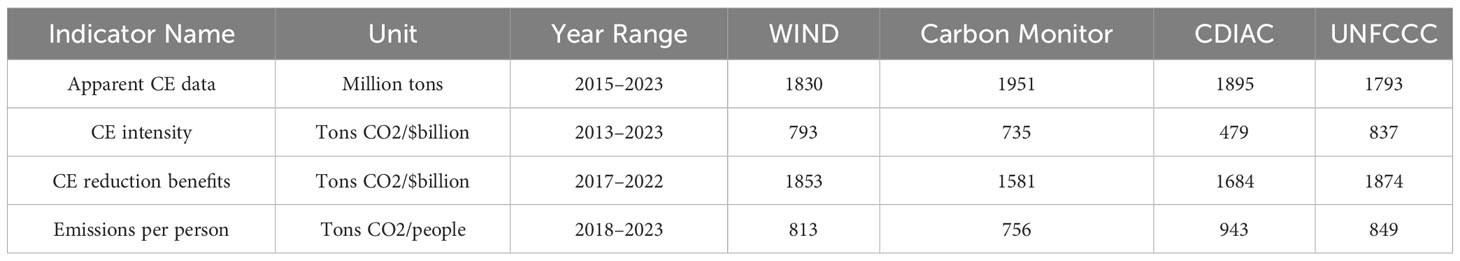
Table 2 Selected dataset data.
4.2 Experimental setup and details
To validate the application value of our GPT-QRCNN-based model for studying the economic benefits of carbon-neutral digital platforms, we conducted a series of experiments to compare with other models to verify our model’s applicability in the economic benefits study of carbon-neutral digital platforms. Our investigations cover Accuracy, F1-Score, MSE, MRecall, R2-Score, and MAE indicators, and the specific practical steps are as follows:
Step 1: Prepare the dataset and partition the dataset
● Obtain datasets from CDIAC, WIND, Carbon Monitor, and UNFCCC databases.
● Pre-process the dataset, such as cleaning and normalization of the data.
● Divide the dataset into training and test sets for use in the training and testing process.
Step 2: Train the GPT-QRCNN model
● Train the GPT model using the training set to extract useful features.
● Fine-tune the GPT model using the training and test sets to optimize feature extraction.
● Train the QRCNN model using the training and test sets to classify and predict the features.
Step 3: Evaluate model performance
● The performance of the model on the metrics Accuracy, Parameters, Flops, F1-Score, MSE, MRecall, R2-Score, and MAE was evaluated using the test set.
● The mean and standard deviation of the model on each metric are calculated and the performance of the model is compared across metrics.
The following is the mathematical formula for comparing indicators.
● Accuracy: Accuracy is the proportion of correctly predicted samples to the total number of samples.
where TP represents true positives, TN represents true negatives, FP represents false positives, and FN represents false negatives.
● Parameters:
● Flops:
● F1-Score: F1-Score is the harmonic mean of precision and recall, used to evaluate the overall performance of the model.
Where precision represents the proportion of true positives to all predicted positives, and recall represents the proportion of true positives to all actual positives.
● MSE (Mean Squared Error): MSE is the average of the squared differences between the predicted and actual values.
where y represents the actual value, represents the predicted value, and n represents the total number of samples.
● MRecall: MRecall is the average of the recall rates for all classes, used to evaluate the performance of a multi-class classification model.
where k represents the number of classes, and recallirepresents the recall rate for class i.
● R2-Score: R2-Score measures the proportion of the variance in the dependent variable that is explained by the independent variables.
where y represents the actual value, represents the predicted value, and represents the average of the actual values.
● MAE (Mean Absolute Error): MAE is the average of the absolute differences between the predicted and actual values.
where y represents the actual value, represents the predicted value, and n represents the total number of samples.
Step 4: Adjust the model parameters
● Adjust the model parameters, such as the number of training rounds, learning rate, etc., to improve the performance of the model.
● Verify the robustness and generalization of the model using techniques such as cross-validation.
Step 5: Visualization of experiment results
● Use charts or visualization tools to show the performance of the model under each metric.
Through the experimental results, we found that our GPT-QRCNN-based model for studying the economic benefits of carbon-neutral digital platforms exhibited better performance with different data sets and data volumes. In particular, our model performance was least affected compared to other groups of models. To gain insight into the composition and performance of our model, we conducted ablation experiments, and the experimental results show that the GPT model in our model plays an important role in the model performance improvement. Through the findings of multiple sets of experiments, we can conclude that our GPT-QRCNN-based model can accurately predict the carbon emission and energy consumption indicators of enterprises in the field of carbon-neutral digital platform economic efficiency research and help enterprises achieve the goals of carbon emission reduction and environmental protection. In addition, our model can adapt to different data sets and volumes with good generalization ability.
4.3 Experimental results and analysis
In Figure 4, the number of parameters and Flops, as well as the AUC and F-Score metrics of the GPT-QRCNN-based carbon-neutral digital platform benefit assessment model, are compared with the other two models on the WIND dataset and Carbon Monitor dataset, respectively.
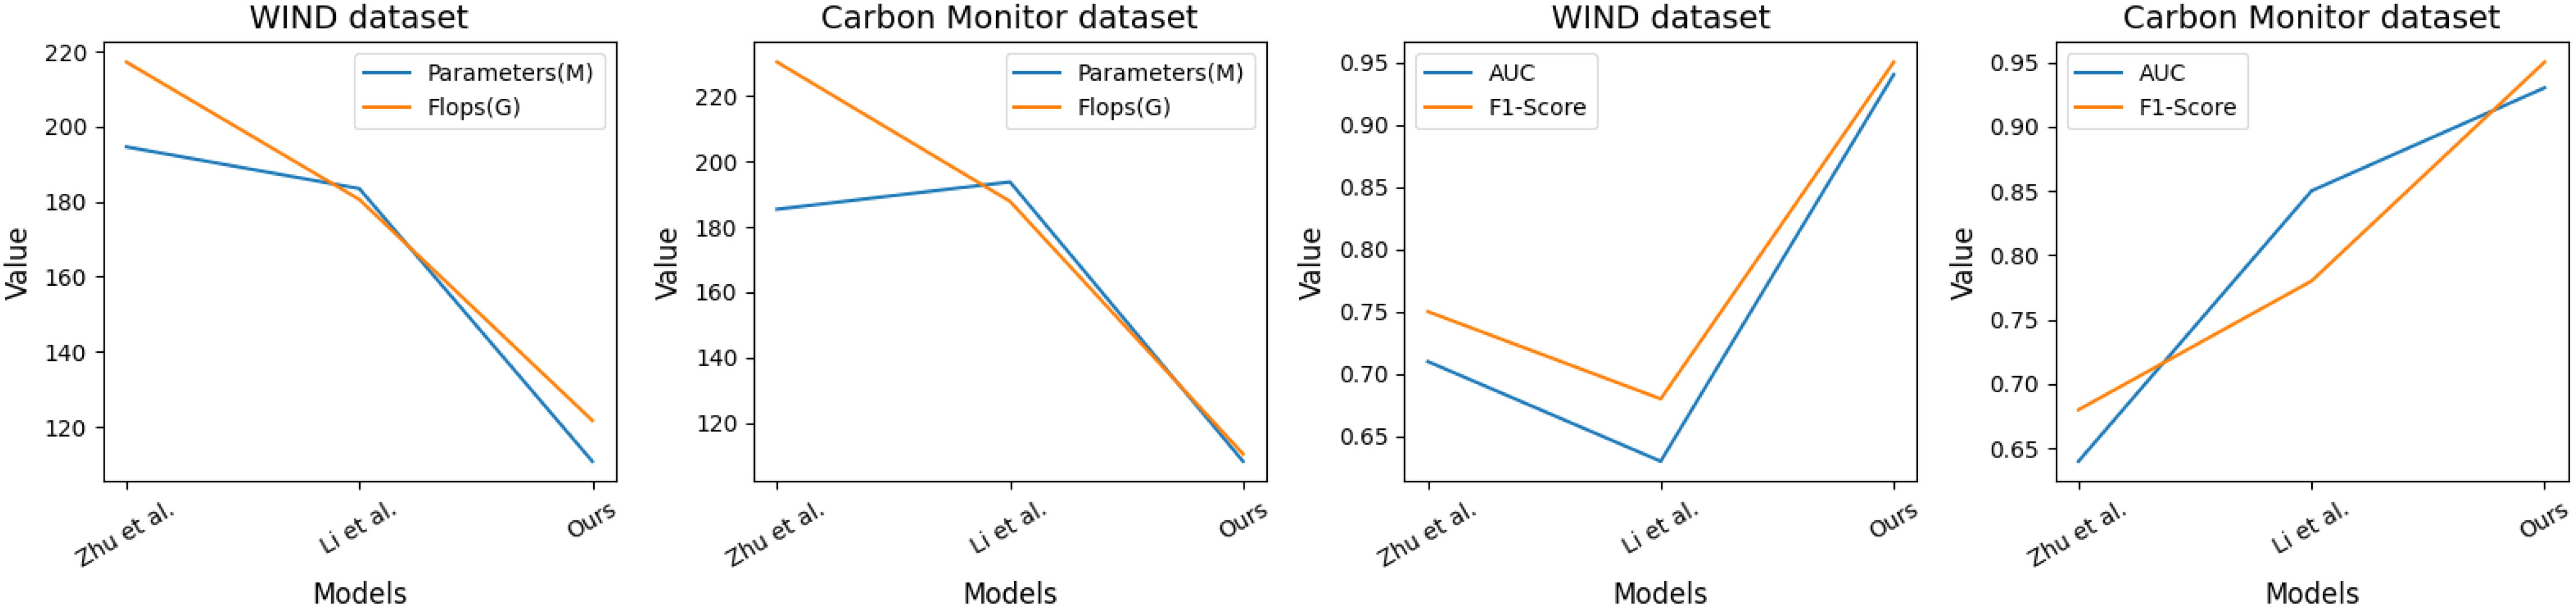
Figure 4 Graph of experimental results of Accuracy comparison for each model.
The experimental results show that our model exhibits fewer covariates and Flops and higher AUC and F-Score on different datasets and quantities and outperforms the other models on these two datasets. This indicates that our model can effectively predict and evaluate the benefits of a carbon-neutral numerical platform, providing researchers with more reliable data support. Therefore, our GPT-QRCNN model has a wide application prospect in the study of carbon-neutral numerical platform benefits and is expected to provide more reliable data support for related studies, help researchers better understand the issues related to carbon-neutral numerical platform benefits, and provide strong support for environmental protection and sustainable development. Table 3 shows the graphs of the experimental data results of the above experiments.
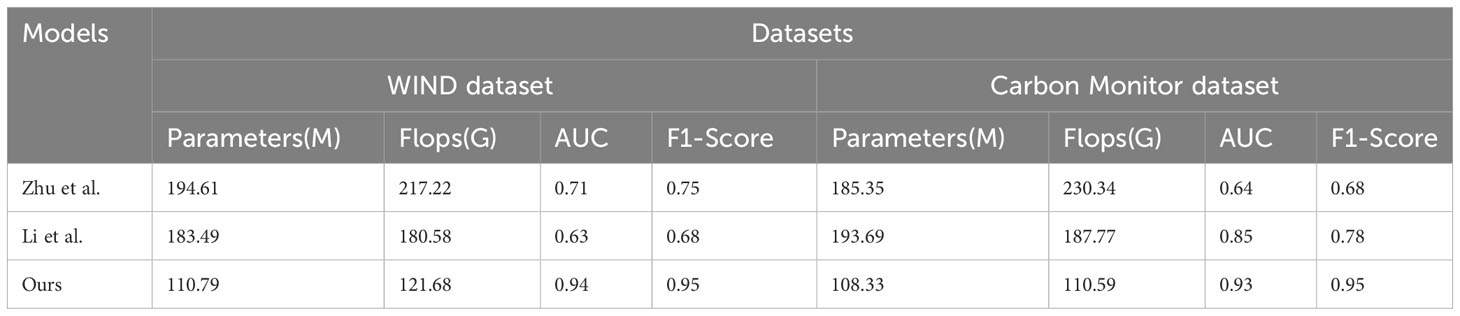
Table 3 Graphs of experimental data of Parameters, Flops, AUC, and F1-Score metrics for the Zhu et al. model (Zhu et al., 2022a), Li et al. model (Li and Wang, 2022), and our model on the WIND dataset (Komninos, 2022) and Carbon Monitor dataset (Qiao et al., 2021).
In Figure 5, We use the F1-score to compare the overall performance of the GPT-QRCNN-based carbon-neutral numerical platform benefit assessment model with other models. This metric combines the precision and recall of the model and is commonly used to assess the overall performance of the model. The experimental results show that our model exhibits high F1-scores for different datasets and volumes and outperforms other models on most datasets. This indicates that our model can offer better overall performance in detecting and identifying anomalies and problems in carbon-neutral and digital platform benefits and has better application prospects.
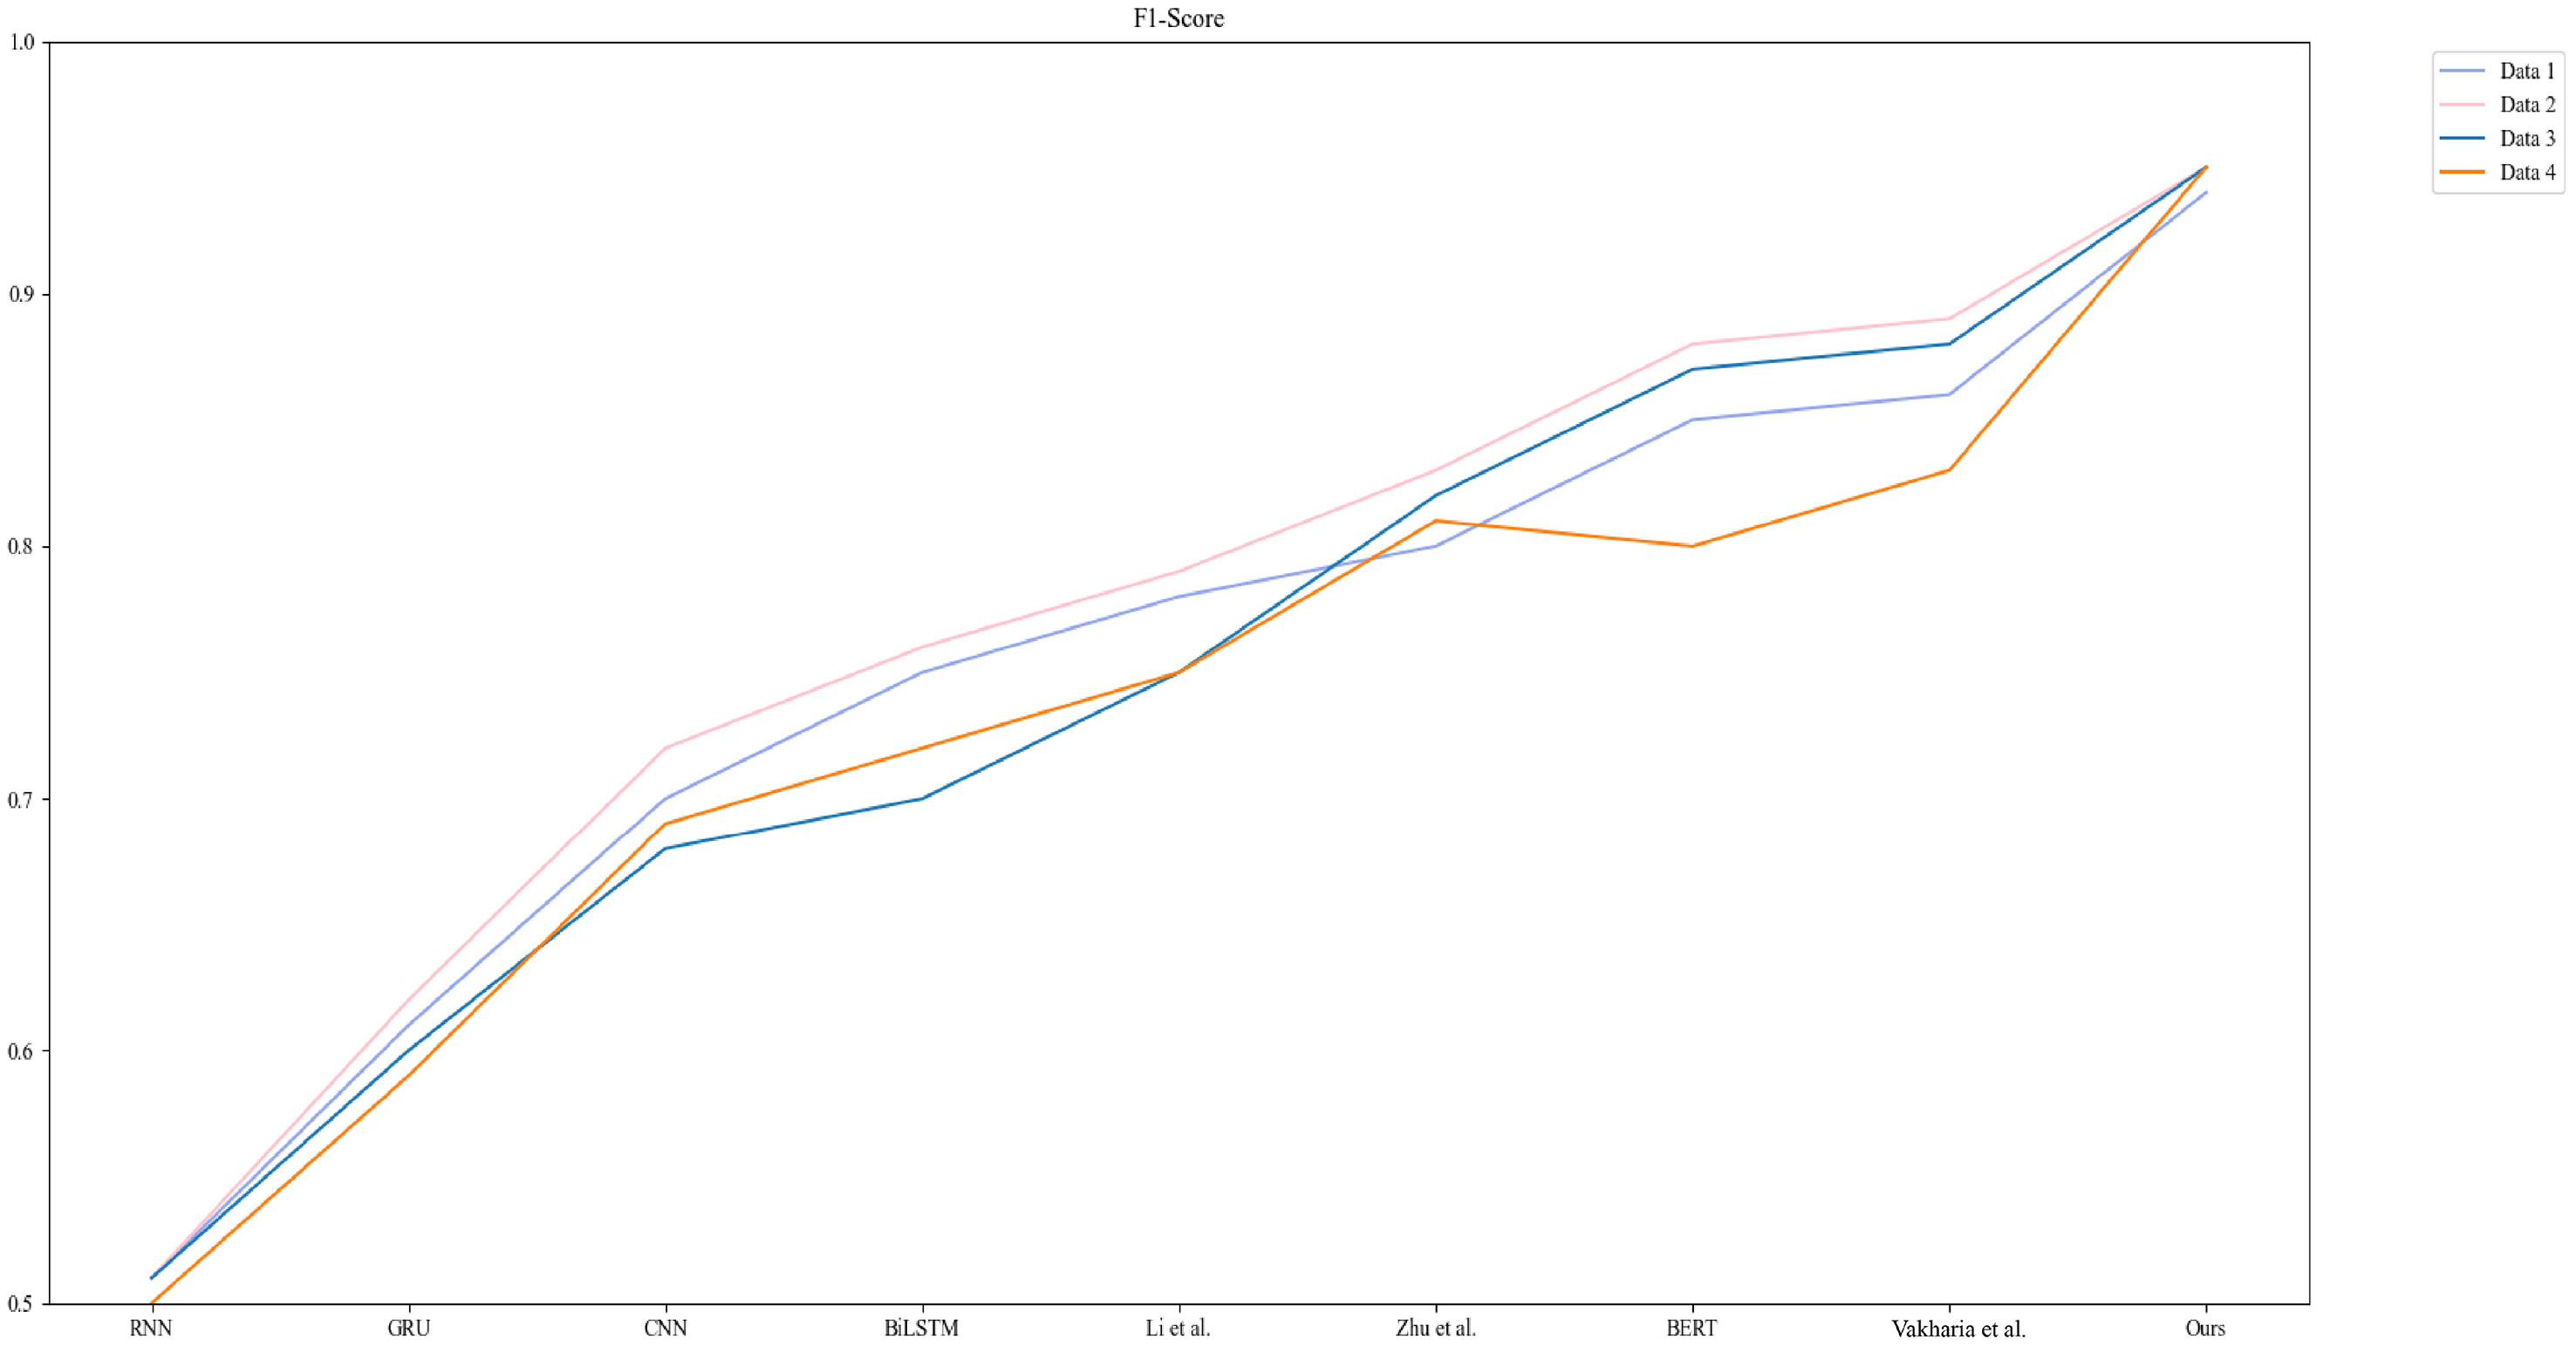
Figure 5 Comparative experimental results of F1-Score metrics for each model.
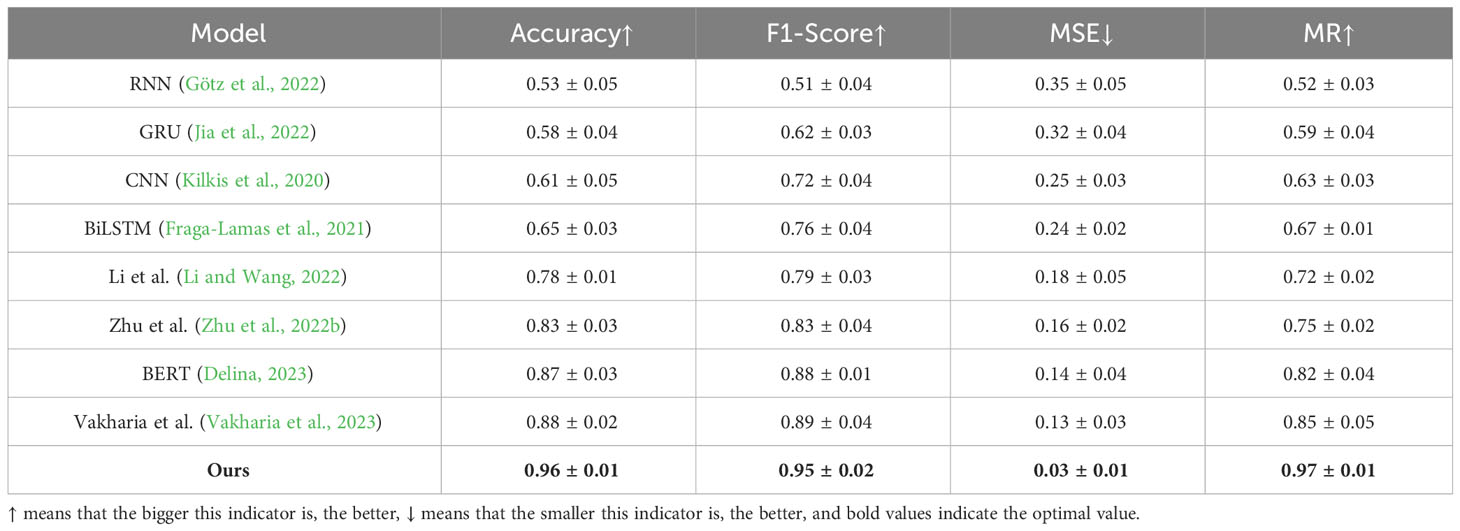
In Figure 6, our GPT-QRCNN-based carbon-neutral digital platform benefit assessment model shows the best average recall performance among all models. The average recall metric measures the proportion of true positive samples the model identifies. Our model can more accurately identify true data characteristics and perform better in carbon-neutral digital platform benefit studies.
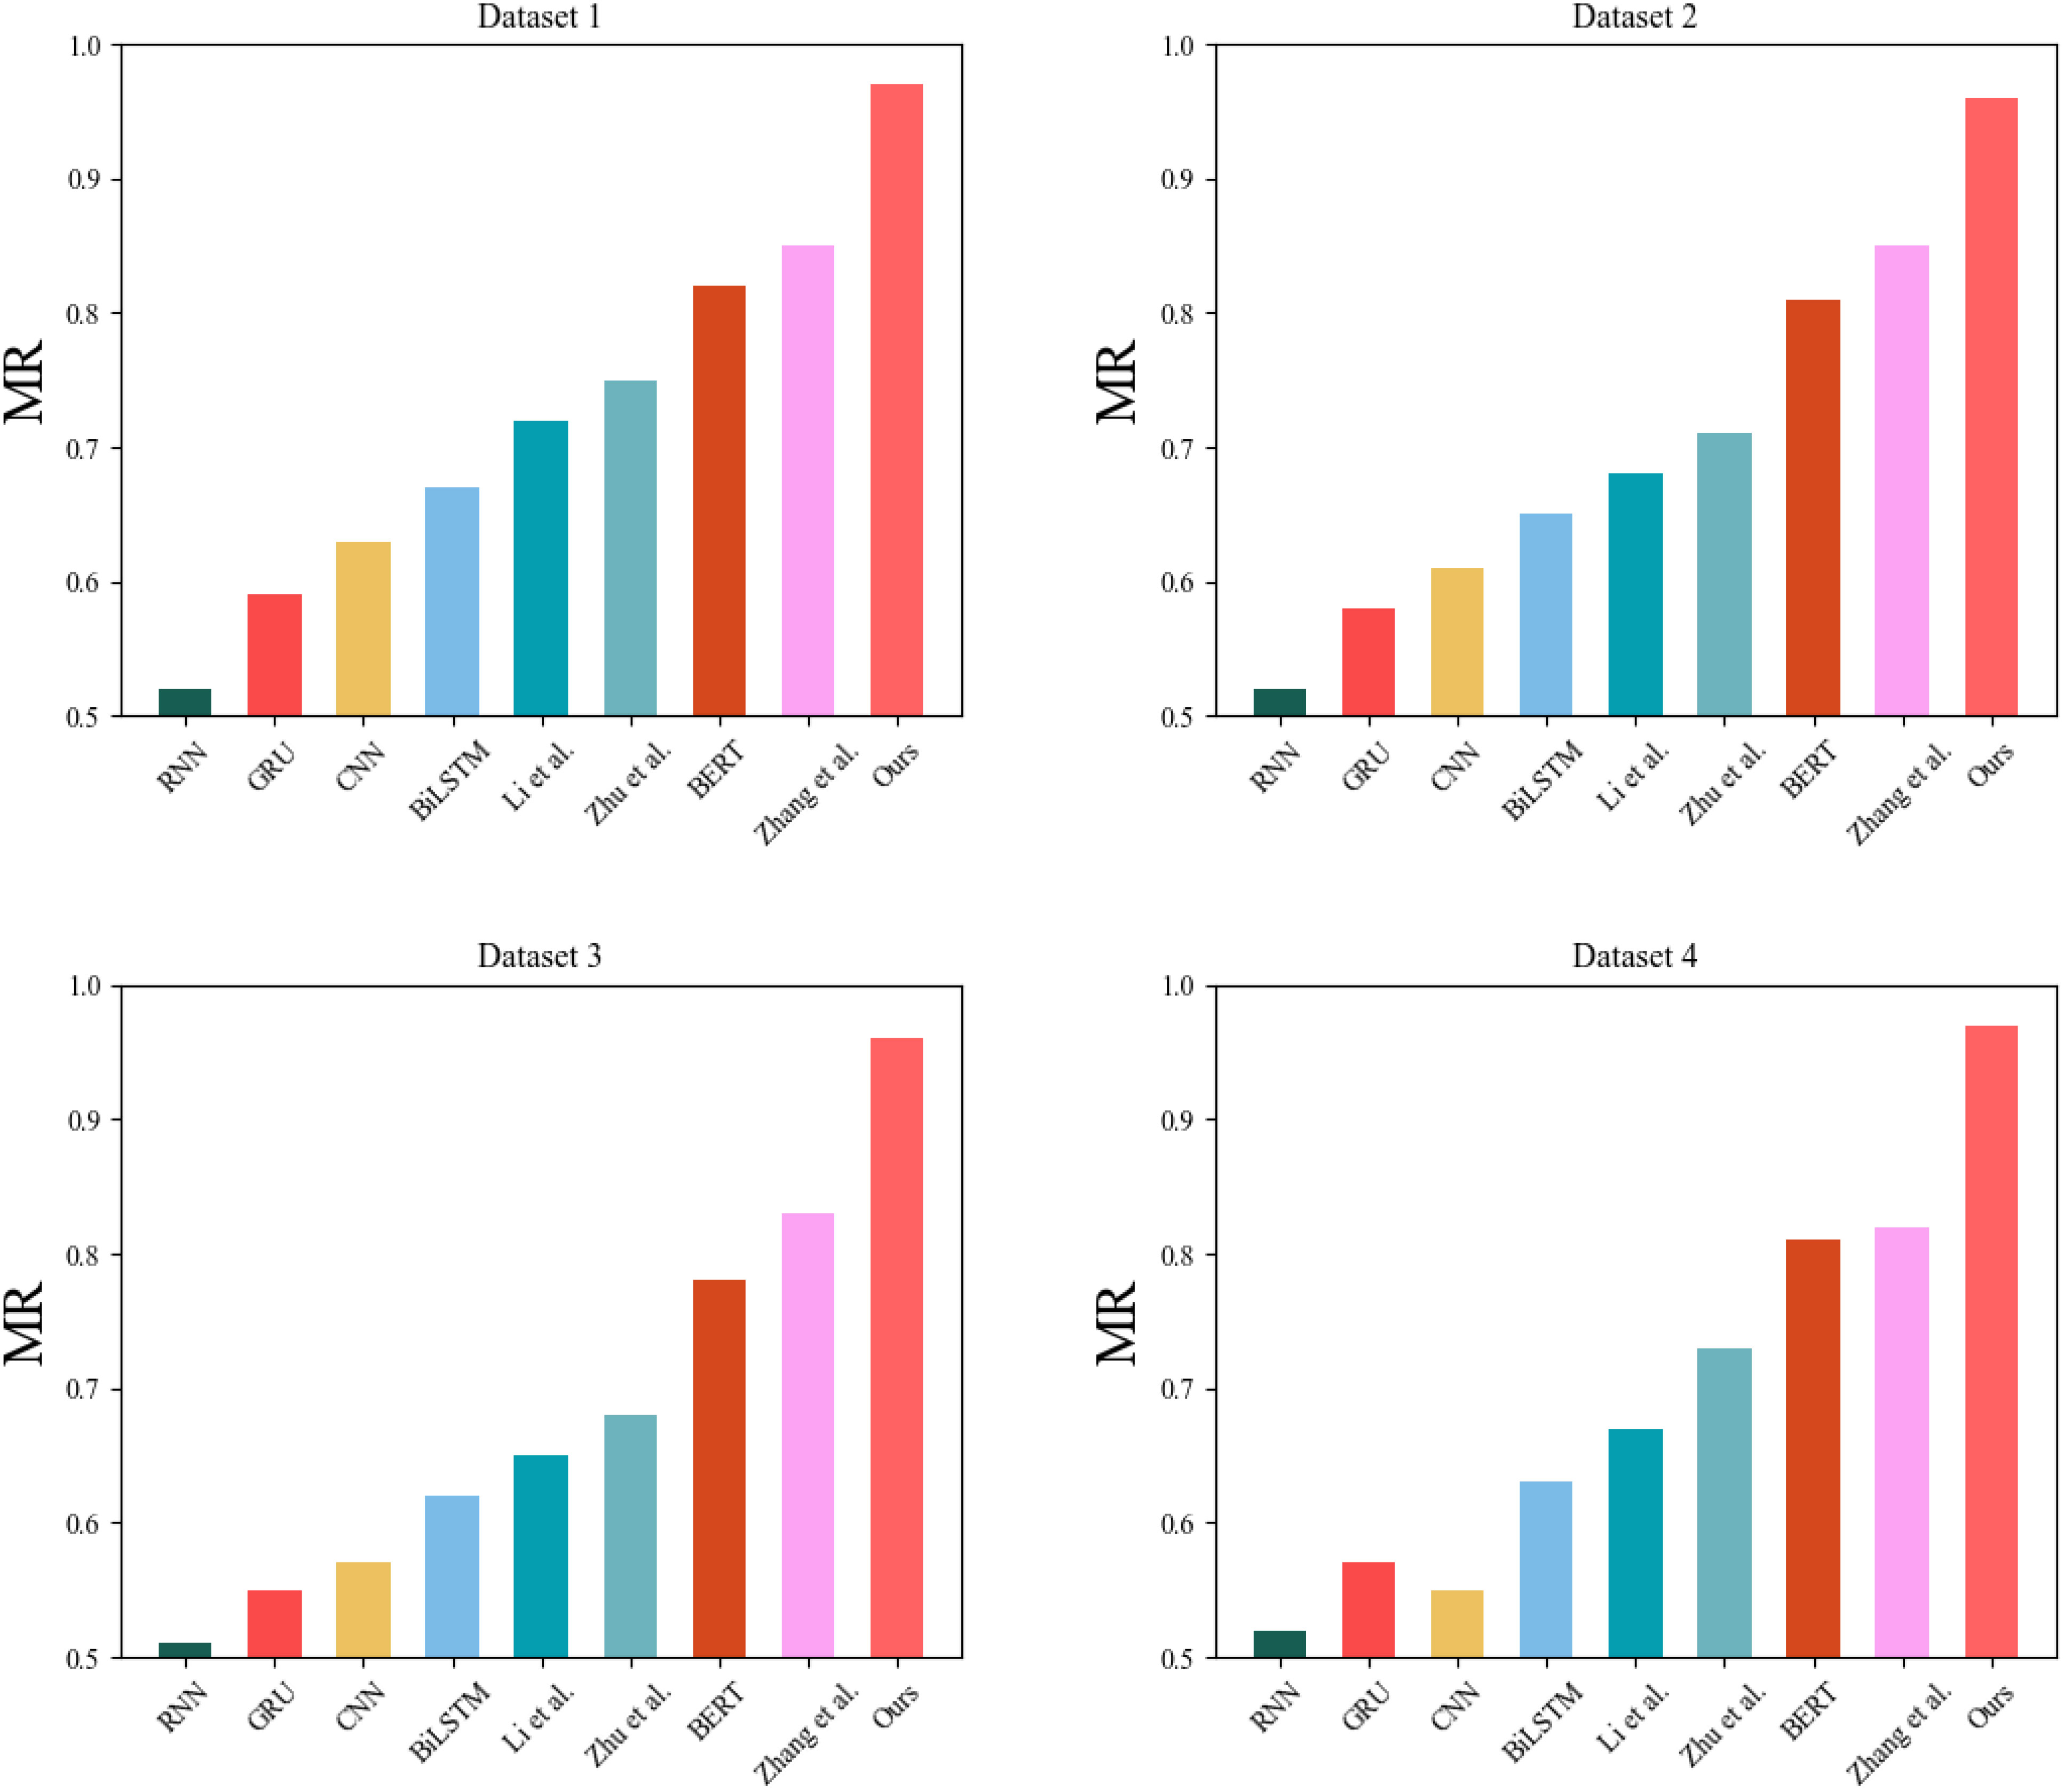
Figure 6 Comparative experimental results of MR indicators for each model.
Table 4 is the general data table for Figures 5, 6. We have selected several important metrics and the best data values for each group of models to visualize the results of our experiments. The bolded parts of the table represent the best data in each group of experiments.
In Figure 7, we have selected two models to compare the Flops and training time on the CDIAC dataset and the UNFCCC dataset, and by visualizing the graphs, we can find that the proposed model has lower Flops and training time than other models. Flops refer to the number of floating-point operations which measures a model’s computational complexity. The lower the flops, the lower the computational complexity of the model, which means that the model requires less computational resources and can complete the inference task in a smaller device or shorter time. Similarly, training time is the time required for model training. If the training time is shorter, the results can be obtained faster and further optimized, so in the carbon-neutral and digital platform economics study in this paper, more research tasks can be completed in the same amount of time, maximizing the digital platform economics conversion. Table 5 shows the visualization of our experimental results.
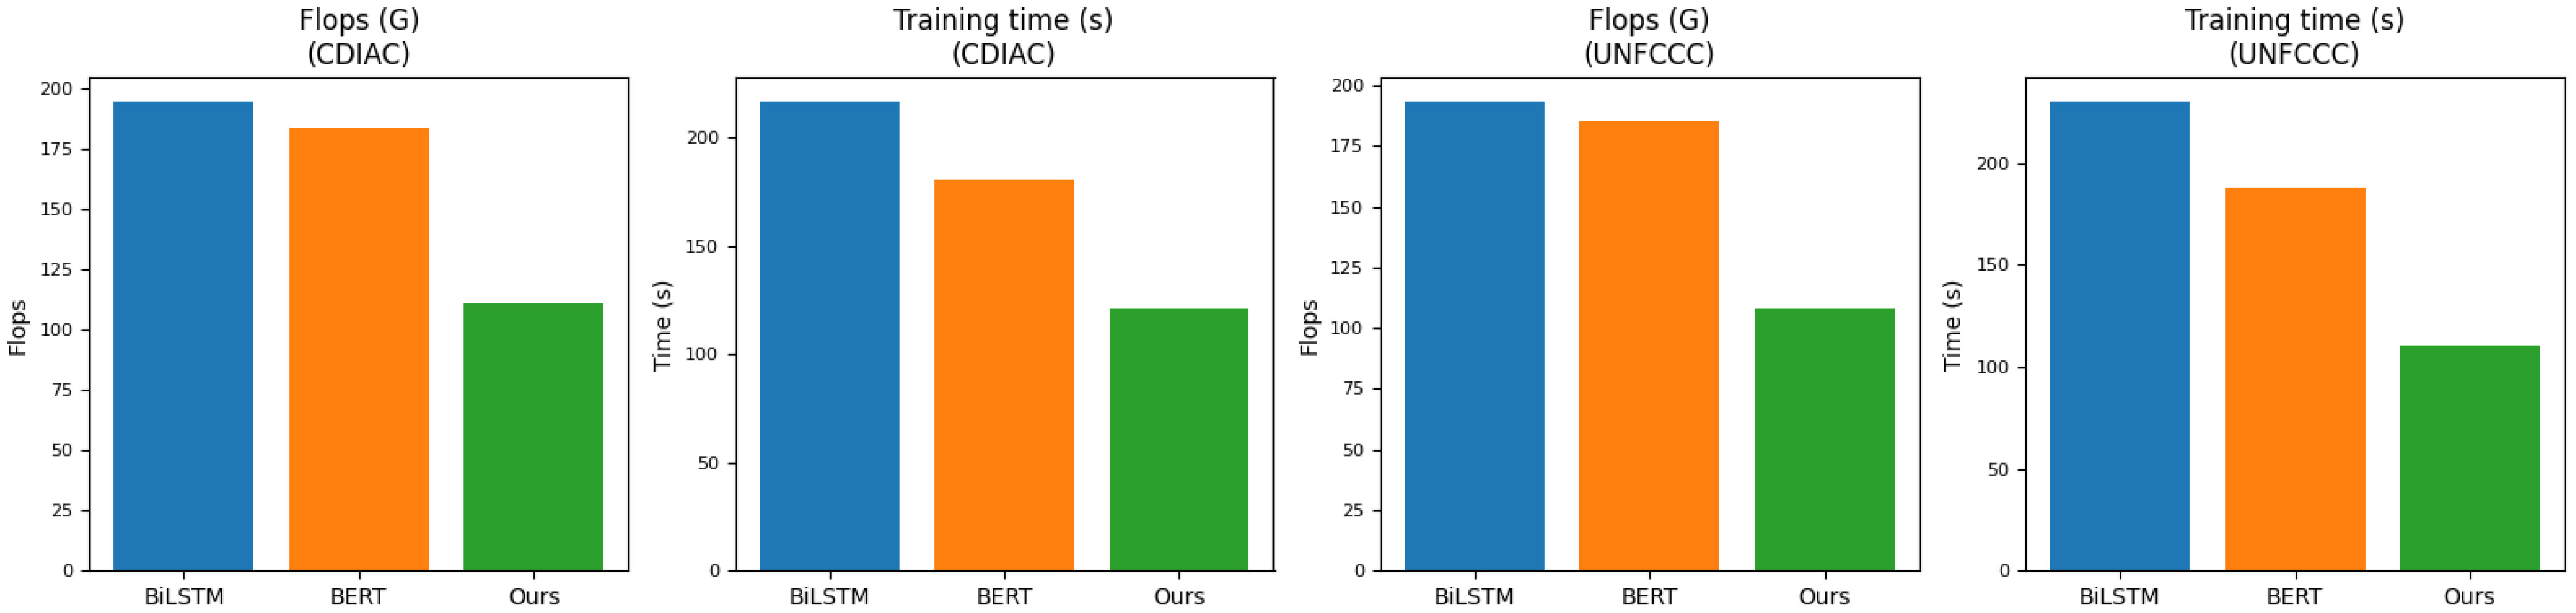
Figure 7 Experimental plots of Flops metrics versus Training time metrics for BiLSTM model, BERT model and our model on CDIAC dataset and UNFCCC dataset.
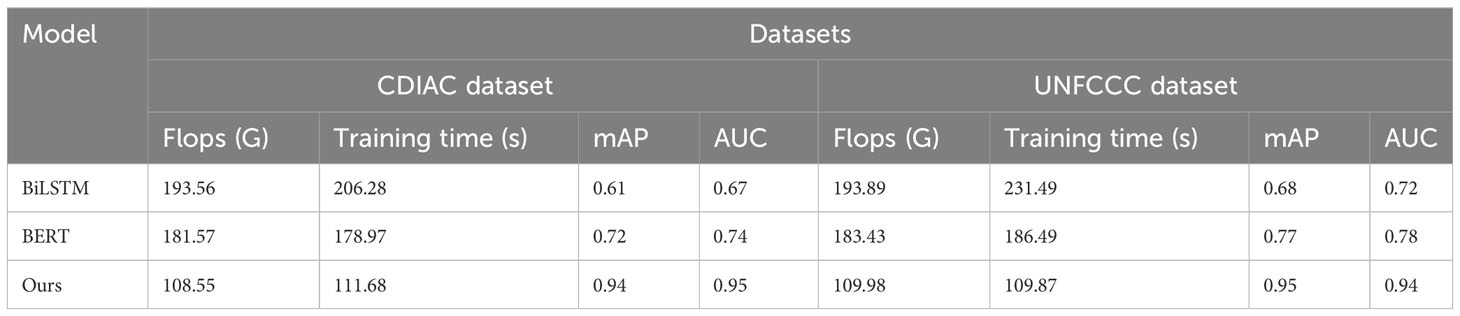
Table 5 Experimental visualization of Flops metrics versus Training time metrics for BiLSTM model, BERT model and our model on CDIAC dataset and UNFCCC dataset.
In Figure 8, the QRCNN, Transformer, and proposed models are selected to conduct experiments on four data sets with the inference time, ROC, and R2-Score indexes. In the study of the economic benefits of carbon-neutral digital platforms, the low inference time means that the model can make predictions and inferences on carbon emission, energy consumption, and economic data faster, which helps decision makers to get the results of the model faster and make a decision and planning faster. In contrast, the high ROC and R2-Score mean that the model can help decision-makers predict future carbon emission, energy consumption, and economic data more accurately, which can provide a reference for decision-makers to make more scientific carbon emission reduction policies or optimize the economic benefits of digital platforms, and help decision makers better achieve carbon neutrality and economic benefits of digital platforms. Table 6 shows the visualization of our experimental results.
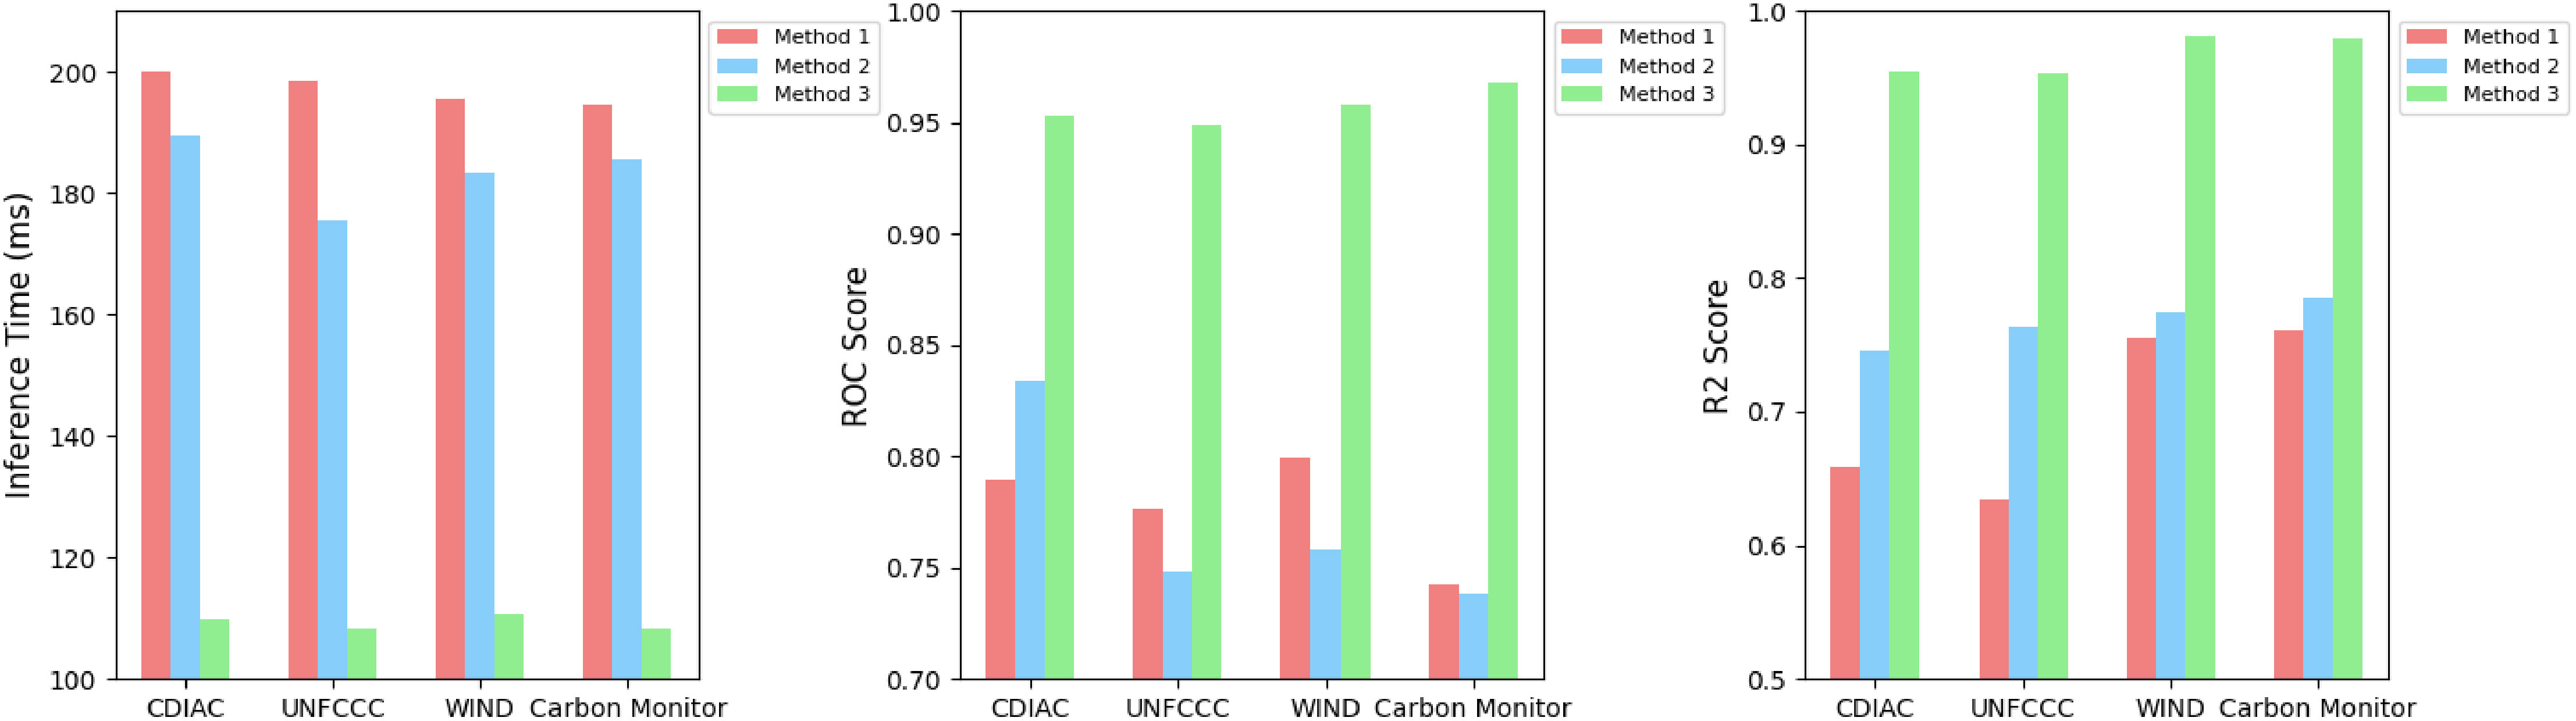
Figure 8 Comparison of inference time metrics, ROC metrics and R2-Score metrics of QRCNN model, Transformer model and our model on WIND dataset, Carbon Monitor dataset, CDIAC dataset and UNFCCC dataset.
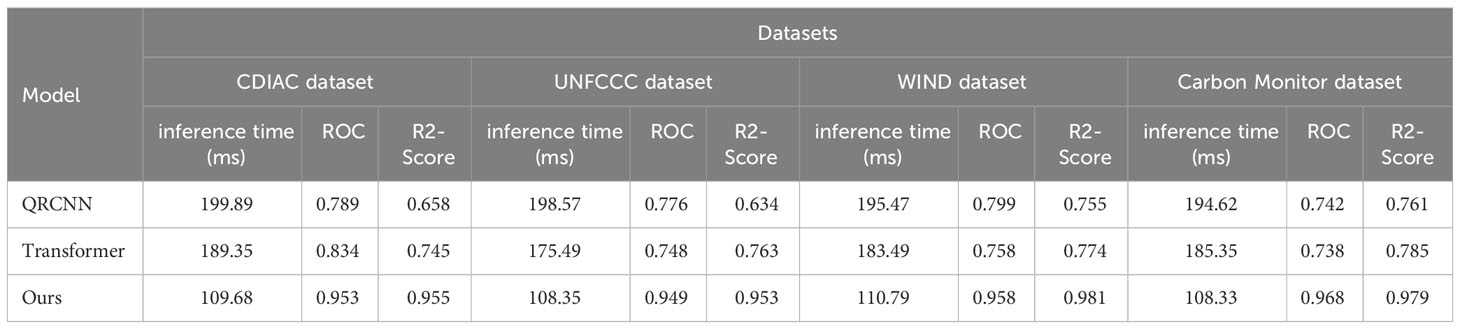
Table 6 Visualization of the inference time metrics, ROC metrics and R2-Score metrics of QRCNN model, Transformer model and our model on WIND dataset, Carbon Monitor dataset, CDIAC dataset and UNFCCC dataset.
5 Results and discussion
In this study, we evaluated and analyzed the economic benefits of carbon-neutral digital platforms by constructing the GPT-QRCNN model. The GPT-QRCNN model, which combines the GPT pre-trained model and the QRCNN model, showed promising results in extracting semantic features from text data and performing classification and prediction. Through comparative tests on four selected databases, we demonstrated the effectiveness and practical value of our model in studying the economic benefits of carbon-neutral digital platforms. Overall, our findings indicate that the GPT-QRCNN model can provide accurate and reliable data support and decision references for enterprises interested in carbon-neutral digital platforms. By understanding and quantifying the economic benefits of these platforms, businesses can make informed decisions and contribute to sustainable development. This research contributes to the growing field of studying the economic implications of carbon-neutral digital platforms.
However, our model still has some shortcomings: First, the GPT-QRCNN model requires a lot of computing resources and time for training and prediction. This may be a big challenge for some small enterprises or research institutions, because they may not be able to afford large-scale computing resources and time costs. In addition, if the model needs to be updated and optimized frequently, it will also increase its computational cost. The GPT-QRCNN model has high requirements for data quality and data diversity. Since the performance of this model is directly affected by the training data, high-quality, diverse datasets are required for training and optimization. If the data quality is not high or the dataset is not diverse enough, it can lead to poor performance of the model.
6 Conclusion
To conclude, our study contributes to the understanding of the economic benefits of carbon-neutral digital platforms through the application of the GPT-QRCNN model. The model’s performance in extracting semantic features and providing accurate predictions can offer valuable data support and decision references for businesses interested in these platforms. By quantifying and examining the economic benefits, organizations can make informed decisions and contribute to sustainable development. We also emphasize the significance of the Carbon Neutral Digital Platform, which combines carbon neutrality and digital technology. Our research not only assesses the commercial value of the platform but also aims to optimize resource allocation, promote the development of the carbon-neutral industry, and advance the concept of carbon neutrality. Furthermore, this study can provide guidance for improving the efficiency and effectiveness of the platform, as well as promote awareness and understanding of carbon neutrality in society. Overall, our research contributes to the growing field of studying the economic implications of carbon-neutral digital platforms. While the GPT-QRCNN model shows promise, we acknowledge the need for further exploration of alternative models that are more practical for real-world applications, considering the resource limitations.
Data availability statement
The original contributions presented in the study are included in the article/supplementary files, further inquiries can be directed to the corresponding author/s.
Author contributions
HY: Conceptualization, Formal Analysis, Funding acquisition, Investigation, Methodology, Project administration, Resources, Software, Supervision, Writing – original draft. XZ: Data curation, Investigation, Project administration, Visualization, Writing – review & editing.
Funding
This research was supported by Key Scientific Research Project of Hunan Provincial Department of Education in 2022: Research on the impact of the development of digital inclusive finance on farmers’ income growth in Hunan Province (22A0702).
Conflict of interest
The authors declare that the research was conducted in the absence of any commercial or financial relationships that could be construed as a potential conflict of interest.
Publisher’s note
All claims expressed in this article are solely those of the authors and do not necessarily represent those of their affiliated organizations, or those of the publisher, the editors and the reviewers. Any product that may be evaluated in this article, or claim that may be made by its manufacturer, is not guaranteed or endorsed by the publisher.
References
Ahunbay M. S., Ashour Novirdoust A., Bhuiyan R., Bichler M., Bindu S., Bjørndal E., et al. (2021). Electricity market design 2030-2050: Shaping future electricity markets for a climate-neutral europe.
Chen X., HU D., Cao W., Liang W., Xu X., Tang X., et al. (2021). Path of digital technology promoting realization of carbon neutrality goal in China’s energy industry. Bull. Chin. Acad. Sci. (Chinese Version) 36, 1019–1029.
Delina L. L. (2023). Fintech re in a global finance centre: Expert perceptions of the benefits of and challenges to digital financing of distributed and decentralised renewables in hong kong. Energy Res. Soc. Sci. 97, 102997. doi: 10.1016/j.erss.2023.102997
Desai K., Dharaskar S., Pandya J., Shinde S., Vakharia V. (2022). Experimental investigation and validation of ultrasound-assisted extractive/oxidative desulfurization of oil using environmentally benign ionic liquid. Process Saf. Environ. Prot. 166, 512–523. doi: 10.1016/j.psep.2022.08.029
Fraga-Lamas P., Lopes S. I., Fernández-Caramés T. M. (2021). Green iot and edge ai as key technological enablers for a sustainable digital transition towards a smart circular economy: An industry 5.0 use case. Sensors 21, 5745. doi: 10.3390/s21175745
Götz T., Berg H., Jansen M., Adisorn T., Cembrero D., Markkanen S., et al. (2022). Digital product passport: the ticket to achieving a climate neutral and circular european economy? (Cambridge: University of Cambridge Institute for Sustainability Leadership).
Jia L., Hu X., Zhao Z., He B., Liu W. (2022). How environmental regulation, digital development and technological innovation affect China’s green economy performance: Evidence from dynamic thresholds and system gmm panel data approaches. Energies 15, 884.
Kang H., Jung S., Lee M., Hong T. (2022). How to better share energy towards a carbon-neutral city? A review on application strategies of battery energy storage system in city. Renewable Sustain. Energy Rev. 157, 112113. doi: 10.1016/j.rser.2022.112113
Kilkis S., Krajačić G., Duićc N., Rosen M. A., Al-Nim M. A. (2020). Advances in integration of energy, water and environment systems towards climate neutrality for sustainable development. Energy Conv. Manag. 225, 1. doi: 10.1016/j.enconman.2020.113410
Komninos N. (2022). Net zero energy districts: Connected intelligence for carbon-neutral cities. Land 11, 210. doi: 10.3390/land11020210
Li Z., Wang J. (2022). The dynamic impact of digital economy on carbon emission reduction: Evidence city-level empirical data in China. J. Cleaner Prod 351, 131570. doi: 10.1016/j.jclepro.2022.131570
Li C., Zhang X. (2022). “Abnormal signal recognition method of wearable sensor based on machine learning,” in IoT and Big Data Technologies for Health Care (Springer), 322–338. doi: 10.1007/978-3-031-33545-7_23
Liao Q., Liang Y., Tu R., Huang L., Zheng J., Wang G., et al. (2022). Innovations of carbon-neutral petroleum pipeline: A review. Energy Rep. 8, 13114–13128. doi: 10.1016/j.egyr.2022.09.187
Liao H.-T., Pan C.-L., Zhang Y. (2023). Smart digital platforms for carbon neutral management and services: Business models based on itu standards for green digital transformation. Front. Ecol. Evol. 11, 1134381. doi: 10.3389/fevo.2023.1134381
Qiao X., Zhao X., Zou J. (2021). Remanufacturing marketing decisions in the presence of retailing platforms in the carbon neutrality era. Int. J. Environ. Res. Public Health 19, 384. doi: 10.3390/ijerph19010384
Sen G., Chau H.-W., Tariq M. A. U. R., Muttil N., Ng A. W. (2022). Achieving sustainability and carbon neutrality in higher education institutions: a review. Sustainability 14, 222.
Torres Cabán C. C., Yang M., Lai C., Yang L., Subach F. V., Smith B. O., et al. (2022). Tuning the sensitivity of genetically encoded fluorescent potassium indicators through structure-guided and genome mining strategies. ACS Sensors 7, 1336–1346. doi: 10.1021/acssensors.1c02201
Vakharia V., Shah M., Nair P., Borade H., Sahlot P., Wankhede V. (2023). Estimation of lithium-ion battery discharge capacity by integrating optimized explainable-ai and stacked lstm model. Batteries 9. doi: 10.3390/batteries9020125
Wang J., Dong K., Wang K. (2023b). Towards green recovery: Platform economy and its impact on carbon emissions in China. Economic Anal. Policy. doi: 10.1016/j.eap.2023.01.004
Wang B., Jiang Z., Cheng D., Wang Z. (2023a). Exploring public attention and sentiment toward carbon neutrality: evidence from chinese social media sina weibo. Front. Psychol. 14, 1200824. doi: 10.3389/fpsyg.2023.1200824
Wen H., Liang W., Lee C.-C. (2023). China’s progress toward sustainable development in pursuit of carbon neutrality: Regional differences and dynamic evolution. Environ. Impact Assess. Rev. 98, 106959. doi: 10.1016/j.eiar.2022.106959
Xing Z., Huang J., Wang J. (2023). Unleashing the potential: exploring the nexus between low-carbon digital economy and regional economic-social development in China. J. Cleaner Prod 413, 137552. doi: 10.1016/j.jclepro.2023.137552
Xu A., Qian F., Ding H., Zhang X. (2023). Digitalization of logistics for transition to a resourceefficient and circular economy. Resour. Policy 83, 103616. doi: 10.1016/j.resourpol.2023.103616
Xu F., Zheng Y., Hu X. (2020). “Real-time finger force prediction via parallel convolutional neural networks: A preliminary study,” in 2020 42nd Annual International Conference of the IEEE Engineering in Medicine & Biology Society (EMBC) (IEEE), 3126–3129. doi: 10.1109/EMBC44109.2020.9175390
You Y., Yi L. (2022). Energy industry carbon neutrality transition path: Corpus-based ahp-dematel system modelling. Energy Rep. 8, 25–39. doi: 10.1016/j.egyr.2022.01.108
Zha Y. (2023). How chinese online media users respond to carbon neutrality: A quantitative textual analysis of comments on bilibili, a chinese video sharing platform. Asian J. Public Opin. Res. 11, 145–162.
Zhang H., Zhang F., Gong B., Zhang X., Zhu Y. (2023). The optimization of supply chain financing for bank green credit using stackelberg game theory in digital economy under internet of things. J. Organizational End User Computing (JOEUC) 35, 1–16. doi: 10.4018/JOEUC.318474
Zhang W., Zhou H., Chen J., Fan Z. (2022). An empirical analysis of the impact of digital economy on manufacturing green and low-carbon transformation under the dual-carbon background in China. Int. J. Environ. Res. Public Health 19, 13192. doi: 10.3390/ijerph192013192
Zhao W., Wu Z., Yin Z. (2021). “Estimation of soil organic carbon content based on deep learning and quantile regression,” in 2021 IEEE International Geoscience and Remote Sensing Symposium IGARSS (IEEE), 3717–3720. doi: 10.1109/IGARSS47720.2021.9553418
Zhu H., Goh H. H., Zhang D., Ahmad T., Liu H., Wang S., et al. (2022a). Key technologies for smart energy systems: Recent developments, challenges, and research opportunities in the context of carbon neutrality. J. Cleaner Prod 331, 129809. doi: 10.1016/j.jclepro.2021.129809
Zhu Z., Liu B., Yu Z., Cao J. (2022b). Effects of the digital economy on carbon emissions: Evidence from China. Int. J. Environ. Res. Public Health 19(9450). doi: 10.3390/ijerph19159450
Zou Z., Careem M., Dutta A., Thawdar N. (2022a). “Unified characterization and precoding for non-stationary channels,” in ICC 2022-IEEE International Conference on Communications (IEEE), 5140–5146. doi: 10.1109/GLOBECOM48099.2022.10001662
Keywords: GPT, QRCNN, carbon neutral, digital platform economic benefits innovation, sustainable development
Citation: Yang H and Zhou X (2023) Study on the economic benefits of carbon-neutral digital platforms for sustainable development based on the GPT-QRCNN model. Front. Ecol. Evol. 11:1263799. doi: 10.3389/fevo.2023.1263799
Received: 20 July 2023; Accepted: 22 August 2023;
Published: 10 October 2023.
Edited by:
Praveen Kumar Donta, Vienna University of Technology, AustriaReviewed by:
Yassine Himeur, University of Dubai, United Arab EmiratesVinay Vakharia, Pandit Deendayal Petroleum University, India
Copyright © 2023 Yang and Zhou. This is an open-access article distributed under the terms of the Creative Commons Attribution License (CC BY). The use, distribution or reproduction in other forums is permitted, provided the original author(s) and the copyright owner(s) are credited and that the original publication in this journal is cited, in accordance with accepted academic practice. No use, distribution or reproduction is permitted which does not comply with these terms.
*Correspondence: Huifang Yang, eWFuZ2h1aWZhbmcwMEBvdXRsb29rLmNvbQ==