- 1Forest College, Shanxi Agricultural University, Jinzhong, Shanxi, China
- 2College of Urban and Rural Construction, Shanxi Agricultural University, Jinzhong, Shanxi, China
The urban heat island (UHI) effect has intensified with increases in impervious surface areas and population densities due to urbanization, which affects the quality of urban life and ecological services. Here, the Moran’s I and hot spot analysis (Getis-Ord Gi*) are used to explore spatial autocorrelation of land surface temperature (LST) in Taiyuan built-up area. Then, the built-up area is divided to 41 sub-areas to accurately explore the urban LST differences caused by different LULC types. Moreover, geographically weighted regression (GWR) is used to analysis the spatial heterogeneity of LST. Finally, we simulate the LST changes using the CA-Markov model in the study area in the year 2030. Our results showed that 1) average LST was 22.76°C in Taiyuan built-up area in 2018. The Highest-temperature areas were distributed in heavy-industry intensive areas in the north, north central, and southeast, whereas the Lowest-temperature areas mainly corresponded to rivers, lakes, urban forests, and green spaces. 2) The Moran’s I gradually decreased from 0.8635 to 0.2097 with an increase in the spatial distance threshold. The optimal recognition effect was obtained at a 400 × 400-m scale. The Getis-Ord Gi* analysis indicated that the cold area was 1248.32 km2 (12.24% of the study area) and the hot area was 43.84 km2 (11.11% of the study area) in 2018. 3) The GWR analysis showed significant spatial non-stationarity in the influence of LULC types on LST. The GWR model was calculated with reference to the observation values of the adjacent areas, so as to better reveal the spatial relationship between artificial surface, woodland, water, grassland, and bare land and LST. 4) The UHI distribution was more concentrated in 2030 than in 2021. The statistics of the proportion and transfer matrix of LST indicated that the proportion of the Highest and Lowest-temperature areas in 2030 decreased and the UHI effect will further intensify. This study could be used to guide sustainable development in cities and provides theoretical support for adjusting the urban spatial structure.
1 Introduction
Climate change is widely recognized as the main factor affecting environmental changes (Jiang et al., 2021). However, these changes have overlooked the effects of human activities, which has irreversibly led humans to alter or exploit their surroundings actively (Alavipanah et al., 2022). With intensifying urbanization and continuously expanding urban hard landscapes, problems such as water pollution (Chen et al., 2023), changes in carbon stock (Sun et al., 2023), and destruction of ecological balance (Lin et al., 2023). The urban heat island (UHI) effect is becoming increasingly serious owing to global warming and human activities (Mohan and Kandya, 2015; Kim and Brown, 2021), which is influencing vegetation productivity in cities (Jia et al., 2018), land surface phenology (Qiu et al., 2020), and human survival in the 21st century (Ward et al., 2016; Manoli et al., 2019). Accordingly, clarifying the spatiotemporal variation characteristics of the thermal environment, revealing its formation mechanism, and suggesting adaptive countermeasures are core topics in research on climate change and urbanization.
The term UHI effect is interpreted as the phenomenon of urban air temperature and land surface temperature (LST) being higher than the temperature in surrounding rural areas (Stewart, 2011). Since 19th century, most scholars have focused on the changes in thermal environment and using LST to indicate the thermal environment (Kafy et al., 2021). Studies have showed that meteorological conditions, urban spatial morphology, underlying surface characteristics, and anthropogenic heat emissions influence the LST (Allegrini and Carmeliet, 2017; Sekertekin and Zadbagher, 2021). Reductions in green space and water area, weakening of air flow, and substantial heat storage strongly influence the surface energy balance and increase the UHI effect intensity (O’Malley et al., 2015). However, changes in the landscape pattern of land use/land cover (LULC) are recognized as the main driving factor of the urban thermal environment (Yang et al., 2017; Li et al., 2021). Such changes induce the conversion of LULC types such as cultivated land, wetland, and forest to construction land, and bare land (Liang et al., 2023), and lead to uneven distribution of latent heat fluxes from solar radiation (Oke, 1982). Investigating the relationship between LST and LULC can improve the understanding of the spatial characteristics of the UHI effect under different LULC types. Such research provides a theoretical basis for urban construction and maintenance of the ecological environment from the perspective of the UHI effect. The general understanding of the response relationship between LULC types and LST mainly includes two aspects: 1) artificial surface types (e.g., construction land, roads, and traffic) are concentrated and distributed widely, often forming high temperature areas, whereas areas with dense natural surface types (e.g., water and vegetation) have a significant cooling effect (Cui et al., 2021); 2) change of LULC types due to urban expansion is a crucial aspect that exacerbates the change in LST (Firozjaei et al., 2020). Although LULC types can reveal the spatial distribution characteristics of the thermal environment to some extent, each LULC type has spatial heterogeneity and substantial internal temperature differences, which cannot fully reveal the changes in spatial pattern of the LST. In addition, the crucial land dynamic process, which could significantly contribute to the increase in LST and aggravation of the UHI effect, remains poorly understood.
In recent years, thermal infrared remote sensing has been able to simultaneously obtain a large range of LST, compensating for the relatively coarse spatial information of traditional discrete temperature observation data and gradually becoming the choice of many urban ecologists (Li et al., 2013; Ren et al., 2016; Cristóbal et al., 2018). Landsat satellite has the advantages of high spatial resolution and long observation time series, with nearly 40 years of observation data. Its spectral information is rich and the thermal infrared band is relatively sensitive to the thermal information of ground objects. Therefore, the Landsat images have become a widely used data source in the study of UHI effect. Jiménez-Muñoz et al. (2014) reported that the single-channel algorithm can obtain accurate LST results when the atmospheric water vapor contents retain a low value. Yu et al. (2014) found that the LST inverted from the radiative transfer equation (RTE) using Band 10 of Landsat-8 has the highest accuracy compared with other algorithms. Thus, the RTE algorithm can be widely used to retrieve the LST (Yu et al., 2017; Yu et al., 2018). Moreover, to better understand the future development of the thermal environment, many prediction methods, such as boundary layer numerical models based on thermodynamics and dynamics (Chen et al., 2016), hydrodynamic computational fluid dynamics technology (Su et al., 2014), artificial neural networks (ANN) (Zhang et al., 2021), coupled ANN with cellular automata (CA) (Zhang et al., 2023), and CA-Markov model (Amir Siddique et al., 2021), are proposed. However, the CA-Markov model is more effective in projecting short-term values over a large area and predicting multi-directional changes (Wang and Zheng, 2022). In previous studies, most of the predictions seldom account for the results of spatial autocorrelation of LST and complexity of LULC types and functional composition. Therefore, the prediction results have some limitations, and it is inaccurate to illustrate the change of urban thermal environment spatial.
Taiyuan is a traditional heavy-industrial city in northern China where economic development and rapid urbanization have led to the destruction of urban ecological balance. In the present study, the built-up area of Taiyuan City was selected as the research object. We used the Moran’s I and hot spot analysis to explore spatial autocorrelation of LST. And then, the built-up area was divided to 41 sub-areas and geographically weighted regression (GWR) are used to analysis the spatial heterogeneity of LST. We determined the parameters and weights that were needed in CA-Markov model according to the previous results. Finally, we accurately simulated and predicted the distribution of LST in 2030.
2 Materials and methods
2.1 Study area
Taiyuan is located in the eastern part of the Loess Plateau. It is a famous historical and cultural city in China, a Chinese garden city, and a core city in Taiyuan metropolitan area. The Fen River passes through the central area from north to south (Figure 1). The city is surrounded by mountains on three sides, and the central and southern parts are the alluvial fan plain of the Fen River (Ma et al., 2022). The city is affected by a monsoon climate, with hot summers and cold and dry winters. It has an annual average temperature of 10.6°C. The local economy is supported by coal mines, chemical industry, metallurgy, and machinery.
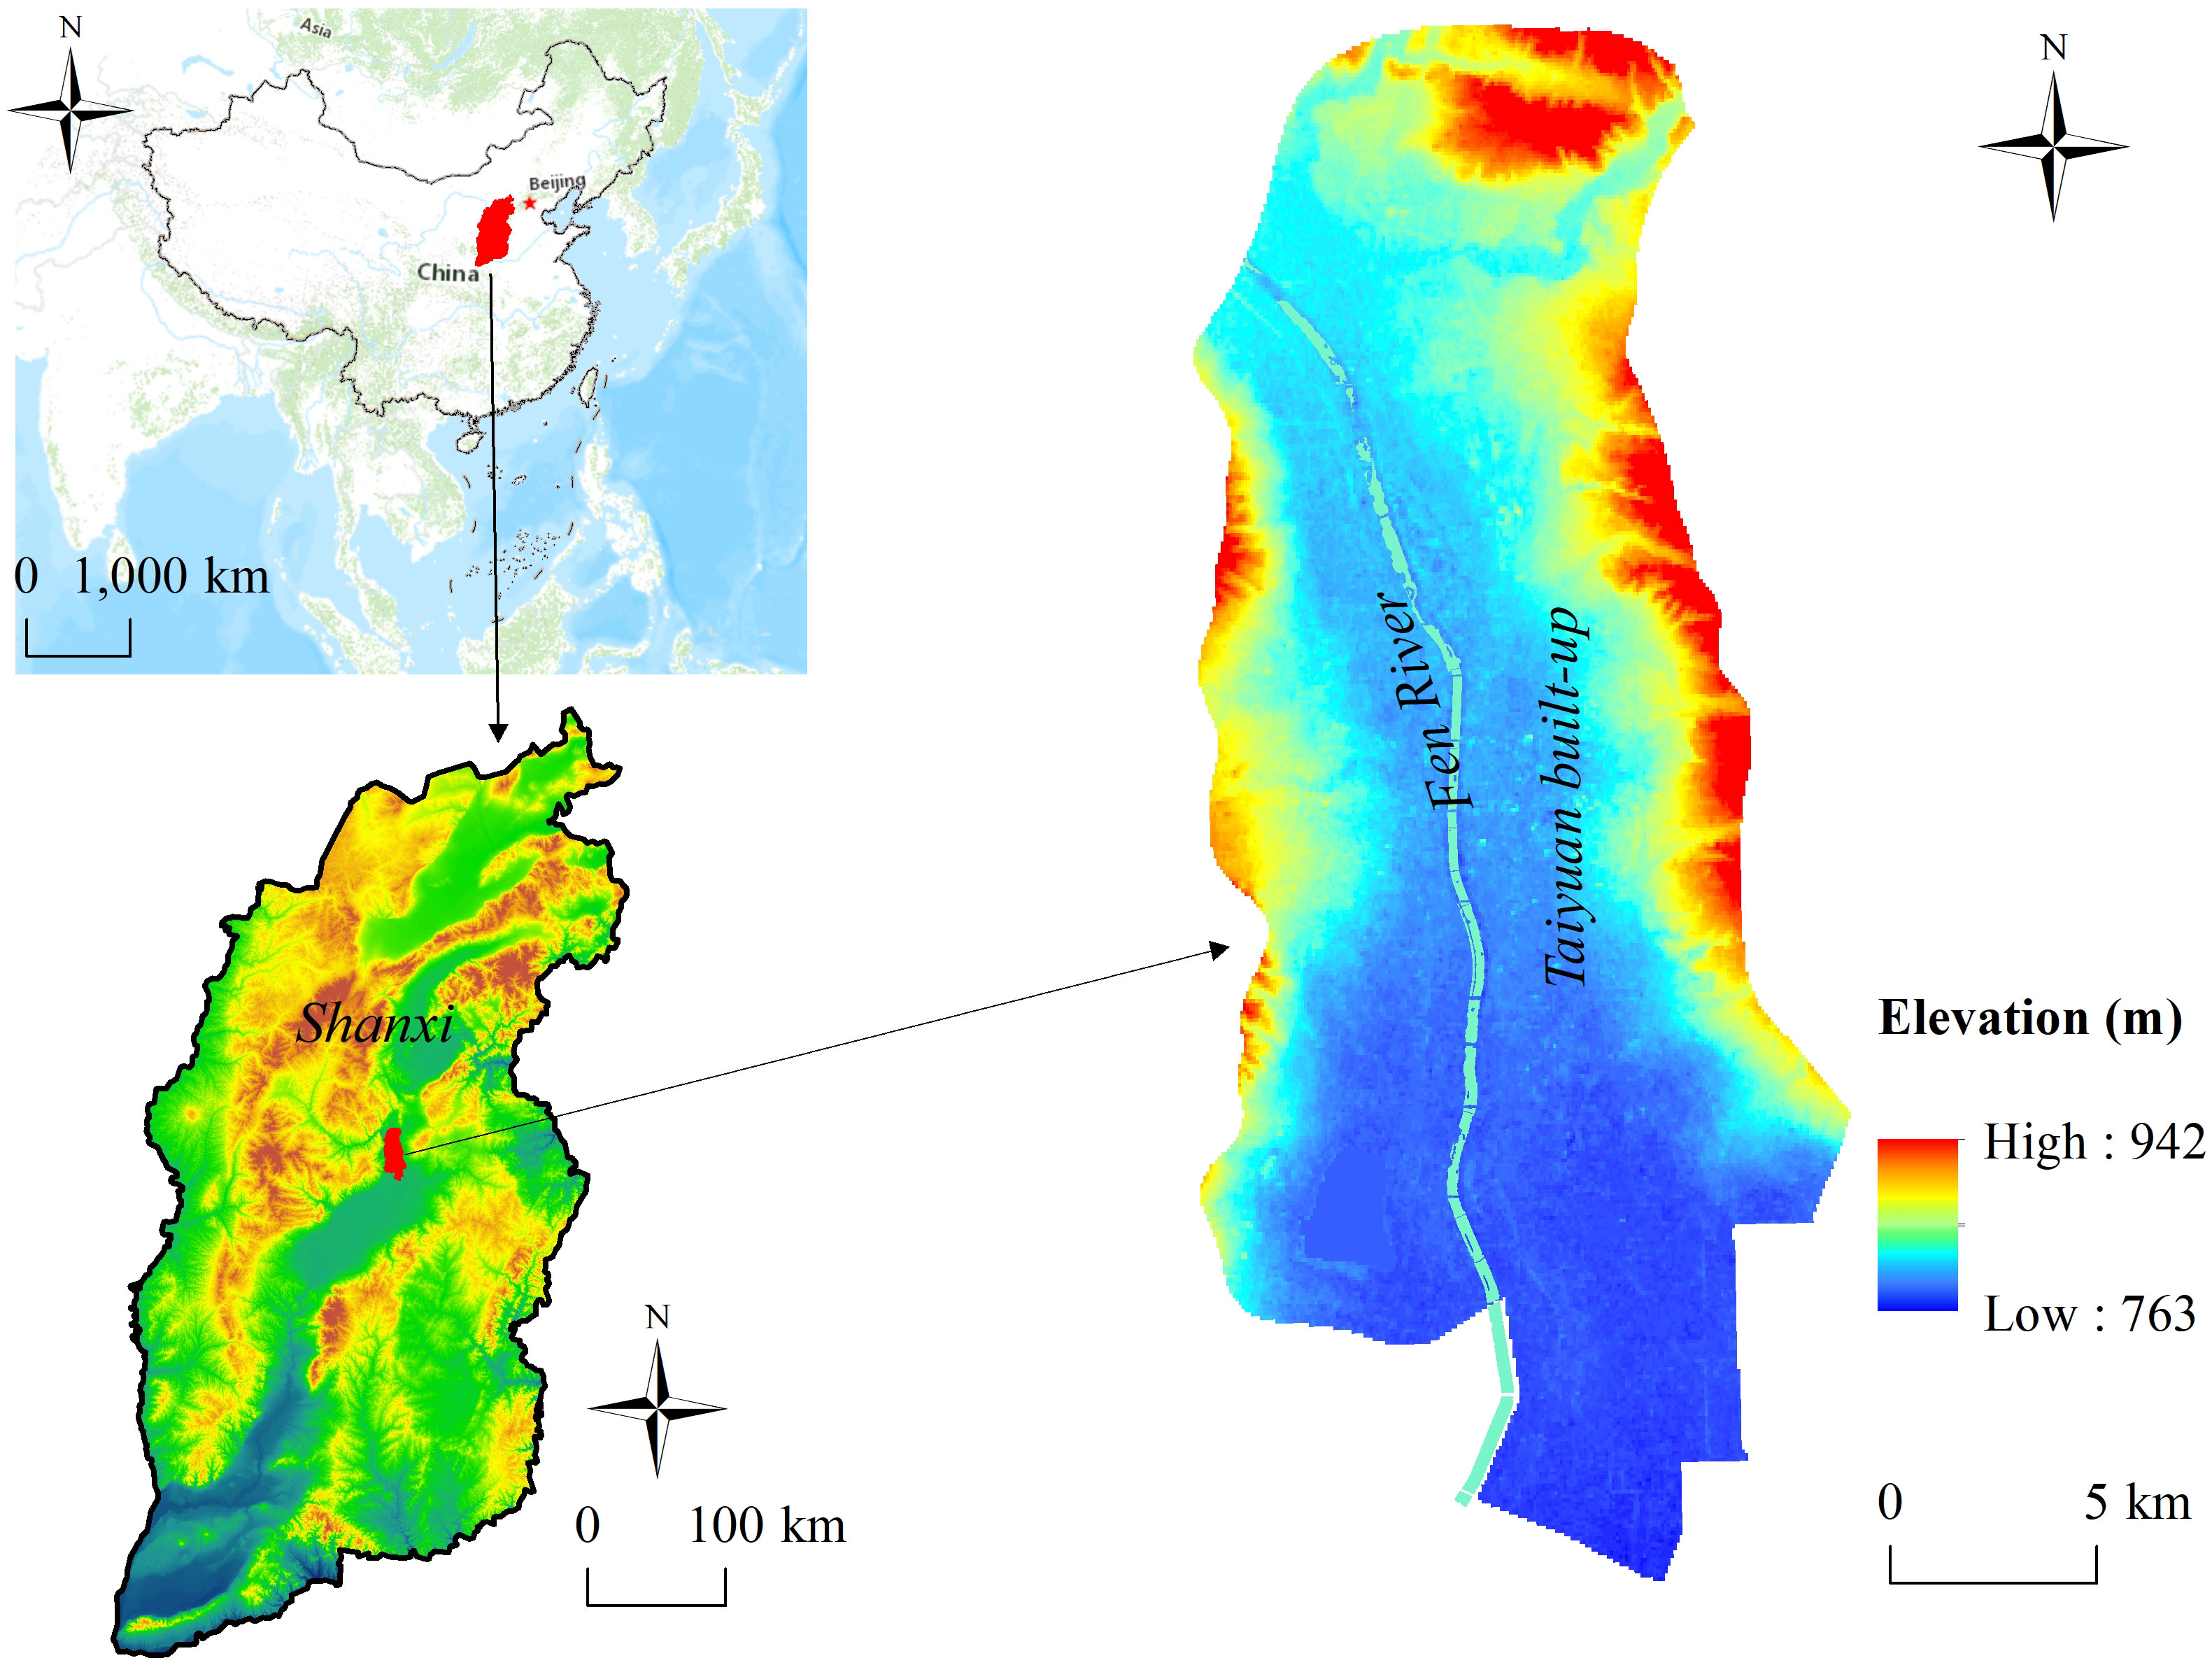
Figure 1 Location of Taiyuan built-up area in Shanxi Province, China. Fen River passes through the built-up area from north to south.
Urbanization has exacerbated urban ecological damage problems in Taiyuan (Qiao et al., 2023) such as soil erosion, air pollution, the UHI effect, etc. In the present study, the built-up area, where there is the highest population density, the highest degree of urbanization, the largest construction scale, and the most prominent UHI effect problem, was selected as the research object. The north, east, and west sides of the built-up area surrounded by expressway, and the south includes a concentrated industrial and building-intensive area in the Xiaodian District.
2.2 Data collection
To study the characteristics and evolution rules of the thermal environment in the central urban area of a city, it is preferable to select the data during the high temperature period in summer. However, cloud cover and precipitation in summer can impact the surface temperature, and also significantly impact the data quality of remote sensing images, which cannot be used for research. Therefore, based on the study of the climate characteristics of Taiyuan City, images with low cloud cover, good imaging quality, and no precipitation on summer were selected as the basic data for the study (Table 1). Landsat-8 OLI/TIRS images from 2015 to 2021 were used to retrieve the LST. Two scenes of high-resolution images (GF-2) in 2018 were required for complete coverage of the study area and were used for LULC classification. The preprocessing process of data mainly includes image cropping, radiometric calibration, atmospheric correction, and image fusion.
2.3 Method
2.3.1 Analytical steps
Firstly, the spatial autocorrelation of LST is analyzed by Moran’s I, local indicators of spatial association (LISA) and hot spot analysis (Getis-Ord Gi*). In addition, combined with the LULC types extracted from GF-2 images in 2018, the spatial heterogeneity of LST and the relationship with LULC types were revealed by ordinary least square (OLS) and geographically weighted regression (GWR). Finally, we use Landsat images in 2015, 2018 and 2021 to simulate and predict the characteristics of LST in 2030 by CA-Markov model (Figure 2).
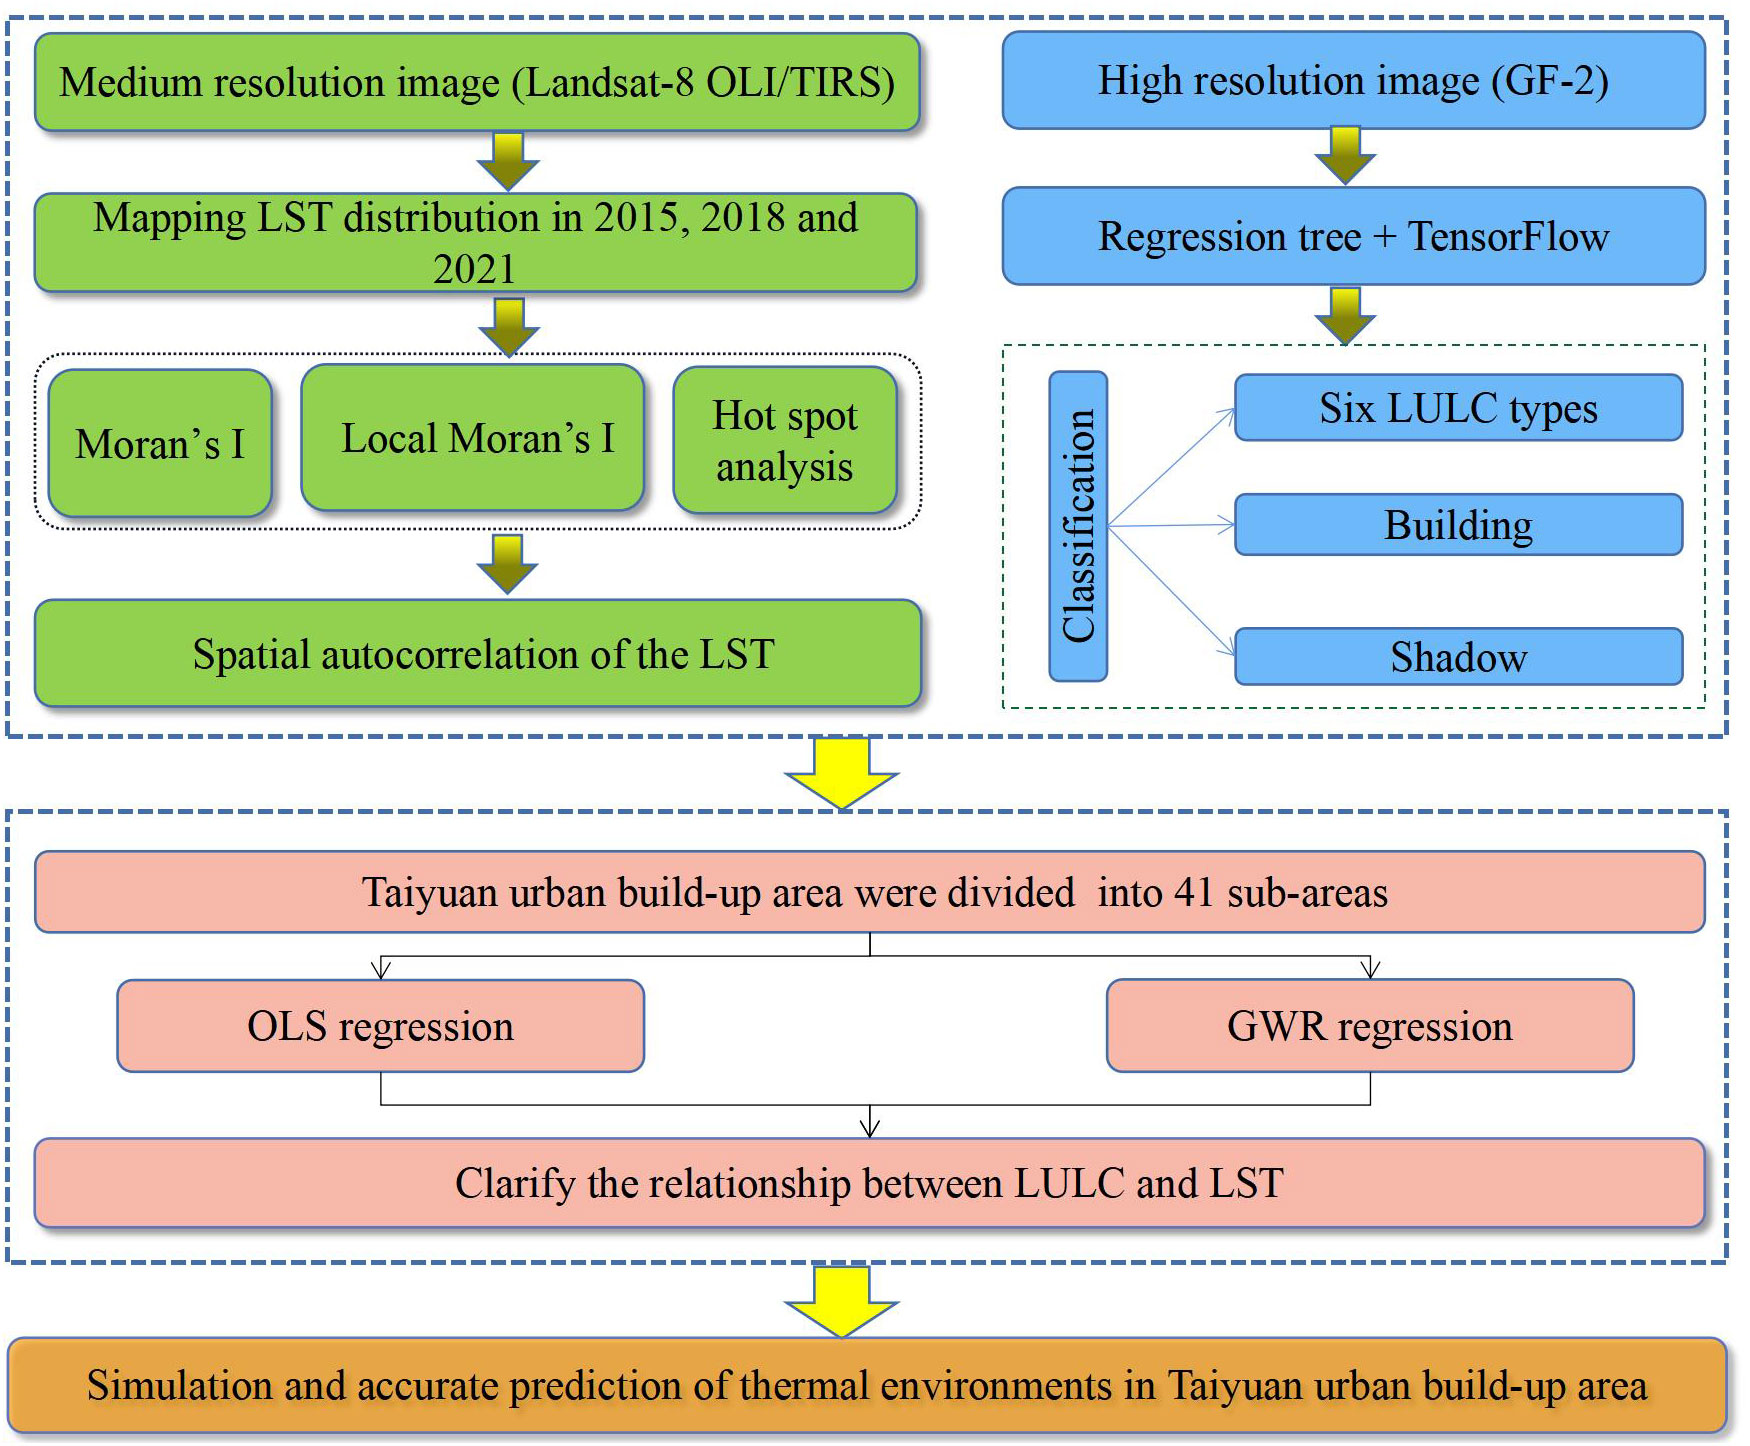
Figure 2 Analytical steps. LULC, land use/land cover; LST, land surface temperature; OLS, ordinary least square; GWR, geographically weighted regression; LISA, local indicators of spatial association.
2.3.2 LST analysis
The LST was retrieved by the radiative conduction equation method (Jiménez-Muñoz et al., 2014). First, we estimated the influence of the atmosphere on surface thermal radiation. The atmospheric influence was then subtracted and the surface thermal radiation intensity (STRI) was obtained. Finally, the STRI was converted into the corresponding LST (Yu et al., 2018). The RTE is:
where Lλ is the thermal infrared radiation brightness value received by the satellite sensor, Lup is the atmospheric upward radiation brightness, Ldown is the atmospheric downward radiation brightness, ε represents the specific emissivity of the surface, Ts is the real temperature of the urban surface (K), B(Ts) is the black body thermal radiation brightness (Wm−2sr−1μm−1), and τ presents the atmospheric transmittance in the thermal infrared band.
According to Plank’s law, B(Ts) can be expressed as Eq. (2).
Here, Lup, Ldown, and τ data were obtained from http://atmcorr.gsfc.nasa.gov.
The normalized difference vegetation index (NDVI) threshold method proposed by Sobrino et al. (1991) was used to calculate the ε, and the calculation formula is:
where NDVI is the normalized vegetation index, NDVISoil is the NDVI value of the area completely in a bare soil state or without vegetation coverage, NDVIVeg is the NDVI value for soil completely covered by vegetation, ρNIR is the near-infrared band, and ρRED is the infrared band.
After estimating B(Ts), the real ground temperature Ts was obtained according to Eq. (6).
where K1 = 774.89 mWm−2sr−1μm−1 and K2 = 1321.08 K.
2.3.3 Classification method
Usually, threshold segmentation, region growth segmentation, pixel-based classification, object-oriented classification, and deep learning approaches are used in remote sensing information extraction and classification. Among them, deep learning method has become an important research tool of artificial intelligence, in which the samples are selected in advance and the model parameters are continuously updated and iterated, the target features can be automatically learned to identify the target object (Zou et al., 2022). In this study, we divided six LULC types by the regression tree method (Qian et al., 2014): grassland, woodland, cultivated land, water area, artificial surface, and bare land. In addition, careful comparison of the ground object distribution and inversion temperature indicated that the temperature of the building and its shadow differed significantly from that of the surrounding space. Therefore, buildings and shadows were extracted using TensorFlow deep learning classification (Hanni, 2019). Through the field accuracy random sampling survey, the correct rate reached 87.2%.
2.3.4 LST spatial analysis
We selected global spatial autocorrelation (GSA) and the local spatial autocorrelation method to explore the spatial distribution of LST (Zhang et al., 2022). The Getis-Ord Gi* was used to improve identification of the areas where heat and cold islands occurred. We identified the statistically significant hot and cold spots, revealed significant clusters of high and low LST values in the study area, and determined the distribution of cold and hot spots. The Moran’s I and Local Moran’s I exponents of different distance thresholds of LST were calculated using the free and open-source software Geoda (Anselin et al., 2010). This method is referred to as the local indicators of spatial association (LISA) (Anselin, 1995). The Getis-Ord Gi* exponents were calculated using ArcGIS 10.8 software.
2.3.5 Analysis of the influence mechanism of LULC to LST
Based on OLS analysis, we integrated the geographical location and spatial weight attributes of data into the regression analysis process, constructed a GWR model between LULC types and LST, and discussed the spatial non-stationarity of the effect of LULC changes on LST at the 41 sub-areas. The OLS is as following:
where yi is the dependent variable of point i, β0 is the intercept, xik presents the kth independent variable at point i; k is an independent variable to count; βk is the regression coefficient of the kth independent variable, and εi is the residual error.
The GWR model introduces the geographical location into the regression parameters, considering the local effect of spatial objects. Therefore, it is an effective method to quantitatively study spatial non-stationarity (Fotheringham et al., 1998). The formula is:
where yi is the matrix of interpreted variables, (ui,vi) is the spatial location of the i sampling point, βk(ui,vi) is the kth regression parameter at sampling point i, and (u,v) is a continuous function. The βk(ui,vi) function is:
where XTW(ui,vi) represents the distance weight matrix, Wij is the Gaussian function formula in the weight function of the GWR model, h represents the bandwidth, and is the distance between observation points j and i. In this study, we used the Akaike information criterion (AIC) to determine the bandwidth:
where σ presents the standard deviation of the estimated value of the error term. Different bandwidths are introduced into the formula, and the selection of the optimal model bandwidth occurs at the minimum AIC value. The weight of the data beyond the range of bandwidth from the regression analysis point is 0.
2.3.6 CA-Markov simulation
In the CA-Markov model, the continuous time state is regarded as a random process. The initial state and transition probability between different states are analyzed to determine the change trend and law of the research object. The equation is:
where St is the state of LST at t moment, St+1 is the state of LST at t+1 moment, and Pij is the transition probability matrix.
The specific steps of CA-Markov simulation prediction are:
(1) Transition probability matrix
In our study, LST data of 2015 and 2018 were standardized, and the different temperature ranges were unified to the range from 0–1. The LST was classified using the medium error method. In order to improve the accuracy of LST identification, seven grades (Lowest, Lower, Low, Medium, High, Higher, and Highest) were classified in this study (Qiao et al., 2014). The standardized formula is:
where NLST represents the surface temperature of pixel i after standardized processing, Ti is the primitive surface temperature of the pixel, and Tmax and Tmin are the highest and lowest LST values, respectively.
(2) Suitability atlas
In this study, the transformation rules were formulated artificially using the multi-criteria evaluation (MCE) module in IDRISI17.0 soft. The MCE model consists of two parts, namely constraints and influence factors. The suitability evaluation index and weight were determined based on the results of Moran’s I, LISA, Getis-Ord Gi*, and GWR analysis.
(a) Determination of suitability evaluation index
The suitability evaluation indicators were LULC types, NDVI, building, industrial storage area, water system distance, distance from industrial storage, park, and water area. Park, water, building, and industrial storage area were corresponding to the constraints factors of the Lowest, Lower, Higher, Highest areas, respectively. No constraints factors were set in Low, Medium, and High-temperature areas.
(b) Determination of weight of influence factors
Influence factors for the Lower temperature areas were the NDVI, LULC types and the water system distance, for which weights were assigned as 0.4, 0.4, and 0.2, respectively, according to their contribution rate to the LST characteristics. The influence factors of the Higher temperature areas were the LULC types, NDVI, and the distance from the industrial storage area, with set weights of 0.4, 0.4, and 0.2, respectively.
(c) Suitability atlas
According to the index system, the ordered weighted average method is used for the suitability atlas in the MCE module of IDRISI 17.0.
(3) Accuracy verification
The simulation results in 2021 are compared with the real LST in 2021 cell by cell, and the cell accuracy is calculated.
(4) Simulation and prediction
Using the 2021 image as the basis, a new transition probability matrix and suitability atlas were introduced to obtain the simulation results of the study area in 2030.
3 Results and analysis
3.1 Spatial characteristics of LST in Taiyuan urban built-up area
The result of LST in 2018 showed a maximum value of 40.27°C, minimum value of 9.50°C, and a mean value of 22.76°C (Figure 3). There are two large High-temperature areas, namely Taiyuan Iron and Steel Group Co., Ltd. in the north-central part of the study area, and Taizhong Coal Machinery Industrial Park, Taizhong Railway Industrial Park, and Foxconn Industrial Park in the southeast. whereas low temperature areas mainly corresponded to rivers, lakes, urban forests, and green spaces. Water bodies have a large heat capacity and low thermal conductivity, making them the main components of urban cold islands. Jinyang Lake has a large water area and significant low temperature performance. Fenhe River runs through the entire research area from north to south, thus exhibiting a linear distribution of low temperature areas. In addition, park green spaces with water bodies also exhibit a certain degree of low temperature characteristics. The average LST of different LULC types was in the following order: artificial surface > bare land > grassland > cultivated land > woodland > water area. Among them, the average LST of artificial surface was 23.18°C, followed by that of bare land was 22.86°C.
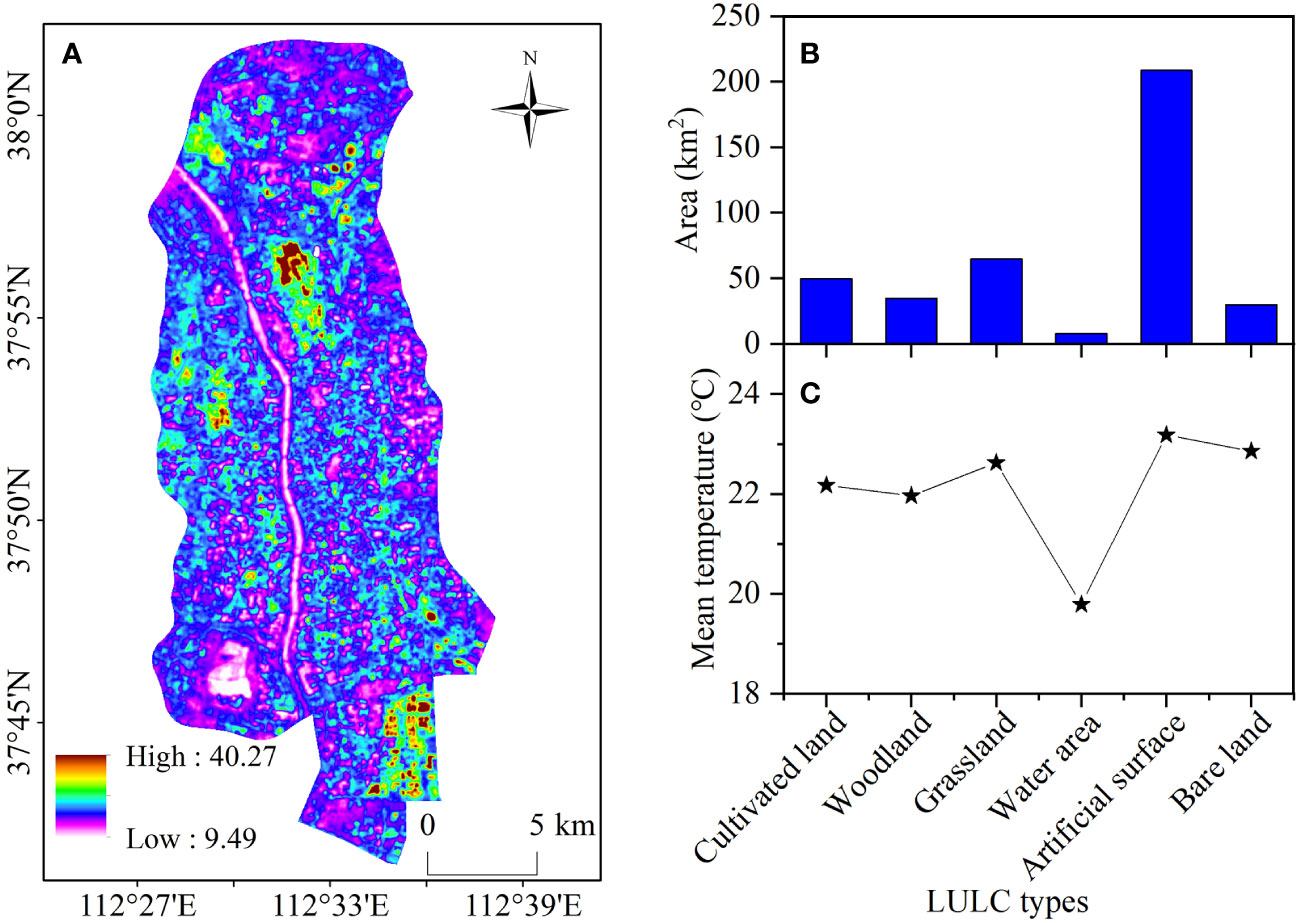
Figure 3 The characteristics of LST distribution. (A) Inversion results of LST in 2018. (B) Areas of different LULC types. (C) Mean temperature in different LULC types.
From 2015 to 2018, the proportion of Medium-temperate areas increased from 46.20% to 52.72% (Figure 4A), mainly transferred from the Low-, High-, and Higher-temperature areas, with an area of 32.10 km2, 29.91 km2, and 12.11 km2, respectively (Figure 4B). The proportion of the Low-temperature areas has increased from 14.66% to 17.11%, mainly transferred from the High-, Medium-, and Lower-temperature areas, with an area of 5.83 km2, 27.65 km2, and 11.83 km2, respectively. The proportion of the High-temperature areas has decreased from 14.29% to 10.38%, mainly transitioning to the Medium-temperature areas, with an area of 29.91 km2.
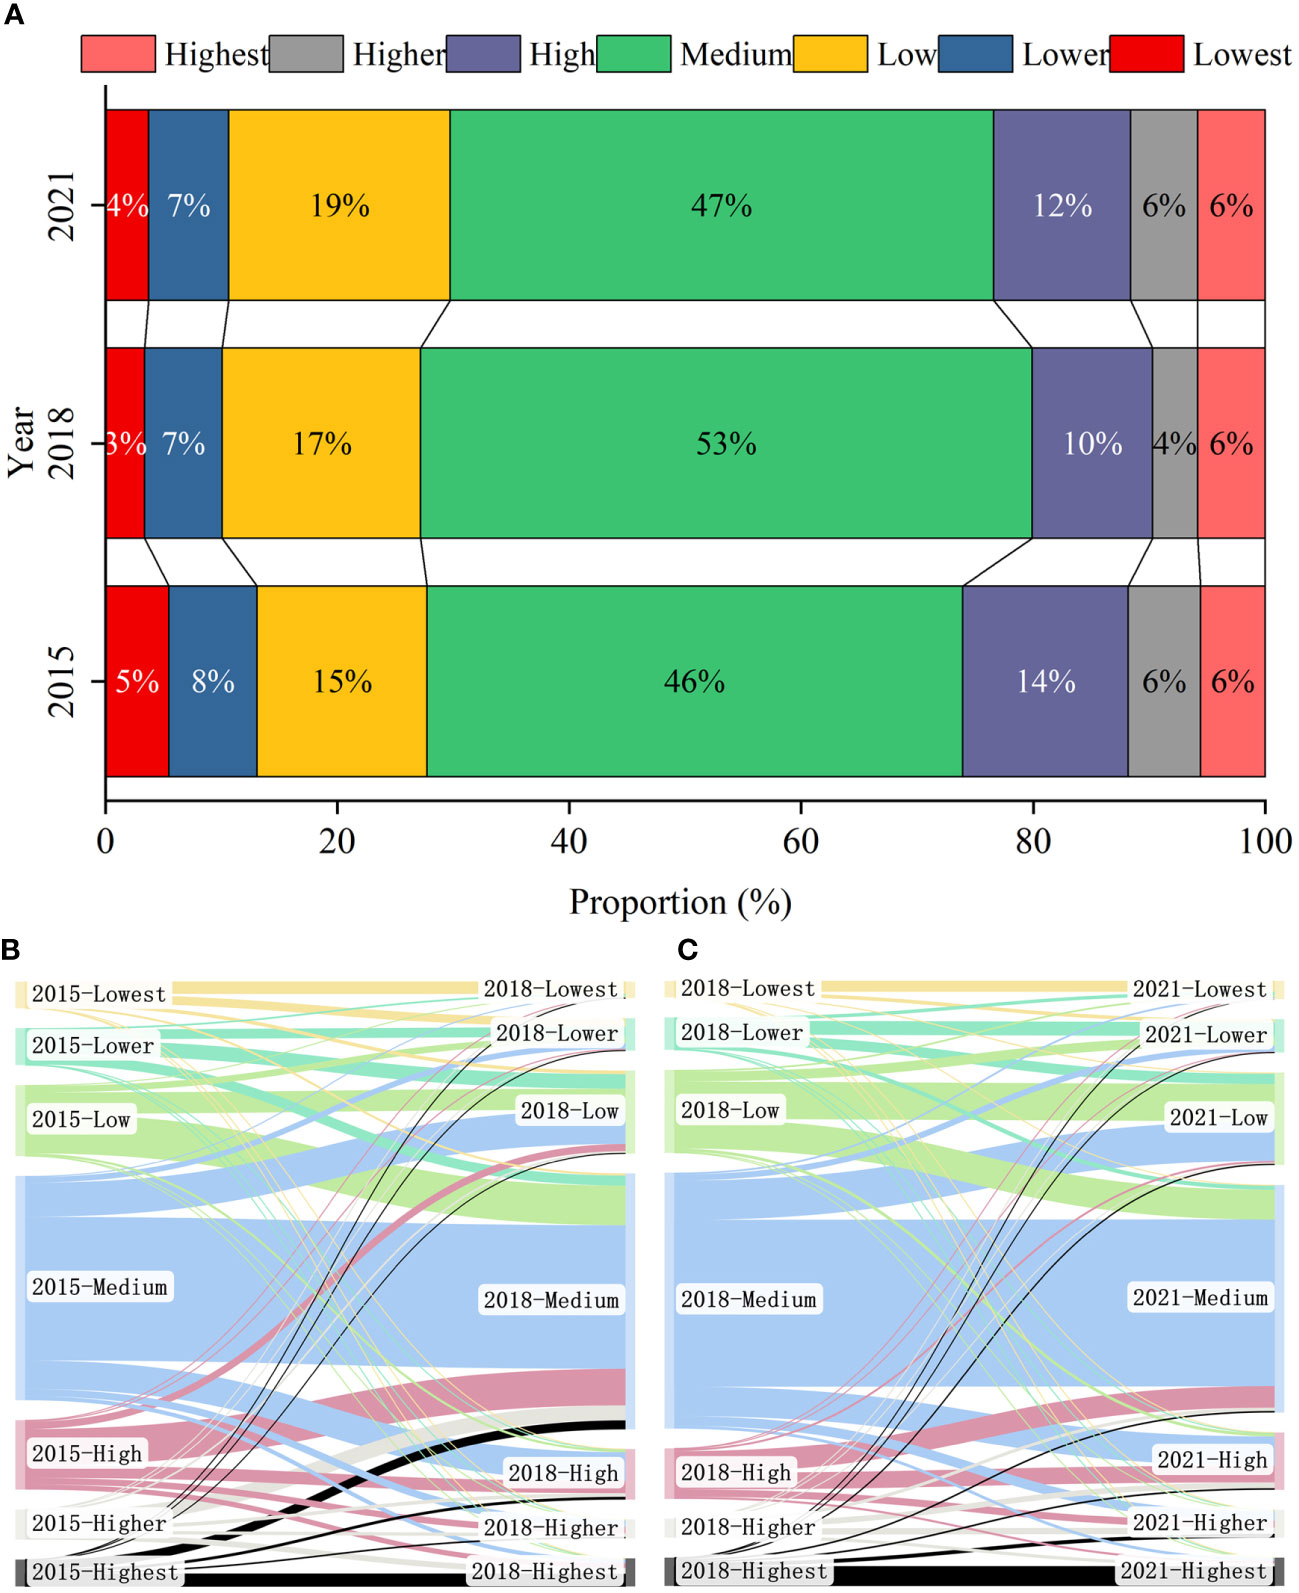
Figure 4 Spatial Characteristics of LST in Taiyuan Urban Built-up Area. (A) Proportion of different LST grades in 2015, 2015, and 2021. (B) Transition Matrix of different LST grades from 2015 to 2018. (C) Transition Matrix of different LST grades from 2018 to 2021.
From 2018 to 2021, the proportion of the Medium-temperature areas decreased from 52.72% to 46.87% (Figure 4A), mainly transformed into the Low- and High-temperature areas, and the transformed areas were 32.08 km2 and 23.90 km2, respectively (Figure 4C); the proportion of the Low-temperature areas increased from 17.11% to 19.09%, mainly from the Medium-temperature areas. The Higher-temperature areas increased from 3.90% to 5.77%, mainly from the Medium-, High-, and Highest-temperature of Moran’s I area, with the areas of 7.86 km2, 5.87 km2, and 3.16 km2, respectively.
3.1.1 Morans’ I analysis
According to the first Law of Geography, the similarity of things gradually decreases with an increase in distance. Accordingly, a spatial weight matrix must be established for spatial autocorrelation analysis. This study established spatial weights for distances of 100, 200, 400, 1000, and 2000 m. The Moran’s I, based on different distance thresholds, revealed a strong spatial positive correlation of the LST distribution in 2018 (Z-score>2.58; P<0.001) (Table 2). The distribution heterogeneity of LST was significant at five different weight matrix scales. The spatial distance threshold increased, and the Moran’s I gradually decreased from 0.8635 to 0.2097, indicating that the aggregation of the LST distribution decreased with an increase in the spatial weighted distance threshold.
3.1.2 LISA analysis
Identification of the specific location of spatial aggregation and spatial anomaly distribution of data in each temperature zone can be improved with LISA analysis. The LISA distribution of the temperature partition data on each unit grid is drawn by the GeoDa software platform (Anselin et al., 2010). Figure 5 reflected the specific location and scale of the spatial aggregation and abnormal characteristics of the LST in Taiyuan urban built-up area in 2018. The H-H clustering areas were mainly artificial surface and bare land; whereas the L-L clustering areas were mainly where water bodies and green land were located. The performance of the H-L clustering area and L-H clustering area were more prominent that ccould intuitively identify the local “heat island” presented by the impermeable surface in the green space or the typical local “cool island” corresponding to the green space distributed in large-scale residential areas. The comparative analysis of the LISA aggregation maps of five weight scales showed that the identification effect was the best at the scale of 400 m × 400 m.
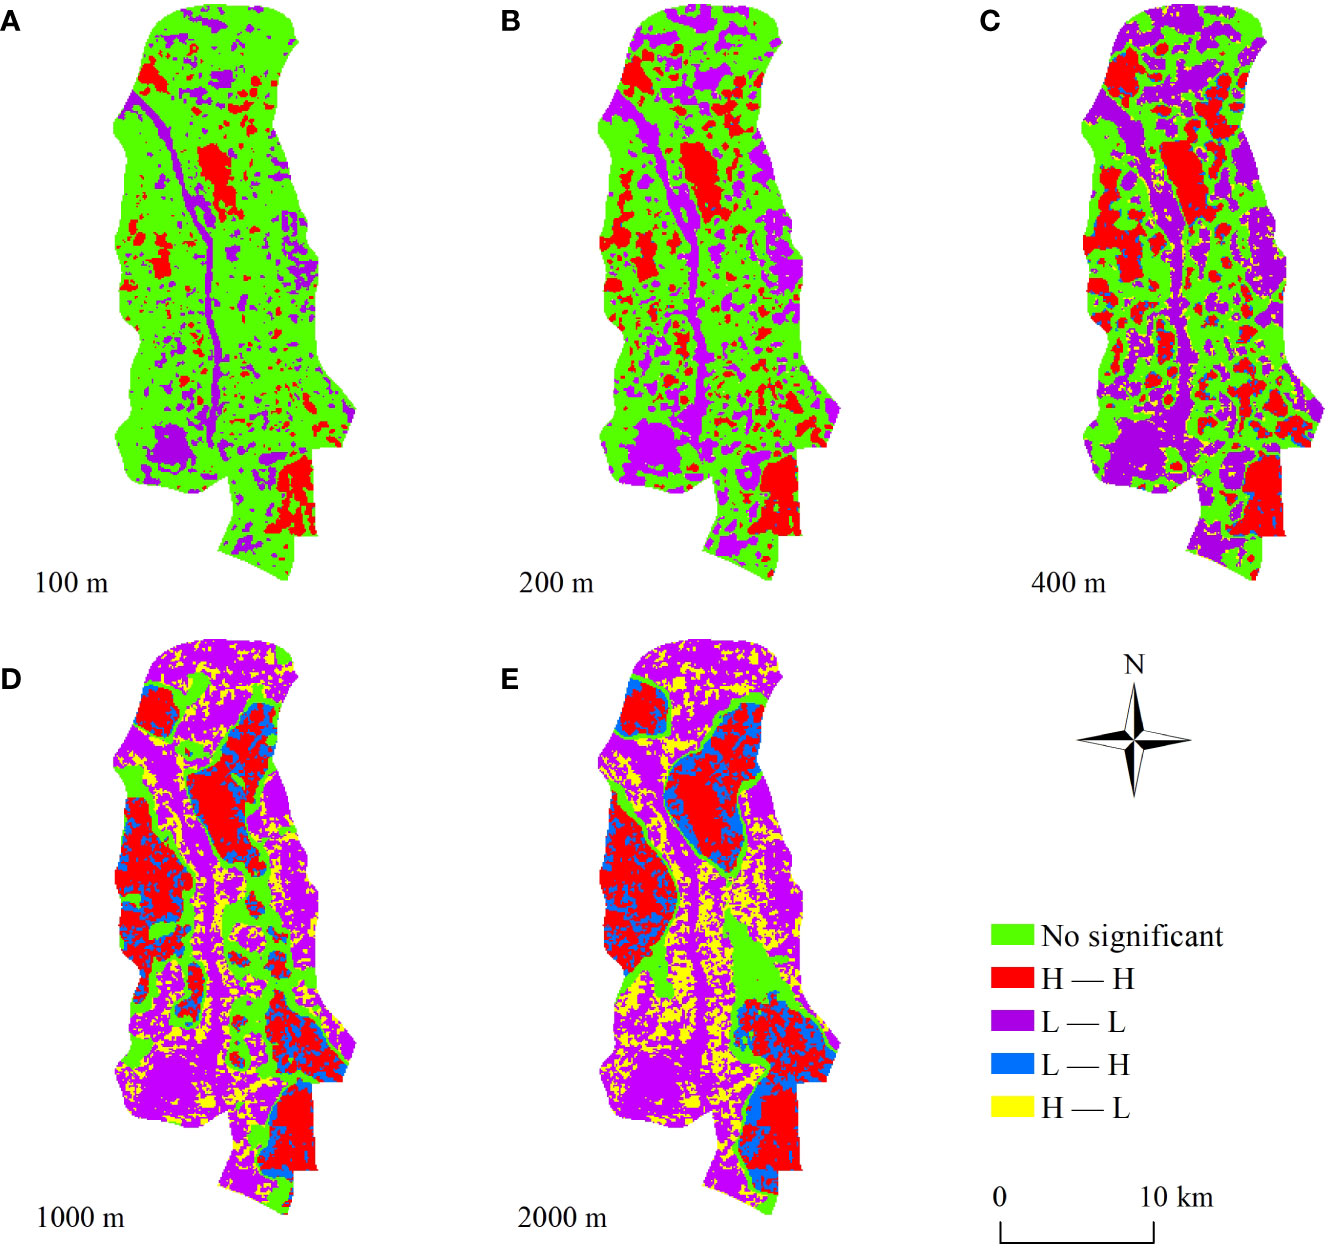
Figure 5 Local spatial autocorrelation cluster diagrams of LST in 2018. Spatial weights for distances of (A) 100 m, (B) 200 m, (C) 400 m, (D) 1000 m, and (E) 2000 m.
3.1.3 Hot spot analysis
Compared with LISA analysis, Getis-OrdGi* analysis is more sensitive to weights and can identify statistically significant hot spots and cold spots. As shown in Figure 6, the distributions of hot and cold spots were generally scattered. Hot spots were mainly distributed in areas with frequent industrial production activities, such as Taiyuan Iron and Steel Group Co., Ltd. and Taizhong Industrial Park, as well as areas with high intensity of high-speed rail and railway lines, warehousing, logistics and commercial operation; cold spots were mainly distributed in urban water bodies such as Fenhe River, Jinyang Lake, Zoo, Longtan Park, marginal woodland and various types of green spaces and parks. Thus, the contribution rate of green space, water body and woodland to the cold spot of LST was high, while the contribution rate of buildings and other impervious surface to the hot spot of LST was high. At the 99% confidence level, the cold area was 48.32 km2, accounting for 12.24% of the study area, that of the hot area was 43.84 km2, accounting for 11.11% of the study area. Monitoring and evaluating the distribution and impact of urban cold and hot spots in the Taiyuan urban build-up area has important scientific significance for improving the microclimate and ecological environment quality.
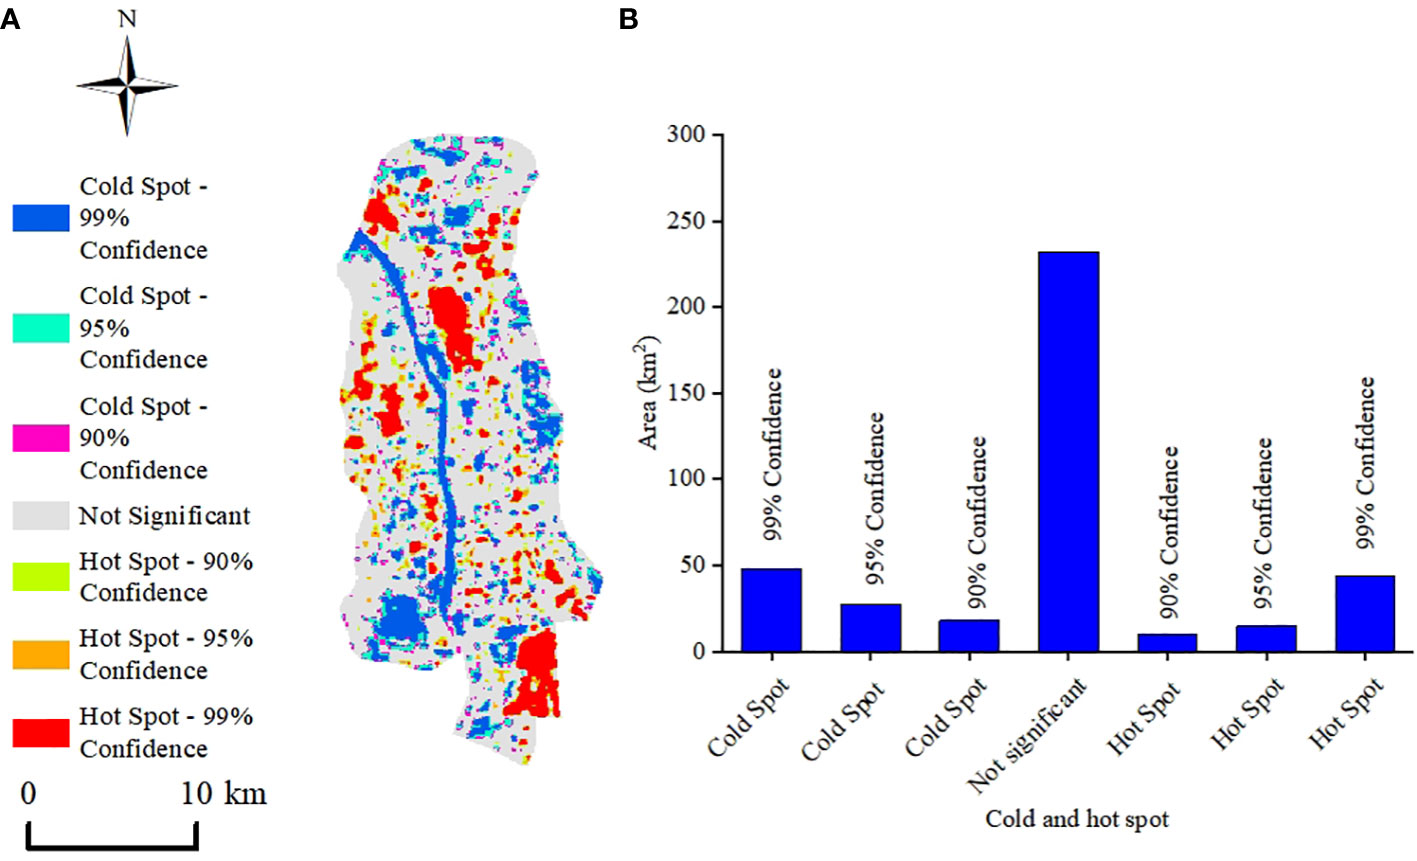
Figure 6 Cold and hot spot analysis. (A) Distribution of cold and hot spot. (B) Areas of cold and hot spot at different confidence.
3.2 Influence of LULC on LST
3.2.1 OLS regression
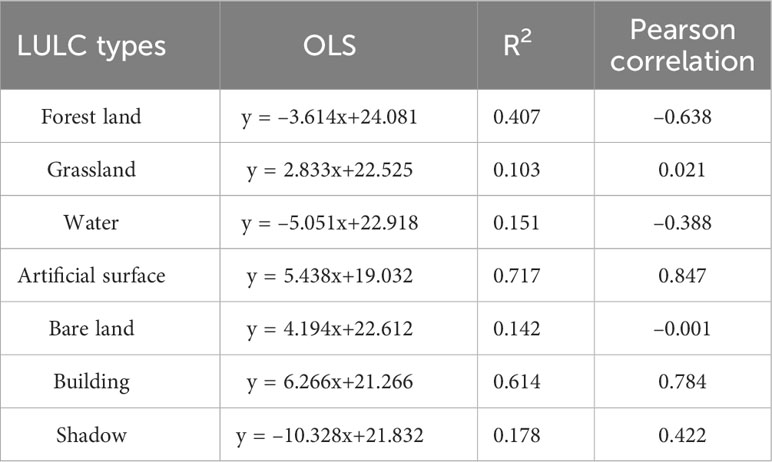
The proportion of cultivated land in Taiyuan built-up area was close to 0, which makes the OLS regression result unable to pass the multicollinearity test, so the OLS analysis was performed after excluding this type. The OLS results showed that different LULC types played a significant role in driving LST (Table 3). Increasing the ratio of woodland and water area could significantly reduce the urban LST, and increasing the proportion of grassland, artificial surface, and bare land would significantly increase the LST. For every 10% increase in area, woodland, water area and shadow will decrease the LST by 0.36°C, 0.51°C, and 1°C, respectively. While the artificial surface, bare land, and building will increase the LST by 0.54°C, 0.42°C, and 0.63°C, respectively.
3.2.2 GWR regression
In general, the administrative boundary or grid method is commonly used to divide a research area. To accurately explore the urban LST differences caused by different LULC types, combining the results of spatial autocorrelation of LST, similarity of surface landscape features, and urban road network, the study area was divided into 41 sub-areas by artificial discrimination (Figure 7A).
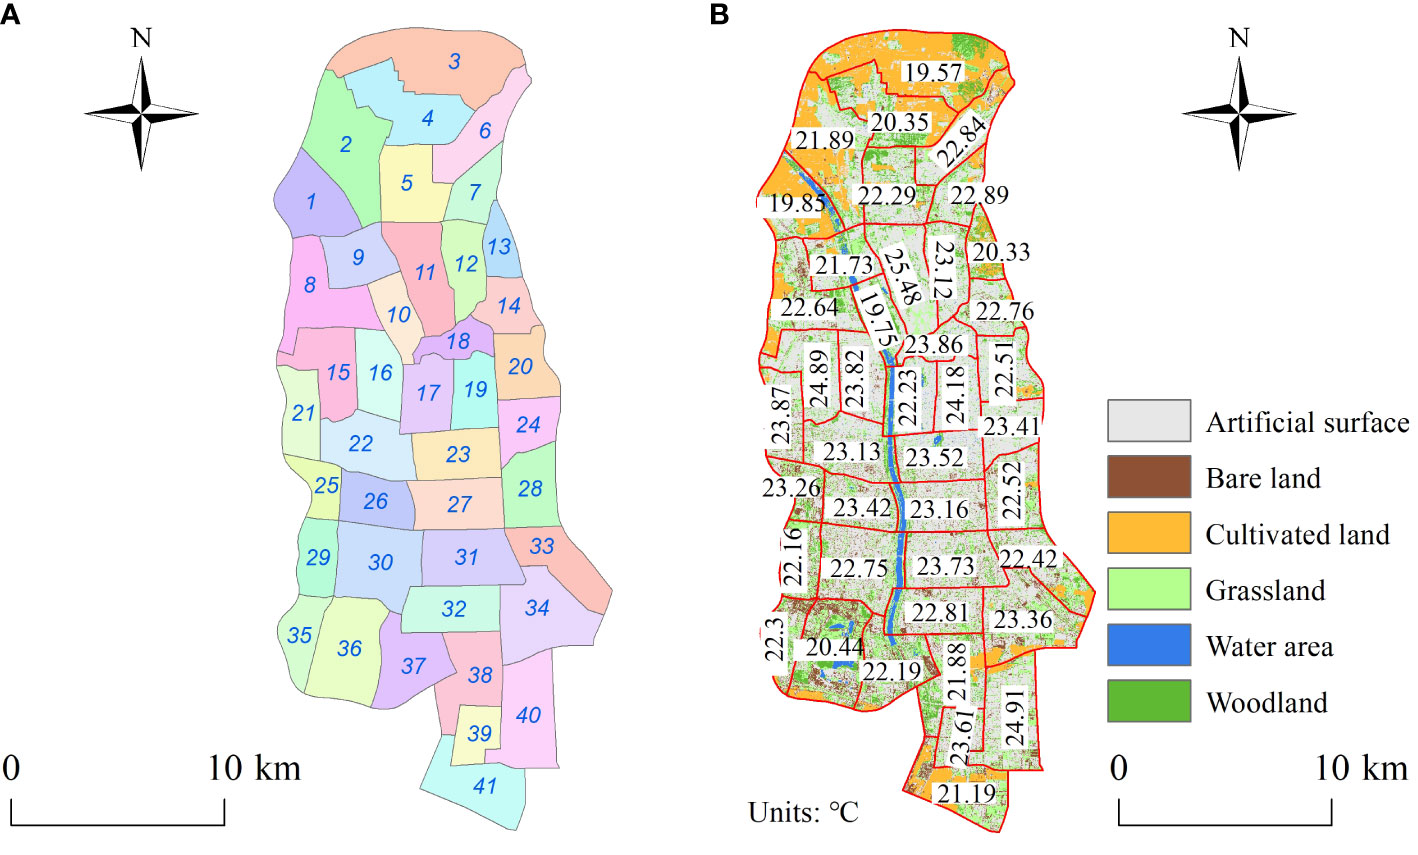
Figure 7 Artificial discrimination of the study area. (A) Divided into 41 sub-areas. (B) Mean temperature in different sub-areas.
GWR analysis showed that the influence of different LULC types on urban LST was spatially unstable, and presented obvious differences in different spatial locations. Therefore, GWR is gradually introduced to research the relationship between the change of LULC types and the spatiotemporal change of the urban thermal environment (Li et al., 2010). In the south of the study area, the relationship between LST and water area was more obvious than that in the north, where the sub-areas of 29 and 35–41 were the most significant; whereas the sub-areas of 1–7 and 13 were exactly the opposite. Therefore, with the increase of the proportion of water area, the LST of 29 and 35-41 areas will decrease significantly. The effect of woodland on temperature decreased gradually from north to south, and its cooling effect was the most significant in northern sub-areas of 1–7, with the lowest sensitivity in sub-areas of 32 and 34–41 where there was a high degree of urbanization. Urban high temperature was mainly caused by artificial surface, and the spatial instability of LST was significant, with the influence in the southern plain being stronger than that in the northern rural landscape. In the north of the study area, the influence of grassland on LST was greater than that in the south. The effect of bare land on LST showed a trend of increasing gradually from north to south. The relationship between buildings or shadows and LST differed significantly from that of other LULC types. The warming effect of buildings on LST became stronger from west to east; whereas the influence of shadows increased gradually from northwest to southeast. The average LST in sub-area of 11 was 25.48°C, in which the proportion of woodland was 7.17%, and the proportion of artificial surface was 74.72%. The average LST in sub-area of 40 (Taizhong Industrial Park and Foxconn Industrial Park) was 24.91°C, in which the proportion of woodland was 3.2%, and artificial surface accounts for 61.3% (Figure 7B). The temperature in sub-area of 11 was 0.57°C higher than that in sub-area of 40, with 13.42%of artificial surfaces and 3.97% of woodland.
The OLS and GWR model exhibit a relatively consistent trend. The GWR model is calculated with reference to the observation values of the adjacent areas, so as to better reveal the spatial relationship between artificial surface, woodland, water, grassland, and bare land and LST. The AIC of GWR was 42.442 and that of OLS was 36.643, showing that the fitting effect of GWR was superior. The GWR analysis results showed significant spatial non-stationarity in the influence of LULC types on LST in the study area. The sensitivity of this effect varied with the types and characteristics of land features in different spatial locations, and the driving effect of LULC on the characteristics of the LST pattern was significant.
3.3 CA-Markov simulation and prediction
3.3.1 Verification of prediction accuracy
With the 2018 image as the reference image, the transfer probability matrix and the suitability atlas were imported, and the spatial cellular rules were constructed using a 5 × 5 filter with 10 iterations. The CA-Markov operation was performed to simulate a LST image of 2021 in the study area. The simulated image and the real ground temperature partition image were superimposed and compared individually, and cell accuracy was calculated to determine the simulated accuracy.
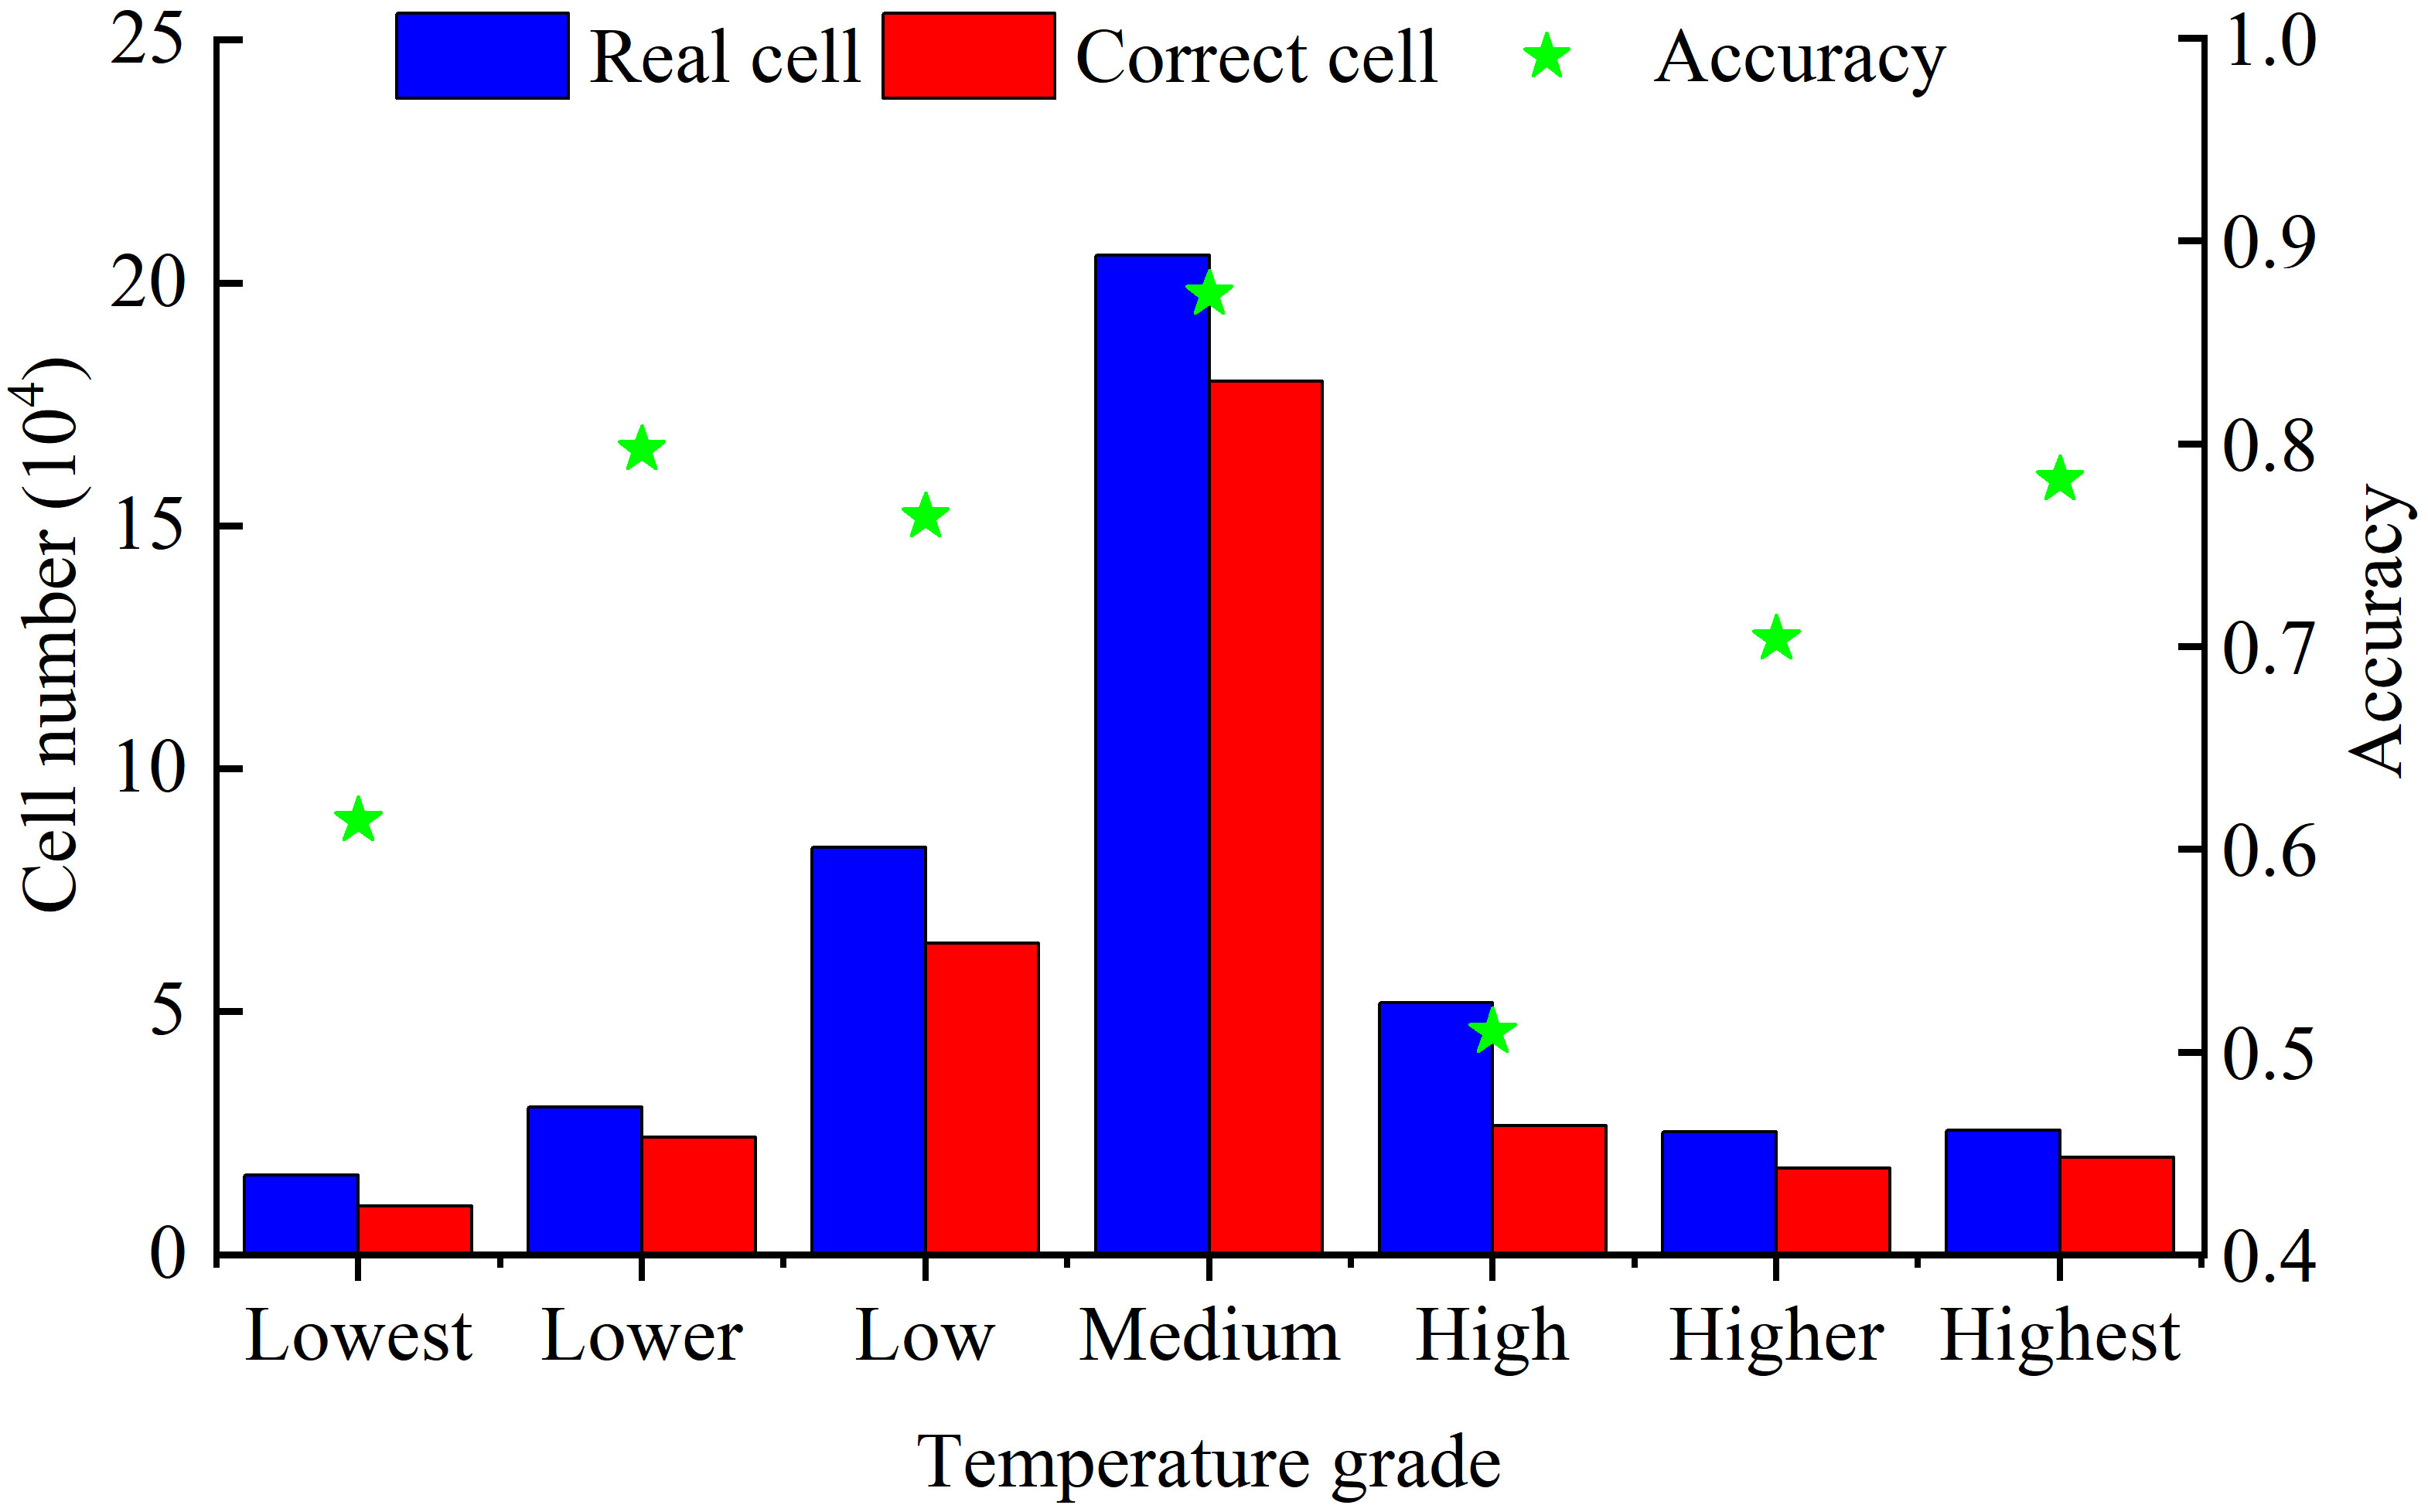
The simulated results of LST in 2021 were compared to the actual LST map in 2021. The matching accuracy of the Lower, Low, Medium, and Highest-temperature areas were 79.72%, 76.40%, 87.38%, and 78.22%, respectively (Figure 8). The overall simulation accuracy was 77.98%, indicating that the simulated LST distribution was consistent with the actual LST distribution. Setting relevant parameters met the requirements of the simulation prediction, and could be used to predict the trend of the LST in the future.
3.3.2 Analysis of prediction results
The UHI distribution in 2030 was more concentrated than that in 2021, and the center of the UHI was clearer (Figure 9). The Highest-temperature area in the central part decreased significantly, with its distribution remaining the same as that in 2021. The Higher-temperature area expanded and tended to be integrated, leading to the formation of a large patch with a High-temperature grade in the central and eastern parts of the study area. A change in the southeast region was not noticeable, and this area remained a typical Highest-temperature center. The Medium-temperature areas in other parts maintained their original scale. Each Low-temperature grade was mainly distributed in the periphery, park green space, and the location of a water body. However, the Low-temperature area corresponding to water bodies and green space had decreased in size, which was a manifestation of the further intensification of the UHI effect. The statistics of the proportion of LST and the transfer matrix of LST indicated that the proportion of the Highest and Lowest-temperature areas in 2030 will decrease to a certain extent and be closer to the average temperature.
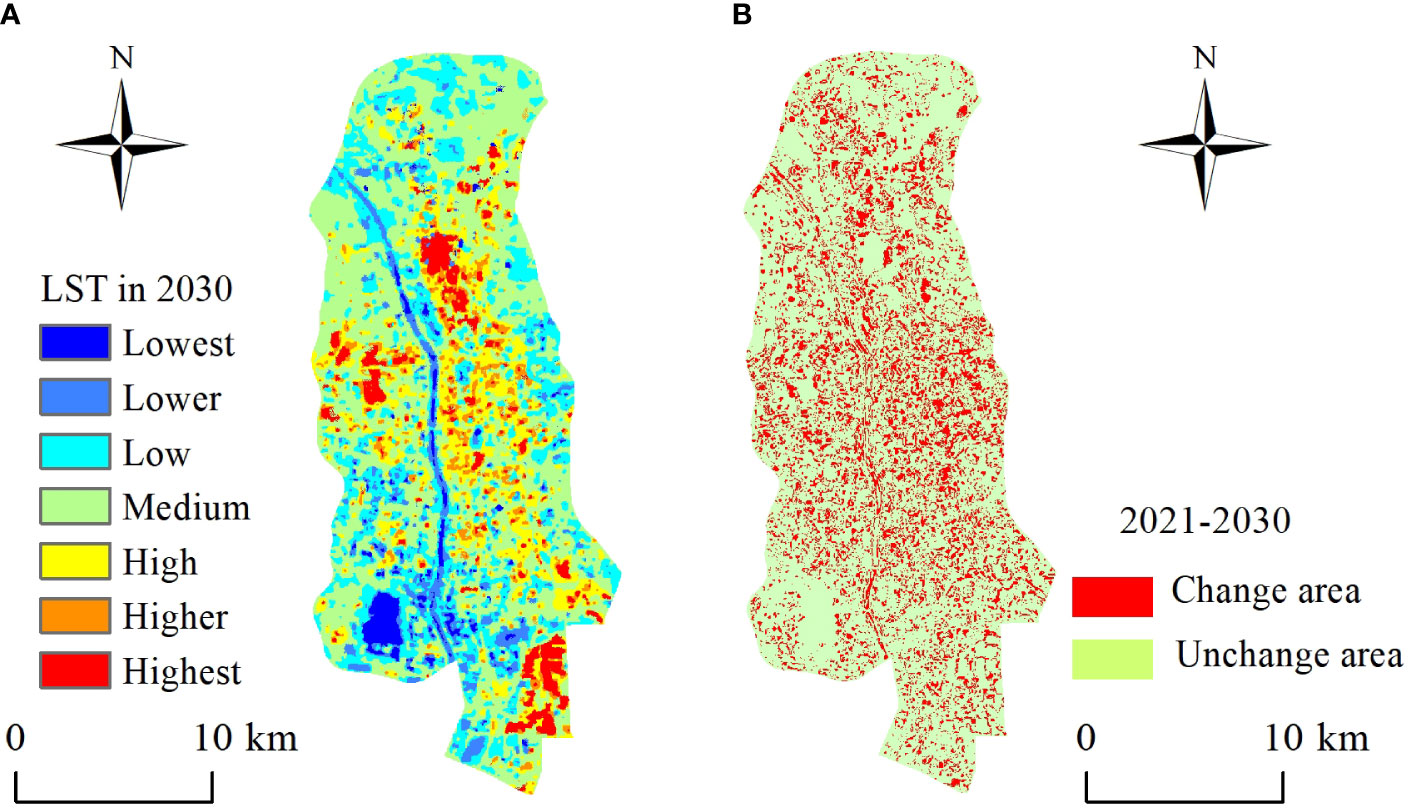
Figure 9 Characteristics and changes of LST in 2030. (A) Simulation results of LST in 2030. (B) Changes of LST from 2021 to 2030.
However, the proportion of the Lowest-temperature areas decreased from 3.72% to 2.66%, which was mainly transformed into the Lower- and Low-temperature areas, with areas of 3.61 km2 and 1.05 km2, respectively. The proportion of the Lower-temperature areas decreased from 6.91% to 6.61%, and were mainly converted to the Low- and Medium-temperature areas, with areas of 7.43 km2 and 1.21 km2, respectively. The proportion of the Low-temperature area increased from 19.09% to 21.25%, mainly from the Lower and Medium-temperature areas. The proportion of the Medium-temperature areas decreased from 46.87% to 45.02%, and mainly converted to the Low- and High-temperature areas, with areas of 12.88 km2 and 17.75 km2, respectively. The proportion of the High-temperature areas increased from 11.82% to 13.42%, mainly from the Medium-temperature area (17.75 km2). The change in the Higher-temperature area was small. The Highest-temperature area decreased from 5.82% to 5.21%, which was mainly converted into the Medium- and Higher-temperature areas. In summary, the sum of the proportions of the High-temperature areas, Higher-temperature areas, and Highest-temperature areas increased from 23.41% to 24.59%, and the sum of the proportions of the Lower- and Lowest-temperature areas dropped from 10.63% to 9.27%. The UHI effect will further intensify.
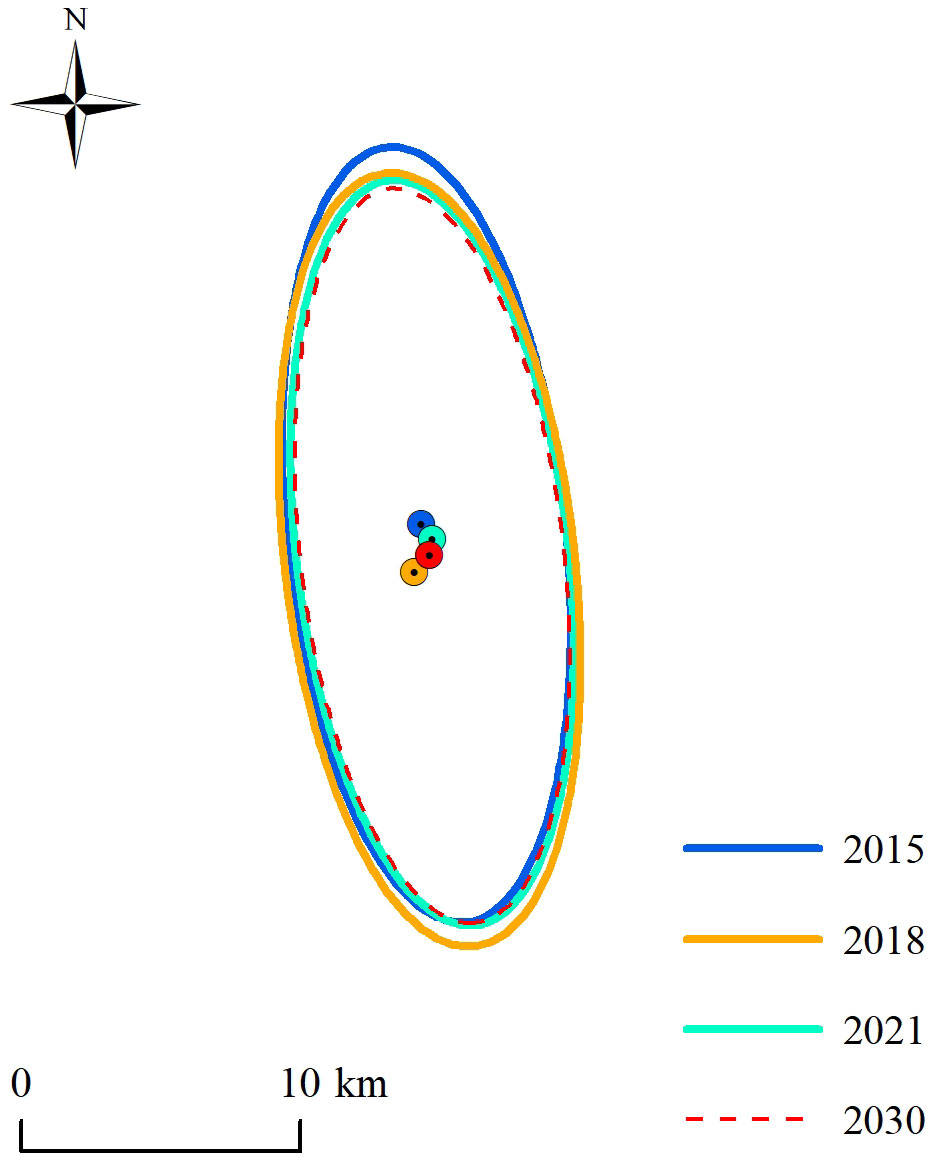
The standard deviation ellipse and center of gravity of urban LST zoning from 2015–2030 are shown in Figure 10. The center of gravity of the UHI shifted to the south from 2015–2018, southwest from 2018–2021, and northeast from 2021–2030, with the UHI gradually gathering in the middle. The shift of the center of gravity of the UHI before 2021 corresponded to the occurrence of urban development in the same period.
4 Discussion
4.1 The spatial pattern analysis of LST
Spatial autocorrelation is the main form of the first Law of Geography (Tobler, 1970). The closer the geographical feature are, the more similar they will be, and the greater the distance between geographical features, the greater will be the differences. Spatial autocorrelation analysis and testing of the LST determine whether the spatial distribution of the urban thermal environment forms an urban thermal field with a certain structure (Chen et al., 2021). Five spatial weights with different distances were constructed to evaluate the spatial autocorrelation of the LST distribution. The spatial statistical results showed that LST in Taiyuan urban built-up area had significant spatial autocorrelation characteristics and showed multiple hot and cold spot clustering. At a spatial weight distance of 400 m, the identification effect of LST spatial autocorrelation in the built-up area was optimal, and the result was accurate and reasonable. This method can accurately identify the range of an UHI and cold island, aiding determination of the exact location for heat release measures and improving the efficiency of UHI regulation and control. Using the LISA aggregation chart to characterize LISA and comparing it to the high-resolution electronic map, the H-L gathering area in the region could be clearly identified.
Fine-scale spatial units are helpful for revealing the spatial details of a research area. Generally, the division of the study area based on administrative boundaries, or the grid method was a relatively rough zoning method. Such divisions do not consider factors such as the spatial autocorrelation of LST distribution, or landscape similarity and feature types. In this study, artificial discrimination was used to divide the study area. The LST and landscape characteristics of areas with relatively similar LULC types were compared horizontally, or the areas with large differences in LULC types and LST distribution characteristics were compared and analysed, and the division of the study area had been carried out many times. After the division is completed, comparative analysis was carried out to determine its rationality, and finally 41 local areas were divided. On this basis, the driving effect of the LULC type was analysed by OLS and GWR, and the observation values in and around the sample were calculated by GWR analysis. The results obtained provided superior characterization of the complexity of the driving mechanism of LULC. In addition, they are considered more beneficial to the science and rationality of the CA-Markov simulation and prediction evolution rules.
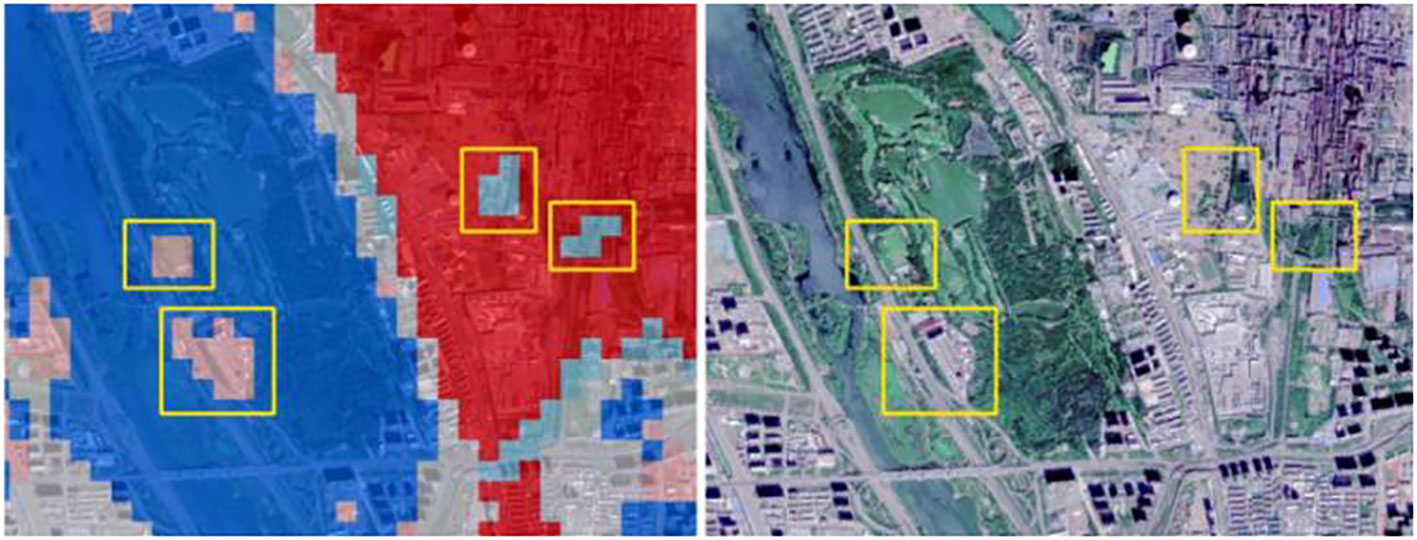
The types of “heat source” and “cold source” corresponding to the H-L and L-H agglomerations in the region could be clearly identified. The hot-spot clusters in industrial zones indicated that urban industrialization might exert a more significant impact on LST, which was basically consistent with the study on Fuzhou Central Area, China (You et al., 2021). In addition, high-density residential areas and large commercial complexes are also closely related to the Higher-temperature areas. In the future, industrial parks and high-tech parks may be further developed, which will bring greater challenges to the urban thermal environment (Li et al., 2019). As shown in Figure 11, two local heat islands on the left correspond to high-volume residential buildings and golf driving ranges, and the two local cold islands on the right correspond to two small, vegetated areas in heavy-industrial production areas. These findings could help urban builders when considering ways for increasing vegetation to improve the microclimate. Such measures include strengthening the greening around high-volume buildings, increasing vertical greening, or building rooftop gardens.
4.2 The impact factor on LST
Employing remote sensing technology, researchers have conducted ample research on the thermal environment inversion algorithm, spatiotemporal distribution characteristics, spatial heterogeneity, and driving analysis (Zhou et al., 2014; Liu et al., 2021). In most cities in China, the intensity of the UHI in summer is higher than that in winter (Peng et al., 2018). A positive correlation has shown between LST and impervious water surfaces (Ward et al., 2016); whereas, green landscapes, such as parks and green land, play a role in cooling and humidifying the surface (Asgarian et al., 2015). In this study, artificial surface and bare land were indicated as the main surface cover types in high temperature areas; whereas, woodland and water areas were typical driving factors of the cold island. Mansourmoghaddam et al. (2023) examined the impact factors on LST in Yazd City and also indicated that bare lands in the radii of 100, 50, and 150 m played key roles in affecting LST.
From 2015 to 2021, the thermal environment pattern has changed very obviously in north Taiyuan built-up area. The area of the Highest-temperature areas has shrunk significantly. Many High-temperature areas in 2015 have now been converted into the Low-temperature areas. This shows that the ecological barrier in northern Taiyuan is gradually forming, and the ecological benefits of the ecological conservation area are reflected. On the west side of the study area, the distribution of LST has also changed significantly. The areas with high LST areas near the edge of the study area have become significantly smaller, and some have transformed into the Medium-temperature areas. This is in line with the fact that this district has strengthened the management of the ecological environment in recent years. Related to the work, the forest scale of Yuquan Mountain Forest Park has been completed and has exerted greater ecological benefits. In the central part of the study area, only a small number of the High- and Highest-temperature areas were visible in 2015. However, these areas expanded to a certain extent in 2018, and by 2021, the High- and Highest-temperature areas have increased significantly, and there is even a tendency to be connected into a single area. Through the identification of remote sensing images and field investigations, the change in the LULC types caused by the accelerated urbanization process in the region. Overall, although Taiyuan urbanization has intensified, LULC types have changed, and the UHI effect has intensified, the proportion of the Lowest-, Lower-, and Low-temperature areas have increased significantly. The “Taiyuan City Landscaping “13th Five-Year Plan” (2016–2020)” mentions that within the five years from 2016 to 2020, Taiyuan City will focus on the implementation of 35 major park construction projects. Therefore, it is inevitable that the enhanced of the quality of urban green space in the city will bring the improvement of the ecological environment and the quality of the human settlement environment. In 2030, the Highest- and Lowest temperature areas in Taiyuan urban built-up area will approach the Medium-temperature, with the total proportion of other LST grades increasing from 77.78% to 79.69%. The High-temperature areas in the central urban area mainly transfer from a portion of the Low- and Medium-temperature areas, and the distribution of Highest-temperature areas showed a decrease, but the overall temperature will rise. From a local perspective, the Highest temperature areas are mainly concentrated in Taiyuan Iron and Steel Group Co., Ltd. and Taizhong Industrial Park, but the proportion has decreased. The Highest-temperature accumulation state in 2021 will become discrete in 2030, and some Higher-temperature areas will appear in the Highest-temperature areas. The Lowest-temperature areas of water and green space in the study area has been reduced, and most of them have been transformed into Lower-temperature areas, which is also a manifestation of the further aggravation of UHI effect. For example, in the edge of the central and eastern part of the study area, the Lower-temperature areas increase, while the Lowest-temperature areas decrease. With the intensification of the UHI effect, the cold source role of urban park green space is particularly important. The development goals of the “Taiyuan 14th Five-Year Housing and Urban-Rural Construction Plan” still contain many contents for the implementation of ecological space construction, such as scenic spots, parks, wetlands, residential areas and unit-affiliated green spaces, the implementation of micro-green spaces, pocket park construction. Under this opportunity, we should fully consider the role of green space in alleviating the UHI effect, rationally plan the location and scale of green space, scientifically design and construct, and strive to maximize the cold island effect of urban green space.
4.3 Prospect
In the current study, the suitability index system of CA-Markov simulation prediction was based on the results of LST spatial autocorrelation and GWR regression analysis. These methods could reflect the effect of the unique features of the environment on LST, making the prediction results more instructive. On the contrary, the method could be affected by the subjective judgment of the researchers, leading to research results that are insufficiently comprehensive or have limitations. Follow-up studies should consider adding more explanatory factors such as meteorological conditions and social economy to participate in the prediction.
Although GWR can effectively solve the problem of spatial non-stationarity by adding spatial distribution information to regression parameters, GWR studies the relationship between LULC and the urban thermal environment based on fixed bandwidth, with certain limitations. Due to the different dimensions of urban blocks, there are also scale differences in the impact of block shape indicators on the LST. Therefore, in future research, we can continue to try to use the multi-scale GWR method to study the qualitative and quantitative relationship between the block shape indicators and the LST at different spatial scales to overcome the limitations of GWR.
5 Conclusions
In the present study, Landsat-8 OLI/TIRS images of 2015, 2018, and 2021, and GF-2 images of 2018 were selected to explore the influence of LULC types on LST. The CA-Markov model was chosen to predict LST changes until 2030. The conclusions are as following:
1) The LST distribution in the built-up area had a high degree of spatial heterogeneity, with numerous hot and cold points. In the GetisOrd Gi* analysis, the cold area was 1248.32 km2 and the hot area was 43.84 km2 at the 99% confidence levels, accounting for 12.24% and 11.11% of the study area, respectively.
2) The GWR regression showed that different LULC types had significant driving effects on LST. Significant differences were observed in the driving performance of various surface cover factors on LST in different regions, indicating that the formation of the LST spatial distribution in the study area was the result of the combined action of several factors.
3) The Highest and Lowest LST in Taiyuan urban built-up area in 2030 approached the Medium-temperature; however, the proportion of the High-temperature grade was still predicted to increase, indicating that the UHI effect would further intensify in 2030.
The results of this study can be used as a reference for the regulation and control of thermal environment on the regional scale, optimize land cover pattern, and provide relevant support for the planning and construction of Taiyuan urban parks and green space in the future.
Data availability statement
The raw data supporting the conclusions of this article will be made available by the authors, without undue reservation.
Author contributions
QQ: Conceptualization, Data curation, Formal Analysis, Writing – original draft. ZZ: Data curation, Software, Writing – review & editing. YL: Project administration, Supervision, Writing – review & editing.
Funding
The author(s) declare that no financial support was received for the research, authorship, and/or publication of this article.
Conflict of interest
The authors declare that the research was conducted in the absence of any commercial or financial relationships that could be construed as a potential conflict of interest.
Publisher’s note
All claims expressed in this article are solely those of the authors and do not necessarily represent those of their affiliated organizations, or those of the publisher, the editors and the reviewers. Any product that may be evaluated in this article, or claim that may be made by its manufacturer, is not guaranteed or endorsed by the publisher.
References
Alavipanah S. K., Mansourmoghaddam M., Gomeh Z., Galehban E., Hamzeh S. (2022). The reciprocal effect of global warming and climatic change (new perspective): A review. Desert 27 (2), 291–305. doi: 10.22059/JDESERT.2022.90831
Allegrini J., Carmeliet J. (2017). Coupled CFD and building energy simulations for studying the impacts of building height topology and buoyancy on local urban microclimates. Urban Climate 21, 278–305. doi: 10.1016/j.uclim.2017.07.005
Amir Siddique M., Wang Y., Xu N., Ullah N., Zeng P. (2021). The spatiotemporal implications of urbanization for urban heat islands in Beijing: A predictive approach based on CA–Markov modeling, (2004–2050). Remote Sens. 13 (22), 4697. doi: 10.3390/rs13224697
Anselin L. (1995). Local indicators of spatial association—LISA. Geographical Anal. 27 (2), 93–115. doi: 10.1111/j.1538-4632.1995.tb00338.x
Anselin L., Syabri I., Kho Y. (2010). “GeoDa: an introduction to spatial data analysis,” in Handbook of Applied Spatial Analysis: Software Tools, Methods and Applications. Eds. Fischer M. M., Getis A. (Berlin, Heidelberg: Springer Berlin Heidelberg), 73–89.
Asgarian A., Amiri B. J., Sakieh Y. (2015). Assessing the effect of green cover spatial patterns on urban land surface temperature using landscape metrics approach. Urban Ecosyst. 18 (1), 209–222. doi: 10.1007/s11252-014-0387-7
Chen C., Liang J., Yang G., Sun W. (2023). Spatio-temporal distribution of harmful algal blooms and their correlations with marine hydrological elements in offshore areas, China. Ocean Coast. Manage. 238, 106554. doi: 10.1016/j.ocecoaman.2023.106554
Chen G., Zhao L., Mochida A. (2016). Urban heat island simulations in Guangzhou, China, using the coupled WRF/UCM model with a land use map extracted from remote sensing data. Sustainability 8 (7), 628. doi: 10.3390/su8070628
Chen L., Wang X., Cai X., Yang C., Lu X. (2021). Seasonal variations of daytime land surface temperature and their underlying drivers over Wuhan, China. Remote Sens. 13 (2), 323. doi: 10.3390/rs13020323
Cristóbal J., Jiménez-Muñoz J., Prakash A., Mattar C., Skoković D., Sobrino J. (2018). An improved single-channel method to retrieve land surface temperature from the Landsat-8 thermal band. Remote Sens. 10, 431. doi: 10.3390/rs10030431
Cui F., Hamdi R., Yuan X., He H., Yang T., Kuang W., et al. (2021). Quantifying the response of surface urban heat island to urban greening in global north megacities. Sci. Total Environ. 801, 149553. doi: 10.1016/j.scitotenv.2021.149553
Firozjaei M. K., Weng Q., Zhao C., Kiavarz M., Lu L., Alavipanah S. K. (2020). Surface anthropogenic heat islands in six megacities: An assessment based on a triple-source surface energy balance model. Remote Sens. Environ. 242, 111751. doi: 10.1016/j.rse.2020.111751
Fotheringham A. S., Charlton M. E., Brunsdon C. (1998). Geographically weighted regression: A natural evolution of the expansion method for spatial data analysis. Environ. Plann. A 30 (11), 1905–1927. doi: 10.1068/a301905
Hanni C. (2019). Assessing palm decline in Florida by using advanced remote sensing with machine learning technologies and algorithms. doi: 10.13140/RG.2.2.25796.78723
Jia W., Zhao S., Liu S. (2018). Vegetation growth enhancement in urban environments of the Conterminous United States. Global Change Biol. 24 (9), 4084–4094. doi: 10.1111/gcb.14317
Jiang M., He Y., Song C., Pan Y., Qiu T., Tian S. (2021). Disaggregating climatic and anthropogenic influences on vegetation changes in Beijing-Tianjin-Hebei region of China. Sci. Total Environ. 786, 147574. doi: 10.1016/j.scitotenv.2021.147574
Jiménez-Muñoz J. C., Sobrino J. A., Skoković D., Mattar C., Cristobal J. (2014). Land surface temperature retrieval methods from Landsat-8 thermal infrared sensor data. IEEE Geosci. Remote Sens. Lett. 11 (10), 1840–1843. doi: 10.1109/LGRS.2014.2312032
Kafy A. A., Abdullah Al F., Rahman M. S., Islam M., Al Rakib A., Islam M. A., et al. (2021). Prediction of seasonal urban thermal field variance index using machine learning algorithms in Cumilla, Bangladesh. Sustain. Cities Soc. 64, 102542. doi: 10.1016/j.scs.2020.102542
Kim S. W., Brown R. D. (2021). Urban heat island (UHI) intensity and magnitude estimations: A systematic literature review. Sci. Total Environ. 779, 146389. doi: 10.1016/j.scitotenv.2021.146389
Li C., Gao X., Wu J., Wu K. (2019). Demand prediction and regulation zoning of urban-industrial land: Evidence from Beijing-TianjinHebei Urban Agglomeration, China. Environ. Monit. Assess. 191, 412. doi: 10.1007/s10661-019-7547-4
Li J., Sun R., Liu T., Xie W., Chen L. (2021). Prediction models of urban heat island based on landscape patterns and anthropogenic heat dynamics. Landscape Ecol. 36 (6), 1801–1815. doi: 10.1007/s10980-021-01246-2
Li Z., Tang B., Wu H., Ren H., Yan G., Wan Z., et al. (2013). Satellite-derived land surface temperature:current status and perspectives. Remote Sens. Environ. 131, 14–37. doi: 10.1016/j.rse.2012.12.008
Li S., Zhao Z., Miaomiao X., Wang Y. (2010). Investigating spatial non-stationary and scale-dependent relationships between urban surface temperature and environmental factors using geographically weighted regression. Environ. Model. Softw. 25 (12), 1789–1800. doi: 10.1016/j.envsoft.2010.06.011
Liang J., Chen C., Song Y., Sun W., Yang G. (2023). Long-term mapping of land use and cover changes using Landsat images on the Google Earth Engine Cloud Platform in bay area - A case study of Hangzhou Bay, China. Sustain. Horizons 7, 100061. doi: 10.1016/j.horiz.2023.100061
Lin L., Wei X., Luo P., Wang S., Kong D., Yang J. (2023). Ecological security patterns at different spatial scales on the loess plateau. Remote Sens. 15 (4), 1011. doi: 10.3390/rs15041011
Liu H., Huang B., Zhan Q., Gao S., Li R., Fan Z. (2021). The influence of urban form on surface urban heat island and its planning implications: Evidence from 1288 urban clusters in China. Sustain. Cities Soc. 71, 102987. doi: 10.1016/j.scs.2021.102987
Ma H., Zhen Z., Mi M., Wang Q. (2022). Characteristics of nutrients pollution and ecological risk assessment of heavy metal in sediments of Fenhe River, Taiyuan section, China. Water Supply 22 (3), 2596–2611. doi: 10.2166/ws.2021.453
Manoli G., Fatichi S., Schläpfer M., Yu K., Crowther T. W., Meili N., et al. (2019). Magnitude of urban heat islands largely explained by climate and population. Nature 573 (7772), 55–60. doi: 10.1038/s41586-019-1512-9
Mansourmoghaddam M., Rousta I., Zamani M. S., Mokhtari M. H., Karimi Firozjaei M., Alavipanah S. K. (2023). Investigating and modeling the effect of the composition and arrangement of the landscapes of Yazd city on the land surface temperature using machine learning and Landsat-8 and Sentinel-2 data. Iranian J. Remote Sens. GIS. 15 (3), 1–26. doi: 10.48308/gisj.2023.102195
Mohan M., Kandya A. (2015). Impact of urbanization and land-use/land-cover change on diurnal temperature range: A case study of tropical urban airshed of India using remote sensing data. Sci. Total Environ. 506-507, 453–465. doi: 10.1016/j.scitotenv.2014.11.006
Oke T. R. (1982). The energetic basis of the urban heat island. Q. J. R. Meteorol. Soc. 108 (455), 1–24. doi: 10.1002/qj.49710845502
O’Malley C., Piroozfar P., Farr E. R. P., Pomponi F. (2015). Urban Heat Island (UHI) mitigating strategies: A case-based comparative analysis. Sustain. Cities Soc. 19, 222–235. doi: 10.1016/j.scs.2015.05.009
Peng J., Ma J., Liu Q., Liu Y., Hu Y. N., Li Y., et al. (2018). Spatial-temporal change of land surface temperature across 285 cities in China: An urban-rural contrast perspective. Sci. Total Environ. 635, 487. doi: 10.1016/j.scitotenv.2018.04.105
Qian Y., Zhou W., Yan J., Li W., Han L. (2014). Comparing machine learning classifiers for object-based land cover classification using very high resolution imagery. Remote Sens. 7 (1), 153–168. doi: 10.3390/rs70100153
Qiao Z., Tian G. J., Zhang L. X., Xu X. L. (2014). Influences of urban expansion on urban heat island in Beijing during 1989-2010. Adv. Meteorol. 2014, 187169. doi: 10.1155/2014/187169
Qiao Q., Zhen Z., Liu L., Luo P. (2023). The construction of ecological security pattern under rapid urbanization in the Loess Plateau: A case study of Taiyuan city. Remote Sens. 15 (6), 1523. doi: 10.3390/rs15061523
Qiu T., Song C., Zhang Y., Liu H., Vose J. M. (2020). Urbanization and climate change jointly shift land surface phenology in the northern mid-latitude large cities. Remote Sens. Environ. 236, 111477. doi: 10.1016/j.rse.2019.111477
Ren Y., Deng L., Zuo S., Song X., Liao Y., Xu C., et al. (2016). Quantifying the influences of various ecological factors on land surface temperature of urban forests. Environ. pollut. 216, 519–529. doi: 10.1016/j.envpol.2016.06.004
Sekertekin A., Zadbagher E. (2021). Simulation of future land surface temperature distribution and evaluating surface urban heat island based on impervious surface area. Ecol. Indic. 122, 107230. doi: 10.1016/j.ecolind.2020.107230
Sobrino J., Coll C., Caselles V. (1991). Atmospheric correction for land surface temperature using NOAA-11 AVHRR channels 4 and 5. Remote Sens. Environ. 38 (1), 19–34. doi: 10.1016/0034-4257(91)90069-I
Stewart I. D. (2011). Redefining the urban heat island. Doctoral dissertation. University of British Columbia Vancouver.
Su W., Zhang Y., Yang Y., Ye G. (2014). Examining the impact of greenspace patterns on land surface temperature by coupling LiDAR data with a CFD model. Sustainability 6 (10), 6799–6814. doi: 10.3390/su6106799
Sun X., Wang S., Xue J., Dong L. (2023). Assessment and simulation of ecosystem carbon storage in rapidly urbanizing areas based on land use cover: a case study of the southern Jiangsu urban agglomeration, China. Front. Ecol. Evol. 11. doi: 10.3389/fevo.2023.1197548
Tobler W. R. (1970). A computer movie simulating urban growth in the Detroit Region. Economic Geogr. 46 (sup1), 234–240. doi: 10.2307/143141
Wang S., Zheng X. (2022). Dominant transition probability: Combining CA-Markov model to simulate land use change. Environ. Dev. Sustain. 25, 6829–6847. doi: 10.1007/s10668-022-02337-z
Ward K., Lauf S., Kleinschmit B., Endlicher W. (2016). Heat waves and urban heat islands in Europe: A review of relevant drivers. Sci. Total Environ. 569-570, 527–539. doi: 10.1016/j.scitotenv.2016.06.119
Yang Q., Huang X., Li J. (2017). Assessing the relationship between surface urban heat islands and landscape patterns across climatic zones in China. Sci. Rep. 7 (1), 9337. doi: 10.1038/s41598-017-09628-w
You M., Lai R., Lin J., Zhu Z. (2021). Quantitative analysis of a spatial distribution and driving factors of the urban heat island effect: A case study of Fuzhou Central Area, China. Int. J. Environ. Res. Public Health 18, 13088. doi: 10.3390/ijerph182413088
Yu Z., Guo X., Jørgensen G., Vejre H. (2017). How can urban green spaces be planned for climate adaptation in subtropical cities? Ecol. Indic. 82, 152–162. doi: 10.1016/j.ecolind.2017.07.002
Yu X., Guo X., Wu Z. (2014). Land surface temperature retrieval from Landsat 8 TIRS—comparison between radiative transfer equation-based method, split window algorithm and single channel method. Remote Sens. 6, 9829–9852. doi: 10.3390/rs6109829
Yu Z., Guo X., Zeng Y., Koga M., Vejre H. (2018). Variations in land surface temperature and cooling efficiency of green space in rapid urbanization: The case of Fuzhou city, China. Urban Forestry Urban Greening 29, 113–121. doi: 10.1016/j.ufug.2017.11.008
Zhang M., Kafy A.-A., Xiao P., Han S., Zou S., Saha M., et al. (2023). Impact of urban expansion on land surface temperature and carbon emissions using machine learning algorithms in Wuhan, China. Urban Climate 47, 101347. doi: 10.1016/j.uclim.2022.101347
Zhang M., Tan S., Pan Z., Hao D., Zhang X., Chen Z. (2022). The spatial spillover effect and nonlinear relationship analysis between land resource misallocation and environmental pollution: Evidence from China. J. Environ. Manage. 321, 115873. doi: 10.1016/j.jenvman.2022.115873
Zhang M., Zhang C., Kafy A.-A., Tan S. (2021). Simulating the relationship between land use/cover change and urban thermal environment using machine learning algorithms in Wuhan City, China. Land 11 (1), 14. doi: 10.3390/land11010014
Zhou D., Zhao S., Liu S., Zhang L., Zhu C. (2014). Surface urban heat island in China's 32 major cities: Spatial patterns and drivers. Remote Sens. Environ. 152, 51–61. doi: 10.1016/j.rse.2014.05.017
Keywords: thermal environment, spatial autocorrelation, cellular automata-Markov model, build-up area, Taiyuan city
Citation: Qiao Q, Zhen Z and Lin Y (2023) Assessment and simulation of thermal environments in Taiyuan urban built-up area, China. Front. Ecol. Evol. 11:1261291. doi: 10.3389/fevo.2023.1261291
Received: 19 July 2023; Accepted: 30 October 2023;
Published: 16 November 2023.
Edited by:
Penghai Wu, Anhui University, ChinaReviewed by:
Chao Chen, Suzhou University of Science and Technology, ChinaJianhui Xu, Guangzhou Institute of Geography, China
Copyright © 2023 Qiao, Zhen and Lin. This is an open-access article distributed under the terms of the Creative Commons Attribution License (CC BY). The use, distribution or reproduction in other forums is permitted, provided the original author(s) and the copyright owner(s) are credited and that the original publication in this journal is cited, in accordance with accepted academic practice. No use, distribution or reproduction is permitted which does not comply with these terms.
*Correspondence: Qiong Qiao, UWlhb3Fpb25nXzUwOUBzeGF1LmVkdS5jbg==; Yinding Lin, TFkyMjAxMDlAc3hhdS5lZHUuY24=
 Qiong Qiao
 Zhilei Zhen2

