 Karina A. Sanchez
 Lauryn Benedict
 Emily A. Holt
95% of researchers rate our articles as excellent or good
Learn more about the work of our research integrity team to safeguard the quality of each article we publish.
Find out more
ORIGINAL RESEARCH article
Front. Ecol. Evol. , 17 October 2023
Sec. Urban Ecology
Volume 11 - 2023 | https://doi.org/10.3389/fevo.2023.1254280
Urban development has drastically altered ecosystems with dramatic effects on avian diversity and community structure. Most studies investigating this phenomenon are conducted in large and established cities, with fewer conducted in areas of current urbanization. Measuring avian community structure in recently established and growing cities is necessary to understand which species are being affected in a range of urban environments. There is also a critical need to explore multiple measures of urbanization, as different axes of human influence might have varied effects on wildlife. This study investigated the relationship between avian communities and urban noise, light, and landscape composition in Weld County, CO, one of the United States’ fastest growing metropolitan areas. We tested the general hypothesis that avian community assemblages would vary with multiple urban characteristics. We measured noise, light, and landscape composition across 16 sites ranging from urban to non-urban and paired these data with avian species census data. We used multivariate analyses to test for covariance of our three measures of urban characteristics, and to examine patterns of species presence and abundances at sites. Results suggest that developed land and water covary with avian community structure across our study sites. Anthropogenic noise and light did not drive avian community patterns as strongly as percent developed land and water. These three urban characteristics did not covary or form a linear urban to non-urban gradient, suggesting that urbanization can have patchy and unpredictable effects, highlighting the value of measuring urban characteristics separately.
Land cover changes and sensory pollutants have drastically increased in the past century due to urbanization, contributing to worldwide declines of species (Aronson et al., 2014; Rosenberg et al., 2019; Zuñiga-Palacios et al., 2021). Natural habitats have been replaced by human constructions, such as buildings, homes, oil platforms, and roads. With these replacements come novel habitat characteristics such as more impervious surfaces, more vertical surfaces, and sensory pollutants including anthropogenic noise and light. Understanding the consequences of multiple human impacts will be important for predicting the trajectory of wildlife populations around the world.
Birds are crucial bioindicators of environmental change (Mehlman, 1997; Gardner et al., 2014; Alexandrino et al., 2017; Mekonen, 2017). North America alone lost 30% of its birds in less than a century (Rosenberg et al., 2019) due in large part to loss of habitat and habitat fragmentation (Aronson et al., 2014). Among all taxa, birds are one of the most well-studied regarding the effects of anthropogenic changes (Zuñiga-Palacios et al., 2021), and bird community responses to urbanization have been key to understanding human impacts on ecosystems. Previous studies report that high urban land cover is associated with decreases in species richness, increases in abundances of generalist species (Melles et al., 2003; Ortega-Álvarez and MacGregor-Fors, 2009), and biotic homogenization of avian communities (McKinney and Lockwood, 1999; McKinney, 2006; Reale and Blair, 2006; Vallejos et al., 2016). Often, the composition of avian species differs drastically in urban areas when compared to the native and local surrounding habitat because urbanization may select for a few, often generalist and introduced species (“urban exploiters”) replacing specialist and local species (“urban avoiders”) (McKinney and Lockwood, 1999; Reale and Blair, 2006; Devictor et al., 2007; Newbold et al., 2014).
While most studies of avian diversity have focused on land-use and landcover changes, there is no clear consensus on how to measure urban-ness (Moll et al., 2019). Historically, many studies investigating the effects of urbanization on wildlife categorically assign study locations to “urban” or “rural” based on qualitative land descriptions or proxies for urbanization rather than habitat measurements (Blair, 1996; McDonnell and Hahs, 2008). More recently, there has been a shift to measuring secondary mechanisms associated with land-use change such as anthropogenic noise and light, but these approaches are still relatively new. Noise pollution and light pollution can result from urbanization and have been demonstrated to affect avian communities (Proppe et al., 2013; Ciach and Fröhlich, 2017; Perilla et al., 2017). Independently, anthropogenic noise, light, and landscape composition (e.g. impervious surface and canopy cover) have each been shown to affect wildlife responses, including individual behavior (Lowry et al., 2013; Shannon et al., 2016; Willems et al., 2022) biodiversity, (Marzluff and Ewing, 2001; Aronson et al., 2017), species richness (Gatesire et al., 2014; Carral-Murrieta et al., 2020), abundance (Gatesire et al., 2014; Wilson et al., 2021) and reproduction (Beck and Heinsohn, 2006; Seress et al., 2020). It is evident that each of these environmental components are impacting wildlife, but the relative impacts of each characteristic are not well understood (Moll et al., 2019; Halfwerk and Jerem, 2021). Areas with more urban development may have more noise and more light at large (regional and continental) scales (Han et al., 2018; Buxton et al., 2020), there is little consensus on whether these three metrics covary at smaller scales, specifically within urban areas (Votsi et al., 2017; Grunst et al., 2023).
In addition to the focus on land cover, most urban wildlife studies worldwide are conducted in large and historically old cities, with fewer studies conducted in recently urbanized areas. By focusing on historically old cities, studies can only speak to the wildlife species, populations, or individuals that have withstood many years of urbanization. Conducting research in newly urbanized areas adds an important comparison group to the literature. Recent work has demonstrated the importance of studying different urbanization types (Xu et al., 2022) by highlighting the variability in what is considered urban habitat. The rate of urbanization is expected to continue to increase with approximately 5 billion people living in urban areas/cities by 2028 compared the 4.3 billion people living in cities in 2020 (United Nations, 2018). Thus, there is an urgent need to describe recently and currently developed areas, especially as we consider how organisms respond to urban landscapes.
We conducted research in Weld County, Colorado as a case study on urban landscape factors that shape avian community structure. Our objective was to describe avian community structure (species composition and abundance) in relation to three anthropogenic characteristics: land cover, noise, and light. We hypothesized that avian community structure would span gradients aligned with all three landscape attributes: land cover, noise pollution, and light. We expected that noise and light would co-vary with land cover in that areas with more developed land would also have more anthropogenic noise and light. We also expected that avian community structure would strongly relate to the landscape attributes measured in that we would find similar avian community composition in areas with similar landcover, noise regimes and light regimes. We used a multivariate approach, a method commonly used in community studies of a variety of taxa, that allowed us to identify patterns in sites using overlaps or dissimilarities in avian community structure as it relates to our urbanization variables.
Weld County is located on the Northern Front Range of central Colorado. The county spans an area from metropolitan Denver to the Wyoming state line and occurs within the Great Plains grassland ecoregion. Weld County’s 9800 square kilometers are dominated by agriculture, with nearly 75% of land devoted to farming and housing livestock, however some of this land is slated to become developed (Weld County Comprehensive Plan, 2020). With a population of 108,795 people, the city of Greeley houses over one-third of the Weld County population (US Census Bureau, 2020). The Greeley Metropolitan Area has consistently remained one of the fastest growing cities in Colorado, which was named the 6th fastest growing state in the United States in the most recent US Census (2020). By 2060, the city of Greeley is expected to nearly double its current population size (City of Greeley, 2020). With these ongoing changes, Weld County is in a stage of urbanization where the urban expansion boom began less than fifty years prior to this study and the largest population boom occurred less than twenty years prior. Cities of this size are widespread but understudied in terms of urban effects on wildlife. There are over 150 cities in the United States alone with a population equal to that of Greeley (population of 109,000) ± 20,000 inhabitants (US Census Bureau, 2023). Greeley, therefore, serves as a critical case study for this type of research exploring recent urbanization, whose findings could transfer to other similar cities elsewhere.
Sixteen sites were used for this study spanning outward from the city of Greeley, in the four general cardinal directions (Figure 1) which captured a random sampling of a variety of urban and non-urban land areas. For standardization, all sites were required to have trees and grass as the primary avian habitats and be a minimum distance of 500 m to other sites. During site selection, these limitations resulted in most of our sites being located within public parks.
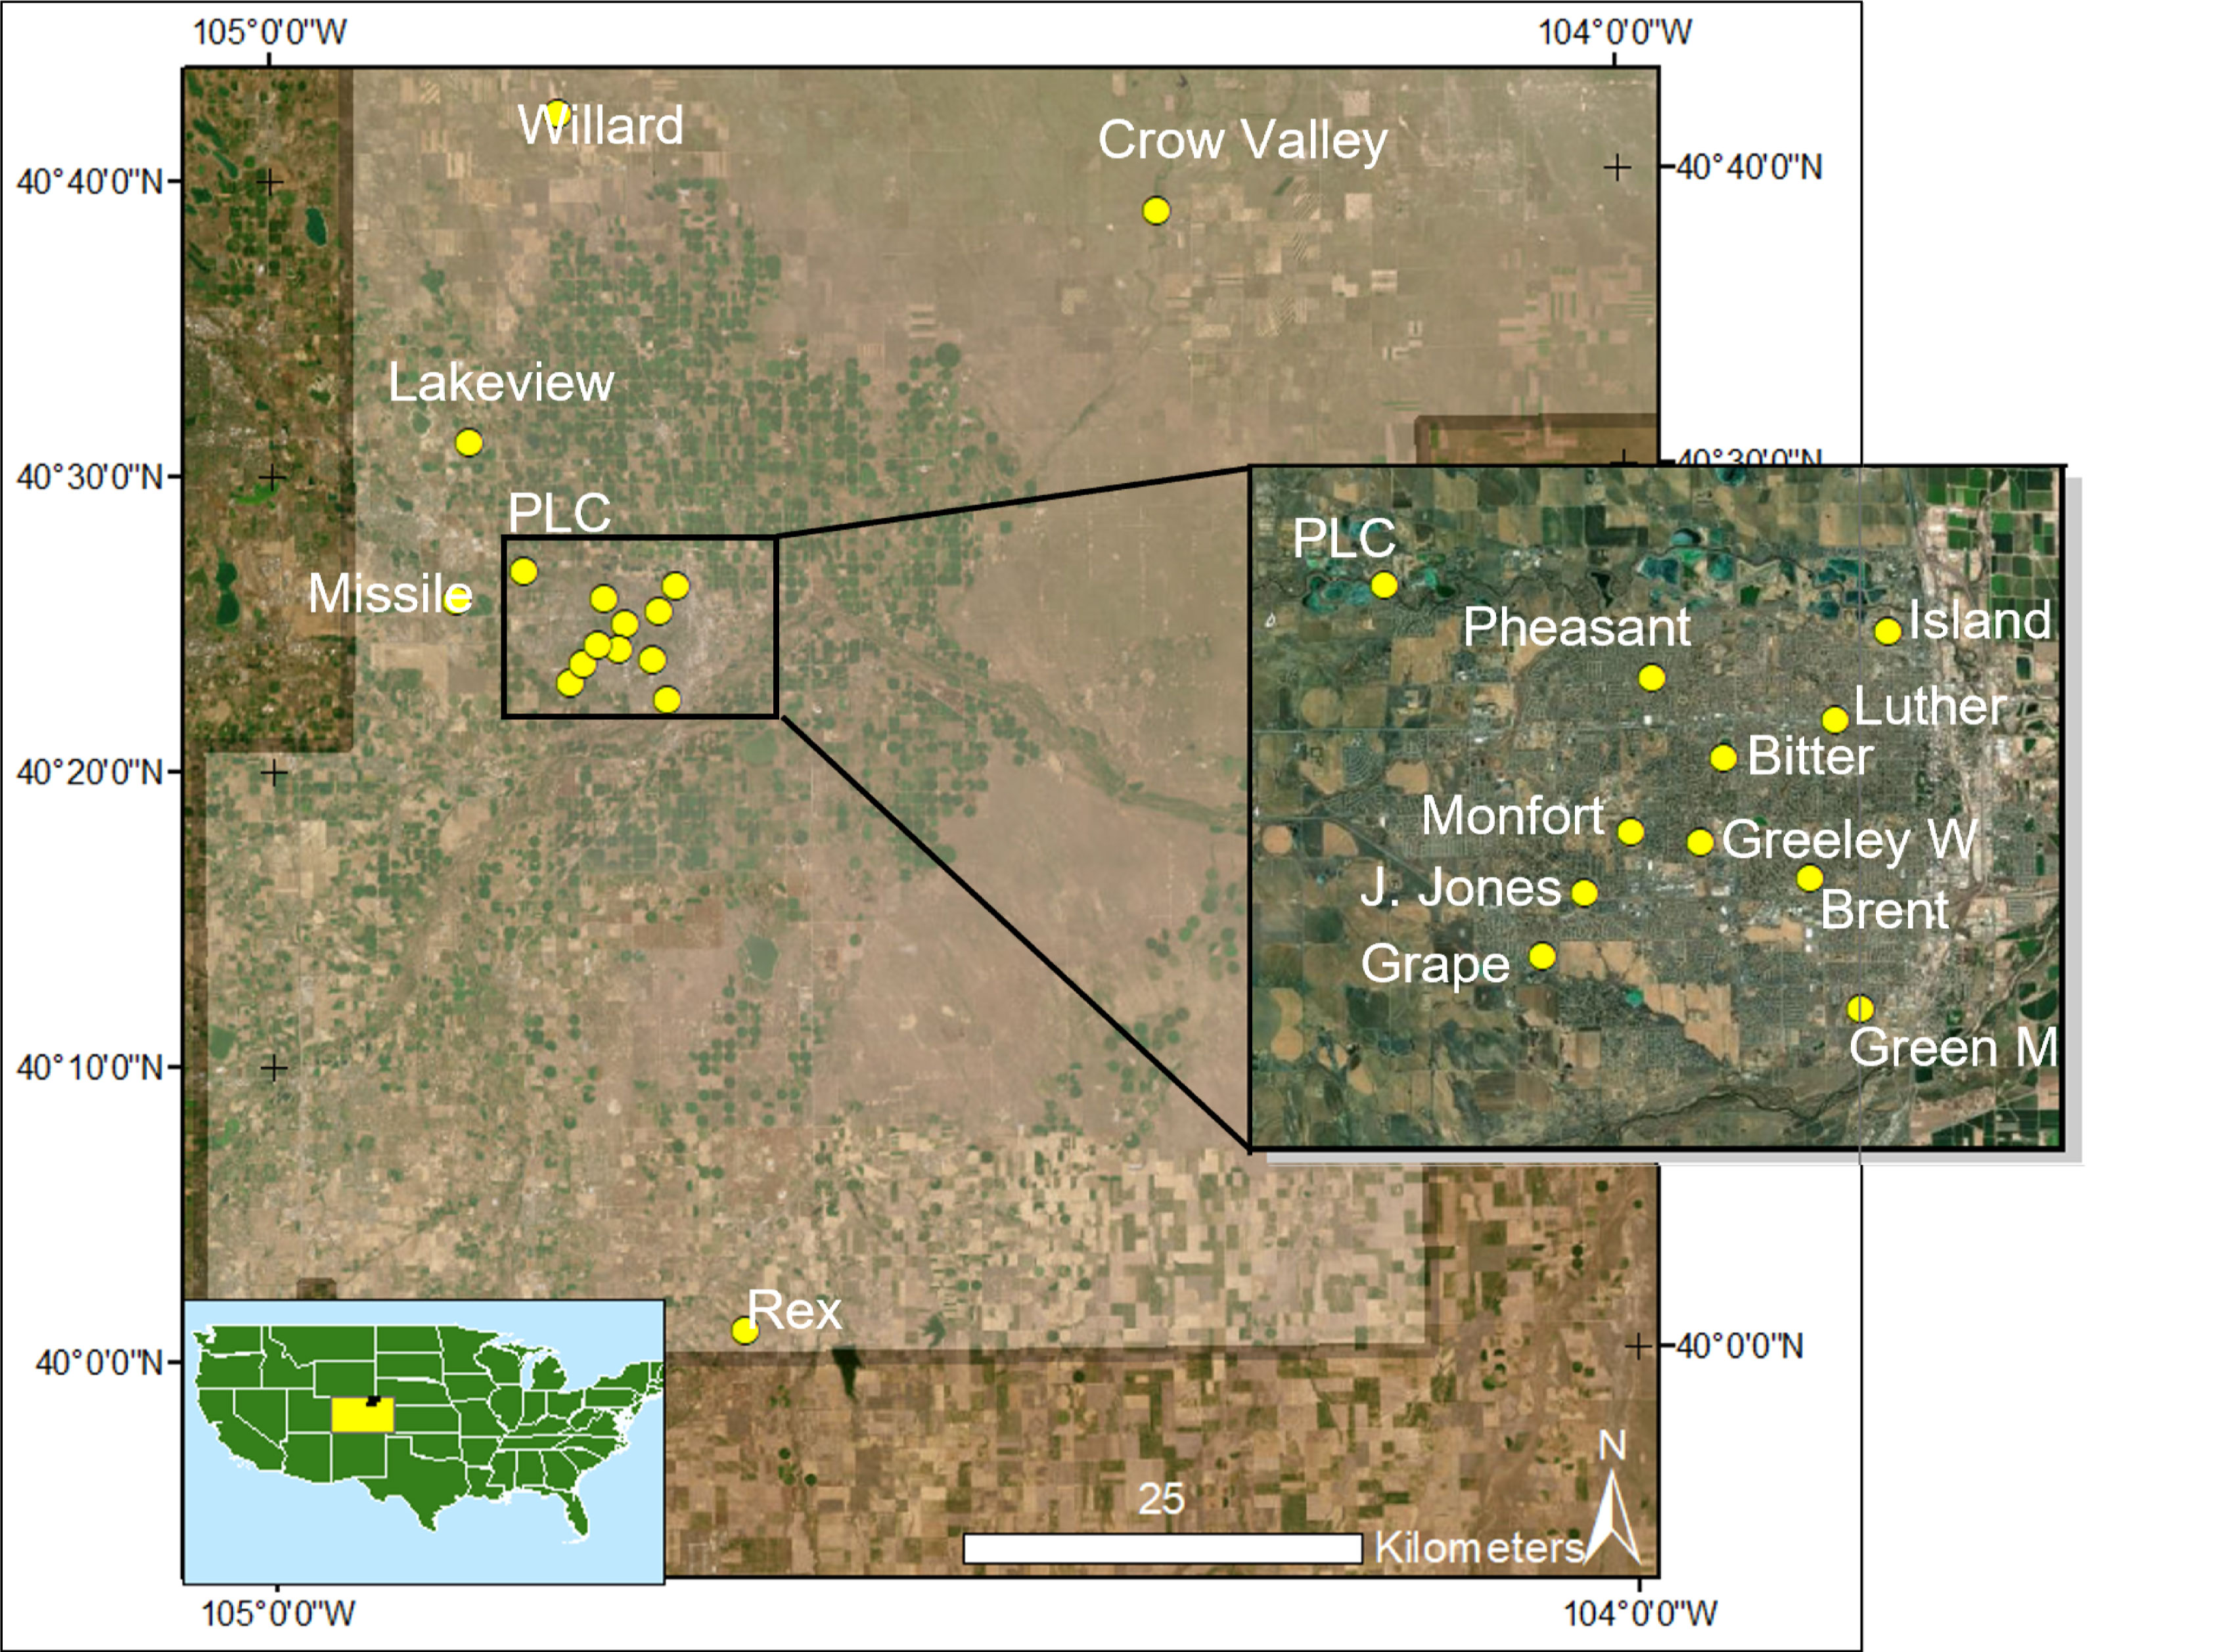
Figure 1 Map of site locations across Weld County, CO. Sites are shown by yellow circles and labeled with their name or abbreviated name. Maps were created using ArcMap 10.6.1 and the Colorado State Planes FIPS III North projected coordinate system.
Bird surveys were conducted at all 16 sites to determine avian abundance and composition. We used a modified point count survey protocol adapted from the USGS North American Breeding Bird Survey (Sauer and Droege, 1990). Surveys took place during the avian breeding season (i.e., May and June) of 2018 and occurred within 4 hours post-sunrise to coincide with peak bird activity. Point count duration was seven minutes at each site, a modification that stayed within suggested count duration (Ralph et al., 1995). Two researchers conducted all bird count surveys at every site. Birds were identified by sight and sound within a 250 m radius; the number of species and the number of individuals per species were recorded. Individuals flying over the location point were not counted, as we sought to focus on birds using the local habitat. Each survey location was revisited three times during the two-month survey period. We rotated timing and day of the week for visits to account for the effects of time and day among sites. For analyses, we took an average across the three count visits for number of each species present to account for all species seen at one site.
Landscape characteristics were extracted using ArcMap and the MRLC 2019 National Land Cover Database layers (Wickham et al., 2021). We created 400 m buffers around each point-count site to capture variation in landcover composition near the immediate locality. This buffer size reflected the area surveyed in our point counts. We used the Zonal Statistics tabulate tool to extract a total area represented in these buffers for each established land category (e.g., developed land, agriculture). This analysis was conducted in the Colorado FIPS III State Plane North projected coordinate system with a 30-m resolution. These data were then used to obtain a percentage of each land cover type at each site. Only 4% of the entire area sampled was categorized into the highest level of urbanization while 26% and 20% were categorized as low- and medium-intensity. Therefore, for simplicity, we combined the three highest development levels determined by the MRLC (22, Developed, low-intensity; 23, Developed, medium intensity; and 24, Developed, high intensity) into one category named “developed” but kept the developed open space category as a separate measure. Developed open-space includes areas of human-designed landscaping such as green space in cities, while the other three categories include human land use primarily for residential or commercial purposes. We also combined the forested areas into one category, the wetlands into one category, and the hay/pasture and cultivated crops into one category (HPC).
All sound and light data were collected in June 2018. Wildlife Acoustics Song Meters (SM2) were used to measure sound at each site. Recorders were set to record continuously for 24 hours over five consecutive days including 2 weekend days and 3 weekdays at a sampling rate of 48KHz and set to 0 gain (32 bits, waveform audio file format). We used the PAMGuide package (Merchant et al., 2015) in R Studio to batch process sound files and convert all audio data to calibrated 1-s one-third octave band SPLs from 12.5 to 8000 Hz (National Park Service, 2013). We extracted unweighted (dB) and A-weighted (dB(A)) Leq SPL measurements (i.e., summary of the acoustic energy across a frequency band of interest), a variable commonly used in environmental background noise monitoring (McKenna et al., 2016). Anthropogenic noise typically occurs at ranges below 2000 Hz (Merchant et al., 2015; Shannon et al., 2016). Therefore, we obtained Leq SPL measurements between the frequencies of 31.5 Hz and 1250 Hz (Buxton et al., 2018) in the recordings. Measurements were calculated for 10-minute timesteps and averaged over the five days of collection to obtain a 24-hr mean per site.
We used Sky Quality Meters (SQM-LU, Unihedron) to measure luminance (brightness) at each site by measuring ground reflectance in magnitudes per square arc second (mag/arcsec2). SQMs collected a reading every five minutes over five continuous days which coincided with the noise data collection. From these measures, we converted the logarithmic magnitudes into linear candela per square meter (cd/m2) for each site. This conversion inverts the scale of the magnitude measurement so that it is more intuitive; brighter sites will have higher values. Equipment for both noise and light measures were secured in trees close to the center of each site to coincide with the location of each bird survey. The package suncalc (Thieurmel and Elmarhraoui, 2022) was used in RStudio to generate the moon altitude, azimuth, and fraction for each SQM reading and classify the lunar phase. We only used data classified as astronomical twilight and nightfall – the darkest periods of the night. These data were sorted and assessed for potential variation due to cloud cover and moon phase. To focus on anthropogenic light at night, we only included data that were collected during the new and crescent lunar phases with clear skies.
To describe overall trends of noise and light regimes across our sampling area, we calculated descriptive statistics including mean, max, and min for noise and light at night measures over all days for each site.
To explore relationships between avian community structure and landscape attributes, we used a multivariate approach. Our main matrix was 16 rows (sites) by 41 columns (species). Species data were relativized by species maximum to account for the influence of hyper-abundant species. We explored removal of rare species (McCune and Mefford, 2011) but negligible improvements in beta diversity and the row and column coefficient of variance suggested we proceed with the full dataset. We evaluated groupings of sites and groupings of bird species using a two-way cluster analysis in PC-ORD version 7 (McCune and Mefford, 2011) with a Sørenson (Bray-Curtis) distance measure and Flexible Beta group linkage method, with beta set at –0.25 as recommended by McCune and Mefford (2011). This analysis created a dendrogram which we cut at various subjective points to create groups of species and sites to maximize interpretation.
We used a Nonmetric Multidimensional Scaling (NMS) analysis with a Sørenson (Bray-Curtis) distance measure to summarize the relationships among sites based on avian community composition. We ran the NMS ordination in PC-ORD version 7 (McCune and Mefford, 2011) using the autopilot mode under the “slow and thorough” option to identify the solution with the lowest stress and instability. We used a maximum of 500 iterations and ran 250 runs with real data and 250 runs with randomized data. Our final solution included 55 iterations. Ordination plots were rigidly rotated to load the strongest environmental variable onto a single axis. Pearson correlations were calculated between environmental variables or species abundance and each axis, and depicted as joint plots, to assess linear relationships among sites, species, and environmental variables. To evaluate the quality of ordination results, coefficients of determination (r2) were calculated in PC-ORD for each ordination axis; the resulting r2 values indicate the amount of variation that is represented by each axis.
We recorded a total of 1869 individual birds and identified 42 bird species across 16 sites in Weld County, CO (S1). The most frequently occurring species included the American Robin (Turdus migratorius), Common Grackle (Quiscalus quiscula), European Starling (Sturnus vulgaris), and House Finch (Haemorhous mexicanus). The average species richness (calculated as the total number of species recorded across all visits) was 15.38 per site, with richness ranging from 11 species at the least rich sites (Green M. and Pheasant) and 22 species at the most speciose site (PLC).
We tested correlations among the three urban environment characteristics: noise, light at night, and developed land. Light at night and developed land were the most strongly correlated (r = 0.48) followed by noise and developed land (r = 0.29) and noise and light (r = 0.25), however none of these correlations were significant (all p values > 0.3).
Developed land levels varied drastically across our 16 sites with an average of 50% developed land per site (within the 400 m buffer zone). For 12 out of the 16 sites, developed land was the most common land cover, ranging from 49% to 91%. Brentwood Park (Brent) and Luther Park (Luther) were our most developed sites with 91% and 90% developed land (Table 1). In both parks, the remaining land cover was developed open space or land developed by humans to include “green space” such as manicured lawns. Crow Valley Campground (Crow) was the least developed site with 0% developed and was land dominated by herbaceous, hay/pasture and cultivated crops (HPC) and wetland landcover in the area (Table 1).
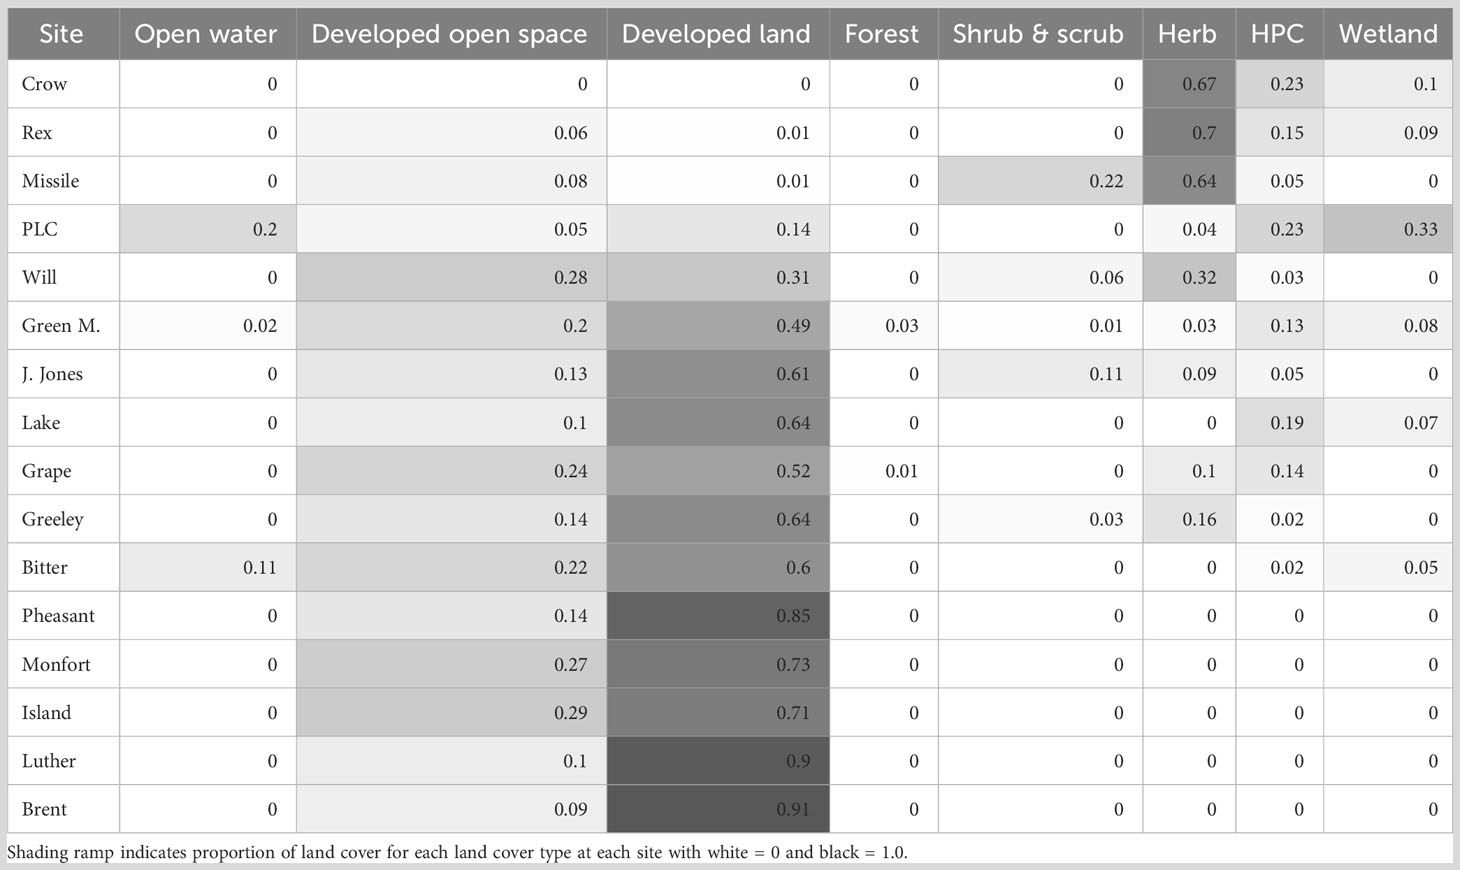
Table 1 Proportion of land cover for 16 sites, ordered by increasing proportion of developed land, and their respective 400 m buffer zones using the 2019 Multi-Resolution Land Characteristics Consortium National Land Cover Data.
Luminance measures of light at night ranged by nearly three orders of magnitude between the brightest (Bitter = 1.26 × 10⁻² cd/m2) and darkest (Crow = 3.8 × 10⁻⁵ cd/m2) site (Figure 2). Overall, sites had an average noise level of 46.9 dB(A)/61.5 dB. Luther Park had the loudest background noise with an average of 79.7 dB(A)/88.3 dB over 24 hours; this level is similar to the sound of a lawn mower or diesel truck. Grapevine Open Space was the quietest site at 37.3 dB(A)/51.8 dB, a sound level comparable to that of a quiet library (Figure 2).
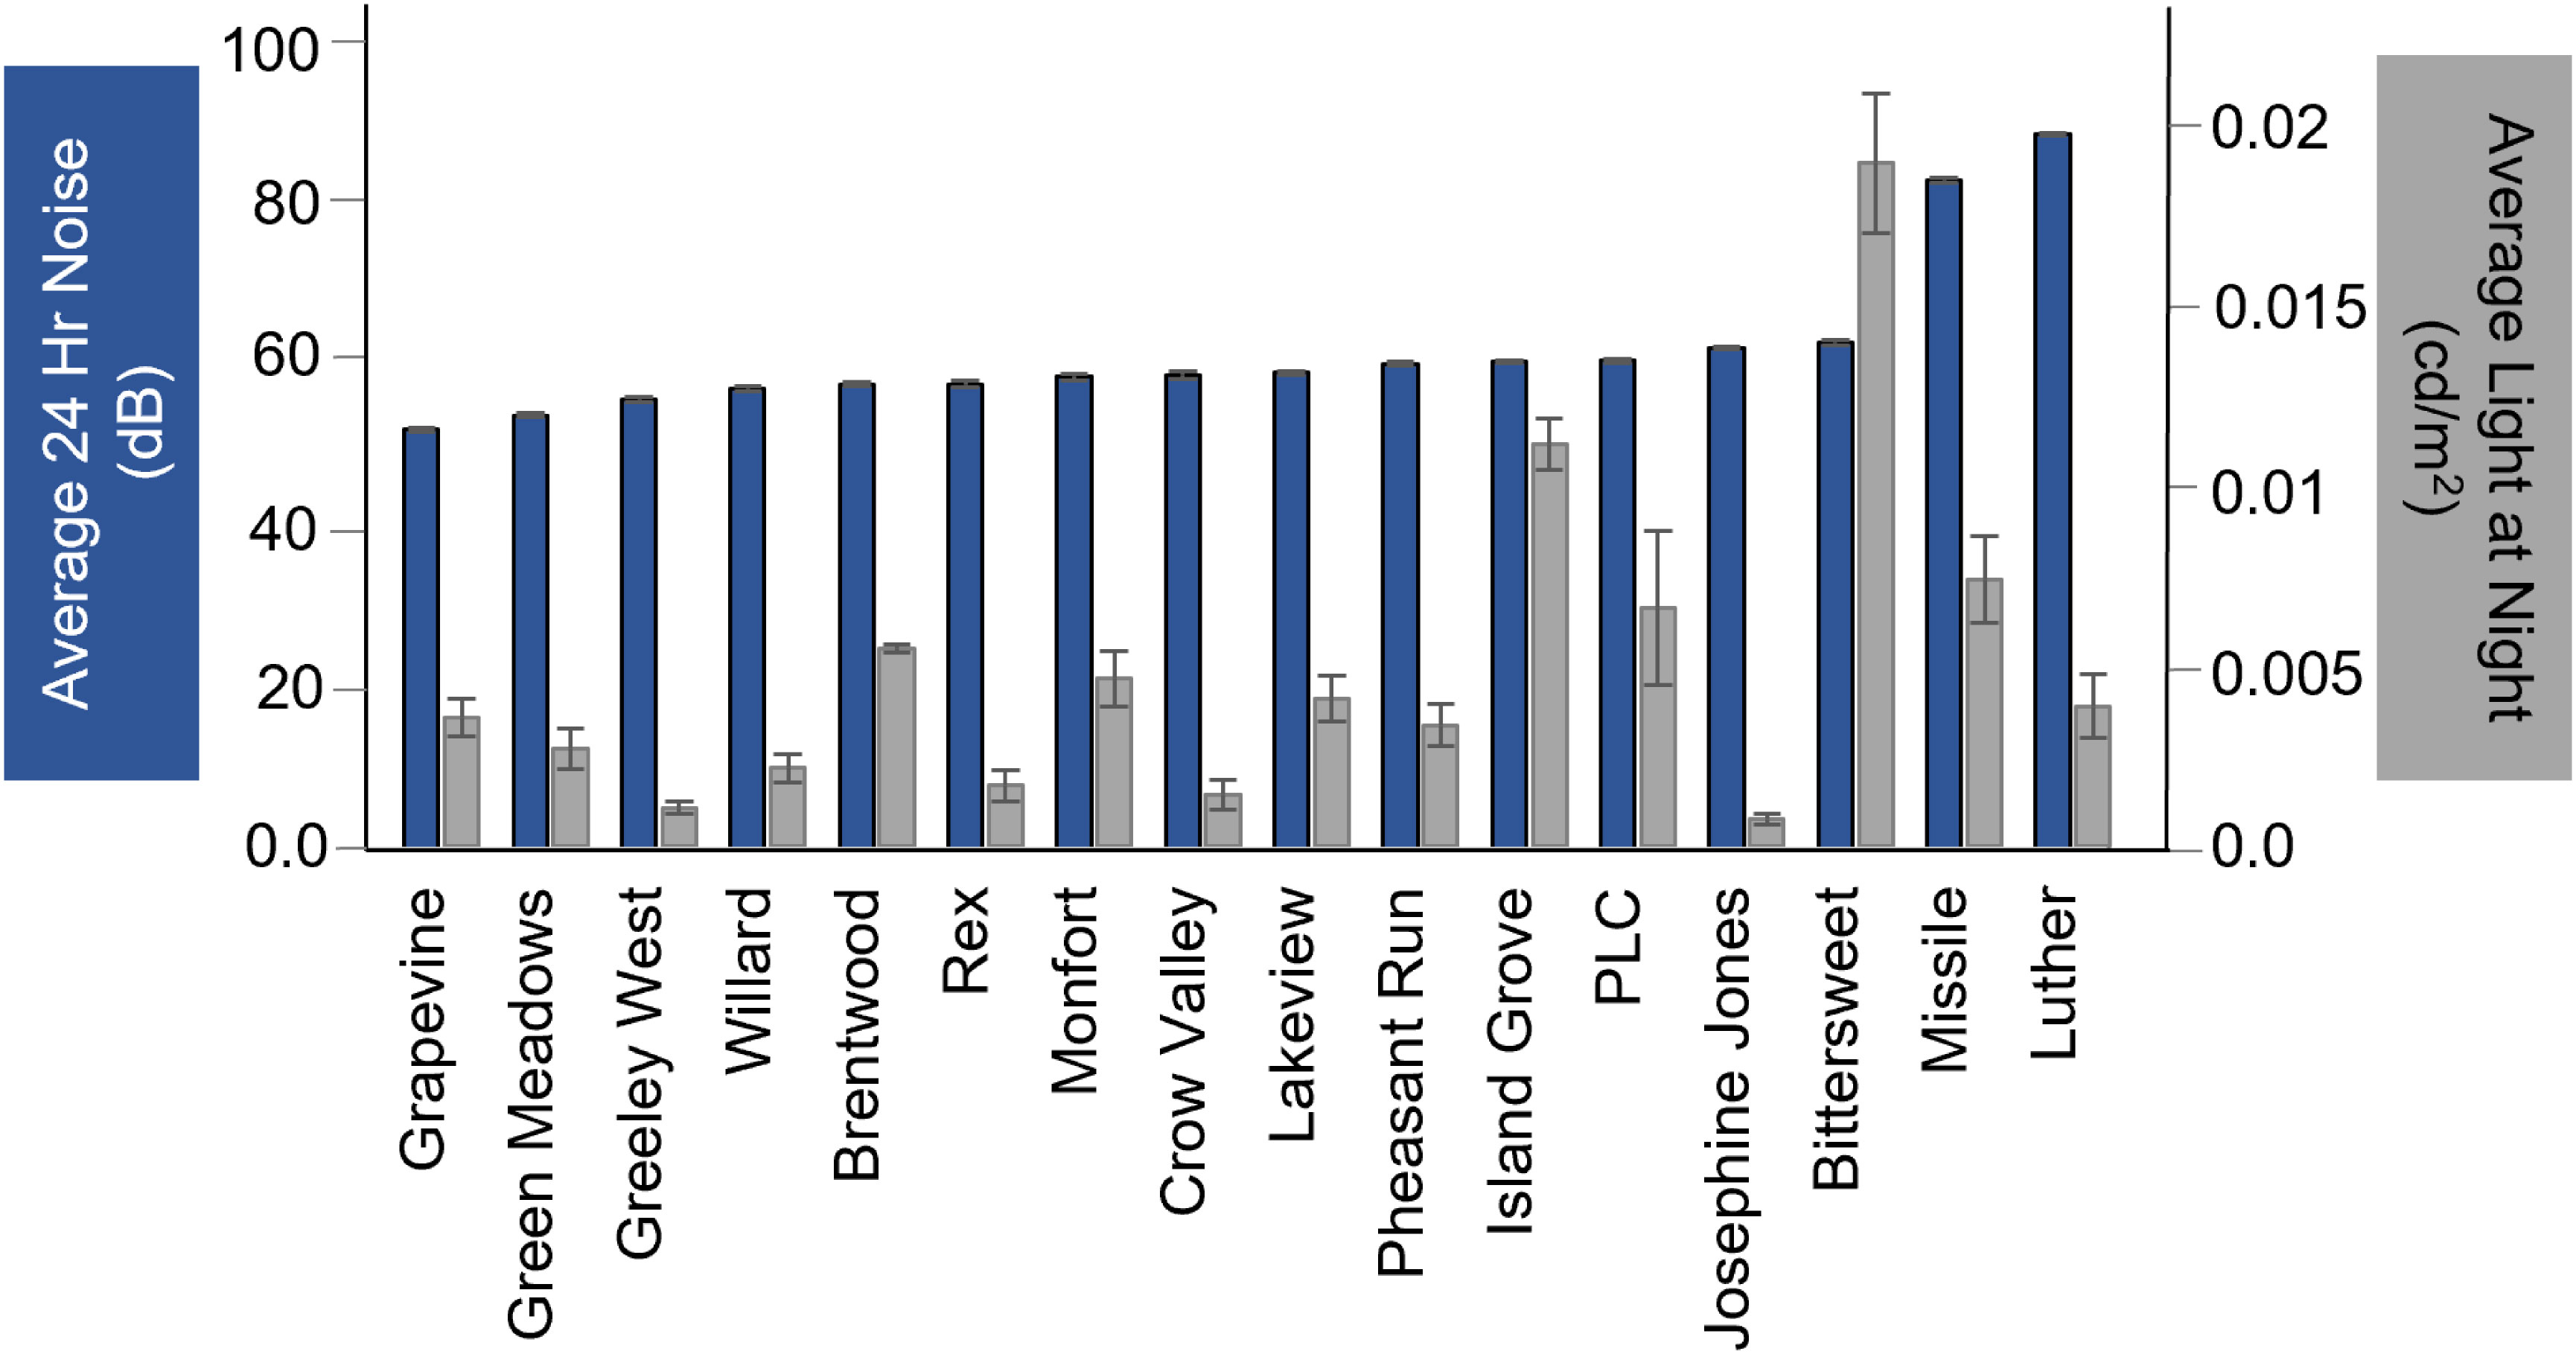
Figure 2 Average noise (dB) (dark blue bars, left axis) and light at night measurements (cd/m2) (gray bars, right axis) at each bird survey site.
The NMS analysis identified a solution that explained 93% of variation in our dataset using three axes. The three-axis solution constructed by NMS was stronger than expected by chance based on a randomization test (p = 0.004). The best solution yielded a final stress value of 6.5. The final instability was < 0.001 following 55 iterations. The first axis, which was rigidly rotated 40 degrees to maximize its relationship with percent developed land (r = 0.94), represented 38% of the variance. Axis 2 represented 42% and axis 3 represented 12% of community variation.
After rotation of axis 1, we had three additional variables with strong negative associations with this axis including herbaceous cover (r = −0.73), HPC (r = −0.72), and wetlands (r = −0.60). Developed open space (r = 0.52) was the only variable besides developed land with a strong positive association with axis 1. This land category consists of some constructed features but is predominately lawn-like vegetation (Figure 2). Light at night and noise, the other urban characteristics of interest, had only weak associations with axis 1 (r = 0.32 and r = 0.13, respectively).
Fifty-five percent of species had negative correlations with axis 1. Among these, the three strongest associations included Western Meadowlark (Sturnella neglecta; r = −0.88), Say’s Phoebe (Sayornis saya; r = −0.70), and House Wren (Troglodytes aedon; r = −0.68). The species most positively associated with axis 1 included American Crow (Corvus brachyrhynchos; r = 0.53), Common Raven (Corvus corax; r = 0.48), and American Robin (r = 0.46). However, these positive species associations are notably weaker than the negative species correlations with this axis. Shannon diversity and total richness measures had strong negative associations with axis 1 (r = −0.693; r = −0.642).
Axis two explained the most variation in our data (r2 = 0.419) but had weaker associations overall with environmental variables. The strongest associations with this axis were positive ones with HPC (hay/pasture and cultivated crops) and water (r = 0.47 and r = 0.43, respectively). Herbaceous and shrub/scrub land cover had the strongest negative relationships with axis 2 (r = −0.34 and r = −0.31, respectively). As seen in axis 1, light at night and noise had relatively weak association with this axis. Light at night was positively associated (r = 0.15), while noise was negatively associated (r = −0.15), with axis 2.
Fifty-two percent of species had positive associations with axis 2. The strongest positive associations were with Red-winged Blackbirds (Agelaius phoeniceus), Common Grackles, and Barn Swallows (Hirundo rustica) (r = 0.82, 0.76, 0.62, respectively). Species with strong negative associations included House Sparrows (Passer domesticus), European Starlings, and American Crows (r = −0.73, −0.64, −0.49, respectively). Shannon diversity had a negative association with axis 2 (r = −0.340) while richness had a positive association with axis 2 (r = 0.253).
The third axis had the weakest overall associations with environmental variables. Shrub/scrub land cover had the strongest association with this axis (r = −0.46). The next two strongest associations were positive with wetlands (r = 0.37) and open water (r = 0.33), both negatively associated with this axis. Both light at night and noise were very weakly and negatively associated with this axis (r = −0.03 and r = −0.002, respectively). American White Pelican (Pelecanus erythrorhynchos), American Goldfinch (Spinus tristis), and Osprey (Pandion haliaetus) were the most positively associated species with axis 3 (r = 0.658; 0.610; 0.678 respectively) while House Sparrow, Eurasian Collared Dove (Streptopelia decaocto), and Bullock’s Oriole (Icterus bullockii) were the most negatively associated species (r = −0.518; −0.484; −0.454 respectively).
For better interpretation, we trimmed both the site and species dendrograms, resulting in three site clusters (A, B, and C; Figure 3) and four species clusters (1–4; Figure 4). The species clusters, identified through the two-way cluster analysis, represent four groups of taxa commonly found at similar sites (Figure 4). The three site groups reflect variation in the dominant land cover such as developed (urban) land (site clusters B and C), open water and wetlands (site cluster A) and herbaceous land (site cluster A).
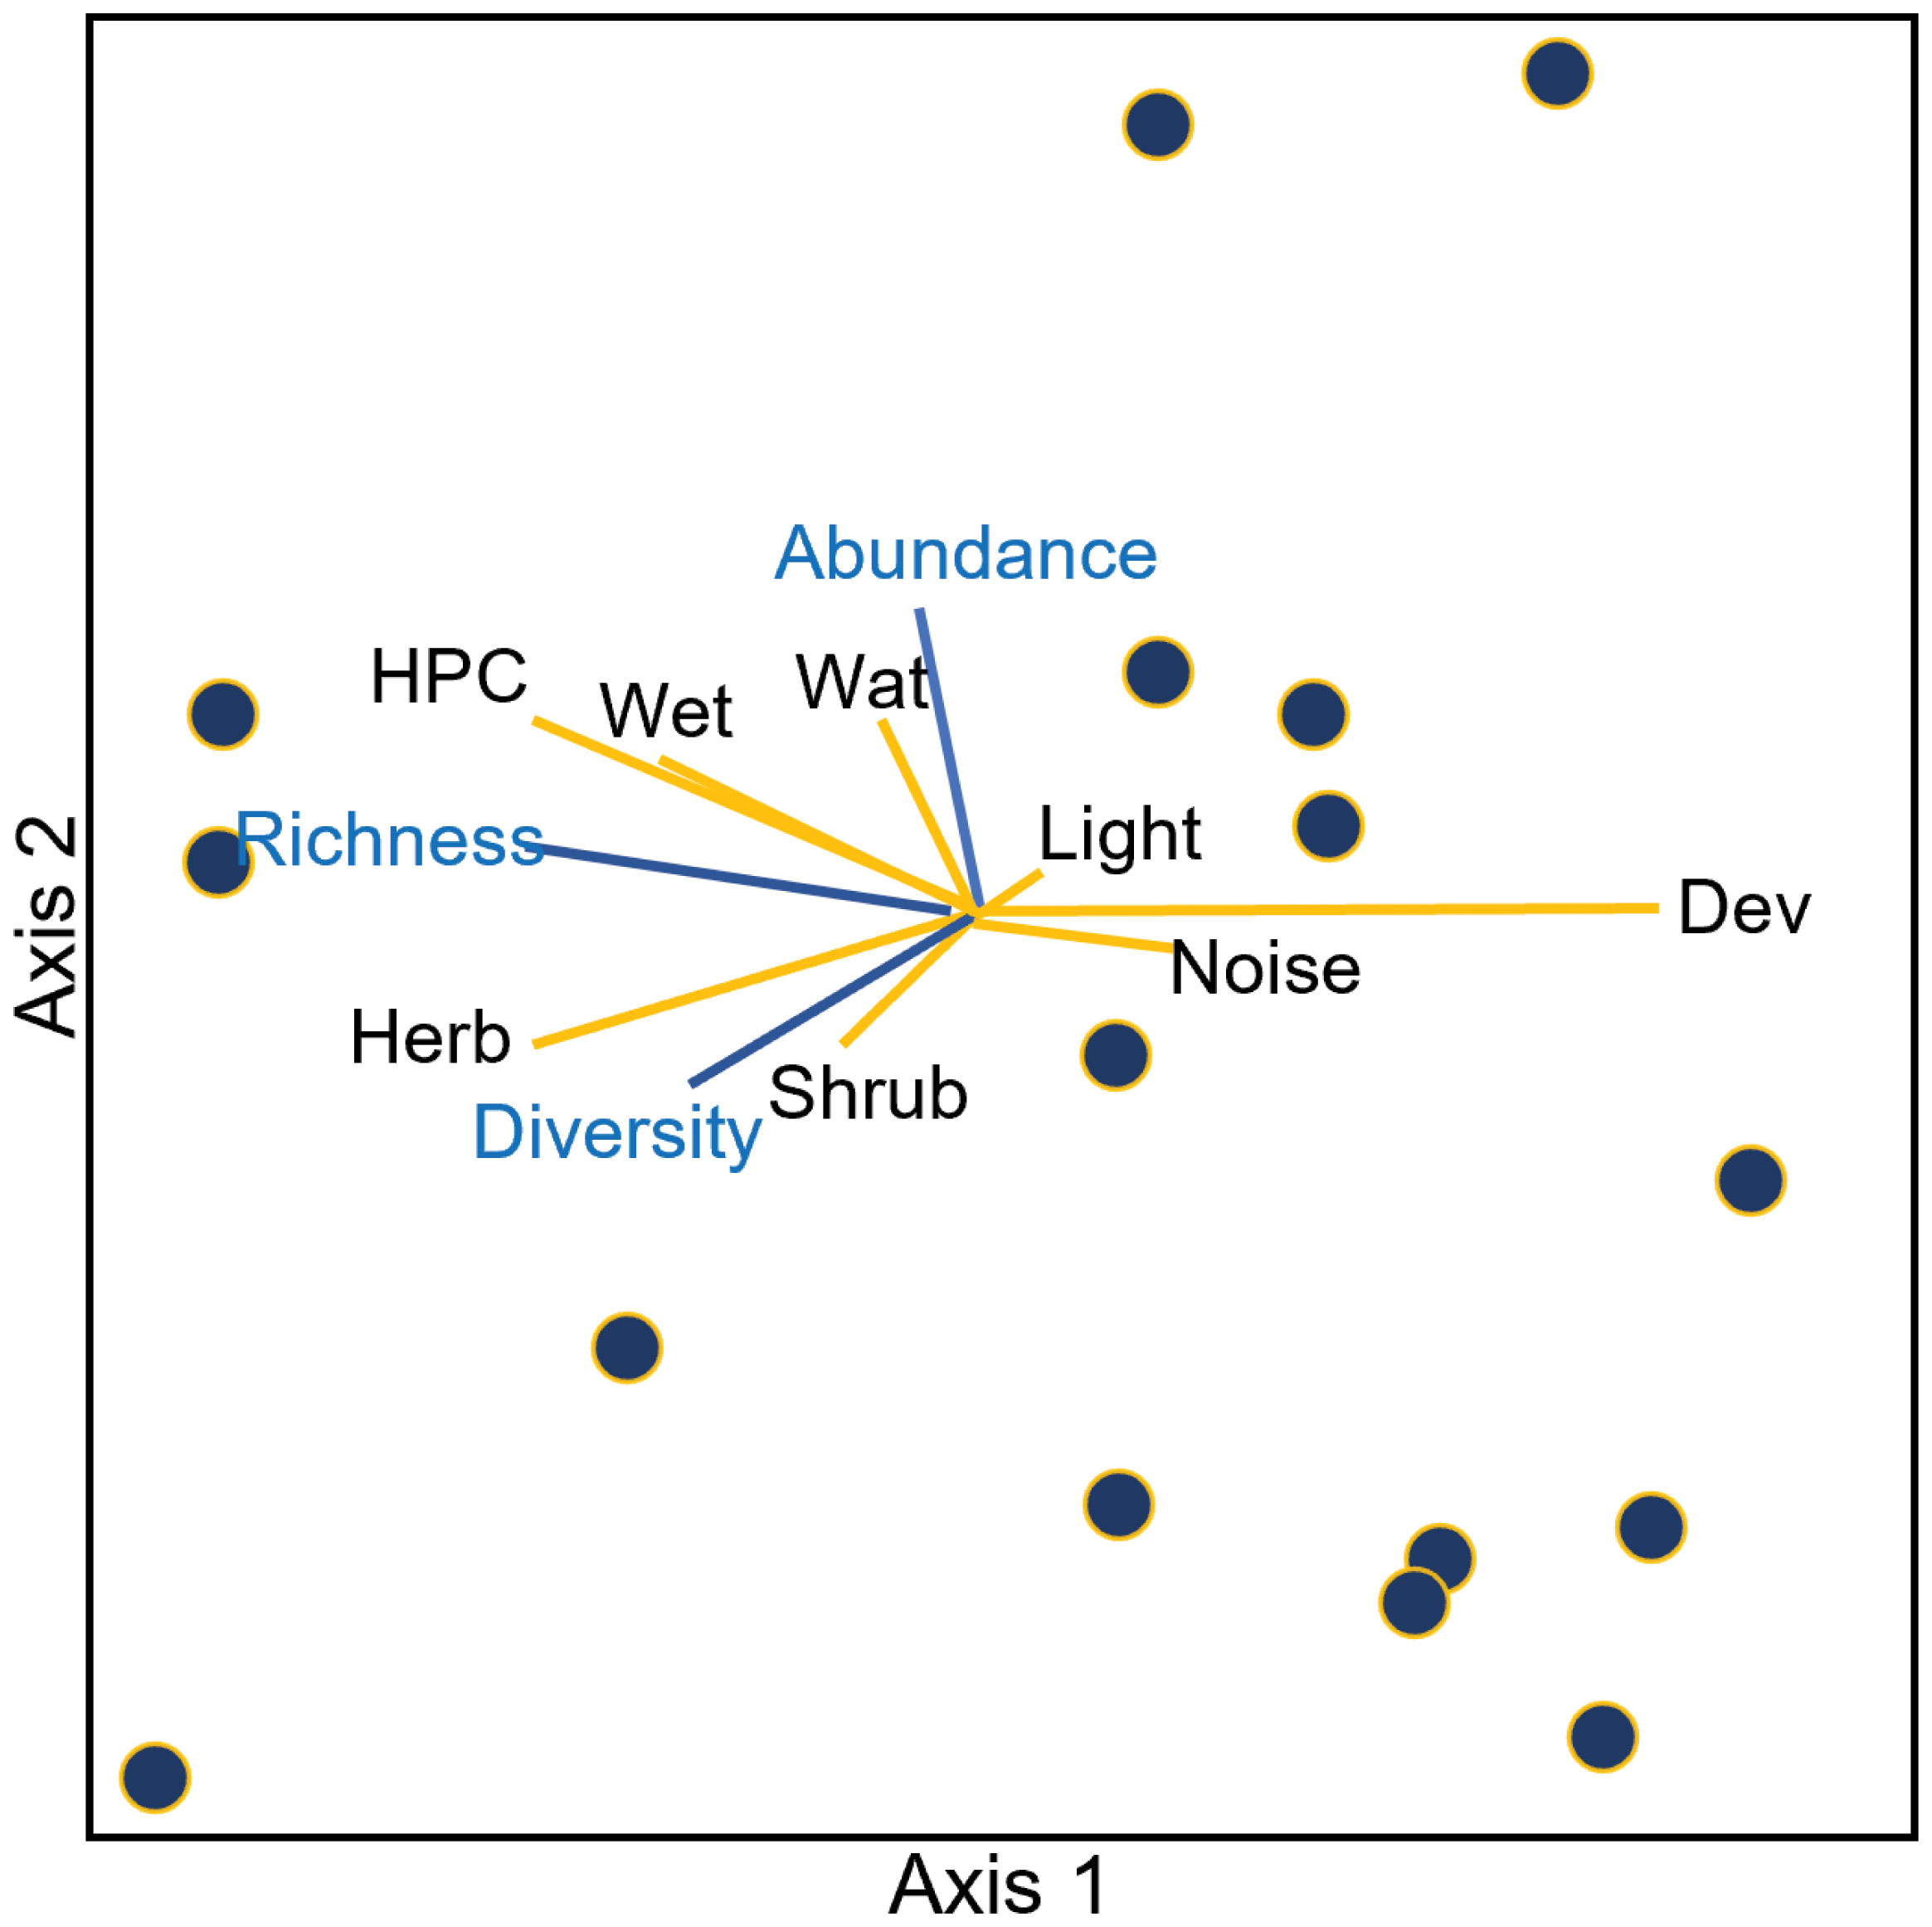
Figure 3 Non-metric multidimensional scaling (NMS) ordination of sites in species space rigidly rotated to align developed land (variable of high interest) with axis 1. The best solution was 3-D and thus axis 3 is not shown here. Sites are depicted in circles. Lines represent joint plots of environmental (yellow lines) and community variables (blue lines) of interest at each site (r2 cutoff = 0.05). Environmental variables include Developed land (Dev), Shrub/Scrub (Shrub), Herbaceous (Herb), Hay/Pasture and Crops (HPC), Wetland (Wet), Water (Wat), Noise (dB) and Light at night (cd/m2). Abundance refers to the average abundance at a site during a survey, richness refers to average species richness, and diversity refers to Shannon diversity.
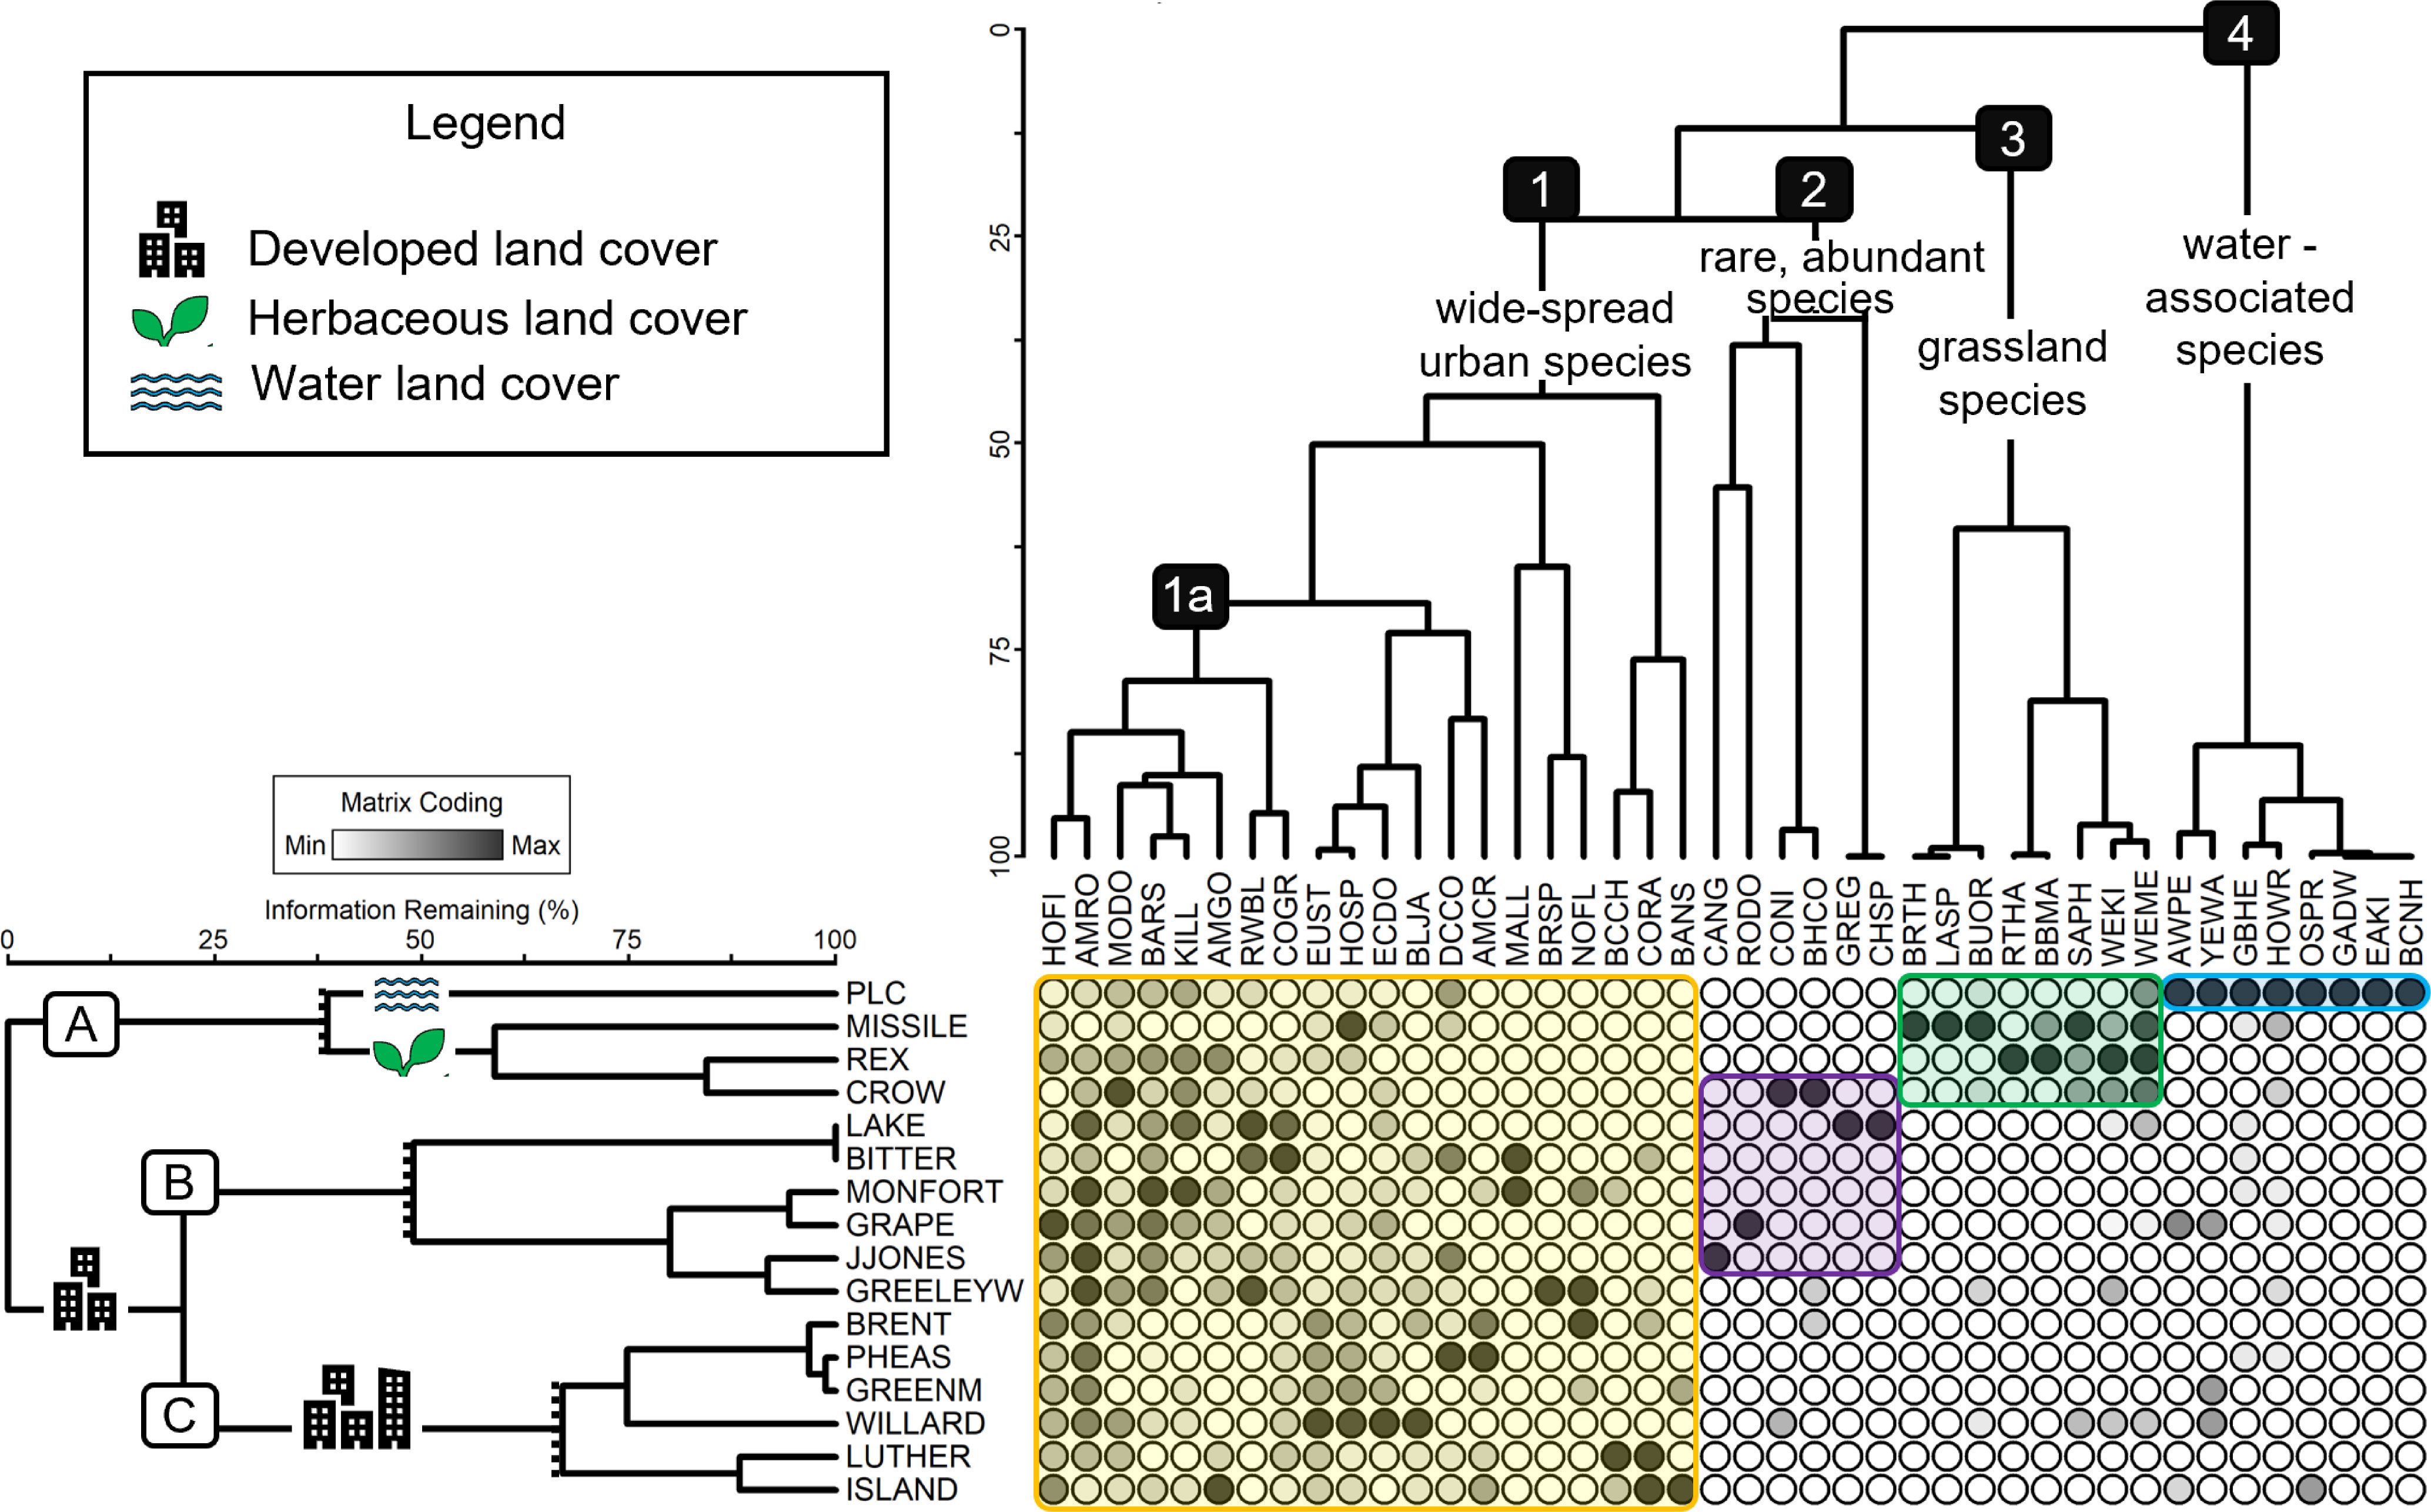
Figure 4 Dendrogram from two-way cluster analysis grouping sites and species by abundance. Each circle represents relative abundance (darker is more abundant) of each species at each site. The site dendrogram (to the left) clusters sites based on avian similarity. We recognized three site groups, labelled on the left with letters (A–C). Symbols (noted in the legend) overlapping the main branch of some groups signal key attributes of certain site groups. The species dendrogram (top of the figure) clusters species based on site similarity. We recognized four species groups, labeled with numbers (1–4), and are described briefly in text on the main branches of each species group. 1a represents a unique group, within species group 1, of birds that occurred at nearly every site. Using the intersection of our site and species clustering, we identified ubiquitous or unique combinations of species at sites that we interpret, and these combinations are represented by color-filled boxes overtop the species–site matrix. All species name codes are available in S1.
The first site cluster (A) represents the “undeveloped” sites, those with the least developed land with a range of water features and herbaceous land present (Table 1; Figure 4). All four sites included in this cluster had very low percentages of developed land and were dark at night, but average daily noise varied among these sites (Table 1; Figure 2). Within this cluster, two subgroups emerged: one with the site that included a predominant water feature and one with three sites that were mainly herbaceous land. The three undeveloped and herbaceous sites were driven by species cluster 3 which mainly includes grassland/Great Plains species such as Say’s Phoebe and Brown Thrasher (Taxostoma rufum). The Poudre Learning Center (PLC) clustered separately from the other undeveloped sites, driven by the presence of species commonly found near freshwater lakes and marshes (Figure 4, species cluster 4), such as the Great Blue Heron (Ardea Herodias) and American White Pelican. This site was the only site classified as undeveloped with a large water feature and was the second darkest site at night, though it was a relatively loud site (Figure 2).
Site cluster B is made up of sites dominated by developed land cover with an average of 66% developed land with variation in noise and light levels (Figures 2, 4). Generally, these sites are occupied by common urban species (species cluster 1) but are primarily driven by a subgroup of species within cluster 1 (1a). This subgroup includes eight open-cup nesting species that are commonly associated with suburban and urban areas (Figure 3) among them including the American Robin, House Finch, and American Goldfinch. While most of the species in 1a are present in nearly all the sites, the high abundances of these species are likely driving the clustering of sites found in this cluster. Site cluster B also includes four of the six species found in species cluster 2 which occurred in limited habitats, for example, Canada Geese (Branta canadensis) were primarily found at Josephine Jones Park (JJONES) while Chipping Sparrows (Spizella passerine) and Great Egrets (Ardea alba) were only found at Lake View Park (LAKE). The species that comprise species cluster 2 are not limited to site cluster B but were less widespread at sites outside this cluster. While these species are not common across our sites, where they were found, they were found in high abundances such as the Common Nighthawk (Chordeiles minor) at Crow Valley Campground.
The third and final site cluster (C) contains sites with little to no presence of water and moderate to high levels of developed land including the four most developed sites (Luther, Island, Brent, and Pheasant) (Table 1; Figure 4, site cluster C) There are no clear commonalities in noise or light at night regimes within this cluster. This cluster of sites are occupied primarily by widespread common species (cluster 1) but what clearly sets these sites apart from other sites is the lack of presence of species in clusters 2, 3, and 4. Over 50% of the species in these species clusters are missing from site cluster C.
The goal of this study was to describe the relationships between avian community structure and environmental factors associated with urbanization across a small but growing US city, using Greeley, CO as our case study. Contrary to our hypothesis, we found that anthropogenic noise, light, and developed land did not closely covary across our study areas (Figure 2). We found that land cover types, specifically, water, HPC and developed land, were the primary environmental variables associated with avian community composition. We also found that anthropogenic noise and light had only weak associations with avian community structure.
Historically, Weld County, Colorado is home to a grassland biome that supports ground-nesting bird species known to be impacted by urbanization (Croci et al., 2008). Surprisingly, we only identified five ground nesting birds, three of which were water birds, including Mallards (Anas platyrhynchos), Gadwalls (Mareca strepera), and American White Pelicans. With the exception of Killdeer (Charadrius vociferus) and Mallard, which were found in the ubiquitous species cluster 1, the remaining ground nesting birds grouped in species clusters 3 and 4 and were limited to sites in site cluster A. In contrast, forty percent of the bird species identified in our study were present at most of our sites. This large group of birds (Figure 4, cluster 1) consists of many “backyard birds” such as American Robins and American Goldfinches. This group together has a wide range of dietary, nesting, and migratory patterns. Most of these species are not grassland specialists, indicating that the urban areas of Weld County hold bird communities not representative of the historical biome of this region.
Urbanization is known to influence bird community composition (Rolando et al., 1997; Francis et al., 2009; Verma and Murmu, 2015; Manzanares Mena and Macías Garcia, 2018). Urbanization, however, can be measured in multiple ways. We found avian species composition to be less associated with anthropogenic noise and light at night than it was with landscape composition. Recent studies have found that noise and light can have mixed effects on species richness and abundance (Ciach and Fröhlich, 2017; Carral-Murrieta et al., 2020; Morelli et al., 2021; Wilson et al., 2021; Morelli et al., 2023; Orlando and Chamberlain, 2023) but we found that that when developed land is accounted for, noise and light were only weakly associated with site clustering. From the multivariate analyses we conducted, site community composition is primarily driven by landcover. First, the presence of water (Axis 2) is driving certain species to sites, and second, the presence of more developed land or more herbaceous and agricultural associated land cover (HPC) impacts community composition. This patterning may represent species-specific tolerance to land cover changes from more historically known land cover (grassland and agricultural land) to developed land for human use. The mechanisms contributing to the tolerance of species, however, are still in question and should be explored in future studies.
We predicted that noise, light, and developed land would covary, but we found no evidence of a linear relationship among these three characteristics. The site with the most noise (Luther Park) was relatively dark at night compared to other sites but was not bright as we predicted. The brightest site at night (Bitter Park) only had moderate noise. Finally, the most developed sites (Brentwood Park, Island Grove, Luther, and Pheasant Run Park) varied widely in the intensity of noise and light, and such patterns have only been shown in a few other studies (Buxton et al., 2020). Additionally, we found that light at night varied much more than anthropogenic noise measured across our sites. It should be noted that while light varied between sites, we found that our sites overall were darker than other cities (Falchi et al., 2016). This may be due to our decision to measure ground luminance (light reflected off the environment) rather than sky illuminance (light from a source, e.g., stars).
Noise and light may be more tightly associated with human development in large, densely populated, more historic cities (Han et al., 2018). Established cities continue to grow in population but grow little in space. The city of Greeley has grown rapidly over the last decade, and it is possible that responses to noise and light are not as immediate as the response to new structural habitat changes. It is reasonable to predict that habitat changes that deplete say, nesting sites, will affect a species immediately, whereas increased noise and light may disrupt certain behaviors or cycles but not preclude species presence. Additionally, the lack of strong positive relationships among noise, light, and landscape may be due to the population size of Weld County. Because Weld County and the city of Greeley are still expanding in both population and space, it is possible that the human density has not reached the threshold at which noise and light are maximized, given the degree of urban land cover.
We investigated the effects of urbanization on avian community structure by simultaneously measuring three key landscape attributes noise, light, and landscape composition. We found that avian community structure is highly associated with landcover composition but not strongly associated with noise or light. Although interest in urban ecology is increasing, few studies have incorporated all three of these key characteristics when studying urban wildlife (Ciach and Fröhlich, 2017; Buxton et al., 2020; Carral-Murrieta et al., 2020; Morelli et al., 2023). To our knowledge, this study is one of the first to test the effects of multiple modes of urban disturbance on avian community structure, by measuring each variable independently. Our study supports the literature suggesting that landscape composition is the most important environmental factor driving reduced avian diversity and changes to abundance in urban areas. It also highlights the nuance of noise and light that cannot be captured by using large satellite datasets or models based on proxies such as road density and human population. These nuances may contribute to the existence of mismatches between different urban disturbances at individual sites. As we work to create biodiverse, wildlife-friendly urban ecosystems, it is imperative that we consider the relative importance of multiple urban attributes and prioritize the management of the most impactful ones.
The datasets presented in this study can be found in online repositories. The names of the repository/repositories and accession number(s) can be found below: https://figshare.com/s/229db3b0fc2d875119e9.
Ethical approval was not required for the study involving animals in accordance with the local legislation and institutional requirements because this was an observational study in which at no time were animals handled – only observed. There was no modification of habitat or experimental manipulation involved.
KS: Conceptualization, Data curation, Formal Analysis, Funding acquisition, Investigation, Methodology, Project administration, Resources, Supervision, Visualization, Writing – original draft. LB: Conceptualization, Resources, Supervision, Writing – review & editing. EH: Methodology, Project administration, Supervision, Writing – review & editing.
KS was supported by an American Association of University Women American Dissertation Fellowship during the writing if this manuscript.
We thank Cameron Kennedy and Jeremy White for their contributions to data collection. We also thank Dr. Stephan Mackessy and Dr. Jessica Salo for feedback on manuscript drafts. We thank the National Parks Services Natural Sounds and Night Skies Division for loaning Sky Quality meters and Song Meters used in this project. We thank the reviewers for their feedback and helpful comments.
The authors declare that the research was conducted in the absence of any commercial or financial relationships that could be construed as a potential conflict of interest.
All claims expressed in this article are solely those of the authors and do not necessarily represent those of their affiliated organizations, or those of the publisher, the editors and the reviewers. Any product that may be evaluated in this article, or claim that may be made by its manufacturer, is not guaranteed or endorsed by the publisher.
The Supplementary Material for this article can be found online at: https://www.frontiersin.org/articles/10.3389/fevo.2023.1254280/full#supplementary-material
Alexandrino E. R., Buechley E. R., Karr J. R., de Barros Ferraz K. M. P. M., de Barros Ferraz S. F., do Couto H. T. Z., et al. (2017). Bird based index of biotic integrity: Assessing the ecological condition of Atlantic forest patches in human-modified landscape. Ecol. Indic. 73, 662–675. doi: 10.1016/j.ecolind.2016.10.023
Aronson M. F. J., La Sorte F. A., Nilon C. H., Katti M., Goddard M. A., Lepczyk C. A., et al. (2014). A global analysis of the impacts of urbanization on bird and plant diversity reveals key anthropogenic drivers. Proc. R. Soc. B.: Biol. Sci. 281, 20133330. doi: 10.1098/rspb.2013.3330
Aronson M. F. J., Lepczyk C. A., Evans K. L., Goddard M. A., Lerman S. B., MacIvor J. S., et al. (2017). Biodiversity in the city: Key challenges for urban green space management. Front. Ecol. Environ. 15, 189–196. doi: 10.1002/fee.1480
Beck N. R., Heinsohn R. (2006). Group composition and reproductive success of cooperatively breeding white-winged choughs (Corcorax melanorhamphos) in urban and non-urban habitat. Austral Ecol. 31, 588–596. doi: 10.1111/j.1442-9993.2006.01589.x
Blair R. B. (1996). Land use and avian species diversity along an urban gradient. Ecol. Appl. 6, 506–519. doi: 10.2307/2269387
Buxton R. T., McKenna M. F., Clapp M., Meyer E., Stabenau E., Angeloni L. M., et al. (2018). Efficacy of extracting indices from large-scale acoustic recordings to monitor biodiversity. Conserv. Biol. 32, 1174–1184. doi: 10.1111/cobi.13119
Buxton R. T., Seymoure B. M., White J., Angeloni L. M., Crooks K. R., Fristrup K., et al. (2020). The relationship between anthropogenic light and noise in US national parks. Landscape Ecol. 35, 1371–1384. doi: 10.1007/s10980-020-01020-w
Carral-Murrieta C. O., García-Arroyo M., Marín-Gómez O. H., Sosa-López J. R., Macgregor-Fors I. (2020). Noisy environments: Untangling the role of anthropogenic noise on bird species richness in a Neotropical City. Avian Res. 11, 1–7. doi: 10.1186/s40657-020-00218-5
Ciach M., Fröhlich A. (2017). Habitat type, food resources, noise and light pollution explain the species composition, abundance and stability of a winter bird assemblage in an urban environment. Urban. Ecosyst. 20, 547–559. doi: 10.1007/s11252-016-0613-6
City of Greeley. (2020). City of Greeley 2060 comprehensive plan land use. City of Greeley, Colorado. Available at: https://greeleygov.com/docs/default-source/community-development/2060-comprehensive-plan/2060-comp-plan---land-us.pdf (Accessed October 11, 2023).
Croci S., Butet A., Clergeau P. (2008). Does urbanization filter birds on the basis of their biological traits? Condor 110, 223–240. doi: 10.1525/cond.2008.8409
Devictor V., Julliard R., Couvet D., Lee A., Jiguet F. (2007). Functional homogenization effect of urbanization on bird communities. Conserv. Biol. 21, 741–751. doi: 10.1111/j.1523-1739.2007.00671.x
Falchi F., Cinzano P., Duriscoe D., Kyba C. C., Elvidge C. D., Baugh K., et al. (2016). The new world atlas of artificial night sky brightness. Sci. Adv. 2 (6), e1600377. doi: 10.1126/sciadv.1600377
Francis C. D., Ortega C. P., Cruz A. (2009). Noise pollution changes avian communities and species interactions. Curr. Biol. 19, 1415–1419. doi: 10.1016/j.cub.2009.06.052
Gardner J. L., Amano T., Backwell P. R. Y., Ikin K., Sutherland W. J., Peters A. (2014). Temporal patterns of avian body size reflect linear size responses to broadscale environmental change over the last 50 years. J. Avian Biol. 45, 529–535. doi: 10.1111/jav.00431
Gatesire T., Nsabimana D., Nyiramana A., Seburanga J. L., Mirville M. O. (2014). Bird diversity and distribution in relation to urban landscape types in northern Rwanda. Sci. World J. 2014, 157824. doi: 10.1155/2014/157824
Grunst A. S., Grunst M. L., Raap T., Pinxten R., Eens M. (2023). Anthropogenic noise and light pollution additively affect sleep behaviour in free-living birds in sex- and season-dependent fashions. Environ. pollut. 316, 120426. doi: 10.1016/j.envpol.2022.120426
Halfwerk W., Jerem P. (2021). A systematic review of research investigating the combined ecological impact of anthropogenic noise and artificial light at night. Front. Ecol. Evol. 9. doi: 10.3389/fevo.2021.765950
Han X., Huang X., Liang H., Ma S., Gong J. (2018). Analysis of the relationships between environmental noise and urban morphology. Environ. pollut. 233, 755–763. doi: 10.1016/j.envpol.2017.10.126
Lowry H., Lill A., Wong B. B. M. (2013). Behavioural responses of wildlife to urban environments. Biol. Rev. 88, 537–549. doi: 10.1111/brv.12012
Manzanares Mena L., Macías Garcia C. (2018). Songbird community structure changes with noise in an urban reserve. J. Urban. Ecol. 4, 1–8. doi: 10.1093/jue/juy022
Marzluff J. M., Ewing K. (2001). Restoration of fragmented landscapes for the conservation of birds: A general framework and specific recommendations for urbanizing landscapes. Urban. Ecol.: Int. Perspective. Interaction. Between. Humans. Nat. 9, 739–755. doi: 10.1007/978-0-387-73412-5_48
McCune B., Mefford M. J. (2011). PC-ORD. Multivariate Analysis of Ecological Data. Gleneden Beach, Oregon: MjM Software.
McDonnell M. J., Hahs A. K. (2008). The use of gradient analysis studies in advancing our understanding of the ecology of urbanizing landscapes: current status and future directions. Landscape Ecol. 23, 1143–1155. doi: 10.1007/s10980-008-9253-4
McKenna M. F., Shannon G., Fristrup K. (2016). Characterizing anthropogenic noise to improve understanding and management of impacts to wildlife. Endanger. Species Res. 31, 279–291. doi: 10.3354/esr00760
McKinney M. L. (2006). Urbanization as a major cause of biotic homogenization. Biol. Conserv. 127, 247–260. doi: 10.1016/J.BIOCON.2005.09.005
McKinney M. L., Lockwood J. L. (1999). Biotic homogenization: A few winners replacing many losers in the next mass extinction. Trends Ecol. Evol. 14, 450–453. doi: 10.1016/S0169-5347(99)01679-1
Mehlman D. W. (1997). Change in avian abundance across the geographic range in response to environmental change. Ecol. Appl. 7, 614. doi: 10.2307/2269525
Mekonen S. (2017). Birds as biodiversity and environmental indicator. Adv. Life Sci. Technol. 60, 2017.
Melles S., Glenn S., Martin K. (2003). Urban bird diversity and landscape complexity: Species-environment associations along a multiscale habitat gradient. Ecol. Soc. 7. doi: 10.5751/ES-00478-070105
Merchant N. D., Fristrup K. M., Johnson M. P., Tyack P. L., Witt M. J., Blondel P., et al. (2015). Measuring acoustic habitats. Methods Ecol. Evol. 6, 257–265. doi: 10.1111/2041-210X.12330
Moll R. J., Cepek J. D., Lorch P. D., Dennis P. M., Tans E., Robison T., et al. (2019). What does urbanization actually mean? A framework for urban metrics in wildlife research. J. Appl. Ecol. 56, 1289–1300. doi: 10.1111/1365-2664.13358
Morelli F., Benedetti Y., Ibáñez-Álamo J. D., Tryjanowski P., Jokimäki J., Kaisanlahti-Jokimäki M. L., et al. (2021). Effects of urbanization on taxonomic, functional and phylogenetic avian diversity in Europe. Sci. Total. Environ. 795, 148874. doi: 10.1016/J.SCITOTENV.2021.148874
Morelli F., Tryjanowski P., Ibáñez-Álamo J. D., Díaz M., Suhonen J., Pape Møller A., et al. (2023). Effects of light and noise pollution on avian communities of European cities are correlated with the species’ diet. Sci. Rep. 13, 1–11. doi: 10.1038/s41598-023-31337-w
National Park Service (2013). Acoustical Monitoring Training Manual. Fort Collins, CO: National Park Service Department of the Interior Natural Sounds and Night Skies Division.
Newbold T., Scharlemann J. P. W., Butchart S. H. M., Şekercioğlu Ç.H., Joppa L., Alkemade R., et al. (2014). Functional traits, land-use change and the structure of present and future bird communities in tropical forests. Global Ecol. Biogeogr. 23, 1073–1084. doi: 10.1111/geb.12186
Orlando G., Chamberlain D. (2023). Tawny Owl strix aluco distribution in the urban landscape: the effect of habitat, noise and light pollution. aorn 57, 167–179. doi: 10.3161/00016454AO2022.57.2.005
Ortega-Álvarez R., MacGregor-Fors I. (2009). Living in the big city: Effects of urban land-use on bird community structure, diversity, and composition. Landscape Urban. Plann. 90, 189–195. doi: 10.1016/j.landurbplan.2008.11.003
Perilla A., Mazzoni L. G., Passos L. F., Goulart V. D. L. R., Duca C., Young R. J. (2017). Anthropogenic noise reduces bird species richness and diversity in urban parks. Ibis 159, 638–646. doi: 10.1111/ibi.12481
Proppe D. S., Sturdy C. B., St. Clair C. C. (2013). Anthropogenic noise decreases urban songbird diversity and may contribute to homogenization. Global Change Biol. 19, 1075–1084. doi: 10.1111/gcb.12098
Ralph C. J., Droege S., Sauer J. R. (1995). Monitoring Bird Populations by Point Counts. Gen. Tech. Rep. PSW-GTR-149, Pacific Southwest Research Station, USDA Forest Service, Albany.
Reale J. A., Blair R. B. (2006). Nesting success and life-history attributes of bird communities along an urbanization gradient. Urban. Habitats. 3, 1–24.
Rolando A., Maffei G., Pulcher C., Giuso A., Gpso C. P., Piemontese G., et al. (1997). Avian community structure along an urbanization gradient. Ital. J. Zool. 64, 341–349. doi: 10.1080/11250009709356221
Rosenberg K. V., Dokter A. M., Blancher P. J., Sauer J. R., Smith A. C., Smith P. A., et al. (2019). Decline of the north american avifauna. Science 366, 120–124. doi: 10.1126/science.aaw1313
Sauer J., Droege S. (Eds.) (1990). Survey designs and statistical methods for the estimation of avian population trends. (US Department of the Interior, Fish and Wildlife Service), vol. 90.
Seress G., Sándor K., Evans K. L., Liker A. (2020). Food availability limits avian reproduction in the city: An experimental study on great tits Parus major. J. Anim. Ecol. 89, 1570–1580. doi: 10.1111/1365-2656.13211
Shannon G., McKenna M. F., Angeloni L. M., Crooks K. R., Fristrup K. M., Brown E., et al. (2016). A synthesis of two decades of research documenting the effects of noise on wildlife. Biol. Rev. 91, 982–1005. doi: 10.1111/brv.12207
Thieurmel B., Elmarhraoui A. (2022). suncalc: compute sun position, sunlight phases, moon position and lunar phase. R package version 0.5.1.
United Nations. (2018). World urbanization prospects 2018: highlights ‐ United Nations, Department of Economic and Social Affairs, Population Division, 2019 Available at: https://population.un.org/wup/publications/Files/WUP2018-Highlights.pdf.
US Census Bureau. (2020). “QuickFacts: greeley Colorado 2020 population estimates,“ in United States Census Bureau, 1 April 2020. Available at: https://www.census.gov/quickfacts/fact/table/greeleycitycolorado,US/PST040222 (Accessed October 11, 2023).
US Census Bureau. (2023). Annual Estimates of the Resident Population for Incorporated Places of 50,000 or More, Ranked by July 1, 2022 Population: April 1, 2020 to July 1, 2022 (US Census Bureau, Population Division).
Vallejos M. A. V., Padial A. A., Vitule J. R. S. (2016). Human-induced landscape changes homogenize atlantic forest bird assemblages through nested species loss. PloS One 11, 1–17. doi: 10.1371/journal.pone.0147058
Verma S. K., Murmu T. D. (2015). Impact of environmental and disturbance variables on avian community structure along a gradient of urbanization in Jamshedpur, India. PloS One 10, e0133383. doi: 10.1371/journal.pone.0133383
Votsi N.-E. P., Kallimanis A. S., Pantis I. D. (2017). An environmental index of noise and light pollution at EU by spatial correlation of quiet and unlit areas. Environ. pollut. 221, 459–469. doi: 10.1016/j.envpol.2016.12.015
Weld County Comprehensive Plan. (2020). Available at: https://library.municode.com/co/weld_county/codes/charter_and_county_code?nodeId=CH22COPL.
Wickham J., Stehman S. V., Sorenson D. G., Gass L., Dewitz J. A. (2021). Thematic accuracy assessment of the NLCD 2016 land cover for the conterminous United States. Remote Sens. Environ. 257, 112357. doi: 10.1016/j.rse.2021.112357
Willems J. S., Phillips J. N., Francis C. D. (2022). Artificial light at night and anthropogenic noise alter the foraging activity and structure of vertebrate communities. Sci. Total. Environ. 805, 150223. doi: 10.1016/J.SCITOTENV.2021.150223
Wilson A. A., Ditmer M. A., Barber J. R., Carter N. H., Miller E. T., Tyrrell L. P., et al. (2021). Artificial night light and anthropogenic noise interact to influence bird abundance over a continental scale. Global Change Biol. 27, 3987–4004. doi: 10.1111/gcb.15663
Xu W., Fu W., Dong J., Yu J., Huang P., Zheng D., et al. (2022). Bird communities vary under different urbanization types – A case study in mountain parks of Fuzhou, China. Diversity 14, 555. doi: 10.3390/d14070555
Keywords: urban ecology, urban birds, community composition, land cover, noise pollution, light pollution
Citation: Sanchez KA, Benedict L and Holt EA (2023) Landscape composition is a stronger determinant than noise and light of avian community structure in an urbanizing county. Front. Ecol. Evol. 11:1254280. doi: 10.3389/fevo.2023.1254280
Received: 06 July 2023; Accepted: 02 October 2023;
Published: 17 October 2023.
Edited by:
Augusto João Piratelli, Federal University of São Carlos, BrazilReviewed by:
Wayne C. Zipperer, Forest Service (USDA), United StatesCopyright © 2023 Sanchez, Benedict and Holt. This is an open-access article distributed under the terms of the Creative Commons Attribution License (CC BY). The use, distribution or reproduction in other forums is permitted, provided the original author(s) and the copyright owner(s) are credited and that the original publication in this journal is cited, in accordance with accepted academic practice. No use, distribution or reproduction is permitted which does not comply with these terms.
*Correspondence: Karina A. Sanchez, dXJiYW5iaXJkbmVyZEBnbWFpbC5jb20=
†ORCID: Karina A. Sanchez, orcid.org/0000-0003-2336-3624
Disclaimer: All claims expressed in this article are solely those of the authors and do not necessarily represent those of their affiliated organizations, or those of the publisher, the editors and the reviewers. Any product that may be evaluated in this article or claim that may be made by its manufacturer is not guaranteed or endorsed by the publisher.
Research integrity at Frontiers
Learn more about the work of our research integrity team to safeguard the quality of each article we publish.