 Huaiyu Wang
 Yongmei Liu
 Xinghua Ge
 Xingzhi Dong1
- 1College of Urban and Environmental Sciences, Northwest University, Xi’an, China
- 2Shaanxi Key Laboratory of Earth Surface System and Environmental Carrying Capacity, Xi’an, China
Stellera chamaejasme is highly invasive and causes a significant threat to alpine grassland on the Qinghai-Tibet Plateau. It is important to determine its distribution pattern in order to stem the rapid invasion of this toxic weed. In the present study, strategies for mapping S. chamaejasme based on UAV Resonon hyperspectral imaging were assessed in combination with dimension reduction, clustering and ordination analysis, and spectral separability measurement. Field spectrometry analysis showed that the hierarchical procedure of Kruskal-Wallis test and Dunn’s post hoc test, CART and JM distance can efficiently select the minimum optimal wavelengths for S. chamaejasme discrimination and considerably reduce the dimensions of hyperspectral imagery. DCA and RDA ordination revealed that S. chamaejasme identification at the species level is difficult even using hyperspectral feature bands. The reaggregating of TWINSPAN ecological communities based on the criterion of JM distance > 1.9 can result in spectrally delineated S. chamaejasme communities and the co-existing species community. Applying three algorithms of MLC, RF, and SVM, the performance of S. chamaejasme classification based on JM-TWINSPAN schemes was significantly improved compared to that based on TWINSPAN schemes. Of these, RF and JM-TWINSPAN achieved the best classification result (OA = 91.00%, Kappa = 0.83, AD = 14.0%, and QD = 1.2%). The result indicates that the promising accuracy can be achieved in accurate mapping of S. chamaejasme by a multivariate approach, which combines ecological analysis and separability measurement with image classification.
1 Introduction
Stellera chamaejasme is a toxic invasive species that significantly threatens ecosystem balance and animal husbandry in western China. This is causing increasingly difficult ecological and sustainable development problems in the Qinghai-Tibet Plateau (QTP), especially in the alpine grasslands (Zhang et al., 2010; Zhang et al., 2011). S. chamaejasme is a perennial grass, belonging to the Thymelaeaceae family. Its flowering occurs from late June to late July, characterized by dense white-pink inflorescences of capitula (Shi, 1997). S. chamaejasme invasions form large stands and dense canopies that contribute to grassland degradation, and heavy infections of the toxic weed cause notable reduction in palatable grasses (Harris, 2010). S. chamaejasme is widespread in alpine meadows and alpine steppes of the eastern areas in Qinghai Province, creating a typically degraded grassland landscape (Bao et al., 2019). To establish the pragmatic management of this species, information about its spatial distribution and abundance is essential.
Over recent decades, remote sensing techniques have used spectral information to perform vegetation mapping, offering fast and efficient options for plant invasion monitoring (Ana et al., 2018). However, the accurate detection of herbaceous plants remains difficult owing to the similarity of spectra and texture among species (Schmidt and Skidmore, 2003; Jana et al., 2017). Hyperspectral instruments can significantly improve the discrimination by capitalizing on the differences in vegetation spectra associated with biophysical or biochemical characteristics (Subhashni et al., 2012; Ullah et al., 2021). Most recently, hyperspectral imaging by unmanned aerial vehicles (UAV) has shown great potential for characterizing spatial and temporal dynamics of vegetation, and is gaining traction in studies of mapping weed species such as Mikania micrantha Kunth (Huang et al., 2021), Phragmites australis and other wetland plant species (Du et al., 2021). Dimension reduction is fundamental for achieving reliable results when working with hyperspectral images (Huang et al., 2021). Studies have been carried out for selecting optimal hyperspectral bands in the discrimination of Beta vulgaris and Cirsium arvensis, Ridolfia segetum and Helianthus annuus, and Spartina alterniflora and other species (Francisco et al., 2015; Peña-Barragán et al., 2006; Wang et al., 2021), all obtained satisfactory effects. Instead of single techniques, a hierarchical procedure that integrates statistical tests, classification and regression trees (CART), and Jeffries-Matusita (JM) distance was used to identify the optimal bands for discriminating Cyperus papyrus and Arundo donax (Adam and Mutanga, 2009; Fernandes et al., 2013). The approach could systematically reduce spectral dimensions to a manageable level and so be a useful procedure for refining the most sensitive bands for herbaceous species detection (Fernandes et al., 2013).
Because the complexity of ecosystem results in a continuum of vegetation cover, a methodological combination of clustering and ordination is often used to classify vegetation communities and characterize their environmental variables (Brook and Kenkel, 2002; Thomas et al., 2003). On the other hand, spectral classification is a modeling procedure whereby vegetation types are classified based on the measure of reflected electromagnetic energy. The correspondence between the individual class and unique spectral signature is particularly important for accurate vegetation mapping, where plant communities are represented in terms of their floristic composition and structure (Brook and Kenkel, 2002). Several authors have explored how image spectra have corresponded to the continuum of vegetation cover based on Landsat or SPOT multispectral images, combined techniques of two-way indicator species analysis (TWINSPAN), Principal Component Analysis (PCA), canonical correspondence analysis (CCA), with maximum likelihood classification (MLC) and support vector machines (SVM) (Thomas et al., 2003; Malik and Husain, 2008; Middleton et al., 2012). However, the optimal procedure for detecting species by their phenological differences compared to the surrounding vegetation still remains to be refined, and the potential of hyperspectral imagery in accurately discriminating invasive weeds needs to be elucidated.
Therefore, we conducted an investigation to collect field spectral data, vegetation samples, and UAV RGB/hyperspectral imagery in a typical S. chamaejasme invaded meadow. The main goal was to evaluate the recognizability of S. chamaejasme from surrounding vegetation, and produce an accurate mapping of S. chamaejasme in the degraded grasslands of the QTP. Using clustering and ordination techniques, spectral separability analysis, and image classification algorithms, the objectives of the study were: 1) to examine the spectral difference between S. chamaejasme and co-existing species in wavelengths of 350–2500 nm based on field measured spectra, and identify the minimum subset of feature bands necessary for S. chamaejasme discrimination; 2) to determine the response of a hyperspectral image to floristic species and to clarity if S. chamaejasme can be detected at the species and community levels; and 3) to demonstrate a combined approach which organized vegetation clustering to be suitable for hyperspectral image classification, and map S. chamaejasme distribution with ecological classes that can be spectrally delineated.
2 Materials and methods
2.1 Study area
The study area was located in Qilian County, Haibei Tibetan Autonomous Prefecture of Qinghai Province. The climate there is typically plateau continental. The annual mean rainfall is 420 mm and annual mean temperature is 1°C. It is characterized by a variety of alpine grassland ecosystems, mainly including alpine meadows and alpine steppes. S. chamaejasme occurs with native Kobresia and Poa species in large areas.
The study site was established in Qingyang Gully in Arou Township (100°21’38.207”–100°21’51.61”E, 38°9’31.76”–38°9’39.721”N). The study site is about 4.05 × 10⁴ m2, with an average altitude of 3073 m and slope of 6.3°. The vegetation is typical of degraded alpine meadow invaded by S. chamaejasme. Dominant species are Stipa purpurea, Poa annua, and Kobresia capillifolia; other common species include Anemone rivularis, Thermopsis lanceolata, Anaphalis lactea, Kobresia humilis, and Potentilla chinensis. The total community cover ranges from 26.0 to 63.0%, with an average of 45.4%. S. chamaejasme is widespread in a dense patchy pattern; its percentage cover ranged from 0 to 38.5% with an average of 15.4% (Figure 1).

Figure 1 S. chamaejasme distribution in the study area.
2.2 Data collection
2.2.1 UAV images
UAV RGB images and hyperspectral images covering the study site were simultaneously acquired in mid July 2019, which coincided with the peak flowering phase of S. chamaejasme. RGB color images were obtained with a DJI Phantom 4 RTK UAV quipped with a FC6310R camera (Da Jiang innovation technology Ltd., Shenzheng, China) at a flight height of 75 m. The orthomosaic image (DOM, Digital Orthophoto Map) was generated based on the photogrammetry algorithms from the Pix4Dmapper software, with a spatial resolution of 0.02 m. The UAV hyperspectral imaging system was formed by using a Pika XC2 hyperspectral imager (Resonon Inc., Bozeman, USA) loaded on an eight rotary-wing UAV at a flight height of 150 m. The sensor was operational over the visible and NIR (near-infrared) portions of the electromagnetic spectrum (400–1000 nm). Four stripes over the area were collected, measuring 231 channels in steps of 2.6 nm with a 1.3 nm spectral resolution. The preprocessing of the hyperspectral images involved dark current deduction, radiometric calibration, and geometric correction (Hakala et al., 2018). Dark current deduction and radiometric calibration were performed in SpectrononPro software. Then, the images were georeferenced based on the DOM, and stitched using ENVI software, generating a hyperspectral image for the study site, with a spatial resolution of 0.2 m.
2.2.2 Vegetation data
Three line transects were created in the study site at 45 m intervals, then 15 vegetation plots were placed along each transect at 30 m intervals. A total of 45 vegetation plots (1 × 1 m) were identified and floristic information was collected (Figure 2). Species composition description, with height measurements and percentage cover estimates, was made for every plot. Locations of all plots were determined using GNSS RTK.
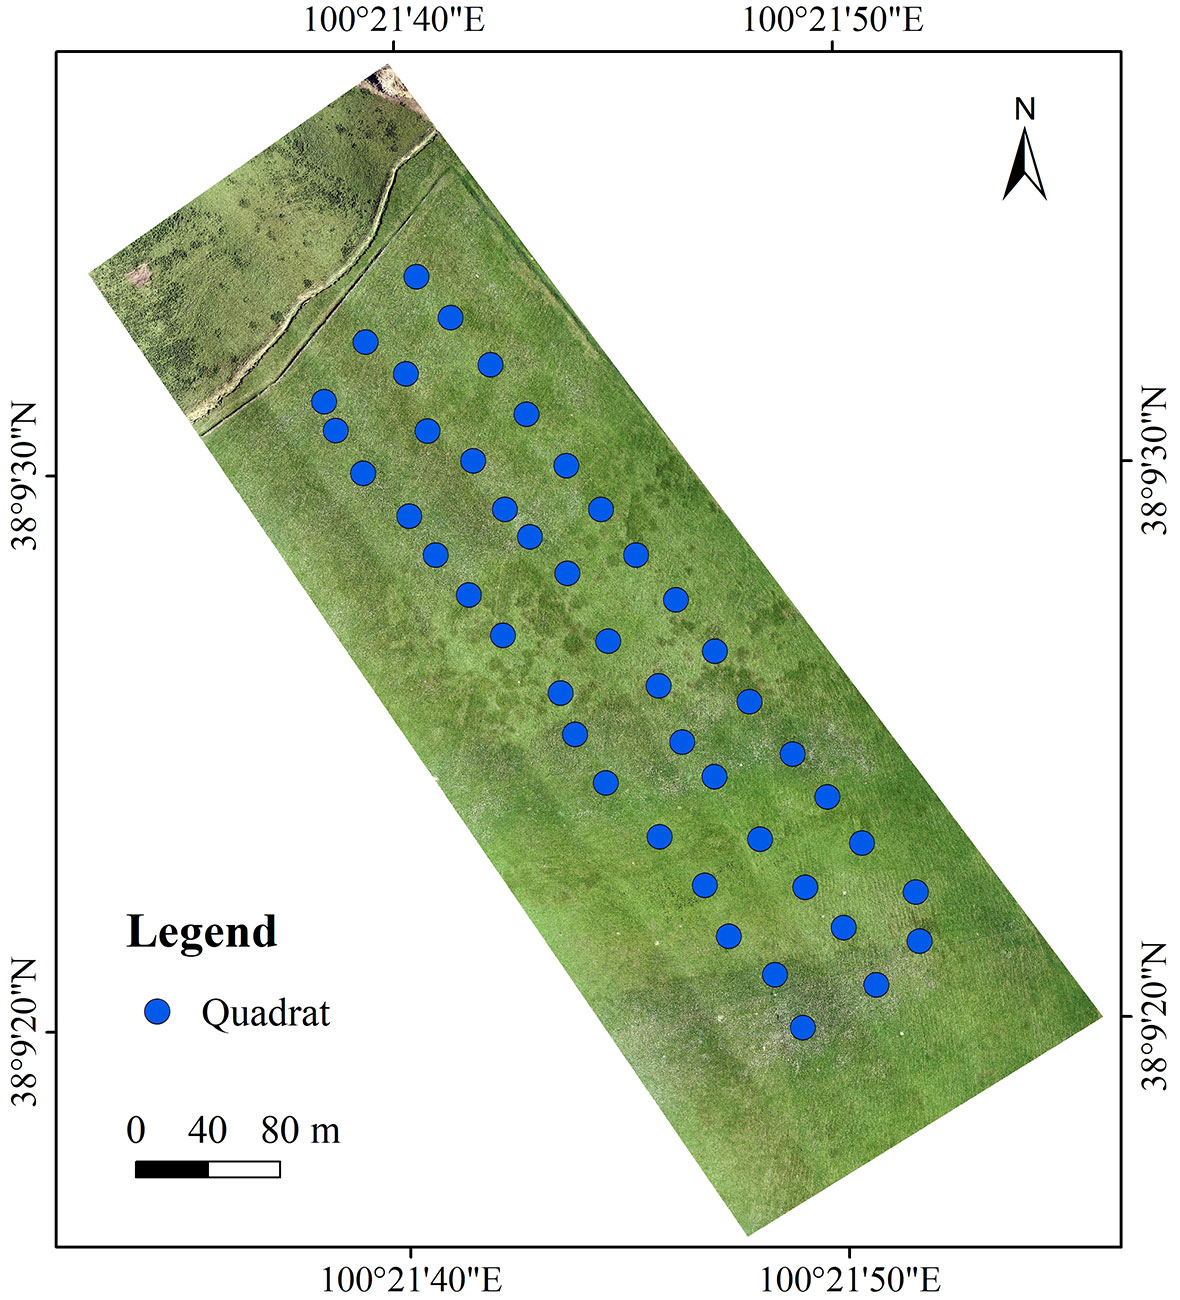
Figure 2 Sampling design in the study site (UAV DOM).
Important Value (IV) is a metric used to represent the importance of each species in a plant community, and calculated as follows (Zhang, 2011):
where RC is the relative cover fraction, referring to the ratio of the cover fraction of each species to the sum of the cover of all species in the plot; RH is the relative height, calculated in the same way as RC.
In total, 30 herbaceous plant species were collected and recorded in the study site. The IV for each species in each of the 45 plots was calculated, and a data matrix of IV (45 × 30) established.
2.2.3 Spectral data
The ASD FieldSpec 4 Hi-Res spectroradiometer (Malvern PANalytical company, Longmont, USA) was used to measure the spectral reflectance from S. chamaejasme and co-existing species. The instrument covers a wavelength range of 350–2500 nm, the spectral resolution is: 3 nm @ 700nm and 8 nm @ 1400/2100nm, at the sampling interval of 1.4nm @ 350-1000nm and 1.1nm @ 1001-2500nm.
Spectral sampling was conducted and 72 spectral plots (1 × 1 m) were defined. The 45 plots corresponded to the vegetation plots in the study site; spectral measurements were collected before vegetation sampling. The other 27 plots were added to provide samples of representative S. chamaejasme invaded areas at various densities, located in Arou Town and Ebao Town within the study area. 30 spectral measurements were acquired in each plot with a 25° field of view, by positioning the probe of the spectroradiometer at about 2.3 m above vegetation canopy. Field spectra of four categories were collected, including high-cover (35–50%), moderate-cover (20–35%), low-cover (0–20%) S. chamaejasme communities, and other co-existing species community (Table 1). The outliers of spectral measurements were removed, then the noise was abated using a window-moving polynomial-fitting smoothing approach (Savitzky-Golay) in ViewSpecPro software (Gorry, 1990).
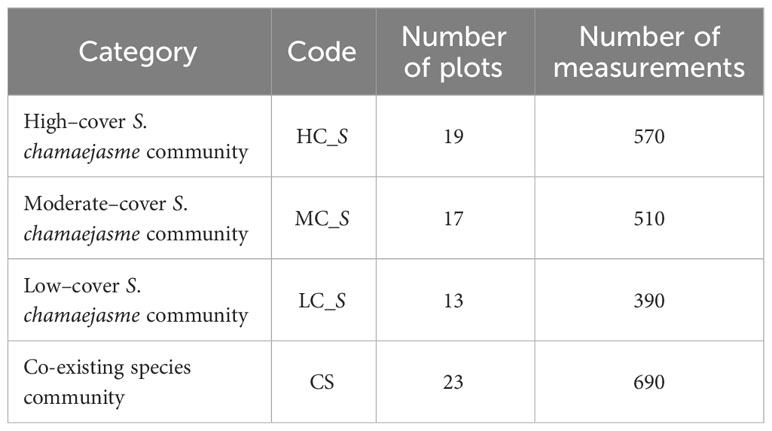
Table 1 Number of spectral sampling plots and spectral measurements collected.
2.3 Methodology
2.3.1 Overview of methodology
The basic methodology in the study is introduced in Figure 3. Firstly, a hierarchical method integrated with Kruskal–Wallis test and Dunn’s post hoc test, CART, and JM distance was adopted to determine the spectral differences between S. chamaejasme and co-existing species based on field spectra, and identify the optimal bands for the discrimination of S. chamaejasme. Secondly, the relationship between S. chamaejasme communities, the co-existing species community and image response was explored based on the UAV Resonon hyperspectral image, using TWINSPAN clustering, DCA and RDA ordination analysis. Furthermore, a regrouping scheme of TWINSPAN ecological clusters by the metric of JM distance was proposed, which produced spectrally separated communities. Thirdly, applying three algorithms of MLC, RF, and SVM, S. chamaejasme classification was performed based on the schemes of TWINSPAN and JM-adjusted TWINSPAN, respectively. Then, a promising approach for the accurate discrimination of S. chamaejasme using the hyperspectral image was proposed, according to accuracy assessment.
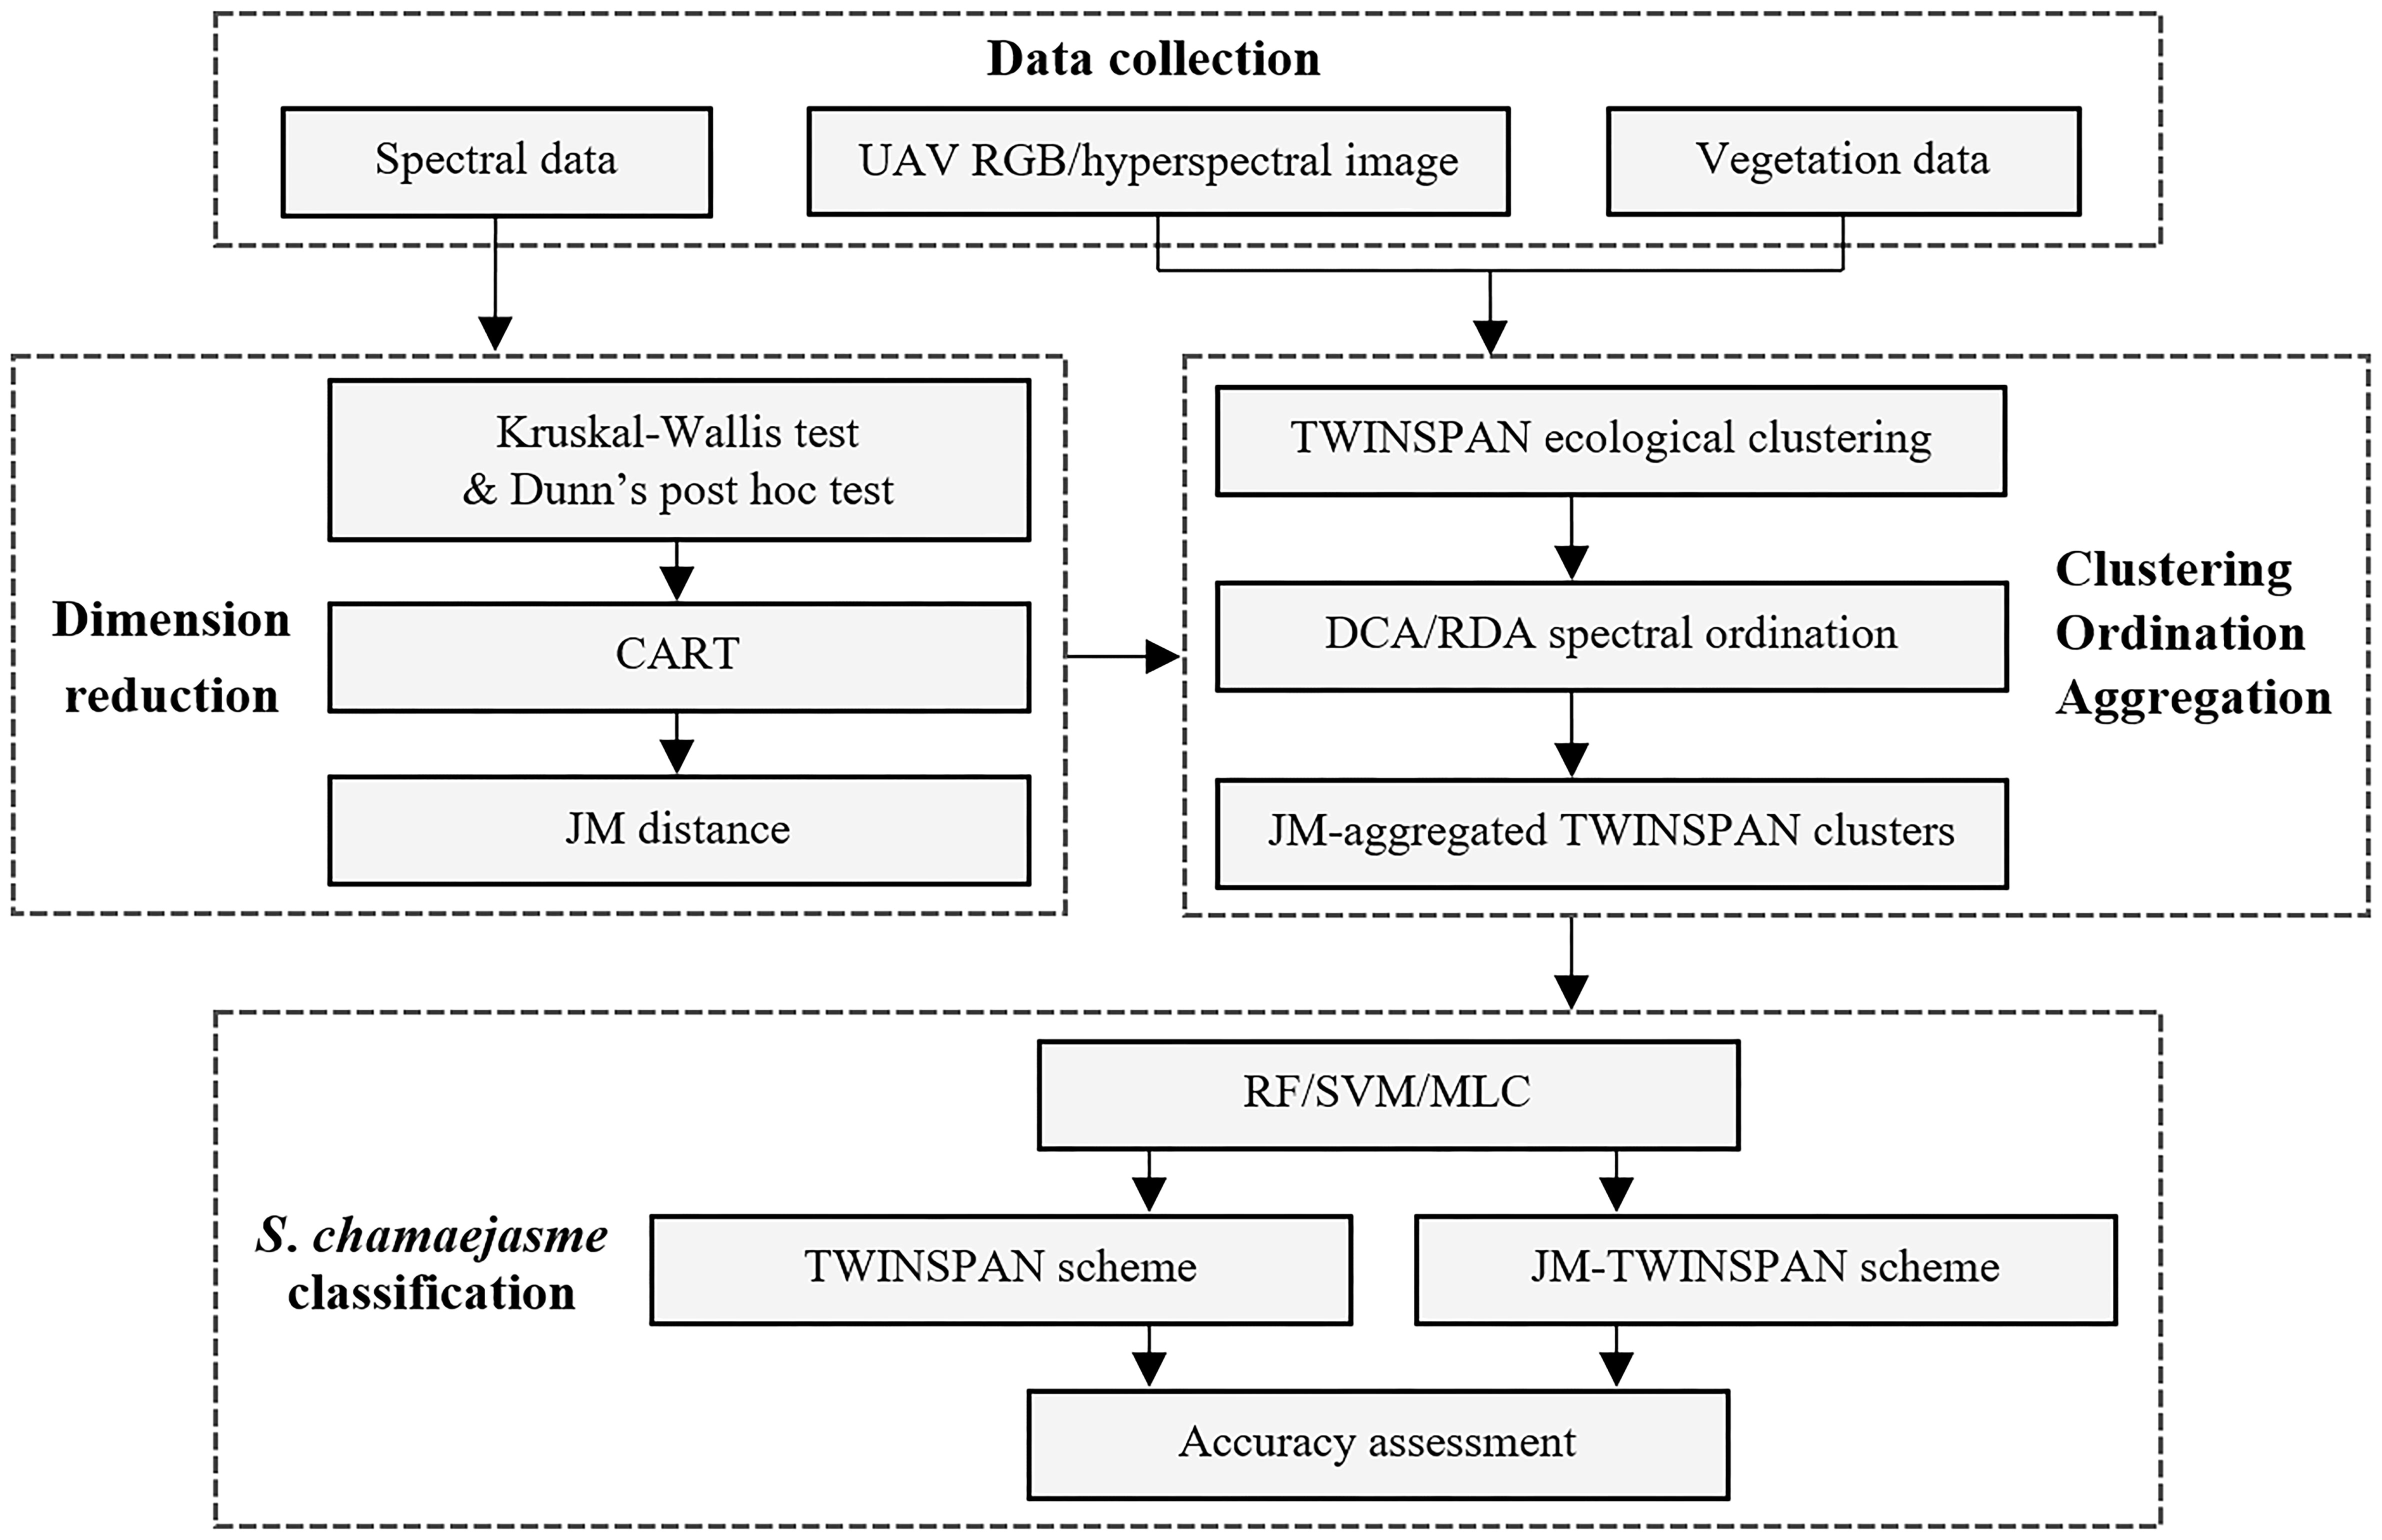
Figure 3 Flow chart of the methodology.
2.3.2 Dimension reduction of hyperspectral data
Using the field collected spectral data, a three-step hierarchical approach was employed to select optimal wavelengths for S. chamaejasme spectral discrimination. Firstly, a Kruskal-Wallis test was used to test if the spectral differences between three S. chamaejasme communities and the co-existing species community were statistically significant from 350 to 2500 nm (n = 2151). Kruskal–Wallis test is a rank-based non-parametric test used to compare multiple independent samples and does not assume a normal distribution (Fernandes et al, 2013). In the study, the null hypothesis was:
H0: The alternative hypothesis was:
H1: where: η1, η2, η3 is the reflectance values from high-cover, moderate-cover, and low-cover S. chamaejasme, and η4 is the reflectance value from co-existing species. Kruskal–Wallis test was used with Dunn’s post hoc test at each measured wavelength for the individual class pair (HC_S vs. CS, MC_S vs. CS, and LC_S vs. CS). Kruskal–Wallis was test with a 95% confidence level (p < 0.05).
Secondly, CART was applied to further reduce the number of significant wavelengths obtained from Kruskal–Wallis and Dunn’s post hoc test. CART is a non-parametric statistical model that can select from a large dataset of explanatory variables that are best for the response variables (Questier et al., 2005; Adam and Mutanga, 2009). The CART model is built on a sequential splitting rule, which divides the data into smaller parts according to the reduction of the deviance from the mean of target variable (Adam and Mutanga, 2009). A classification tree was generated in our study as the predictor variable (spectral reflectance) is continuous, and the target variable (three S. chamaejasme communities and the co-existing species community) is categorical. As a result, CART generated the sensitive bands for discriminating each class pair (HC_S vs. CS, MC_S vs. CS, and LC_S vs. CS).
Finally, JM distance was adopted to select the wavelengths indicating the best spectral separability between three S. chamaejasme communities and the co-existing species community. The JM distance algorithm calculates the separability of two classes (Adam and Mutanga, 2009):
where JMij is the degree of separation between class i and class j, , are variance matrices of class i and j, and Ui, Uj are mean vectors of class i and class j. The range of JM distance is 0–2. A JM value close to 2 indicates high separability. JM distances > 1.9, 1.9–1.0, and < 1.0 indicate good, moderate, and poor separability between two classes, respectively (Thomas et al., 2003). JM distance between each class pair (HC_S vs. CS, MC_S vs. CS, and LC_S vs. CS) was measured, and the optimal wavelengths for distinguishing S. chamaejasme from other species were identified. The dimension reduction analysis was performed with Python Anaconda3 programming.
By matching the Resonon hyperspectral channels with the optimal wavelengths (400–1000 nm) from the hierarchical approach, the hyperspectral channels responding to S. chamaejasme were identified, and the feature bands were aggregated by averaging the neighboring channels with the bandwidths of 5–30 nm. Then, based on these feature bands, standardized (correlation matrix) principal components (SPCs) and non-standardized (covariance matrix) principal components (NSPCs) were calculated. Resonon feature bands incorporated with their principal components were used as image input for S. chamaejasme discrimination.
2.3.3 Clustering, ordination, and spectral aggregation
TWINSPAN is a hierarchical clustering method which interprets a species dataset into ecologically and biogeographically homogeneous classifications using a top-down stepwise divisive algorithm (Hill, 1979; Novák et al., 2023). Here, taking the IV matrix of 45 plots in the study site as the metric, TWINSPAN was used to group all vegetation plots into ecological communities in PC-ORD 5.0 software.
Ordination methods are often employed to depict the ecological relationship between vegetation distribution and environmental variables, based on field vegetation data and environmental measurements (Middleton et al., 2012). DCA is an improvement of reciprocal averaging algorithm that eliminates the arch effect, usually used to visualize the range of species variation along with the ordination axis (Hill and Gauch, 1980; Kalantari et al., 2022). RDA is based on multivariate regression, and models linear relationships of the explanatory variables (environmental predictors) and the response variables (vegetation variables) by combining ordination and regression (Thibaut and Brenna, 2021). In the study, DCA ordination of 45 plots was calculated using the IV matrix, the result showed that the gradient length of first axis was less than 3, suggesting the adoption of linear model. Therefore, RDA was performed to determine how image spectral responses described S. chamaejasme and other species distribution. Using the Resonon incorporated bands (the feature bands and their standardized/non-standardized principal components) as environmental variables, and the IV matrix as vegetation variables, the relationship between image spectra and vegetation was determined at two ecological levels: species and community. Ordination analysis was conducted using CANOCO 5.0 software.
Subsequently, the spectral separability of communities grouped by TWINSPAN was evaluated using the most meaningful principal components which characterized the Resonon feature bands. Spectral confusions occurred between and within TWINSPAN communities were clarified by the calculation of JM distance. As a result, the plots of TWINSPAN communities were reaggregated on the criteria of spectral similarity, and new communities was defined. These communities were ecologically meaningful associations that can be spectrally delineated, hereinafter referred to as JM-TWINSPAN communities.
2.3.4 Classification and error assessment
For the purpose of exploring the potential of ecological clustering in S. chamaejasme discrimination, image classification was performed using the plots of TWINSPAN and JM-TWINSPAN communities, in combination with the most meaningful Resonon principal components as data source. Three supervised classification algorithms were applied in the study, including random forest (RF), support vector machines (SVM), and maximum likelihood classification (MLC). The algorithms were implemented using ENVI software.
RF is a collection of classification and regression trees, using binary splits on predictor variables to determine outcome predictions (Speiser et al., 2019). The method can solve the overfitting problem of decision trees, and has a strong anti-interference ability for noise. In the study, the number of decision trees was 10, and the minimum leaf size was 2.
SVM is a machine learning method based on statistical learning theory, which do not require an estimation of the statistical distributions of classes and define the classification model by exploiting the concept of margin maximization (Nidamanuri, 2020). Here, the radial basis function (RBF) was selected as the kernel function, with a penalty parameter of 100 and a gamma of 0.25.
MLC uses the maximum probability as the criterion for determining the class to which the sample belonged. It has been widely used as a method of choice in supervised image classification.
DOM (0.02 × 0.02 m) acquired in the same period served as a reference map, which was compared with S. chamaejasme classification map derived on the Resonon hyperspectral image (0.2 × 0.2 m). In total, 500 test points were randomly selected on the classification map. After locating the corresponding region of each point on the DOM, S. chamaejasme proportion within the region were calculated. Then, the point was allocated to categories of moderate-cover S. chamaejasme (20-35%), low-cover S. chamaejasme (0-20%), and co-existing species (non-S. chamaejasme), respectively. Thus, a confusion matrix was created and classification accuracy assessed. Four commonly used measures of overall accuracy (OA), user accuracy (UA), producer accuracy (PA), and Kappa coefficient, in combination with quantity disagreement (QD) and allocation disagreement (AD), were examined in error analysis. Quantitative disagreement was defined as the amount of difference between a reference map and a comparison map, resulting from the less than perfect matching in the proportions of the categories. Allocation disagreement was defined as the amount of difference between the reference map and the comparison map, caused by the less than optimal matching of the spatial allocation of the categories (Robert and Marco, 2011). Low quantity disagreement and allocation disagreement indicated high classification accuracy.
3 Results
3.1 Identification of optimal feature bands
The wavelength ranges of three-step dimension reduction are shown in Table 2. Kruskal-Wallis test and Dunn’s post hoc test indicated that there were statistically significant differences in the spectral reflectance of 350–2500 nm amongst the four communities. The number of significant wavelengths identified between all three class pairs (HC_S vs. CS, MC_S vs. CS, and LC_S vs. CS) was 478, 310, and 223, respectively. CART analysis was further applied to reduce the number of significant wavelengths, and the sensitive wavelengths were determined for the class pairs with the number of 331, 199, and 130, the corresponding classification accuracies were 0.82, 0.79, and 0.79, respectively. At the third level, spectral separability between S. chamaejasme communities and the co-existing species community was measured using the metric of JM distance > 1.9. The optimal wavelengths which provided the best separability among the communities were selected, and the wavelength number for each individual class pair was reduced to 221, 189, and 77, respectively.
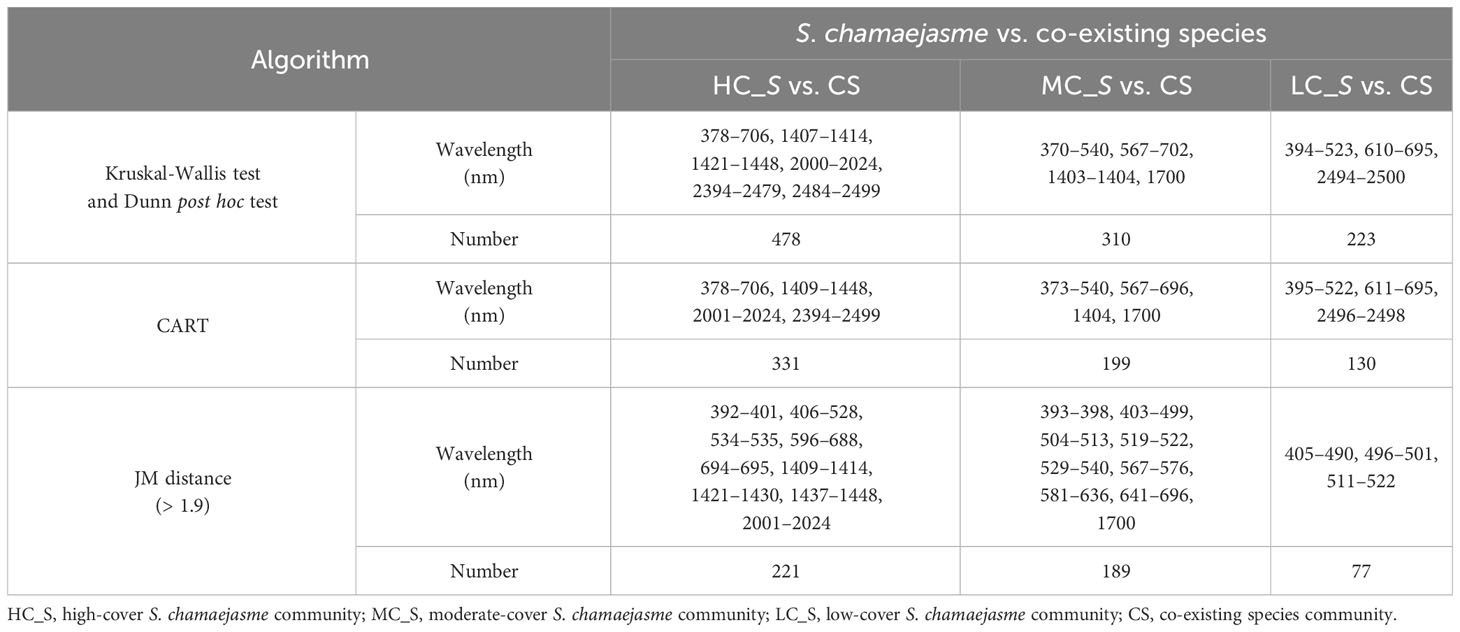
Table 2 Wavelength ranges selected by Kruskal-Wallis test and Dunn’s post hoc test, CART, and JM distance.
According to the spectrum partition: visible (350–679 nm), red-edge (680–759 nm), near-infrared (760–1299 nm), and mid-infrared (1300–2500 nm) (Fernandes et al., 2013), a majority of optimal wavelengths selected for all class pairs were located in the visible region, and a minority were located in red-edge and mid-infrared region. No wavelengths were located in the near-infrared region, perhaps relating to high reflectance of all four categories in the portion of spectrum which led to very similar spectral behaviours of S. chamaejasme and co-existing species (Table 3). Considering the moderate- and low-coverage S. chamaejasme in the study site, the union of optimal wavelengths of two class pairs, MC_S vs. CS and LC_S vs. CS, were selected to match Resonon original channels. Finally, 13 Resonon feature bands were aggregated, including 393–398, 403–431, 433–442, 444–465, 466–486, 487–501, 504–515, 518–540, 581–604, 607–636, 641–656, 660–679, and 683–696 nm.
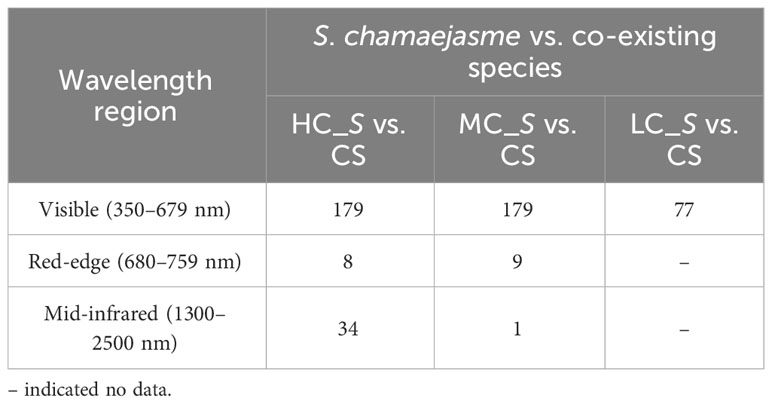
Table 3 Number of optimal wavelengths selected for all three class pairs in different spectrum partition.
3.2 Clustering of plant communities
TWINSPAN was performed based on the species IV matrix of 45 plots, using a cut level of 0, 0.02, 0.05, 0.1, and 0.2. Three communities were grouped at the second level subdivision, labelled Groups I–III (Figure 4). Although common species appeared in the three communities, the species dominance changed significantly with increased invasion of S. chamaejasme. Compared to Group III, S. chamaejasme replaced S. Purpurea (Gramineae) as the major dominant species in Groups II and I. Percentage cover of S. chamaejasme exhibited a gradient increase (5.5, 11.0, and 25.6%), which indicated more serious grassland degradation. Characteristics of the three communities were as follows:
Group I: S. chamaejasme–S. Purpurea–K. capillifolia–T. lanceolala community, accompanied by Morina. kokonorica, P. annua, and P. chinensis etc. The average percentage cover of S. chamaejasme was 25.6%, and the total community cover was 40.4–63.0%.
Group II: S. chamaejasme–S. Purpurea–P. chinensis–Saussurea pulchra community, accompanied by P. annua, A. lacteal, and T. lanceolala etc. The average percentage cover of S. chamaejasme was 11.0%, and the total community cover was 36.6–59.4%.
Group III: S. purpurea–A. rivularis–S. chamaejasme–P. annua community, accompanied by P. chinensis, A. lacteal, S. pulchra etc. The average percentage cover of S. chamaejasme was 5.5%, and the total community cover was 26.0–48.6%.
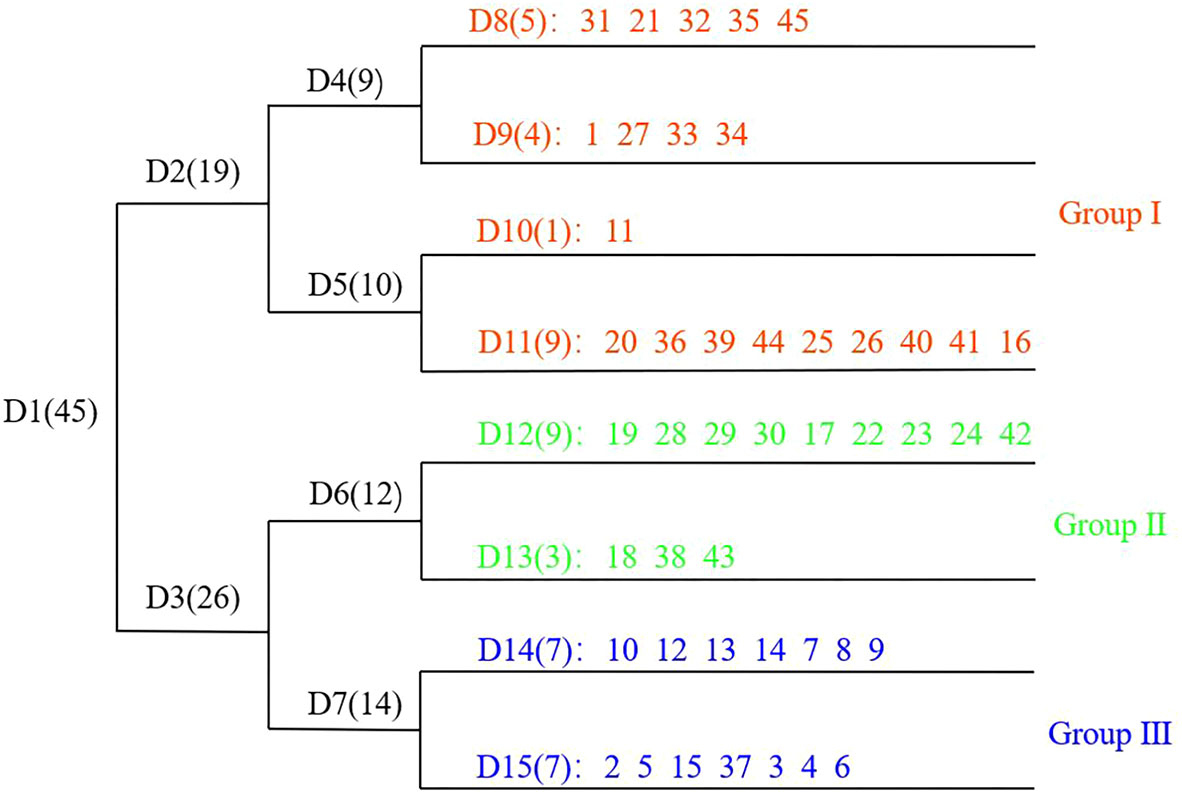
Figure 4 TWINSPAN classification dendrogram. D1–D15 refers to plot grouping. Numbers in brackets refer to the plots involved in the group. 1–45 refers to the 45 plots.
3.3 Ordination of species/communities and feature spectra
Using 13 feature bands and their standardized/non-standardized principal components (39 bands in total) as environmental variables, RDA was performed to explore the relationship between the species/plots distribution and feature spectral response (Figure 5 and Table 4). RDA analysis indicated that the image feature bands and principal components did not relate well to the species/plots distribution (P = 0.844). A total of 28.5% cumulative variance in the ordination space could be explained by variations extracted from the 39 bands, of which the cumulative variance of the first four ordination axes was 23.79%. Most spectral variables except the seventh standardized principal component (SPC7) displayed non-significant relationships with the species/plot patterns across the study site. The results suggested that identification of S. chamaejasme at the species level was difficult (Figure 5A), and also revealed the weak connection between TWINSPAN communities and feature spectra (Figure 5B). This finding suggesting the establishment of S. chamaejasme communities, incorporating the plots with the similar spectral responses while still maintaining their ecological significance.
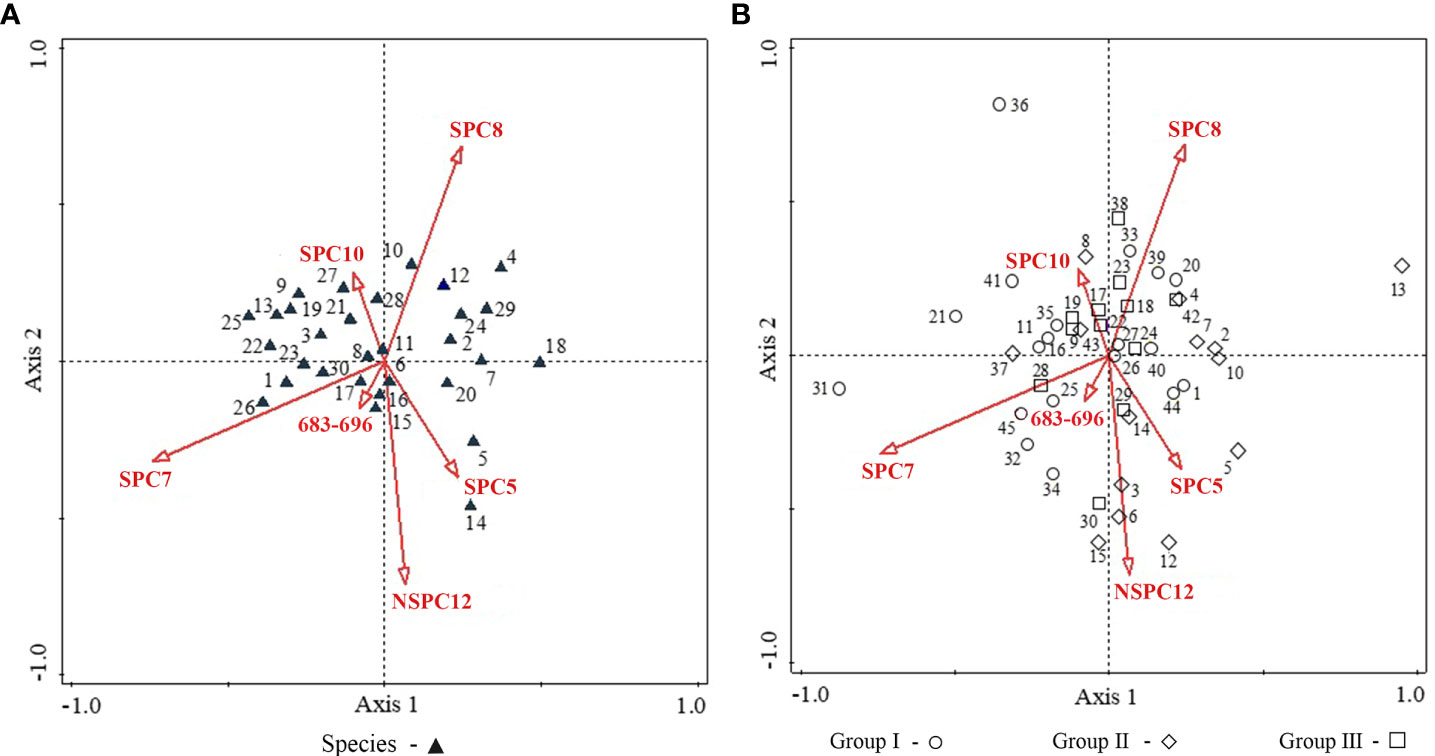
Figure 5 RDA ordination diagram between species/plots and feature spectra. (A) Species (B) Plots. 1–30 in (A) represents the 30 species: 1. S. chamaejasme, 2. A. rivularis, 3. Taraxacum mongolicum, 4. Thermopsis lanceolala, 5. P. annua, 6. Mentha haplocalyx, 7. Anaphalis lacteal, 8. Ixeris polycephala, 9. Morina kokonorica, 10. Gentiana straminea, 11. Gueldenstaedtia diversifolia, 12. S. pulchra, 13. Aster flaccidus, 14. S. purpurea, 15. Medicago ruthenica, 16. Polygonum paleaceum, 17. Gentianopsis paludosa, 18. Polygonum macrophyllum, 19. Gentiana scabra, 20. Gentiana aristate, 21. Gentiana macrophylla, 22. Galium verum, 23. Ranunculus sceleratus, 24. Lancea tibetica, 25. Thalictrum alpinum, 26. Bupleurum chinensis, 27. K. capillifolia, 28. Ranunculus tanguticus, 29. P. chinensis, 30. K. humilis. 1–45 in (B) are the 45 plots which were assigned to TWINSPAN Groups I–III. The red arrows refer to spectral variables. The first six bands which showed the highest correlation with the ordination axis is presented. SPC, standardized principal component; NSPC, non-standardized principal component; 683–696: the feature band with the wavelength range of 683–696 nm.
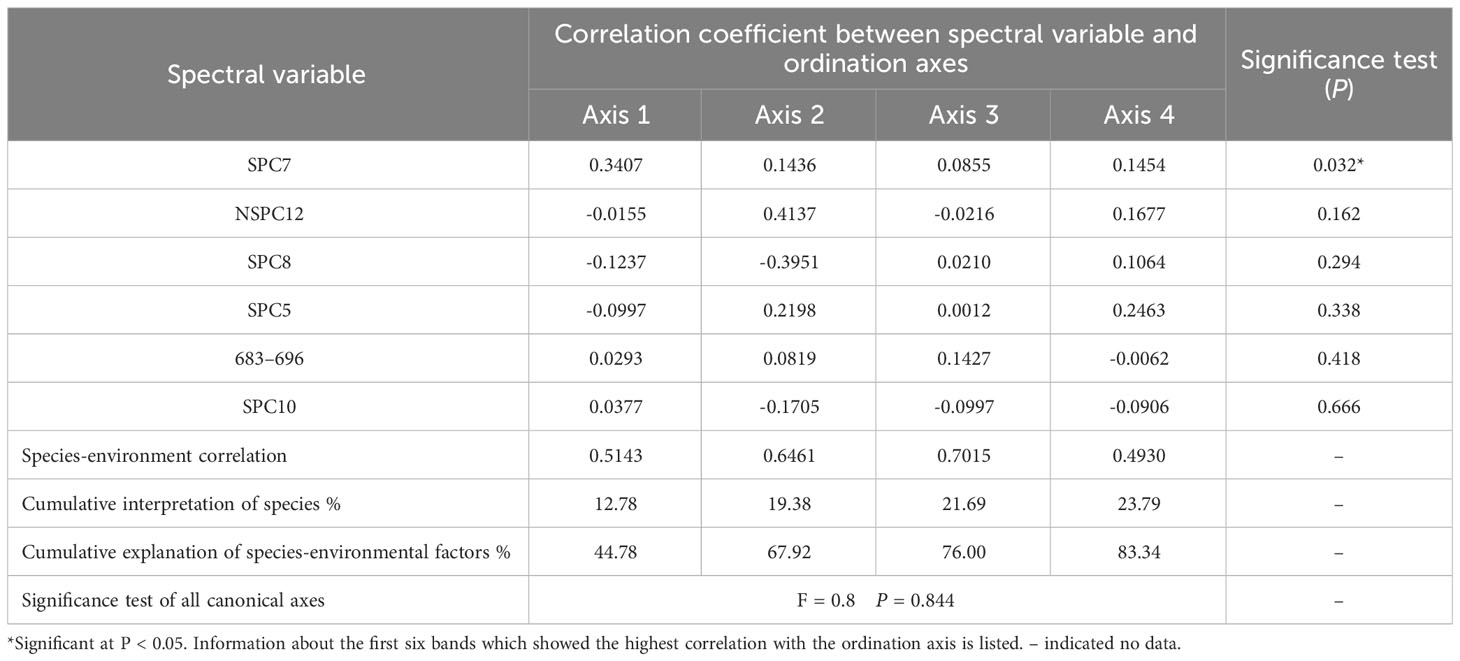
Table 4 RDA analysis of species/plots and spectral variables.
3.4 Reaggregation of the ecological communities
S. chamaejasme forms large white-pink capitula inflorescences which make the species distinct during its flowering phase. The percentage cover of S. chamaejasme communities has a significant influence on spectrally discriminating S. chamaejasme from co-existing species. The plots of moderate-, low-coverage S. chamaejasme and other species were grouped together by TWINSPAN clustering, which may lead to potential conflicts with regards to spectral classification. To reduce the confusion introduced by the inconsistency of S. chamaejasme coverage, JM distance was used as a spectral criterion; the plots of three TWINSPAN groups were reaggregated to create new ecological communities. The PCA results revealed that the first two non-standardized principal components corresponded to a meaningful proportion (99.96%) of the original 13 feature bands, thereby the first two components (NSPC 1 and NSPC 2) were used as an input for the spectral separability analysis. By using JM distance > 1.9 as the threshold, the separability measure for each plot against all others was calculated and new clusters were defined as follows:
• Plots with a JM distance of > 1.9 from each other were not grouped together. When a plot had a JM distance of < 1.9 with another plot, they were grouped together.
• The JM distance between each plot and all the others within a class was less than 1.9. The JM distance between the plots of different classes was greater than 1.9.
Based on the above guidelines, 38 plots were grouped into three classes. The remaining seven plots showed the separability of JM < 1.9 with the three classes. So, with the JM > 1.4, these plots were then added to the class from which they were hardest to separate, and the spectral clusters of all plots were created. Then, by comparing spectrally reallocated clusters with TWINSPAN clusters, the conflicting plots were selected and reallocated to the suitable class based on the separability rule, whereby there were no conflicts with any member of that class.
Through the spectral reallocating, new ecological communities which could be spectrally separated were derived (Table 5). JM-TWINSPAN Groups 1, 2, and 3 were basically corresponding to original TWINSPAN Groups I, II, and III. The inconsistency of S. chamaejasme cover within communities was eliminated, and the gradient of S. chamaejasme cover in Groups 3, 2, and 1 was clearly highlighted. Group 3 was the co-existing species community, involving all other species plots and 2 S. chamaejasm plots with very low percentage cover, which were hardly discriminated from the other species community. Groups 2 and 1 were both S. chamaejasme communities. Compared to TWINSPAN communities, the dominant species of JM-TWINSPAN communities changed in some degree. The characteristics of the new communities were as follows:
Group 1: S. chamaejasme–S. Purpurea–P. chinensis–S. pulchra community, which is a moderate-cover S. chamaejasme community (20–35%), widely distributed in the mosaic of dense and sparse patches, with an average S. chamaejasme cover of 29.5%.
Group 2: S. chamaejasme–S. Purpurea–K. capillifolia–A. Rivularis community, which is a low-cover S. chamaejasme community (0–20%), distributed in sparse patches, with an average S. chamaejasme cover of 16.2%.
Group 3: S. Purpurea–A. Rivularis–P. annua–P. chinensis community, which is the co-existing species community in the study area, with an average community coverage of 39.1%. There is very little S. chamaejasme in the group, with an average S. chamaejasme cover of < 1%.
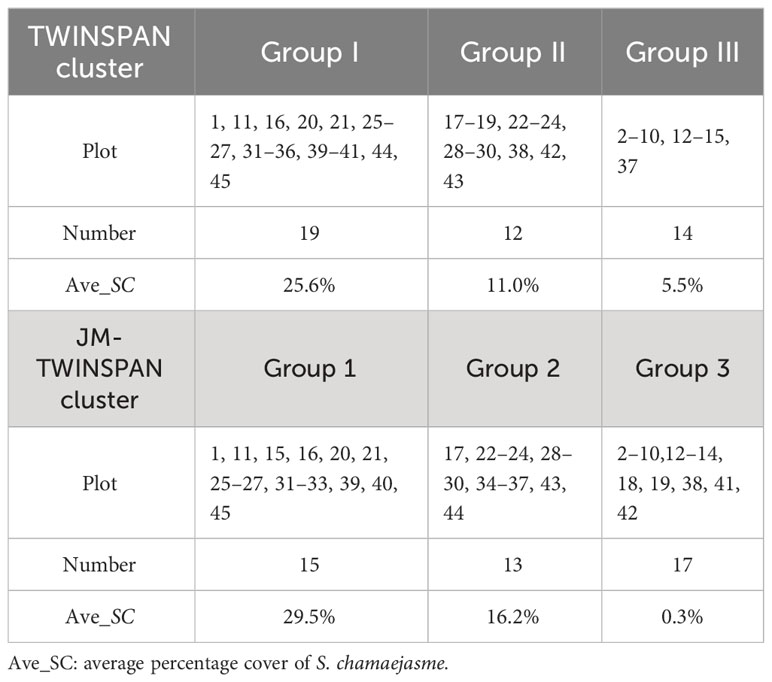
Table 5 Spectral reallocation of TWINSPAN clusters.
3.5 S. chamaejasme classification and accuracy assessment
Taking NSPC 1 and NSPC 2 as the data source, classification was performed based on TWINSPAN and JM-TWINSPAN clusters, applying three supervised algorithms (Figure 6 and Table 6). The results indicated that S. chamaejasm communities accounted for 43.20–49.83% and 59.91–67.30% of total grassland area based on JM-TWINSPAN and TWINSPAN clusters, respectively. Some plots of co-existing species (18–19, 38, and 41–42) were grouped in the TWINSPAN S. chamaejasm communities, leading to the corresponding pixels being misclassified in S. chamaejasm communities. This explained why S. chamaejasm area extracted using TWINSPAN schemes was significantly larger than that using JM-TWINPAN schemes. Spatial distributions of S. chamaejasme extracted by three algorithms were fairly similar, characterized by clumped patches in random dispersion. Moderate-cover S. chamaejasme community accounted for a major proportion of the total S. chamaejasme area, with the range of 56.70–66.58% for all classification schemes.
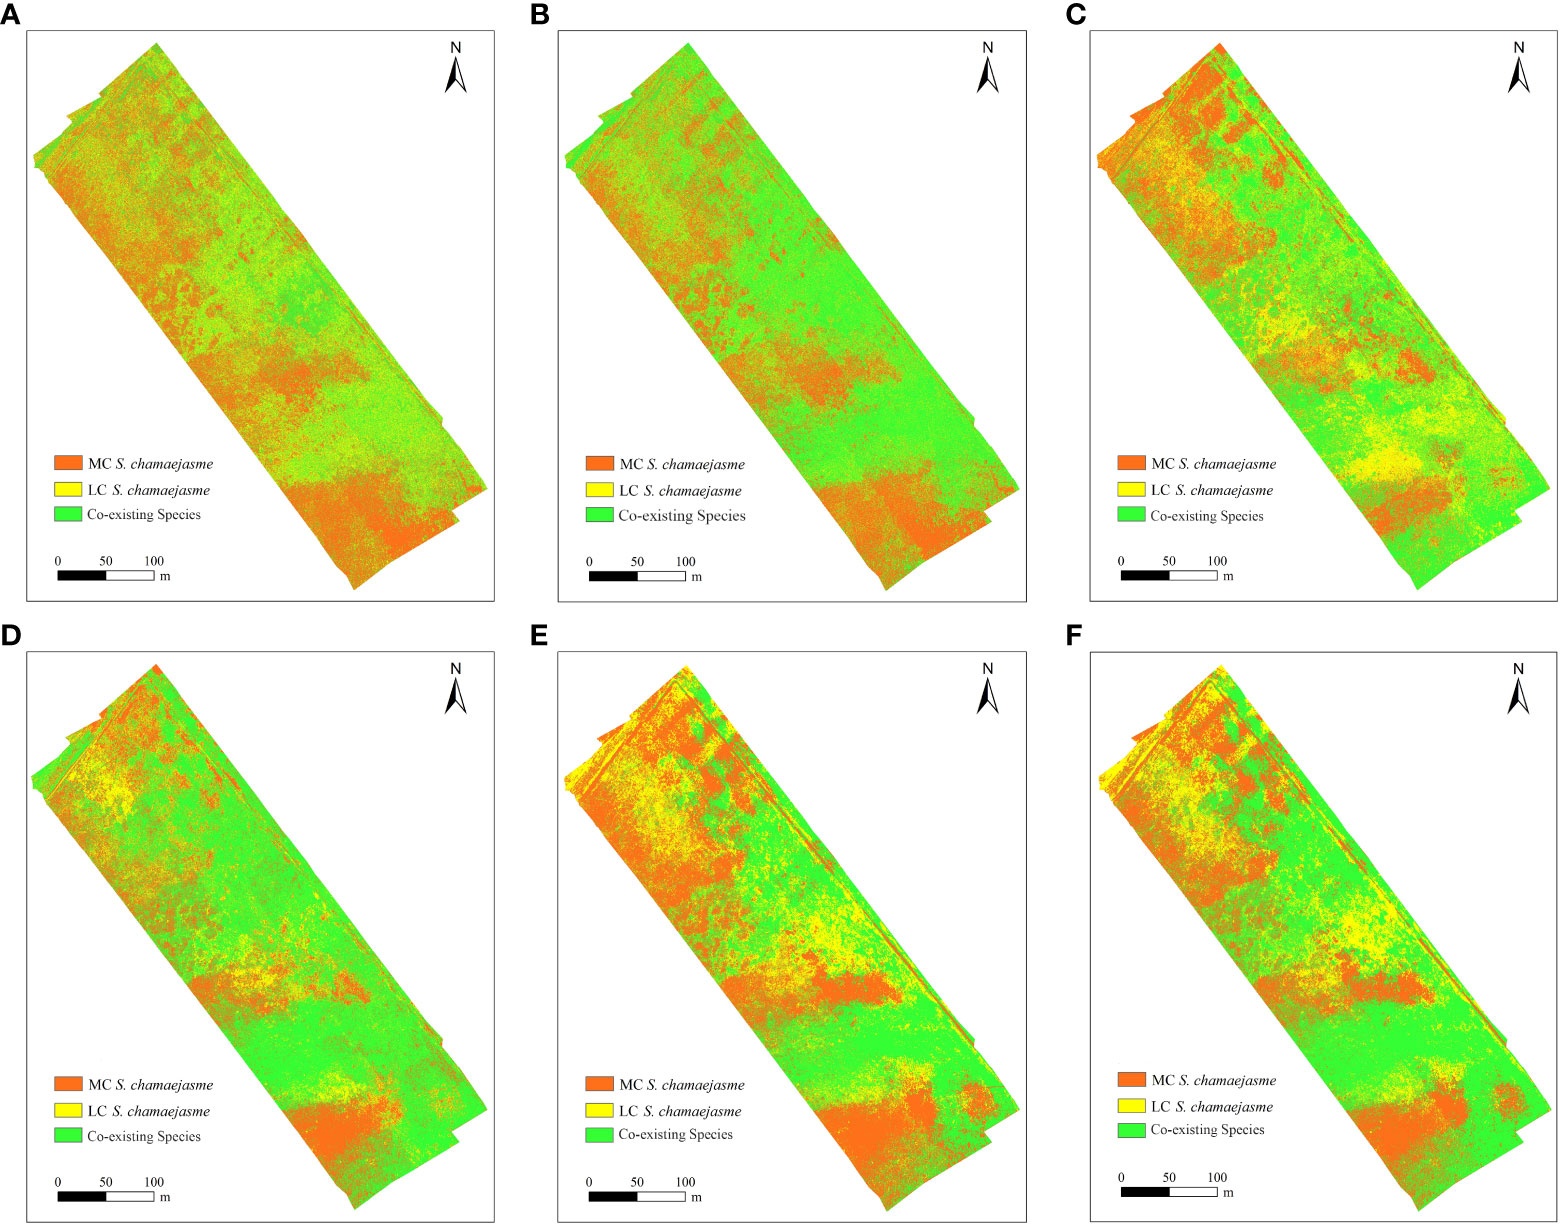
Figure 6 Distribution map f S. chamaejasme based on six classification schemes. (A) MLC & TWINSPAN (B) MLC & JM_TWINSPAN (C) RF&TWINSPAN (D) RF & JM_TWINSPAN (E) SVM & TWINSPAN (F) SVM & JM_TWINSPAN.
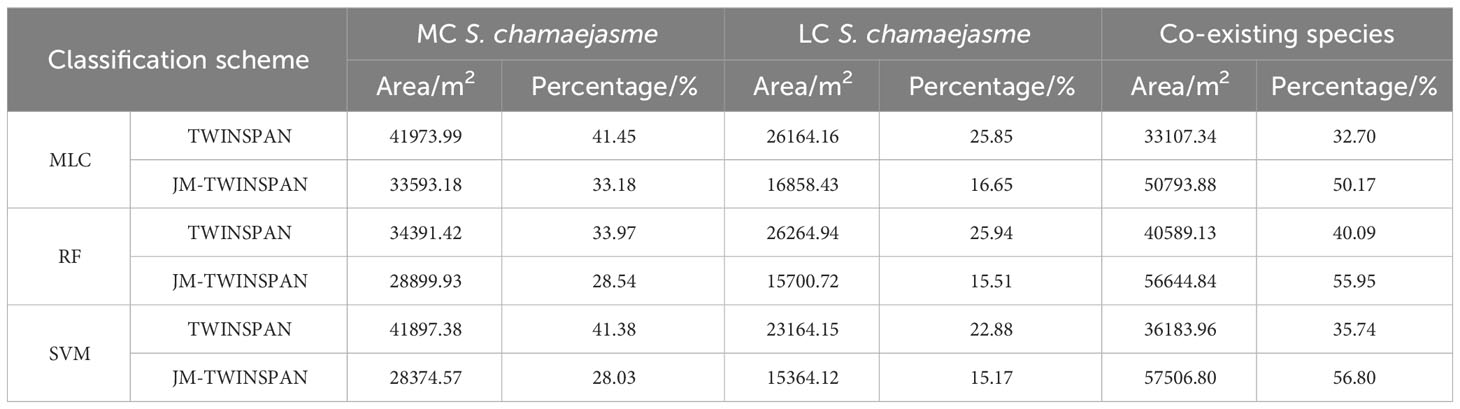
Table 6 S. chamaejasme distribution area estimated by six classification schemes.
The validation revealed considerable variations in classification accuracy of TWINSPAN and JM-TWINSPAN clusters in combination with the three algorithms (Table 7 and Figure 7). OA varied through the range of 71.6–91.0%, corresponding to a Kappa coefficient of 0.54–0.83. The disagreement percentage for the six schemes was mainly due to AD (14.0–29.2%) rather than QD (1.2–15.2%). Classification performance based on JM-TWINSPAN schemes significantly improved in comparison to TWINSPAN schemes. PA and UA measures were more than 70% (LC S. chamaejasme based on MLC excepted) for S. chamaejasme and co-existing species, which indicated the success of this optimized classification technique. Of these, RF and JM-TWINSPAN achieved the best result with PA, UA, and OA of more than 84%, the highest Kappa of 0.83, and the lowest QD and AD of 1.2 and 14%, respectively. SVM and JM-TWINSPAN also achieved good results with slightly lower accuracy than RF and JM-TWINSPAN. Overall, MLC and TWINSPAN presented with a worse performance for S. chamaejasme communities extraction, with OA and Kappa of 71.6% and 0.54, and produced the largest QD and AD of 15.2 and 29.2%.
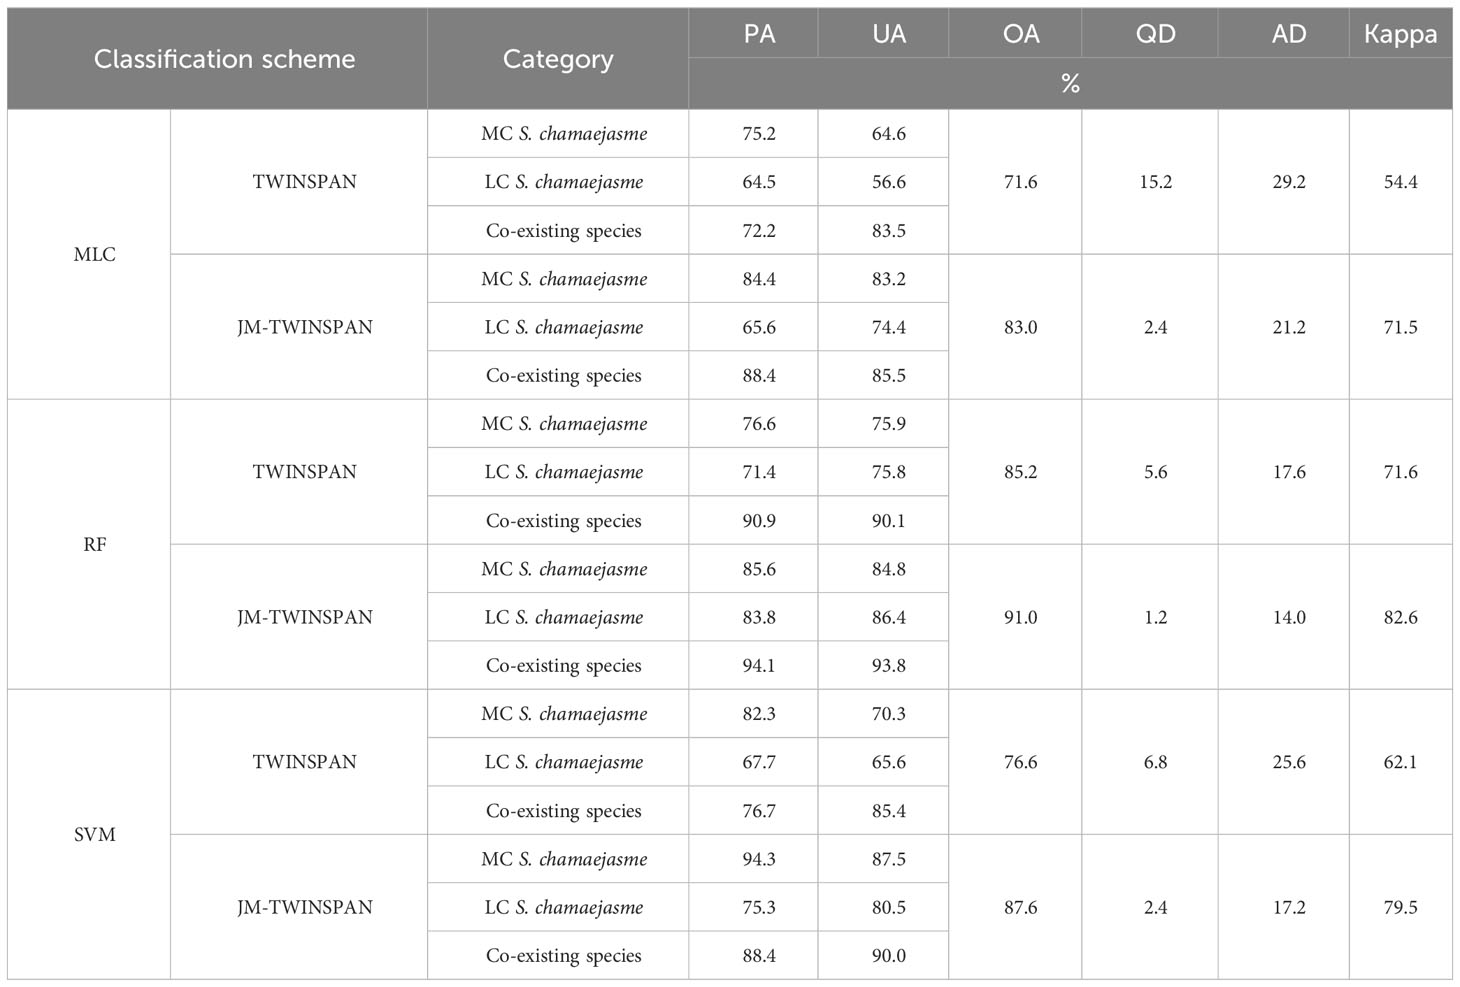
Table 7 Accuracy achieved by six classification schemes.
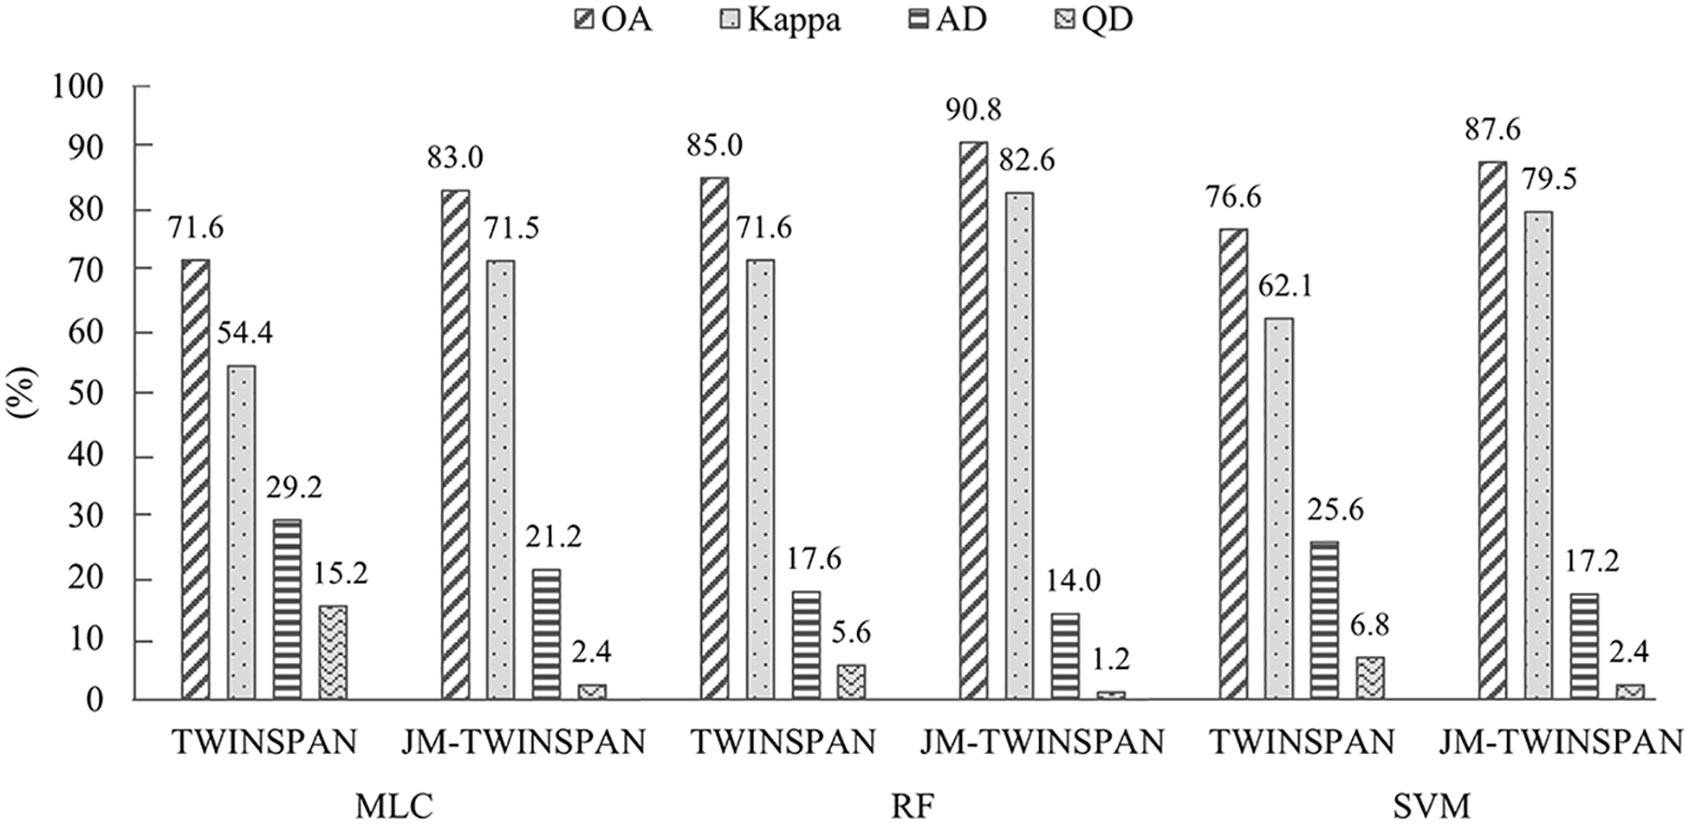
Figure 7 Accuracy comparison for six classification schemes.
4 Discussion
4.1 Impact of dimension reduction on spectral discrimination of S. chamaejasme
Dimension reduction is a critical consideration for the improvement of classification performance on hyperspectral data (Nidamanuri, 2020; Ullah et al., 2021). Various studies have indicated that no single technique universally proven to be superior for optimal feature selection, and inconsistent results have usually been obtained using different techniques (Taylor et al., 2012; Fernandes et al., 2013). In the present study, the potential of a hierarchical procedure, which is an integration of Kruskal-Wallis test and Dunn’s post hoc test, CART, and JM distance, was explored in terms of identifying feature spectra for S. chamaejasme discrimination (Fernandes et al., 2013). The three-step method allowed for adequate data dimension reduction, and the most sensitive wavelengths for recognizing S. chamaejasme were selected. The numbers of these wavelengths were reduced to 221, 189, and 77 for the class pairs of HC_S vs. CS, MC_S vs. CS, and LC_S vs. CS, achieving high reduction rates of 89.7, 91.2, and 96.4%, respectively, which was consistent with previous findings (Adam and Mutanga, 2009; Fernandes et al., 2013). Our results revealed that the spectral differences between S. chamaejasme communities and the co-existing species community weakened with the decreasing in S. chamaejasme coverage, as the magnitude of optimal wavelengths for S. chamaejasme identification decreased significantly.
As a result, 13 feature bands corresponding to the Resonon channels represented the spectral areas of maximum separability between S. chamaejasme and co-existing species. The feature bands were mainly located in the visible region, in particular green and red wavelengths, which were considered crucial for S. chamaejasme discrimination. The spectral differences between S. chamaejasme and other species in the visible region were mainly related to variations in foliage cover and flower pigments (Everitt et al., 2004). In the study, 38 of the 45 plots were regrouped into three communities with good separability (JM > 1.9), and the other seven plots were assigned to the communities with moderate separability (JM > 1.4). This suggested good separation of S. chamaejasme from adjacent species by using the selected feature bands, and confirmed the superiority of the hierarchical procedure for feature selection in invasive species identification, which may efficiently locate the most sensitive wavelengths without losing important information.
4.2 Implication of ecological clustering and ordination in the mapping of S. chamaejasme
RDA analysis revealed that Resonon feature bands did not relate well with the distribution of species IV data. Only 28.5% accumulative variance could be explained by variations in the image reflectance. Previous findings showed weak relationships between multispectral bands (aircraft CASI or SPOT XS data) and species abundance data in forest type classification, with explained variance of 44 and 36%, respectively (Thomas et al., 2003; Malik and Husain, 2008). Our study further suggests the difficulty of S. chamaejasme mapping at the species level, even when using hyperspectral feature bands. This is due to the smaller size and patchiness of herbaceous plants (Jana et al., 2017). Vegetation spectra were largely affected by structure and coverage, rather than floristic species, thus leading to high variations in the floristic composition that was remained unexplained (Brook and Kenkel, 2002). Ordination techniques proved to be useful tools for determining the relationship between floristic characteristics and spectral reflectance data.
TWINSPAN analysis divided the field plots into ecologically meaningful vegetation classes (Kalantari et al., 2022; Novák et al., 2023). Examination of the IV data revealed that the three TWINSPAN communities in the study site consisted of similar species but were very different in terms of dominant species. Native species S. purpurea and A. rivularis were highly abundant in Group III; S. chamaejasme replaced the two species as the major dominant species in Groups II and I, with increasing S. chamaejasme coverage. Using the TWINSPAN clusters, S. chamaejasme plots and co-existing species plots were grouped together. For example, the 19 plots in Group I composed of 14 plots of moderate-cover S. chamaejasme, four plots of low-cover S. chamaejasme and one plot of co-existing species. The mixture caused considerable spectral conflicts between the plots, making it difficult to separate classes based solely on spectral response. Overall, the results showed apparently lower accuracies of S. chamaejasme classification based on TWINSPAN schemes, suggesting that a purely ecological grouping was not readily amenable to spectral classification. A combination of TWINSPAN and JM distances represents an attempt to adjust ecological classes using the rule of spectral similarity. In our study, the JM-TWINSPAN Groups 3, 2, and 1 were defined as ecologically meaningful communities that can be spectrally separated. The new groups highlighted the gradient of S. chamaejasme coverage of 0.3, 16.2, and 29.5%, and were distributed in more clear spatial patterns.
Compared to TWINSPAN schemes, JM-TWINSPAN schemes presented as a marked improvement of S. chamaejasme classification accuracy, with the increase of OA and Kappa of 5.8–11.4% and 0.11–0.17, respectively, and the decrease of QD and AD of 4.4–12.8% and 3.6–8.4%, respectively. Our study suggests that the combination of ecological clustering and spectral separability analysis provides an refined method for identifying S. chamaejasme, especially when S. chamaejasme coverage is low or medium. Also, the distinct features of white-pink inflorescences in the flowering phase makes S. chamaejasme distinguishable from co-existing species, which implies that phenological differences play an important role in influencing RS detection of invasive weeds.
Among all classification schemes, RF and JM-TWINSPAN achieved the best classification result (OA = 91.00%, Kappa = 0.83, AD = 14.0%, and QD = 1.2%), with the highest PA and UA larger than 84%. The disagreement percentage for the all schemes was mainly due to AD rather than QD, illustrating the main impacts of spatial error occurred in S. chamaejasme discrimination (Ji et al., 2019). The lowest AD and QD were produced by RF and JM-TWINSPAN, implicating this approach as a promising one for accurately discriminating S. chamaejasme via hyperspectral imagery.
5 Conclusion
The approach advocated here is an integration of data dimension reduction, clustering and ordination analysis, and spectral separability analysis for the identification of S. chamaejasme using Resonon hyperspectral images. The hierarchical procedure of statistical tests, CART, and JM distance can be used to select the most important feature bands for discriminating S. chamaejasme from co-existing species, reducing considerably the dimensions of hyperspectral imagery. Our results indicate that detailed field species/plot data are essential for image interpretation of vegetation types. The performance of clustering and ordination helps to define vegetation classes which are not only ecologically meaningful but also spectrally distinctive, and provide a highly robust and flexible method for the accurate mapping of invasive weeds.
Data availability statement
The original contributions presented in the study are included in the article/supplementary material. Further inquiries can be directed to the corresponding author.
Author contributions
HW: Formal Analysis, Software, Visualization, Writing – original draft, Writing – review & editing. YML: Conceptualization, Investigation, Methodology, Writing – original draft, Writing – review & editing. XG: Formal Analysis, Investigation, Software. XD: Formal Analysis, Investigation, Software. YQL: Investigation, Supervision. LW: Investigation, Supervision.
Funding
The author(s) declare financial support was received for the research, authorship, and/or publication of this article. This work was funded by the National Natural Science Foundation of China (Grant No.41871335).
Conflict of interest
The authors declare that the research was conducted in the absence of any commercial or financial relationships that could be construed as a potential conflict of interest.
Publisher’s note
All claims expressed in this article are solely those of the authors and do not necessarily represent those of their affiliated organizations, or those of the publisher, the editors and the reviewers. Any product that may be evaluated in this article, or claim that may be made by its manufacturer, is not guaranteed or endorsed by the publisher.
References
Adam E., Mutanga O. (2009). Spectral discrimination of papyrus vegetation (Cyperus papyrus L.) in swamp wetlands using field spectrometry. Isprs. J. Photogramm. 64, 612–620. doi: 10.1016/j.isprsjprs.2009.04.004
Ana S. V., Domingo A., João C. C., Joana R. V., João P. H. (2018). Managing plant invasions through the lens of remote sensing: A review of progress and the way forward. Sci. Total. Environ. 642, 1328–1339. doi: 10.1016/j.scitotenv.2018.06.134
Bao G. S., Wang Y. Q., Song H. L., Wang H. S., Yin Y. L., Liu C. S., et al. (2019). Effects of Stellera chamaejasme patches on the surrounding grassland community and on soil physical-chemical properties in degraded grasslands susceptible S. chamaejasme invasion. Acta Prataculturae. Sinica. 28, 51–61. doi: 10.11686/cyxb2018205
Brook R. K., Kenkel N. C. (2002). A multivariate approach to vegetation mapping of Manitoba’s Hudson Bay Lowlands. Int. J. Remote. Sens. 23, 4761–4776. doi: 10.1080/01431160110113917
Du B. J., Mao D. H., Wang Z. M., Qiu Z. Q., Yan H. Q., Feng K. D., et al. (2021). Mapping wetland plant communities using unmanned aerial vehicle hyperspectral imagery by comparing object/pixel-based classifications combining multiple machine-learning algorithms. IEEE. J-Stars. 14, 8249–8258. doi: 10.1109/JSTARS.2021.3100923
Everitt J. H., Yang C., Alaniz M. A., Davis M. R., Nibling F. L., Deloach C. J. (2004). Canopy spectra of giant reed and associated vegetation. J. Range. Manage. 57, 561–569. doi: 10.2111/1551-5028(2004)057[0561:CSOGRA]2.0.CO;2
Fernandes M. R., Aguiar F. C., Silva J. M. N., Ferreira M. T., Pereira J. M. C. (2013). Spectral discrimination of giant reed (Arundo donax L.): A seasonal study in riparian areas. ISPRS. J. Photogramm. 80, 80–90. doi: 10.1016/j.isprsjprs.2013.03.007
Francisco J., Garcia R., Dvoralai W., Jesper R. (2015). Sugar beet (Beta vulgaris L.) and thistle (Cirsium arvensis L.) discrimination based on field spectral data. Biosyst. Eng. 139, 1–15. doi: 10.1016/j.biosystemseng.2015.07.012
Gorry P. A. (1990). General least-squares smoothing and differentiation by the convolution (Savitzky-Golay) method. Anal.Chem. 62, 570–573. doi: 10.1021/ac00205a007
Hakala T., Markelin L., Honkavaara E., Scott B., Theocharous T., Nevalainen O., et al. (2018). Direct reflectance measurements from drones: sensor absolute radiometric calibration and system tests for forest reflectance characterization. Sensors-basel. 18, 1417. doi: 10.3390/s18051417
Harris R. B. (2010). Rangeland degradation on the Qinghai-Tibetan plateau: A review of the evidence of its magnitude and causes. J. Arid. Environ. 74, 1–12. doi: 10.1016/j.jaridenv.2009.06.014
Hill M. O. (1979). TWINSPAN: a FORTRAN program for arranging multivariate data in an ordered two-way table by classification of the individuals and attributes (“New York, USA: Cornell University Press).
Hill M. O., Gauch H. G. (1980). Detrended correspondence analysis: an improved ordination technique. Vegetation. 42, 47–58. doi: 10.1007/BF00048870
Huang Y. Q., Li J., Yang R., Wang F. K., Li Y. Z., Zhang S., et al. (2021). Hyperspectral imaging for identification of an invasive plant Mikania micrantha Kunth. Front. Plant Sci. 12. doi: 10.3389/fpls.2021.626516
Jana M., Josef B., Josef B., Tomáš B., Petr D., Michaela V., et al. (2017). Timing is important: unmanned aircraft vs. Satellite Imagery Plant Invasion Monitoring. Front. Plant Sci. 8. doi: 10.3389/fpls.2017.00887
Ji M., Liu L., Du R., Buchroithner M. F. (2019). A comparative study of texture and convolutional neural network features for detecting collapsed buildings after earthquakes using pre- and post- event satellite imagery. Remote. Sens-Basel. 11, 1202. doi: 10.3390/rs11101202
Kalantari Z., Heydari M., Esmailzadeh O., Asadi H., Prévosto B. (2022). Classification of plant communities in the Caspian Hyrcanian English yew (Taxus baccata L.) forests using environmental factors: testing the modified TWINSPAN method. J. Wildlife. Biodivers. 6, 57–78. doi: 10.22120/jwb.2022.543338.1479
Malik R. N., Husain S. Z. (2008). Linking remote sensing and ecological vegetation communities: a multivariate approach. Pak. J. Bot. 40, 337–349. doi: 10.1127/0029-5035/2008/0086-0259
Middleton M., Närhi P., Arkimaa H., Hyvönen E., Kuosmanen V., Treitz P., et al. (2012). Ordination and hyperspectral remote sensing approach to classify peatland biotopes along soil moisture and fertility gradients. Remote. Sens. Environ. 124, 596–609. doi: 10.1016/j.rse.2012.06.010
Nidamanuri R. R. (2020). Hyperspectral discrimination of tea plant varieties using machine learning, and spectral matching methods. Remote. Sens. Appl. 19, 100350. doi: 10.1016/j.rsase.2020.100350
Novák P., Willner W., Biurrun I., Gholizadeh H., Heinken T., Jandt U., et al. (2023). Classification of European oak-hornbeam forests and related vegetation types. Appl. Veg. Sci. 26, e12712. doi: 10.1111/avsc.12712
Peña-Barragán J. M., López-Granados F., Jurado-Expósito M., García-Torres L. (2006). Spectral discrimination of Ridolfia segetum and sunflower as affected by phenological stage. Weed. Res. 46, 10–21. doi: 10.1111/j.1365-3180.2006
Questier F., Put R., Coomans D., Walczak B., Heyden Y. V. (2005). The use of CART and multivariate regression trees for supervised and unsupervised feature selection. Chemometr. Intell. Lab. 76 (1), 45–54. doi: 10.1016/j.chemolab.2004.09.003
Robert G. P., Marco M. (2011). Death to Kappa: birth of quantity disagreement and allocation disagreement for accuracy assessment. Int. J. Remote. Sens. 32, 4407–4429. doi: 10.1080/01431161.2011.552923
Schmidt K. S., Skidmore A. K. (2003). Spectral discrimination of vegetation types in a coastal wetland. Remote. Sens. Environ. 85, 92–108. doi: 10.1016/S0034-4257(02)00196-7
Shi Z. C. (1997). The poisonous plants of chinese grassland (Beijing, China: China Agriculture Press).
Speiser L. J., Miller E. M., Tooze J., Lp E. (2019). A comparison of random forest variable selection methods for classification prediction modeling. Expert. Syst. Appl. 134, 93–101. doi: 10.1016/j.eswa.2019.05.028
Subhashni T., Lalit K., Nick R., Craig R. G. L. (2012). Optimal band selection from hyperspectral data for Lantana camara discrimination. Int. J. Remote. Sens. 33, 5418–5437. doi: 10.1080/01431161.2012.661093
Taylor S., Nickreid L. K., Lewis C. R. G. (2012). Optimal band selection from hyperspectral data for Lantana camara discrimination. Int J Remote Sens. 33, 5418–5437. doi: 10.1080/01431161.2012.661093
Thibaut C., Brenna R. F. (2021). Redundancy analysis: A Swiss Army Knife for landscape genomics. Methods Ecol. Evol. 12 (12), 2298–2309. doi: 10.1111/2041-210X.13722
Thomas V., Treitz P., Jelinski D., Miller J., Lafleur P., McCaughey J. H. (2003). Image classification of a northern peatland complex using spectral and plant community data. Remote. Sens. Environ. 84, 83–99. doi: 10.1016/S0034-4257(02)00099-8
Ullah S., Shakir M., Iqbal M. S., Iqbal A., Ali M., Shafique M. (2021). Identifying optimal waveband positions for discriminating Parthenium hysterophorus using hyperspectral data. Ecol. Inform. 64, 101362. doi: 10.1016/J.ECOINF.2021.101362
Wang L., Zhang Y., Huang L., Li Y. (2021). Canopy spectral characteristics of typical invasive and native plants in the coastal wetland of Yancheng City, China. Acta Ecol. Sinica. 41, 631–637. doi: 10.1016/j.chnaes.2021.10.001
Zhang Y. H., Volis S., Sun H. (2010). Chloroplast phylogeny and phylogeography of Stellera chamaejasme on the Qinghai-Tibet Plateau and in adjacent regions. J. Mol. Phylogenet. Evol. 57, 1162–1172. doi: 10.1016/j.ympev.2010.08.033
Keywords: field spectrometry, dimensionality reduction, clustering and ordination, JM distance, invasive species
Citation: Wang H, Liu Y, Ge X, Dong X, Long Y and Wang L (2023) Discriminating Stellera chamaejasme in alpine grasslands using UAV hyperspectral imagery and multivariate analysis. Front. Ecol. Evol. 11:1254143. doi: 10.3389/fevo.2023.1254143
Received: 06 July 2023; Accepted: 09 October 2023;
Published: 26 October 2023.
Edited by:
Amin Zehtabian, Free University of Berlin, GermanyReviewed by:
David Jupp, Commonwealth Scientific and Industrial Research Organisation (CSIRO), AustraliaHoward Epstein, University of Virginia, United States
Copyright © 2023 Wang, Liu, Ge, Dong, Long and Wang. This is an open-access article distributed under the terms of the Creative Commons Attribution License (CC BY). The use, distribution or reproduction in other forums is permitted, provided the original author(s) and the copyright owner(s) are credited and that the original publication in this journal is cited, in accordance with accepted academic practice. No use, distribution or reproduction is permitted which does not comply with these terms.
*Correspondence: Yongmei Liu, bGl1eW1Abnd1LmVkdS5jbg==