 Lijia Zhong
 Bo Wang2
- 1Institute of Geotechnical Engineering, Xi’an University of Technology, Xi’an, Shaanxi, China
- 2JiKan Research Institute of Engineering Investigation and Design, Co., Ltd., Xi’an, Shaanxi, China
- 3Guangzhou Traffic Design & Research Institute Co., Ltd., Guangzhou, Guangdong, China
- 4PowerChina Northwest Engineering Co., Ltd., Xi’an, Shaanxi, China
The study of the rainfall infiltration mechanism of unsaturated soil has always been a hot issue in the field of geotechnical engineering. It is worth studying which parameters should be introduced to characterize the infiltration characteristics of unsaturated soil in the calculation and analysis of rainfall infiltration. In this paper, the Fredlund–Xing model was quoted in the SEEP/W module of the Geostudio software, and the transient numerical calculation of rainfall infiltration under the same rainfall duration T and different rainfall intensity I was carried out for a soil column. Three infiltration characteristic parameters were introduced: rainfall infiltration front depth WF, suction reduction depth MRn, and section infiltration rate IR. The variation of these three parameters and rainfall intensity I during rainfall were sorted out and analyzed; it is indicated that WF increases with the extension of rainfall duration. MRn decreases with the increase of suction reduction rate n%, and when the rainfall duration is 24 h, the maximum depth of the soil column affected by rainfall is approximately 35% of the total depth. IR is mainly affected by the rainfall intensity I and the saturation permeability coefficient ks. There is a limit value for the influence of I on WF, MRn, and IR, and the limit rainfall intensity under the calculation conditions in this paper is I = 2.5ks.
1 Introduction
Slope instability and landslide disasters occur frequently. Landslides are harmful, large scale, and difficult to predict. They not only seriously threaten the safety of people’s lives, but also cause certain ecological damage. Many scholars (Anderson and Zhu, 1996; Rahardjo, 1996; Rahardjo et al., 2001; Tsaparas et al., 2002; Rahardjo et al., 2005; Rahardjo et al., 2007; Rahardjo et al., 2008) have summarized and analyzed the causes of many landslide accidents, and found that rainfall infiltration is the most important cause of landslides. For example, the landslide in Huaxian County, Shaanxi Province in 2006 was a typical case of rainfall-induced loess slope instability. Therefore, it is of great significance to study the mechanism of the rainfall infiltration characteristics.
At present, many scholars have carried out a lot of related research. Romano et al. (1998), Corradini et al. (2000), and Cho and Lee (2002) studied the characteristics of rainfall infiltration from the perspectives of soil science, agricultural water, and soil engineering and hydrology. Based on the effective stress principle of unsaturated soil and the double stress strength theory, Zhou et al. (2014) established a nonlinear programming model, and verified the correctness of the proposed model through an example analysis, so that we have a further understanding of the law of soil slope instability under unsaturated unsteady seepage. Wang et al. (2015) found that there was no slope runoff phenomenon through numerical experiments, which was significantly different from the theory of orthogonal infiltration boundary. Moreover, the discrimination mechanism of soil moisture content, infiltration capacity, and slope boundary condition transformation of sandy slope surface calculated according to the orthogonal infiltration boundary theory was not consistent with the actual situation. Wu et al. (2017) conducted a physical model test on the anti-seepage effect of the slope of the unsaturated drainage structure, and found that the drainage-seepage control effect and ecological function of the binary structure were significantly better than that of a single structure. Zeng et al. (2020) found that the infiltration depth of the slope was the largest at the foot of the slope and the smallest at the middle of the slope, and the infiltration rate was the largest at the top of the slope and the smallest at the middle of the slope.
However, so far, no one has summarized the accurate infiltration law characteristics in the whole rainfall process, and the understanding of rainfall infiltration only stays on the qualitative level. Therefore, it is necessary to study the parameters or indicators that could quantitatively describe the characteristics of rainfall infiltration.
In this study, the Fredlund–Xing model is introduced into the software program, and the unsaturated seepage equation is used to calculate the water seepage in the soil. Three rainfall infiltration characteristic parameters are introduced into the data analysis of a rainfall infiltration numerical experiment: infiltration front depth WF, suction reduction depth MRn, and section infiltration rate IR. These three parameters were used to describe the whole infiltration process, which not only is of great significance for the collation and comparative analysis of the large number of data in the numerical simulation of one-dimensional rainfall infiltration, but also can provide new important indicators for the analysis of rainfall infiltration mechanism in practical engineering.
2 Numerical test scheme and infiltration characteristic parameters
2.1 Calculation schemes
In this paper, by using the SEEP/W module in Geostudio2004 developed by the Geo-slope company (Yang, 1992), the finite element numerical calculation of one-dimensional transient saturated–unsaturated seepage for an isotropic homogeneous soil column with a height of 5 m and a width of 0.4 m is carried out, considering rainfall conditions. The influence of the rainfall intensity I and the infiltration characteristic parameters on the infiltration characteristics of unsaturated soil columns is studied.
The underground water level of the soil column model is located at its bottom and does not change during the whole rainfall process. Therefore, a total head boundary with constant 0 is set at the bottom of the soil column. The left and right sides of the soil column are impermeable, and the boundary condition of 0 flow is set at both sides. The surface runoff during rainfall and the evaporation of surface water after rain stop are not be considered in the model test. The seepage calculation and analysis of seven different rainfall intensities with a rainfall duration of 24 h are carried out for the soil column. The design values of rainfall intensity I and soil parameters under each working condition are shown in Table 1.
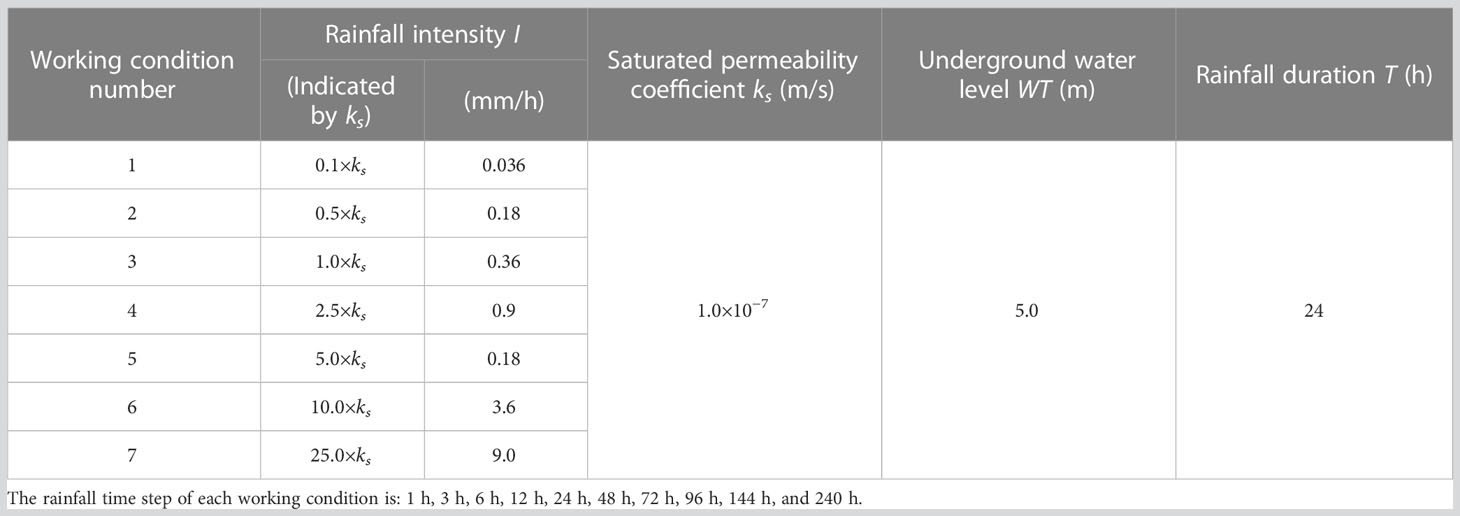
Table 1 The summary of parameters used during different series of numerical studies.
In Table 1, the rainfall intensity I is selected according to the multiple of saturated permeability coefficient ks. For example, 0.5×ks indicates that the rainfall intensity I (surface rainwater flow) is equal to 50% of the saturated permeability coefficient of soil. In this way, the permeability coefficient of the soil is linked to the amount of rainfall flow applied. The rainfall time step indicates that the time from the beginning of rainfall is the starting point of timing. The rainfall duration of 24 h indicates that the rainfall stops at 24 h, and 24 h to 240 h indicate the time period after the rainfall stops.
In the finite element calculation, the mesh division of the soil column model, the water head boundary condition, and the flow boundary condition are shown in Figure 1A, and the pore water pressure uw distribution is shown in Figure 1B.
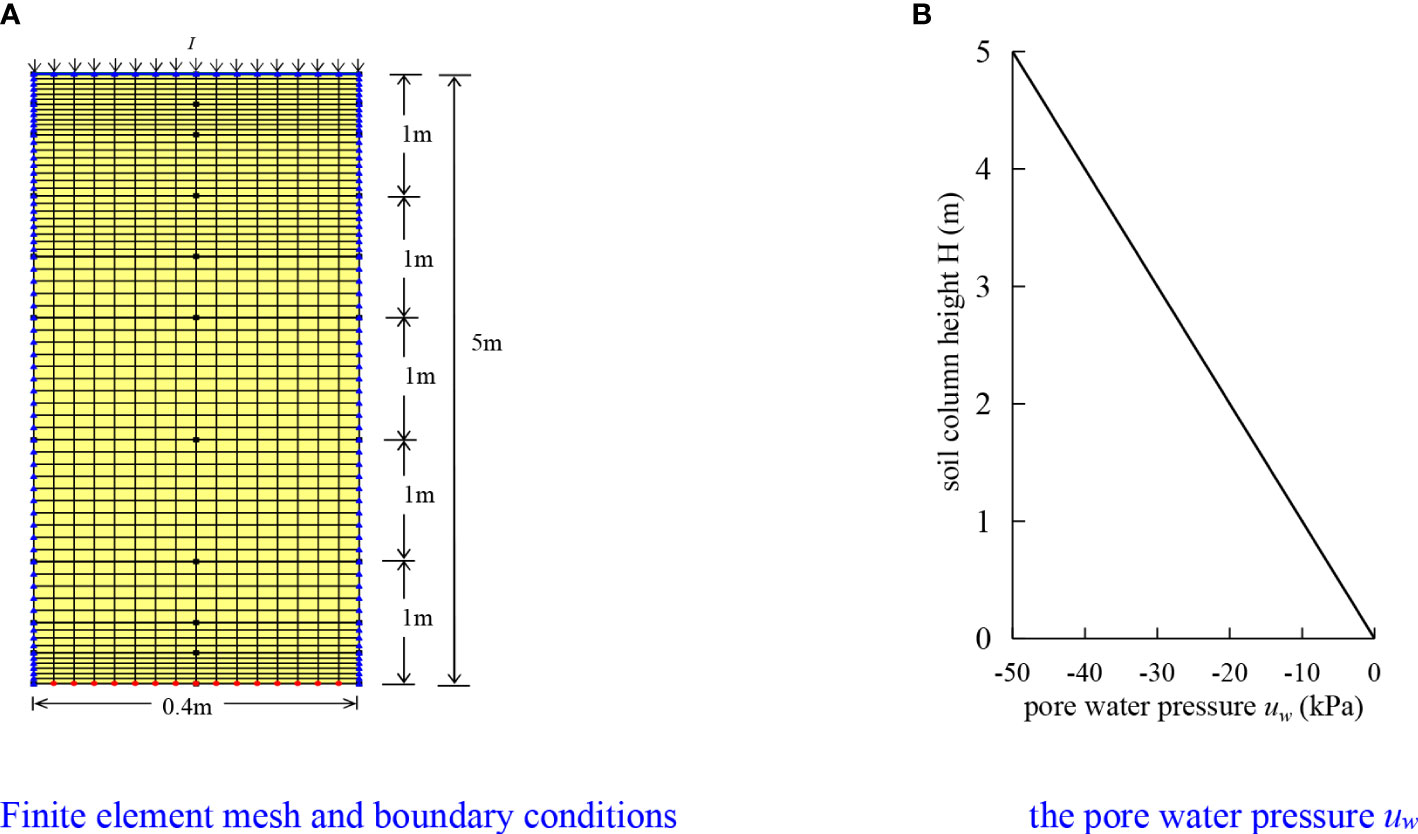
Figure 1 Finite element, boundary conditions, and initial pore water pressure conditions of the soil column. (A) Finite element mesh and boundary conditions, (B) The pore water pressure uw.
The data calculated by the soil column of each working condition will be extracted and sorted out. The variation rules of volumetric water content, infiltration characteristic parameters, and rainfall intensity in the process of rainfall duration will be analyzed.
2.2 Definition of the rainfall infiltration characteristic parameters
The analysis of the law of the soil column in the rainfall duration introduces three parameters to describe the infiltration characteristics: infiltration front depth WF, suction reduction depth MRn, and section infiltration rate IR. These three parameters are defined in detail as follows.
2.2.1 Infiltration front depth WF
The infiltration front depth WF is defined as the depth from the surface to the position of the soil where the volumetric water content θ begins to change due to rainwater infiltration, which can be determined by the graphical method shown in Figure 2. The depth of the intersection point of the section line of the initial volume water content and the section line of the water content at any time is WF. In other words, WF is the minimum depth at which the volumetric water content of the soil at a certain depth at any time is equal to the initial volumetric water content.
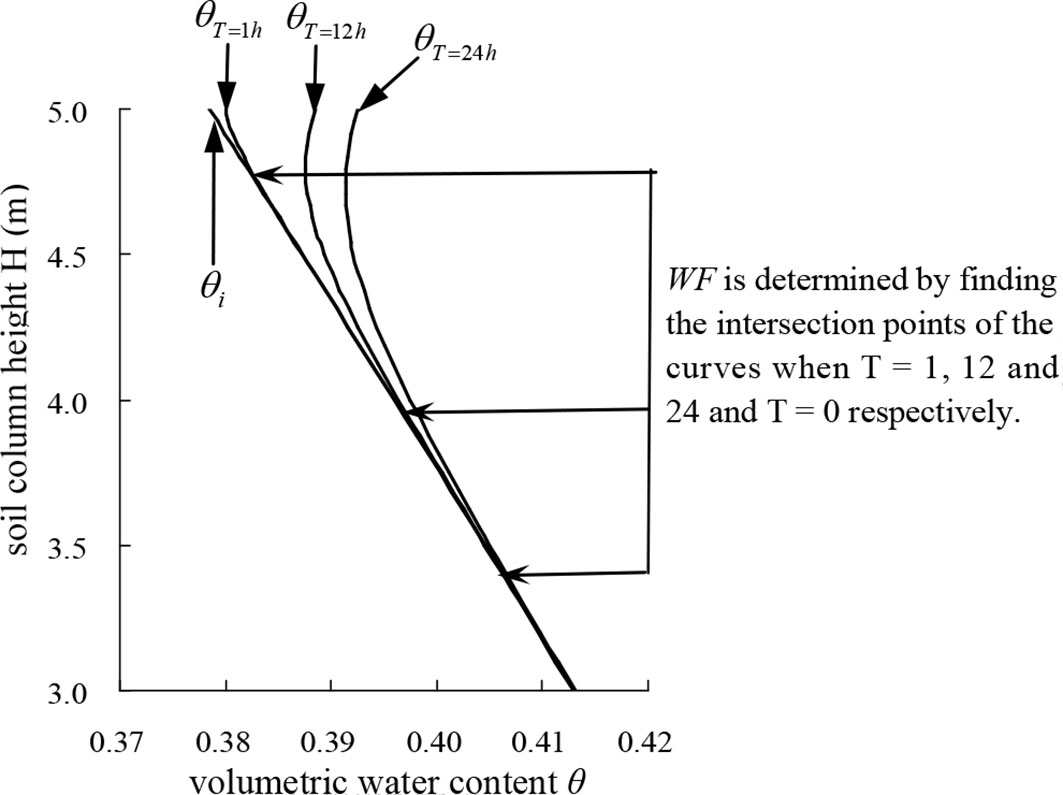
Figure 2 The schematic diagram of the determination method of the infiltration front depth WF.
WF is a depth index that is greatly affected by the rainfall conditions. In order to discuss this index in a more general case, the author introduces the dimensionless parameter of normalized infiltration front depth WFnor, which can easily describe the infiltration characteristics of the soil column. It can be calculated as Eq. 1:
where WF is the infiltration front depth (m) and WT is groundwater level (m).
2.2.2 Suction reduction depth MRn
While the finite element calculation of seepage is completed, the distribution of pore water pressure uw with depth under different working conditions is extracted for further analysis. The suction reduction depth MRn is defined as the depth at which the soil matric suction (ua − uw)r decreases to the initial matric suction (ua − uw)i during the rainfall process. n% is the matrix suction reduction rate.
In the numerical calculation, five kinds of matric suction reduction rates are set, i.e., n% is 10%, 20%, 30%, 40%, and 90%, respectively. The corresponding suction reduction depths are MR10, MR20, MR30, MR40, and MR90. For example, MR10 means the corresponding soil position when the suction is reduced by 10%, that is, all the matric suction (ua − uw) above this depth has been reduced by 10% compared with the initial matric suction.
MRn is used to describe the distribution law of matric suction reduction of soil column section caused by the rainfall process. As shown in Figure 3, we can determine five suction reduction depths (i.e., MR10, MR20, MR30, MR40, and MR90) by the distribution of pore water pressure with depth. The influence of the whole rainfall process on the matric suction reduction of the soil column can be described according to this figure.
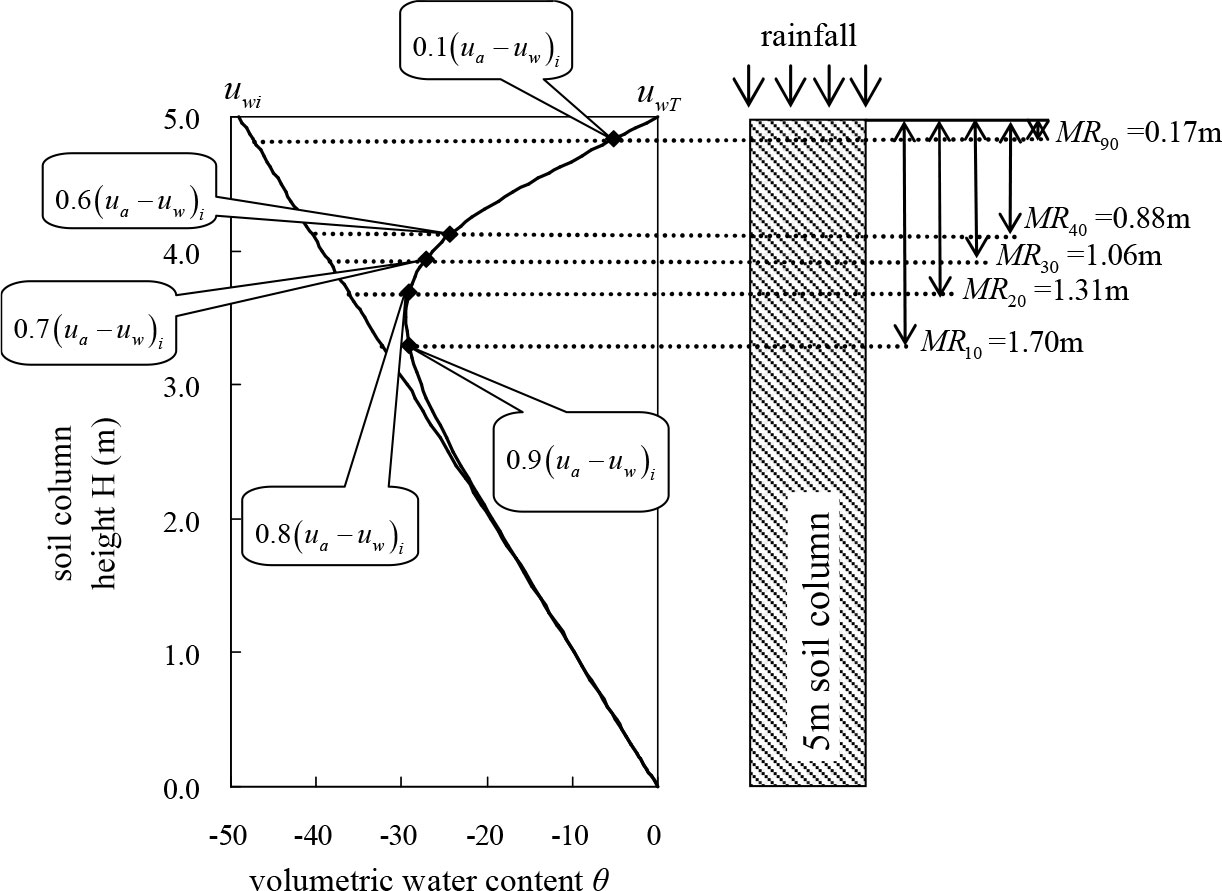
Figure 3 The schematic diagram of the determination method of the suction reduction depth MRn.
We then introduce a non-dimensional parameter of the normalized suction reduction depth MRnnor to characterize the suction reduction law of the soil column more conveniently. The calculation of MRnnor is as shown in Eq. 2:
where MRn is the suction reduction depth (m) and WT is groundwater level (m).
2.2.3 Section infiltration rate IR
In order to represent the flow velocity of rainwater in the soil column through the Y direction of a certain section, the parameter of section infiltration rate IR is introduced.
The soil column used in the seepage analysis of the model calculation in this paper is divided into seven sections along the horizontal direction, and the variation of the infiltration rate of each section with time is monitored. The height of each section is divided by the depth of the groundwater level, and are normalized to obtain the corresponding normalized height Hnor. The position of IR and its corresponding section normalized height Hnor are calculated for each section, as shown in Figure 4.
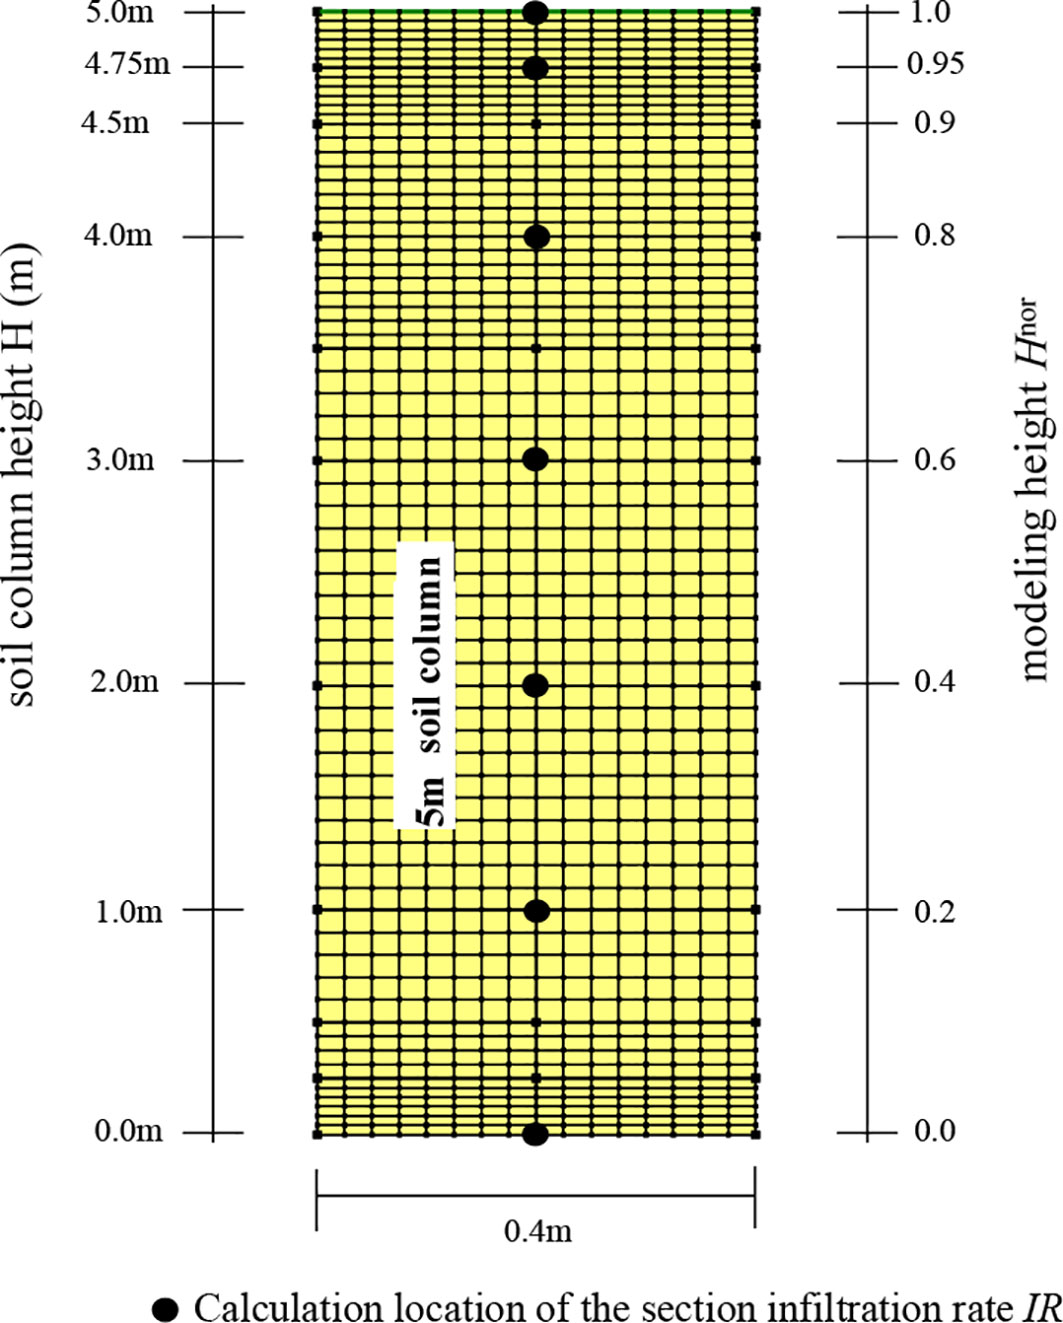
Figure 4 Sketch defining the normalized height Hnor and locations where sectional infiltration rates IR were computed.
The dimensionless parameter of the maximum infiltration rate IRmaxnor of the modeled section is introduced to describe the relative size of the infiltration rate of the soil column. The calculation formula is as shown in Eq. 3:
where IRmax is the section infiltration rate (m/s) and I is the rainfall intensity (mm/h).
After the seepage finite element calculation of the designed different working conditions, the influence of rainfall on the soil is analyzed by using the three defined rainfall infiltration characteristic parameters; the rainfall infiltration characteristics and mechanism of the soil column are described.
2.3 Hydraulic characteristic function used for the calculation
At present, the saturated permeability function and soil–water characteristic curve are mostly used to estimate the permeability function of unsaturated soil.
The SEEP/W module of the finite-element seepage analysis software Geostudio2004 developed by Geo-slope International Ltd (2004) used in this paper contains Fredlund–Xing formula [correction coefficient C(ψ) = 1] (Fredlund and Xing, 1994), as shown in Eq. 4. In this paper, this model (Fredlund et al., 1997) is used to describe the soil–water characteristic curve of unsaturated soil column.
where kwy is the permeability coefficient of water in the y direction (mm/h), q is the flow of rainwater applied on the surface (mm/h), Hw is the total water head (m), m2w is the slope corresponding to the suction at any point in the soil–water characteristic curve, γw is the bulk density of water (kN/m3), and t is the time of rainfall (h).
The transient seepage analysis of unsaturated soil includes two hydraulic characteristic functions (i.e., soil–water characteristic curve and permeability function). The soil–water characteristic curve and permeability function used in this paper are the experimental curve data obtained by Professor Zhang Zhao (2009) according to the prediction method of Fredlund et al. (1994), as shown in Figure 5.
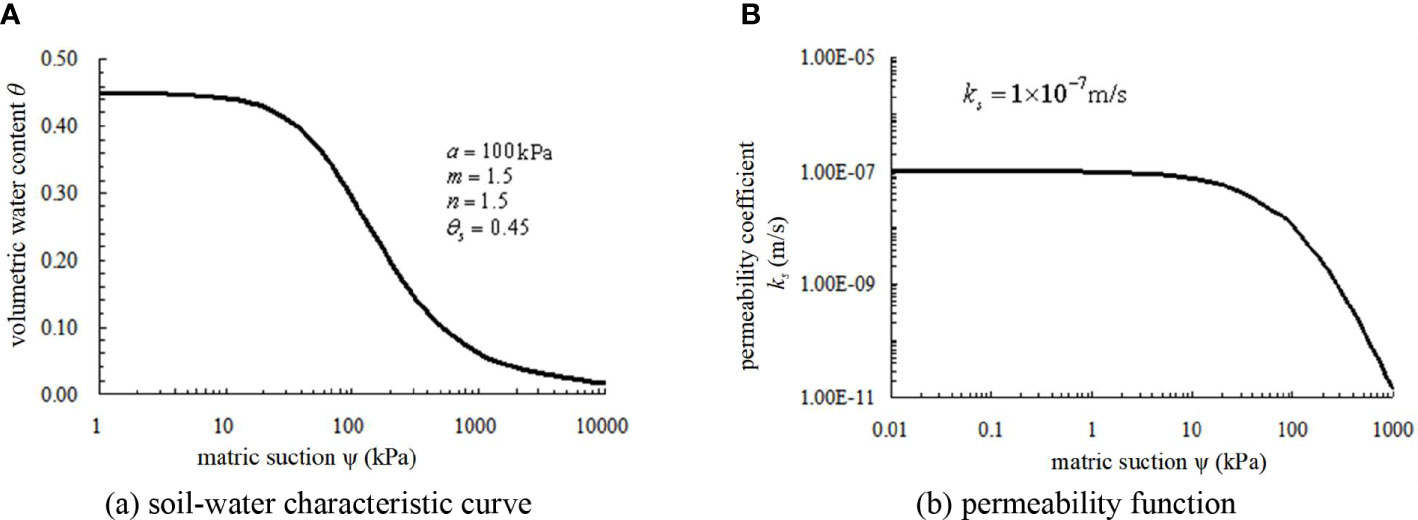
Figure 5 The soil–water characteristic curve and permeability function used in the numerical test in this paper. (A) Soil–water characteristic curve, (B) Permeability function.
3 Results and analysis
3.1 Results and analysis of WF
Firstly, the distribution curve of the volumetric water content θ of the soil column along its height at each time under different rainfall intensity I is sorted out, as shown in Figure 6.
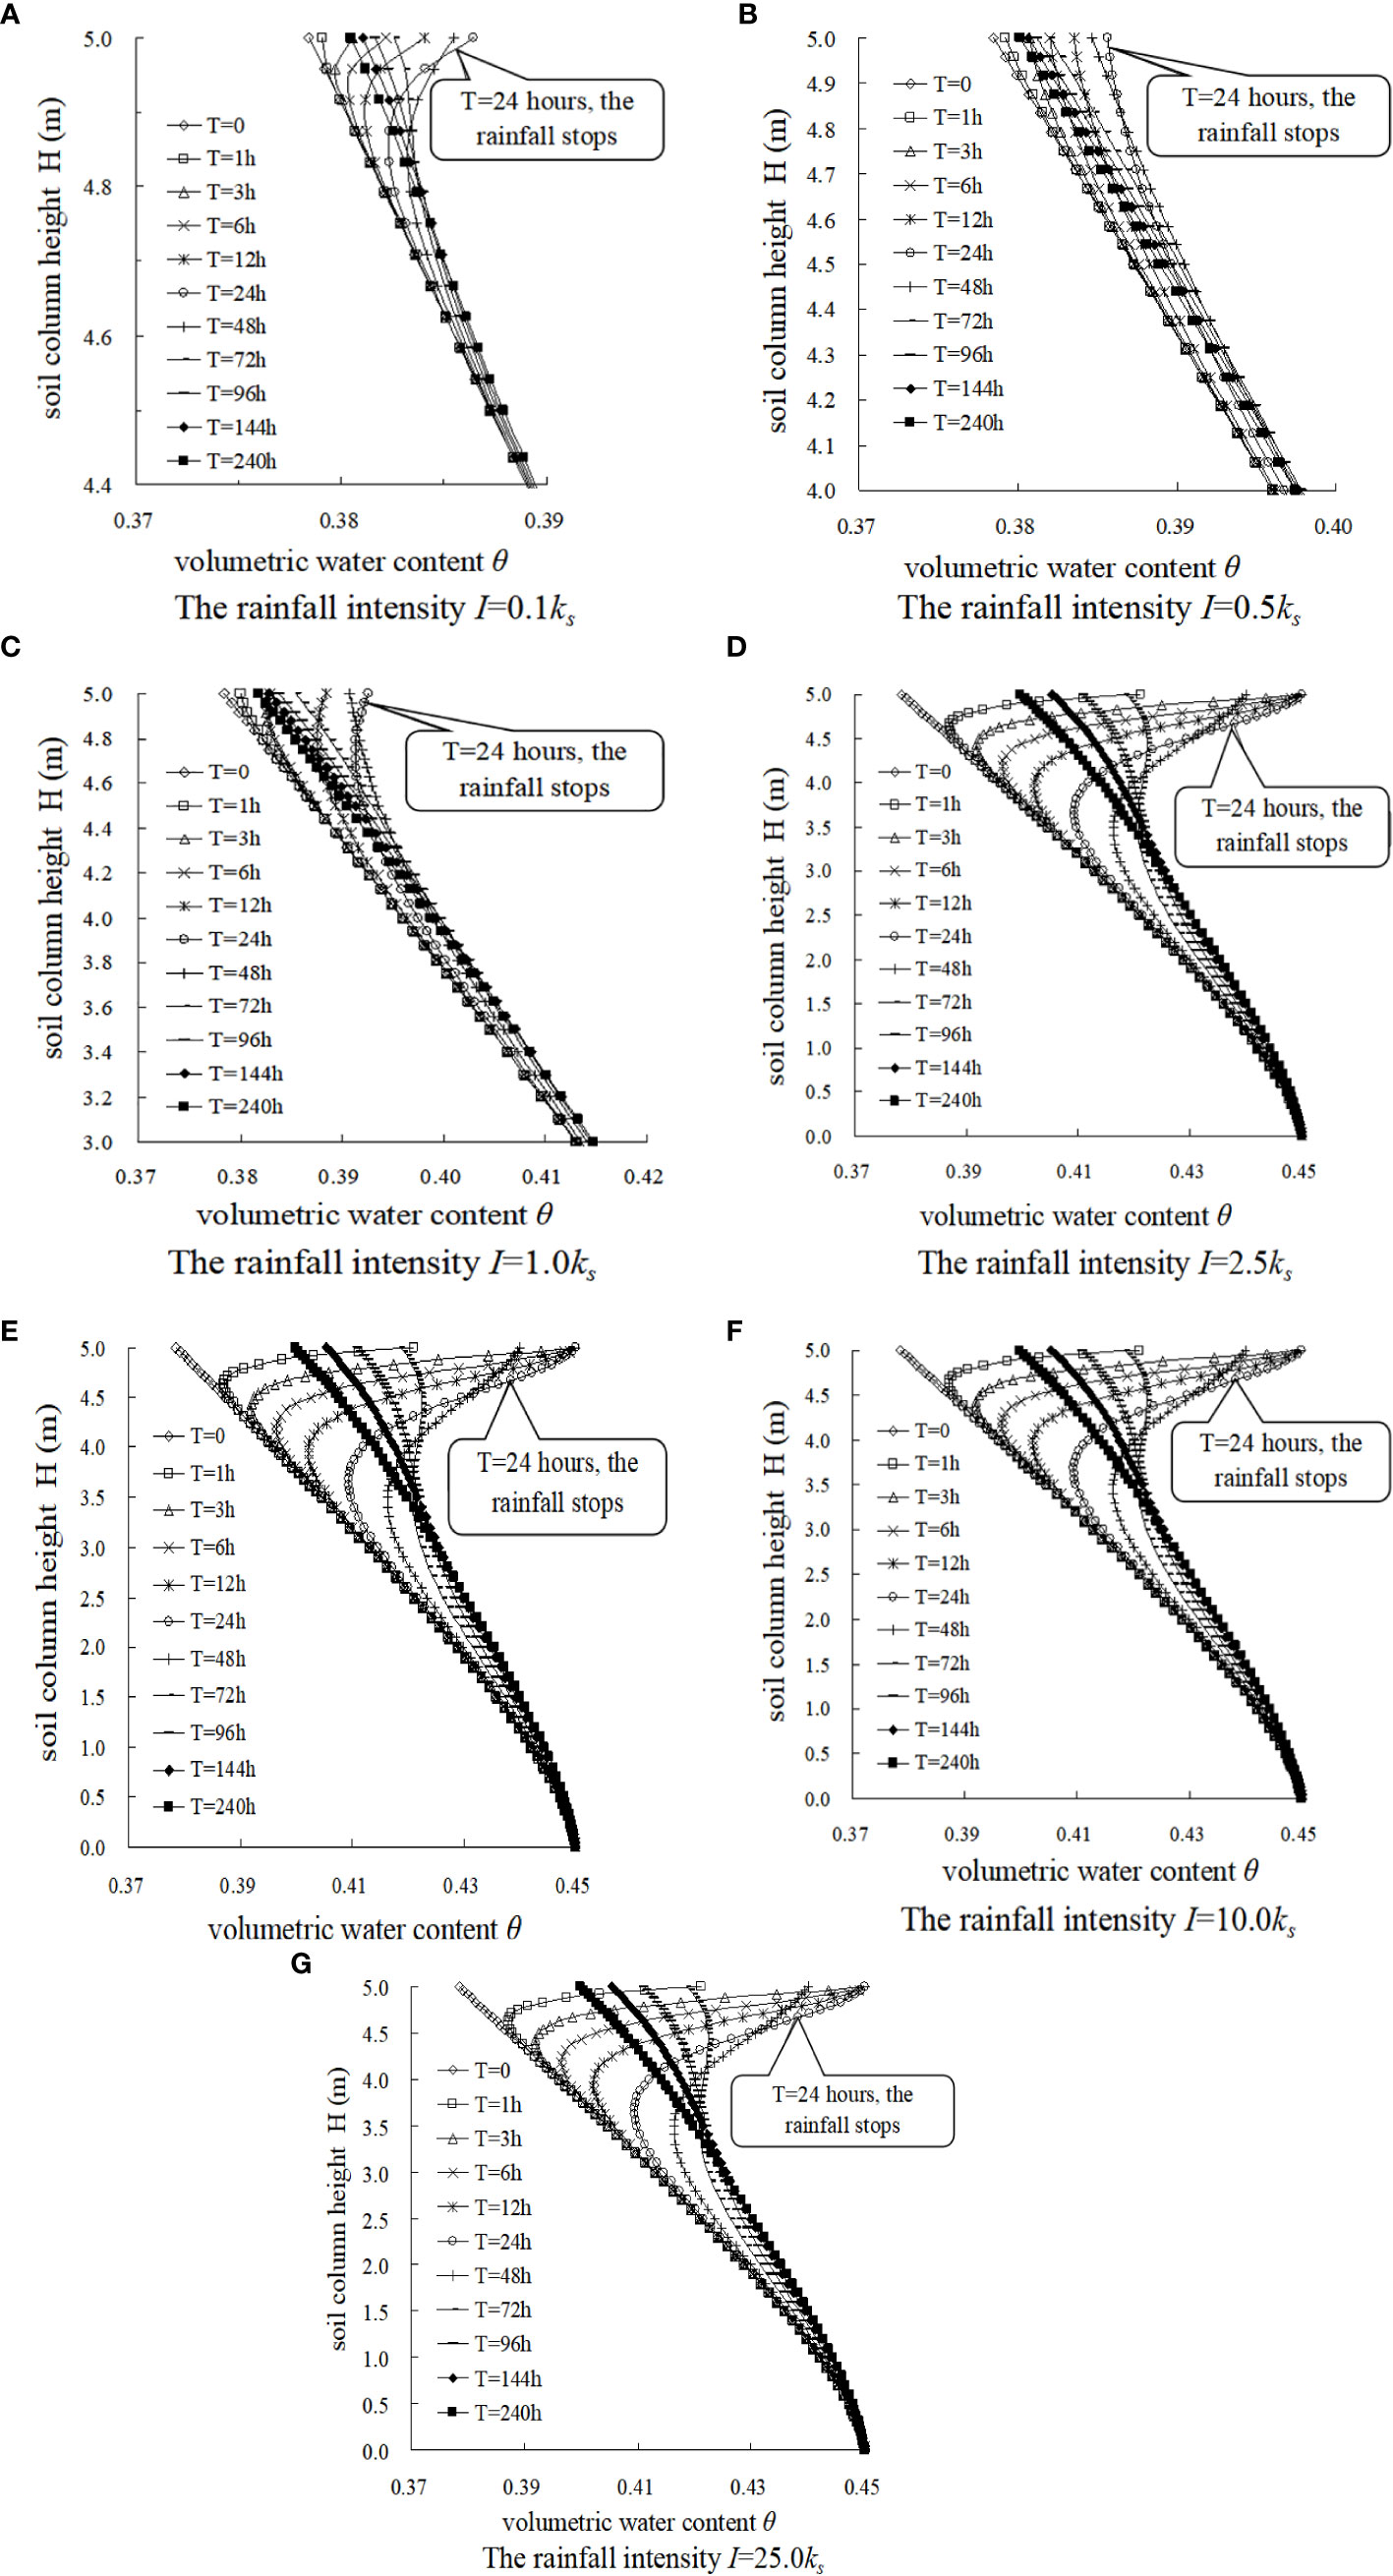
Figure 6 The relations between height of the soil column H and volumetric water content θ with time during and after several rainfall events under different rainfall intensities I.
As can be seen from Figure 6, during the continuous rainfall process, the volumetric water content θ gradually increases with time. However, when the rainfall stops (i.e., T = 24 h), the volumetric water content θ at the top of the soil column continues to decrease, while the θ at the bottom of the soil column continues to increase. Even 9 days after the rainfall stops (i.e., T = 240 h), the θ still does not return to the initial state. Analysis shows that with the passage of time, the water continues to penetrate downward gradually under the action of gravity and the matric suction. If the evaporation of water is not considered, the volumetric water content in the soil column will take a long time to return to the initial state.
It also can be seen from Figure 6 that under different rainfall intensities, the infiltration of rainwater in the soil column first increases the volumetric water content θ of the soil near the surface, and the θ section line gradually approaches the groundwater level line. Furthermore, in order to determine the value of WF, the distribution map of the volumetric water content θ along the depth of soil column is drawn, as shown in Figure 7.
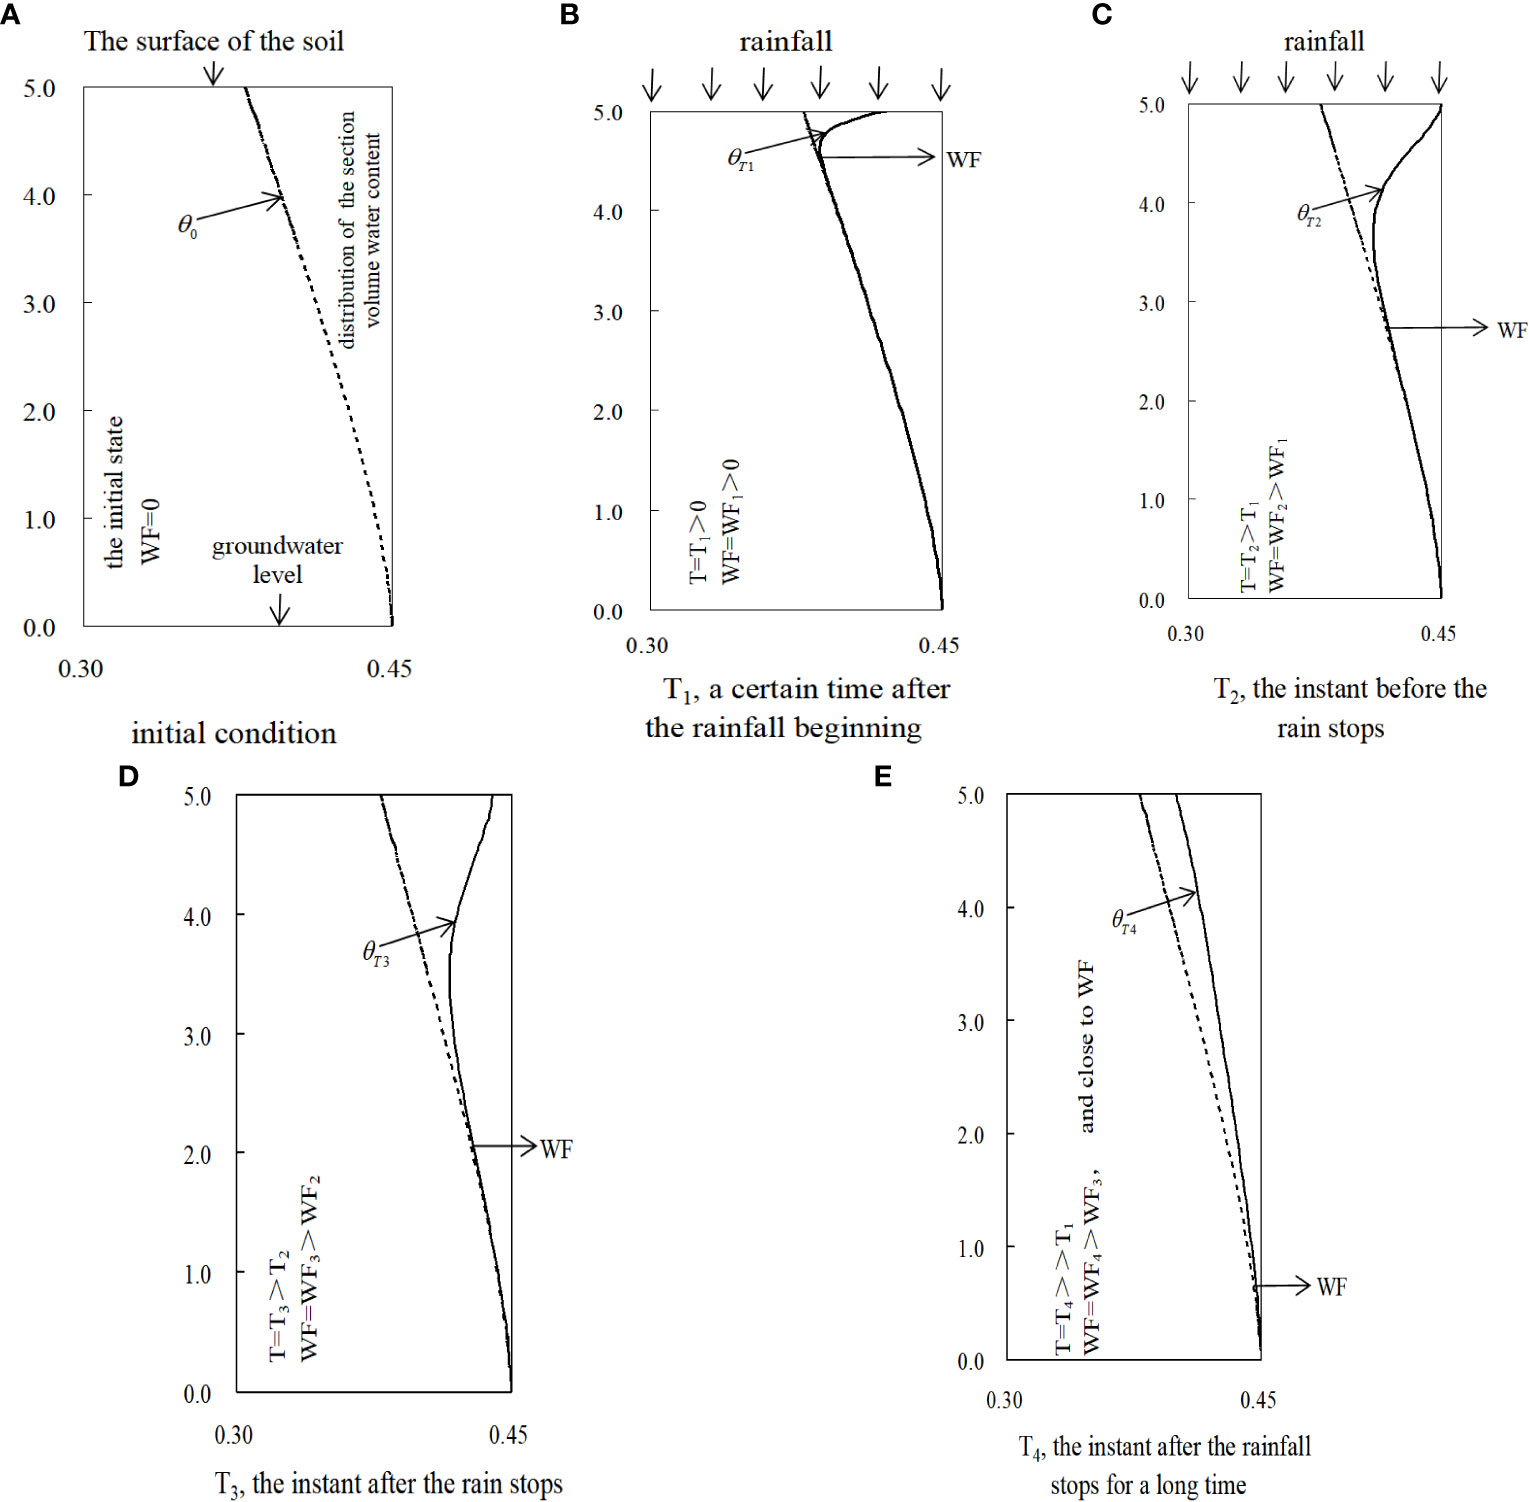
Figure 7 Generalized characterization of infiltration and the ingress of the wetting front into the soil column due to rainfall in terms of depth of wetting front WF.
From Figure 7, we can see that with the extension of rainfall duration, the WF is more and more large. With further analysis, from the beginning to the end of rainfall, the volume water content θ of the soil near the surface is most affected by the rainfall, and that of the soil at a greater depth is less affected. With the time extension, the rain continues to penetrate downward; thus, even if the rainfall stops for a long time, WF continues to increase.
3.2 Results and analysis of MRn
Similarly, the curves of pore water pressure uw at different heights of soil column under different rainfall intensity I and different rainfall time T are sorted out, as shown in Figure 8.

Figure 8 The relations between height of the soil column H and pore-water pressure uw with time during and after several rainfall events under different rainfall intensities I.
It can be seen from Figure 8 that the pore water pressure uw increases with the extension of rainfall time gradually, and the matrix suction (ua − uw) gradually decreases correspondingly. After the rain stops, the pore water pressure uw at the top of the soil column begins to decrease in the direction of the initial hydrostatic pressure. However, after 10 days of rain stop (i.e., = 240 h), the pore water pressure is still not restored to the initial state, and the pore water pressure at the bottom of the soil column continues to increase slowly, that is, MRn is still increasing. This analysis shows that the downward migration of rainwater in the soil column increases the uw and reduces the (ua − uw). The increase of MRn indicates that the infiltration and suction reduction in the soil column continue after the rain stops. After the rain stops, the uw gradually reduces to the initial hydrostatic pressure, which is the redistribution process of pore water pressure after the rain stops. This phenomenon is consistent with the in situ monitoring law of pore water pressure during rainfall by Rahardjo et al., (2007). The whole movement process is very slow, indicating that the pore water pressure in the soil column needs a long time to restore to the initial water pressure value.
Furthermore, according to the data of Figures 8D–G, the relationship curve of change of the normalized suction reduction depth MRnnor with the suction reduction rate n% under four higher rainfall intensities (i.e., I = 2.5ks, I = 5.0ks,I = 10.0ks, and I = 25.0ks, respectively) is sorted out, as shown in Figure 9.
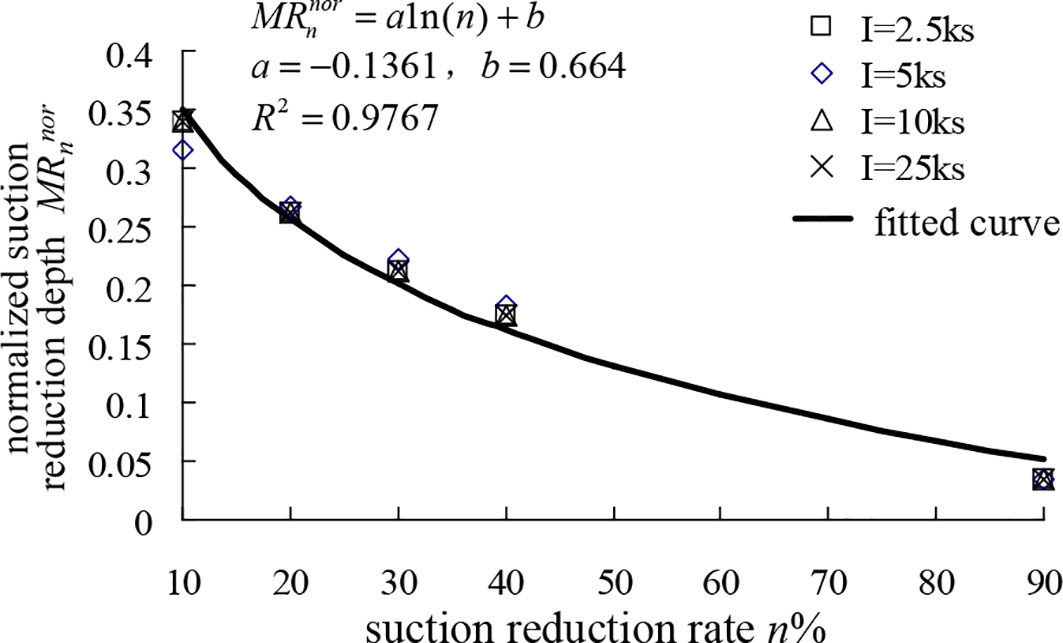
Figure 9 Normalized matric suction reduction depth MRnnor versus percent reduction in suction n% under four rainfall intensities I.
Figure 9 shows that the MRnnor of the four rainfall intensities decreases with the increase of n%, which indicates that the shallower the depth in the soil column is, the more obvious the matrix suction reduction. In addition, the four curves show a good exponential function (R2 = 0.9767). The four groups of data can be fitted to a curve, and the curve fitting formula is as Eq. 4. This also reflects that there is a limit of the effect of rainfall intensity I on the reduction of matric suction; that is, MRn has a limit value. Beyond this limit value, the effect of I on the reduction of matric suction is not obvious.
where a and b are the curve fitting parameters, respectively, a = −0.1361, b = 0.664.
Then, the distribution law of suction reduction at different depths of soil column during rainfall is sorted out, as shown in Figure 10.
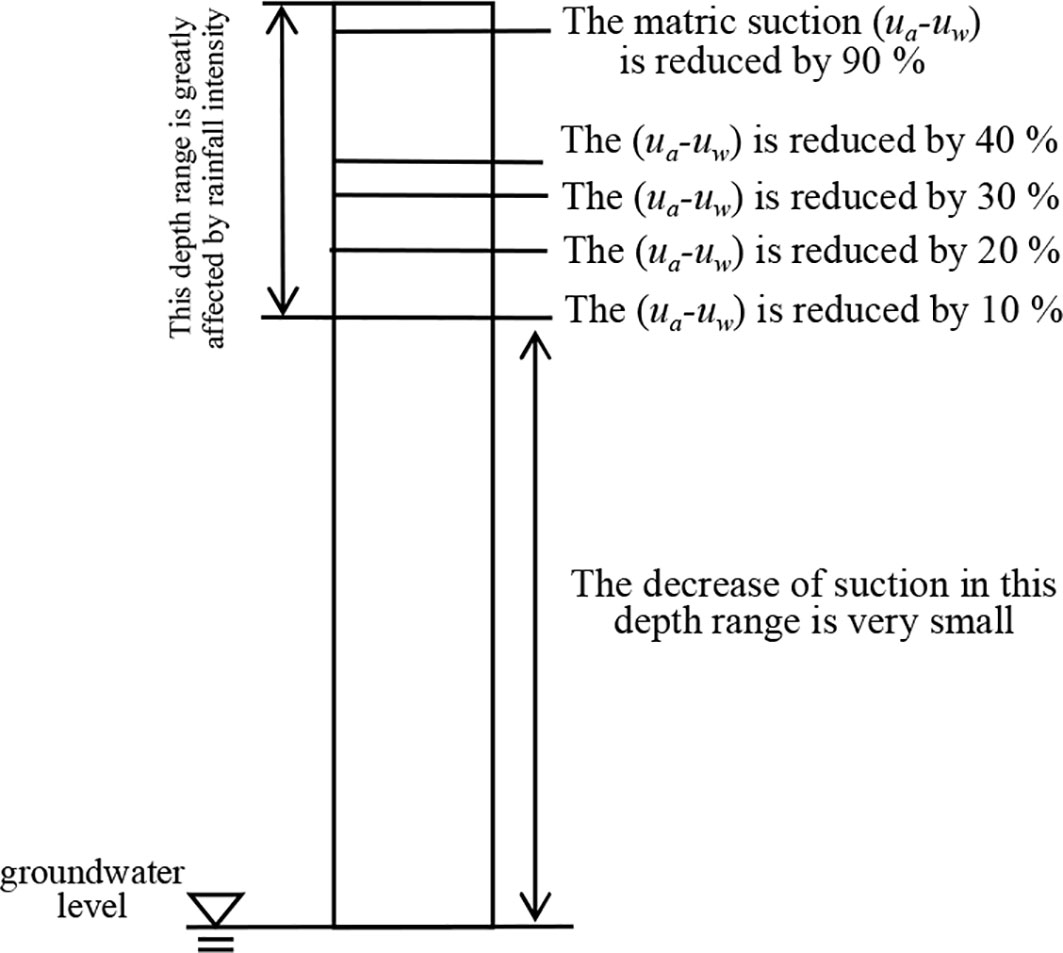
Figure 10 Generalized matric suction reduction profile in the soil column after a rainfall event.
According to Figure 10, the suction reduction caused by rainfall is unevenly distributed along the depth of the soil column. Under the condition of 24 h of rainfall duration, the maximum normalized suction reduction depth MNnnor is approximately 0.35; that is, the maximum depth of matrix suction affected by rainfall is approximately 35% of the total depth.
3.3 Results and analysis of IR
In order to analyze the variation of section infiltration rate IR during rainfall, we extracted the relationship curve of section infiltration rate IR with time corresponding to different normalized heights Hnor under condition I = 1.0ks, as shown in Figure 11.
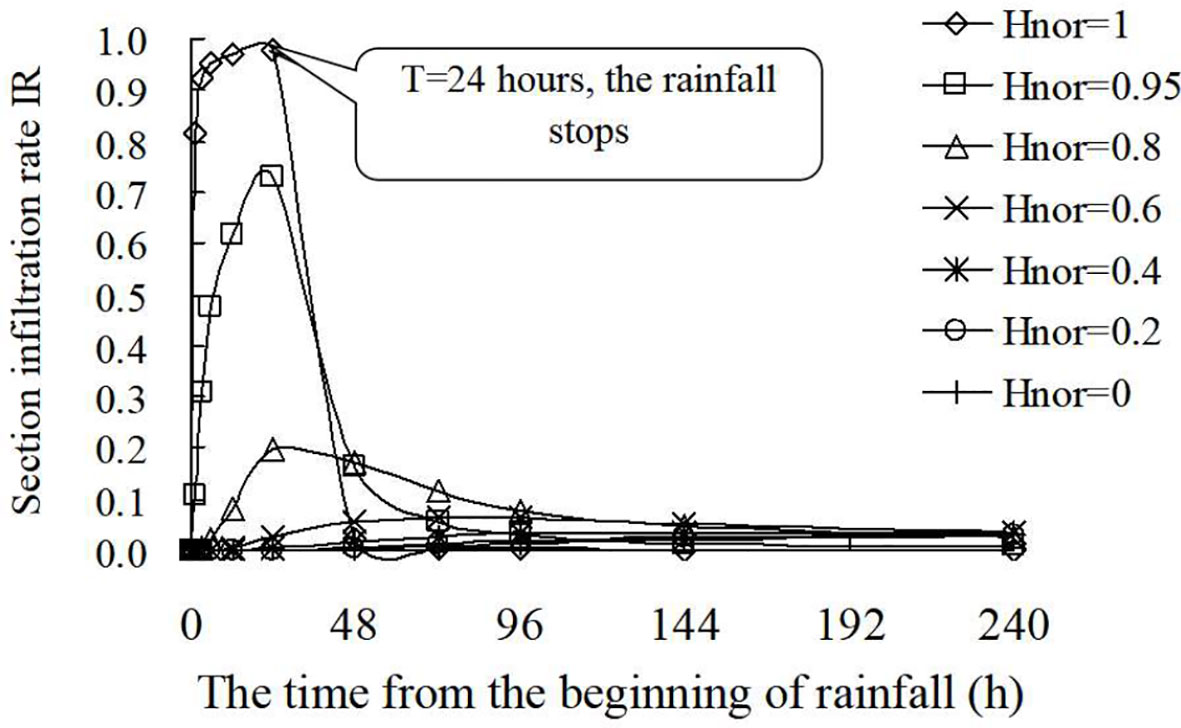
Figure 11 Section infiltration rate at different elapsed times under different normalized heights Hnor for the soil column.
As can be seen from Figure 11, under each Hnor, the IR at the top of the soil column gradually increased with time during the rainfall process, but after the rain stops, it began to decrease again. The IR at the bottom of the soil column begins to increase again after a long period of rain stop. According to the analysis, the infiltrated rainwater moves slowly from the top of the soil column to the bottom, resulting in a lag in time. Therefore, as the rainfall continues, the IR of the surface gradually increases to the saturated permeability coefficient of the soil. After rain stops, the IR of the soil near the surface (the top of the soil column) decreases to zero, and at this time, the IR of the soil near the bottom of the soil column begins to increase. It can also be seen from Figure 11 that the maximum infiltration rate IRmax at the bottom of the soil column is significantly smaller than that of the top of the soil column. This is because the infiltration of rainwater into the bottom of the soil column becomes much slower due to the reduction of the hydraulic gradient. During the whole process of rainfall, the maximum infiltration rate IRmax near the surface (i.e., Hnor = 1.0) is the largest, and the IRmax decreases with the decrease of Hnor.
The curves in Figure 11 also show that the distribution of IR in the soil column along the depth direction is very uneven. Then, the relationship curves between the normalized height Hnor and the section infiltration rate IR under the conditions of I ≤ 1.0ks and I > 1.0ks are drawn, as shown in Figure 12. In the figure, T1 and T2 are the different moments during the rain, and T1< T2, T3 is a certain moment after the rain stops.

Figure 12 The relationship curve between the normalized height Hnor and section infiltration rate IR.
3.4 Effect of I on the infiltration characteristic parameters
From the previous article, we can find that when the rainfall intensity I is different, the two parameters of the calculated normalized infiltration front depth WFnor and the normalized suction reduction depth MRnnor are also different. We also sorted out the change of the WFnor and the MRnnor of the soil column under different rainfall intensities I and different times T during the rainfall process, as shown in Figure 13.
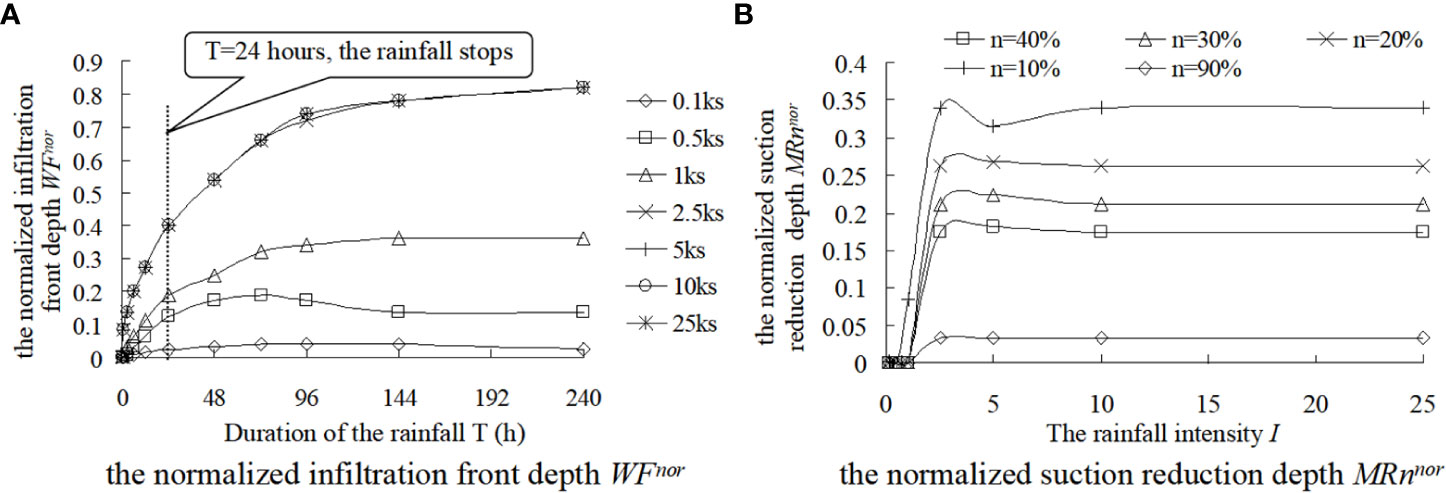
Figure 13 Influence of rainfall intensity I on the normalized infiltration front depth WFnor and normalized matric suction reduction depth MRnnor.
Figure 13A shows the variation of WFnor with the rainfall duration under different rainfall intensities. It can be seen from the figure that WFnor generally increases exponentially with time, and with the increase of rainfall intensity I, the depth of infiltration front WF gradually approaches the depth of groundwater level WT (i.e., WF = WT). In addition, it can be seen that when the rainfall began, the movement of the infiltration front is very rapid, but it gradually slowed down over time, especially after the rain stops, where the movement of the infiltration front became slower. When the rainfall duration is 1 day under different rainfall intensities, the normalized infiltration front depth WFnor under each working condition has a maximum value; that is, the influence depth of rainwater has a limit, and as the rainfall intensity increases, this limit value also increases. When , the individual curves almost coincide; it can be considered that I = 2.5ks is an eigenvalue.
Figure 13B shows the variation of the depth of normalized suction reduction MRnnor with rainfall intensity I under different suction reduction rates n%. It can be seen from the figure that the matric suction in the soil column is not completely lost after the rainfall: the area where the suction reduction in the soil column is more than 10% only accounts for approximately 35% of the height of the soil column. In other words, from the groundwater level up, the suction reduction of the soil column in the range of approximately 65% height is very small (i.e., the reduction is less than 10%). Therefore, only a small part of the soil column’s shear strength is reduced.
It also can be seen from Figure 13 that the movement speed of the infiltration front increases with the increase of rainfall intensity I. Similarly, the amplitude of suction reduction and the section infiltration rate IR also increase with the increase of I. However, there is a limit to the influence of rainfall intensity on these parameters, that is, I = 2.5ks.
All these phenomena indicate that there is indeed a “special” rainfall intensity when the soil column is affected by rainfall infiltration. In a certain range, increasing the rainfall intensity I will accelerate the infiltration of rainwater in the soil column, but there is a maximum limit (“special”) rainfall intensity. At this time, the influence of I on the infiltration of the soil column reaches the maximum. When I exceeds this value, its effect on the infiltration of the soil column will be less obvious.
4 Conclusions
Based on the one-dimensional seepage theory of saturated–unsaturated soil, this paper studies the one-dimensional rainfall infiltration numerical test of a soil column model under different conditions. By introducing three infiltration characteristic parameters to sort out and analyze the calculation, the following conclusions are obtained:
1. The proposed three infiltration characteristic parameters of infiltration front depth WF, suction reduction depth MRn, and section infiltration rate IR can qualitatively and quantitatively describe the infiltration characteristics of the soil column model under rainfall conditions.
2. During the rainfall, the volumetric water content θ near the surface first began to increase and gradually moves to the groundwater level, and the infiltration front depth WF increased with the extension of rainfall duration, and even continues to increase for a long time after the rain stops.
3. During the rainfall process, the suction reduction depth MRn decreases with the increase of n%; that is, the shallower the depth, the more obvious the suction reduction of the soil matrix. When the rainfall duration is 24 h and the rainfall intensity is different, the normalized suction reduction depth MRnnor is approximately 35% of the total depth.
4. During the rainfall process, IR is mainly affected by rainfall intensity I, and the IRmax near the surface decreases with the increase of soil column depth. After the rain stops, IR is mainly affected by the saturated permeability coefficient ks, and the IR increases first and then decreases with the increase of soil column depth, but the IRmax is less than the maximum value during the rainfall process.
5. The increase of rainfall intensity I can accelerate the infiltration of soil columns. The faster the WF changes, the greater the change range of MRn and IR. However, there is a limit rainfall intensity value for the influence of rainfall intensity on the infiltration of soil columns. The limit rainfall intensity under the calculation conditions in this paper is I = 2.5ks.
Data availability statement
The original contributions presented in the study are included in the article/supplementary material. Further inquiries can be directed to the corresponding author.
Author contributions
FL contributed to the conception of the study. BW executed numerical simulation experimentation. LZ and XZ contributed significantly to analysis and manuscript preparation. FL and CP performed the data analyses and wrote the manuscript. MM contributed to check the details of the article. All authors contributed to the article and approved the submitted version.
Funding
This study was funded by the National Natural Science Foundation of China (No. 12072260 and No. 51679198) and the State Key Laboratory of Eco-hydraulics in Northwest Arid Region of China (QNZX-2019-07).
Conflict of interest
Author BW is employed by the company JiKan Research Institute of Engineering Investigation and Design Co., Ltd. Author XZ is employed by the company Guangzhou Traffic Design & Research Institute Co., Ltd. Author CP is employed by the company PowerChina Northwest Engineering Co., Ltd.
The remaining authors declare that the research was conducted in the absence of any commercial or financial relationships that could be construed as a potential conflict of interest.
Publisher’s note
All claims expressed in this article are solely those of the authors and do not necessarily represent those of their affiliated organizations, or those of the publisher, the editors and the reviewers. Any product that may be evaluated in this article, or claim that may be made by its manufacturer, is not guaranteed or endorsed by the publisher.
References
Anderson S. A., Zhu J. H. (1996). “Assessing the stability of a tropical residual soil slope,” in Proceedings of the 7th International Symposium on Landslides, Trondheim, Norway. 1489–1495.
Cho S. E., Lee S. R. (2002). Evaluation of surficial stability for homogeneous slopes considering rainfall characteristics. J. Geotechnical Geoenvironmental Eng. 128, 756–763. doi: 10.1061/(ASCE)1090-0241(2002)128:9(756)
Corradini C., Melone F., Smith R. E. (2000). Modelling local infiltration for a two-layered soil under complex rainfall patterns. J. Hydrological 237, 58–73. doi: 10.1016/S0022-1694(00)00298-5
Fredlund D. G., Rahardjo H. (1997). Unsaturated soil-soil mechanics. Ed. Zhongyi C. (Beijing, China: China Construction Industry Press).
Fredlund D. G., Xing A. Q. (1994). Equations for soil-water characteristic curve. Can. Geotechnical J. 31, 521−532. doi: 10.1139/t94-061
Fredlund D. G., Xing A., Huang S. Y. (1994). Predicting the permeability function for unsaturated soils use the soil-water characteristic curve. Can. Geotechnical J. 31, 533–546. doi: 10.1139/t94-062
Geo-slope International Ltd (2004). Seep/W for infinite element seepage analysis (Calgray, Alta: Geo-slope International Ltd.).
Rahardjo H., Chang M. F., Lim T. T. (1996). “Stability of residual soil slopes as affected by rainfalls,” in Proceedings of the 7th International Symposium on Landslides, Trondheim, Norway. 1109–1114.
Rahardjo H., Lee T. T., Leong E. C., Rezaur R. B. (2005). Response of a residual soil slope to rainfall. Can. Geotechnical J. 42, 340–351. doi: 10.1139/t04-101
Rahardjo H., Leong E. C., Rezaur R. B. (2008). Effect of antecedent rainfall on pore-water pressure distribution characteristics in residual soil slopes under tropical rainfall. Hydrological Processes 22, 506–523. doi: 10.1002/hyp.6880
Rahardjo H., Li X. W., Toll D. G., Leong E. C. (2001). The effect of antecedent rainfall on slopr stability. Geotechnial Geological Eng. 19, 371–399. doi: 10.1023/A:1013129725263
Rahardjo H., Ong T. H., Rezaur R. B., , E., Leong C. (2007). Factors controlling instability of homogeneous soil slope under rainfall. J. Geotechnical Geoenvironmental Eng. 133, 1532–1543. doi: 10.1061/(ASCE)1090-0241(2007)133:12(1532)
ROmano N., Brunone B., Santini A. (1998). Numerical analysis of one-dimensional unsaturated flow in layered soils. Adv. Water Resource 21, 315–324. doi: 10.1016/S0309-1708(96)00059-0
Tsaparas I., Rahardjo H., Toll D. G., Leong E. C. (2002). Controlling parameters for rainfall-induced landslides. Comput. Geotechnics 29, 1–27. doi: 10.1016/S0266-352X(01)00019-2
Wang C.-h., Wan Z.-y., Zhang C.-l. (2015). Tests and numerical simulations of non-orthogonal rainfall infiltration on surfaces of unsaturated sand slopes. Chin. J. Geotechnical Eng. 37 (8), 1357–1364. doi: 10.11779/CJGE201508001
Wu Q.-h., Zhang J.-f., Wu j.-b. (2017). Physical model tests on slopes with control of infiltration by unsaturated drainage structures. Chin. J. Geotechnical Eng. 39 (1), 154–140. doi: 10.11779/CJGE201701014
Yang D.-q. (1992). Nonlinear numerical model of two-dimensional generalized consolidation of unsaturated soils. Chin. J. Geotechnical Eng. 14 (9), 2–12.
Zeng C.-l., Li R.-j., Guan X.-d., Zhang S.-b., Bai W.-s. (2020). Experimental study on rainfall infiltration characteristics of loess slopes under different rainfall intensities. Chin. J. Geotechnical Eng. 42 (S1), 111–115. doi: 10.11779/CJGE2020S1022
Zhao Z. (2009). Experimental investigation of permeability function of unsaturated soil and its application (Xi’an Shaanxi, China: Xi’an University of Technology).
Keywords: unsaturated soil, seepage, rainfall infiltration, numerical simulation experimentation, characteristic parameter
Citation: Zhong L, Wang B, Zhao X, Liu F, Miao M and Pu C (2023) Study on rainfall infiltration characteristic parameters of unsaturated soil. Front. Ecol. Evol. 11:1251765. doi: 10.3389/fevo.2023.1251765
Received: 02 July 2023; Accepted: 18 July 2023;
Published: 17 August 2023.
Edited by:
Naifei Liu, Xi’an University of Architecture and Technology, ChinaReviewed by:
Jiqiang Lyu, Chang’an University, ChinaAizhong Luo, Guizhou University of Engineering Science, China
Copyright © 2023 Zhong, Wang, Zhao, Liu, Miao and Pu. This is an open-access article distributed under the terms of the Creative Commons Attribution License (CC BY). The use, distribution or reproduction in other forums is permitted, provided the original author(s) and the copyright owner(s) are credited and that the original publication in this journal is cited, in accordance with accepted academic practice. No use, distribution or reproduction is permitted which does not comply with these terms.
*Correspondence: Fengyin Liu, bGl1ZnkyMTFAMTYzLmNvbQ==