 Yansi Chen
 Yulong Dong
 Yunchen Wang2,3
- 1Center for Geophysical Survey, China Geological Survey, Langfang, China
- 2School of Computer Science and Technology, Xi’an University of Posts and Telecommunications, Xi’an, China
- 3Shaanxi Satellite Application Technology Center for Natural Resources, Shaanxi Institute of Geological Survey, Xi’an, China
- 4Center for Applied Geology Research, China Geological Survey, Sichuan, China
Lithological mapping in highly vegetated areas using remote sensing techniques poses a significant challenge. Inspired by the concept of “geobotany”, we attempted to distinguish lithologies indirectly using machine learning algorithms (MLAs) based on Sentinel-2 and SRTM DEM in Zhangzhou City, Fujian Province. The study area has high vegetation cover, with lithologies that are largely obscured. After preprocessing such as cloud masking, resampling, and median image synthesis, 17 spectral bands and features from Sentinel-2 and 9 terrain features from DEM were extracted. Five widely used MLAs, MD, CART, SVM, RF, and GBDT, were trained and validated for lithological mapping. The results indicate that advanced MLAs, such as GBDT and RF, are highly effective for nonlinear modeling and learning with relative increases reaching 8.18%∼11.82% for GBDT and 6.36%∼10% for RF. Compared with optical imagery or terrain data alone, combining Sentinel-2 and DEM significantly improves the accuracy of lithological mapping, as it provides more comprehensive and precise spectral characteristics and spatial information. GBDT_Sen+DEM utilizing integrated data achieved the highest classification accuracy, with an overall accuracy of 63.18%. This study provides a case study for lithological mapping of areas with high vegetation cover at the local level. This also reinforces the idea that merging remote sensing and terrain data significantly enhances the precision and reliability of the lithological mapping methods.
1 Introduction
Lithological mapping of highly vegetated areas is an essential part of geological surveys and mineral resource exploration (Lu et al., 2021). On the one hand, challenges related to low comprehensive utilization of mineral resources, uneven regional development, ecological degradation, and environmental pollution in mineral resource exploitation underscore the importance of addressing these issues to achieve sustainable development in the mining industry (Wang and Li, 2020; Xie, 2020). On the other hand, the spatial distribution of rocks contributes to the extraction of mineral alteration information, selection of target areas within mining regions, and acquisition of multiscale structural control information (Shuai, 2022). Therefore, it provides theoretical support for delineating prospective mineralization zones and holds significant importance for geological prospecting and evaluation (Wang and Liu, 2020). However, traditional geological mapping encounters significant challenges in areas with high vegetation cover, including fieldwork difficulties, high costs, lengthy time requirements, and limited accessibility to certain areas.
Remote sensing technology enables efficient and large-scale identification of rock types due to its fast speed, low cost, and efficiency in terms of time and labor (Carli and Sgavetti, 2011; Pour and Hashim, 2014). However, rocks are largely obscured by soil in densely vegetated areas, with studies indicating that vegetation cover of only 10% or more can effectively conceal surface information (Siegal and Goetz, 1977; Ager and Milton, 2012). Extracting weak rock-type information using remote sensing is a major challenge in geological applications (Chen et al., 2012). “Geobotany” offers an important approach to address this challenge, enabling indirect rock-type identification by considering the relationship between vegetation and underlying substrates (Grebby et al., 2011). Rock types influence the composition of aboveground plant communities in two ways: nutrient provision to plants (Landeweert et al., 2001; Hahm et al., 2014), and the weathering depth, degree, and increased porosity of rocks, which impact water storage potential (Schwinning, 2010; Klos et al., 2018). Hahm’s research showed that plant communities in different regions are correlated with hydrology and rock types, even under similar climatic conditions (Hahm et al., 2019). Do Amaral mapped three geological phases using indicator species (do Amaral et al., 2018). Qiao’s research showed a significant impact of rock types on the spatiotemporal pattern changes in vegetation (Qiao et al., 2020).
High-resolution optical and radar remote sensing data, along with terrain information, are valuable for extracting rock-type information from densely vegetated areas. In the past decade, medium-resolution remote sensing imagery such as Landsat series and ASTER, has been extensively employed for rock type mapping in vegetated areas (Knepper, 1989; Langford, 2015; Han et al., 2021; Zeng et al., 2023). It establishes a strong foundation for rock-type identification by offering cost-effective, wide coverage, high spatial resolution (Chen et al., 2022; Zou et al., 2022), valuable indications of vegetation and rock-soil information, rich surface information and a small mixed pixel effect (Meroni et al., 2021). Sentinel-2 imagery is a new and freely accessible dataset that offers a high spatial resolution. It has been widely used in fields like geology, agriculture, and urban studies. Equipped with a multispectral sensor, it can capture visible and near-infrared spectral data making it an invaluable resource for lithological identification research. Radar is highly sensitive to surface physical characteristics, particularly the C-band response related to vegetation biomass, structure, and soil conditions. Digital Terrain Models (DTMs) can qualitatively and quantitatively reveal terrain variations reflecting subtle changes in rock types. The erosion and weathering resistance of rocks fundamentally shapes the terrain, and rocks with higher resistance to erosion form steeper terrain sections under similar conditions (Snyder et al., 2000; Montgomery, 2001). In stable landscapes, terrain slope indices can represent the erodibility of different rock types (Mills, 2003; Gallen, 2018). Radar and terrain data partially overcome the limitations of optical remote sensing in identifying and classifying rock types in vegetation- and shallow-covered areas (Gloaguen et al., 2019). In addition, compared to traditional remote sensing data, hyperspectral data can provide richer spectral information, thus reflecting the spectral response characteristics of different lithologies more accurately. This can provide effective technical support for geological exploration and mineral resource development (Chen L. et al., 2023).
An appropriate algorithm is one of the key factors contributing to achieving satisfactory classification results. Machine learning algorithms such as maximum likelihood (ML) (Grebby et al., 2011), partial least squares discriminant analysis (PLSDA) (Lu et al., 2021), support vector machine (SVM) (Othman and Gloaguen, 2014; Bachri et al., 2019), and random forest (RF) (Han et al., 2021) have been extensively used for rock classification in vegetation-covered areas because of the rapid advancement of machine learning. In Grebby’s study, airborne multispectral imagery and laser scanning data were used to map rock types in the Troodos ophiolite. The self-organizing map algorithm achieved the highest accuracy (72.7%) among the algorithms utilized (Grebby et al., 2011). Othman and Gloaguen improved the lithologic map of the Mawat ophiolite complex in northeastern Iraq using an SVM classifier based on ASTER multispectral data, landform features, and texture data with overall accuracy (OA) of 79.28% (Othman and Gloaguen, 2014). Lu used multiple algorithms, including PLSDA, SVM, k-nearest neighbors and Bayesian, combined with Sentinel-1 and SRTM data, to map rock distribution of Huludao City in Liaoning Province, China. The highest accuracy of 0.444 was achieved using the PLSDA (Lu et al., 2021). Otele updated lithological mapping in the southern region of Cameroon using Landsat 7 imagery and a multilayer perceptron neural network and achieved an accuracy of 53.01% (Otele et al., 2021). Zeng compared the accuracy of KNN, MLC, and SVM algorithms in classifying basalt using Landsat 5 and ASTER imagery. The SVM model with Landsat 5 achieved the highest accuracy of 70.92% (Zeng et al., 2023). These methods establish a solid basis for the rapid classification of rocks using “geobotany” principles in remote sensing. Furthermore, HAN utilized the RF method to map Quaternary rock (including Pleistocene gravel, Holocene sand, Holocene clay, and Holocene gravel) in vegetation-covered areas of Vietnam based on multiple remote sensing data sources, achieving OA of 80.99% (Han et al., 2021). This highlights the potential of the RF algorithm in geological mapping.
This study aims to achieve lithological mapping in areas with dense vegetation using Sentinel-2 and SRTM DEM data combined with MLAs. The study focuses on Zhangzhou City in Fujian Province as an example. We tested the performance of five popular MLAs to determine which one works best for this task. We carefully compared and analyzed the accuracy of the classification results achieved by each algorithm, gaining valuable insights into their effectiveness. Furthermore, we systematically evaluated the accuracy of classification results obtained from Sentinel-2 alone, DEM alone, and the combination of Sentinel-2 and DEM to better understand their impact on lithological mapping. This research contributes to the advancing field of geospatial science and remote sensing.
2 Study area and data
2.1 Study area
The study area is located around Daxi Town, Pinghe County, Zhangzhou City, Fujian Province. The specific administrative division map, true-color composite image, and DEM are shown in Figure 1. It is situated in a complex region with intersecting Nanshan Mountain Range and the Second Complex Uplift Belt of the Xinhua-Xia series. It has undergone multiple crustal movements and has exhibited complex tectonic faults. The primary geological formations consist of Lower Cretaceous, Jurassic strata, and Yanshanian intrusion rocks. The main rock types in this area include Rhyolite tuff (RhyT), Yingan tuff (YinT), Rhyolite (Rhy), sandstone (San), and granite (Gra). Sedimentary deposits consist mainly of conglomerate, gravel, and sandy soil layers (CGS).
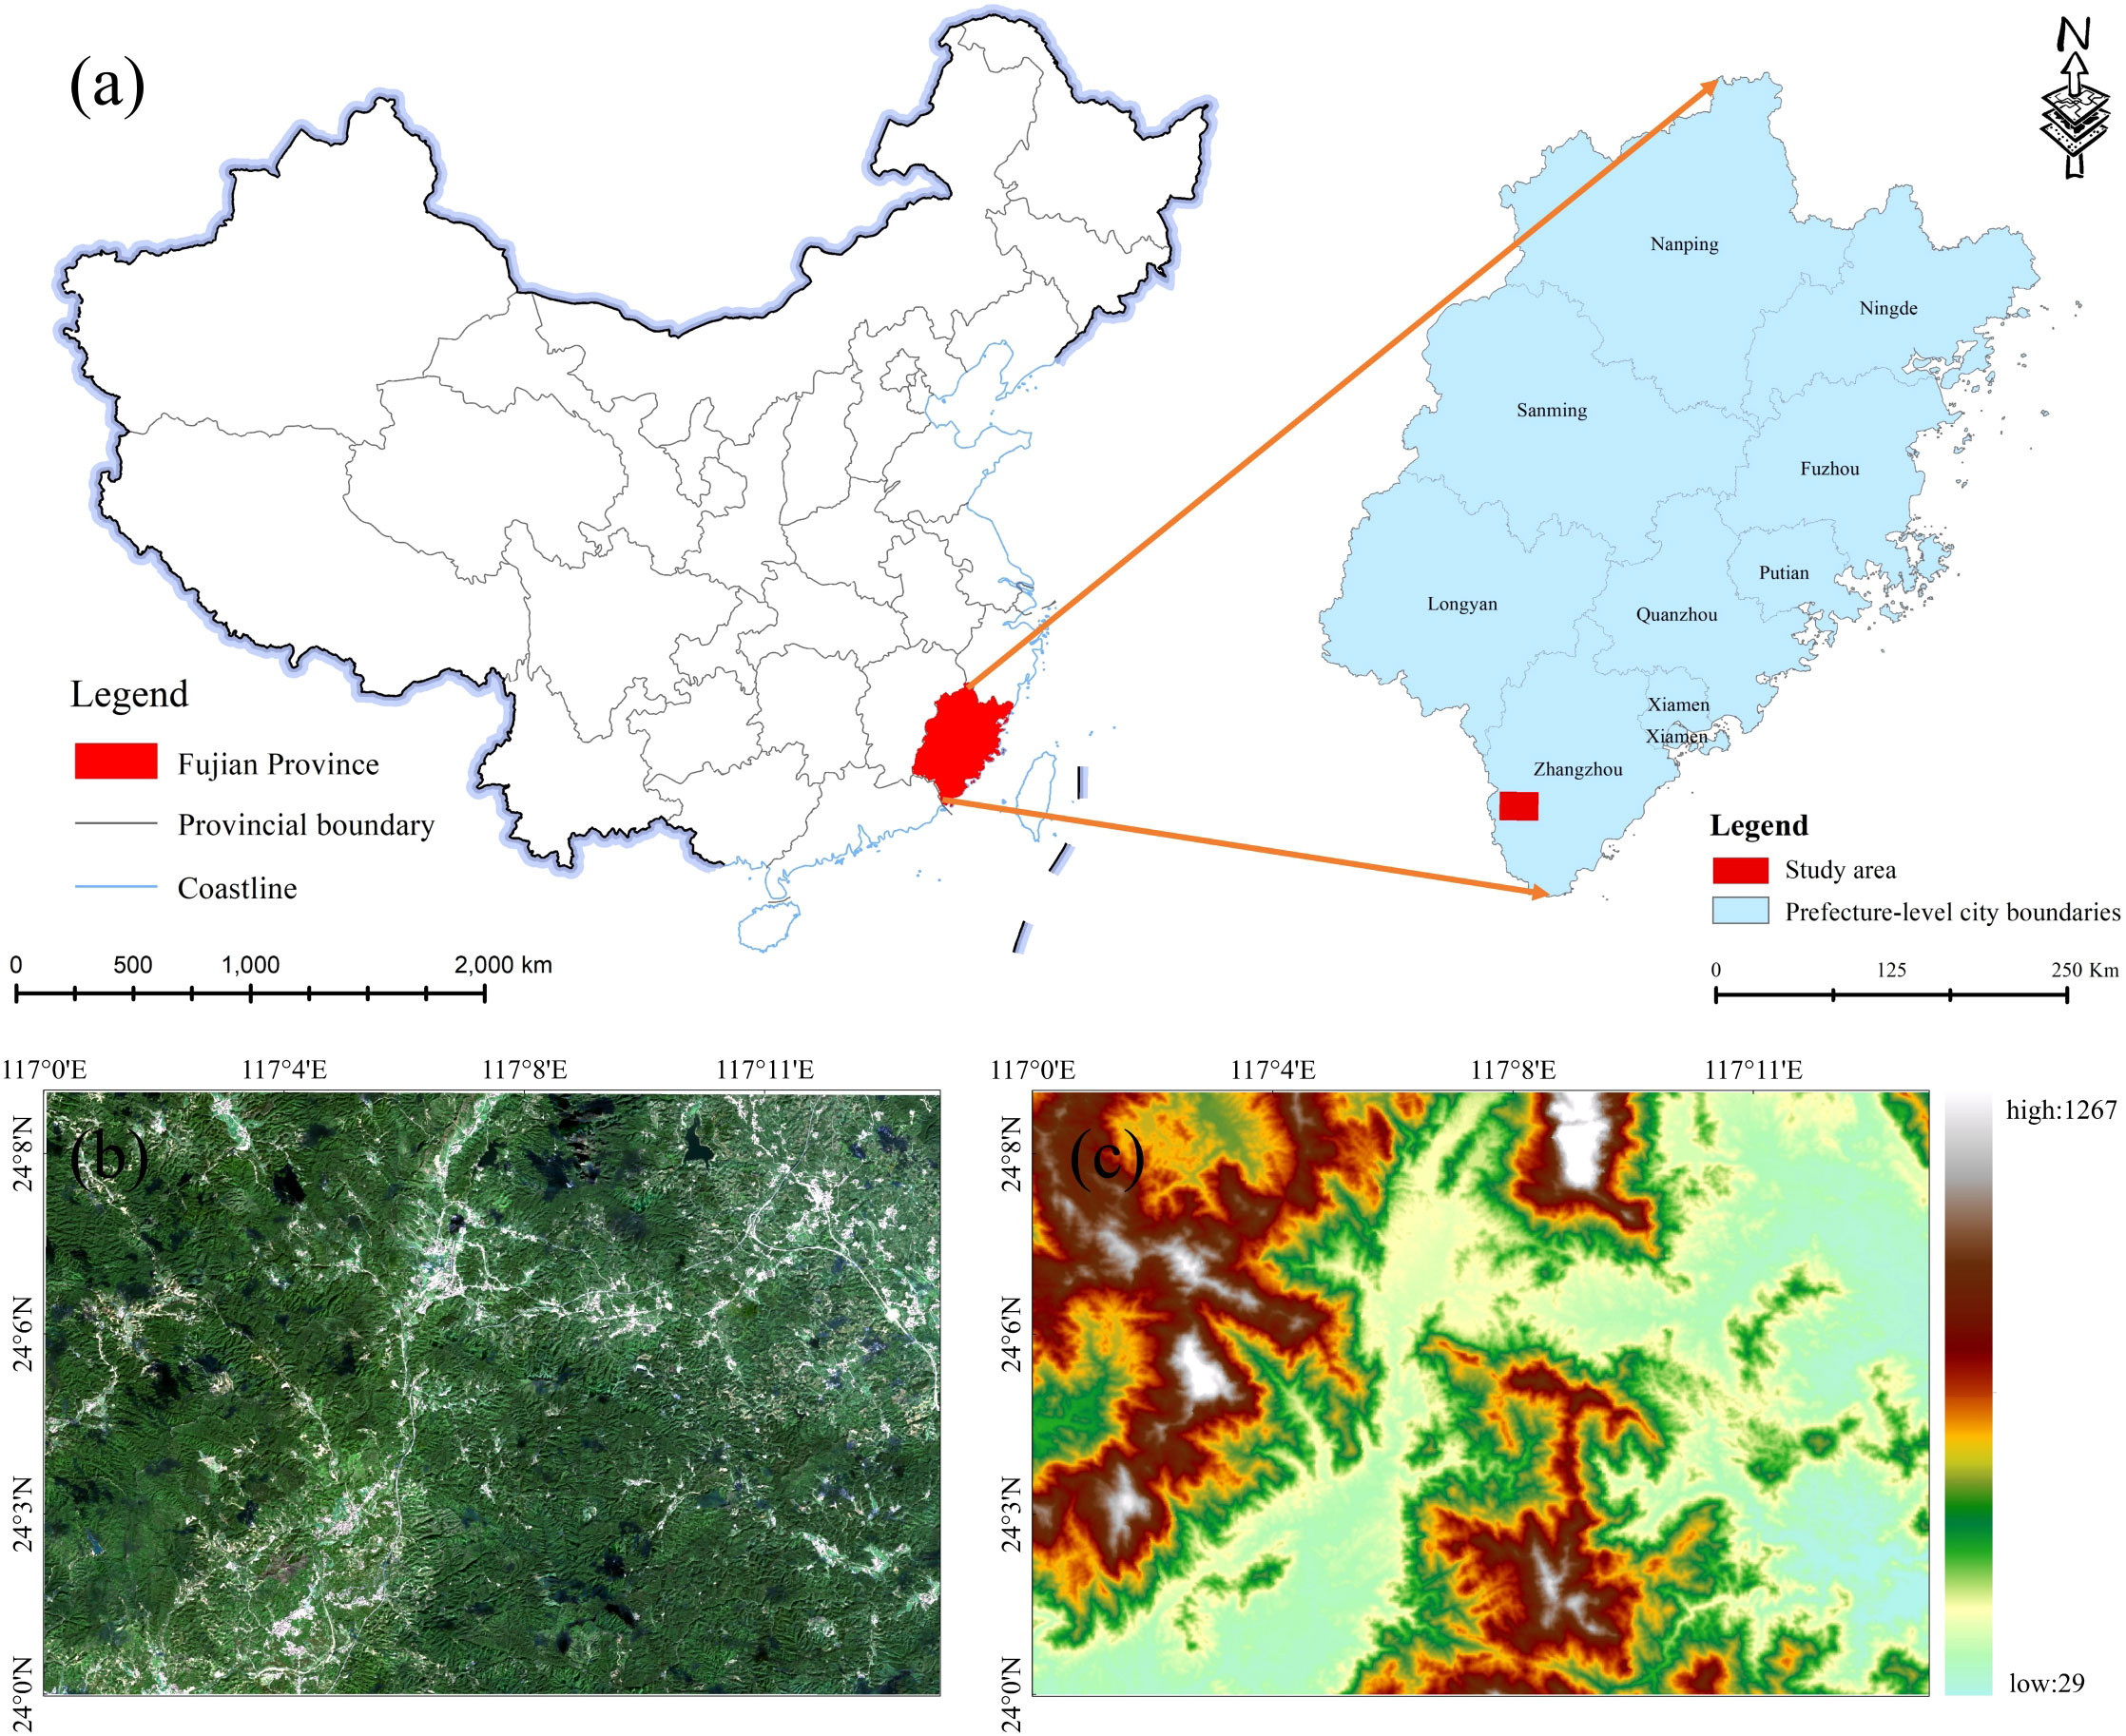
Figure 1 The study area for (A) a specific location in the administrative map of China, (B) Sentinel-2 tru color composite image and (C) Digital Elevation Model (DEM).
The area is characterized by dense vegetation growth, with a forest coverage rate of 73.2% as of 2021. It exhibits a variety of plant community types and a complex hierarchical structure, resembling the vibrant landscapes of the South Asian tropical rainforests. The main vegetation types include coniferous forests, broad-leaved forests, mixed forests of conifers and broad-leaved trees, bamboo forests, shrubs, and grass slopes. The bedrock is mostly covered by a few outcrops (Shi and Wang, 2014). Additionally, in highly vegetated areas, the surface layer is heavily weathered, and the soil layer is thick, posing challenges for rock-type identification using remote sensing techniques.
2.2 Data and preprocessing
The Sentinel satellite carries the Multispectral Instrument (MSI), capturing imagery data in visible, near-infrared, and shortwave infrared bands. It provides a spatial resolution ranging from 10 m to 60 m (band details in Table 1). With a 5-day revisit period at the equator, it covers a swath width of 290 km (Chen et al., 2021). The S2 MSI Level-2A products offer preprocessed bottom-of-atmosphere reflectance images, including geometric correction, orthorectification, image registration, radiometric calibration, and atmospheric correction. A total of 78 images for the year 2021 with cloud coverage of less than 10% in the study area were obtained, and cloud masking using the QA60 band was performed to eliminate cloud effects. Bands B5, B6, B7, B8A, B11, and B12 were resampled to 10-meter spatial resolution using bilinear interpolation, and then the median composite was applied to the images.
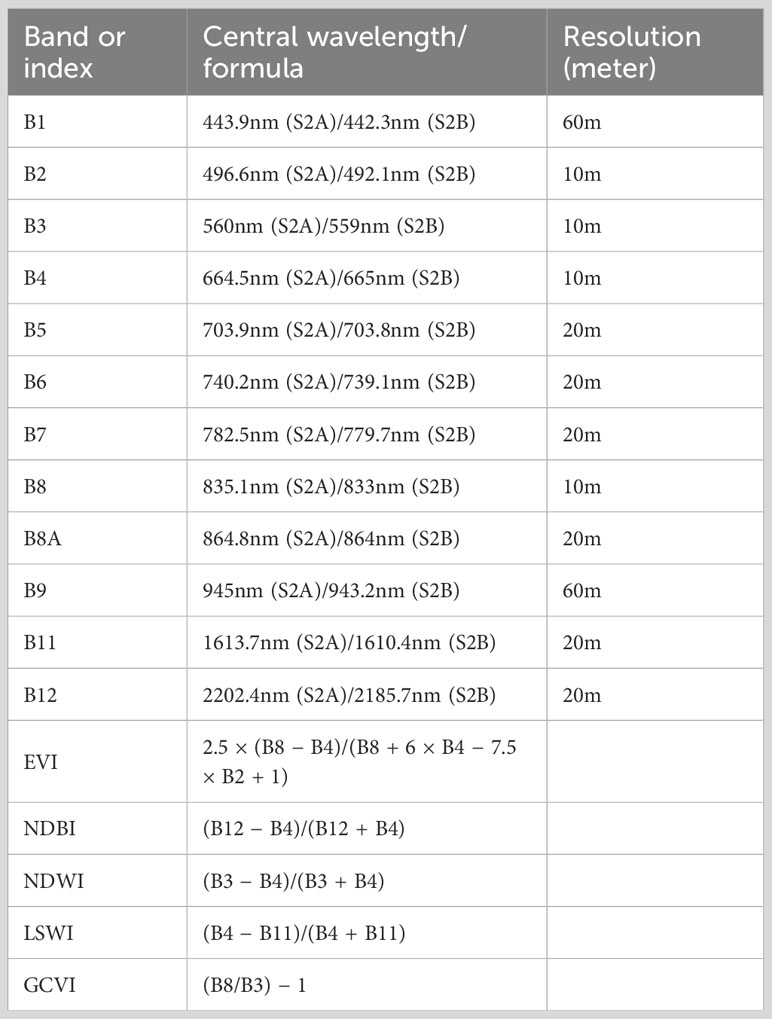
Table 1 Sentinel-2 band and spectral characteristics.
The Shuttle Radar Topography Mission Digital Elevation Model (SRTM DEM) is a digital representation of terrain elevation obtained using radar equipment carried by space shuttles, covering over 80% of the Earth’s land surface. SRTM DEM data is acquired by emitting radar beams from a space shuttle towards the Earth’s surface and measuring the returning signals. This technique bypasses cloud cover and vegetation obstruction to acquire surface elevation data. The SRTM DEM 30 m dataset was resampled to 10 m using bilinear interpolation to match the spatial resolution of the optical imagery.
2.3 Ground reference data
The reference data includes the regional geological map from the First Survey Team of Fujian Provincial Geological Survey Bureau in 1982 and lithology distribution maps obtained through a combination of vegetation suppression methods and manual visual interpretation by professional experts. We adopted the approach used in the lithological distribution map to classify land surface cover types and collected pixel-level sample data for 7 land cover classes based on the regional geological map: CGS (118), San (106), Rhy (112), RhyT (121), YinT (121), Gra (110), and water (39).
3 Methods
3.1 Method system construction
The main idea for pixel-wise rock classification is based on “geobotany”. It uses differences in surface reflectance between vegetation communities to indirectly identify underlying rock types by considering terrain and landform characteristics. To achieve this, we construct five classical machine learning algorithms: minimum distance algorithm (MD), classification and regression trees (CART), support vector machine (SVM), random forest (RF), and gradient boosting decision tree (GBDT) (refer to Figure 2).
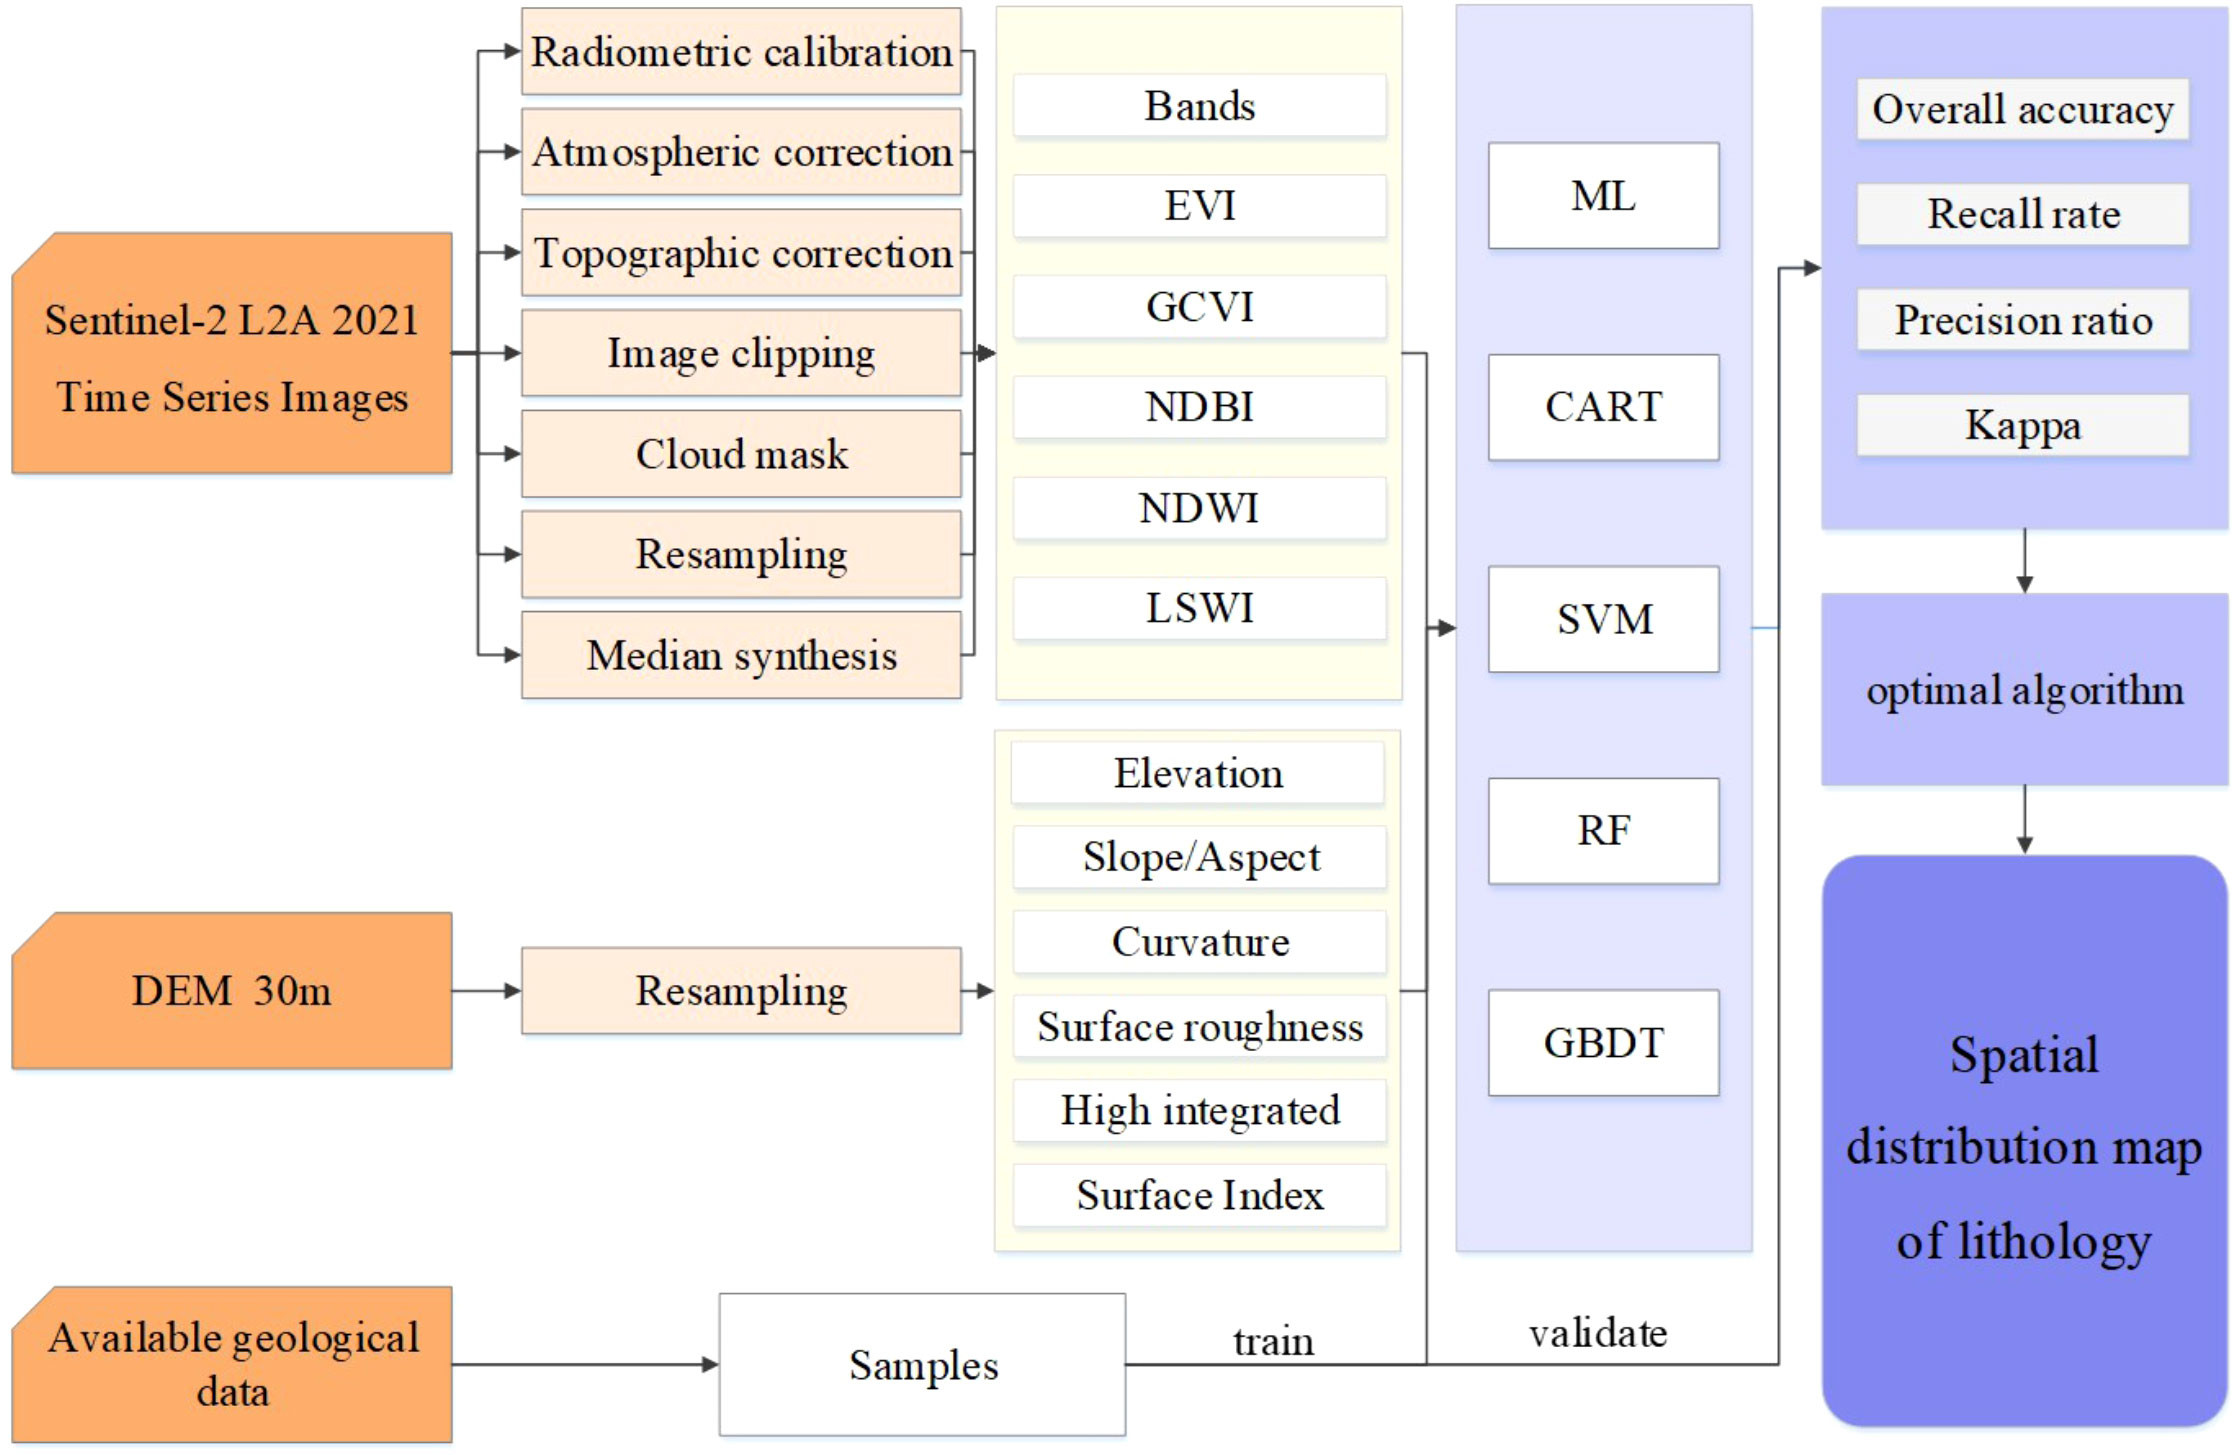
Figure 2 The flowchart. “DEM” for digital elevation model, “EVI” for enhanced vegetation index, “GCVi” for green chlorophyll vegetation index, “NDBI” for normalized difference building index, “NDWI” for normalized difference water index, and “LSWI” for land surface water index.
The following research plan aims to reduce computational burden and accelerate the production of optimal lithological spatial distribution maps. The available geological data is divided into training and validation sets at a 7:3 ratio to assess the model’s generalization ability, which evaluates its performance on new data. Then, five classification algorithms are trained and optimized using the preprocessed Sentinel-2 remote sensing image and a sample dataset. The optimized models are validated and evaluated for accuracy using validation samples. Subsequently, the optimal model is used to classify rock types and generate a lithological map based on Sentinel-2 data. In the subsequent studies based on SRTM DEM (alone) and combination of Sentinel-2 with SRTM DEM, at least two classifiers that performed well in the previous step are used for validation and accuracy evaluation. Similarly, the optimal model is used to generate lithological maps based on SRTM DEM (alone) and combined with Sentinel-2 and SRTM data.
3.2 Feature extraction
B2, B3, B4, B5, B6, B7, B8, B8A, B11, and B12, were selected from Sentinel-2. It should be noted that B1 represents the aerosol band and B9 represents the water vapor band, therefore, they were not used in this study. Additionally, five spectral features were computed, which are crucial for rock or water body identification: enhanced vegetation index (EVI), green chlorophyll vegetation index (GCVI), normalized difference building index (NDBI), normalized difference water index (NDWI), and Land Surface Water Index (LSWI). This study employed EVI to indicate vegetation growth status, as it is well known that normalized difference vegetation index (NDVI) can saturate areas with high vegetation cover (Huete et al., 1997). GCVI is sensitive to chlorophyll and can be used to identify agricultural areas (Huete et al., 2002). NDBI is useful for identifying built-up areas (Benbahria et al., 2018). NDWI and LSWI are vegetation indices that are highly sensitive to surface water (Jeong et al., 2012).
For SRTM DEM, six terrain features, including elevation (E), slope, aspect, vertical curvature, horizontal curvature, and Gaussian curvature, were obtained using terrain analysis algorithms proposed by Florinsky (2016) and Safanelli (Safanelli et al., 2020). Additionally, surface roughness (SR), high integral (HI), and surface index (SI) were calculated within a 3 × 3 window, providing indications of terrain features associated with rock type information.
Where E is extracted directly from the DEM. E_mean, E_max, and E_min represent the mean, maximum, and minimum values within the moving window, respectively. SR is the ratio of grid surface area to projected area, which is used to quantify tectonic landform changes. A higher SR value indicates a more severe degree of regional deformation (Han et al., 2021). SI is a new efficient index that simultaneously depicts the preserved and eroded portions of the landscape (Andreani et al., 2014).
3.3 Classification algorithms for lithological mapping
The Minimum Distance (MD) algorithm is widely used for classification and pattern recognition (Wacker and Landgrebe, 1972). It assigns input data to the closest category based on computed distances between categories, using methods such as Euclidean, Manhattan, and Minkowski distances. In the context of lithological mapping, this algorithm can be used to infer the lithology of specific locations based on their proximity to known geological features or data points (Pal et al., 2020). MD is simple, easy to implement, and well-suited for problems with distinct category boundaries.
Classification and regression trees (CART) is a tree-based algorithm for classification and regression (Friedl and Brodley, 1997; Pal and Mather, 2003). It recursively splits and evaluates input data to build a tree-like model, where nodes represent features, branches represent feature values, and leaf nodes represent final results. Applying CART to lithological mapping involves systematic interpretation of geological features for accurate lithological classification. Visualizing the decision tree offers insights into hierarchical feature divisions that lead to lithological categorization, enhancing our understanding of how different features influence prediction accuracy (Serbouti et al., 2022). CART has a simple structure, making it easy to understand, interpret, and generate decision-making rules. It’s worth noting that the effectiveness of the CART decision tree method relies on the quality and relevance of selected features, as well as the representation of distinct lithological classes in the dataset (Lewis, 2000).
Support vector machine (SVM) is a non-parametric classifier widely used for binary and multi-class classification tasks (Pal and Mather, 2005; Mountrakis et al., 2011). It aims to minimize structural risk by identifying an optimal hyperplane in the feature space that maximizes the margin between samples of different classes. SVM can be used for lithologic classification by selecting training and testing pixels, training the SVM classifier using a kernel function, and mapping the input data (such as spectra, textures, topography, gamma-ray and land temperature) (Othman and Gloaguen, 2014; Harris and Grunsky, 2015; Yang et al., 2018; Chen C. et al., 2023) into a higher-dimensional space to find a hyperplane that separates the different classes. SVM has the advantage of handling high-dimensional data, nonlinear classification problems, and small sample sizes (Shebl and Csamer, 2021; Shebl et al., 2021). However, it also has limitations in terms of selecting appropriate kernel functions, computational intensity, and sensitivity to noise and outliers (Othman and Gloaguen, 2017).
Random forest (RF) works by creating multiple decision trees on randomly selected subsets of the data and then combining the results to make a final prediction (Pal, 2005; Belgiu and Drăguţ, 2016). It has significant advantages with the ability to combine multiple remote sensing and data sources in lithology mapping as it improves its generalization ability by randomly selecting input or input combinations at each node (Breiman, 2001). It is especially effective for processing high-dimensional and noisy input data and can overcome the interference of vegetation coverage, thereby improving the accuracy of lithological mapping (Harris and Grunsky, 2015; Bachri et al., 2019). However, caution should be exercised when fine-tuning parameters for optimal outcomes and effectively managing computational expenses, particularly when dealing with substantial datasets. The risk of overfitting due to an abundance of trees or noisy data should be considered, along with its limited efficacy with imbalanced datasets (Guo et al., 2022).
The Gradient Boosting Decision Tree (GBDT) is an iterative ensemble learning algorithm that constructs a strong prediction model (Yang et al., 2018; Xu et al., 2020). It builds multiple decision trees iteratively, using the residual between the current predicted value and the true label to train each tree. Each iteration adjusts the predicted value to approximate the true label. The final prediction is obtained by combining the predictions of all the trees. Although the algorithm is rarely used in lithology mapping in high vegetation cover areas, studies have shown that it is effective in handling large datasets and high-dimensional feature spaces, and it is robust to noise, outliers, and missing data (Lemercier et al., 2012; Zhou et al., 2020; Cai et al., 2022).
3.4 Accuracy assessment
Accuracy assessment objectively evaluates the performance of remote sensing algorithms and models, providing a reliable foundation for remote sensing applications and decision-making (Hay, 1988). It validates the accuracy of tasks like image classification and object detection, helping to determine the reliability and feasibility of the results. The Confusion Matrix is a tabular representation used to evaluate the performance of a classification model (Comber et al., 2012; Salmon et al., 2015). Therefore, we calculate four evaluation metrics using the Confusion Matrix to assess the classification results and optimize the model: overall accuracy (OA), recall (R), precision (P), and Kappa coefficient.
4 Results
4.1 Model tuning
Model tuning optimizes the performance and generalizability of the machine learning model by adjusting its parameters or hyperparameters, improving its effectiveness in addressing real-world problems. By systematically adjusting parameters, the model can better adapt to data patterns and characteristics. Proper parameter settings also reduce computational resources required for training and prediction. Through tuning, structure of the model and parameter selection are optimized, resulting in reduced computational costs and time consumption.
The sample dataset was randomly divided into training and validation sets at a 7:3 ratio for model training and tuning based on Sentinel-2 imagery. To determine the best settings for our models, we test them by using different parameters in the validation set. We begin by defining a range of parameter values and then try different values within that range. Finally, we select the parameter values that make our models perform the best on the validation set. We can show this process on a chart, where the horizontal line represents different parameter choices, and the vertical line shows the performance of the model (typically, model performance metrics such as OA). The tuning results for each model are shown in Figure 3. The MD algorithm achieved optimal performance using the Mahalanobis distance metric. The CART was tuned with a maximum of 50 nodes and a minimum of 5 nodes. The gamma coefficient of SVM model was set to 20, and the Cost parameter was set to 10. The RF utilized 210 trees and a minimum of 3 leaf nodes. The GBDT employed 80 trees and a maximum of 70 leaf nodes.
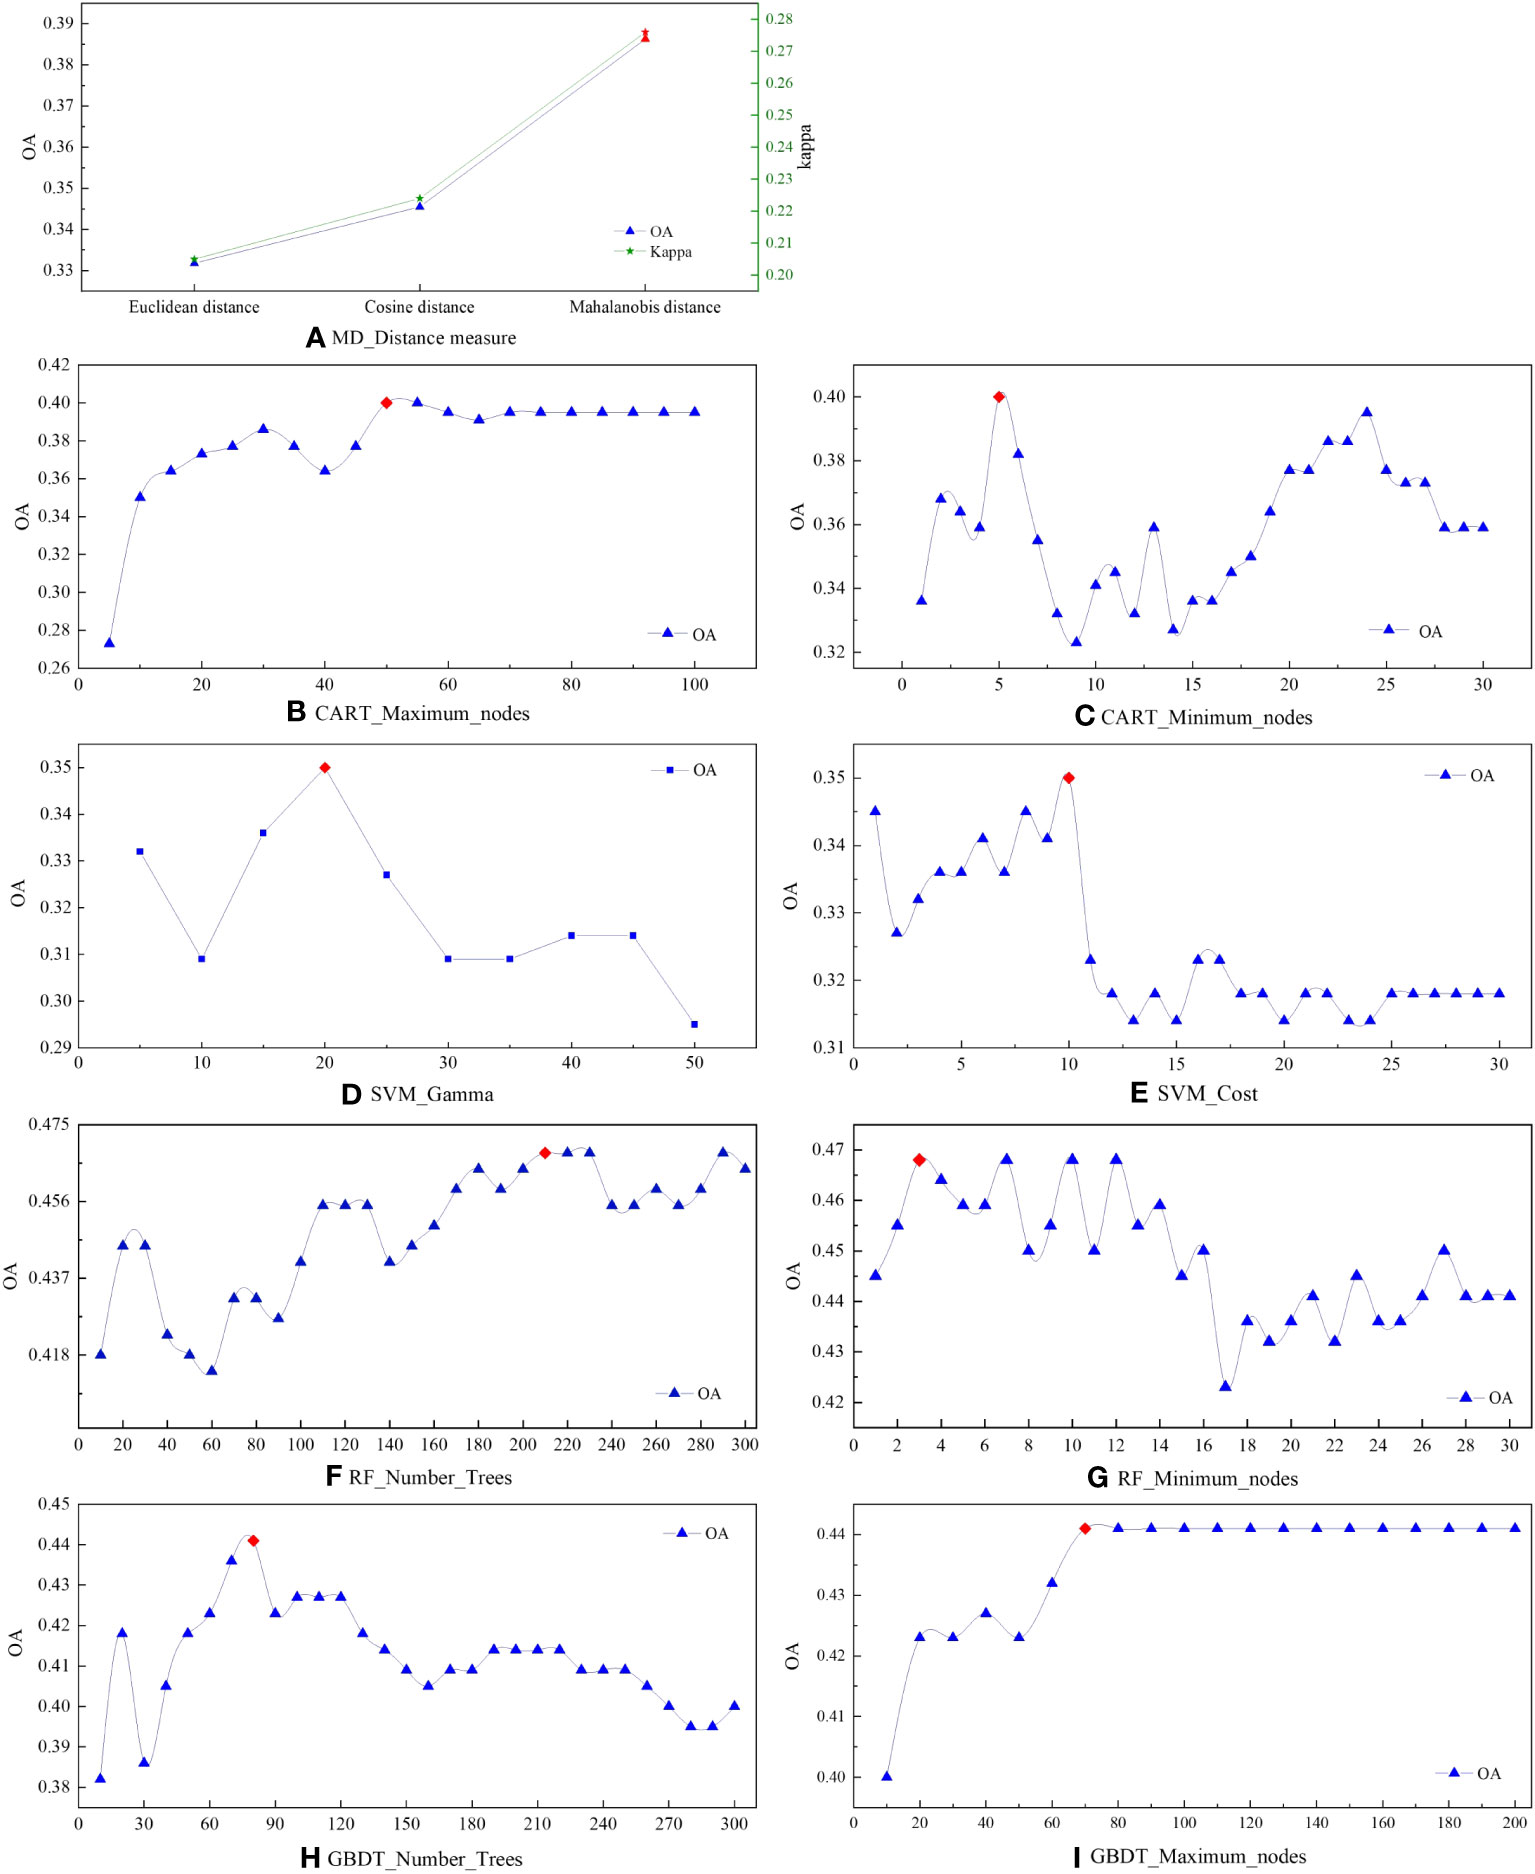
Figure 3 Adjust the parameters for (A) the distance measure method of MD, (B) the maximum and (C) minimum nodes of Cart, (D) gamma and (E) cost of SVM, (F) the number of trees and (G) minimum nodes of RF, (H) the number of trees and (I) maximum nodes of GBDT using validation samples. Each subscription below the figure is labeled as "Algorithms Parameter" to indicate the specific parameters used for each classifier.
In machine learning and data modeling, the optimal parameters of a model typically change with different datasets and feature combinations. Once we have identified at least two promising classifiers based on Sentinel-2, we apply the same tuning methodology to both the DEM data and the combination of Sentinel-2 and DEM data to ensure optimal model performance.
4.2 Lithology classification using Sentinel-2 image
The model accuracy and validation accuracy of five typical machine learning algorithms were summarized (as shown in Figure 4). The SVM algorithm had higher model accuracy but lower validation accuracy, possibly indicating overfitting due to linear inseparability of rock categories and limited sample size. MD and CART performed poorly, with model accuracy below 70% and validation accuracies below 0.4, suggesting limitations in handling complex structural information. RF and GBDT showed better performance as ensemble algorithms with strong learning capabilities with OA 46.82% and 45%, and Kappa 0.371 and 0.349 respectively.
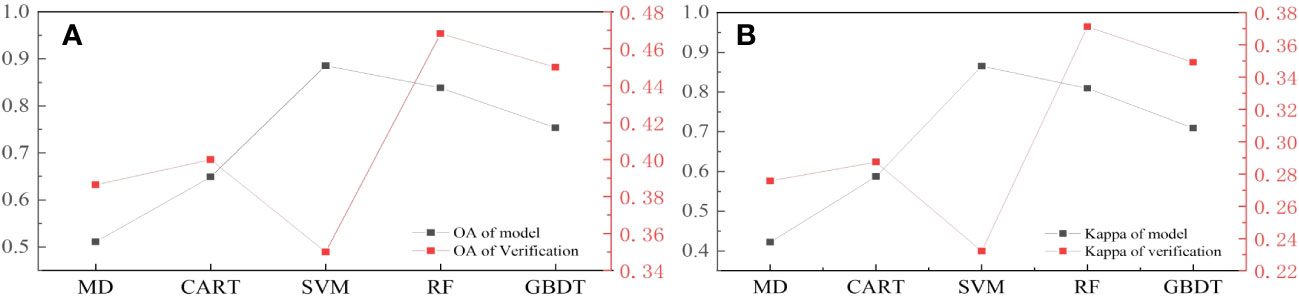
Figure 4 (A) Overall accuracy (OA) and (B) Kappa of five classifiers in lithological mapping. The black dots represent model accuracy, whereas the red dots represent model validation accuracy.
Figure 5 illustrates rock-type accuracy achieved by the five machine learning algorithms. The “water” class consistently exhibits high accuracy (close to 100%) across all models, indicating the effectiveness of the algorithms. In terms of class accuracy, the RF model demonstrates notable improvements in precision for “RhyT”, “San”, and “YinT” classes, as well as increased recall for “RhyT” and “YinT” classes. For instance, precision of San improved by 13.1% to 20%, and recall of “RhyT” increased by 10% to 36.6%. The GBDT achieved overall high accuracy through significant improvements in precision and recall for “CGS” and “San”. Specifically, precision and recall of “CGS” increased by 1.3% to 11.8% and 2.7% to 29%, respectively.
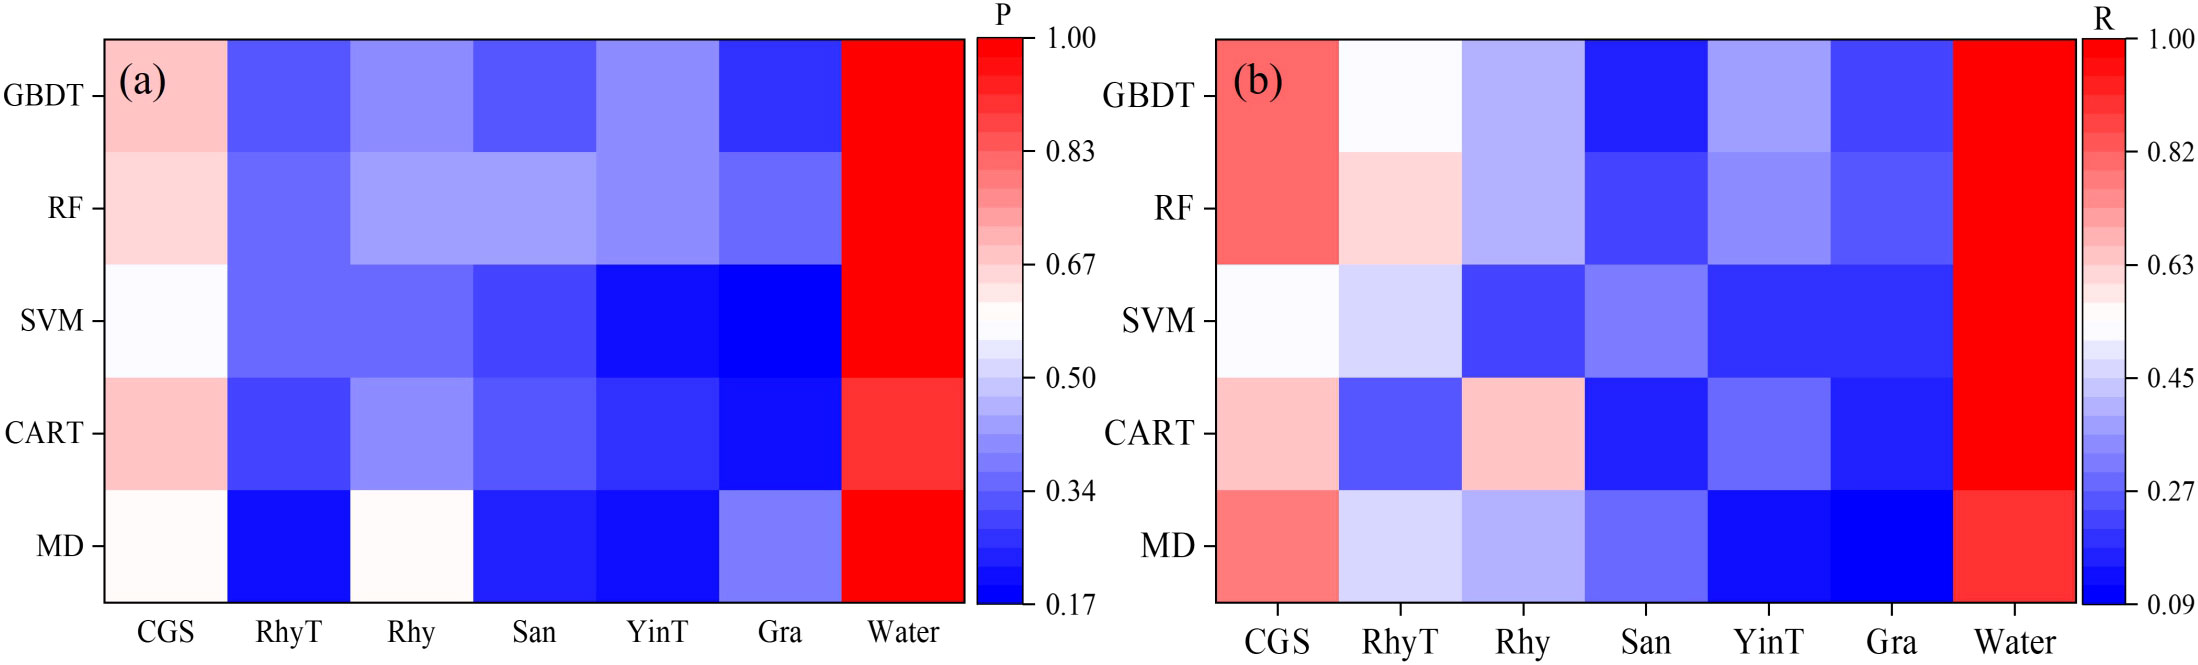
Figure 5 (A) Precision (P) and (B) recall (R) of rock types using five classifiers (MD, CART, SVM, RF and GBDT) based on Sentinel-2.
4.3 Lithology classification using SRTM DEM
Using RF and GBDT algorithms for lithology classification achieves higher accuracy based on the accuracy assessment results (see Figures 6, 7). The overall classification accuracy is approximately 49% with a kappa coefficient of approximately 0.4. When comparing individual rock types, both algorithms show higher accuracy for “CGS” and “Rhy”. “CGS” plays a significant role in terrain morphology and exhibits a certain relationship with terrain features. “Rhy” is commonly found in uplift zones associated with tectonic landforms.
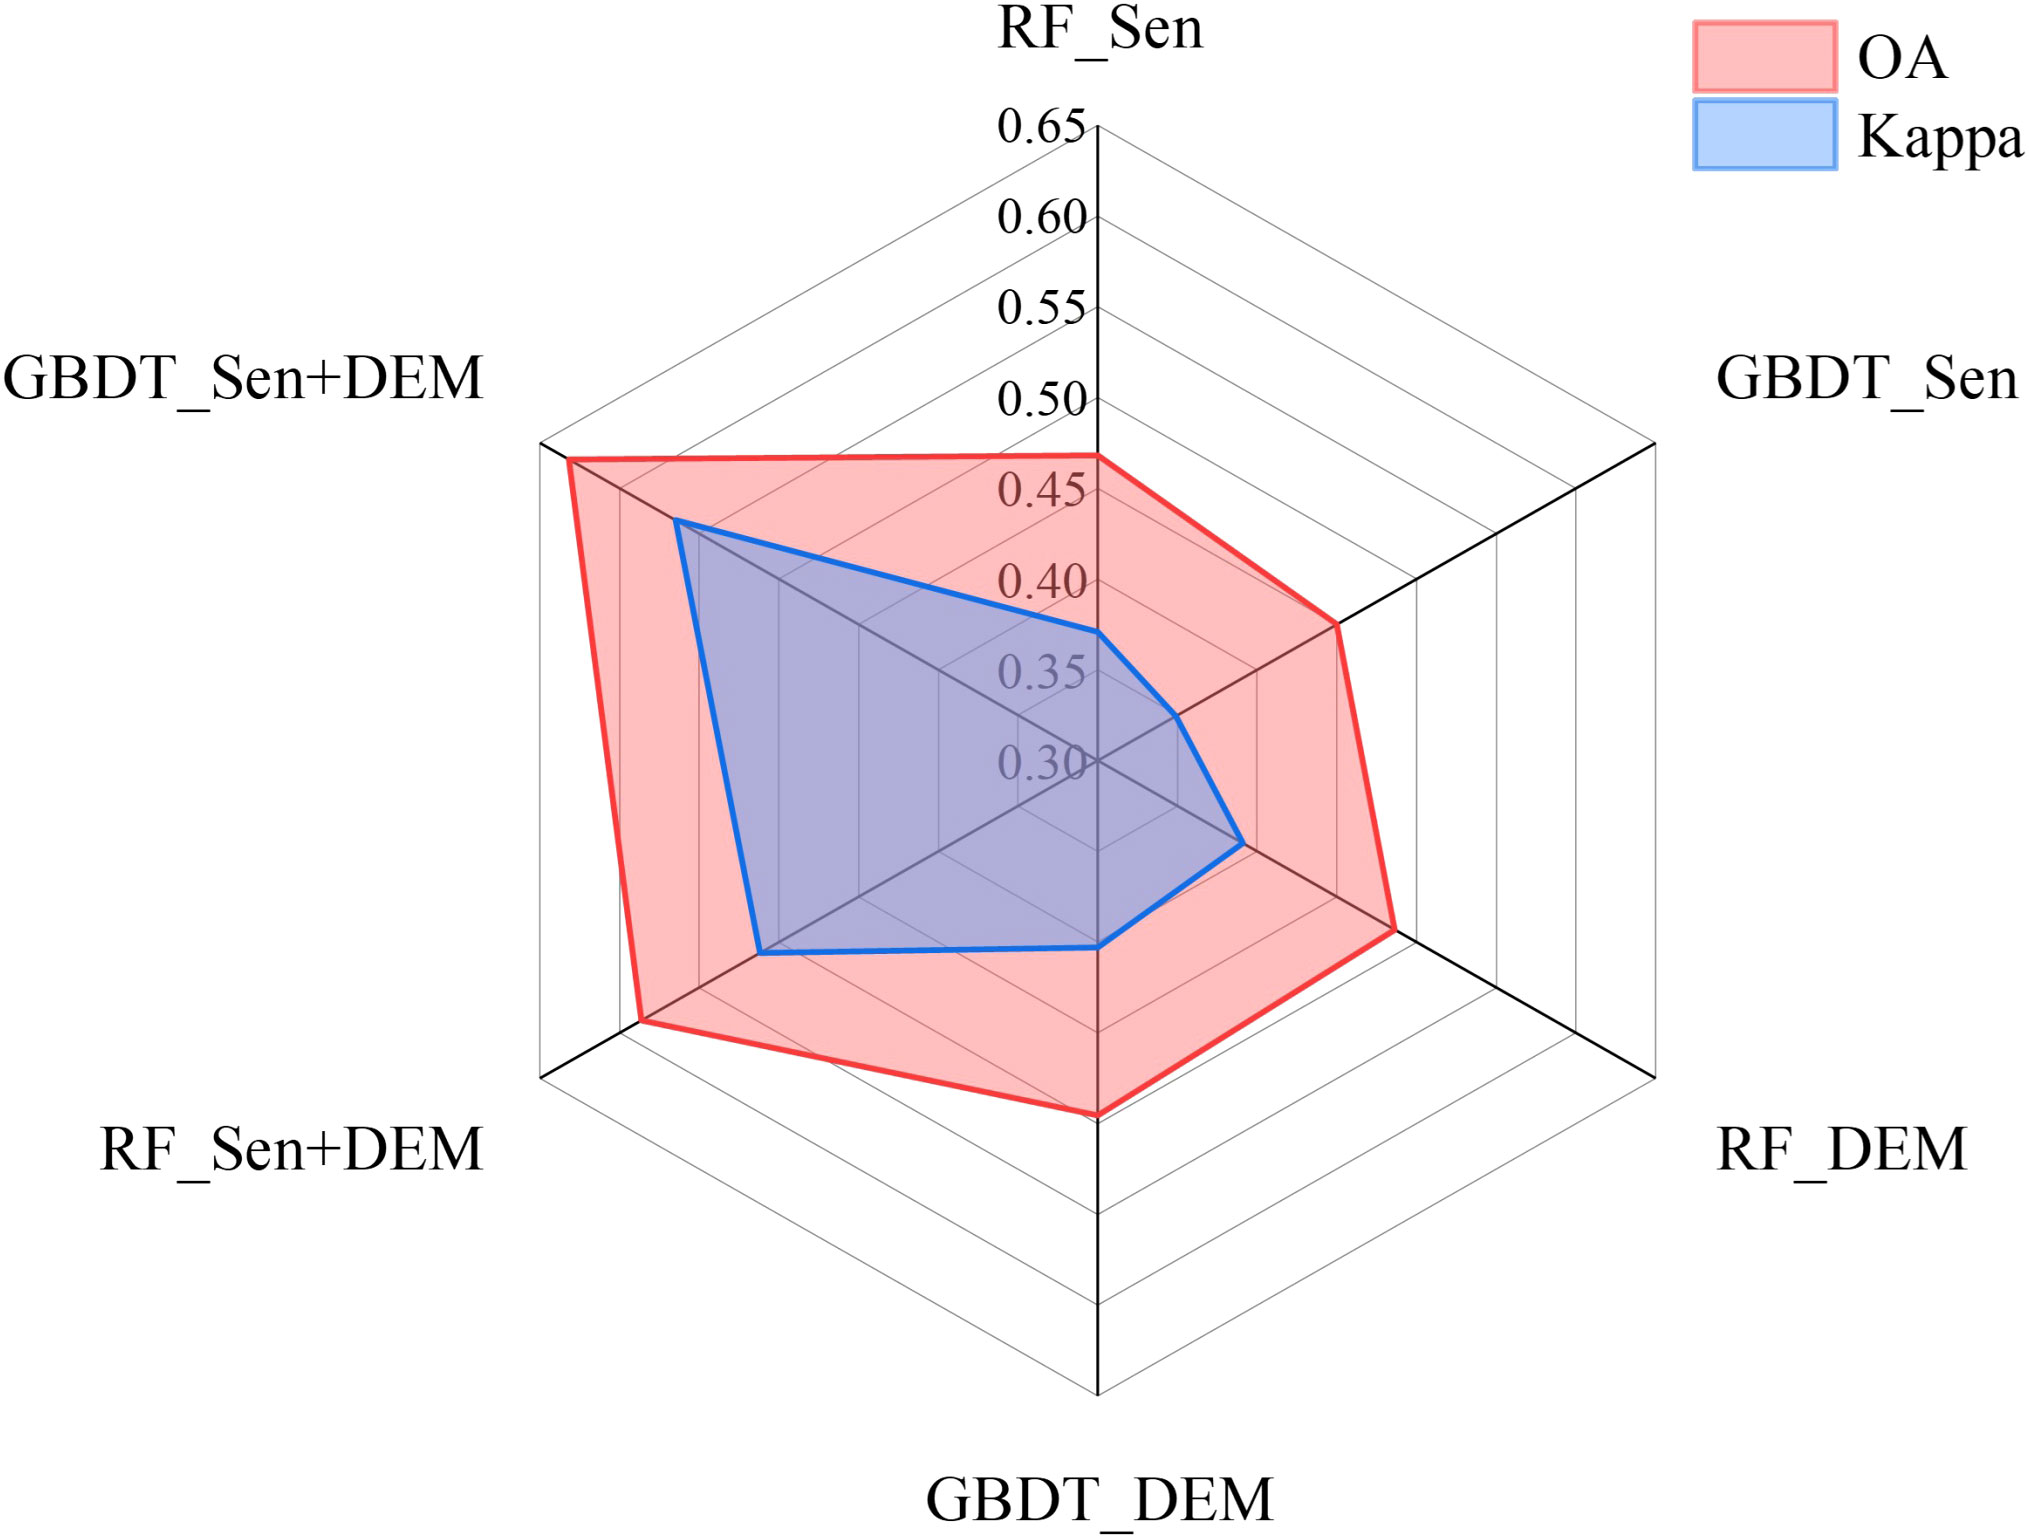
Figure 6 Overall accuracy (OA) and Kappa of the RF and GBDT in lithological classification based on Sentinel-2 (alone), DEM (alone), and combined Sentinel-2 and DEM data. "Sen" is the abbreviation for Sentinel-2.
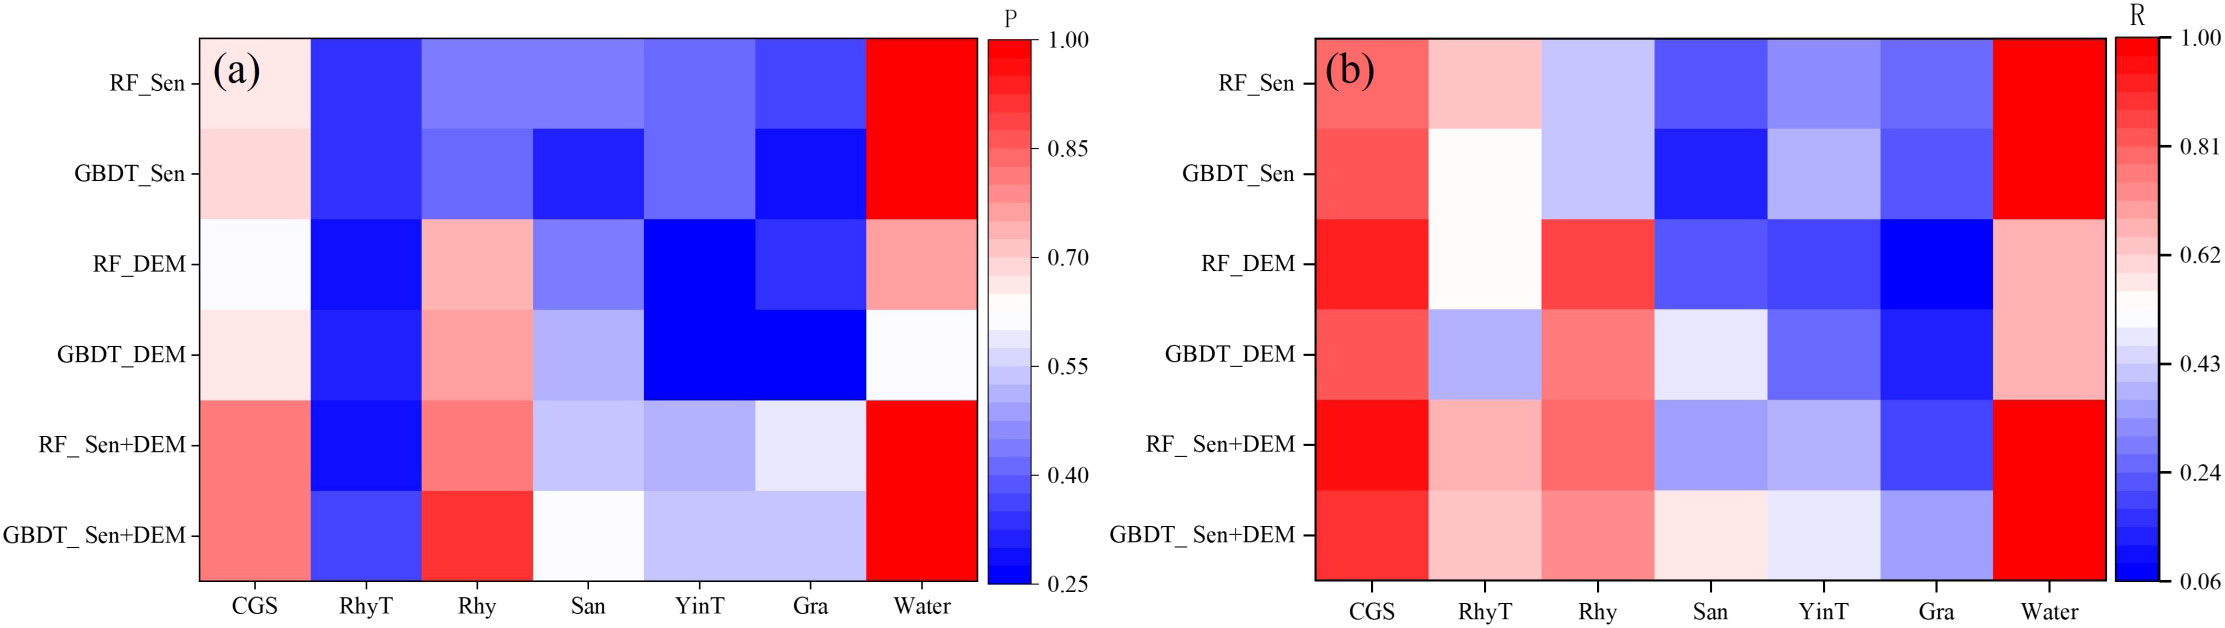
Figure 7 (A) Precision (P) and (B) recall (R) of rock types using RF and GBDT based on Sentinel-2 (alone). DEM (alone), and combined Sentinel-2 and DEM.
The lithology classification map generated using SRTM DEM (Digital Elevation Model) data shows higher accuracy than Sentinel-2 imagery. The overall improvement in lithology classification accuracy is mainly attributed to better classification of “Rhy” and “San”, despite a slight decrease in the accuracy of classifying “RhyT” and “Gra”. This can be explained by the strong correlation between spatial distribution and landform morphology. “San” is commonly found in low-lying areas, while “Rhy” is associated with volcanic activity and its distribution relates to volcanic topography. However, it should be noted that the accuracy of “water” based on SRTM DEM is significantly lower than that of Sentinel-2 imagery due to the limited information about water bodies in DEM, which primarily focuses on surface terrain elevation. As a result, there may be errors or omissions in the parts of the lithology classification that involve water bodies, as it does not capture the characteristics of water flow from higher to lower elevations. Overall, the utilization of DEM improves the accuracy of lithological classification by capturing the relationship between lithological variations and landform morphology.
4.4 Lithology classification using combined Sentinel-2 and SRTEM DEM
The RF and GBDT are also utilized in a lithology mapping study that combines Sentinel-2 imagery and SRTM DEM data. The extraction of lithological information can be greatly improved by integrating optical remote sensing data with terrain morphology features, resulting in more comprehensive and accurate spatial information. Both algorithms (RF and GBDT) show a significant improvement in accuracy compared to Sentinel-2 (alone) or SRTM DEM (alone), achieving OA of approximately 60% (see Figure 6). The GBDT demonstrates a more precise lithology classification, achieving OA of 63.18% and a Kappa of 0.565. Compared with RF, GBDT improved OA and Kappa by 4.54% and 0.053, respectively.
The joint utilization of Sentinel-2 imagery and SRTM DEM, along with advanced machine learning algorithms like GBDT, significantly improves the classification accuracy of various lithological categories, as depicted in Figure 7. The performance in classifying “CGS”, “San” and “Rhy” is notably enhanced. Moreover, the classification of “water” achieves optimal results.
Based on the above study, lithological mapping was performed using RF for Sentinel-2 (alone), GBDT for DEM (alone) and the combination of Sentinel-2 and DEM (Figure 8). In the lithological map based on Sentinel-2, the limited distinguishability of rock types other than “CGS” and the presence of significant “speckle” phenomenon may be attributed to the optical sensor limitations of Sentinel-2, which are affected by cloud cover, atmospheric interference, and vegetation obstruction. In contrast, DEM data offers continuous surface elevation and terrain information, resulting in a clearer representation of lithological distribution. The combination of Sentinel-2 imagery and DEM allows for leveraging their respective strengths, leading to more comprehensive and accurate rock-type classification results.
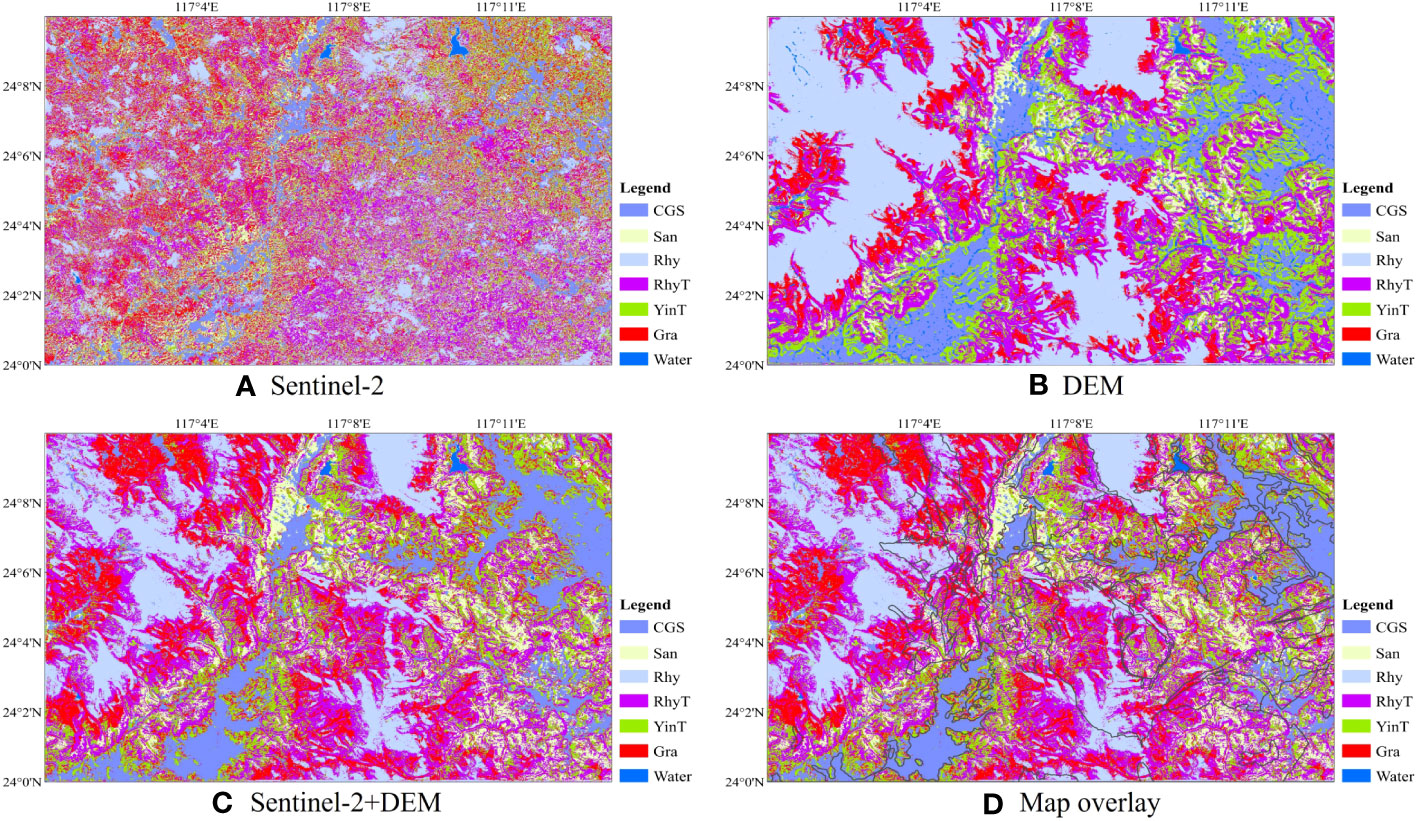
Figure 8 Lithological mapping of the study area from (A) Sentinel-2 (alone), (B) DEM (alone), (C) combined Sentinel-2 and DEM, and (D) overlay of the rock classification map and existing geological contour map.
5 Discussion
Using SRTM DEM data for lithological classification provides more accurate results than Sentinel-2 imagery, particularly for “Rhy” and “San”. However, “water” requires additional data sources or methods to enhance accuracy. Sentinel-2 imagery offers rich spectral information for analyzing rock characteristics such as color and reflectance. On the other hand, SRTM DEM provides elevation data for terrain morphology revealing surface undulations and morphological features complementing lithological classification. The accuracy and reliability of lithological classification are substantially improved through the integration of these data sources, meticulous consideration of spectral and terrain features, and the utilization of state-of-the-art machine learning algorithms.
Choosing the correct classification algorithm is crucial for achieving satisfactory results in land cover classification using remote sensing data. In this study, we evaluated the performance of five classical machine learning algorithms for rock identification in densely vegetated areas. Our findings indicate that complex algorithms like RF and GBDT outperformed the others, consistent with previous research (He et al., 2015; Othman and Gloaguen, 2017). RF exhibited robustness, stability, and the ability to handle feature selection and outliers. GBDT demonstrated strong fitting and generalization capabilities, making it suitable for capturing complex nonlinear relationships.
Overlaying the classification result map with geological contour maps allows for visual analysis of the spatial distribution of rock types (Figure 8). In this study, we observed consistency between the classification results and existing geological maps for “GCS”, and “Rhy”, indicating a good match. Fine sand and siltstone were primarily found in valley areas, corresponding to the gentle topographic features of valleys. These areas are often impacted by human activities for agricultural, residential, and industrial purposes, leading to modified surface cover types. The mixing of the other three rock types is prominent. However, further observation shows that the classification performance of granite and andesitic tuff in the northern region is consistently high. In the southern region, although there is a mixing phenomenon in the rhyolite area, rhyolite remains dominant. These findings are valuable for studying the geological features, distribution of rock types, and geological evolution in the study area.
In areas with dense vegetation, the presence of subsurface rock types can potentially affect the distribution and characteristics of vegetation (Ott, 2020). However, the growth and distribution of vegetation are influenced by various factors such as soil type, moisture levels, light intensity, and climate conditions (Yang et al., 2021). The complex interactions among these factors make the relationship between vegetation and subsurface rock types complex. In our study, we used maps created from field surveys as a reference for our sample data. Although we tried to avoid including samples from border regions to reduce potential errors due to geographic bias, there may still be some mistakes in our pixel-based sample data, including issues with the representativeness of the sample and measurement accuracy. Additionally, we didn’t thoroughly analyze how rock types correlate with vegetation and terrain features. This oversight could reduce the certainty of our research results, especially if the connections between these factors are weak or unclear. To address this, in our future research, we will focus on a detailed correlation analysis to better understand these relationships. This will improve the accuracy of rock classification and provide more reliable tools and data support for geological research, resource exploration, and related fields. As well as,future research should consider incorporating more extensive on-site validation efforts to confirm the accuracy of our classification results.
Moreover, the high variability within rock classes and similarities between different rock types (Otele et al., 2021) contribute to the complexity of vegetation and terrain features, making it challenging to directly infer subsurface rock information solely based on vegetation indices. Recent advancements in deep learning algorithms have significantly enhanced their application in remote sensing for land cover classification (Sun et al., 2022). Particularly, in areas with dense vegetation cover, deep learning algorithms have demonstrated higher accuracy in identifying rock types (Otele et al., 2023; Pan et al., 2023). These algorithms leverage the ability to learn from extensive image data, enabling them to explore and capture intricate relationships and feature representations among different land cover classes (Dimitrovski et al., 2023). They effectively address the challenges posed by vegetation interference and complex land cover backgrounds, resulting in improved classification accuracy and stability. Additionally, deep learning algorithms exhibit a certain level of generalization capability, performing well across different regions and datasets (Yasir et al., 2023). These findings provide valuable insights and pave the way for future research in this field.
6 Conclusions
Through the integration of optical remote sensing imagery and terrain data, coupled with the utilization of advanced algorithms, the potential to discern various rock types becomes attainable. This integration significantly enhances the precision and dependability of lithological mapping within regions characterized by dense vegetation cover. When juxtaposed with the individual use of optical imagery or terrain data, the amalgamation of these two datasets for rock classification purposes exhibits a synergistic effect, enriching the informational representation of rock types.
Furthermore, the employment of sophisticated Machine Learning Algorithms (MLAs) adeptly harnesses and delves into the wealth of feature information stemming from these diverse data sources. These algorithms, characterized by their resilient nonlinear modeling and learning capabilities, enable the capture of intricate relationships within land cover. This is achieved through the extensive use of sample data, ultimately resulting in improved accuracy and stability in lithology classification.
It’s worth noting that the GBDT and RF algorithms employed in this study exhibit robustness and resilience, rendering them applicable across various research regions and for the categorization of rock types involving different combinations of data types. This holds significant implications for geological surveys and mineral exploration.
Looking ahead to future research endeavors, our focus will remain on deepening our understanding of the interplay between rock types and vegetation as well as terrain features. This ongoing exploration aims to further enhance the accuracy of rock classification. Additionally, the application of deep learning algorithms presents an intriguing avenue, particularly in addressing the challenges posed by rock classification in areas with dense vegetation cover.
Data availability statement
The original contributions presented in the study are included in the article/supplementary files. Further inquiries can be directed to the corresponding author.
Author contributions
Conceptualization, YD and YW. Methodology, YC, GL and YD. Software, YC. Investigation, PS. Writing—original draft preparation, YC. Writing—review and editing, YC, FZ and YW. Visualization, YC. Supervision, YD and GL. Funding acquisition, PS. All authors contributed to the article and approved the submitted version.
Funding
This research was funded by China Geological Survey Project (project number DD20230591), Science and Technology Innovation Fund of Command Center of Integrated Natural Resources Survey Center (KC20220020) and Soft Science Research Project of Xi’an Science and Technology Plan (22RKYJ0044).
Conflict of interest
The authors declare that the research was conducted in the absence of any commercial or financial relationships that could be construed as a potential conflict of interest.
Publisher’s note
All claims expressed in this article are solely those of the authors and do not necessarily represent those of their affiliated organizations, or those of the publisher, the editors and the reviewers. Any product that may be evaluated in this article, or claim that may be made by its manufacturer, is not guaranteed or endorsed by the publisher.
References
Ager C. M., Milton N. M. (2012). Spectral reflectance of lichens and their effects on the reflectance of rock substrates. Geophysics 52, 898–906. doi: 10.1190/1.1442360
Andreani L., Stanek K. P., Gloaguen R., Krentz O., Domínguez-González L. (2014). DEM-based analysis of interactions between tectonics and landscapes in the Ore Mountains and Eger Rift (East Germany and NW Czech Republic). Remote Sens. 6, 7971–8001. doi: 10.3390/rs6097971
Bachri I., Hakdaoui M., Raji M., Teodoro A. C., Benbouziane A. (2019). Machine learning algorithms for automatic lithological mapping using remote sensing data: A case study from Souk Arbaa Sahel, Sidi Ifni Inlier, Western Anti-Atlas, Morocco. ISPRS Int. J. Geo-Information 8, 248. doi: 10.3390/ijgi8060248
Belgiu M., Drăguţ L. (2016). Random forest in remote sensing: A review of applications and future directions. ISPRS J. photogrammetry Remote Sens. 114, 24–31. doi: 10.1016/j.isprsjprs.2016.01.011
Benbahria Z., Sebari I., Hajji H., Smiej M. F. (2018). “Automatic mapping of irrigated areas in mediteranean context using landsat 8 time series images and random forest algorithm,” in Proceedings of the IGARSS 2018–2018 IEEE International Geoscience and Remote Sensing Symposium. Valencia, Spain: Institute of Electrical and Electronics Engineers 7986–7989. doi: 10.1109/IGARSS.2018.8517810
Cai W., Wei R., Xu L., Ding X. (2022). A method for modelling greenhouse temperature using gradient boost decision tree. Inf. Process. Agric. 9, 343–354. doi: 10.1016/j.inpa.2021.08.004
Carli C., Sgavetti M. (2011). Spectral characteristics of rocks: Effects of composition and texture and implications for the interpretation of planet surface compositions. Icarus 211, 1034–1048. doi: 10.1016/j.icarus.2010.11.008
Chen C., Liang J., Xie F., Hu Z., Sun W., Yang G., et al. (2022). Temporal and spatial variation of coastline using remote sensing images for Zhoushan archipelago, China. Int. J. Appl. Earth Observation Geoinformation 107, 102711. doi: 10.1016/j.jag.2022.102711
Chen Y., Hou J., Huang C., Zhang Y., Li X. (2021). Mapping maize area in heterogeneous agricultural landscape with multi-temporal Sentinel-1 and Sentinel-2 images based on random forest. Remote Sens. 13, 2988. doi: 10.3390/rs13152988
Chen C., Liang J., Yang G., Sun W. (2023). Spatio-temporal distribution of harmful algal blooms and their correlations with marine hydrological elements in offshore areas, China. Ocean Coast. Manage. 238, 106554. doi: 10.1016/j.ocecoaman.2023.106554
Chen S., Liu Y., Yang Q., Zhou C., Zhao L. (2012). Lithology classification of vegetated area by satellite hyperspectral remote sensing. J. Jilin Univ. (Earth Sci. Edition) 42, 1959–1965. doi: 10.13278/j.cnki.jjuese.2012.06.010
Chen L., Sui X., Liu R., Chen H., Li Y., Zhang X., et al. (2023). Mapping alteration minerals using ZY-1 02D hyperspectral remote sensing data in coalbed methane enrichment areas. Remote Sens. 15, 3590. doi: 10.3390/rs15143590
Comber A., Fisher P., Brunsdon C., Khmag A. (2012). Spatial analysis of remote sensing image classification accuracy. Remote Sens. Environ. 127, 237–246. doi: 10.1016/j.rse.2012.09.005
Dimitrovski I., Kitanovski I., Kocev D., Simidjievski N. (2023). Current trends in deep learning for Earth Observation: An open-source benchmark arena for image classification. ISPRS J. Photogrammetry Remote Sens. 197, 18–35. doi: 10.1016/j.isprsjprs.2023.01.014
do Amaral C. H., de Almeida T. I. R., de Souza Filho C. R., Roberts D. A., Fraser S. J., Alves M. N., et al. (2018). Characterization of indicator tree species in neotropical environments and implications for geological mapping. Remote Sens. Environ. 216, 385–400. doi: 10.1016/j.rse.2018.07.009
Florinsky I. (2016). Digital terrain analysis in soil science and geology (Pushchino, Russia: Academic Press). doi: 10.1016/C2010-0-65718-X
Friedl M. A., Brodley C. E. (1997). Decision tree classification of land cover from remotely sensed data. Remote Sens. Environ. 61, 399–409. doi: 10.1016/S0034-4257(97)00049-7
Gallen S. F. (2018). Lithologic controls on landscape dynamics and aquatic species evolution in post-orogenic mountains. Earth Planetary Sci. Lett. 493, 150–160. doi: 10.1016/j.epsl.2018.04.029
Gloaguen R., Fuchs M., Khodadadzadeh M., Ghamisi P., Lorenz S. (2019). “Multi-source and multi-scale imaging-data integration to boost mineral mapping,” in Proceedings of the IGARSS 2019–2019 IEEE International Geoscience and Remote Sensing Symposium. Valencia, Spain: Institute of Electrical and Electronics Engineers. doi: 10.1109/IGARSS.2019.8900426
Grebby S., Naden J., Cunningham D., Tansey K. (2011). Integrating airborne multispectral imagery and airborne LiDAR data for enhanced lithological mapping in vegetated terrain. Remote Sens. Environ. 115, 214–226. doi: 10.1016/j.rse.2010.08.019
Guo S., Yang C., He R., Li Y. (2022). Improvement of lithological mapping using discrete wavelet transformation from sentinel-1 SAR data. Remote Sens. 14, 5824. doi: 10.3390/rs14225824
Hahm W. J., Rempe D. M., Dralle D. N., Dawson T. E., Lovill S. M., Bryk A. B., et al. (2019). Lithologically controlled subsurface critical zone thickness and water storage capacity determine regional plant community composition. Water Resour. Res. 55, 3028–3055. doi: 10.1029/2018WR023760
Hahm W. J., Riebe C. S., Lukens C. E., Araki S. (2014). Bedrock composition regulates mountain ecosystems and landscape evolution. Proc. Natl. Acad. Sci. 111, 3338–3343. doi: 10.1073/pnas.1315667111
Han S., Shuai S., Guo W., Yang P. (2021). Automatic classification method of quaternary lithology in vegetation cover area combining spectral, textural, topographic, geothermal, and vegetation. doi: 10.3233/ATDE210216
Harris J., Grunsky E. C. (2015). Predictive lithological mapping of Canada's North using Random Forest classification applied to geophysical and geochemical data. Comput. geosciences 80, 9–25. doi: 10.1016/j.cageo.2015.03.013
Hay A. (1988). The derivation of global estimates from a confusion matrix. Int. J. Remote Sens. 9, 1395–1398. doi: 10.1080/01431168808954945
He J., Harris J., Sawada M., Behnia P. (2015). A comparison of classification algorithms using Landsat-7 and Landsat-8 data for mapping lithology in Canada’s Arctic. Int. J. Remote Sens. 36, 2252–2276. doi: 10.1080/01431161.2015.1035410
Huete A., Didan K., Miura T., Rodriguez E. P., Gao X., Ferreira L. G. (2002). Overview of the radiometric and biophysical performance of the MODIS vegetation indices. Remote Sens. Environ. 83, 195–213. doi: 10.1016/S0034-4257(02)00096-2
Huete A., Liu H., Batchily K., Van Leeuwen W. (1997). A comparison of vegetation indices over a global set of TM images for EOS-MODIS. Remote Sens. Environ. 59, 440–451. doi: 10.1016/S0034-4257(96)00112-5
Jeong S., Kang S., Jang K., Lee H., Hong S., Ko D. (2012). Development of Variable Threshold Models for detection of irrigated paddy rice fields and irrigation timing in heterogeneous land cover. Agric. Water Manage. 115, 83–91. doi: 10.1016/j.agwat.2012.08.012
Klos P. Z., Goulden M. L., Riebe C. S., Tague C. L., O’Geen A. T., Flinchum B. A., et al. (2018). Subsurface plant-accessible water in mountain ecosystems with a Mediterranean climate. Wiley Interdiscip. Reviews: Water 5, e1277. doi: 10.1002/wat2.1277
Knepper D. H. Jr. (1989). “Mapping hydrothermal alteration with Landsat thematic mapper data,” in Remote Sensing in Exploration Geology: Golden, Colorado to Washington, DC, June 30–July 8, 1989, Washington, America, mineral deposits of North America. vol. 182. , 13–21. doi: 10.1002/9781118669877.ch3
Landeweert R., Hoffland E., Finlay R. D., Kuyper T. W., van Breemen N. (2001). Linking plants to rocks: ectomycorrhizal fungi mobilize nutrients from minerals. Trends Ecol. Evol. 16, 248–254. doi: 10.1016/S0169-5347(01)02122-X
Langford R. L. (2015). Temporal merging of remote sensing data to enhance spectral regolith, lithological and alteration patterns for regional mineral exploration. Ore Geology Rev. 68, 14–29. doi: 10.1016/j.oregeorev.2015.01.005
Lemercier B., Lacoste M., Loum M., Walter C. (2012). Extrapolation at regional scale of local soil knowledge using boosted classification trees: A two-step approach. Geoderma, 171, 75–84. doi: 10.1016/j.geoderma.2011.03.010
Lewis R. J. (2000). “An introduction to classification and regression tree (CART) analysis,” in Proceedings of the Annual Meeting of the Society for Academic Emergency Medicine in San Francisco, California, Vol. 14.
Lu Y., Yang C., Meng Z. (2021). Lithology discrimination using Sentinel-1 dual-pol data and SRTM data. Remote Sens. 13, 1280. doi: 10.3390/rs13071280
Meroni M., d'Andrimont R., Vrieling A., Fasbender D., Lemoine G., Rembold F., et al. (2021). Comparing land surface phenology of major European crops as derived from SAR and multispectral data of Sentinel-1 and-2. Remote Sens. Environ. 253, 112232. doi: 10.1016/j.rse.2020.112232
Mills H. H. (2003). Inferring erosional resistance of bedrock units in the east Tennessee mountains from digital elevation data. Geomorphology 55, 263–281. doi: 10.1016/S0169-555X(03)00144-2
Montgomery D. R. (2001). Slope distributions, threshold hillslopes, and steady-state topography. Am. J. Sci. 301, 432–454. doi: 10.2475/ajs.301.4-5.432
Mountrakis G., Im J., Ogole C. (2011). Support vector machines in remote sensing: A review. ISPRS J. photogrammetry Remote Sens. 66, 247–259. doi: 10.1016/j.isprsjprs.2010.11.001
Otele C. G. A., Onabid M. A., Assembe P. S. (2023). Design and Implementation of an Automatic Deep Stacked Sparsely Connected Auto-encoder (ADSSCA) Neural Network Architecture for Lithological Mapping under thick Vegetation using Remote Sensing. doi: 10.21203/rs.3.rs-2537926/v1
Otele C. G. A., Onabid M. A., Assembe P. S., Nkenlifack M. (2021). Updated lithological map in the Forest zone of the Centre, South and East regions of Cameroon using multilayer perceptron neural network and Landsat images. J. Geosci. Environ. Prot. 9, 120–134. doi: 10.4236/gep.2021.96007
Othman A. A., Gloaguen R. (2014). Improving lithological mapping by SVM classification of spectral and morphological features: The discovery of a new chromite body in the Mawat ophiolite complex (Kurdistan, NE Iraq). Remote Sens. 6, 6867–6896. doi: 10.3390/rs6086867
Othman A. A., Gloaguen R. (2017). Integration of spectral, spatial and morphometric data into lithological mapping: A comparison of different Machine Learning Algorithms in the Kurdistan Region, NE Iraq. J. Asian Earth Sci. 146, 90–102. doi: 10.1016/j.jseaes.2017.05.005
Ott R. F. (2020). How lithology impacts global topography, vegetation, and animal biodiversity: A global-scale analysis of mountainous regions. Geophysical Res. Lett. 47, e2020GL088649. doi: 10.1029/2020GL088649
Pal M. (2005). Random forest classifier for remote sensing classification. Int. J. Remote Sens. 26, 217–222. doi: 10.1080/01431160412331269698
Pal M., Mather P. M. (2003). An assessment of the effectiveness of decision tree methods for land cover classification. Remote Sens. Environ. 86, 554–565. doi: 10.1016/S0034-4257(03)00132-9
Pal M., Mather P. M. (2005). Support vector machines for classification in remote sensing. Int. J. Remote Sens. 26, 1007–1011. doi: 10.1080/01431160512331314083
Pal M., Rasmussen T., Porwal A. (2020). Optimized lithological mapping from multispectral and hyperspectral remote sensing images using fused multi-classifiers. Remote Sens. 12, 177. doi: 10.3390/rs12010177
Pan T., Zuo R., Wang Z. (2023). Geological mapping via convolutional neural network based on remote sensing and geochemical survey data in vegetation coverage areas. IEEE J. Selected Topics Appl. Earth Observations Remote Sens 16, 3485–3494. doi: 10.1109/JSTARS.2023.3260584
Pour A. B., Hashim M. (2014). ASTER, ALI and Hyperion sensors data for lithological mapping and ore minerals exploration. SpringerPlus 3, 130–130. doi: 10.1186/2193-1801-3-130
Qiao Y., Chen H., Jiang Y. (2020). Quantifying the impacts of lithology on vegetation restoration using a random forest model in a karst trough valley, China. Ecol. Eng. 156, 105973. doi: 10.1016/j.ecoleng.2020.105973
Safanelli J. L., Poppiel R. R., Ruiz L. F. C., Bonfatti B. R., Mello F., Rizzo R., et al. (2020). Terrain analysis in google earth engine: A method adapted for high-performance global-scale analysis. ISPRS Int. J. Geo-Information 9, 400. doi: 10.3390/ijgi9060400
Salmon B. P., Kleynhans W., Schwegmann C. P., Olivier J. C. (2015). “Proper comparison among methods using a confusion matrix,” in Proceedings of the 2015 IEEE International Geoscience and Remote Sensing Symposium (IGARSS). Milan, Italy: Institute of Electrical and Electronics Engineers, 3057–3060. doi: 10.1109/IGARSS.2015.7326461
Schwinning S. (2010). The ecohydrology of roots in rocks. Ecohydrology: Ecosystems land Water process interactions Ecohydrogeomorphology 3, 238–245. doi: 10.1002/eco.134
Serbouti I., Raji M., Hakdaoui M., El Kamel F., Pradhan B., Gite S., et al. (2022). Improved lithological map of large complex semi-arid regions using spectral and textural datasets within google earth engine and fused machine learning multi-classifiers. Remote Sens. 14, 5498. doi: 10.3390/rs14215498
Shebl A., Csamer A. (2021). Stacked vector multi-source lithologic classification utilizing Machine Learning Algorithms: Data potentiality and dimensionality monitoring. Remote Sens. Applications: Soc. Environ. doi: 10.1016/j.rsase.2021.100643
Shebl A., Csamer A., Abdellatif M. (2021). Lithological mapping enhancement by integrating Sentinel 2 and gamma-ray data utilizing support vector machine: A case study from Egypt. International Journal of Applied Earth Observation and Geoinformation. San Francisco, CA, USA, 105 doi: 10.1016/j.jag.2021.102619
Shi C., Wang X. (2014). Extraction and prospecting prediction of remote sensing geological structure anomaly information in Pinghe Vegetated area, Fujian Province. J. Geology 38, 464–469. doi: 10.3969/j.issn.1674-3636.2014.03.464
Shuai S. (2022). Study on lithology classification method based on multi-level information Fusion of multi-source Remote Sensing Data: A case study of basic-ultrabasic rocks in Bijiashan area, Beishan (Hubei: PhD, China University of Geosciences).
Siegal B. S., Goetz A. F. (1977). Effect of vegetation on rock and soil type discrimination. Photogrammetric Eng. Remote Sens. 43, 191–196. doi: 10.1016/0031-8663(77)90007-2
Snyder N. P., Whipple K. X., Tucker G. E., Merritts D. J. (2000). Landscape response to tectonic forcing: Digital elevation model analysis of stream profiles in the Mendocino triple junction region, northern California. Geological Soc. America Bull. 112, 1250–1263. doi: 10.1130/0016-7606(2000)112<1250:LRTTFD>2.0.CO;2
Sun W., Ren K., Meng X., Yang G., Xiao C., Peng J., et al. (2022). MLR-DBPFN: A multi-scale low rank deep back projection fusion network for anti-noise hyperspectral and multispectral image fusion. IEEE Trans. Geosci. Remote Sens. 60, 1–14. doi: 10.1109/TGRS.2022.3146296
Wacker A., Landgrebe D. (1972). Minimum distance classification in remote sensing. LARS Tech. Rep. 25.
Wang Z., Li D. (2020). Analysis on comprehensive utilization of geological prospecting and mineral resources in China. China Resour. Compr. Utilization 3, 109–111.
Wang L., Liu F. (2020). Analysis on Eco geological conditions of mineral resources exploration and development in North Junggar metallogenic belt, Xinjiang. World Nonferrous Metals 2.
Xie Y. (2020). Current situation and improvement of Chinese legislation on mineral resources protection – comment on the innovation research on Chinese legislation on mineral resources protection. Min. Res. Dev. 40, 170.
Xu S., Liu S., Wang H., Chen W., Zhang F., Xiao Z. (2020). A hyperspectral image classification approach based on feature fusion and multi-layered gradient boosting decision trees. Entropy 23, 20. doi: 10.3390/e23010020
Yang L., Shen F., Zhang L., Cai Y., Yi F., Zhou C. (2021). Quantifying influences of natural and anthropogenic factors on vegetation changes using structural equation modeling: A case study in Jiangsu Province, China. J. Cleaner Production 280, 124330. doi: 10.1016/j.jclepro.2020.124330
Yang L., Zhang X., Liang S., Yao Y., Jia K., Jia A. (2018). Estimating surface downward shortwave radiation over China based on the gradient boosting decision tree method. Remote Sens. 10, 185. doi: 10.3390/rs10020185
Yasir M., Jianhua W., Shanwei L., Sheng H., Mingming X., Hossain M. (2023). Coupling of deep learning and remote sensing: a comprehensive systematic literature review. Int. J. Remote Sens. 44, 157–193. doi: 10.1080/01431161.2022.2161856
Zeng L., Li T., Huang H., Zeng P., He Y., Jing L., et al. (2023). Identifying Emeishan basalt by supervised learning with Landsat-5 and ASTER data. Front. Earth Sci. 10. doi: 10.3389/feart.2022.1097778
Zhou K., Zhang J., Ren Y., Huang Z., Zhao L. (2020). A gradient boosting decision tree algorithm combining synthetic minority oversampling technique for lithology identification. Geophysics 85, WA147–WA158. doi: 10.1190/geo2019-0429.1
Keywords: GBDT, RF, lithological mapping, highly vegetated areas, Sentinel-2, SRTM DEM
Citation: Chen Y, Dong Y, Wang Y, Zhang F, Liu G and Sun P (2023) Machine learning algorithms for lithological mapping using Sentinel-2 and SRTM DEM in highly vegetated areas. Front. Ecol. Evol. 11:1250971. doi: 10.3389/fevo.2023.1250971
Received: 30 June 2023; Accepted: 06 October 2023;
Published: 17 October 2023.
Edited by:
Samy Ismail Elmahdy, United Arab Emirates University, United Arab EmiratesReviewed by:
Chao Chen, Suzhou University of Science and Technology, ChinaRui Xu, Chang’an University, China
Copyright © 2023 Chen, Dong, Wang, Zhang, Liu and Sun. This is an open-access article distributed under the terms of the Creative Commons Attribution License (CC BY). The use, distribution or reproduction in other forums is permitted, provided the original author(s) and the copyright owner(s) are credited and that the original publication in this journal is cited, in accordance with accepted academic practice. No use, distribution or reproduction is permitted which does not comply with these terms.
*Correspondence: Yulong Dong, MTk4MjQzMzQxOEBxcS5jb20=