 Chen Zhang1
 Jiahong Liu
 Yongpeng Lv
 Nan Zhang
95% of researchers rate our articles as excellent or good
Learn more about the work of our research integrity team to safeguard the quality of each article we publish.
Find out more
ORIGINAL RESEARCH article
Front. Ecol. Evol. , 04 August 2023
Sec. Interdisciplinary Climate Studies
Volume 11 - 2023 | https://doi.org/10.3389/fevo.2023.1242492
This article is part of the Research Topic Interaction of Droughts and Eco-Hydrological Processes in Changing Environments View all 6 articles
Synergistic allocation of urban stormwater infrastructure is critical to flood risk prevention and control under extreme rainfall events. This study focuses on the interaction regularity of green, gray, and blue infrastructure in the process of runoff retention and discharge under extreme rainfall scenarios. Three strategies, namely, gray infrastructure, green-gray infrastructure, and green-gray-blue infrastructure, are proposed to analyze the effectiveness of different scenarios on flood risk control capabilities of urban drainage systems and to determine the key influencing factors of the three strategies. The results show that green-gray-blue infrastructure demonstrates synergy in improving the efficiency of urban drainage systems. Under gravity drainage conditions, the backwater jacking caused by high river water levels has a certain impact on the smooth discharge of stormwater runoff in urban drainage systems. This case study identified a sensitive range in the influence of water level on runoff control and drainage function and an adaptive range in which the flood increases slightly with the water level increase. These present notable rules in improving the synergistic effect of blue infrastructure in the integrated urban green-gray-blue infrastructure system.
Since the Industrial Revolution, human activities have significantly altered the urban environment and its functions, which has led to many environmental problems in urban areas (Arjenaki et al., 2020; Jiang et al., 2022), such as the rapid expansion of impervious surfaces, increased surface stormwater runoff, changes in soil conditions, and declining water and air quality (Walsh et al., 2016; Huo et al., 2019). Since the 1970s, many developed countries, such as the United States, Canada, Japan, and Turkey, have developed sustainable stormwater management concepts. (Bradford and Randall, 2013; Olszewski and Davis, 2013; Guo et al., 2018; Alikhani et al., 2020; Zhang et al., 2020; Rentachintala et al., 2022). Green infrastructure is considered a common sustainable stormwater management measure, which is now recognized as an efficient method to improve the effectiveness of stormwater management by playing a positive role in urban stormwater management (Rahman et al., 2014; Walsh et al., 2014; Deyvid et al., 2020). In 2012, China proposed the Sponge City strategy, using green infrastructure as the main strategy aiming to mitigate urban water issues and improve the adaptability of cities to water (Marsalek et al., 2013; Wang et al., 2017; Zhang et al., 2019). Current research has focused on the functional effects of green infrastructure, scenario analysis, or case studies of green infrastructure in terms of total stormwater runoff reduction, peak flow reduction, and flood risk reduction (Debusk and Wynn, 2011; Bradford and Randall, 2013; Olszewski and Davis, 2013; Rahman et al., 2014; Dhakal and Chevalier, 2015; Shafique and Kim, 2017b; Earles et al., 2018; Guo et al., 2018; Alikhani et al., 2020; Zhang et al., 2020). A series of green infrastructure measures such as rain gardens, green roofs, infiltration trenches, and permeable pavements have been used to address the impacts of urbanization and climate change on urban areas, effectively reducing the impact of urban development on the environment, rationalizing the use of landscape space, and controlling stormwater runoff (Rowe, 2011; Liu et al., 2021; Jiang et al., 2022).
The planning and construction of green infrastructure are constrained by urban land use and cannot completely replace gray infrastructure. In addition, source-based, decentralized green infrastructure has disadvantages such as the inability to cope with short-time heavy rainfall (Lee et al., 2012; Eckart et al., 2017; Taji and Regulwar, 2019). In recent years, comprehensive facilities that combine green infrastructure with gray infrastructure have been recommended as an alternative to traditional drainage design (Shafique and Kim, 2017a). Green-gray infrastructure is a cost-effective long-term measure compared to traditional gray infrastructure and can effectively mitigate the effects of the changes in hydrological conditions in local areas due to the proliferation of gray infrastructure on a global scale (Konijnendijk, 2008; Llausàs and Roe, 2012; Bradford and Randall, 2013). However, the effect of green-gray infrastructure also varies considerably under the effect of different climatic and hydrological characteristics, land use economics, and other regional features (Dong et al., 2017). Moreover, green infrastructure is mostly small-scale and decentralized, which makes green-gray infrastructure inadequate to cope with torrential rain and future extreme weather conditions (Demuzere et al., 2014). To solve these problems, integrated green-gray-blue infrastructure has been advocated in recent years. The IPCC Sixth Assessment Group II Report states that green-blue infrastructure investments and natural area conservation in cities can provide nature-based solutions (NBSs) across scales to reduce temperature shocks and provide natural flood defenses among other adaptation and resilience benefits (Alves et al., 2020). Several studies have proposed the combination of blue infrastructure with green-gray infrastructure as the best solution for cities to cope with climate change (Alves et al., 2020). It is advocated that urban internal rivers, water bodies, wetlands, and other components of blue infrastructure be incorporated into urban stormwater management systems to form green-gray-blue infrastructure. Urban rivers are important blue infrastructure for discharging and managing stormwater runoff that exceeds green-gray infrastructure standards and mitigating urban flooding risks.
Previous studies focused on the storage space and volume provided by blue infrastructure such as ponds, wetlands, and open space. Versini et al. (2018) analyzed the influence of distributed structure and total storage capacity of blue infrastructure on runoff volume and peak discharge. Gunnell et al. (2019) used water storage capacity as a metric to analyze the ability of blue infrastructure to buffer flood risk. Wang et al. (2022), taking the storage volume of blue infrastructure as one of the decision variables, carried out studies on green-gray-blue infrastructure automatic optimization. In the case of extreme rainfall scenarios, backwater jacking may occur when the river water level (RWL) rises. Under gravity drainage conditions, backwater jacking of urban rivers has a direct impact on the function of green-gray-blue infrastructure, as the backwater can lead to the runoff control and drainage function of green and gray infrastructure to be difficult to operate properly, aggravating the water inundation inside the city. It is critical to enhance the synergistic effect and avoid the negative impact through collaborative design between green, gray, and blue infrastructures. At present, there are few studies focused on quantifying the effect of water level change on synergy and the negative impact of river backwater jacking on runoff and flood control function, which is an obstacle to the comprehensive effect of green-gray-blue infrastructure. More practical data are needed to support the important role of combined green-gray-blue infrastructure in urban stormwater management, as well as to summarize the laws and provide a reference basis for how to integrate green-gray-blue infrastructure.
The study area is located in the old city of Lin-gang Special Area, Shanghai, China, with a total area of approximately 0.53 km2, shown in Figure 1. The study area has a tropical oceanic monsoon climate with an average precipitation of 1229.4 mm per year, unevenly distributed. Because of its special geographical location, it is vulnerable to typhoons from July to September. The study area has a complete drainage system, with stormwater being discharged to the surrounding urban river through the drainage system. The local government of the study area has renovated the urban drainage system in recent years based on the sponge city concept.
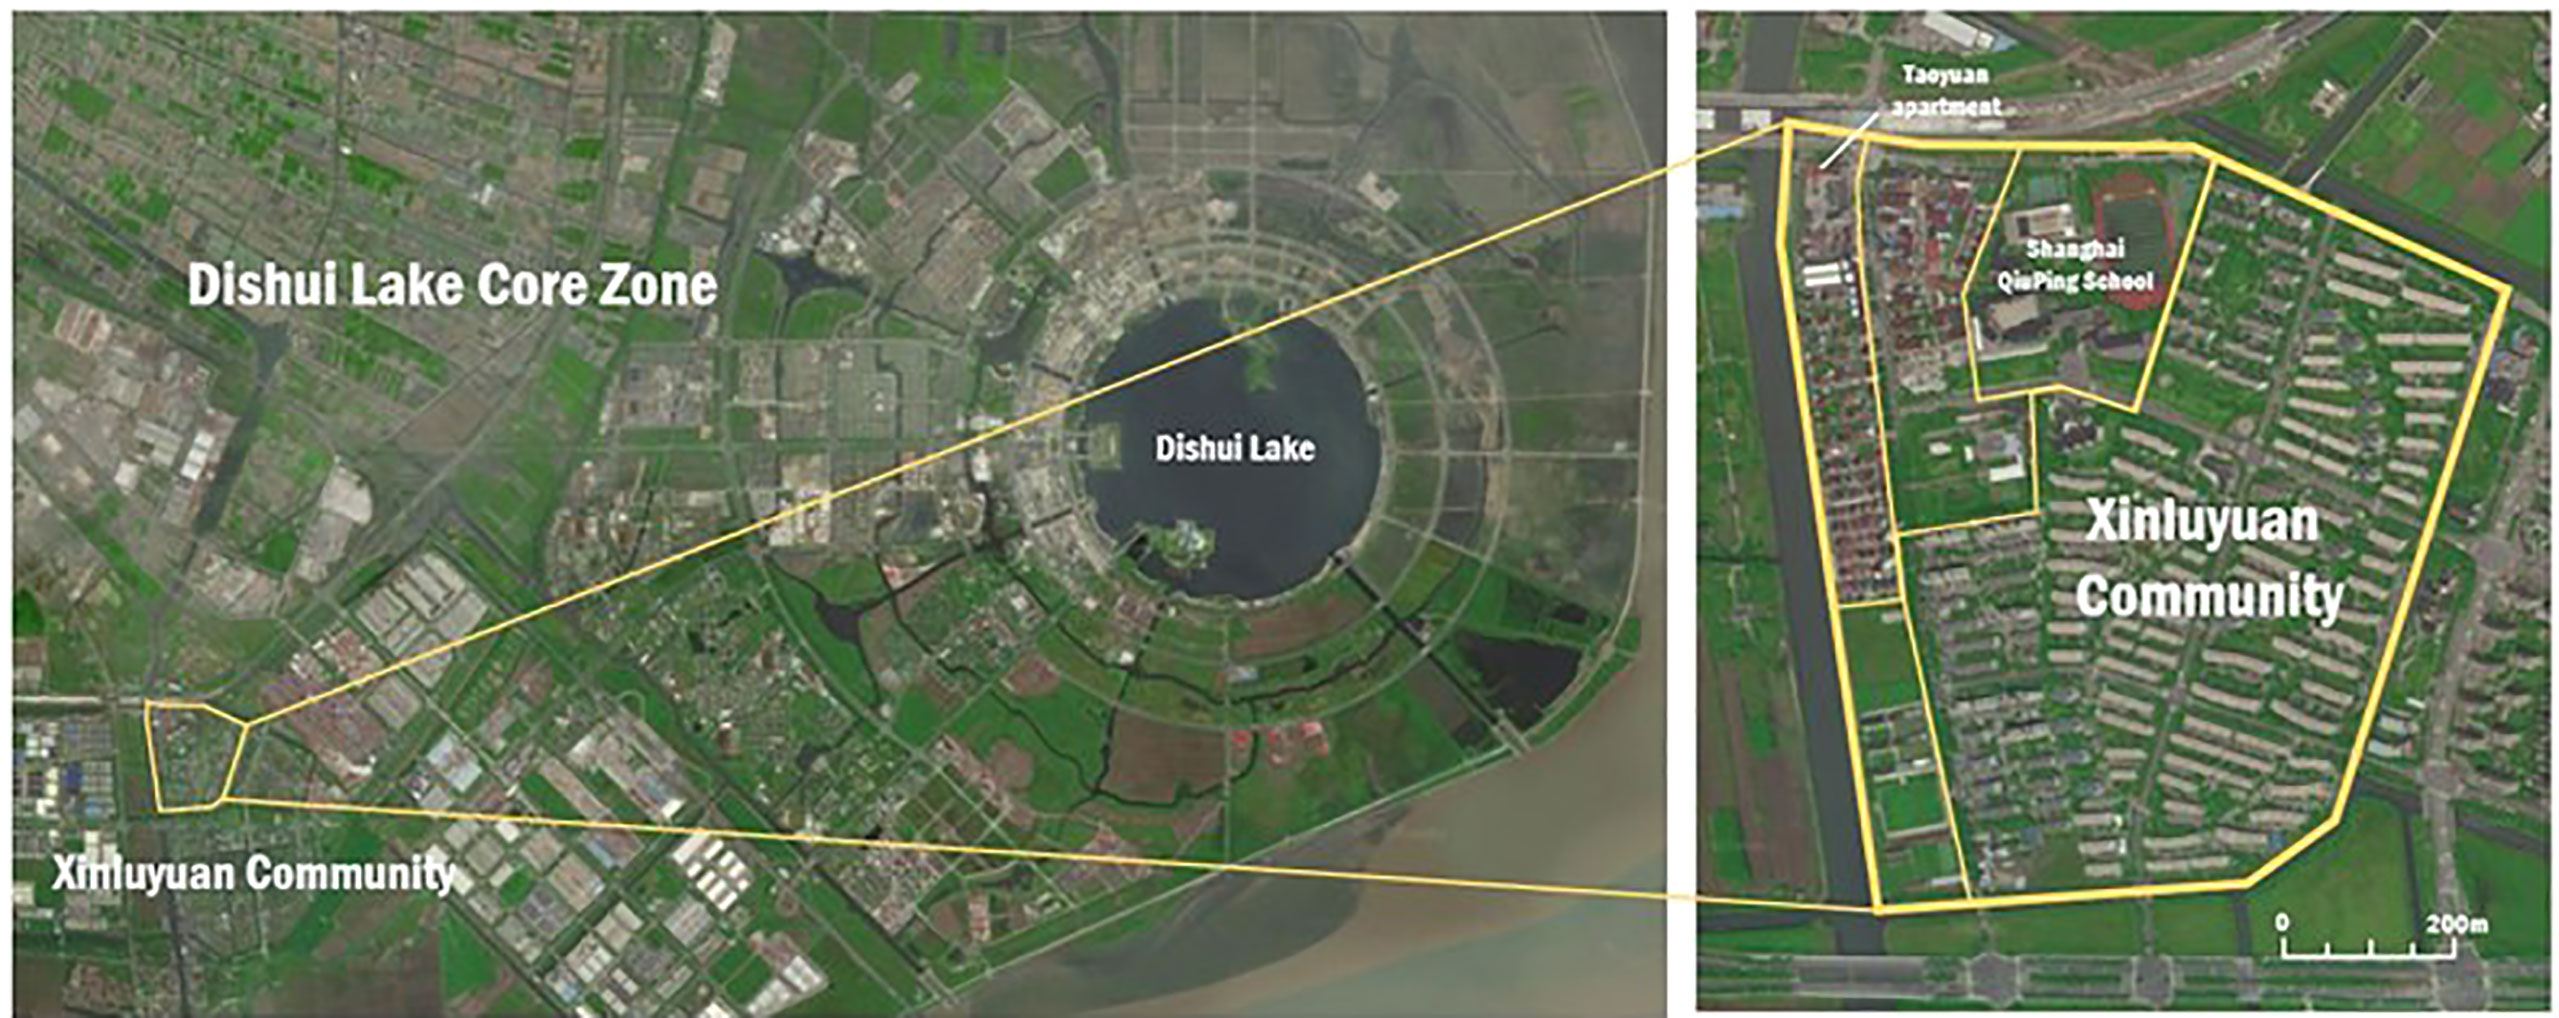
Figure 1 Study area.
Three strategies (gray infrastructure strategy, green-gray infrastructure strategy, and green-gray-blue infrastructure strategy) were set to construct an urban stormwater management model, as shown in Figure 2. The gray infrastructure strategy consists of a stormwater pipe network, where precipitation is discharged directly through the stormwater drainage network after the confluence with sub-catchments. The green-gray infrastructure strategy combines a stormwater pipe network and green infrastructure, including a series of green infrastructures such as rain gardens, green roofs, infiltration trenches, and permeable pavements in sub-catchment areas. The green-gray-blue infrastructure strategy consists of green infrastructure, gray infrastructure, and urban rivers. Multiple groups of RWLs were set to analyze the phenomenon of river backwater jacking at the outlet of the drainage network and their operation effect on the urban drainage system.
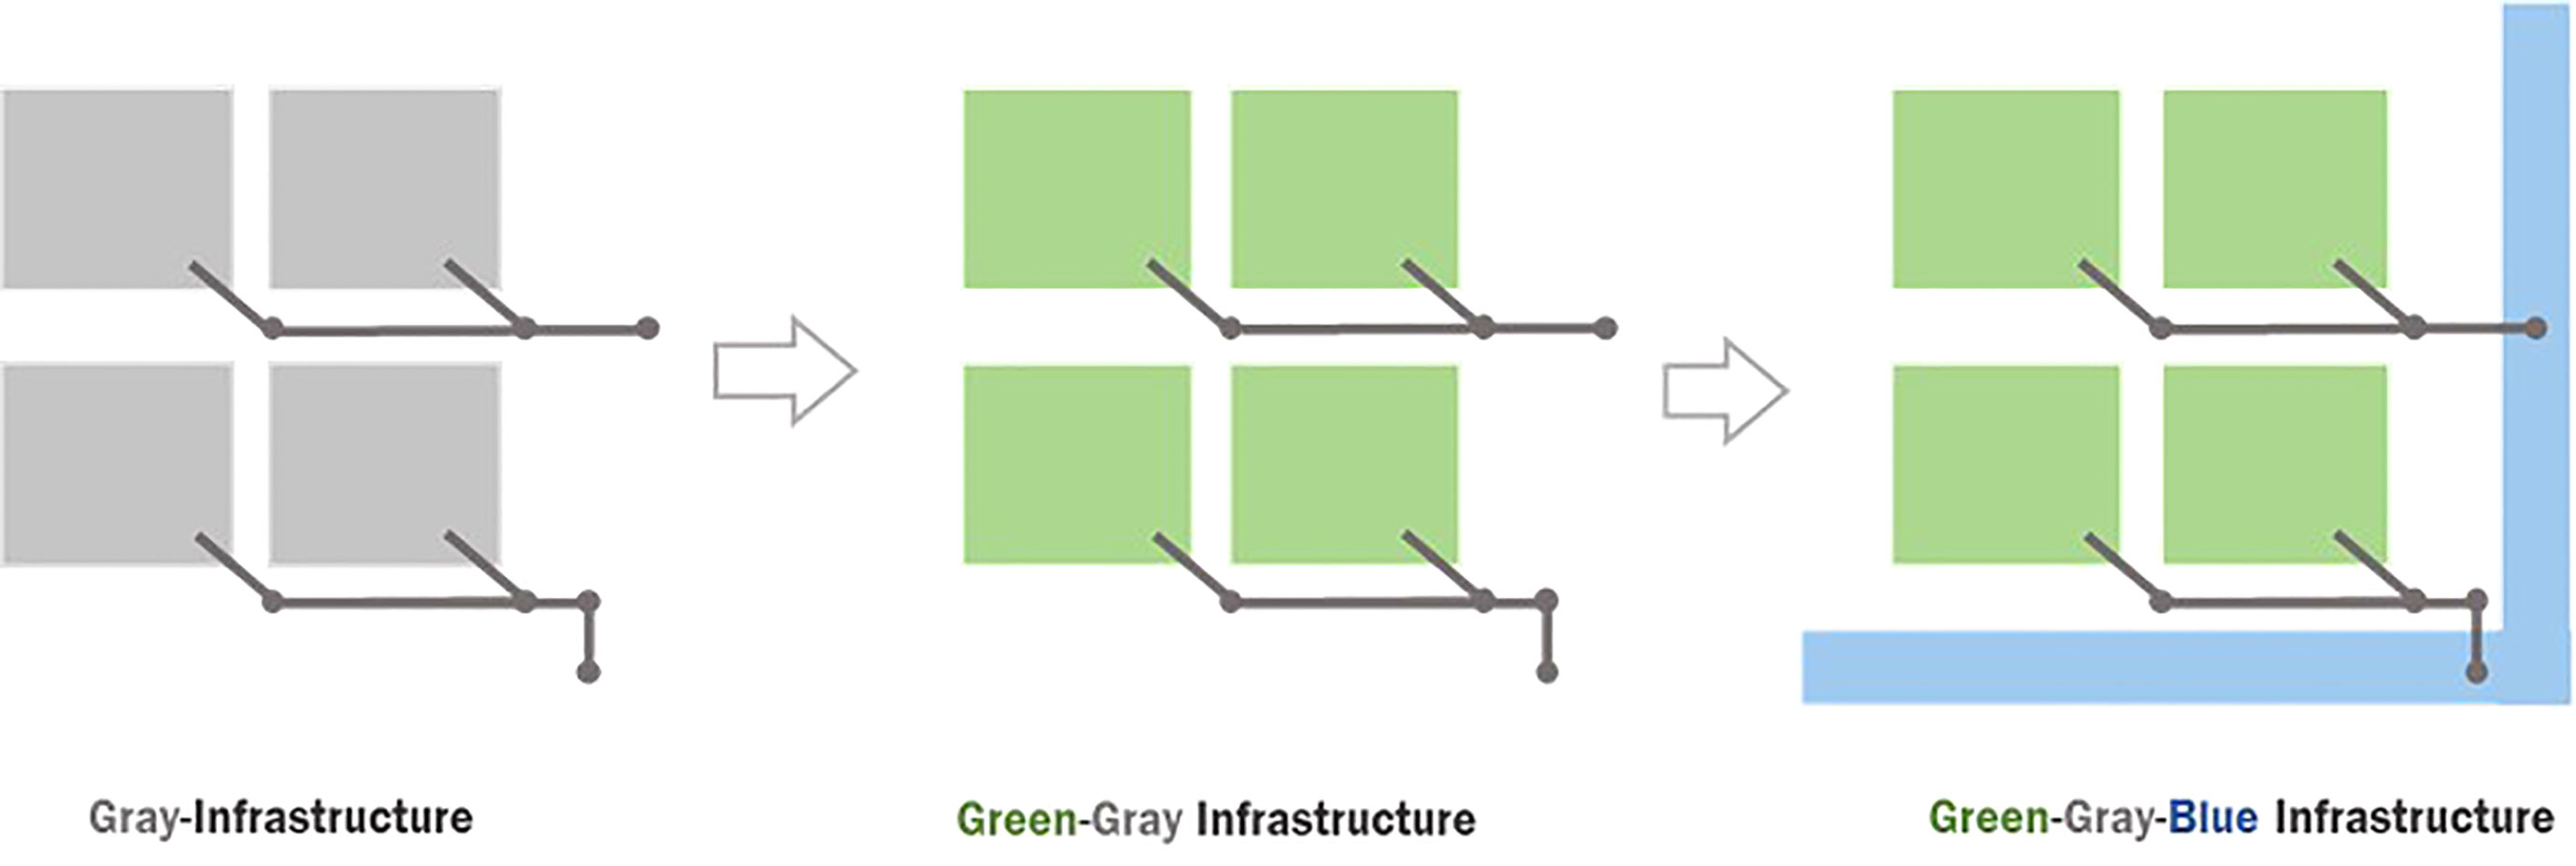
Figure 2 Three strategies of urban stormwater infrastructure.
The technology roadmap is shown in Figure 3, and the specific research process is as follows:
1. Data collection. Basic information, such as regional overview, land use, DEM, geophysical exploration data of stormwater drainage network, sponge city construction distribution, and river data of the study area, was first collected from the local administration department. Rainfall events and corresponding pipeline flow data are derived from real-time monitoring.
2. Model construction. The rainfall-runoff process of the study area was constructed using US EPA Storm Water Management Model (SWMM), and the initial conditions were set according to the basic conditions of the study area, and the model parameters were determined by using the measured rainfall and the corresponding measured pipe flow.
3. Result analysis. The performance of the three infrastructure strategies was simulated, and evaluation indexes of the urban drainage system under different infrastructure scenarios were comparatively analyzed.
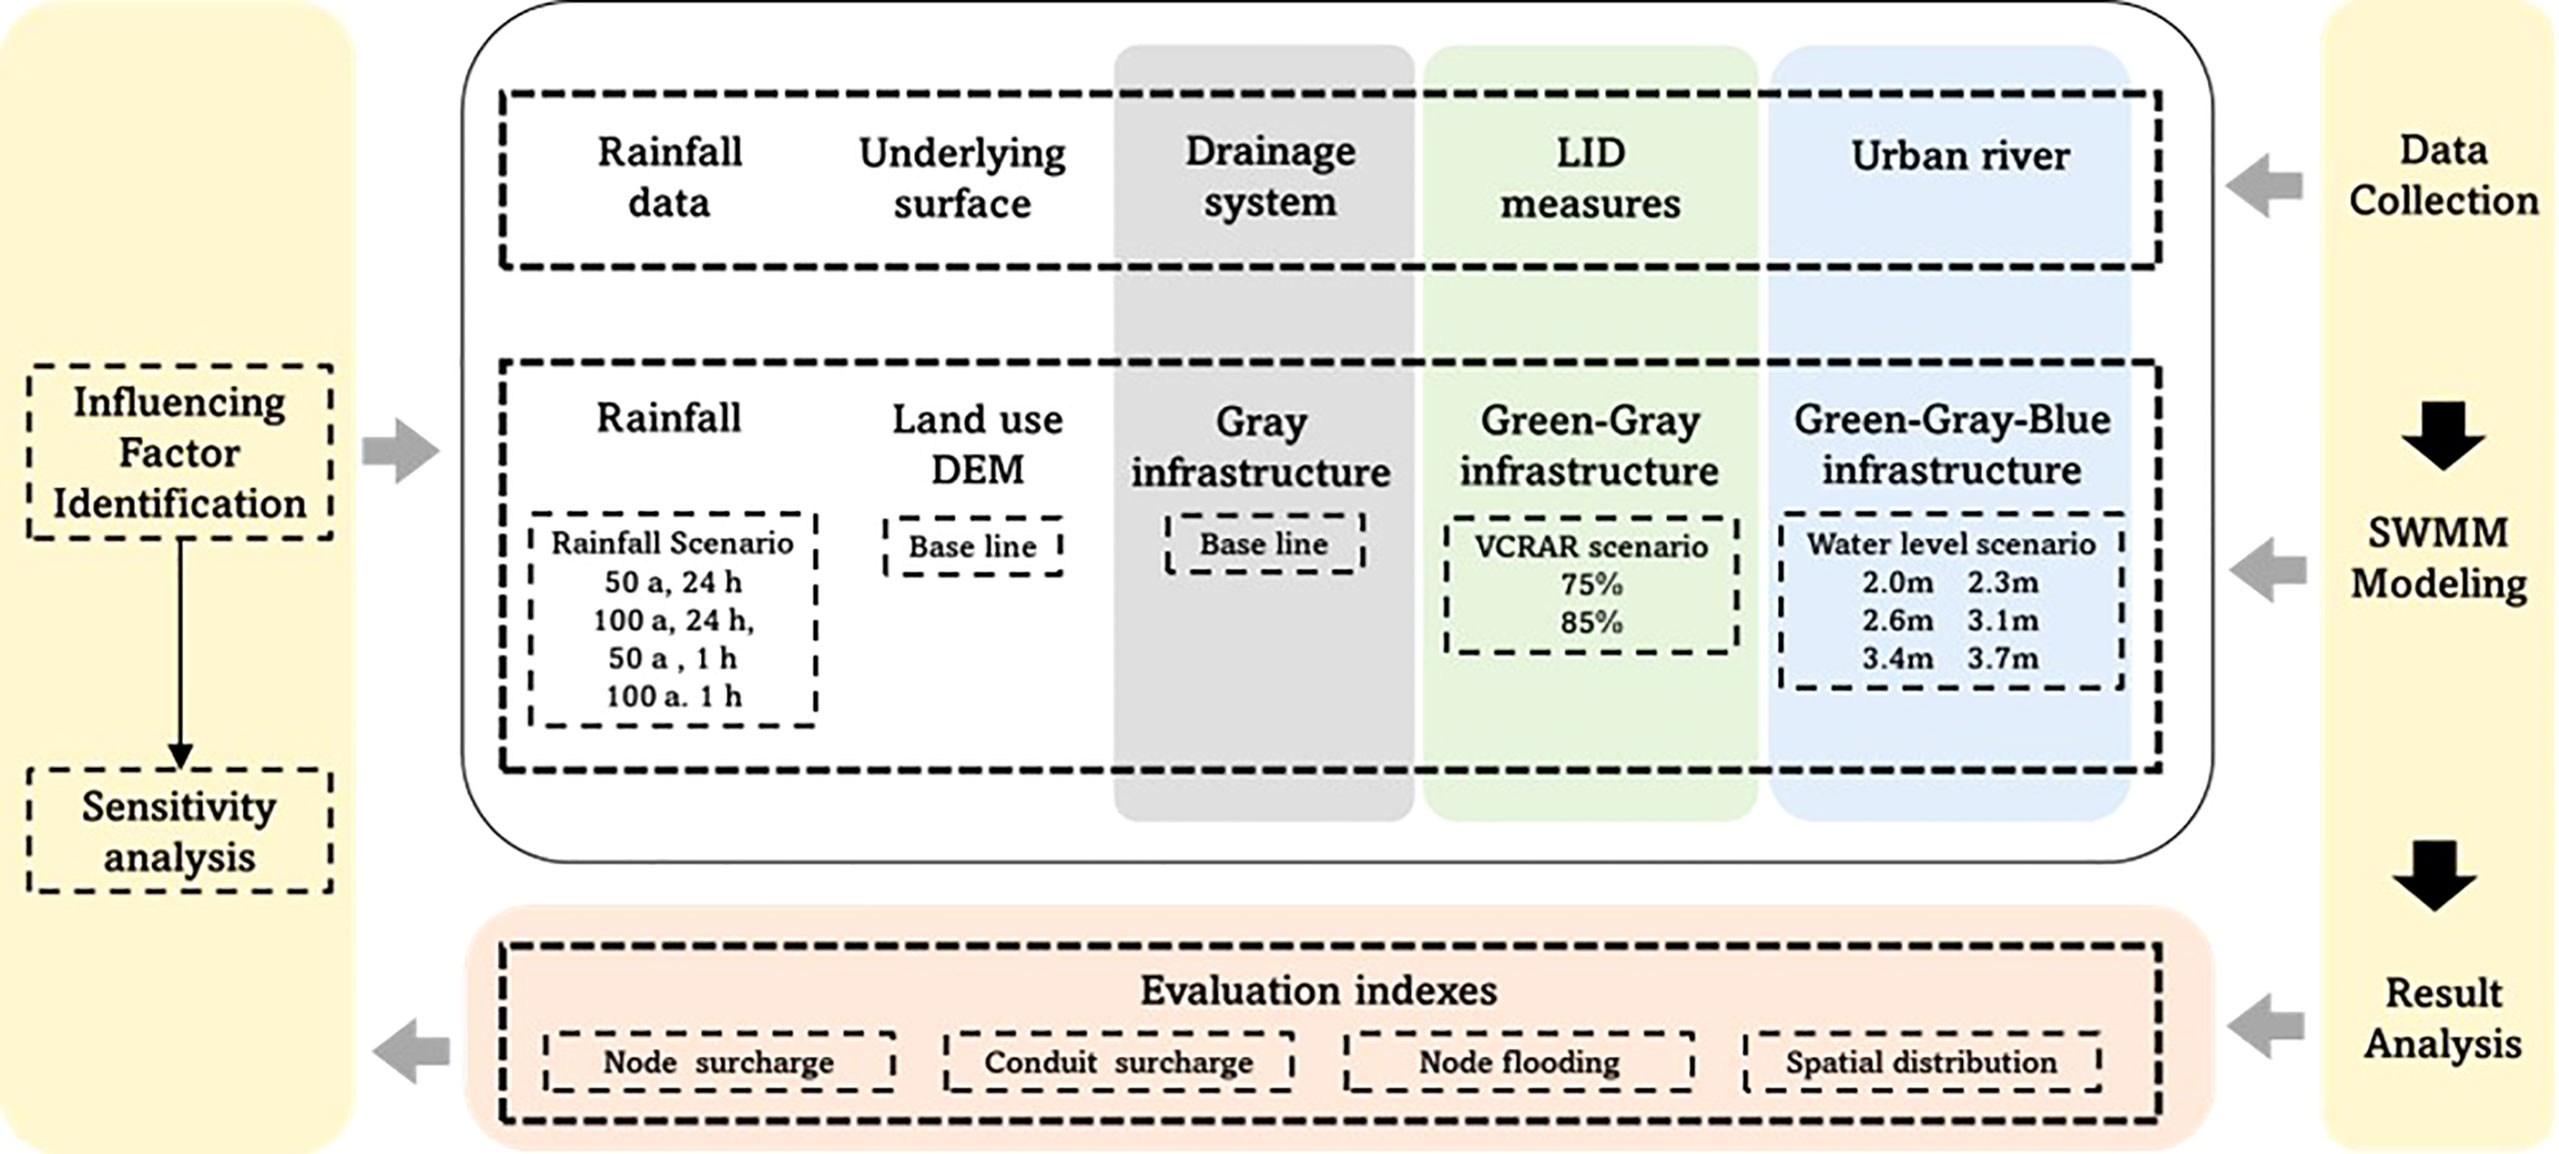
Figure 3 Technology roadmap.
The study area was divided into 31 sub-catchments. The total length of the stormwater drainage network in the study area is 4,128 m, with 78 nodes, 86 conduits, and 7 gravity outfalls discharging into the urban river. The local government has carried out green infrastructure construction in the study area in recent years. The sub-catchment and the green infrastructure construction are shown in Figure 4A, and the elevation map of the drainage network is shown in Figure 4B.

Figure 4 SWMM model basic data of study area. [(A) The sub-catchment and the green infrastructure construction; (B) The elevation map of the drainage network].
For scenario analysis, 1-hour rainfall with a 50-year return period (50 a, 1 h), 1-hour rainfall with a 100-year return period (100 a, 1 h), 24-hour rainfall with a 50-year return period (50 a, 24 h), and 24-hour rainfall with a 100-year return period (100 a, 24 h) were chosen, with precipitation of 88.81 mm, 98.09 mm, 245.61 mm, and 279.1 mm, respectively. The rainfall patterns are shown in Figure 5.
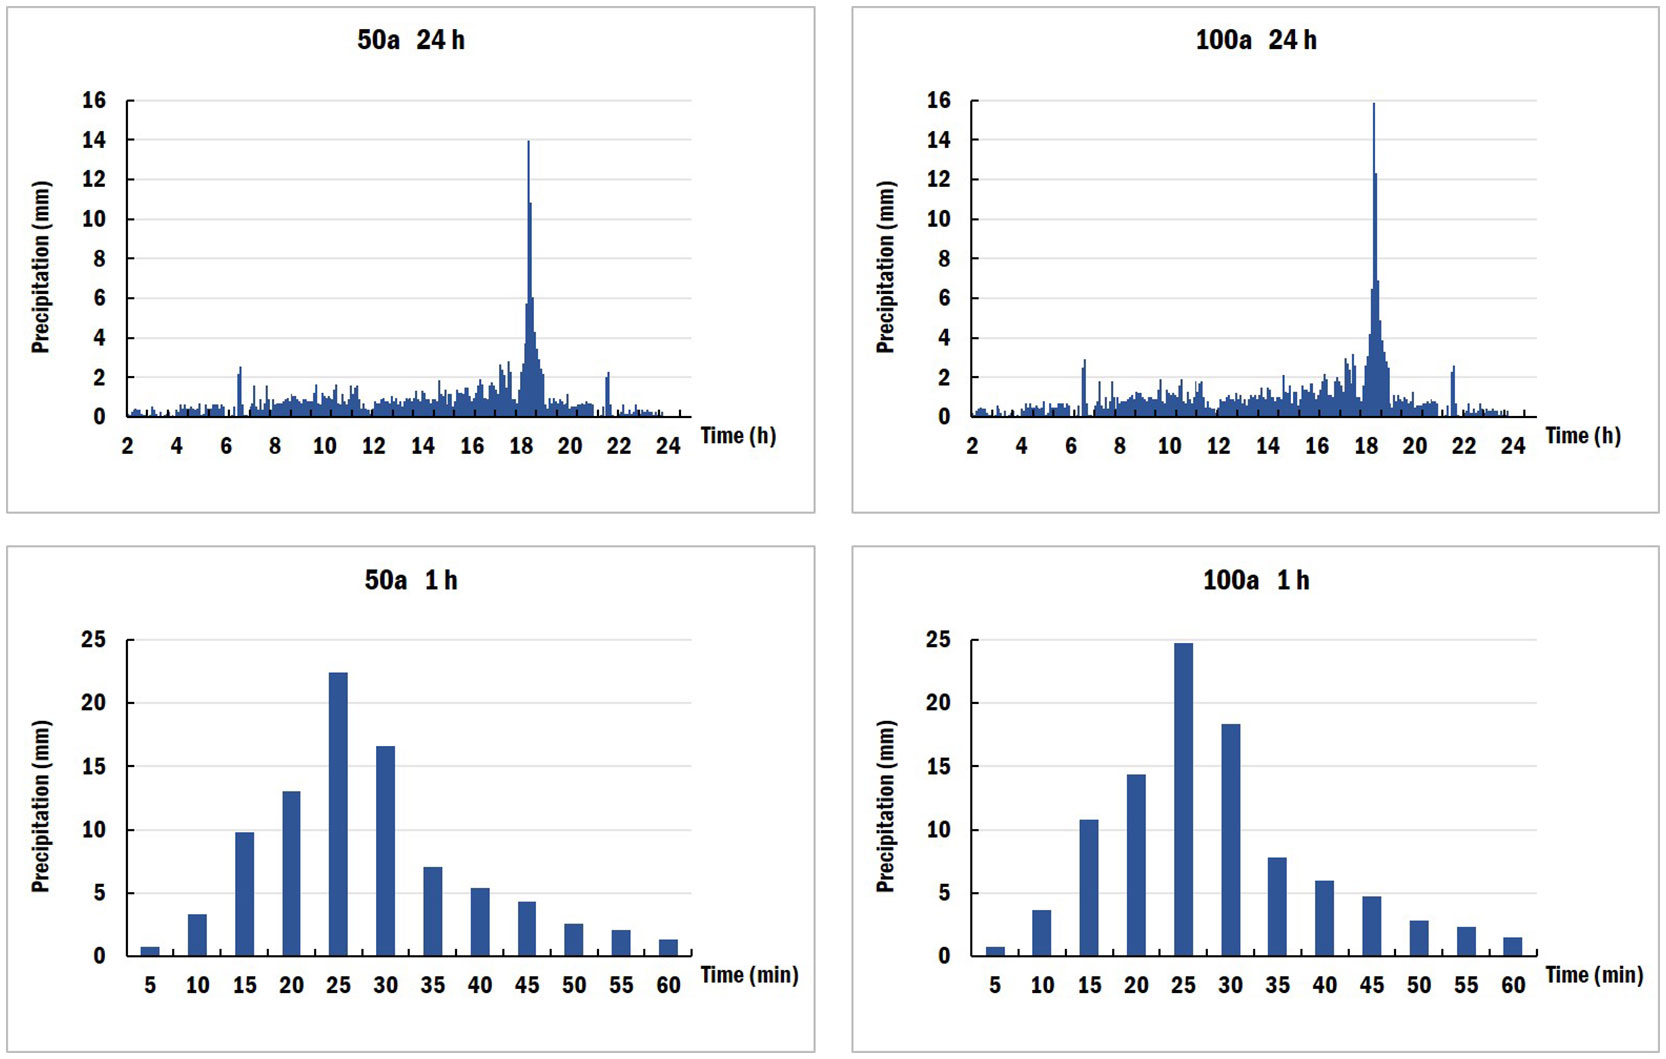
Figure 5 Design rainfall data.
The model parameters were set regarding the SWMM model user’s manual (Rossman, 2015), and the surface slope and drainage system parameters were taken according to the actual topography. The basic parameters of the study area and the parameters setting of green infrastructure are shown in Table 1.
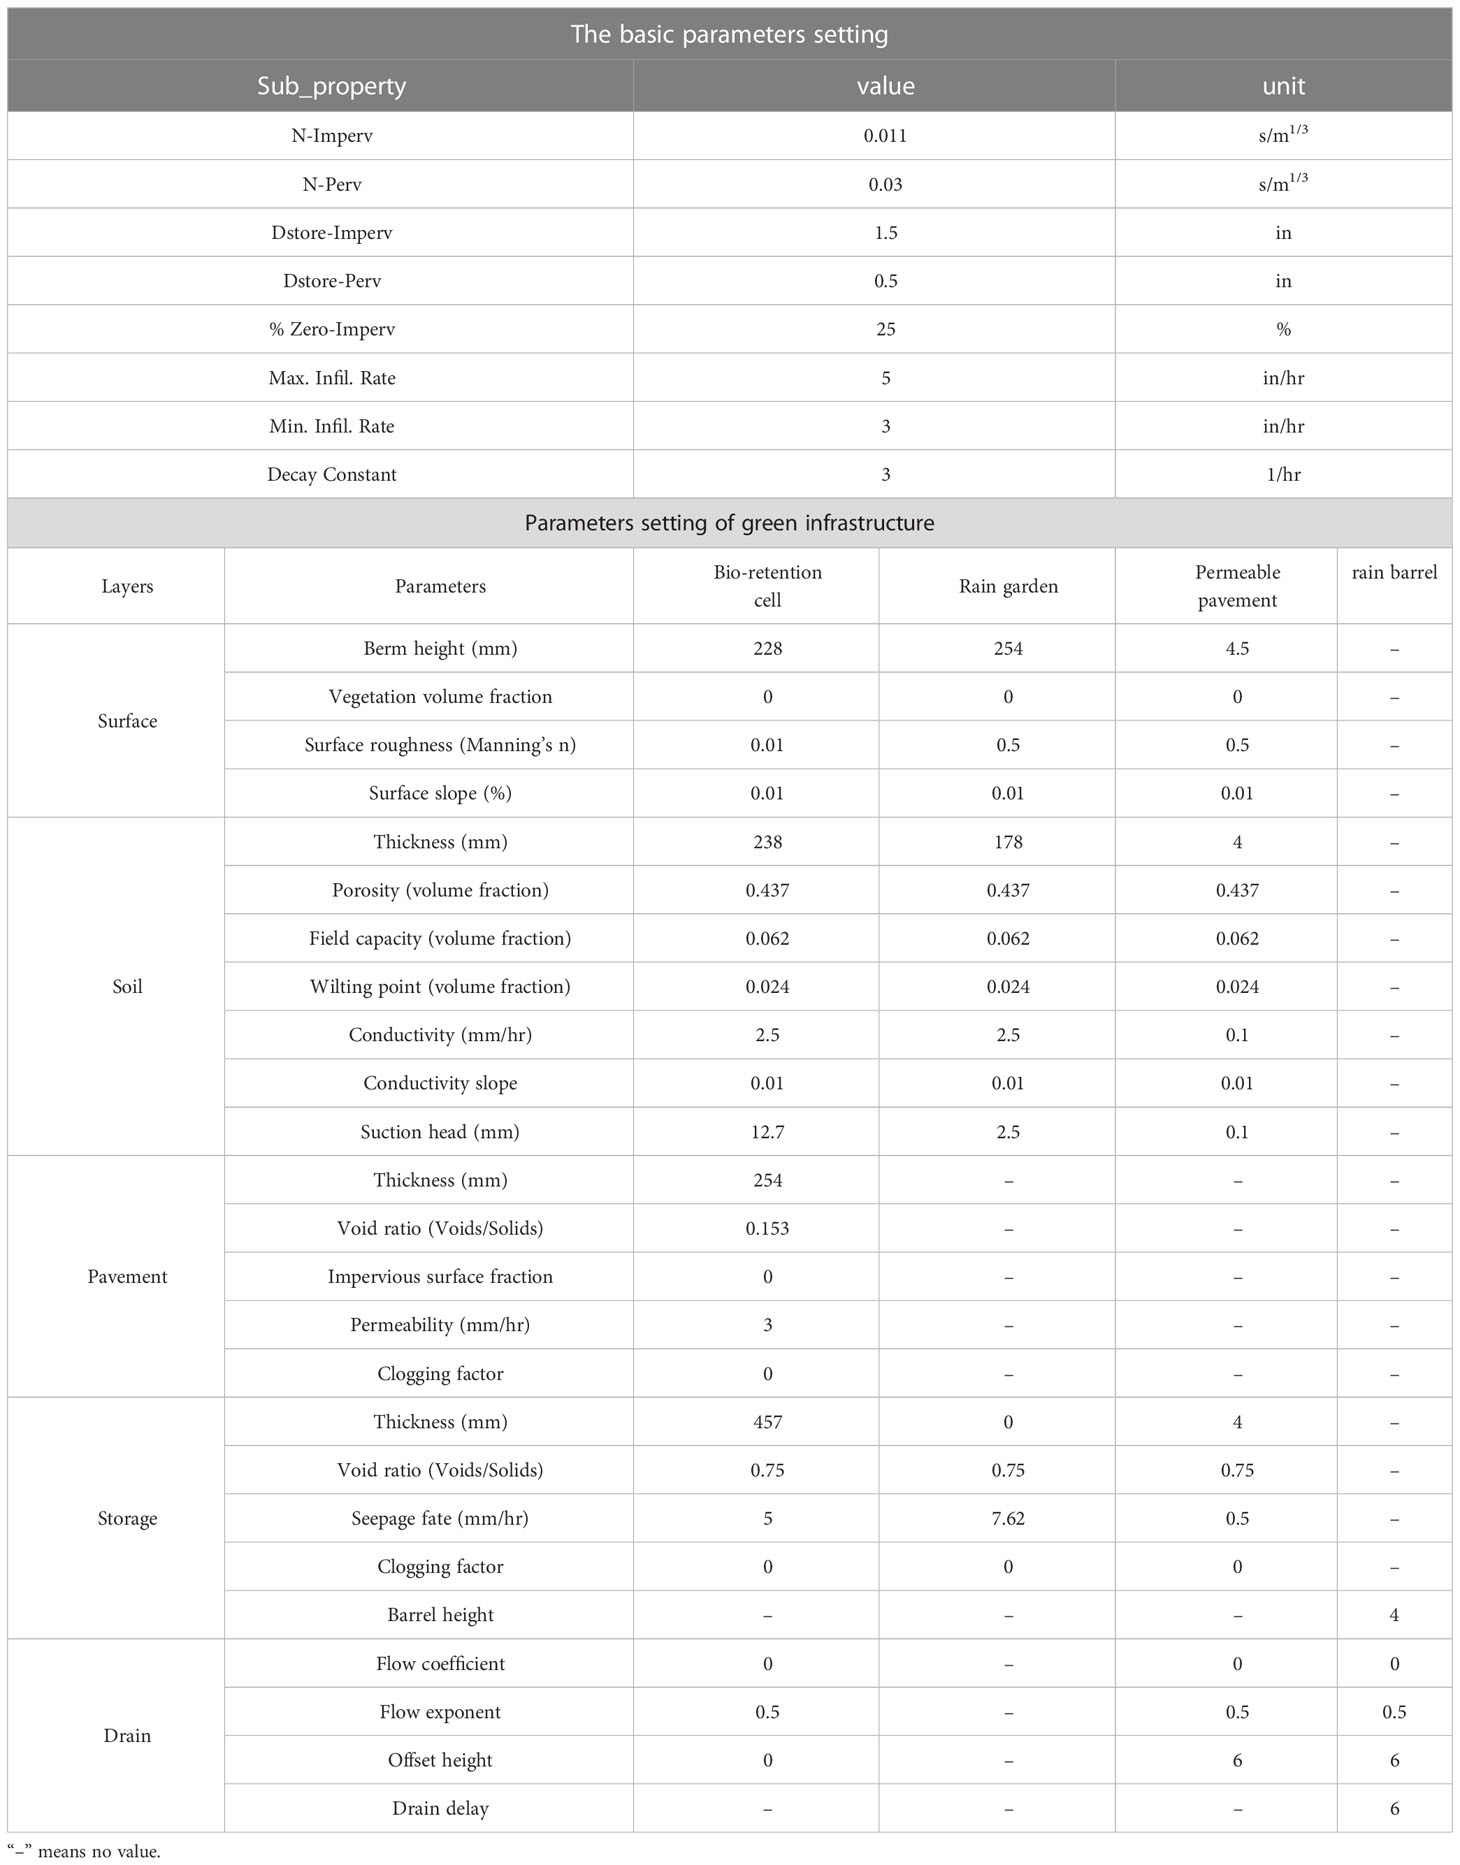
Table 1 Parameters setting of the study area.
The parameters were calibrated using the precipitation data of 9 August 2019 (Super Typhoon Lekima with 24h precipitation of 151.2 mm), and the real-time monitoring data of pipe flow in the sub-catchment area. The precipitation data and monitored pipe flow data on 29 June 2019 (24h precipitation of 104.2 mm) were selected to validate the parameter rate determination results. The Nash–Sutcliffe efficiency coefficient (NSE) was used to evaluate the reliability of the model, calculated by Eq.(1) (Escobar-Ruiz et al., 2019).
Where Si is the simulation at the time i; Oi is the observed measurement at time i; and is the mean of the observed measurements. Please confirm whether the edits made to the sentence are accurate.
The scenarios of green infrastructure were set according to the volume capture ratio of annual rainfall (VCRAR). VCRAR is a design standard of green infrastructure proposed by the Chinese sponge city strategy, which usually corresponds to water quality volume (WQV). The effect of different scales of green infrastructure on the runoff regulation function of the traditional gray infrastructure-based urban drainage system was analyzed. VCRAR was calculated by Eq.(2) (MHURDPRC, 2014).
Where VCRAR is the volume capture ratio of annual rainfall, %; Pd is the annual rainfall discharged from the study area, mm; and P is the annual rainfall of the study area, mm.
The minimum and maximum limits of the VCRAR in the study area are 75% and 85% based on the guidelines of the sponge city strategy, which were selected in this study to set the green infrastructure scenarios. The design rainfall corresponding to VCRAR can be obtained based on the statistical method. The design storage capacity volume of green infrastructure is generally calculated using the volumetric method, as shown in Eq.(3).
Where, V is the design storage capacity volume, m3; H is the design rainfall under different VCRAR, mm; φ is the integrated runoff coefficient; and F is the catchment area, m2.
The design storage capacity volume is allocated according to the area of each sub-catchment, and the four green infrastructure measures of permeable pavement, rain garden, bio-retention cell, and rain barrel were arranged in the SWMM model. The scenario setting of green infrastructure measures referred to the existing sponge city layout in the study area. Green infrastructure scenarios under 75% and 85% VCRAR are shown in Figure 6. The design rainfall under VCRAR 75% is 22.44mm, and the design rainfall under VCRAR 85% is 32.96mm.
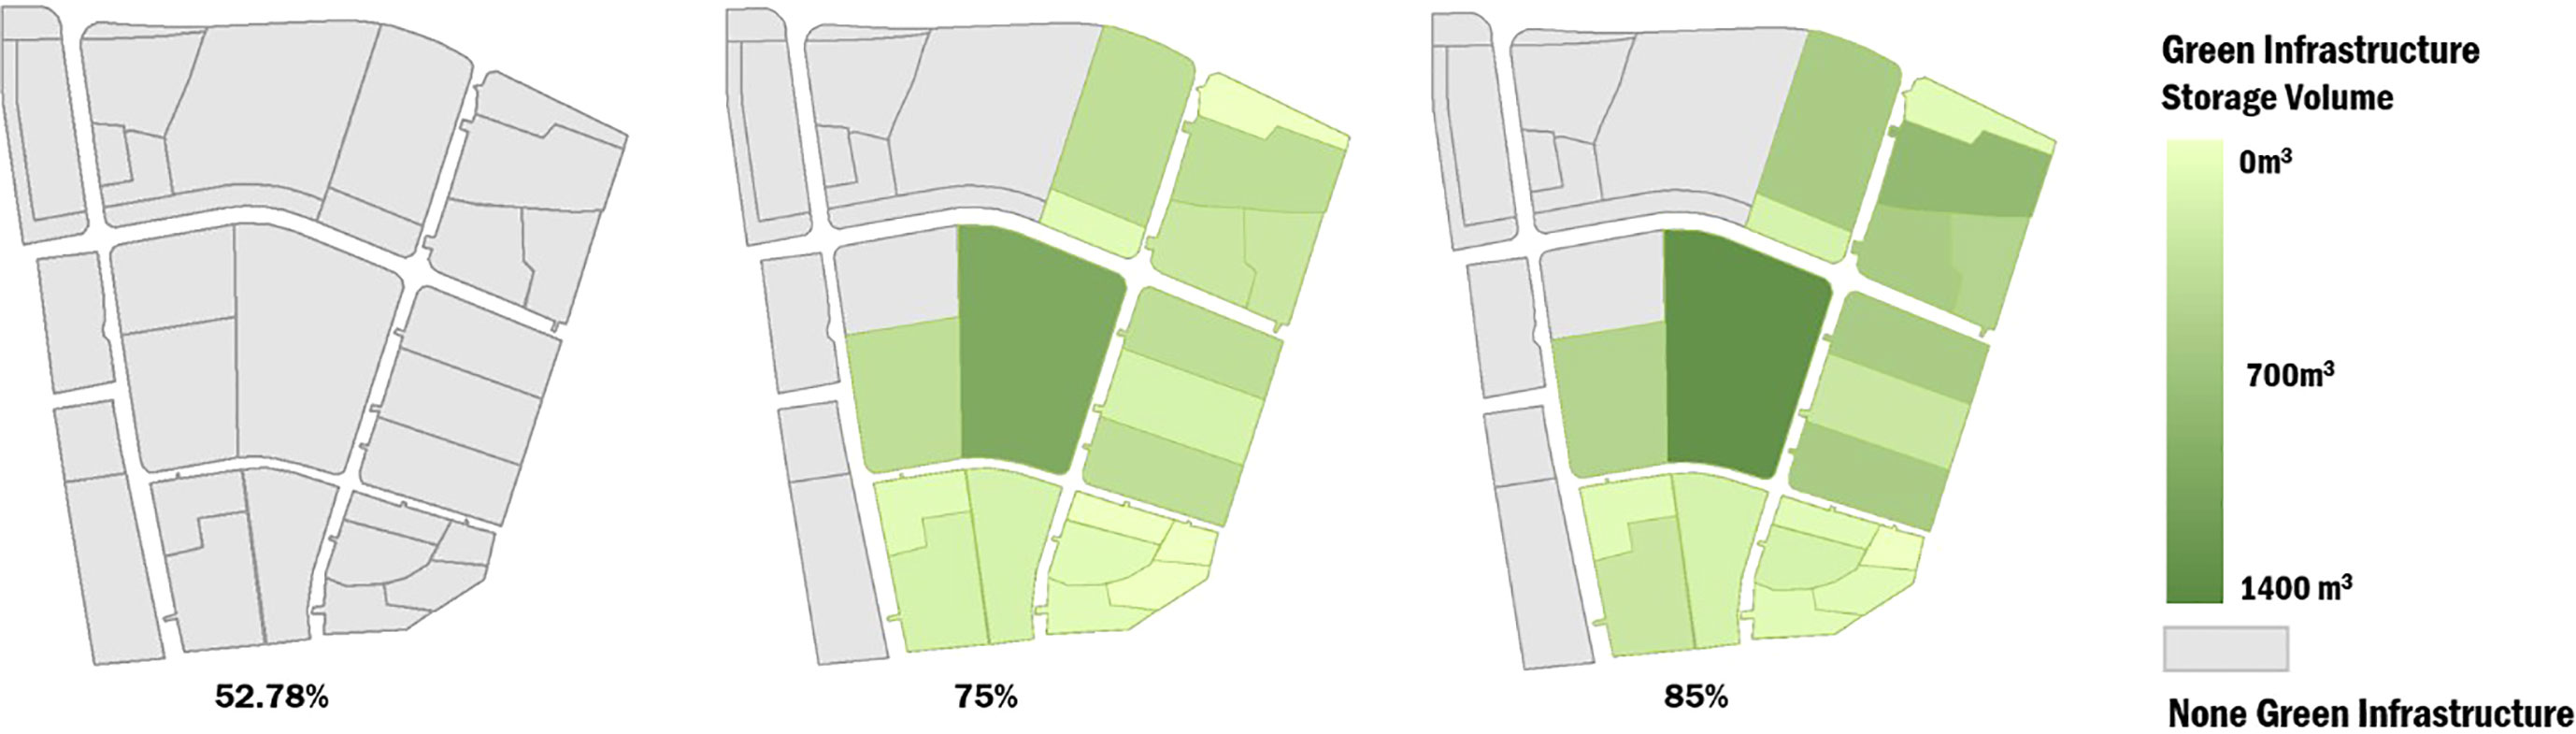
Figure 6 Green infrastructure spatial distribution under different VCRAR.
The ordinary water level of the rivers around the old city of Shanghai Lin-gang District is 2.6 m, and the water level fluctuates between 2 m and 3.75 m. The water level of the rivers was set from 2.0 m to 3.4 m in this study. The outlet of the pipe network to the river in the SWMM model is set to be a tidal outlet, which is used to simulate the impact of different RWL boundary conditions on the urban drainage system. The power wave method is used to simulate the operation effect of the pipe network under different RWL conditions.
The number and duration of node surcharges, the number and duration of conduit surcharges, the number and volume of node flooding, and the corresponding spatial distribution were selected as the evaluation indexes to evaluate the performance under different parameters of the three strategies. The number of node surcharges and conduit surcharges was obtained directly from the simulation results. The mean duration of node surcharge and conduit surcharge was calculated using Eq. (4).
Where is the mean duration, h; ti is the duration of each element, h; m is the number of the surcharge or flooding elements; and n is the total number of nodes or conduits.
The total node flooding volume was calculated using Eq. (5).
Where v is the total node flooding volume, m3 and vi is the flooding volume of each node, m3.
The calibration and validation results of sub-catchments No.3 and No.24 are shown in Figure 7. The Nash coefficients of calibration results for sub-catchments No.3 and No.24 are 0.72 and 0.78, respectively. The Nash coefficients of the validation results for sub-catchments No.3 and No.24 achieved 0.94 and 0.79, respectively, which met the simulation requirements.
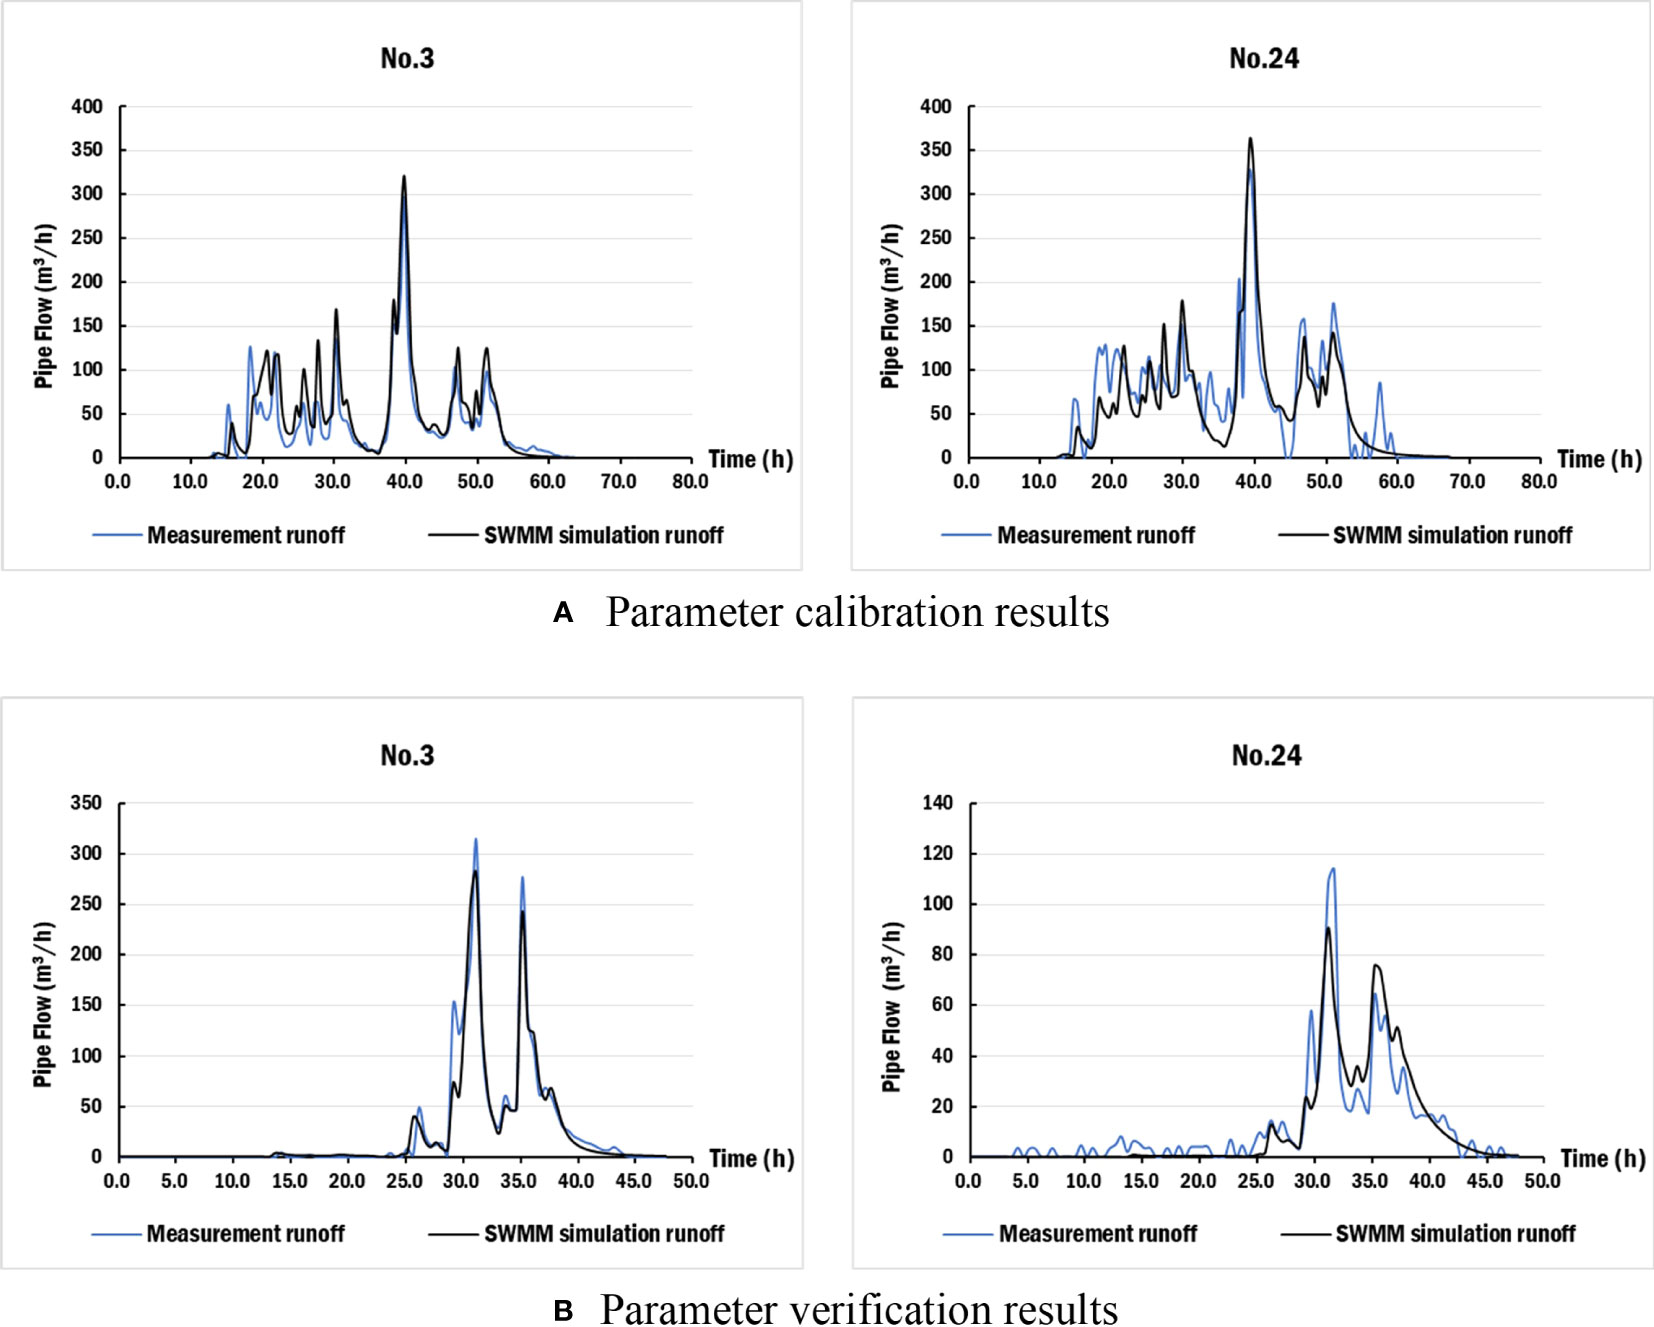
Figure 7 Parameter calibration and verification results. [(A) Parameter calibration results; (B) Parameter validation results].
The ordinary water level was used as the river level boundary condition; the calculation results of the gray infrastructure strategy are shown in Figure 8. Taking extreme rainfall (100a, 24h) as an example, there were 49 nodes surcharged and 67 conduits surcharged, and 15 nodes and 15 conduits overloaded for more than 10 h. The surcharge situation was mainly distributed in the southeast direction of the drainage, near the outlet and the intersection of the drainage. The mean duration of nodes surcharge and conduit surcharge was 12.84 h and 7.78 h, respectively. Five nodes experienced flooding, with a total node flooding volume of 154.57 m3.
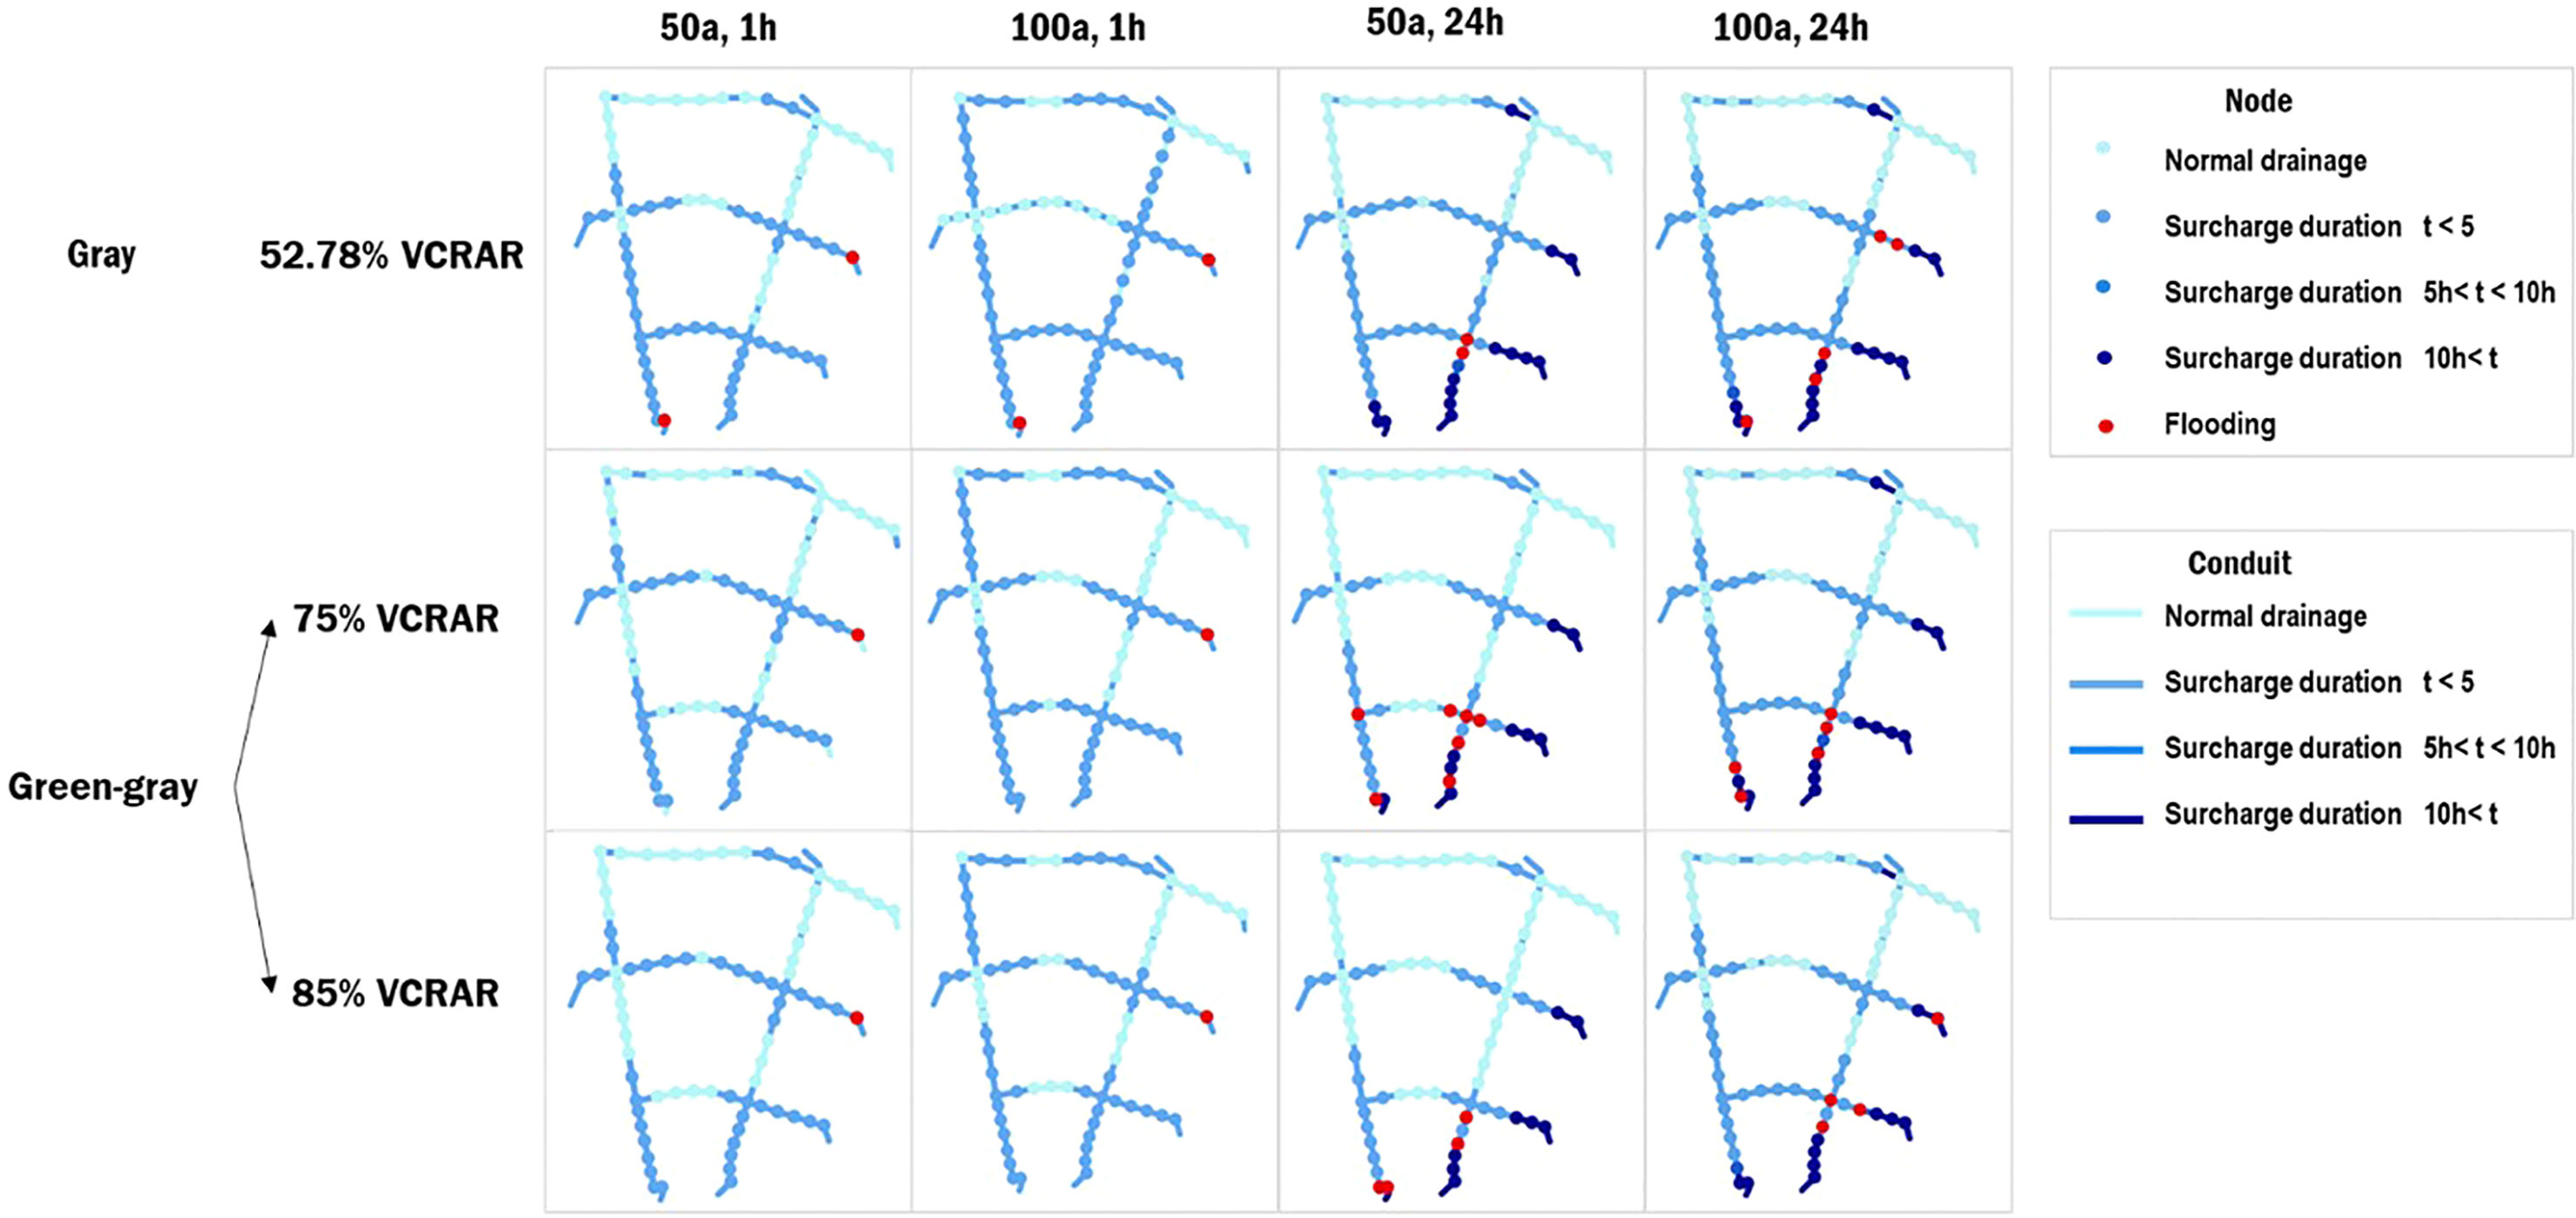
Figure 8 Drainage performance under gray and green-gray infrastructure strategy.
The ordinary water level was used as the river level boundary condition; the calculation results of the green-gray infrastructure strategy are shown in Figure 8. Taking extreme rainfall (100a, 24h) as an example, under the conditions of 75% and 85% VCRAR, there were 48 and 47 nodes surcharged and 67 and 66 conduits surcharged, respectively. The number of nodes and conduits with surcharge duration longer than 10 h decreased to 14 and 11, respectively. There was still a certain amount of surcharged nodes and conduits. The distribution of surcharged nodes was more dispersed. Under the condition of 75% VCRAR, the mean duration of nodes surcharge and conduits surcharge was 8.63 h and 7.78 h, respectively. Under the condition of 85% VCRAR, the mean duration of nodes surcharge and conduits surcharge was 7.03 h and 6.99 h, respectively. Under the conditions of 75% and 85% VCRAR, the total node flooding volume decreased to 131.83 m3 and 127.29 m3, respectively. There were still five and four node floodings occurring in the study area under the conditions of 75% and 85% VCRAR.
The simulation results of the green-gray-blue strategy are shown in Figure 9. When the water level gradually decreased from the ordinary water level to 2.0 m, the number of node surcharges, conduit surcharges, and node flooding decreased significantly. When the water level dropped to 2.0 m, the number of node surcharges, conduit surcharges, and node flooding were 30, 45, and 1, respectively. There were no more nodes and conduits surcharged with a surcharge duration longer than 10 h. When the water level gradually increased from the ordinary water level to 3.7 m, the number of node surcharges, conduit surcharges, and node flooding increased significantly. When the water level was 3.7 m, the number of nodes surcharged and conduits surcharged was 77 and 86, respectively, for both the 75% and 85% VCRAR. When the water level was 3.7 m, the number of node flooding was 39 for both the 75% and 85% VCRAR. In terms of spatial distribution, the area where overload occurred was located in the southeast corner of the study area, and the range gradually increased with the rise of the RWL. Besides, the mean duration of node surcharge and conduit surcharge at the 2.0 m water level was 0.04 h, for both the 75% and 85% VCRAR. The mean duration of node surcharge and conduits surcharge at the 3.7 m water level was 45.52 h and 45.75 h, respectively, for both the 75% and 85% VCRAR. The total node flooding volume at the 2.0 m water level was 4.55 m3 for both the 75% and 85% VCRAR. The total node flooding volume at the 3.7 m water level was 390.96 m3 and 381.87 m3 for the 75% and 85% VCRAR, respectively. The rise of water level causes the river backwater jacking effect, which seriously affects the drainage capacity of urban drainage systems. Avoiding backwater jacking plays an important role in improving the drainage capacity of green-gray-blue infrastructure.
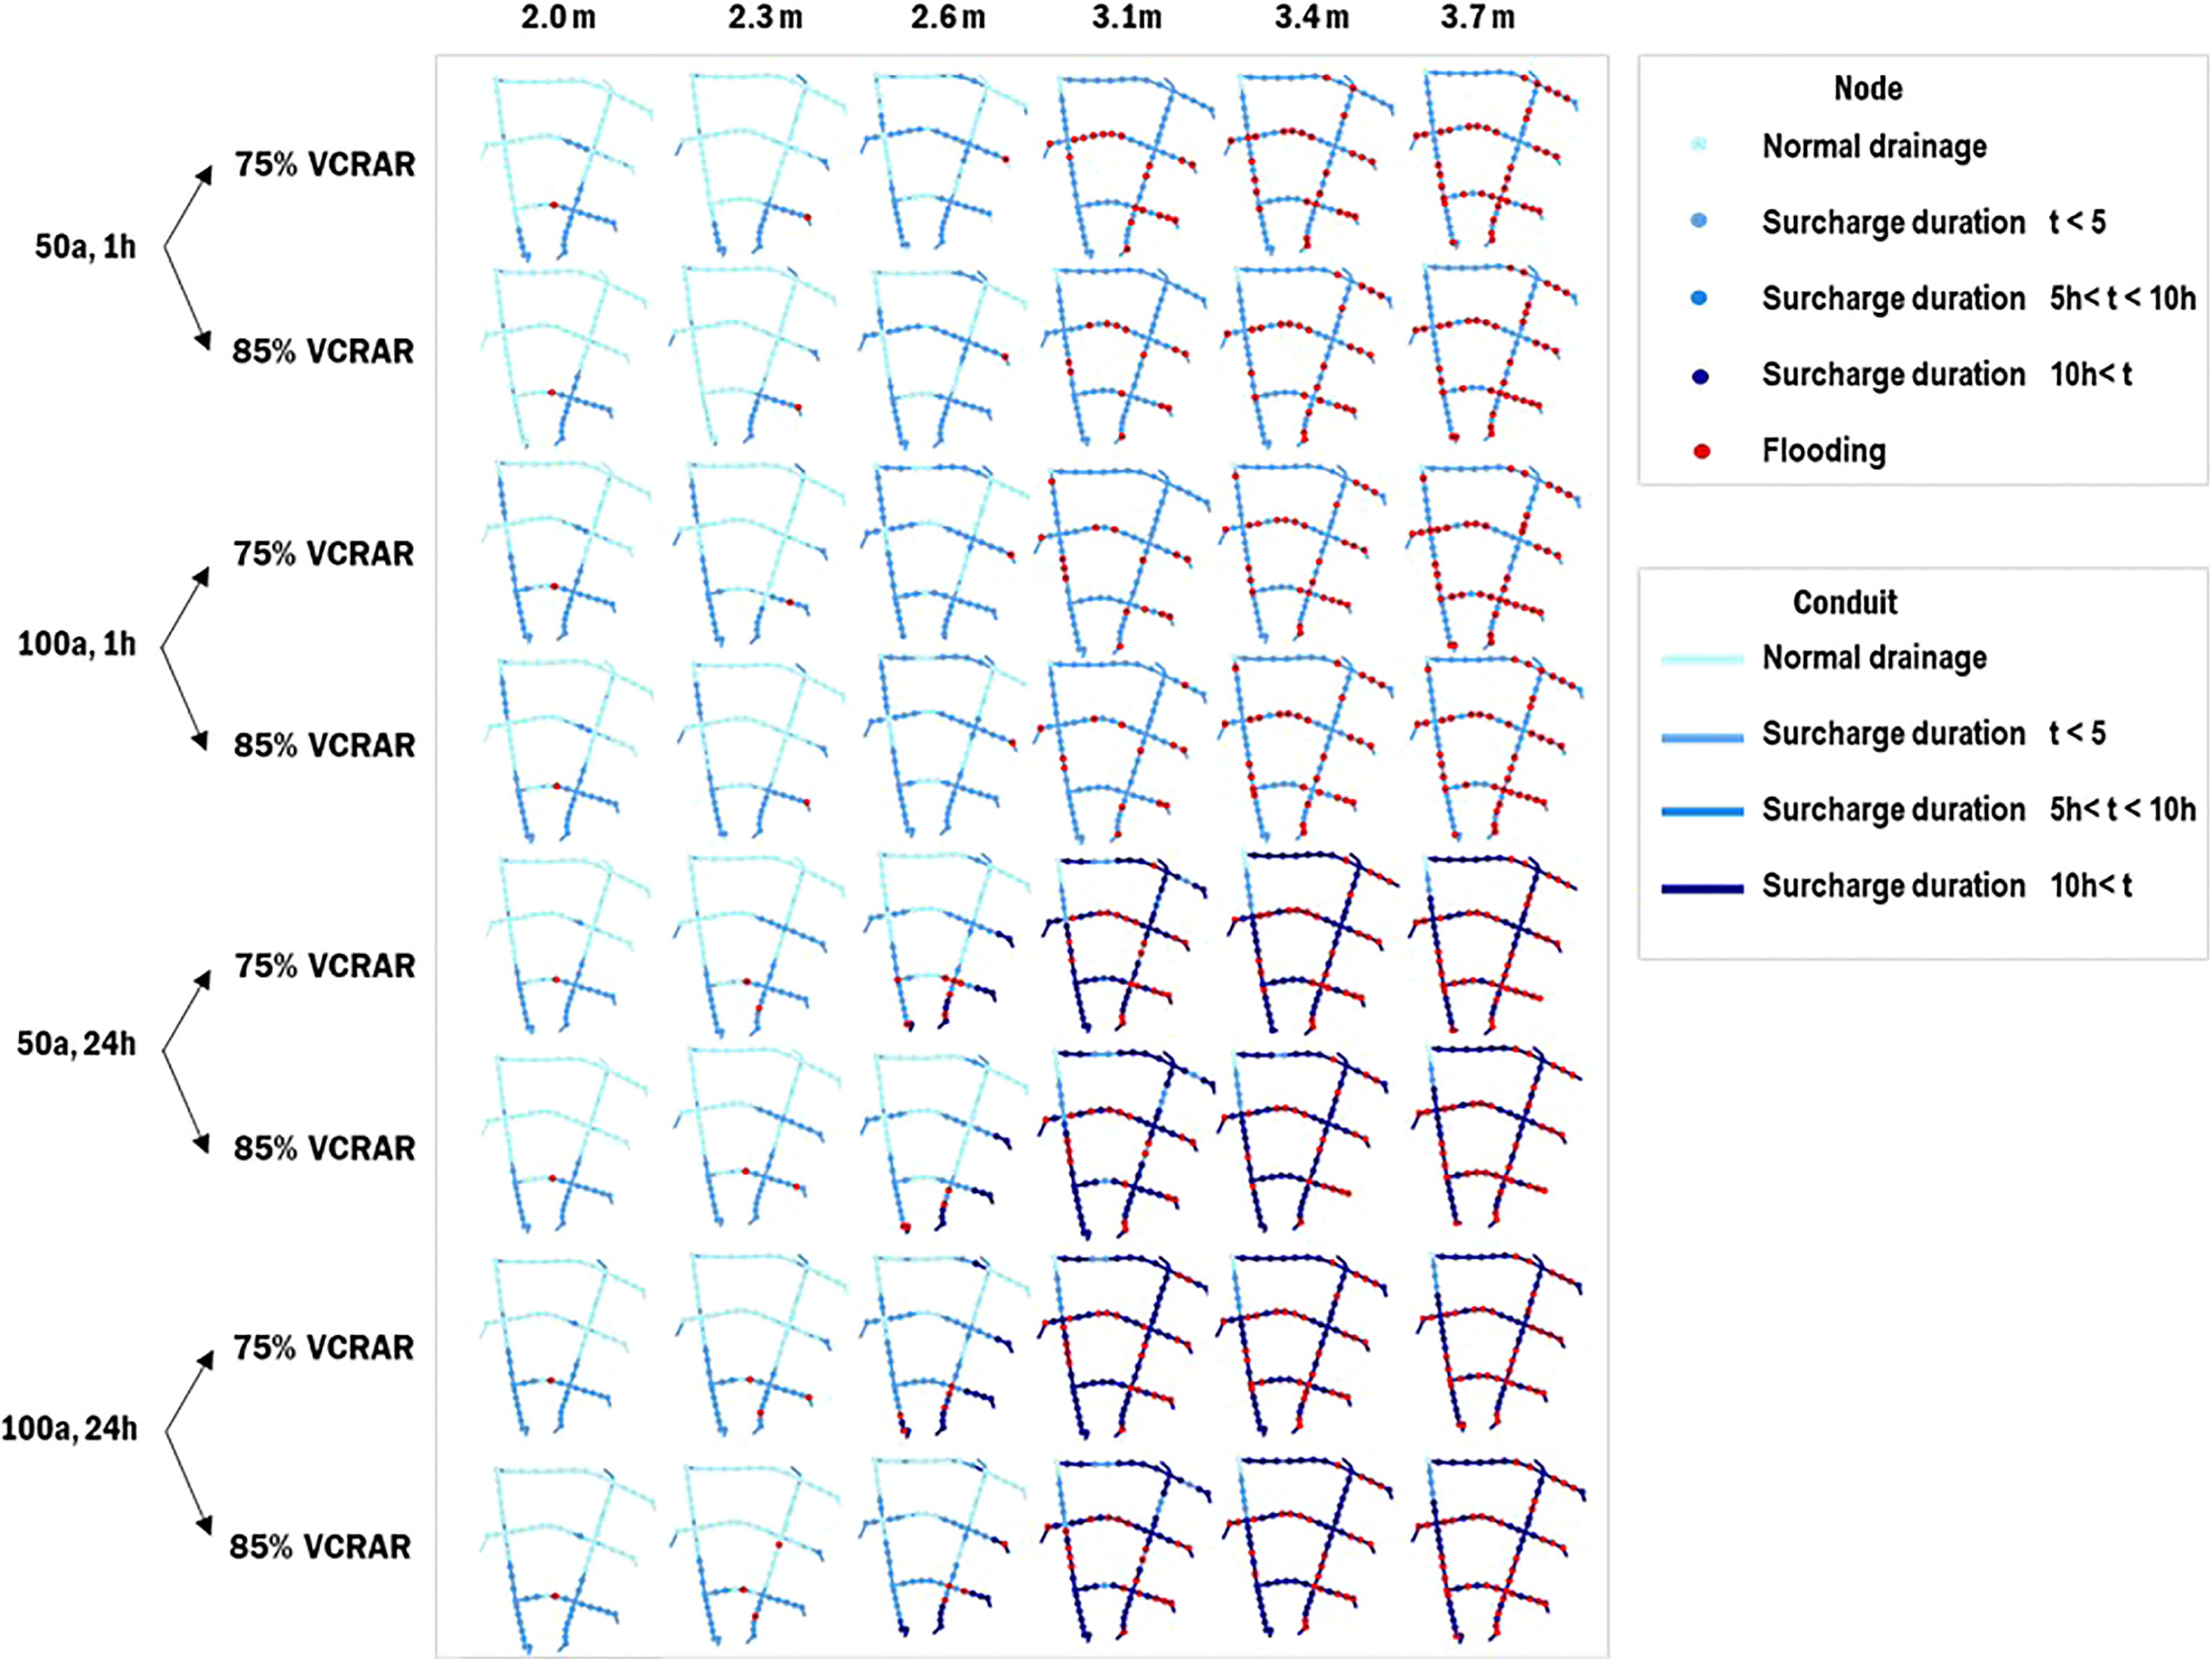
Figure 9 Performance of the drainage under green-gray-blue infrastructure strategy.
The number and duration of node surcharge, the number and duration of conduit surcharge, and the number and volume of node flooding were used as evaluation indexes to analyze the sensitivity of different facility parameters to the drainage performance of urban drainage systems. Facility parameters included the VCRAR of green infrastructure and the RWL of blue infrastructure. The sensitivity analysis result is shown in Figure 10. Under extreme rainfall conditions, the effect of different facility parameters on drainage performance was different, and the effect of RWL on drainage performance was greater than that of VCRAR. As shown in Figures 10A–D, the scenario simulation results at different VCRAR levels in the study area show that green infrastructure had a limited effect on drainage performance under extreme rainfall conditions. The number and mean duration of node and conduit surcharge, and flooding volume decreased with the increase of VCRAR, but not significantly. This is basically consistent with the results of previous studies (Qin et al., 2013). As shown in Figures 10E–H, the scenario simulation results at different RWL levels in the study area show that high water levels will lead to river backwater jacking effect, and seriously affect the drainage performance under extreme rainfall conditions.
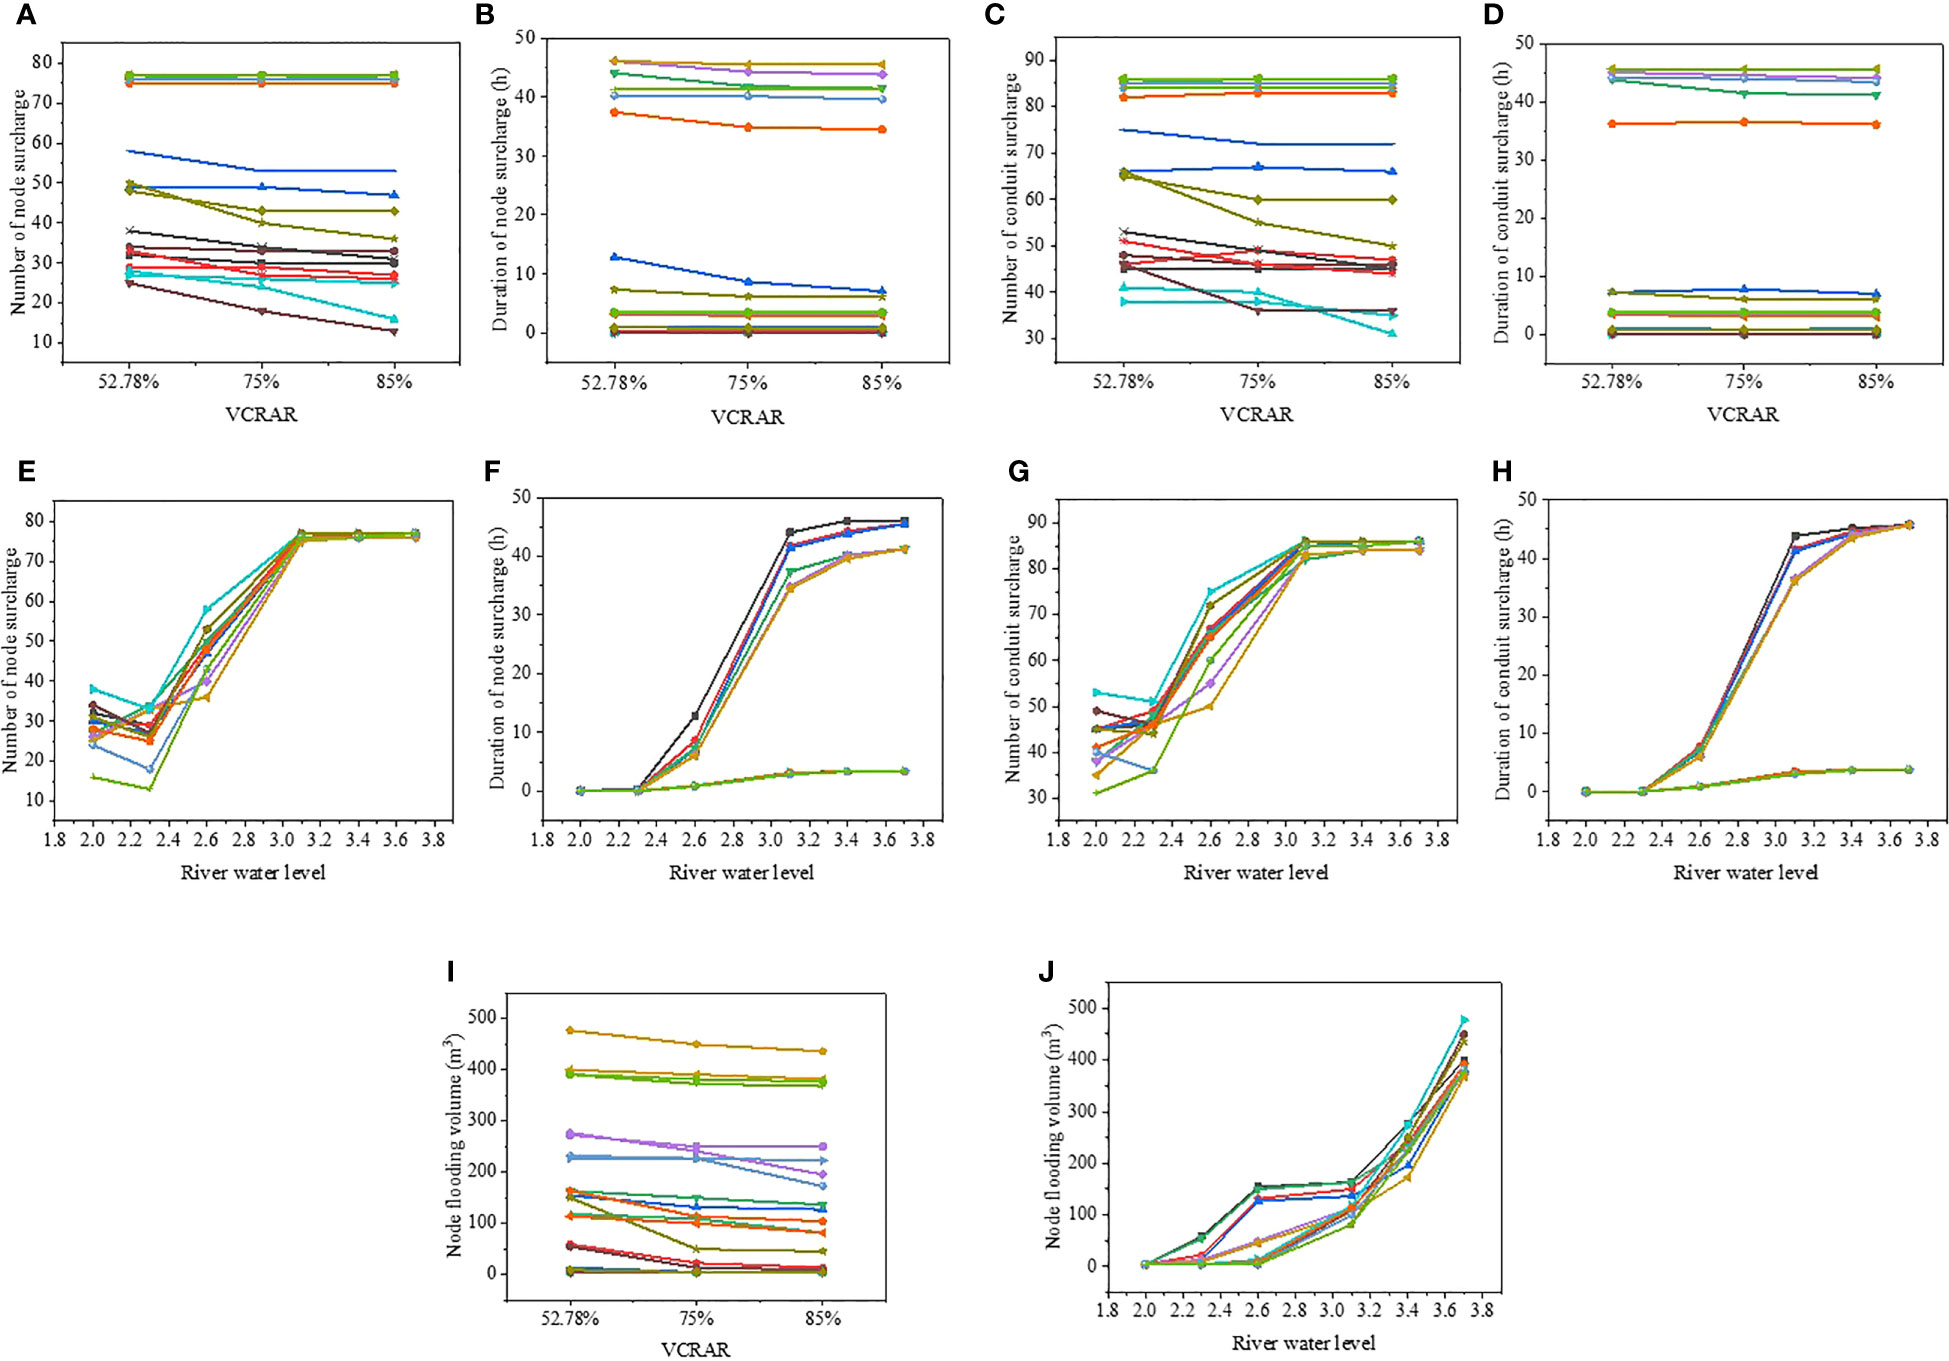
Figure 10 Drainage performance under different design parameters. [(A) The number of node surcharge under different VCRAR; (B) The duration of node surcharge under different VCRAR; (C) The number of conduit surcharge under different VCRAR; (D) The duration of conduit surcharge under different VCRAR; (E) The number of node surcharge under different river water level; (F) The duration of node surcharge under different river water level; (G) The number of conduit surcharge under different river water level; (H) The duration of conduit surcharge under different river water level; (I) The node flooding volume under different VCRAR; (J) The node flooding volume under different river water level].
The influence mechanism of water depth on urban drainage capacity was further analyzed, based on the number and duration of node and conduit surcharge. Figures 10E–H show that high water levels will lead to river backwater jacking effects and seriously affect the runoff control and drainage function of an urban drainage system. The number and mean duration of node and conduit surcharge decreased with the decrease of the RWL. When the water level was between 3.7 m and 3.1 m, the value of the evaluation index changed slightly. When the water level declined less than 3.1 m, the value of the evaluation index declined significantly. The decline tended to be gentle when the water level declined less than 2.3 m. The results indicate that the influence of water level on runoff control and drainage function has a sensitive range. It is crucial to identify the sensitive range and the sensitivity of water level parameters to play the synergistic role of blue infrastructure in the integrated urban green-gray-blue infrastructure system.
The influence mechanism of RWL on urban drainage capacity was further analyzed, based on the node flooding volume. Figure 11 shows the node flooding statuses under the two extreme rainfall conditions of 100a, 24h and 100a, 1h. As shown in Figure 11A, under extreme rainfall conditions (100a, 24h), the RWL reduction of 0.3 m from ordinary water level can significantly reduce the total flooding volume by 82.8% and 89.3%, respectively, when VCRAR rises to 75% and 85%. The results indicate that the flood control performance of green-gray-blue infrastructure can be effectively improved with the decrease of RWL. The decline tends to be gentle when the RWL drops to a certain value, as the water level rises from the normal level to 3.1 m. After the water level exceeded 3.1 m, there was a significant increase in the total volume of node flooding with the RWL increase. As shown in Figure 11B, under extreme rainfall conditions (100a, 1h), the decline tended to be gentle when the RWL dropped to 2.6 m. After the water level exceedED 2.6 m, there was a significant increase in the total volume of node flooding with the RWL increase. The results indicate that there is an adaptive range in which the flood increases slightly with the increase in water level, as green-gray-blue infrastructure can achieve synergy through self-regulation under a certain range of external pressures. It is crucial to identify the adaptive range so that blue infrastructure can have a synergistic role in an integrated urban green-gray-blue infrastructure system.
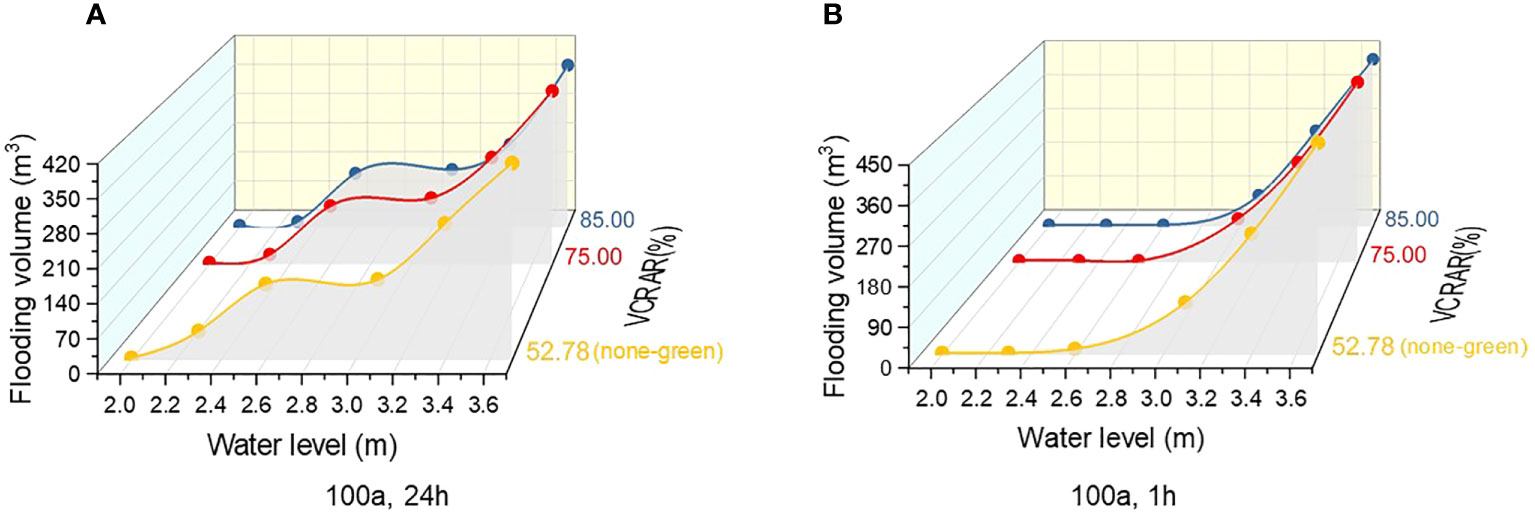
Figure 11 Flooding performance under different water level. [(A) Scenarios of 100a, 24h extreme rainfall; (B) Scenarios of 100a, 1h extreme rainfall].
This study focuses on how the water level boundary of blue infrastructure affects the ability of urban drainage systems, taking into account gravity drainage but not pump drainage conditions. If the RWL is too high to ensure smooth drainage, technical solutions such as pumps can be used in appropriate areas. Future studies will consider adding pump drainage to conduct a more comprehensive assessment. In addition, this study was conducted under the conditions of current land use and single rainfall, without considering urban development and climate change. For green-gray-blue infrastructure, how to improve resilience to urban development and climate change is also a very important research direction. Moreover, this study did not measure the cost of different scenarios, thus a more systematic and comprehensive assessment of green-gray-blue infrastructure is needed.
In this study, three strategies of gray infrastructure, green-gray infrastructure, and green-gray-blue infrastructure were simulated based on a case study to evaluate the performance of urban drainage systems and the key influencing factors of the three types of infrastructure under extreme rainfall scenarios. The following conclusions can be drawn based on the quantitative results:
1. Supplementing traditional gray infrastructure with green infrastructure could improve the efficiency of urban drainage systems. The efficiency increases with the increase of the volume capture ratio of annual rainfall. However, the effectiveness of small-scale decentralized green infrastructure is limited under extreme rainfall events.
2. Green-gray-blue infrastructure is more effective in improving the efficiency of urban drainage systems. Under gravity drainage conditions, the backwater jacking caused by the high water level of a river would have a certain impact on the smooth discharge of stormwater runoff in urban drainage systems. When the flood risk assessment of urban catchment is carried out under gravity drainage conditions, not considering the RWL boundary conditions may lead to inaccurate results.
3. There is a sensitive range in the influence of water level on runoff control and drainage function, and there is an adaptive range in which the flood increases slightly with the water level rises, which are notable rules in improving the synergistic effect of blue infrastructure in the integrated urban green-gray-blue infrastructure system.
This study provides quantitative data to support the integrated urban green-gray-blue infrastructure in solving the urban flooding problem of drainage under extreme rainfall events.
The original contributions presented in the study are included in the article/supplementary material. Further inquiries can be directed to the corresponding author.
CZ, JW, JL, and YL contributed to the conception and overarching research goals and aims of the study. JW and ZY performed the data analyses and wrote the manuscript. YL, JC, and NZ contributed to the collection of the datasets. JC and NZ helped perform the analysis with constructive discussions. All authors contributed to the article and approved the submitted version.
This study was supported by the National Key Research and Development Program of China (No.2022YFC3800500), Shanghai Science and technology Program (No.21511103700), The Young Top-Notch Talent Program in Shanghai (2019), the Research Fund of the State Key Laboratory of Simulation and Regulation of Water Cycle in River Basin (No.SKL2022TS11).
Authors CZ, YL, JC, and NZ were employed by the company Shanghai Municipal Engineering Design Institute Group Co. Ltd.
The remaining authors declare that the research was conducted in the absence of any commercial or financial relationships that could be construed as a potential conflict of interest.
All claims expressed in this article are solely those of the authors and do not necessarily represent those of their affiliated organizations, or those of the publisher, the editors and the reviewers. Any product that may be evaluated in this article, or claim that may be made by its manufacturer, is not guaranteed or endorsed by the publisher.
Alikhani J., Nietch C., Jacobs S., Shuster B., Massoudieh A. (2020). Modeling and design scenario analysis of long-term monitored bioretention system for rainfall-runoff reduction to combined sewer in Cincinnati, OH. J. Sustain Water Built Environ. 6, 040190161–401901617. doi: 10.1061/JSWBAY.0000903
Alves A., Vojinovic Z., Kapelan Z., Sanchez A., Gersonius B. (2020). Exploring trade-offs among the multiple benefits of green-blue-grey infrastructure for urban flood mitigation. Sci. Total Environ. 703, 134980. doi: 10.1016/j.scitotenv.2019.134980
Arjenaki M. O., Sanayei H. R. Z., Heidarzadeh H., Mahabadi N. A. (2020). Modeling and investigating the effect of the LID methods on collection network of urban runoff using the SWMM model (case study: Shahrekord City). Model. Earth Syst. Environ. 7, 1–16. doi: 10.1007/s40808-020-00870-2
Bradford A., Randall M. T. (2013). Bioretention gardens for improved nutrient removal. Water Qual. Res. J. 48, 372–386. doi: 10.2166/wqrjc.2013.016
Debusk K. M., Wynn T. M. (2011). Storm-water bioretention for runoff quality and quantity mitigation. J. Environ. Engineering Asce 137, 800–808. doi: 10.1061/(ASCE)EE.1943-7870.0000388
Demuzere M., Orru K., Heidrich O., Olazabal E., Geneletti D., Orru H., et al. (2014). Mitigating and adapting to climate change: multi-functional and multi-scale assessment of green urban infrastructure. J. Environ. Manage 146, 107–115. doi: 10.1016/j.jenvman.2014.07.025
Deyvid W., Nilo O., Priscilla M., Gustavo D. (2020). Assessment of the hydrological response of an urban watershed to rainfall-runoff events in different land use scenarios – Belo Horizonte, MG, Brazil. Water Sci. Technol. 81(4), 679–693. doi: 10.2166/wst.2020.148
Dhakal K. P., Chevalier L. R. (2015). “Implementing low impact development in urban landscapes: A policy perspective,” in World Environmental and Water Resources Congress 2015: Floods, Droughts, and Ecosystems, (Austin, Texas: World Environmental and Water Resources Congress 2015) 322–333.
Dong X., Guo H., Zeng S. (2017). Enhancing future resilience in urban drainage system: Green versus grey infrastructure. Water Res. 124, 280–289. doi: 10.1016/j.watres.2017.07.038
Earles A., Wulliman J., Chongtoua B., Zivkovich B., Rogers S., Johnson S. (2018). “Oak gulch green infrastructure: scaling and continuity analysis from the lot to the watershed level,” in World Environmental and Water Resources Congress 2018: Water, Wastewater, and Stormwater; Urban Watershed Management; Municipal Water Infrastructure; and Desalination and Water Reuse (Minneapolis, Minnesota: the World Environmental and Water Resources Congress 2018), 143–151.
Eckart K., Mcphee Z., Bolisetti T. (2017). Performance and implementation of low impact development - A review. Sci. Total Environ. 607-608, 413–432. doi: 10.1016/j.scitotenv.2017.06.254
Escobar-Ruiz V., Smith H. G., Blake W. H., Macdonald N. (2019). Assessing the performance of a physically based hydrological model using a proxy-catchment approach in an agricultural environment. Hydrol. Processes 33, 3119–3137. doi: 10.1002/hyp.13550
Gunnell K., Mulligan M., Francis R. A., Hole D. G. (2019). Evaluating natural infrastructure for flood management within the watersheds of selected global cities[J]. Sci. Total Environ. 670, 411–424. doi: 10.1016/j.scitotenv.2019.03.212
Guo C., Li J., Li H., Zhang B., Ma M., Li F. (2018). Seven-year running effect evaluation and fate analysis of rain gardens in Xi’an, Northwest China. Water 10 (7), 944. doi: 10.3390/w10070944
Huo Y. C., Wu X., Luan Q. H., Liu J. H., Ma D. (2019). “Effectiveness evaluation of LIDs through SWMM: A case study of typical urban unit in Handan, China,” in The 5th International Conference on Water Resource and Environment (WRE 2019). (Macao, China: IOP Conference Series: Earth and Environmental Science). 344.
Jiang Y., Qiu L., Gao T., Zhang S. (2022). Systematic application of sponge city facilities at community scale based on SWMM. Water 14 (4), 591. doi: 10.3390/w14040591
Lee J. G., Selvakumar A., Alvi K., Riverson J., Zhen J. X., Shoemaker L., et al. (2012). A watershed-scale design optimization model for stormwater best management practices. Environ. Model. Softw. 37, 6–18. doi: 10.1016/j.envsoft.2012.04.011
Liu T., Lawluvy Y., Shi Y., Yap P.-S. (2021). Low Impact Development (LID) practices: A review on recent developments, challenges and prospects. Water Air Soil pollut. 232 (9), 232–344. doi: 10.1007/s11270-021-05262-5
Llausàs A., Roe M. (2012). Green infrastructure planning: cross-national analysis between the North East of England (UK) and Catalonia (Spain). Eur. Plann. Stud. 20, 641–663. doi: 10.1080/09654313.2012.665032
Marsalek J., Bradford A., Drake J. A. P. (2013). Review of environmental performance of permeable pavement systems: state of the knowledge. Water Qual. Res. J. 48, 203–222. doi: 10.2166/wqrjc.2013.055
MHURD. (2014). The ministry of housing and urban - rural development. The technical guide for sponge cities - construction of low impact development (for trial implementation). in CHINA. Available at: http://www.mohurd.gov.cn/zcfg/jsbwj0/JsbwjcSJS/201411/W020141102041225.PDF.
Olszewski J. M., Davis A. P. (2013). Comparing the hydrologic performance of a bioretention cell with predevelopment values. J. Irrig. Drain. Eng. 139, 124–130. doi: 10.1061/(ASCE)IR.1943-4774.0000504
Qin H. P., Li Z. X., Fu G. (2013). The effects of low impact development on urban flooding under different rainfall characteristics. J. Environ. Manage 129, 577–585. doi: 10.1016/j.jenvman.2013.08.026
Rahman S., Khan M. T., Akib S., Din N. B., Biswas S. K., Shirazi S. M. (2014). Sustainability of rainwater harvesting system in terms of water quality. ScientificWorldJournal 2014, 721357. doi: 10.1155/2014/721357
Rentachintala L. R. N. P., Reddy M. M., Mohapatra P. K. (2022). Urban stormwater management for sustainable and resilient measures and practices: a review. Water Sci. Technol. 85 (4), 1120–1140. doi: 10.2166/wst.2022.017
Rossman L. A. (2015). Storm Water Management Model User’s Manual Version 5.1 (Washington, D.C.: United States Environmental Protection Agency).
Rowe D. B. (2011). Green roofs as a means of pollution abatement. Environ. pollut. 159, 2100–2110. doi: 10.1016/j.envpol.2010.10.029
Shafique M., Kim R. (2017a). Green stormwater infrastructure with low impact development concept: a review of current research. Desalin. Water Treat 83, 16–29. doi: 10.5004/dwt.2017.20981
Shafique M., Kim R. (2017b). Retrofitting the Low Impact Development Practices into Developed Urban areas Including Barriers and Potential Solution. Open Geosci. 9 (1), 240–254. doi: 10.1515/geo-2017-0020
Taji S. G., Regulwar D. G. (2019). LID coupled design of drainage model using GIS and SWMM. ISH J. Hydraul. Eng. 27, 376–389. doi: 10.1080/09715010.2019.1660919
Thaiutsa B., Puangchit L., Kjelgren R., Arunpraparut W. (2008). Urban green space, street tree and heritage large tree assessment in Bangkok, Thailand. Urban Forestry & Urban Greening 7 (3), 219–229. doi: 10.1016/j.ufug.2008.03.002
Versini P. A., Kotelnikova N., Poulhes A., Tchiguirinskaia I., Leurent F. (2018). A distributed modelling approach to assess the use of blue and green infrastructures to fulfil stormwater management requirements. Landscape Urban Plann. 173, 60–63. doi: 10.1016/j.landurbplan.2018.02.001
Walsh C. J., Booth D. B., Burns M. J., Fletcher T. D., Hale R. L., Hoang L. N., et al. (2016). Principles for urban stormwater management to protect stream ecosystems. Freshw. Sci. 35, 398–411. doi: 10.1086/685284
Walsh T. C., Pomeroy C. A., Burian S. J. (2014). Hydrologic modeling analysis of a passive, residential rainwater harvesting program in an urbanized, semi-arid watershed. J. Hydrol. 508, 240–253. doi: 10.1016/j.jhydrol.2013.10.038
Wang J., Liu J., Mei C., Wang H., Lu J. (2022). A multi-objective optimization model for synergistic effect analysis of integrated green-gray-blue drainage system in urban inundation control. J. Hydrol. 609, 127725. doi: 10.1016/j.jhydrol.2022.127725
Wang Y., Sun M., Song B. (2017). Public perceptions of and willingness to pay for sponge city initiatives in China. Resour. Conserv. Recycl. 122, 11–20. doi: 10.1016/j.resconrec.2017.02.002
Zhang C., He M., Zhang Y. (2019). Urban sustainable development based on the framework of sponge city: 71 case studies in China. Sustainability 11 (6), 1544. doi: 10.3390/su11061544
Keywords: urban flood, stormwater management, green-gray-blue infrastructure, extreme rainfall, synergy
Citation: Zhang C, Wang J, Liu J, Lv Y, Chen J, Yang Z and Zhang N (2023) Performance assessment for the integrated green-gray-blue infrastructure under extreme rainfall scenarios. Front. Ecol. Evol. 11:1242492. doi: 10.3389/fevo.2023.1242492
Received: 19 June 2023; Accepted: 17 July 2023;
Published: 04 August 2023.
Edited by:
Jiefeng Wu, Nanjing University of Information Science and Technology, ChinaReviewed by:
Yunxia Zhao, University of California, Irvine, United StatesCopyright © 2023 Zhang, Wang, Liu, Lv, Chen, Yang and Zhang. This is an open-access article distributed under the terms of the Creative Commons Attribution License (CC BY). The use, distribution or reproduction in other forums is permitted, provided the original author(s) and the copyright owner(s) are credited and that the original publication in this journal is cited, in accordance with accepted academic practice. No use, distribution or reproduction is permitted which does not comply with these terms.
*Correspondence: Yongpeng Lv, eW9uZ3BlbmdsdkBmb3htYWlsLmNvbQ==
Disclaimer: All claims expressed in this article are solely those of the authors and do not necessarily represent those of their affiliated organizations, or those of the publisher, the editors and the reviewers. Any product that may be evaluated in this article or claim that may be made by its manufacturer is not guaranteed or endorsed by the publisher.
Research integrity at Frontiers
Learn more about the work of our research integrity team to safeguard the quality of each article we publish.