 Bo Hu
Bo Hu Mingqing Xiao3,4
 Xiaodong Fu
 Yongqiang Zhou
95% of researchers rate our articles as excellent or good
Learn more about the work of our research integrity team to safeguard the quality of each article we publish.
Find out more
ORIGINAL RESEARCH article
Front. Ecol. Evol. , 28 July 2023
Sec. Environmental Informatics and Remote Sensing
Volume 11 - 2023 | https://doi.org/10.3389/fevo.2023.1237250
This article is part of the Research Topic Advances in Development and Utilization of Underground Space, volume II View all 13 articles
Surrounding rock pressure is a crucial parameter in tunnel engineering design, and its calculation is a classic challenge. The surrounding rock pressure is influenced by geostress, but existing calculation methods often do not take into account the effect of geostress. In this paper, finite discrete element method (FDEM) is used to study the design values of tunnel surrounding rock pressure under different geostress fields. Firstly, a set of calibration methods for input parameters of FDEM is summarized based on previous studies. Then, taking a high-speed railway tunnel in IV-level surrounding rock as an example, the excavation-induced failure process of the tunnel under the influence of gravity stress field and geostress field is simulated using the FDEM. By comparing the results with those of the finite element method simulation, the rationality of applying FDEM to the simulation of tunnel excavation is demonstrated. Next, a calculation method of surrounding rock pressure design value based on FDEM is proposed by introducing tunnel displacement criterion, and its validity is verified by comparing with the results of the theoretical formula. Finally, the surrounding rock pressure design values under different geostress are analyzed by using this calculation method. The results show that there are significant differences between the gravity stress field and the geostress field in the maximum principal stress distribution, failure zone form and crack distribution. The geostress directly influences the design value of surrounding rock pressure. As the geostress varies from 4MPa to 12MPa, the corresponding design value increases from 49KPa to 1,288KPa, illustrating a quadratic relationship between them. With the corresponding design support force, the displacement of the surrounding rock is controlled within a reasonable range, ensuring the stability of the tunnel is maintained.
The surrounding rock pressure is the foundation of tunnel design, construction and operation, and it is also the main factor affecting project costs (Ding et al., 2022; Keawsawasvong et al., 2022). The study of surrounding rock pressure has always been an important research subject in tunnel engineering and one of the most concerned problems in the engineering. However, due to the complexity of geological conditions, variations in construction methods, differing supporting parameters, and spatio-temporal effects, accurately determining the surrounding rock pressure is challenging (Wu et al., 2019; Liu et al., 2022; Zhang et al., 2022; Liu et al., 2023).
Various methods for calculating surrounding rock pressure are commonly used in practice. For example, (1) Q system and RMR system based on surrounding rock classification system comprehensively consider a variety of factors affecting surrounding rock pressure, and are mostly suitable for deep buried rock tunnels, but these methods have strong subjectivity in the value of calculation parameters (Lee et al., 2018). (2) Code for Design of Railway Tunnel (TB10003-2016) provides a formula for calculating surrounding rock pressure of deep-buried tunnels based on landslide statistics. However, this method does not consider the influence of burial depth. (3) The theoretical calculation methods of surrounding rock pressure based on circular tunnel, such as Caquot formula, Fenner formula (Cai, 2002) and Kastner formula (Cheng, 2012), etc., are mostly based on the research of deep buried circular tunnel, without considering the influence of surface load and boundary. In summary, most of the existing calculation methods of surrounding rock pressure have their limitations, and a universal method is needed.
Numerical simulation is a widely used research method in rock mechanics, which includes continuous and discontinuous methods. Many scholars have applied these two methods to study surrounding rock pressure and obtained fruitful results. For instance, the distribution law of surrounding rock pressure under different tunnel sections and different geological environments is studied by continuous method (Zhang et al., 2020; Ding et al., 2021; Qiu et al., 2022). The discontinuous method is used to investigate the influence of discontinuous conditions such as joints and faults on the surrounding rock pressure distribution, and some useful conclusions are obtained (Sun et al., 2018; Xue et al., 2019; Lee et al., 2021). However, the continuity requirement of the deformation equation limits the capability of the continuous method to deal with discontinuous materials such as rocks. Moreover, the discontinuous method has low calculation efficiency and high cost when analyzing actual projects (Liu et al., 2019; Liu et al., 2020). To overcome these limitations, scholar Munjiza proposed the finite discrete element method (FDEM), which combines the advantages of both methods and has shown promising results in simulating the crack initiation and propagation of rock-like brittle materials (Munjiza et al., 1995; Munjiza et al., 1999; Munjiza, 2004). The correctness and effectiveness of FDEM have been confirmed through laboratory and engineering scale simulations. FDEM has been widely applied in various fields including tunnel excavation (Lisjak et al., 2014; Lisjak et al., 2015a) and support (Lisjak et al., 2015b), surrounding rock reinforcement (Liu et al., 2019), slope stability analysis (Zhong et al., 2022), hydraulic fracturing (Yan and Zheng, 2017a; Yan and Zheng, 2017b), rock fracture acoustic emission (Lisjak et al., 2013; Zhao et al., 2015), complex rock block modeling (Yan et al., 2015), uniaxial compression (An et al., 2022), triaxial compression (Song et al., 2022), Brazilian splitting (Zhang et al., 2021), direct shear test (Min et al., 2020), rock thermal failure (Yan and Zheng, 2017c) and blasting failure (Trivino and Mohanty, 2015). However, the application of FDEM in studying surrounding rock pressure is still limited.
Geostress is the original force existing in the rock mass in nature, and also the fundamental force leading to the deformation and failure of underground engineering, which determines the basic mechanical properties of geotechnical mass (Zhang et al., 2018). It is necessary to analyze the stress state of surrounding rock and its influence on the stability of surrounding rock. At the same time, the study of the influence law of geostress on tunnel surrounding rock pressure can provide reference for improving the tunnel support method and analyzing the mechanism of surrounding rock pressure. FDEM has been utilized to investigate the internal force distribution and failure of the surrounding rock after tunnel excavation under different stress states (Han et al., 2021; Deng et al., 2022). However, there are few researchers who have used FDEM to conduct research on the influence of geostress on the surrounding rock pressure design value.
Therefore, based on the FDEM, this paper puts forward the idea of using the surrounding rock pressure design value as the design supporting force to solve the problem that the actual surrounding rock pressure is difficult to determine. Based on the correct calibration of the calculation parameters of FDEM, the excavation failure process of high-speed railway tunnel in IV-level surrounding rock is simulated under the gravity stress field and geostress field. And a method for calculating the surrounding rock pressure design value based on FDEM is proposed by introducing the tunnel displacement criterion, and its validity is verified. Finally, this method is used to analyze the surrounding rock pressure design value under different geostress. This study can provide theoretical basis for the design and construction of tunnel engineering.
FDEM discretizes the material into triangular elements of constant strain and incorporates 0-thickness quadrilateral joint elements as bonding agents along the common sides of adjacent triangles (Figure 1). Assuming that the triangular element is always in an elastic strain state without fracture, deformation stress is calculated via the generalized Hooke’s law. Plastic deformation and fracture of the material are determined by the tensile and shear displacements of the joint element. Upon reaching the corresponding limit values, the joint element fails and generates a micro-crack, while the triangular elements on both sides of the joint element transition from a bonding to a contact state. The principle of FDEM is as follows (Munjiza, 2004).
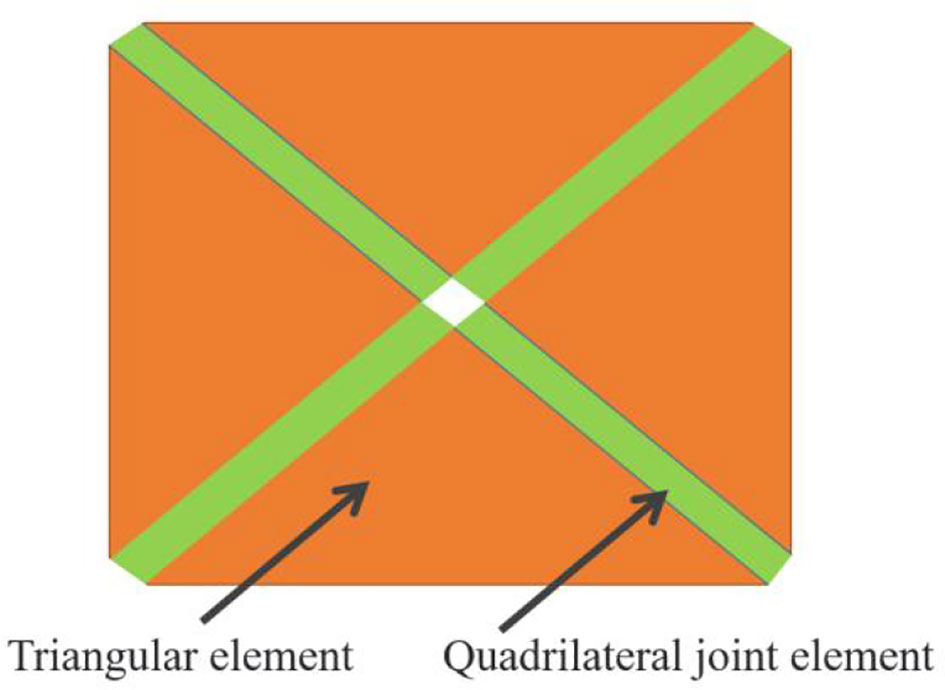
Figure 1 Meshing principle of FDEM.
The dynamic equation of FDEM is solved by applying Newton’s second law, and the equation for the nodes is solved using the Euler method:
where, is the mass matrix of all element nodes in the system. represents the unbalanced force vector of nodes. The damping matrix is introduced in order to consume the kinetic energy of the system. According to Formula (1), coordinates and velocities of nodes of triangular elements in each time step are calculated by central difference method, and the formula is as follows:
where, represents the total node force, is the time step, and is the mass of the node, which is one third of the mass of the element.
Under external loading, contact between triangular elements will occur, resulting in the generation of contact forces. FDEM utilizes a contact force calculation method based on potential, which facilitates the treatment of point-to-point contact problems. The contact stress of the triangle is influenced by both the contact penalty value and the area and shape of the triangles in contact, as illustrated in Figure 2. The formula for calculating contact stress using this method is as follows:
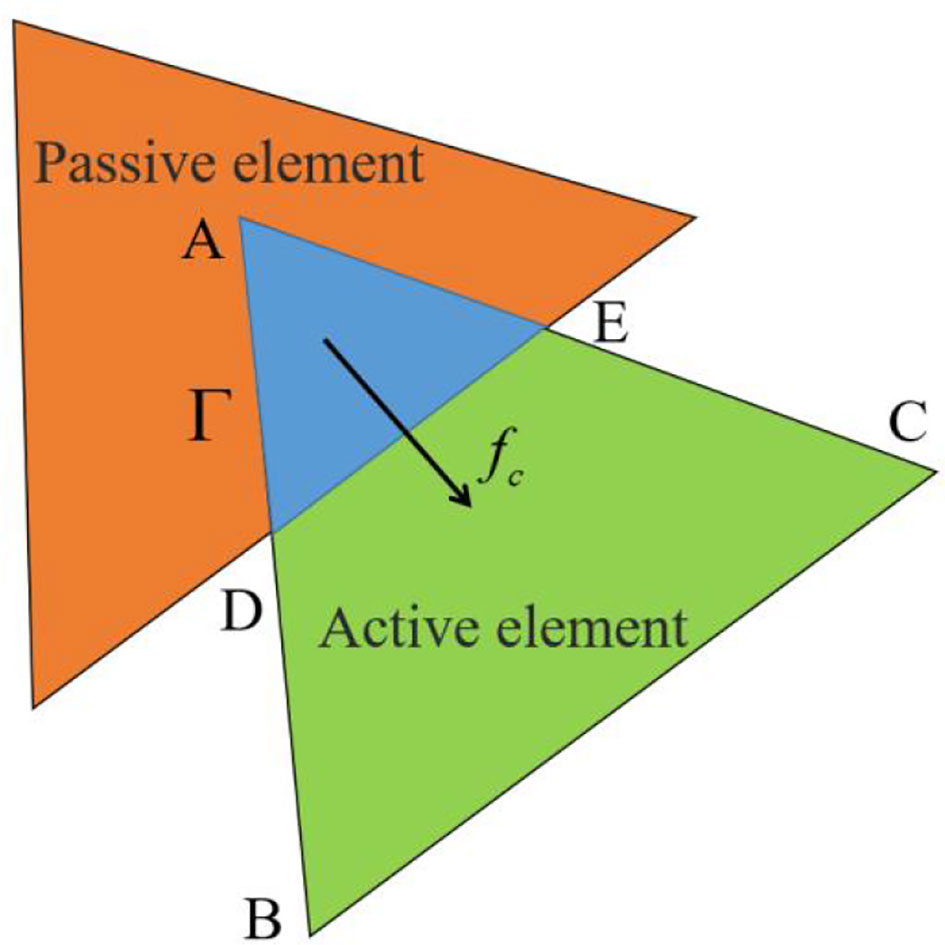
Figure 2 Contact between active element and passive element. Capital letters indicate different contact relationships.
where denotes the normal contact penalty value, represents the boundary of the overlapping region between active element and passive element , while and respectively represent the potential of the two elements. Additionally, represents the outer normal vector of the overlapping region boundary.
In FDEM, the strain and stress of the triangular elements are computed using the finite element method. As the triangular constant strain element is employed, stresses within the element remain uniform. Once the stress of the deformed triangular element is calculated, the equivalent nodal force vector resulting from the element deformation on each side of the triangular element can be determined using the following formula:
where is the outer normal unit vector of the edge of the triangular element, is the side length of the edge of the element, and 1/2 means to distribute the force equally between the two nodes of the edge.
The quadrilateral joint element is capable of withstanding compressive, tensile, and shear stresses. When the joint is subjected to stretching, compression, or sliding, normal and tangential stresses will arise in the joint element. The stress value is solely dependent on the relative tensile distance , slip distance , joint penalty value , tensile strength , and shear strength , as depicted in Figure 3. The specific calculation formula is as follows:
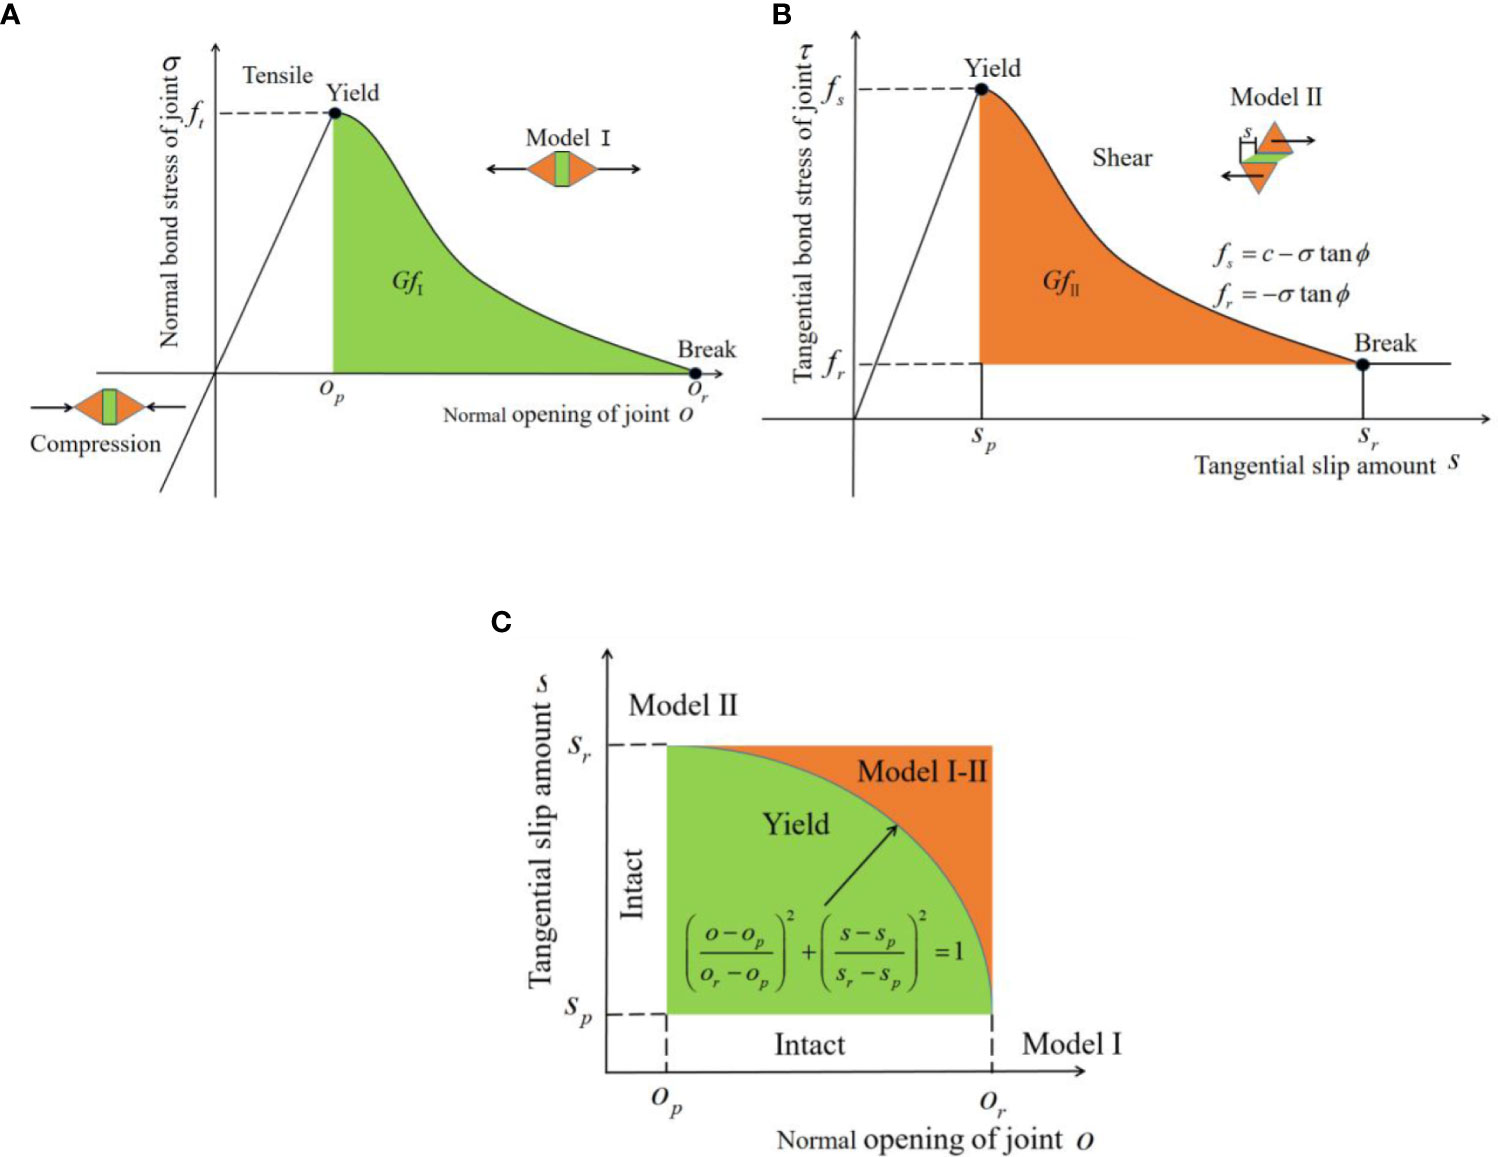
Figure 3 Failure mode of joint element. (A) Tensile failure. (B) Shear failure. (C) Tensile-shear mixed failure.
(1) In the unyielding state:
where, is the normal stress; is shear stress; and are joint tensile and slip amounts at peak stress respectively, specifically, , , and is the minimum size of the element.
(2) In the yield state:
in the formula, is the loss factor and is the softening coefficient of the material. The relevant value and calculation method are relatively complex, and the specific content can be found in the relevant literature (Yan and Zheng, 2017a).
Wufeng Tunnel is a high-speed railway tunnel with a designed speed of 350km per hour. The length of the left line of the tunnel is 15471m, and the tunnel body mainly passes through Silurian shale and silty sandstone (Figure 4). And the surrounding rock of the left line of the tunnel is mainly IV-level. The lithology of the stratum in which the tunnel is situated is intricate and varied. The tectogenesis of the stratum is also evidently dynamic, while the engineering geological conditions are relatively complex. The construction process may encounter geological issues such as rockfalls and large deformation of soft rock. Furthermore, the mountainous terrain is characterized by substantial undulations, and the burial depth of the tunnel varies significantly, resulting in a complicated geostress environment for the tunnel. Therefore, it is essential to factor in the influence of geostress factors when devising the tunnel’s design and construction plan.
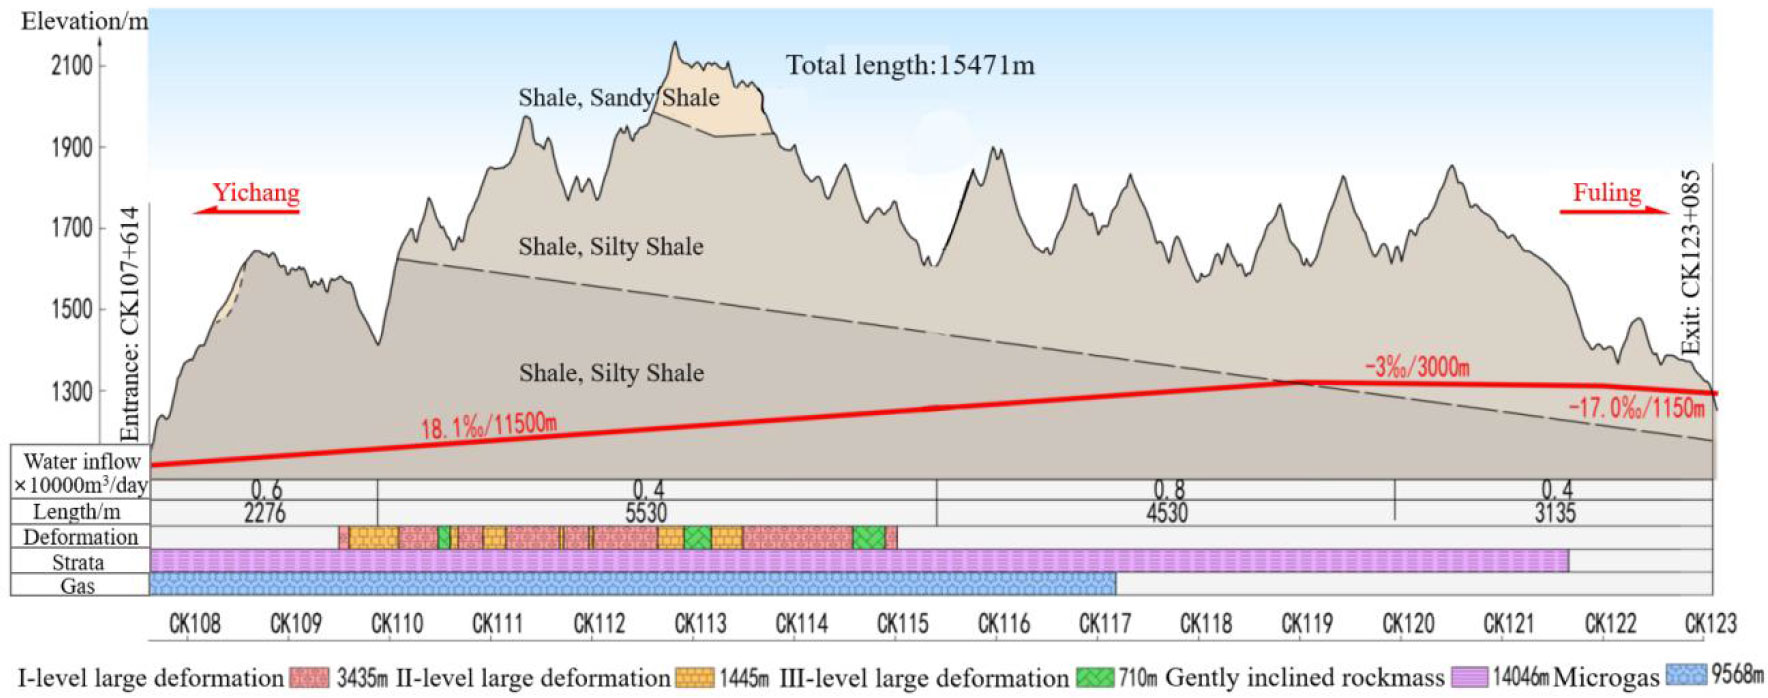
Figure 4 Geological profile.
A high-speed railway tunnel model with a design speed of 350km/h and a buried depth of 200m in the IV-level surrounding rock is established, as shown in Figure 5. The model size is 135m×160m (width × height), in which the tunnel span is 14.7m and the tunnel section height is 12.23m. The distance between tunnel and model boundary is 5 times the span of tunnel, which is sufficient to eliminate the influence of boundary conditions on model excavation. To reduce the scale of the model and accelerate numerical calculation, the stress boundary was applied on the top surface of the model, making the equivalent buried depth of the tunnel equal to 200m. At the same time, the side of the model is set as the normal displacement constraint boundary, and the bottom surface is set as the full constraint boundary. Tunnel excavation is simplified to the excavation of the whole section at one time. In order to improve the accuracy of the calculation results, mesh refinement was carried out around the excavation section of the tunnel. The mesh size around the tunnel was set at 0.25m, and gradually increased to 2.5m from the refinement area to the boundary. Surrounding rock and tunnel were divided by Delaunay triangle with 24,452 nodes and 49,494 elements.
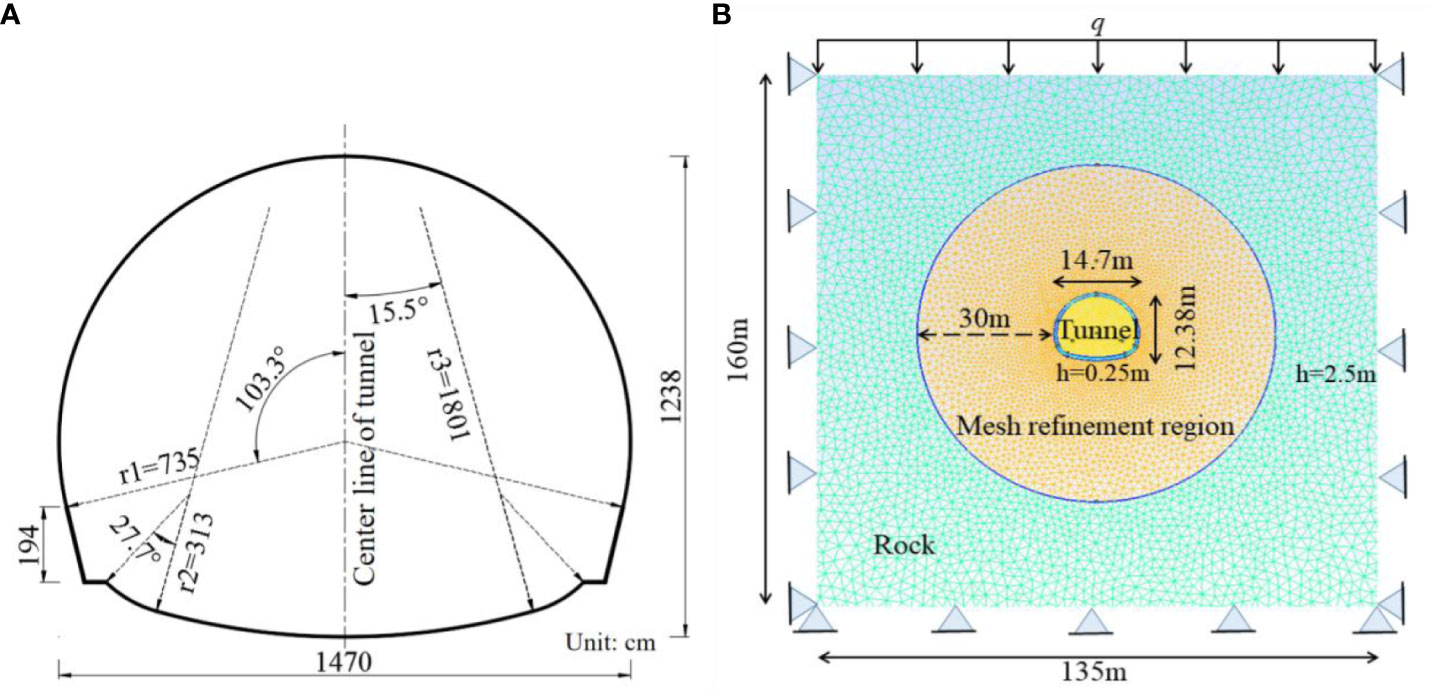
Figure 5 FDEM model. (A) Tunnel section. (B) Schematic diagram of the model.
This study primarily focuses on the IV-level surrounding rock. According to the relevant engineering practice, the rock mass is assumed to be a continuous uniform medium. To ensure the research results are widely applicable, this paper refers to the value range of mechanical parameters of surrounding rock provided by Code for Design of Railway Tunnel (TB10003-2016), and utilizes the lower one-third of the value range. Specific mechanical parameters are shown in Table 1.
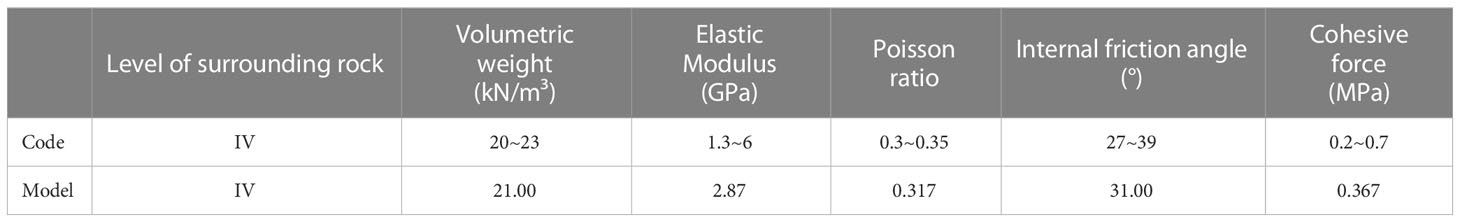
Table 1 Values of mechanical parameters of surrounding rock.
Before using FDEM to simulate tunnel excavation, it is necessary to calibrate the calculation parameters. Previous studies pointed out that parameter calibration can be conducted by comparing the results of numerical simulation with those of laboratory uniaxial compression and Brazilian splitting test (Tatone and Grasselli, 2015). When the failure mode, strength value, elastic modulus, Poisson’s ratio and stress-strain curve obtained by simulation are consistent with those obtained by laboratory test or the deviation is within a certain range, It is deemed that this set of input parameters used in the simulation is reasonable. At the same time, this also implies that the final parameter calibration results are not unique, allowing the relevant parameters to have a range of adjustment, within which the simulation results and laboratory results can be well consistent.
The calculation parameters of FDEM can be divided into four categories: (1) calculation control parameters, such as calculation time step ; (2) triangle element parameters, including elastic modulus , Poisson’s ratio , material density ; (3) Parameters of quadrilateral joint elements, including cohesive force , internal friction angle , tensile strength , Mode I fracture energy and Mode II fracture energy ; (4) Contact parameters of triangular element, including normal contact penalty , tangential contact penalty and fracture penalty . Among these parameters, the macroscopic parameters (such as elastic modulus , Poisson’s ratio , density , cohesive force , internal friction angle , and tensile strength ) directly utilize values obtained from laboratory tests (Liu et al., 2019; Deng et al., 2022). The contact parameters define the contact stiffness between finite elements and control the limit distance of embeddedness and slip between elements. By setting a high penalty value, the tip deformation of joint elements and relative displacement between contact pairs can be effectively reduced, thereby improving the calculation accuracy. However, to ensure calculation stability, a small-time step should be selected, which will increase the computational workload dramatically. It has been founded that when and are set to 1 times the elastic modulus, and is set to 100 times the elastic modulus, a good balance between calculation accuracy and cost can be achieved, and the simulation results can be ideally obtained (Yan et al., 2021; Wang et al., 2022). Based on the above parameters, the values of fracture energy and are adjusted constantly, and the simulation results are compared with the laboratory and theoretical results. Finally, the input parameters of the tunnel model are determined as shown in Table 2. The numerical model is calculated using MultiFracS, which is a FDEM software developed by Chengzeng Yan (Yan et al., 2021).
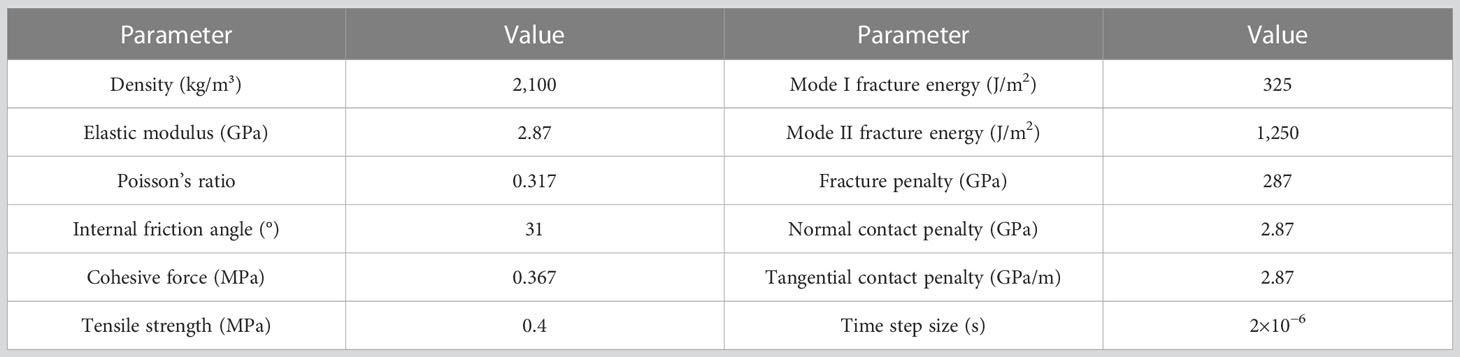
Table 2 Calculation parameters of the tunnel model.
After the excavation of the tunnel, the maximum principal stress of surrounding rock is approximately symmetrical, and the maximum value appears at the vault, inflected arch and side wall. Figure 6A illustrates the distribution of the maximum principal stress of the model after geostress equilibrium. As a whole, the tunnel model is under pressure, and the maximum principal stress is approximately linear along the depth direction. After tunnel excavation, the surrounding rock is affected by excavation unloading effect, and the value of the maximum principal stress around the excavated section is greatly reduced, as shown in Figure 6B. The far end of the excavated section is less affected, and the maximum principal stress does not change. With the continuous action of the excavation disturbance, the stress disturbance area radiates annular from the excavation section. And the stress above and below the tunnel excavation section is symmetrical, as is the stress on the left and right sides, as shown in Figure 6C. At the 20,000th time step after tunnel excavation, the surrounding rock reaches the strength limit, and a crack germinates from the arch foot of the tunnel section. Meanwhile, the crack propagation in turn affects the distribution of the maximum principal stress, resulting in the stress concentration near the crack tip. The stress concentration phenomenon will induce the crack to continue to develop, so that the crack continues to expand to the deep of the rock mass (Figure 6D), and the location of the maximum principal stress concentration also moves to the deep of the rock mass simultaneously. Finally, the model is calculated to be convergent, cracks fully develop and expand, large deformation occurs on both sides of the spandrel, collapse happens at the vault, slight uplift occurs in the inflected arch, and tension areas are formed in the vault and inflected arch (Figure 6E). At this time, the maximum principal stress distribution tends to be stable, and the maximum principal stress is still symmetrically distributed about the center line of tunnel with the phenomenon of stress concentration.
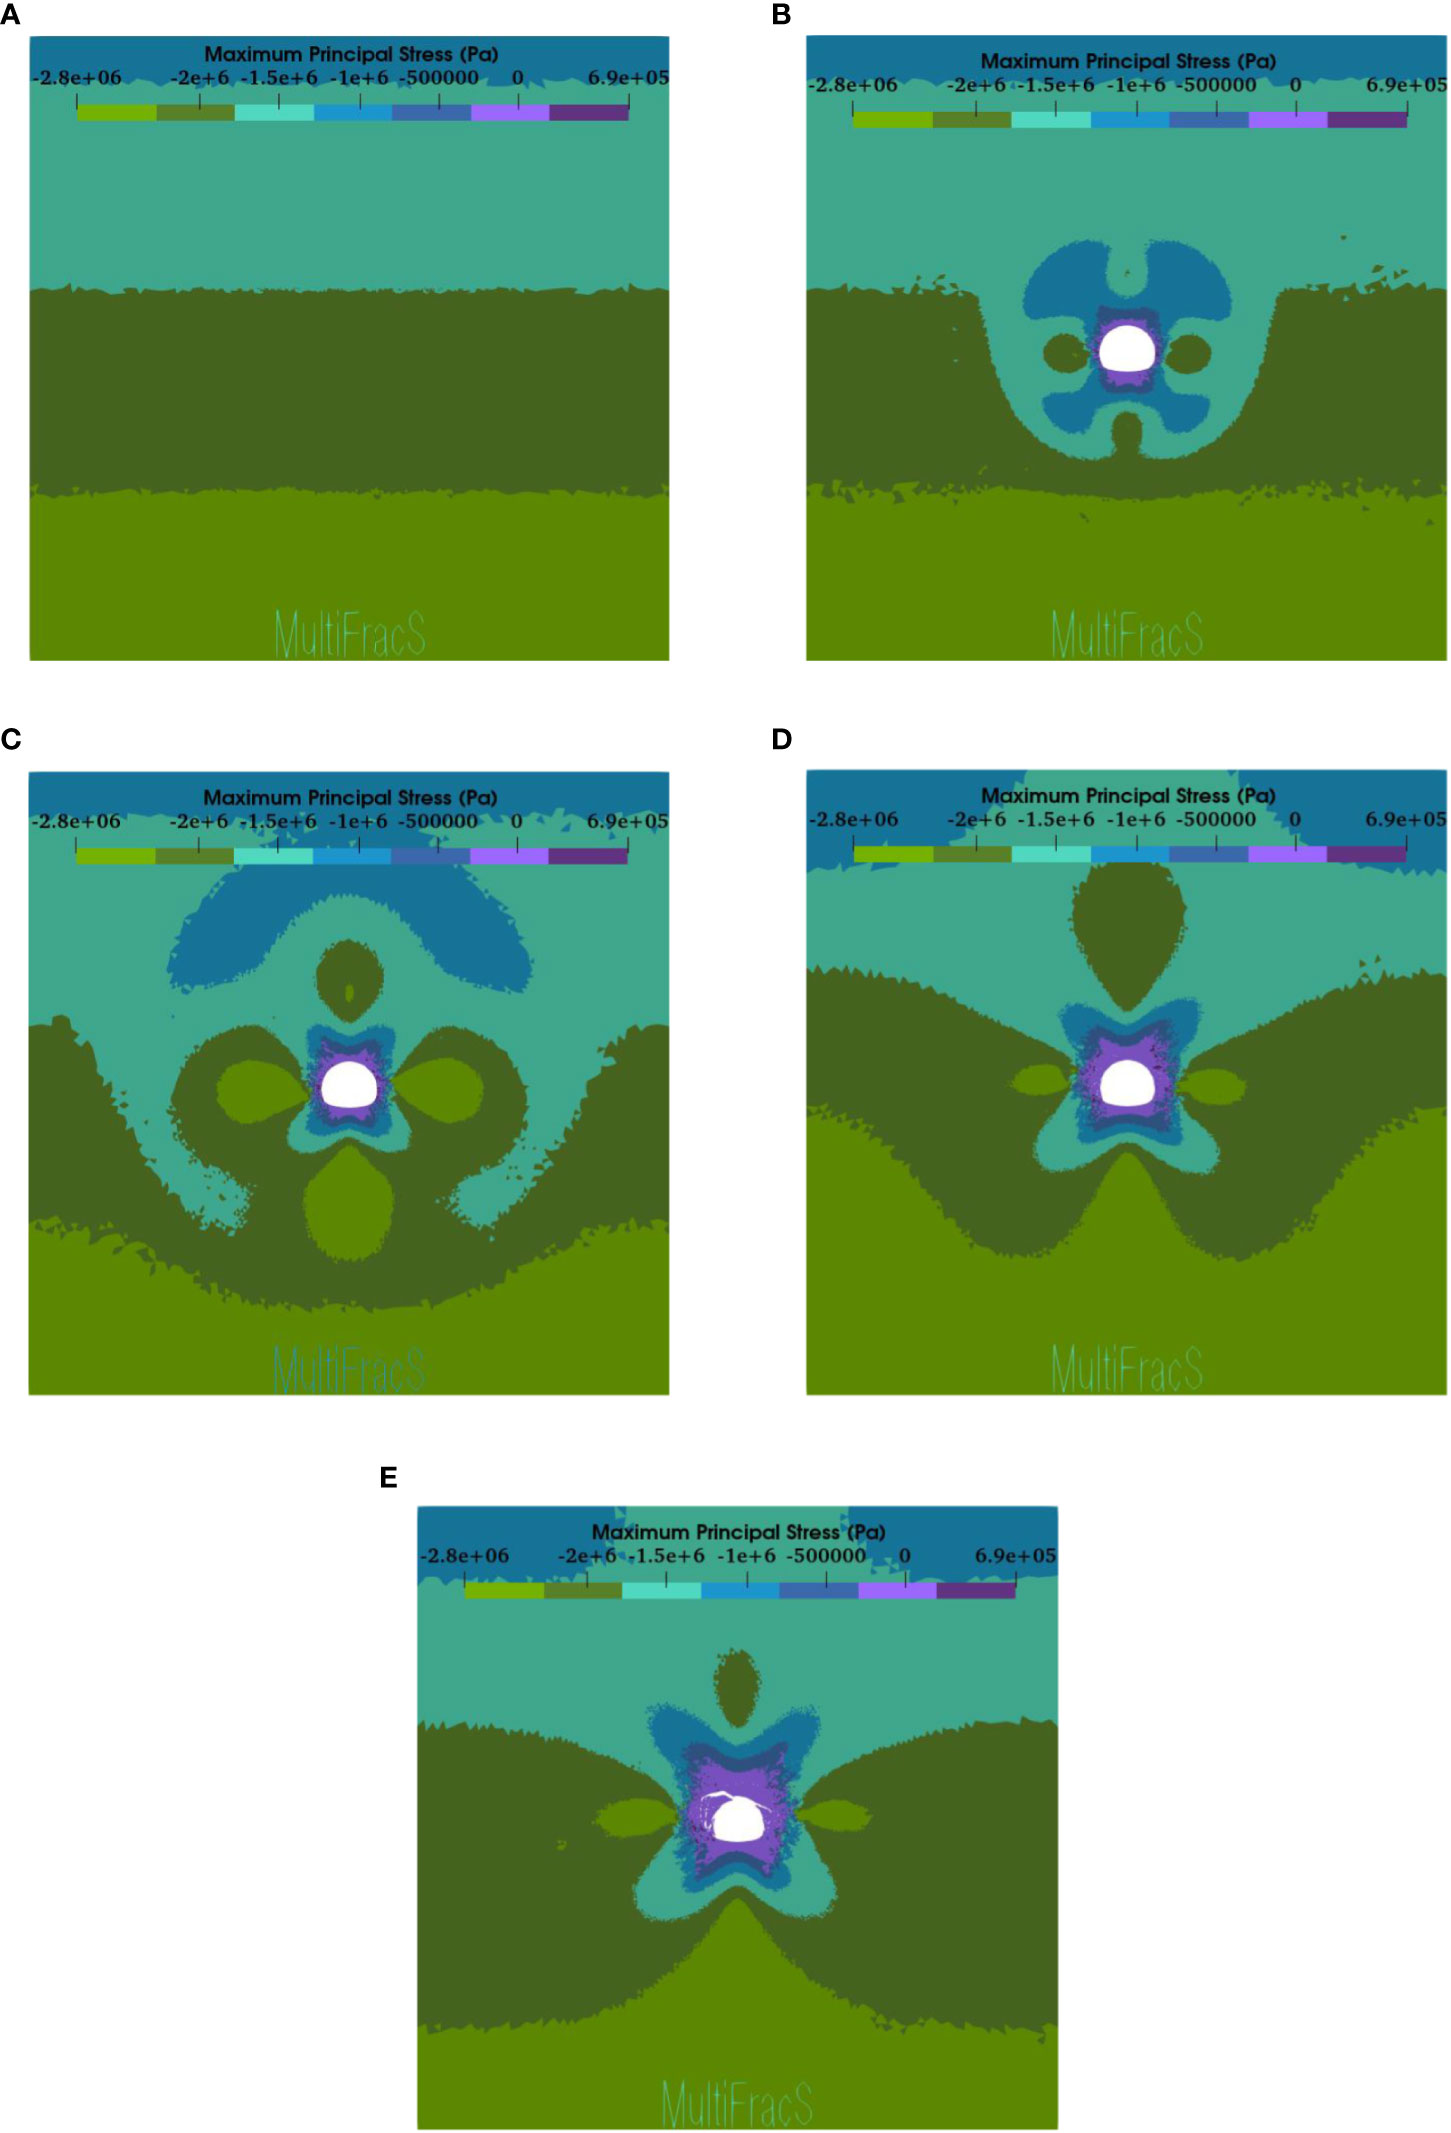
Figure 6 Nephogram of maximum principal stress of tunnel after excavation under gravity stress field. (A) Geostress equilibrium. (B) 10,000 time steps. (C) 20,000 time steps. (D) 110,000 time steps. (E) 300,000 time steps.
After excavation, the stress of rock mass in the tunnel is released, and the radial compressive stress provided by the rock mass in the cavern disappears, resulting in the surrounding rock to transition from a state of two-direction compressive stress to unidirectional compressive stress. And the stress borne by the rock mass in the cavern is transferred to the surrounding rock, causing the increase of tangential stress in the surrounding rock. In essence, tunnel excavation is a process in which tangential pressure of surrounding rock increases and radial pressure decreases. The surrounding rock breaks when the tangential stress exceeds the compressive strength corresponding to the radial stress. During the failure process after excavation, cracks and spalling occur on both sides of the side wall first, the fracture zone develops along the radial direction, and cracks extend and develop on both sides of the cavern (Figure 7A). Subsequently, the cracks continued to grow at the spandrel and intersected at the vault, resulting in settlement deformation of the vault with significant collapse (Figure 7B). Eventually, the surrounding rock breaks and expands, and the rock mass moves toward the center of the cavern, causing the deformation of the tunnel section and the reduction of the area.
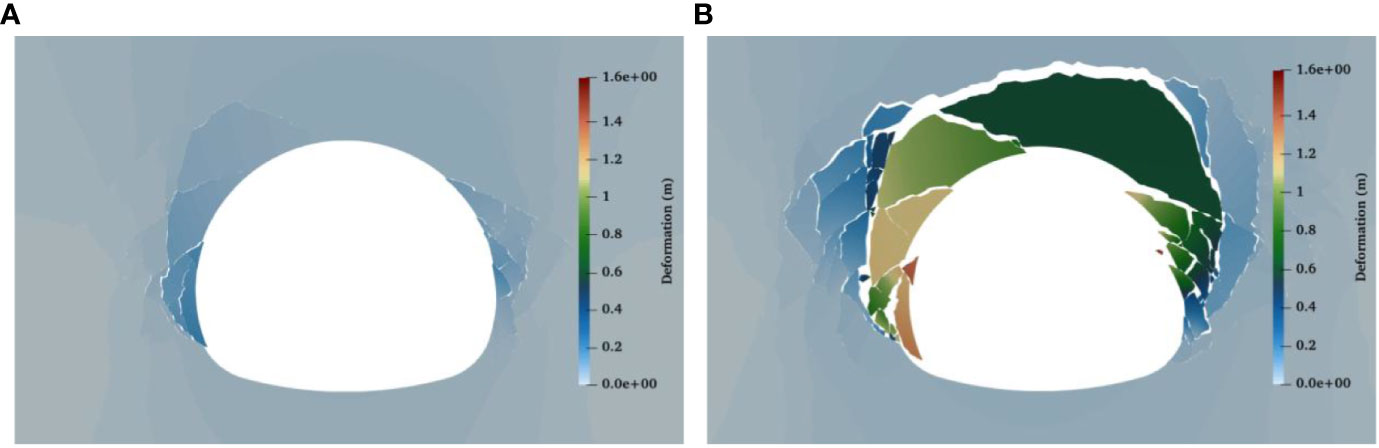
Figure 7 Deformation process of surrounding rock after excavation. (A) Radial convergent deformation of both side walls. (B) Large spandrel deformation and vault collapse.
When the tunnel face was excavated, stress concentration occurred at the arch foot of the tunnel, and the crack was first generated at this position (Figure 8A). With the advance of tunnel excavation time, the stress concentration near both sides of the side wall intensifies, and the crack continues to expand to the deeper rock mass until the concentrated stress at the crack tip reaches the ultimate equilibrium state. As the whole surrounding rock is in a state of compression, the vertical geostress is much greater than the horizontal geostress, which makes the cracks mainly expand at the side wall, and the cracks are mainly tensile-shear mixed crack (Figure 9), showing a conjugate cross distribution (Figure 8B). After the shear crack has fully extended, the rock mass on both sides of the side wall gradually loosens and falls off, converging and deforming into the cavern. The broken rock blocks extrude each other, causing them to overturn into the cavern. This results in a decrease in stress in the fracture zone, forming a local tensile stress zone. Subsequently, cracks on both sides of the side wall gradually extended to the vault and intersected, causing the vault to collapse (Figure 8C). After tunnel excavation, the failure zone is mainly distributed in the spandrel, taking on an inverted V shape. Tensile cracks are the primary cracks in the shallow part of the surrounding rock, while shear cracks are the primary cracks in the deep. The conjugate shear angle gradually decreases and annihilates in the deep part.
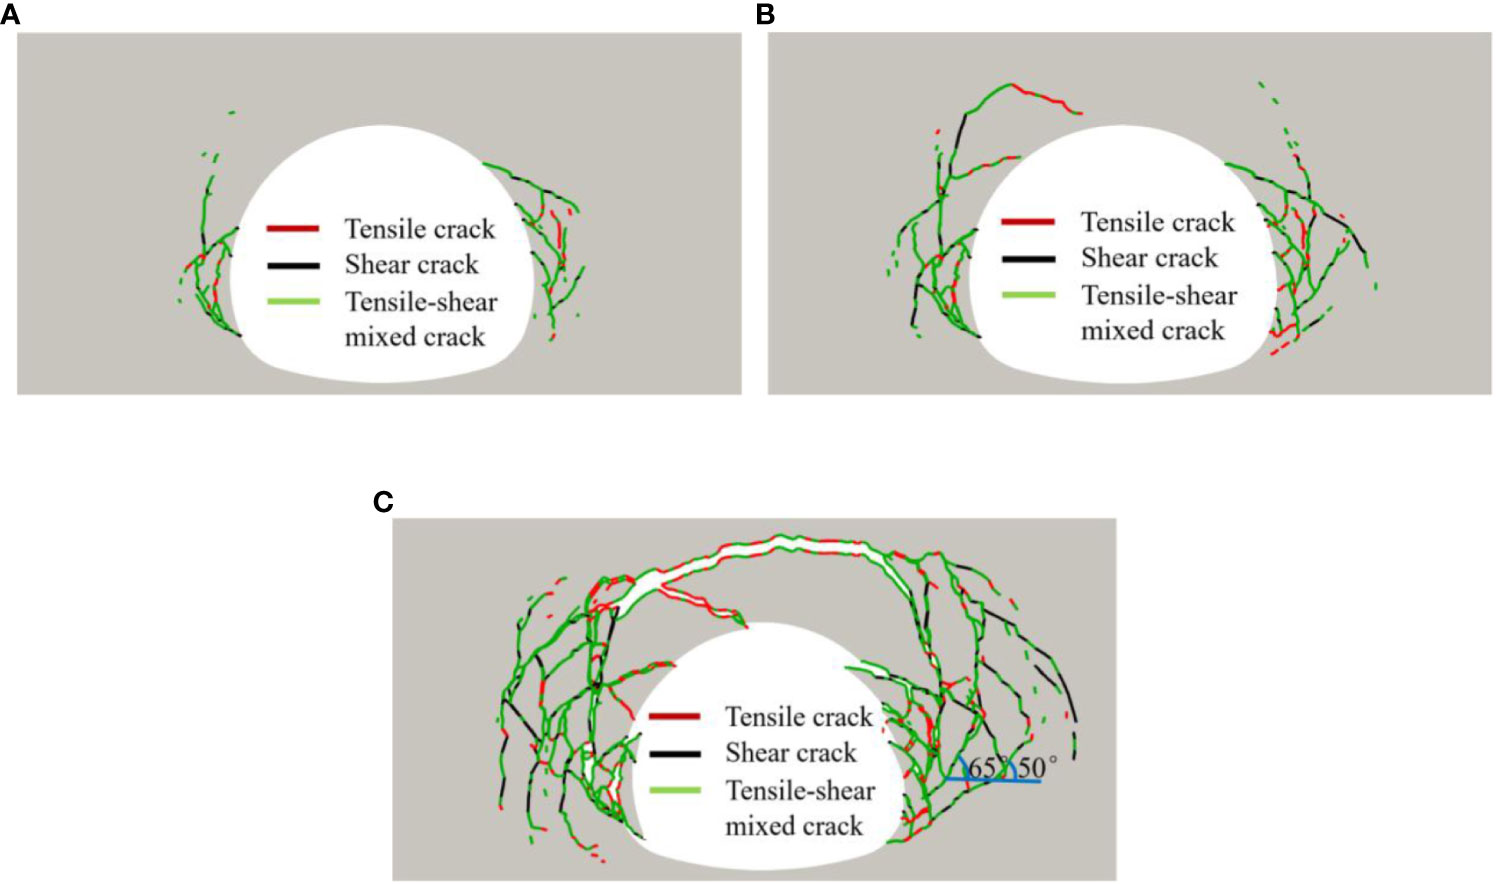
Figure 8 Crack propagation process of surrounding rock after excavation under gravity stress field. (A) 30,000 time steps. (B) 90,000 time steps. (C) 300,000 time steps.
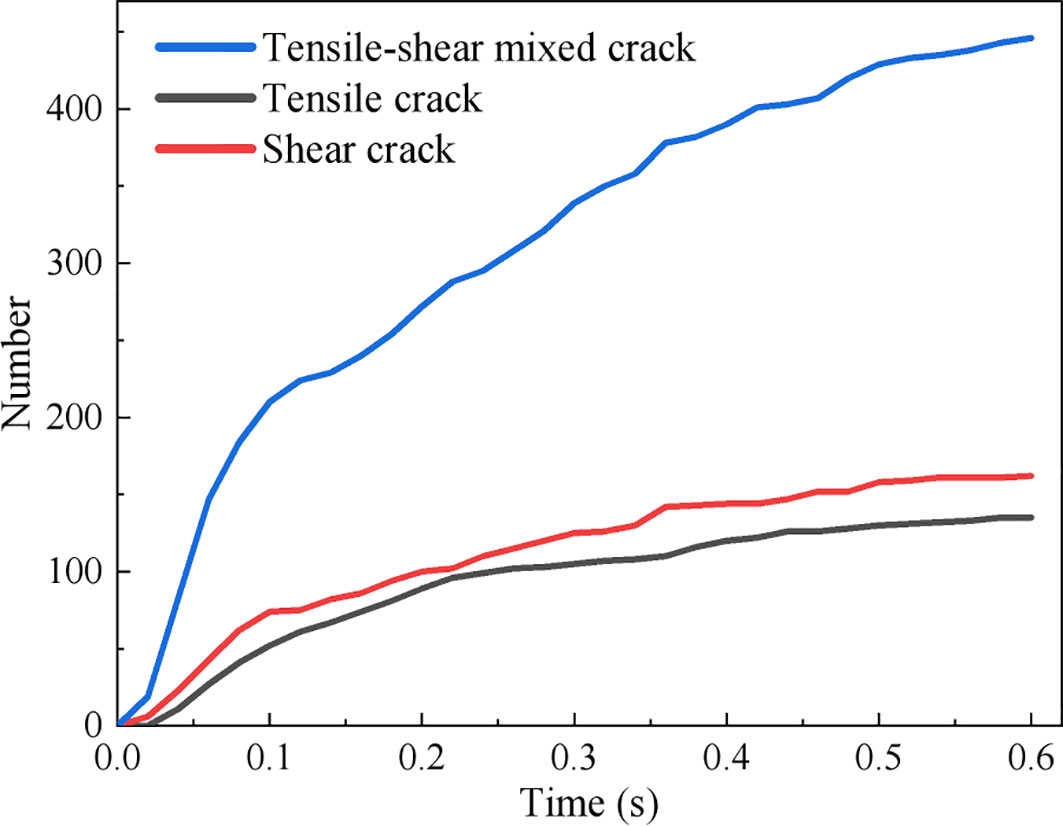
Figure 9 Variation of the number of cracks in surrounding rock after tunnel excavation under gravity stress field.
The finite element model with the same mechanical parameters and geometric dimensions as the FDEM model is established to analyze the tunnel stability, in which the surrounding rock adopts the Mohr-Coulomb constitutive model. The plastic zone distribution after tunnel excavation was calculated, and the specific simulation results are presented in Figure 10. By comparing the plastic zone and fracture zone calculated by both methods, it can be observed that the failure location and degree are essentially identical, and the contours of the failure area are in good agreement. This verifies the validity and rationality of FDEM for tunnel stability analysis. Moreover, FDEM successfully simulates the gradual transformation process of the surrounding rock from continuous to discontinuous under the influence of excavation unloading effect. It also reproduces the process of crack germination, propagation, and collapse in the process of tunnel surrounding rock failure after excavation, which is more consistent with the failure mode of tunnel surrounding rock as a discontinuous medium. The simulation results are more realistic, intuitive, and consistent with actual tunnel excavation failure mode.

Figure 10 Comparison of simulation results of two methods. (A) Plastic zone calculated by finite element method. (B) Fracture zone calculated by FDEM.
The model of a high-speed railway tunnel with a design speed of 350km/h in IV-level surrounding rock is utilized. The ratio of the uniaxial saturated compressive strength () of the rock to the maximum initial geostress () in the vertical axis direction is used to reflect the initial geostress state, in accordance with the evaluation standard of the initial geostress state in the Code for Design of Railway Tunnel (TB10003-2016). Other calculation parameters are held constant, and the value is varied to 1.5, 3, 4.5, 6, 7.5, and 9, resulting in a total of six working conditions. This is used to simulate three stress states: general stress, high stress, and very high stress.
Based on the engineering geological conditions of the Wufeng Tunnel, Silurian shale has been chosen as the representative rock for the tunnel surrounding rock. The uniaxial saturated compressive strength of the shale has been determined to be 18MPa based on engineering data and serves as the benchmark for calculations. And then the simulated working conditions under various initial geostress are confirmed (Table 3). Since the deep buried tunnel is mainly affected by geostress, gravity is not considered in the model. The application method of initial geostress is shown in Figure 11.
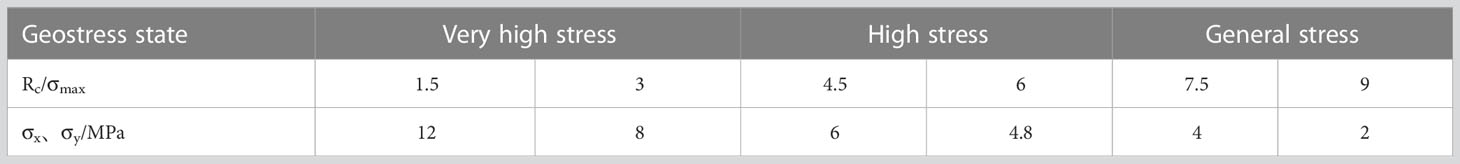
Table 3 Simulation scheme of initial geostress (lateral pressure coefficient=1, ).
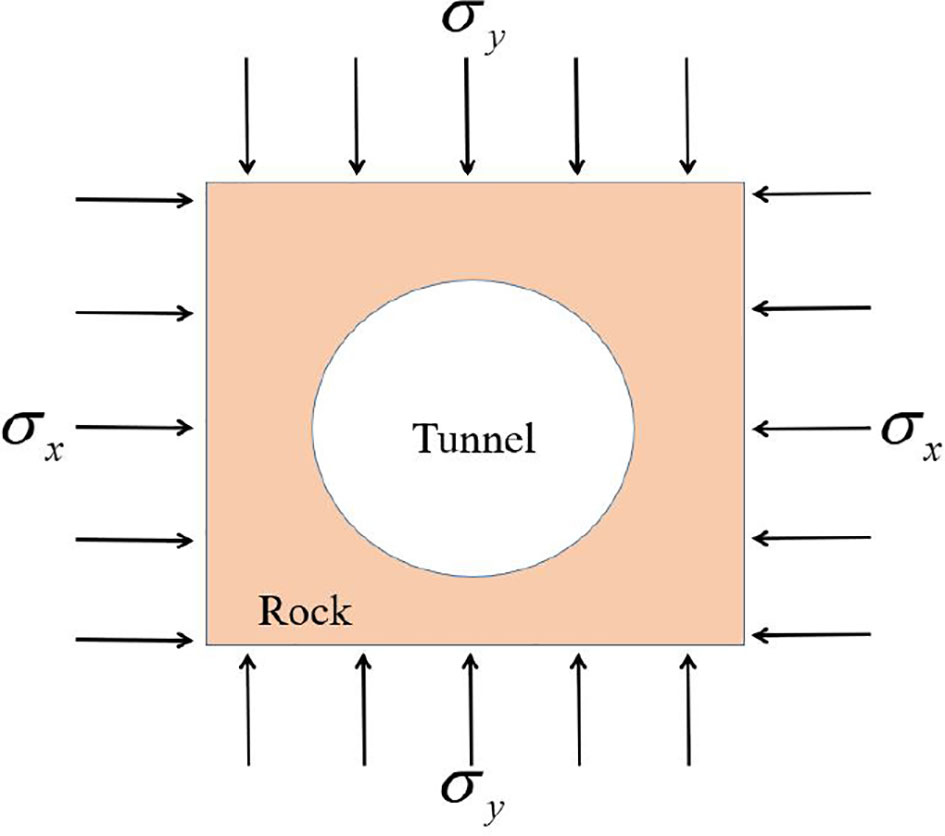
Figure 11 Schematic diagram of initial geostress field of tunnel.
Three different conditions of geostress were chosen for analysis: general , high , and very high . The simulation results are presented in Figure 12. When the geostress is low (Figure 12A), the tunnel’s surrounding rock can maintain a stable state following excavation, and the tension area is limited to within 2 meters near the tunnel section. Meanwhile, the excavation’s disturbance does not propagate deep into the surrounding rock, resulting in a small stress disturbance area. When (Figure 12B), the surrounding rock collapses, causing the tunnel’s critical stable section to shift deeper. The distribution range of the tension zone increases to twice the tunnel diameter, and the stress disturbance zone caused by excavation forms an obvious evenly-distributed ring. When the geostress reaches a very high state (, Figure 12C), the collapse range of the surrounding rock is further expanded, and the distribution range of the tension zone extends to three times the diameter of the tunnel. The stress disturbance caused by excavation also spreads to the boundary of the model. In conclusion, under a geostress field with a lateral pressure coefficient of 1, the stress value of the surrounding rock near the excavation section will sharply drop after excavation. The tension zone will appear near the excavation section, and the stress disturbance zone will be distributed annularly around the contour surface of the cavern. Then the surrounding rock stress gradually transition from tensile stress in shallow part to the original stress in deep part of tunnel face. Compared with the simulation results of gravity stress field, the maximum principal stress distribution in geostress field does not exhibit an obvious stress concentration phenomenon.
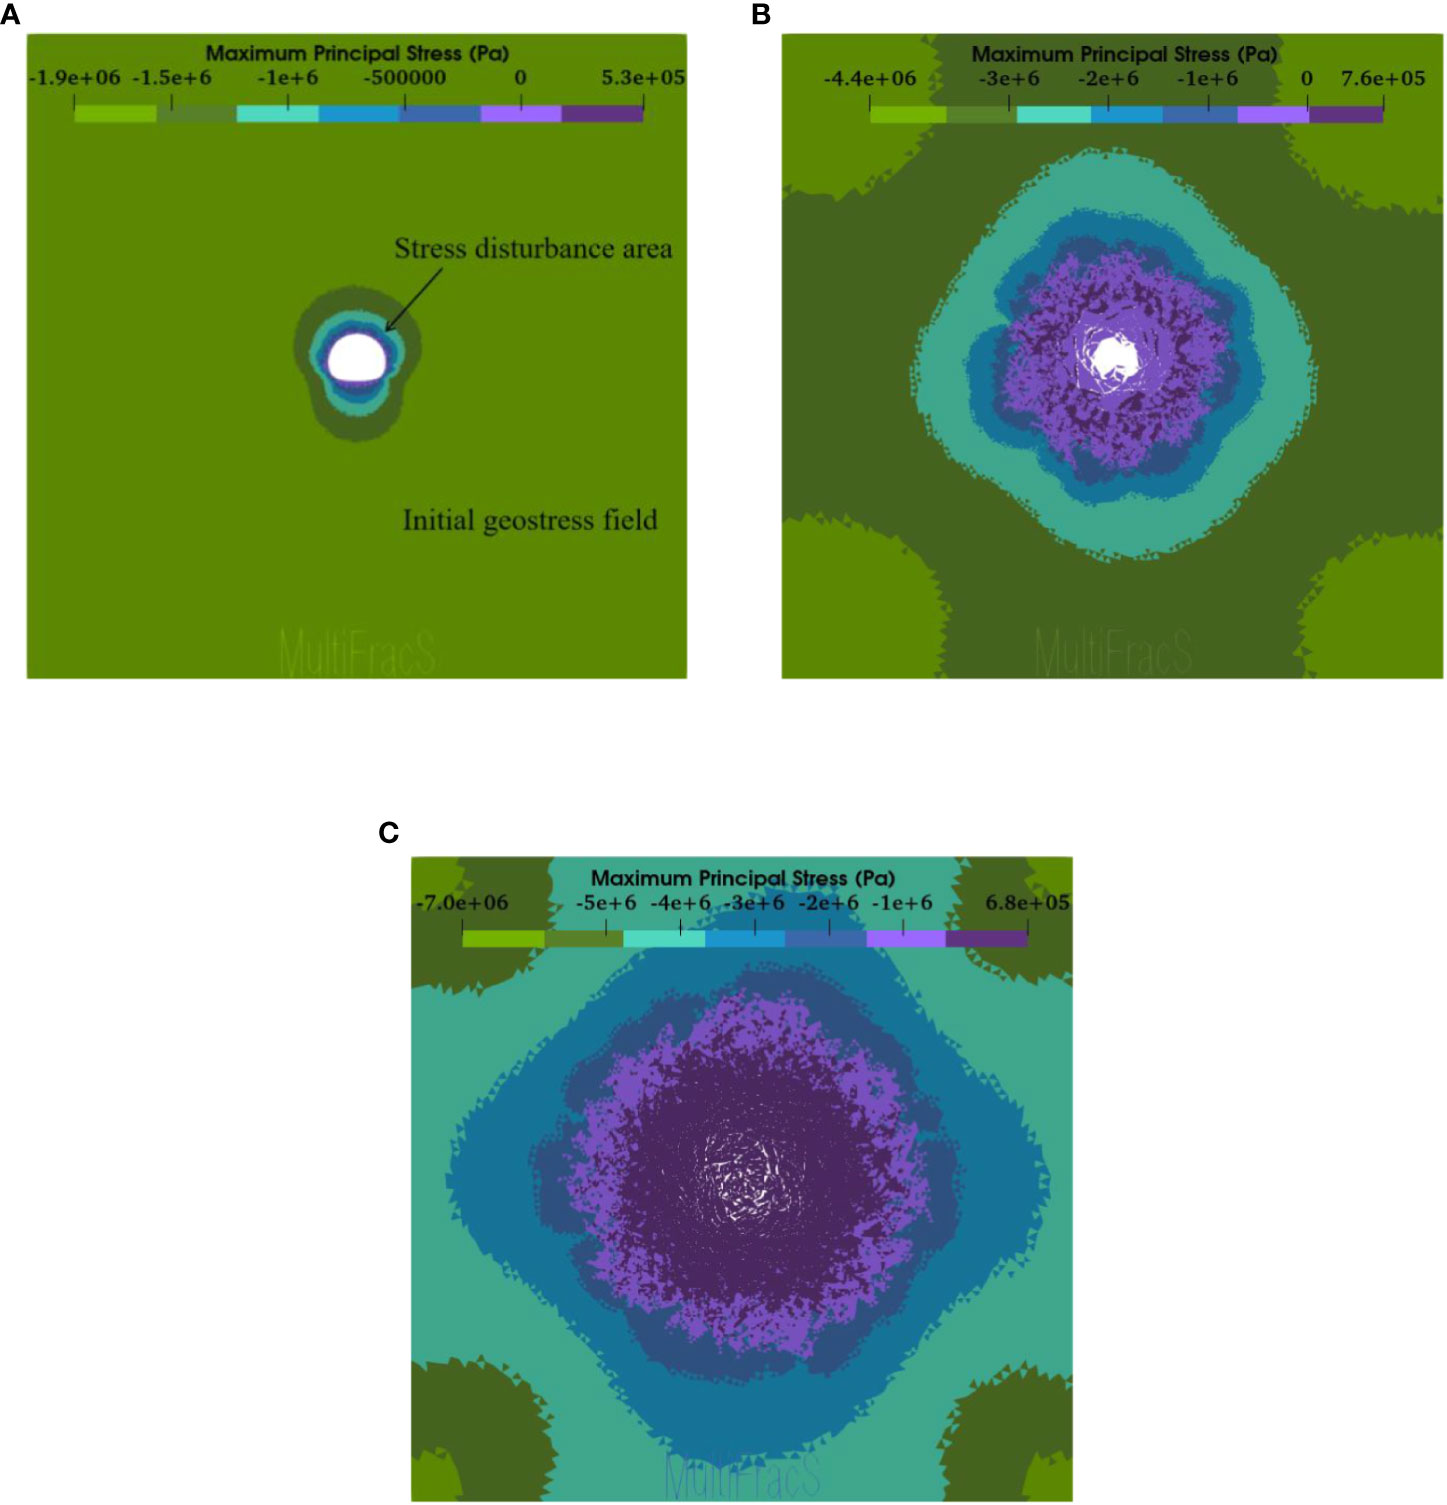
Figure 12 Maximum principal stress distribution of the tunnel after excavation under different geostress fields. (A) Rc / σmax = 9. (B) Rc / σmax = 6. (C) Rc / σmax = 3.
The working condition with high geostress () was selected for analysis, and the simulation results are presented in Figure 13. Following tunnel excavation, failure occurred around the tunnel face, and the overall failure form was circular. Initially, cracking and loosening occurred in the vault, side wall and inflected arch, and the fracture area gradually developed to the depth of surrounding rock (Figure 13A). The volume of rock block produced by shear crack cutting in deep surrounding rock increases gradually. Additionally, the deep crushed rock compresses the shallow rock, making the shallow rock turn over to the cavern (Figure 13B). The large overturning movement of rock blocks and the contact non-occlusion between the blocks make the surrounding rock produce the large deformation of crushing expansion in meter scale. Compared to the failure mode under the gravity stress field, the failure of the surrounding rock under the geostress field is influenced by both horizontal and vertical compressive stresses. There was significant uplift in the inflected arch and extensive collapse in the vault. Moreover, the failure zone of the surrounding rock exhibits no apparent directional preference. These observations suggest that the horizontal geostress plays a critical role in determining both the failure mode and the extent of surrounding rock.
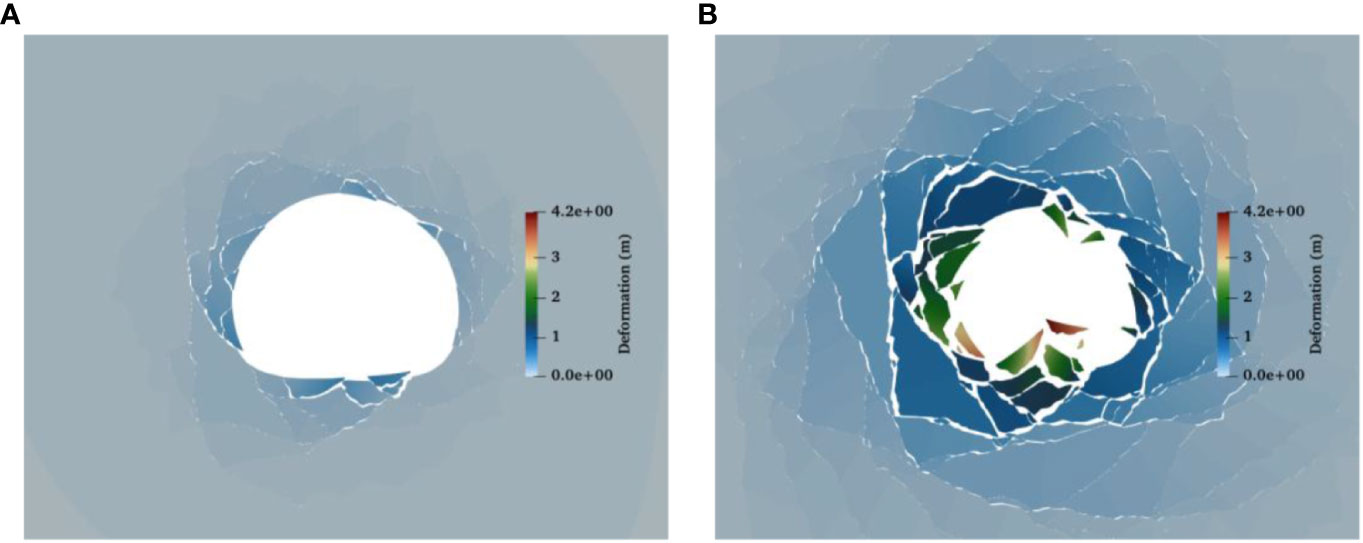
Figure 13 Displacement nephogram of surrounding rock under high geostress. (A) Surrounding rock begins to break. (B) Inflected arch uplift and vault collapse.
High geostress () is selected for analysis. The simulation results demonstrate that the cracks produced due to tunnel excavation are primarily tensile-shear mixed crack, followed by shear cracks and a small proportion of tensile cracks. The overall distribution pattern of cracks appears to be annular and conjugate, with a higher density of cracks observed near the excavation section and a lower density in the deep surrounding rock. After the tunnel excavation, cracks appear in the shallow part of the surrounding rock due to the action of both vertical and horizontal geostress. These cracks are mainly tensile-shear mixed crack (Figure 14A). Subsequently, the cracks progressively extend to the depth of surrounding rock, with the maximum propagation depth being 30.4 m, approximately twice the tunnel’s equivalent diameter. The cracks observed in the deeper surrounding rock are mainly shear cracks, exhibiting a distinct conjugate distribution pattern (Figure 14B). Eventually, the shear angle of the crack decreases gradually and becomes annihilated along the depth direction, which leads to the cessation of failure of the surrounding rock.
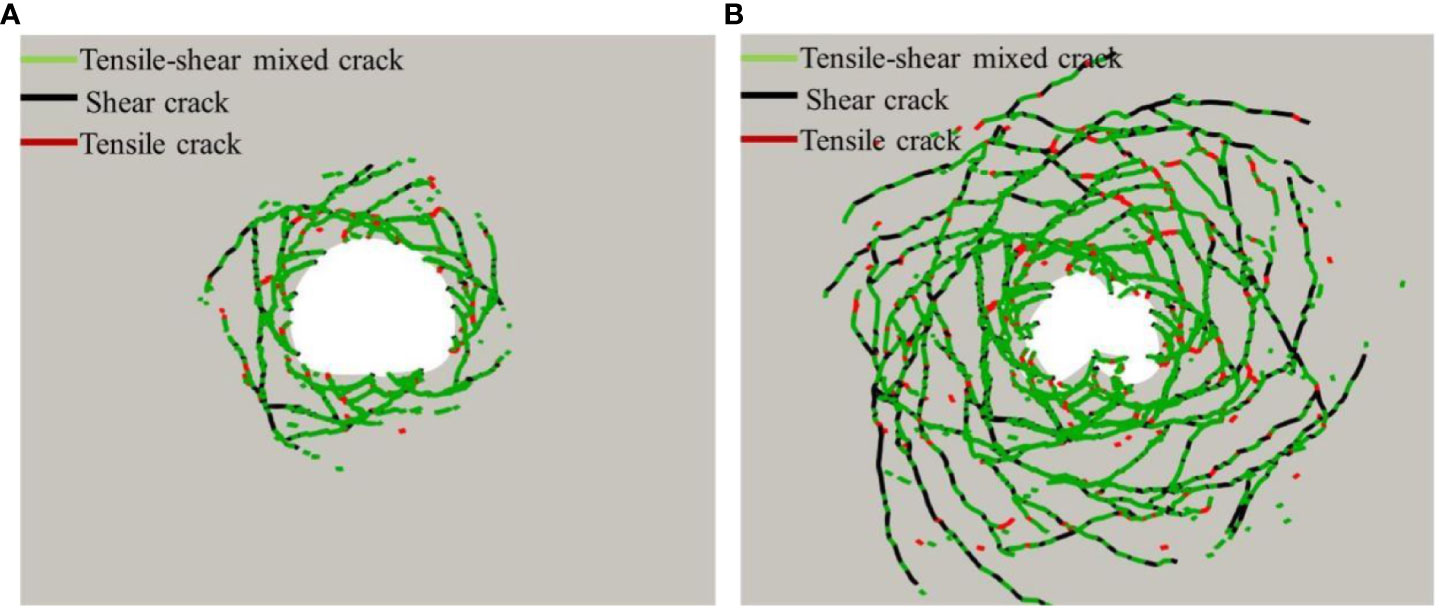
Figure 14 Crack distribution of surrounding rock under high geostress. (A) 12,000 time steps. (B) 36,000 time steps.
Figure 15 illustrates the failure of the surrounding rock after excavation under six different geostress conditions. It is observed that only at a geostress of 2 MPa, the surrounding rock can maintain the stability. Under all other conditions, the tunnel experiences deformations at the meter-level after excavation, and large deformations occur under very high geostress conditions. This emphasizes the critical role of the stress state of the tunnel in maintaining the stability of the surrounding rock. When the geostress is 2 MPa (Figure 15A), the displacement of the surrounding rock after excavation is limited to the millimeter level, indicating robust tunnel stability. It is noteworthy that the maximum displacement of the surrounding rock is concentrated at the vault and inflected arch, whereas the maximum displacement of the tunnel after excavation under the gravity stress field is generated in both sides of the side wall. This is due to the presence of horizontal geostress that alter the stress state of the cavern. Therefore, when the tunnel is located in an engineering rock mass with a significant geostress field, special attention should be paid to the stress on the vault and inflected arch during the design and construction process. As the geostress increases to 4 MPa (Figure 15B), the surrounding rock begins to collapse in the shallow section, with the failure area distributed evenly around the cavern contour, and the maximum failure depth reaching 7.4 m. When the geostress gradually increases to 4.8MPa and 6MPa (high geostress), the failure zone begins to propagate to the depth of the surrounding rock. The deep broken rock began to extrude the shallow rock, forcing the shallow rock to overturn to the cavern. The maximum depth of the corresponding failure zone reaches 16m and 25m respectively (Figures 15C, D). Under very high geostress (Figures 15E, F), the failure zone of surrounding rock further radiates outward, and the maximum depth of the failure zone under 8MPa and 12MPa conditions reaches 31 meters and 42 meters respectively. Meanwhile, the surrounding rock at the excavated section is more broken, and loose and collapsed rock blocks jam the entire tunnel face.
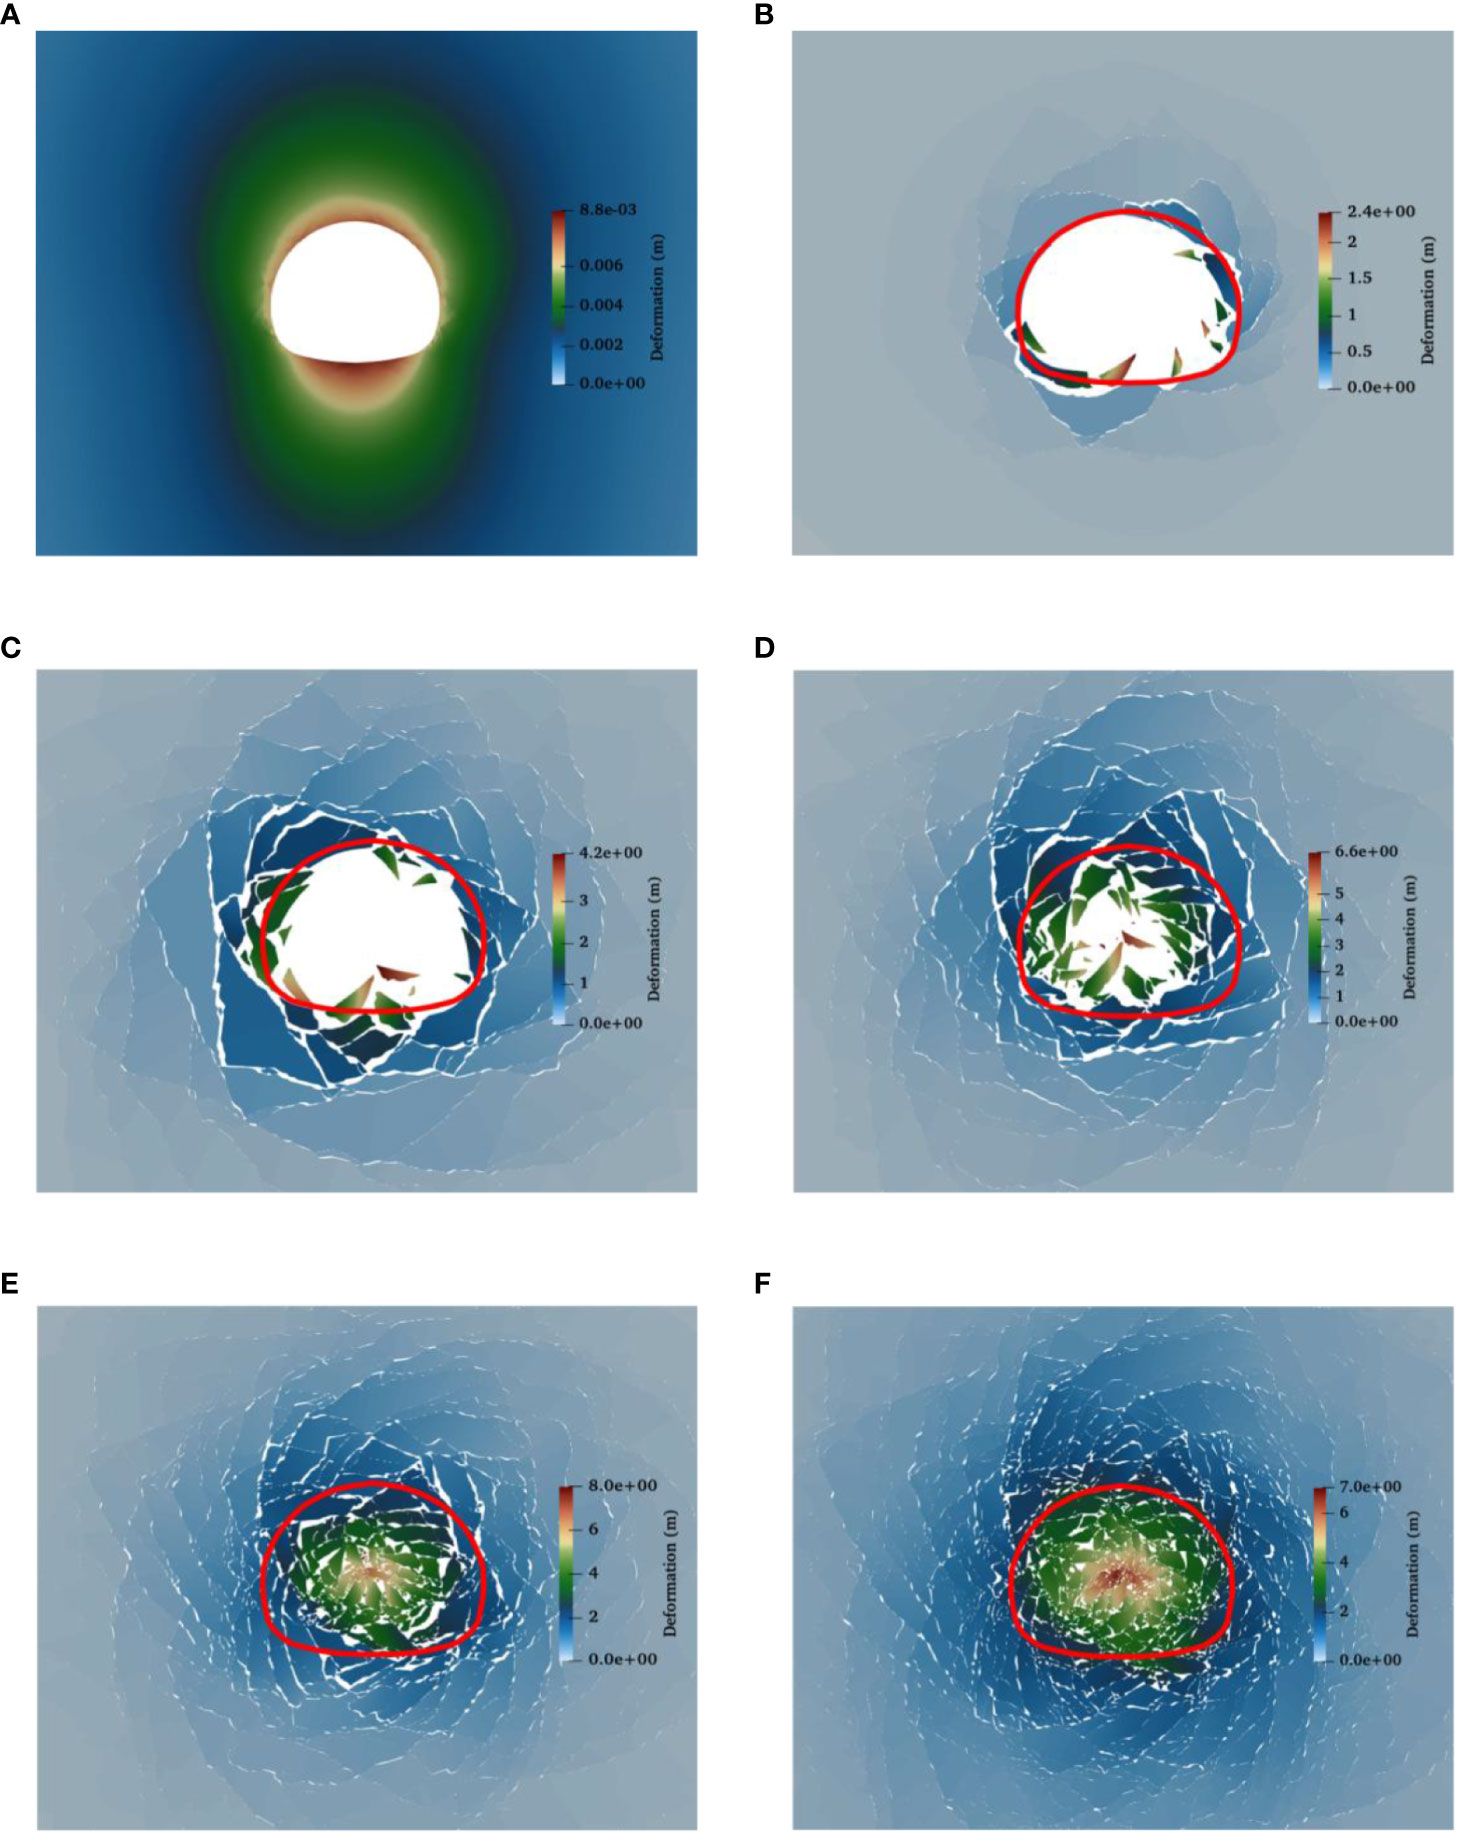
Figure 15 Failure of the tunnel after excavation under different geostress fields. (A) 2MPa. (B) 4MPa. (C) 4.8MPa. (D) 6MPa. (E) 8MPa. (F) 12MPa.
In general, the IV-level surrounding rock can maintain a certain stability after excavation under general geostress conditions. However, as geostress increases, a failure zone appears around the excavation section and gradually develops deeper into the surrounding rock. At very high geostress conditions, the failure zone can extend more than three times of the tunnel diameter. At this point, the rock generated from collapse completely blocks the cavern, resulting in the overall collapse and destabilization of the tunnel.
The determination of surrounding rock pressure is a fundamental problem in tunnel engineering. The calculation theory for this problem has gone through three stages: classical pressure theory, loose media pressure theory, and elastic-plastic pressure theory. Despite numerous achievements made by scholars in this field, the calculation method for surrounding rock pressure still has limitations due to the complexity and randomness of rock mass properties, geostress, boundary conditions, and construction methods. When using the traditional safety factor method for design, only the most unfavorable situation of surrounding rock pressure needs to be found (Xiao, 2020). Therefore, this paper proposes using the design value of surrounding rock pressure as the design support force to solve the problem that the actual surrounding rock pressure is difficult to determine. Additionally, this paper analyzes the impact of geostress on the design value of surrounding rock pressure.
Based on the strength reduction method, the FDEM is utilized to determine the required minimum supporting force for maintaining the equilibrium of the failure zone of the surrounding rock at the tunnel vault. Then 1.4 times of the minimum supporting force is taken as the design value of surrounding rock pressure. Figure 16 shows the schematic diagram of the calculation principle of the design value of surrounding rock pressure. The specific steps are as follows:
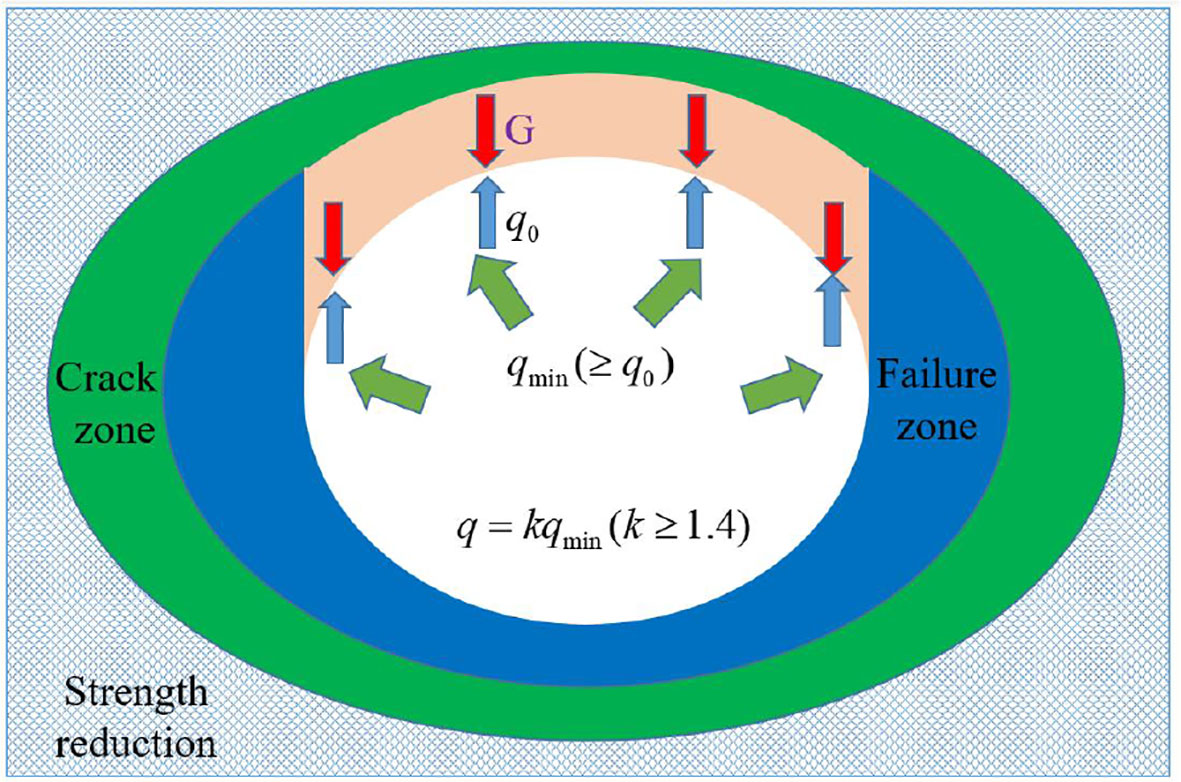
Figure 16 Schematic diagram of calculation principle of surrounding rock pressure design value.
(1) A numerical model of FDEM is established. Considering the weakening effect of groundwater, joint surface and other factors on the strength of surrounding rock, the strength of mechanical parameter of surrounding rock is reduced, and the reduction coefficient is generally 1.15 (Xiao, 2020). After the tunnel excavation, the model is calculated to converge, and the crack zone and failure zone of the surrounding rock are computed separately.
(2) The gravity of surrounding rock failure zone within the span of the cavern is calculated, and it is equivalent to the uniform load along the span direction.
(3) Following the tunnel model described in (1) an excavation simulation is again conducted. Normal supporting force of initial value is applied to the tunnel section, and the supporting force is gradually adjusted until there is no failure zone around the section. The supporting force is recorded at this point as the minimum supporting force . Then, the horizontal load is calculated by multiplying the vertical load with the lateral pressure coefficient.
(4) The design value of the surrounding rock pressure is determined by multiplying the minimum supporting force with the safety factor k. k is usually greater than 1.4 and can be adjusted based on factors such as the importance of the engineering project and the degree of deformation control required.
In the above steps, the failure zone is identified based on displacement. When the displacement of the surrounding rock near the excavation section reaches a specific value, it is considered locally unstable and the failure zone is formed. The displacement criterion refers to the allowable relative convergence value around the cavern (Table 4) in the Technical Code for Engineering of Ground Anchorages and Shotcrete Support (GB50086-2015). The relative convergence value around the cavern represents the ratio of the measured displacement between two measuring points and the distance between them, or the ratio of the measured displacement of the vault and the span of the tunnel.
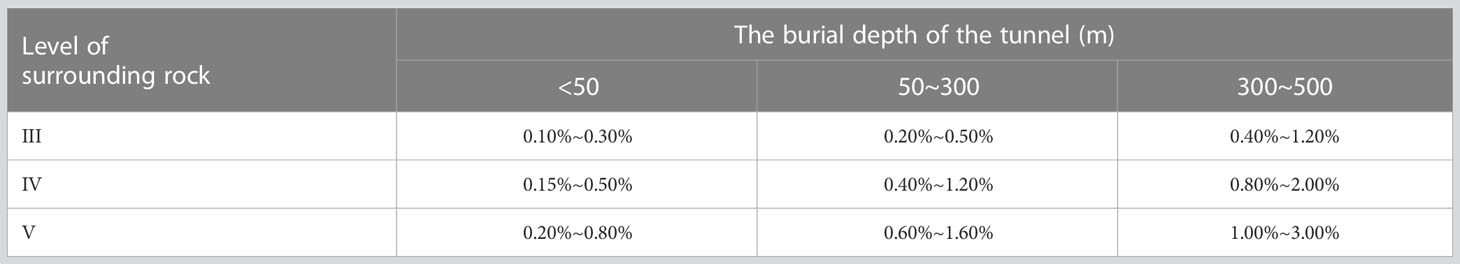
Table 4 The allowable relative convergence value around the cavern.
Taking a high-speed railway tunnel with a burial depth of 200m and a design speed of 350km/h in the IV-level surrounding rock as an example, the design value of surrounding rock pressure is calculated. After the tunnel excavation, the equivalent uniform load of gravity of the failure zone in the tunnel vault is calculated as 16kPa. Subsequently, excavation simulation is conducted again, followed by the application of supporting force, and the model is calculated until it converges. Finally, the supporting force is gradually adjusted until the surrounding rock no longer produces a failure zone after excavation.
The simulation results under different supporting forces are shown in Figure 17. When the supporting force is 16kPa (Figure 17A), the simulation results show that when the supporting force is small, the cracks will intersect at the tunnel vault, and the side walls on both sides will converge and deform towards the cavern. The surrounding rock around the cavern will collapse, and the excavation disturbance area will be large. With 25kPa supporting force applied (Figure 17B), the excavation disturbance area decreases significantly. Although cracks still appear at the vault and intersect at the right spandrel, no rock falls off from the rock mass. When the supporting force increases to 54kPa (Figure 17C), the excavation disturbance area is concentrated in a smaller region around the cavern. The cracks in the surrounding rock decreased obviously and mainly concentrated on both sides of the side wall. The cracks do not intersect at the vault, which remains stable, and no rock spalling occurs on both sides of the side wall. The relative convergence value of the tunnel is 0.99%, and the tunnel remains stable. Subsequently, the supporting force continues to increase, but the relative convergence value of the tunnel remains stable at about 1% (Figure 18), meeting the requirements of surrounding rock stability. Therefore, 54kPa is the minimum supporting force required for the high-speed railway tunnel.
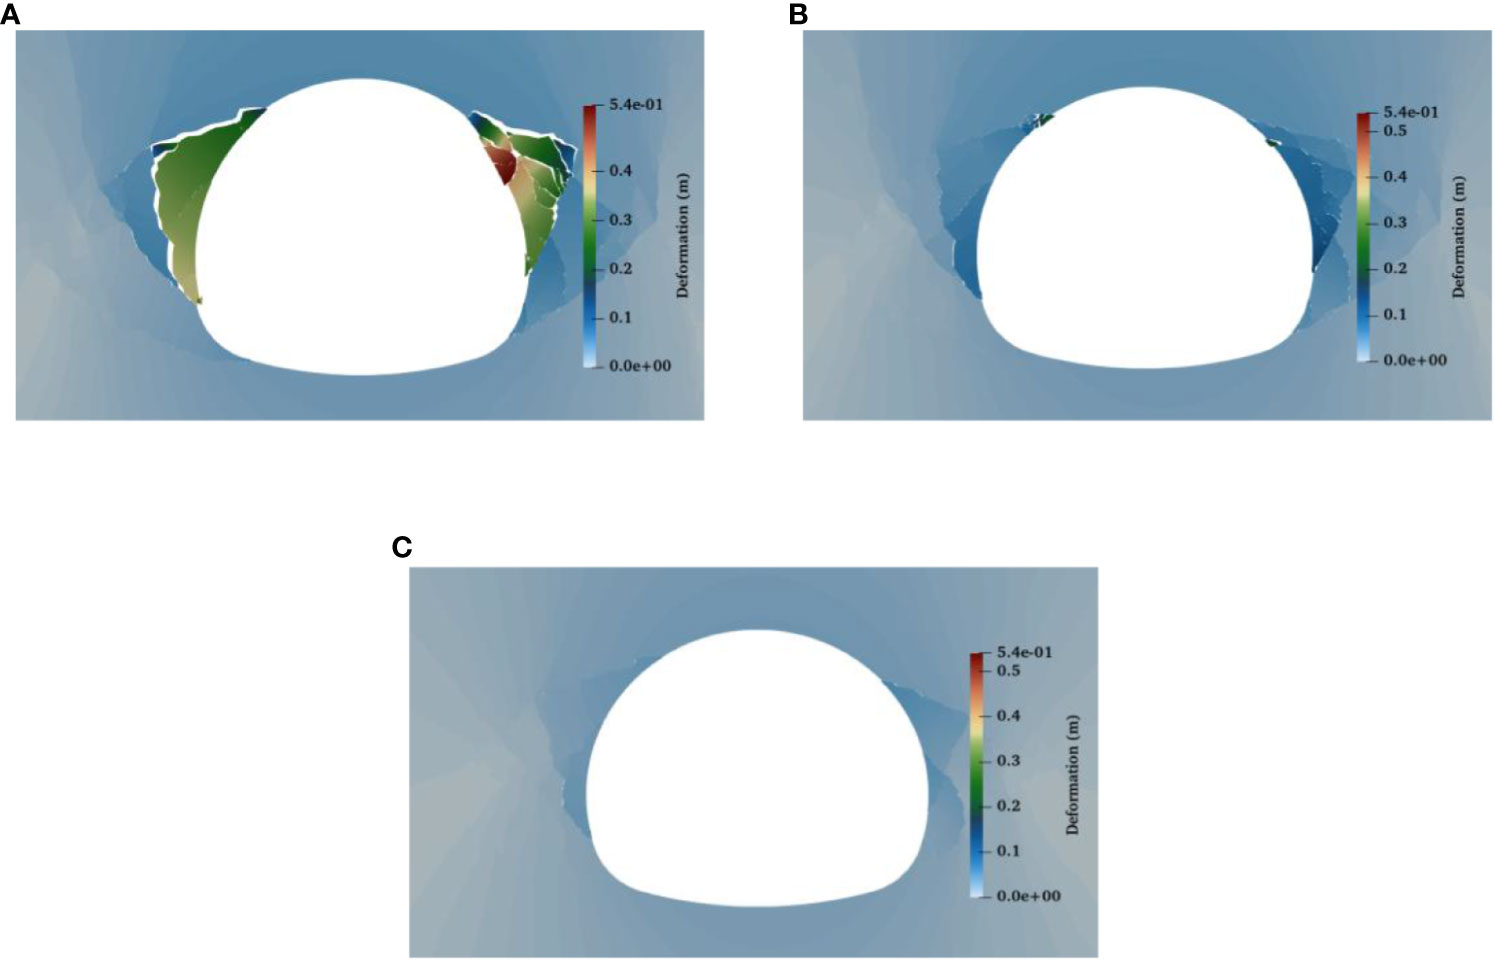
Figure 17 Deformation of cavern with different supporting forces. (A) 16kPa. (B) 25kPa. (C) 54kPa.
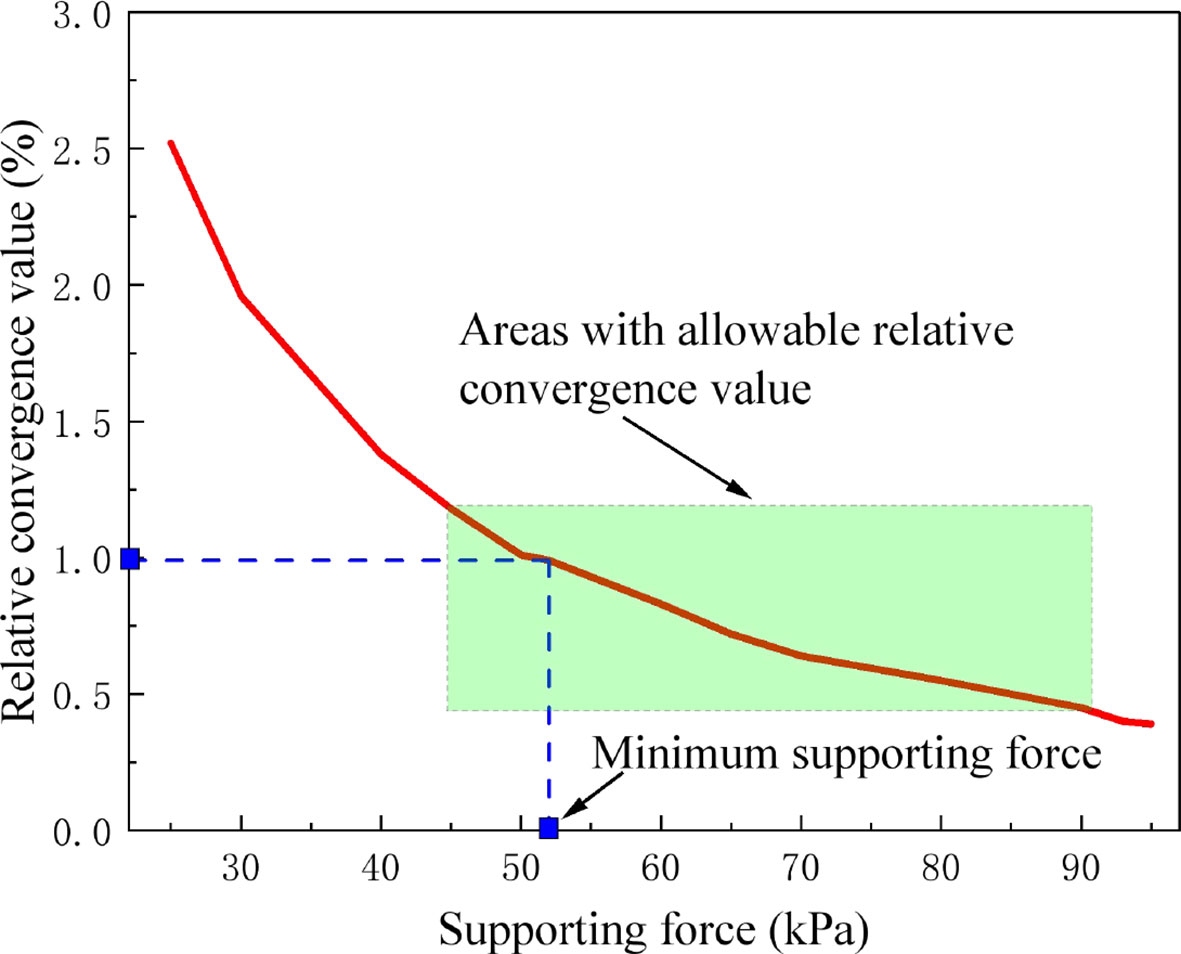
Figure 18 Variation curve of relative convergence value of tunnel under different supporting forces.
When the buried depth of the tunnel is no less than 10 ~ 15 times of the tunnel diameter, the formula for calculating the surrounding rock pressure is as follows for surrounding rock that conforms to the Mohr-Coulomb yielding criteria (Cai, 2002).
Vertical uniform load:
Horizontal uniform load:
where, is the volumetric weight of surrounding rock; is the lateral pressure coefficient of surrounding rock; and are the adjustment coefficients of surrounding rock pressure at the arch and side of the tunnel respectively; and is the radius of the tunnel plastic zone at 45° when the supporting force =0. , , and represent the initial stress, cohesive force, and internal friction angle of the surrounding rock respectively. is the included angle with the horizontal axis of the tunnel; is the radius of tunnel. If the section is not circular, the radius of the outer circle of the tunnel section is taken. is the distance from the center of the outer circle of the tunnel section to the tunnel excavation face in the direction of 45°.
When applying the aforementioned theoretical formula to resolve the surrounding rock pressure, the outer circle of tunnel section should be taken as the equivalent circular tunnel first. Subsequently, the theoretical solution for the plastic zone of the equivalent circular tunnel is computed, along with the determination of the depth of the plastic zone in the 45° direction. The gravitational force exerted by the surrounding rock within this depth range serves as the fundamental value of the surrounding rock pressure at the top of the tunnel. Ultimately, the approximate value of the surrounding rock pressure is obtained by multiplying the fundamental value by the adjustment coefficient.
The relevant parameters of the tunnel model in Section 5.1.2 are applied to equations (10) and (12), resulting in the calculation of a surrounding rock pressure of 62 kPa at the top of the tunnel. Although slightly higher than the minimum supporting force determined by the FDEM method in Section 5.1.2, the two values are close. The differences in the calculation results between the two methods are primarily attributed to the parameter related to the importance of the tunnel, which is the adjustment coefficient in the theoretical formula, as well as the allowable relative convergence value around the cavern in the FDEM-based calculation method. When the allowable relative convergence value is set to 0.75%, the calculation results from both methods can be equal (Figure 18). Therefore, it is important to select an appropriate allowable relative convergence value based on the significance of the tunnel. This finding further validates the accuracy of the FDEM-based calculation method for determining the design value of surrounding rock pressure. Moreover, it should be noted that the theoretical formula can solely provide the surrounding rock pressure for a circular tunnel in a homogeneous stratum, whereas the FDEM-based approach allows for the determination of the design value of surrounding rock pressure under complex section and surrounding rock conditions.
The calculation method, based on FDEM as proposed in Section 5.1, was utilized for the calculations. Table 5 presents the calculation results for the design values of surrounding rock pressure of the high-speed railway tunnel with a design speed of 350km/h in the IV-level surrounding rock, considering various geostress. It should be noted that the safety factor “k” in the table is maintained at 1.4.
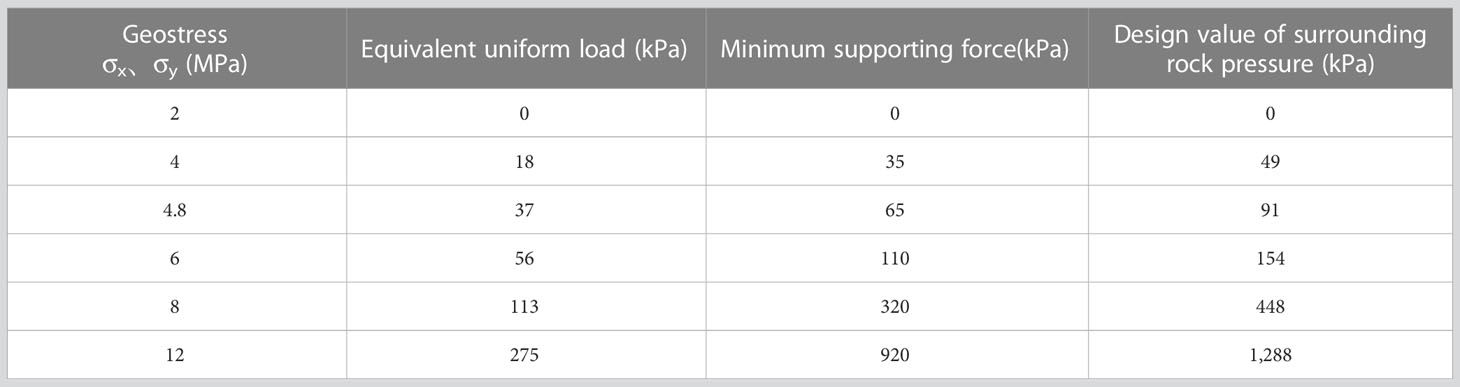
Table 5 Calculation results of design values of surrounding rock pressure under various geostress.
Based on the calculation results of the design value of surrounding rock pressure, it is evident that engineering support measures need to be implemented in all five working conditions, except when the geostress is 2MPa, in order to meet the design requirements. As depicted in Figure 19, it can be observed that the equivalent uniform load, the minimum supporting force, and the design value of surrounding rock pressure exhibit a significant increase with the augmentation of geostress. Specifically, when the geostress varies from 2MPa to 12MPa, the corresponding equivalent uniform load ranges from 18KPa to 275KPa, the minimum supporting force escalates from 35KPa to 920KPa, and the design value of surrounding rock pressure rises from 49KPa to 1288KPa. The curve that represents the design value of the surrounding rock pressure in response to geostress approximately conforms to the quadratic function relation. By fitting the formula, the equation is derived. Notably, all three indicators steadily increase in the general and high geostress stages but sharply increase in the very high geostress stage. Moreover, the curve that illustrates the design value of the surrounding rock pressure shows obvious nonlinearity. This is because under extreme geostress conditions, the tunnel’s surrounding rock generally approaches the limit state. This results in a severe stress-release phenomenon after tunnel excavation, leading to a broad distribution of surrounding rock failure areas. To control the destabilization and collapse of the large-scale failure area, significant supporting force is necessary.
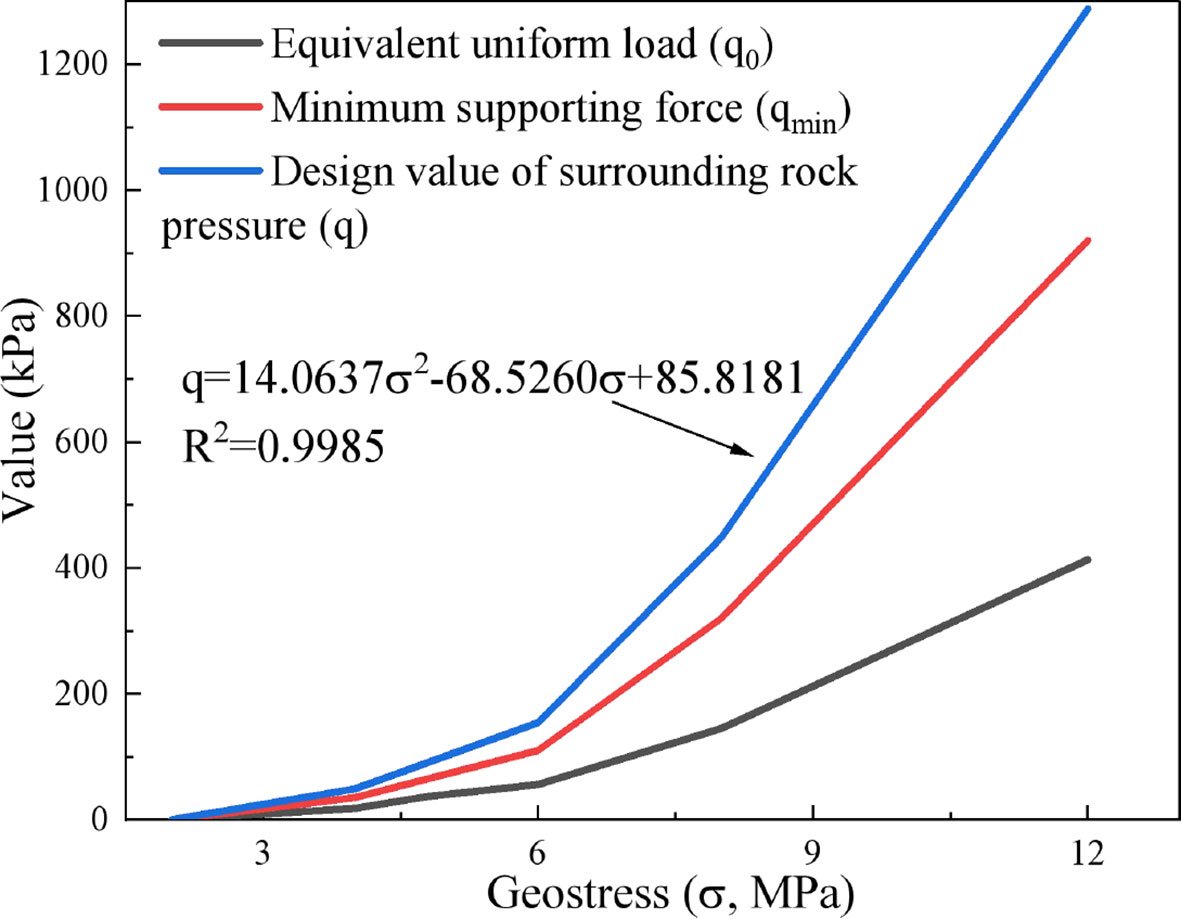
Figure 19 The variation curves of equivalent uniform load, minimum supporting force, and design values of surrounding rock pressure under different geostress.
Additionally, it should be noted that there is an approximate linear relationship between the minimum supporting force and the equivalent uniform load (Figure 20), and the corresponding fitting formula is . This supporting force can restrict the deformation of the surrounding rock of the tunnel after excavation to a small scale and ensure the integrity of the tunnel section. This calculation result also proves the correctness and reasonableness of computing the design value of the surrounding rock pressure based on the equivalent uniform load of the surrounding rock gravity in the failure zone within the cavern span.
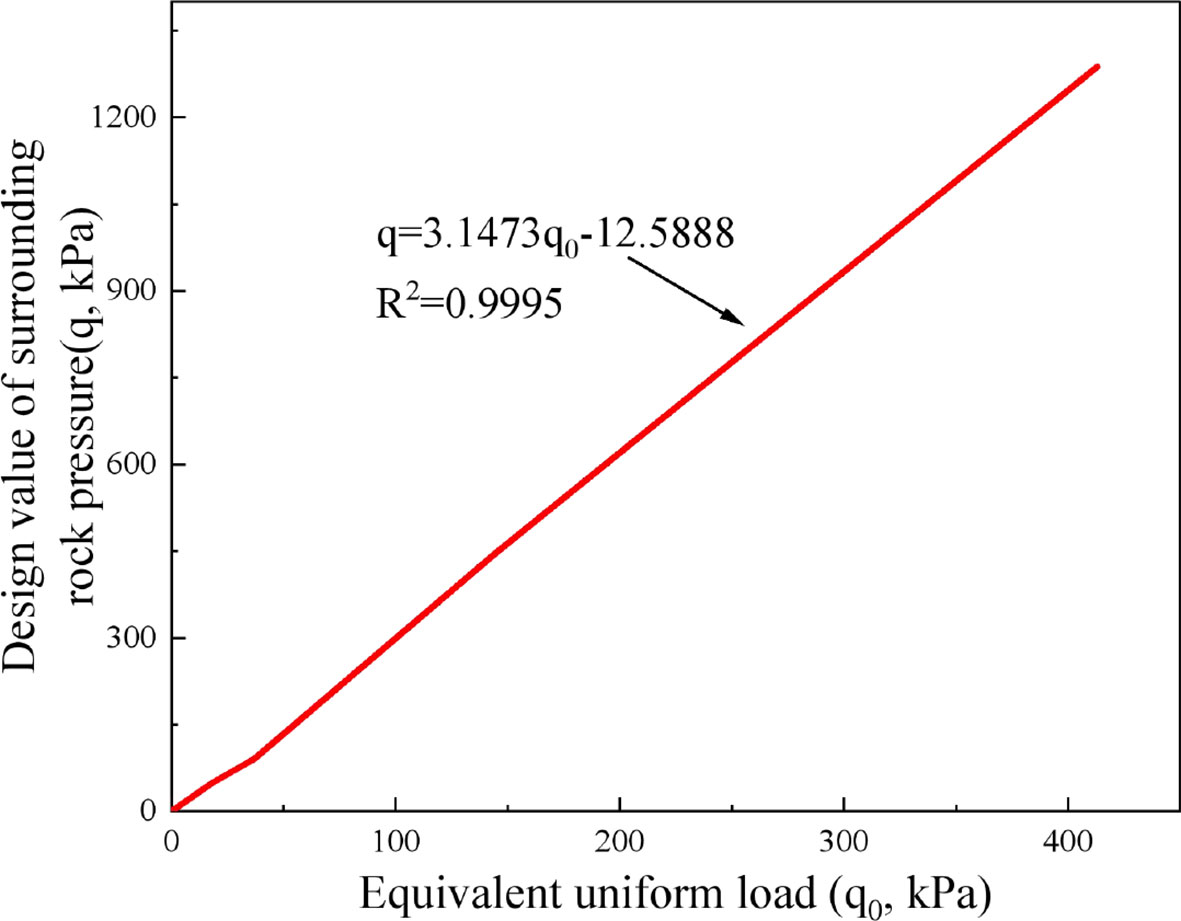
Figure 20 The variation curve of design value of surrounding rock pressure with respect to equivalent uniform load.
In summary, geostress directly affects the design value of the surrounding rock pressure of tunnels, particularly under very high geostress. An obvious correlation exists between the minimum supporting force and the equivalent uniform load of the surrounding rock gravity in the failure zone within the cavern span, so the uniform load can be used as the reference value to calculate and verify the final design value of surrounding rock pressure.
In this paper, FDEM is utilized to simulate the failure process of a tunnel after excavation under gravity stress field and geostress field. A method for determining the design value of surrounding rock pressure based on FDEM is proposed by introducing the tunnel displacement criterion. This method is then applied to investigate the influence of geostress on the surrounding rock pressure. The main conclusions of this study are as follows:
(1) For calibrating the calculation parameters of FDEM, the following approach is proposed: The macro parameters in FDEM can be acquired directly from laboratory tests. Contact penalty and are set as one times the elastic modulus, while fracture penalty is set as 100 times the elastic modulus. Subsequently, the fracture energy and are adjusted iteratively until the reasonable calibration result is obtained. This method ensures the rationality of the calibration parameters while significantly expediting the calibration process.
(2) The failure zone and crack zone of the surrounding rock following tunnel excavation under the gravity stress field are mainly distributed in the spandrel and vault. In the geostress field, the failure zone and crack zone of the surrounding rock are distributed in a ring along the tunnel section. In both scenarios, the predominant type of cracks observed is tensile-shear mixed cracks, with shear cracks primarily concentrated at the far end of the section, while tensile cracks are mainly observed in the shallower portion of the section.
(3) A calculation method for determining the design value of surrounding rock pressure based on FDEM is proposed. This method incorporates a displacement criterion to identify the failure zone, followed by an assessment of the stability of the surrounding rock. The reasonableness of this FDEM-based calculation method is verified by comparing its results with those obtained from the theoretical formula for surrounding rock pressure.
(4) Geostress directly impacts the design value of surrounding rock pressure. These two variables follow a quadratic function relationship, namely . The design value of surrounding rock pressure and the equivalent uniform load of the surrounding rock gravity of the failure zone within the cavern span exhibit a linear relationship, specifically, . The equivalent uniform load can serve as a reference value for calculating and verifying the results of the design value of surrounding rock pressure.
The original contributions presented in the study are included in the article/supplementary material. Further inquiries can be directed to the corresponding author.
Conceptualization, BH and YZ. Methodology, MX, XF, and JY. Investigation, BH, CX and JW. Writing original draft, BH, JW and YZ. Writing – review and editing, MX and XF. Funding acquisition, MX, XF and YZ. Resources, XF, YZ and CX. Supervision, Y.Z. All authors contributed to the article and approved the submitted version.
This work was supported by the National Key Research and Development Program (No. 2021YFB2600404), the Knowledge Innovation Program of Wuhan (No. 2022010801020164), the Youth Innovation Promotion Association, CAS (No. 2021325), the Regional Innovation and Development Joint Fund of the National Natural Science Foundation of China (No. U21A20159) and the National Natural Science Foundation of China (No. 52179117).
Authors MX, JY, CX, and JW were employed by the company China Railway Siyuan Survey and Design Group Co., Ltd.
The remaining authors declare that the research was conducted in the absence of any commercial or financial relationships that could be construed as a potential conflict of interest.
All claims expressed in this article are solely those of the authors and do not necessarily represent those of their affiliated organizations, or those of the publisher, the editors and the reviewers. Any product that may be evaluated in this article, or claim that may be made by its manufacturer, is not guaranteed or endorsed by the publisher.
An H., Wu S., Liu H., Wang X. (2022). Hybrid finite-discrete element modelling of various rock fracture modes during three conventional bending tests. Sustainability 14, 592. doi: 10.3390/su14020592
Cai M. F. (2002). Rock mechanics and engineering (Science Press: Beijing, China), ISBN: ISBN:978-7-03-038440-9.
Cheng Y. M. (2012). Modified Kastner formula for cylindrical cavity contraction in Mohr-Coulomb medium for circular tunnel in isotropic medium. J. Mech. 28, 163–169. doi: 10.1017/jmech.2012.17
Deng P.-H., Liu Q.-S., Huang X., Pan Y.-C., Bo Y. (2022). ). Combined finite-discrete element numerical study on the buckling failure mechanism of horizontally layered soft rock mass. Rock Soil Mech. S2), 508–523+574. doi: 10.16285/j.rsm.2021.0701
Ding W., Tan S., Zhu R., Jiang H., Zhang Q. (2021). Study on the damage process and numerical simulation of tunnel excavation in water-rich soft rock. Appl. Sci. 11, 8906. doi: 10.3390/app11198906
Ding Z., Zhao L. S., Zhou W. H., Bezuijen A. (2022). Intelligent prediction of multi-factor-oriented ground settlement during TBM tunneling in soft soil. Front. Built Environ. 8. doi: 10.3389/fbuil.2022.848158
GB50086-2015 (2015). Technical code for engineering of ground anchorages and shotcrete support (Beijing, China: China Planning Press).
Han H., Fukuda D., Liu H., Fathi Salmi E., Sellers E., Liu T., et al. (2021). Combined finite-discrete element modellings of rockbursts in tunnelling under high in-situ stresses. Comput. Geotechnics 137, 104261. doi: 10.1016/j.compgeo.2021.104261
Keawsawasvong S., Seehavong S., Ngamkhanong C. (2022). Application of artificial neural networks for predicting the stability of rectangular tunnels in Hoek-Brown rock masses. Front. Built Environ. 8. doi: 10.3389/fbuil.2022.837745
Lee H., Choi H., Choi S.-W., Chang S.-H., Kang T.-H., Lee C. (2021). Numerical simulation of EPB shield tunnelling with TBM operational condition control using coupled DEM-FDM. Appl. Sci. 11, 2551. doi: 10.3390/app11062551
Lee J., Rehman H., Naji A., Kim J.-J., Yoo H.-K. (2018). An empirical approach for tunnel support design through Q and RMi systems in fractured rock mass. Appl. Sci. 8, 2659. doi: 10.3390/app8122659
Lisjak A., Figi D., Grasselli G. (2014). Fracture development around deep underground excavations: Insights from FDEM modelling. J. Rock Mech. Geotechnical Eng. 6 (6), 493–505. doi: 10.1016/j.jrmge.2014.09.003
Lisjak A., Garitte B., Grasselli G., Müller H. R., Vietor T. (2015a). The excavation of a circular tunnel in a bedded argillaceous rock (Opalinus Clay): Short-term rock mass response and FDEM numerical analysis. Tunnelling Underground Space Technol. 45, 227–248. doi: 10.1016/j.tust.2014.09.014
Lisjak A., Liu Q., Zhao Q., Mahabadi O. K., Grasselli G. (2013). Numerical simulation of acoustic emission in brittle rocks by two-dimensional finite-discrete element analysis. Geophys. J. Int. 195 (1), 423–443. doi: 10.1093/gji/ggt221
Lisjak A., Tatone B. S. A., Mahabadi O. K., Grasselli G., Marschall P., Lanyon G. W., et al. (2015b). Hybrid finite-discrete element simulation of the EDZ formation and mechanical sealing process around a microtunnel in opalinus clay. Rock Mech. Rock Eng. 49 (5), 1849–1873. doi: 10.1007/s00603-015-0847-2
Liu Q.-S., Deng P.-H., Bi C., Li W.-W., Liu J. (2019). FDEM numerical simulation of the fracture and extraction process of soft surrounding rock mass and its rockbolt-shotcrete-grouting reinforcement methods in the deep tunnel. Rock Soil Mech. 10), 4065–4083. doi: 10.16285/j.rsm.2018.1032
Liu N. F., Li N., Li G. F., Song Z. P., Wang S. J. (2022). Method for evaluating the equivalent thermal conductivity of a freezing rock mass containing systematic fractures. Rock Mech. Rock Eng. 55, 7333–7355. doi: 10.1007/s00603-022-03038-9
Liu N. F., Li N., Wang S. J., Li G. F., Song. Z. P. (2023). A fully coupled thermo-hydro-mechanical model for fractured rock masses in cold regions. Cold Regions Sci. Technol. 205, 103707. doi: 10.1016/j.coldregions.2022.103707
Liu N., Li N., Xu C., Li G., Song Z., Yang M. (2020). Mechanism of secondary lining cracking and its simulation for the dugongling tunnel. Rock Mech. Rock Eng. 53, 4539–4558. doi: 10.1007/s00603-020-02183-3
Min G., Fukuda D., Oh S., Kim G., Ko Y., Liu H., et al. (2020). Three-dimensional combined finite-discrete element modeling of shear fracture process in direct shearing of rough concrete–rock joints. Appl. Sci. 10, 8033. doi: 10.3390/app10228033
Munjiza A. (2004). The combined finite-discrete element method (London: John Wiley&Sons, Ltd), ISBN: ISBN: 0-470-84199-0. (Cloth: alk.paper).
Munjiza A., Latham J. P., Andrews K. R. F. (1999). Challenges of a coupled combined finite-discrete element approach to explosive induced rock fragmentation. Fragblast 3 (3), 237–250. doi: 10.1080/13855149909408048
Munjiza A., Owen D. R. J., Bicanic N. (1995). A combined finite-discrete element method in transient dynamics of fracturing solids. Eng. Computations 12 (2), 145–174. doi: 10.1108/02644409510799532
Qiu H., Qiu R., Luo G., Ayasrah M., Wang Z. (2022). Study on the mechanical behavior of fluid-solid coupling in shallow buried tunnels under different biased terrain. Symmetry 14, 1339. doi: 10.3390/sym14071339
Song Y., Fan Y., An H., Liu H., Wu S. (2022). Investigation of the dynamic pure-mode-II fracture initiation and propagation of rock during four-point bending test using hybrid finite–discrete element method. Sustainability 14, 10200. doi: 10.3390/su141610200
Sun X., Li G., Zhao C., Liu Y., Miao C. (2018). Investigation of deep mine shaft stability in alternating hard and soft rock strata using three-dimensional numerical modeling. Processes 7, 2. doi: 10.3390/pr7010002
Tatone B. S. A., Grasselli G. (2015). A calibration procedure for two-dimensional laboratory-scale hybrid finite–discrete element simulations. Int. J. Rock Mech. Min. Sci. 75, 56–72. doi: 10.1016/j.ijrmms.2015.01.011
TB10003-2016 (2016). Code for design of railway tunnel (Beijing, China: China Railway Publishing House).
Trivino L. F., Mohanty B. (2015). Assessment of crack initiation and propagation in rock from explosion-induced stress waves and gas expansion by cross-hole seismometry and FEM–DEM method. Int. J. Rock Mech. Min. Sci. 77, 287–299. doi: 10.1016/j.ijrmms.2015.03.036
Wang T., Yan C., Zheng H., Zheng Y., Wang G. (2022). Microfracture behavior and energy evolution of heterogeneous mudstone subjected to moisture diffusion. Comput. Geotechnics 150, 104918. doi: 10.1016/j.compgeo.2022.104918
Wu P., Yang F., Zheng J., Wei Y. (2019). Evaluating the highway tunnel construction in western sichuan plateau considering vocational health and environment. Int. J. Environ. Res. Public Health 16, 4671. doi: 10.3390/ijerph16234671
Xiao M. Q. (2020). Total safety factor method of tunnel support structure design (China Communications Press Co., Ltd), ISBN: 9787114165580ISBN: 978-7-114-16558-0.
Xue G., Fang X., Wei T. (2019). A case study on large deformation failure mechanism and control techniques for soft rock roadways in tectonic stress areas. Sustainability 11, 3510. doi: 10.3390/su11133510
Yan C., Tong Y., Luo Z., Ke W., Wang G. (2021). A two-dimensional grouting model considering hydromechanical coupling and fracturing for fractured rock mass. Eng. Anal. Boundary Elements 133, 385–397. doi: 10.1016/j.enganabound.2021.09.013
Yan C., Zheng H. (2017a). FDEM-flow3D: A 3D hydro-mechanical coupled model considering the pore seepage of rock matrix for simulating three-dimensional hydraulic fracturing. Comput. Geotechnics 81, 212–228. doi: 10.1016/j.compgeo.2016.08.014
Yan C., Zheng H. (2017b). Three-dimensional hydromechanical model of hydraulic fracturing with arbitrarily discrete fracture networks using finite-discrete element method. Int. J. Geomech. 17 (6), 04016133. doi: 10.1061/(asce)gm.1943-5622.0000819
Yan C., Zheng H. (2017c). A coupled thermo-mechanical model based on the combined finite-discrete element method for simulating thermal cracking of rock. Int. J. Rock Mech. Min. Sci. 91, 170–178. doi: 10.1016/j.ijrmms.2016.11.023
Yan C.-Z., Zheng H., Sun G.-H., Ge X.-R. (2015). Polygon characterization of coarse aggregate and two-dimensional combined finite discrete element method analysis. Rock Soil Mech. S2), 95–103. doi: 10.16285/j.rsm.2015.S2.012
Zhang H., Chen L., Chen S., Sun J., Yang J. (2018). The spatiotemporal distribution law of microseismic events and rockburst characteristics of the deeply buried tunnel group. Energies 11, 3257. doi: 10.3390/en11123257
Zhang Q., Guo X., Yu T., Shen Y., Liu X. (2022). Effect of constructing a new tunnel on the adjacent existed tunnel in weak rock mass: A case study. Buildings 12, 1845. doi: 10.3390/buildings12111845
Zhang T., Nie L., Zhang M., Dai S., Xu Y., Du C., et al. (2020). The unsymmetrical coefficient of unsymmetrical-loaded tunnel based on field monitoring and numerical simulation. Symmetry 12, 1793. doi: 10.3390/sym12111793
Zhang S., Qiu S., Kou P., Li S., Li P., Yan S. (2021). Investigation of damage evolution in heterogeneous rock based on the grain-based finite-discrete element model. Materials 14, 3969. doi: 10.3390/ma14143969
Zhao Q., Tisato N., Grasselli G., Mahabadi O. K., Lisjak A., Liu Q. (2015). Influence of in-situ stress variations on acoustic emissions: a numerical study. Geophys. J. Int. 203 (2), 1246–1252. doi: 10.1093/gji/ggv370
Keywords: FDEM, surrounding rock pressure, design value, state of surrounding rock, geostress
Citation: Hu B, Xiao M, Fu X, Yang J, Xu C, Wu J and Zhou Y (2023) FDEM numerical study of the influence law of geostress on state and pressure of tunnel surrounding rock. Front. Ecol. Evol. 11:1237250. doi: 10.3389/fevo.2023.1237250
Received: 09 June 2023; Accepted: 10 July 2023;
Published: 28 July 2023.
Edited by:
Naifei Liu, Xi’an University of Architecture and Technology, ChinaReviewed by:
Xiao Wang, Shandong University of Science and Technology, ChinaCopyright © 2023 Hu, Xiao, Fu, Yang, Xu, Wu and Zhou. This is an open-access article distributed under the terms of the Creative Commons Attribution License (CC BY). The use, distribution or reproduction in other forums is permitted, provided the original author(s) and the copyright owner(s) are credited and that the original publication in this journal is cited, in accordance with accepted academic practice. No use, distribution or reproduction is permitted which does not comply with these terms.
*Correspondence: Yongqiang Zhou, eXF6aG91QHdocnNtLmFjLmNu
Disclaimer: All claims expressed in this article are solely those of the authors and do not necessarily represent those of their affiliated organizations, or those of the publisher, the editors and the reviewers. Any product that may be evaluated in this article or claim that may be made by its manufacturer is not guaranteed or endorsed by the publisher.
Research integrity at Frontiers
Learn more about the work of our research integrity team to safeguard the quality of each article we publish.