 McLean L. D. Worsham1*
 Parvathi Nair2
 J. Randy Gibson3David Rodriguez2
 Benjamin F. Schwartz2,4Weston H. Nowlin2
- 1Department of Zoology, University of Hawai’i at Manoa, Honolulu, HI, United States
- 2Department of Biology, Texas State University, San Marcos, TX, United States
- 3U.S. Fish and Wildlife Service, Aquatic Resources Center, San Marcos, TX, United States
- 4Edwards Aquifer Research and Data Center, Texas State University, San Marcos, TX, United States
It is unclear if geographic distributions of animals are behaviorally mediated or simply maintained by ecologically-driven deleterious effects on fitness. Furthermore, it is not well known how behaviors that may affect geographic distributions and responses to environmental stressors evolve. To explore this, we examined behavioral and physiological reactions to light in six species of amphipods in the family Crangonyctidae collected from a variety of subterranean and epigean habitats. Stark differences between epigean and subterranean habitats occupied by different crangonyctid species allowed this clade to serve as an appropriate model system for studying the link between habitat and phenotype. We sampled habitats in or adjacent to the Edwards Aquifer in central Texas and collected two epigean and four stygobiontic species. We examined respiratory and behavioral responses to light in all study species. We found that similarities in behavioral and physiological responses to light between species were only weakly correlated with genetic relatedness but were correlated with habitat type. However, the breadth of variation in phenotype was found to be correlated with phylogenetic relationships, suggesting that population level trait evolution likely involves interactions between standing population level variation and strength of selection. Our findings suggest that natural selection via environmental conditions may outweigh history of common ancestry when predicting phenotypic similarities among species, and that behavioral and physiological phenotypes may mediate the evolution of biogeographic distributions.
1 Introduction
Habitat characteristics are partially determined by abiotic conditions and variation in these conditions are typically distributed across gradients or clines (Nowicki et al., 2017). Dispersal across gradients or clines by organisms into novel habitats presumably submits organisms to novel selection pressures (Geber and Eckhart, 2005). Directional adaptive divergence on the fringe of populations is one way that organisms can colonize novel habitats (Waterhouse et al., 2018). This perspective assumes that populations distribute themselves randomly and biogeographic distributions are mediated by deleterious genetic effects causing barriers to dispersal (Lange and Marshall, 2016). For motile organisms, behavior can play a role in maintaining biogeographic distributions through active avoidance of less hospitable habitats (Resetarits, 2005; Edelaar et al., 2008; Fišer et al., 2016). However, it is not fully understood how such behaviors evolve. Behaviors also allow organisms to respond to changes in conditions more rapidly than intragenerational acclimatization or intergenerational adaptation (Little and Seebacher, 2017). For example, reptiles maintain preferred body temperatures by behaviorally altering the thermal environment they experience, which is a much more rapid response than evolving new thermal tolerance or producing new enzyme conformations.
Shared phenotypes can occur across many organisms of variable relatedness (e.g., numerous lineages sunbathe, and sunbathing is not limited to just reptiles). A commonly-highlighted example of this is the convergent “subterranean-adapted” stygobiont phenotype [e.g., elongated appendages for sensing the environment in the absence of light, reduced or absent pigmentation to conserve energy expenditures, lower metabolic rates, and vestigial or absent eyes (Fong et al., 1995; Aden, 2005; Culver et al., 2010)]. These adaptations are observed across distantly related cave-dwelling animal lineages, and the stark phenotypic contrasts between subterranean- and related surface-adapted species (Pipan and Culver, 2012) suggests that the surface-subterranean habitat ecotone can be used to study the importance of adaptive phenotypes in maintaining population level biogeographic distributions. Selection in a habitat devoid of light is thought to be responsible for the apparent convergent morphological traits of many subterranean fauna across diverse lineages (Jeffery, 2005; Culver et al., 2010; Pipan and Culver, 2012; Carlini and Fong, 2017). Although these traits are considered adaptations to dark conditions, the same traits are presumably maladapted to conditions commonly found in epigean habitats. Lower fitness of subterranean fauna in epigean habitats is likely due to a lack of sight, pigment, and camouflage, increasing vulnerability to predation (Tobler, 2009; Horstkotte et al., 2010; Klaus and Plath, 2011) and mutagenic radiation (Protas and Patel, 2008; Bilandžija et al., 2017). Likewise, epigean species are considered maladapted to subterranean environments due to the metabolic cost of maintaining eyes in the absence of light (Moran et al., 2015), higher metabolic rates and an inability to deal with prolonged periods of starvation due to scarcity of food in resource-limited subterranean environments (Aspiras et al., 2015; Nair et al., 2020), disruption of circadian rhythms (Espinasa et al., 2016), and difficulty finding mates (Riesch et al., 2011). Thus, fitness costs associated with surface- and subsurface-adapted taxa dispersing out of their respective habitats likely mediates contemporary biogeographic distributions to some extent. However, in the case of subterranean-epigean ecotones (e.g., spring orifices, seeps), it is not known if biogeographic distributions are behaviorally mediated or if they are only maintained by suffering deleterious consequences.
The evolutionary consequences of an organism venturing out of available optimal habitats are variable and depend on phenotype (Langecker, 2000). If light is a factor driving biogeographic distributions of organisms at surface-subterranean ecotones, then it should be expected that the ability to detect and respond to light has been selected for in eyeless subterranean species that periodically encounter light (such as those occupying shallow spring or seep habitats). Fišer et al. (2016) demonstrated that epigean and subterranean species living along surface-subterranean ecotones will use light as a habitat choice mechanism, allowing surface and subterranean species to remain within their appropriate niches. In contrast, an ability to detect light should not have been selected for in subterranean species which rarely if ever encounter light (Langecker, 2000). Therefore, we hypothesized that patterns in light response would reflect habitat distributions more so than an inferred history of common ancestry, reflecting selection as a major factor determining phenotype even in the presence of standing genetic variation. We predicted that subterranean species which encounter light regularly will exhibit photophobic responses to light, thereby allowing them to avoid epigean habitats. We also predicted that species which occupy deeper aquifer habitats would exhibit little response to the presence of light (i.e., photoneutrality), because these species do not encounter light at all and are predicted to be naïve to it. In respect to surface species that encounter light daily, we predicted that exposure to light will not be stressful (i.e., photoneutrality), but they may behaviorally respond in a variety of ways (i.e., photophobia, photoneutrality, or photophilia).
We tested these predictions in a series of experiments on several closely related amphipods of three genera in the family Crangonyctidae: Crangonyx, Stygobromus, and Sicifera. This family of amphipods was selected because some species have eyes and live in epigean environments while others are eyeless, and the eyeless species occupy different microhabitats with differing light availability (Gibson et al., 2008). Also, eyeless stygobiontic amphipods in this family (i.e., Stygobromus allegheniensis) (Espinasa et al., 2016) and all the species in the stygobiontic genus Niphargus (Simčič and Brancelj, 2007; Borowsky, 2011; Fišer et al., 2016) have the capacity to detect light despite vestigial or no eyes. To assess photophilia, photoneutrality, and photophobia, we performed experiments that quantified behavioral avoidance of direct light, and physiological stress response due to exposure to light. Trait data were used in phylogenetic comparative methods to assess the evolution of these traits in response to selection imposed by different microhabitats.
2 Materials and methods
This study characterized phenotype using live organisms (captured from the wild) that can be reared and reproduced in captivity, thus allowing responses to be studied in a controlled environment. Phenotypic attributes other than morphology can be the result of complex evolutionary processes that allow adaptation to novel environments without appreciable changes in morphology. These attributes are not quantifiable using preserved archived specimens and require the study of live organisms. Studying ecological adaptation of live organisms can be confounded by altered organismal behavior or physiology due to stress associated with captivity, and ecological interactions that are difficult or impossible to control in field studies.
2.1 Selection of study species and collection of test subjects
We collected and used individuals of six species of crangonyctid amphipod (Tables 1, S2). Crangonyctidae is exclusively freshwater and thought to be derived from a marine ancestor that radiated into freshwater habitats via interstitial spaces, perhaps as early as the late Cretaceous (Holsinger, 1967). Crangonyctidae includes 13 extant genera, 8 of which contain exclusively eyeless stygobiont species which are thought to represent independent adaptive radiations (Culver et al., 2010; Cannizzaro et al., 2021; Marin and Palatov, 2021; Palatov and Marin, 2023). Four species used in this study are eyeless species in the genus Stygobromus. The remaining two genera, Crangonyx sp. and Sicifera sp., have eyes, but Crangonyx sp., have reduced eyes (Gibson et al., 2008). Live amphipods were collected using drift nets over spring openings in and around central and eastern Texas (USA), except for Stygobromus pecki, Crangonyx sp., and Sicifera sp., which were collected by dip netting loose sediments in their respective sampling locations (Table S1). Live individuals collected in the field were immediately placed in insulated containers filled with water from the source location and transported to the San Marcos Aquatic Resources Center (SMARC) operated by the U.S. Fish and Wildlife Service. Amphipods were housed in physicochemically consistent (22°C, > 6 mg DO/L) flow-through chambers with a constant supply of Edwards Aquifer well water. Surface species were kept in 12/12-hour light/dark regime whereas stygobiont species were kept in 24-hour dark regime to simulate natural conditions.
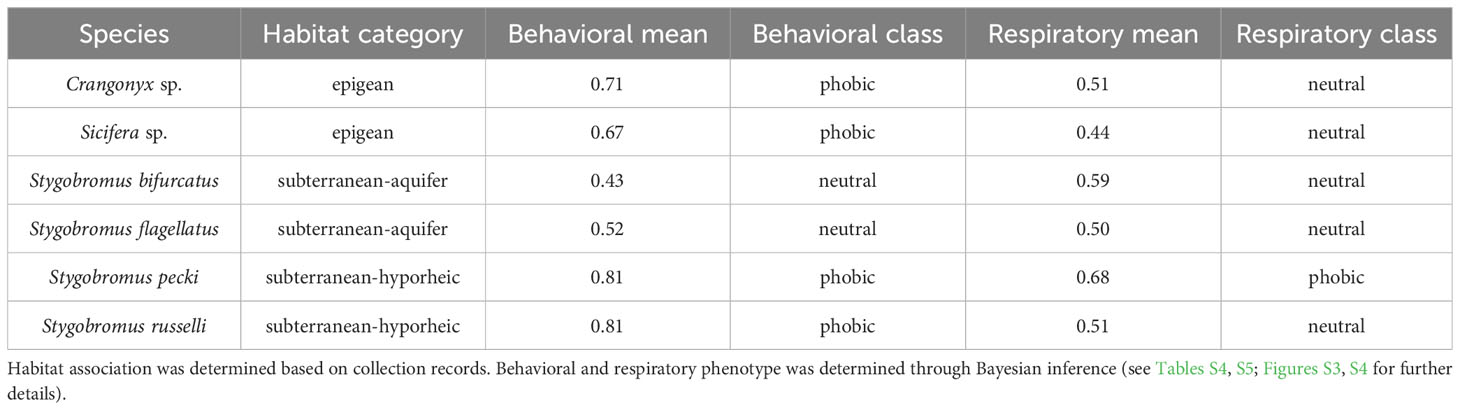
Table 1 Habitat association, behavioral, and respiratory response phenotypes determined for each species.
2.2 Assignment of habitat associations to species
All species used in this study were placed in one of three broad habitat association categories: epigean, subterranean-hyporheic, or subterranean-aquifer. To assign habitat associations for each species, we used characteristics of collection localities and habitats, morphological characteristics, and insight from the literature to associate each species with a particular habitat type (Table S2). Because we have a limited understanding of each species’ complete ecological niche, we could only use habitat association as a correlate with light response phenotypes.
Stygobromus pecki (Peck’s cave amphipod), is an endangered species restricted to Comal and Hueco springs in Comal County, Texas, and is found in interstitial habitats near spring openings and upwellings and the adjacent aquifer (Gibson et al., 2008). Individuals are often captured in and around spring orifices, even during daylight hours. Because of the proximity of this species to spring orifices, it is expected to encounter light at an evolutionarily-relevant frequency (defined herein as a frequency experienced by enough individuals in a population to impose a selection pressure sufficient to effect the population level phenotype). When disturbed from the substrate during daylight hours, S. pecki has been observed to swim directly downward and hide in interstitial spaces (R. Gibson, pers. obs.). Stygobromus flagellatus is considered a deep subterranean species primarily collected from deep wells, caves, and in the drift from large artesian springs (Holsinger, 1967; Gibson et al., 2008). Because this species dwells in deeper phreatic waters, it is not expected to encounter light at an evolutionary relevant frequency. Both S. pecki and S. flagellatus are assigned to the endemic central Texas ‘flagellatus’ species group and closely-related members of this group typically have more elongated appendages and are thought to be descended from a deep phreatic ancestor as compared to the contemporarily sympatric ‘tenuis’ group (Holsinger, 1967; Gibson et al., 2008). Two members of the ‘tenuis’ group, S. russelli and S. bifurcatus are the most widespread species of Stygobromus in Texas, and are found in caves, wells, springs, and shallow interstitial habitats such as the near-surface hyporheic gravels of limestone streams in Central Texas (Holsinger, 1967; Reddell, 1986; Nissen et al., 2018; Hutchins et al., 2020). Stygobromus bifurcatus is not as common [especially in shallow hyporheic habitats (Hutchins et al., 2020)] and reaches larger adult sizes than the sympatric S. russelli. This larger size likely limits adult S. bifurcatus to conduits and larger interstitial habitats as compared to S. russelli (Culver et al., 2010; Trontelj et al., 2012; Kralj-Fišer et al., 2020). Stygobromus russelli, however, is expected to encounter light more regularly and at an evolutionarily relevant frequency owing to its more frequent occurrence near epigean habitats when compared to S. bifurcatus.
The surface-water dwelling amphipod examined in this study, Sicifera sp. was collected from perennially flowing streams of east Texas that receive groundwater inputs from the Carrizo-Wilcox Aquifer. This species has well-developed eyes and occurs primarily on allochthonous debris in shallow sandy headwater streams where it is often exposed to direct (M. Worsham, pers. obs.). Crangonyx cf. pseudogracilis (referred to hereafter as Crangonyx sp.) was collected from the San Marcos River where they occupy shallow interstitial habitats and have reduced eyes (Gibson et al., 2008). Although, Crangonyx sp. is an epigean genus, it is expected that it will avoid direct light based on its interstitial adaptations and our field observations.
2.3 Light exposure experiments
2.3.1 Respiratory response study
For our study species, we used rates of respiration in light vs. dark as a proxy for stress responses to light exposure. Previous studies have found that rate of oxygen consumption by an organism is correlated with stress intensity (Kedwards et al., 1996; Simčič and Brancelj, 2007). Oxygen consumption is one of the few methods that have been used to provide a continuous quantitative response variable as an estimate of sensitivity to light in subterranean aquatic organisms (Simčič and Brancelj, 2007).
For the respiratory response study, a lighting apparatus was made by cutting a 15 cm diameter hole in the bottom of a 20 L plastic casing. The interior surface of the bucket was painted with opaque black paint to standardize internal light conditions and penetration from external sources. The bucket was then inverted and a utility lamp slightly larger in diameter than the hole, was affixed with the bulb inserted through the opening. A 5.5 W full-spectrum LED light bulb (40 W halogen bulb equivalent) was used for the study and the light source was calibrated to 45 µmol m-2 s-1 by adjusting the amount of current to the bulb, based on pilot studies to assess amphipod sensitivity to light intensity. To estimate stress, rate of dissolved oxygen (DO) consumption was compared between individual test subjects held in the dark vs. in full spectrum light. Thus, we assumed that any elevation in the rate of DO consumption (respiration) was related to an increase in organismal stress levels. Respiration rates were quantified using Qubit® OX1LP-30 dissolved oxygen cuvettes with built in Clark cell type polarographic O2 sensors (see Figure S1 for explanation). After calibration of the cuvette systems, but prior to testing subjects for sensitivity to light, DO consumption of the O2 electrodes was estimated by running the cuvettes filled with 5 mL of fresh well water in the dark and in full-spectrum light to ensure that differences in lighting did not affect the rate of consumption of the O2 electrodes and to gain an understanding of the base-line rate of O2 consumption by the O2 electrodes.
Individual amphipods were placed in a cuvette filled with 5 mL of fresh well water and allowed to acclimate to the chamber for 10 min. Prior studies suggested that 10 min was a sufficient duration to allow amphipods to recover from the stress of being handled (Bethel and Holmes, 1973; Macneil and Dick, 2014). Each amphipod was then randomly assigned an order to sequentially receive each of the two treatments: dark or full-spectrum light. Amphipods were exposed to each treatment for 15 min while DO concentration was recorded at 30 second intervals, with 10 min intervals between the two treatments to allow subjects to recover from any stress that may have been induced by the prior treatment. All experiments were carried out in a dark room. Cuvettes were immersed in a flowing well-water bath to maintain thermal stability of 22°C. Individuals were assayed only once to avoid confounding datasets with autocorrelation or pseudoreplication. Replication varied from 5 to 10 individuals per species and depended on the availability of the organisms we collected from the field.
2.3.2 Behavioral response study
Because we expected behavior to be affected by exposure to environmental stressors, we also examined behavioral responses of amphipods to light to determine which taxa actively avoided direct exposure to light (i.e., photophobia), responded positively toward light (photophilia), or exhibited indifference or no clear behavioral responses to light (i.e., photoneutrality). All experiments were conducted in a dark room. The experimental apparatus was made using a lamp elevated 30 cm directly above a shallow, water-filled chamber (round plastic dish 9 cm in diameter and filled to approximately 1-cm in depth with well water). The circular chamber was covered with a transparent lid divided into quarters, with two quarters of the upper surface of its cover painted black with opaque black paint (see Figure S2 for explanation) and the remaining two quarters transparent. A 5.5 W full-spectrum LED light bulb (40 W halogen bulb equivalent), calibrated to 45 µmol m-2 s-1 of irradiance at the water surface of the chamber, was used.
Individual amphipods were placed in the experimental chamber singly and allowed an initial ten-minute acclimation period in the dark prior to making observations. After the acclimation period, the light source was turned on and observational data were collected every minute for 15 minutes. Data were collected by noting if a test subject was in a light or dark quarter of the experimental chamber at 1 min intervals for the entire 15 min duration. Individuals were used only once for an experiment. Replication varied from 5 to 10 individuals per species, again depending on the availability of the organisms.
2.3.3 Light exposure phenotypic data analysis
For the behavioral study we calculated the proportion of the total number of 1 min observations in which the individual was in the shaded (black) portion of the chamber. For the respiratory study, to correct for physiological differences in DO consumption between individual test subjects, all values were converted to proportions by dividing the net DO consumed during exposure to light by the sum of the DO consumed for both treatments using Equation 1:
where relative level of DO consumption in the light vs. dark treatments (pDOlight) was calculated as the amount of DO consumed during the light treatment (DOlight) divided by the net DO consumed during light and dark treatments (DOlight + DOdark). In addition to providing a single respiratory score per individual, this also corrected for differences of respiratory rate between individuals due to size or other factors. Proportional DO data for all individuals were treated as replicates to estimate respiratory response curves. Bootstrapping was used to obtain parameter estimates before the distribution of each species was compared to the hypothetical response distributions.
Because response to light (i.e., avoidance or non-avoidance) is a binomial variable, three beta distributions were utilized to serve as priors for the possible response categories: photophilic, photoneutral, and photophobic phototaxis (Figure 1). Bootstrapped data were compared to these hypothetical distributions and Inverse Bayes Factors (IBF) were calculated for each species. IBFs greater than 3 but less than 10 were considered marginal evidence supporting assignment of each species to one or more of the three response categories while IBFs of 10 or greater were considered strong evidence supporting response category assignments (Jarosz and Wiley, 2014).
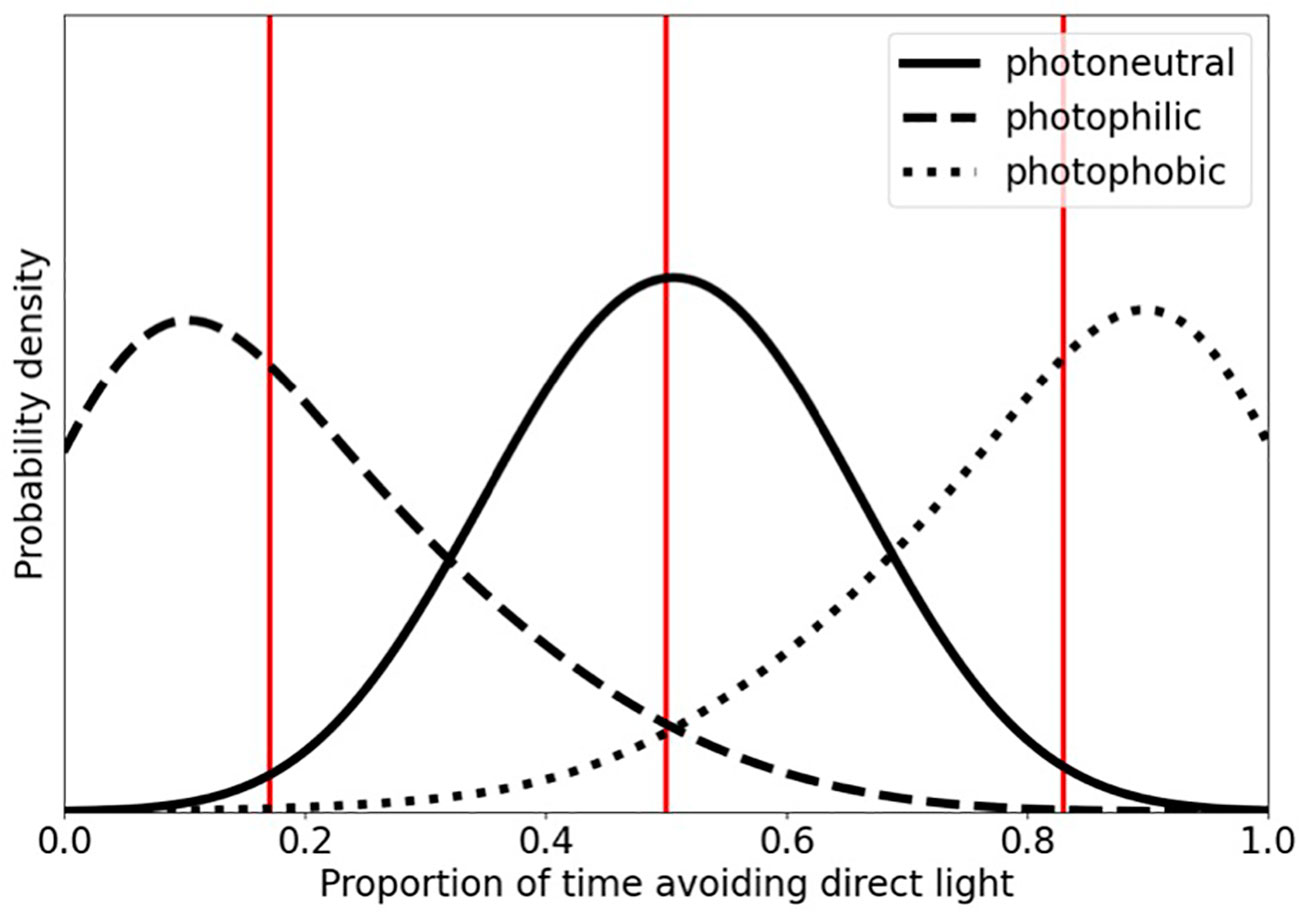
Figure 1 Beta distributions serving as proxies for the priors of the binomial response variable of reaction to light; photophilic, photoneutral, photophobic phototaxis. Photophobic individuals have greater probability density as X approaches 1, whereas photophilic individuals have greatest probability density as X approaches 0. Photoneutral individuals have greatest probability density at X = 0.5. Vertical lines denote distribution means.
2.4 Molecular methods
To estimate the phylogenetic relationships and genetic distances between study species, we utilized the COI locus sequences to construct a single locus mitochondrial phylogeny. The COI locus has by far the greatest depth of sampling across amphipod species; thus, this is the best available locus for estimating a phylogeny without missing terminal nodes. Because populations of Crangonyx sp. and Sicifera sp. used in this study have never been sequenced for any locus, we sequenced the COI locus from four individuals for each species. A 2–3 mm portion of the abdomen was excised from each with a sterilized razor blade. DNA was extracted using the Thermo Scientific GeneJET Genomic DNA Purification Kit according to the manufacturer’s protocol with an initial tissue digestion at 56°C for 16 hours in a rocking platform incubator to ensure complete tissue digestion. DNA was eluted from the GeneJET spin column into new sterile 1.5 mL tubes, which were held at 4°C until downstream reactions were performed.
A fragment of the COI locus of the mitochondrial genome was amplified using Polymerase chain reaction (PCR) in 0.20 mL strip tubes using LCO1490 (5’-GGTCAACAAATCATAAAGATATTGG-3’) forward primer and HCO2198 (5’-TAAACTTCAGGGTGACCAAAAAATCA-3’) reverse primer (Folmer et al., 1994). The PCR had a final reaction volume of 14 μL, which consisted of 6.25 μL of Thermo Scientific DreamTaq PCR Master Mix (2X), 1 μM of LCO1490 forward primer, 1 μM of HCO2198 reverse primer, 5.75 μL of nuclease-free water, and ~1–10 ng of genomic DNA. The reaction was performed in a thermal cycler under the following conditions: an initial denaturation at 95°C for 2 min; 33 cycles of 95°C for 30 seconds, 46°C for 30 seconds, and 72°C for 45 seconds; with a final extension step at 72°C for 10 min. Excess nucleotides and primers were removed from the PCR products by combining 2.0 μL of ExoSAP-IT™ PCR Product Cleanup Reagent (Applied Biosystems) with 5.0 μL of PCR products in new sterile PCR tubes. The cleanup reaction was performed in a thermal cycler under the following conditions: 37°C for 15 min; 80°C for 15 min. Cleaned PCR products were held at 4°C until downstream reactions were performed. Cycle sequencing reactions were performed using BigDye™ Terminator v3.1 Cycle Sequencing Kit (Applied Biosystems) with separate reactions for both the forward and reverse primers. Cycle sequencing products were cleaned using Sephadex™ G-50 (GE Healthcare). Cleaned products were sequenced on an Applied Biosystems 3500xl Genetic Analyzer and chromatograms were edited in Geneious 11.1.2 [http://www.geneious.com, (Kearse et al., 2012)]. Sequencing returned one haplotype for Crangonyx sp. and two haplotypes for Sicifera sp. (Genbank Accessions OR490761 – OR490763).
2.5 Phylogenetic estimation
A global alignment was performed using the Geneious alignment algorithm with default parameters [http://www.geneious.com, (Kearse et al., 2012)]. The ends of this alignment were trimmed to the shortest sequence length to ensure that the alignment was complete across all sequences. Because the COI locus is protein coding, ORFfinder (NCBI, https://www.ncbi.nlm.nih.gov/orffinder/) was used to annotate the consensus sequences into the appropriate reading frame. This yielded a 468-bp alignment of 79 sequences consisting of the two Sicifera sp. haplotypes and one Crangonyx sp. haplotype sequenced in our lab, and two each of Sicifera spp., Crangonyx spp., and Metacrangonyx spp. retrieved from GenBank with the remaining 36 sequences from Stygobromus spp. COI fragments from Ethridge et al. (2013), and one Gammarus roeseli sequence as an outgroup; see Table S3. This phylogeny was partitioned into codon position and each position was tested for the best fit model of evolution using Modeltest-NG (Darriba et al., 2020). It was determined that the best model of evolution for 1st and 3rd codon positions was HKY+I+G4, and HKY+G4 for 2nd codons.
Phylogenies were estimated using MrBayes (Ronquist et al., 2012) with Markov chain Monte Carlo methods consisting of four Markov chains (three heated, one cold) with confidence assessed by posterior probabilities. Using the recommended models of evolution for each codon position, the average deviation of split-chain frequencies between runs fell to ≈0.005 after 2,000,000 generations. Subsequently, a majority-rule consensus phylogeny was computed by removing the first 25% of trees as burn-in. After computing this original phylogeny, all species were found to be monophyletic, therefore a reduced alignment with only one sequence per species was used for subsequent analyses. This alignment contained 34 sequences, 468-bp long, and it was determined that the best model of evolution for 1st codons was TrNef+I, TrN+G4 for 2nd codons, and HKY+G4 for 3rd codons. Using the recommended models of evolution for each codon position, the average deviation of split-chain frequencies between runs fell to 0.005 after 2,000,000 generations. Subsequently, a majority-rule consensus phylogeny was computed by removing the first 25% of trees as burn-in.
2.6 Evaluation of phylogenetic and phenotypic congruence
We analyzed both the trait means and the coefficient of variation (CV) within each species for both behavioral and respiratory traits. The CV was analyzed because it contains information about the amount of trait variation in respect to the trait value within a species. Considering trait variation is a prerequisite for natural selection (Darwin, 1859) and CV provides insight into the evolvability of a trait within a species.
To gain insight into the evolutionary history of the traits examined by this study, we matched the trait means and CVs to the phylogeny using ‘treeplyr’ (Uyeda and Harmon, 2020) in R (www.r-project.org) and then performed an ancestral state reconstruction (ANS) using the ‘ape’ library (Paradis et al., 2004) in R. The relative likelihood of different habitat association, behavioral phenotypes, and respiratory phenotypes were estimated for all internal nodes of the phylogeny using the “all rates different” model which allows traits to evolve at unique rates along each branch of the phylogeny. To quantitatively estimate the level of phylogenetic independence of these traits, the phylogeny was annotated with the trait values for each species and traits were tested for phylogenetic signal. Using ‘phytools’ (Revell, 2012) in R, Pagel’s lambda (λ) (Pagel, 1999) was calculated for both the mean and CV of traits to assess the strength of correlation between the phylogeny and traits. Additionally, as stated above, because stress is thought to affect behavior, we analyzed the relationship between the behavioral and respiratory phenotypes with respect to the phylogeny to understand how coupled these two traits are in their evolution. This was done by performing two phylogenetic regressions on the trait means and trait CVs using the ‘phylolm’ library (Tung Ho and Ané, 2014) in R; one model had the covariance structure of the error set to Brownian motion and other was set to Ornstein–Uhlenbeck (O-U) model which constrains the parameter space values are permitted to explore. We also performed a standard linear regression without the phylogenetic relationships being considered. We then used the ‘MuMIn’ library (Barton and Barton, 2015) in R to test which model best fit the data based on Akaike information criterion (AIC) scores. The relationship of these traits and the phylogeny were visualized graphically in phylomorpho plots using ‘phytools’ (Revell, 2012) in R.
To test the hypothesis that habitat has a stronger effect on phenotype than history of common ancestry, we constructed three macroevolutionary models for the means of both phenotypes. The first model was Brownian motion (Felsenstein, 1973), which assumes the correlation structure among trait values is proportional to the extent of shared ancestry for pairs of species. The next model was a “white-noise” model which is a non-phylogenetic model that assumes that the data come from a single normal distribution with no covariance structure among species. The third model was the same as the Brownian motion model except the phylogeny incorporated into the model was based on the similarity of habitat rather than genetic similarity. A non-ultrametric tree was deliberately used to ensure that all lineages were on equally long branches (see Figure 2 for explanation). All models were run using the ‘geiger’ package (Harmon et al., 2007) in R. To evaluate the relative fit of each of these models to the data, we used the ‘MuMIn’ library (Barton and Barton, 2015) in R to perform a model selection procedure based on AIC scores.
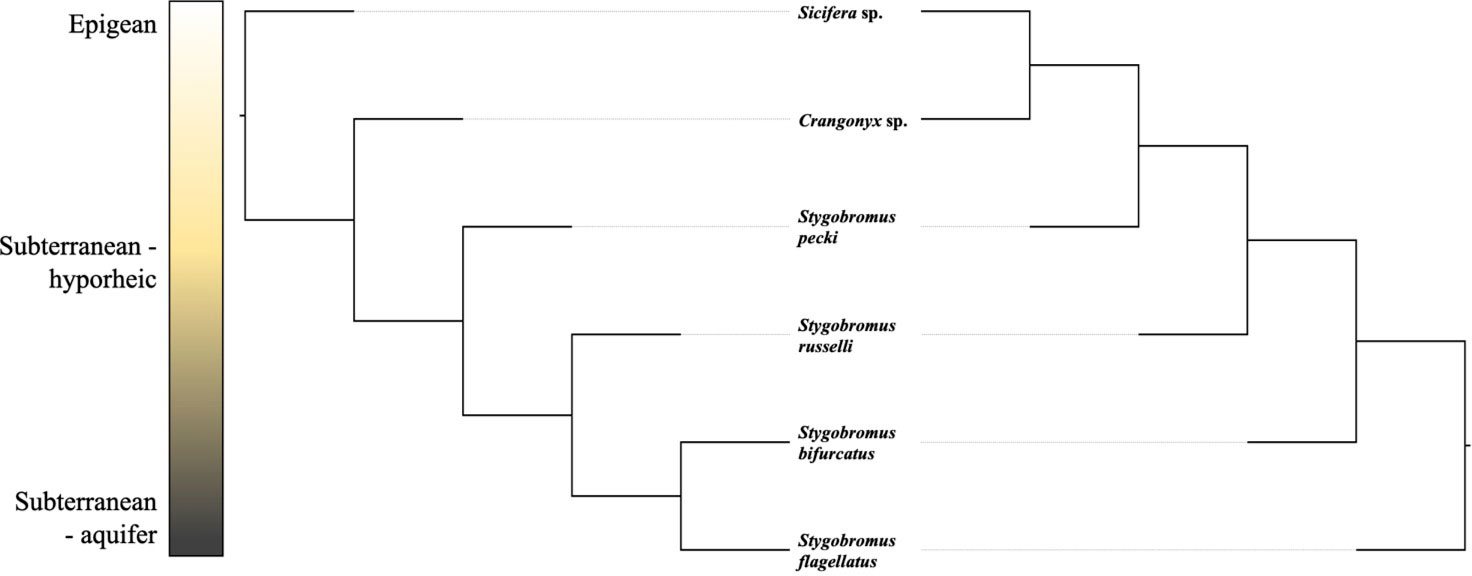
Figure 2 Two graphical depictions of the Newick topology used in habitat-based models. These projections are identical in Newick space as the total branch length between two lineages is equal in both projections; they only differ in where the tree is rooted. A binary tree was used because the R program ‘geiger’ requires binary trees.
3 Results
3.1 Characterizing response to light
Behavioral and respiratory responses varied in magnitude across the different species and habitat types (Table 1). There was strong support for Crangonyx sp., Sicifera sp., and Stygobromus pecki being behaviorally photophobic and S. russelli being weakly photophobic, while S. bifurcatus and S. flagellatus were found to be behaviorally photoneutral. Results from the respiratory response study indicated that Crangonyx sp., Sicifera sp., Stygobromus bifurcatus, S. flagellatus, and S. russelli are photoneutral, while only S. pecki was found to have photophobic respiratory responses making it the only species to be photophobic for both phenotypes. Calculated IBFs for both behavioral and respiratory data sets can be found in Tables S4 and S5 while the relative fit of each species to each of the hypothetical phototaxis distributions by proportion of the overlap of area under the curve is shown in Figures S3 and S4, and in Tables S6 and S7. Raw data and sample sizes can be found in Tables S8 and S9.
3.2 Phylogenetic analysis of response to light
Though it is impossible to definitively determine species relationships using phylogenetic methods, most of the nodes recovered in the phylogeny have relatively high posterior probabilities (Figure 3), therefore we proceeded to use the phylogeny for further analysis. Stygobromus was recovered as a monophyletic clade, and the Crangonyx sp. specimens grouped with other Crangonyx spp. sequences, while the Sicifera and Metacrangonyx species were found to be a sister clade to a clade composed of Stygobromus and Crangonyx species (Figure 3).
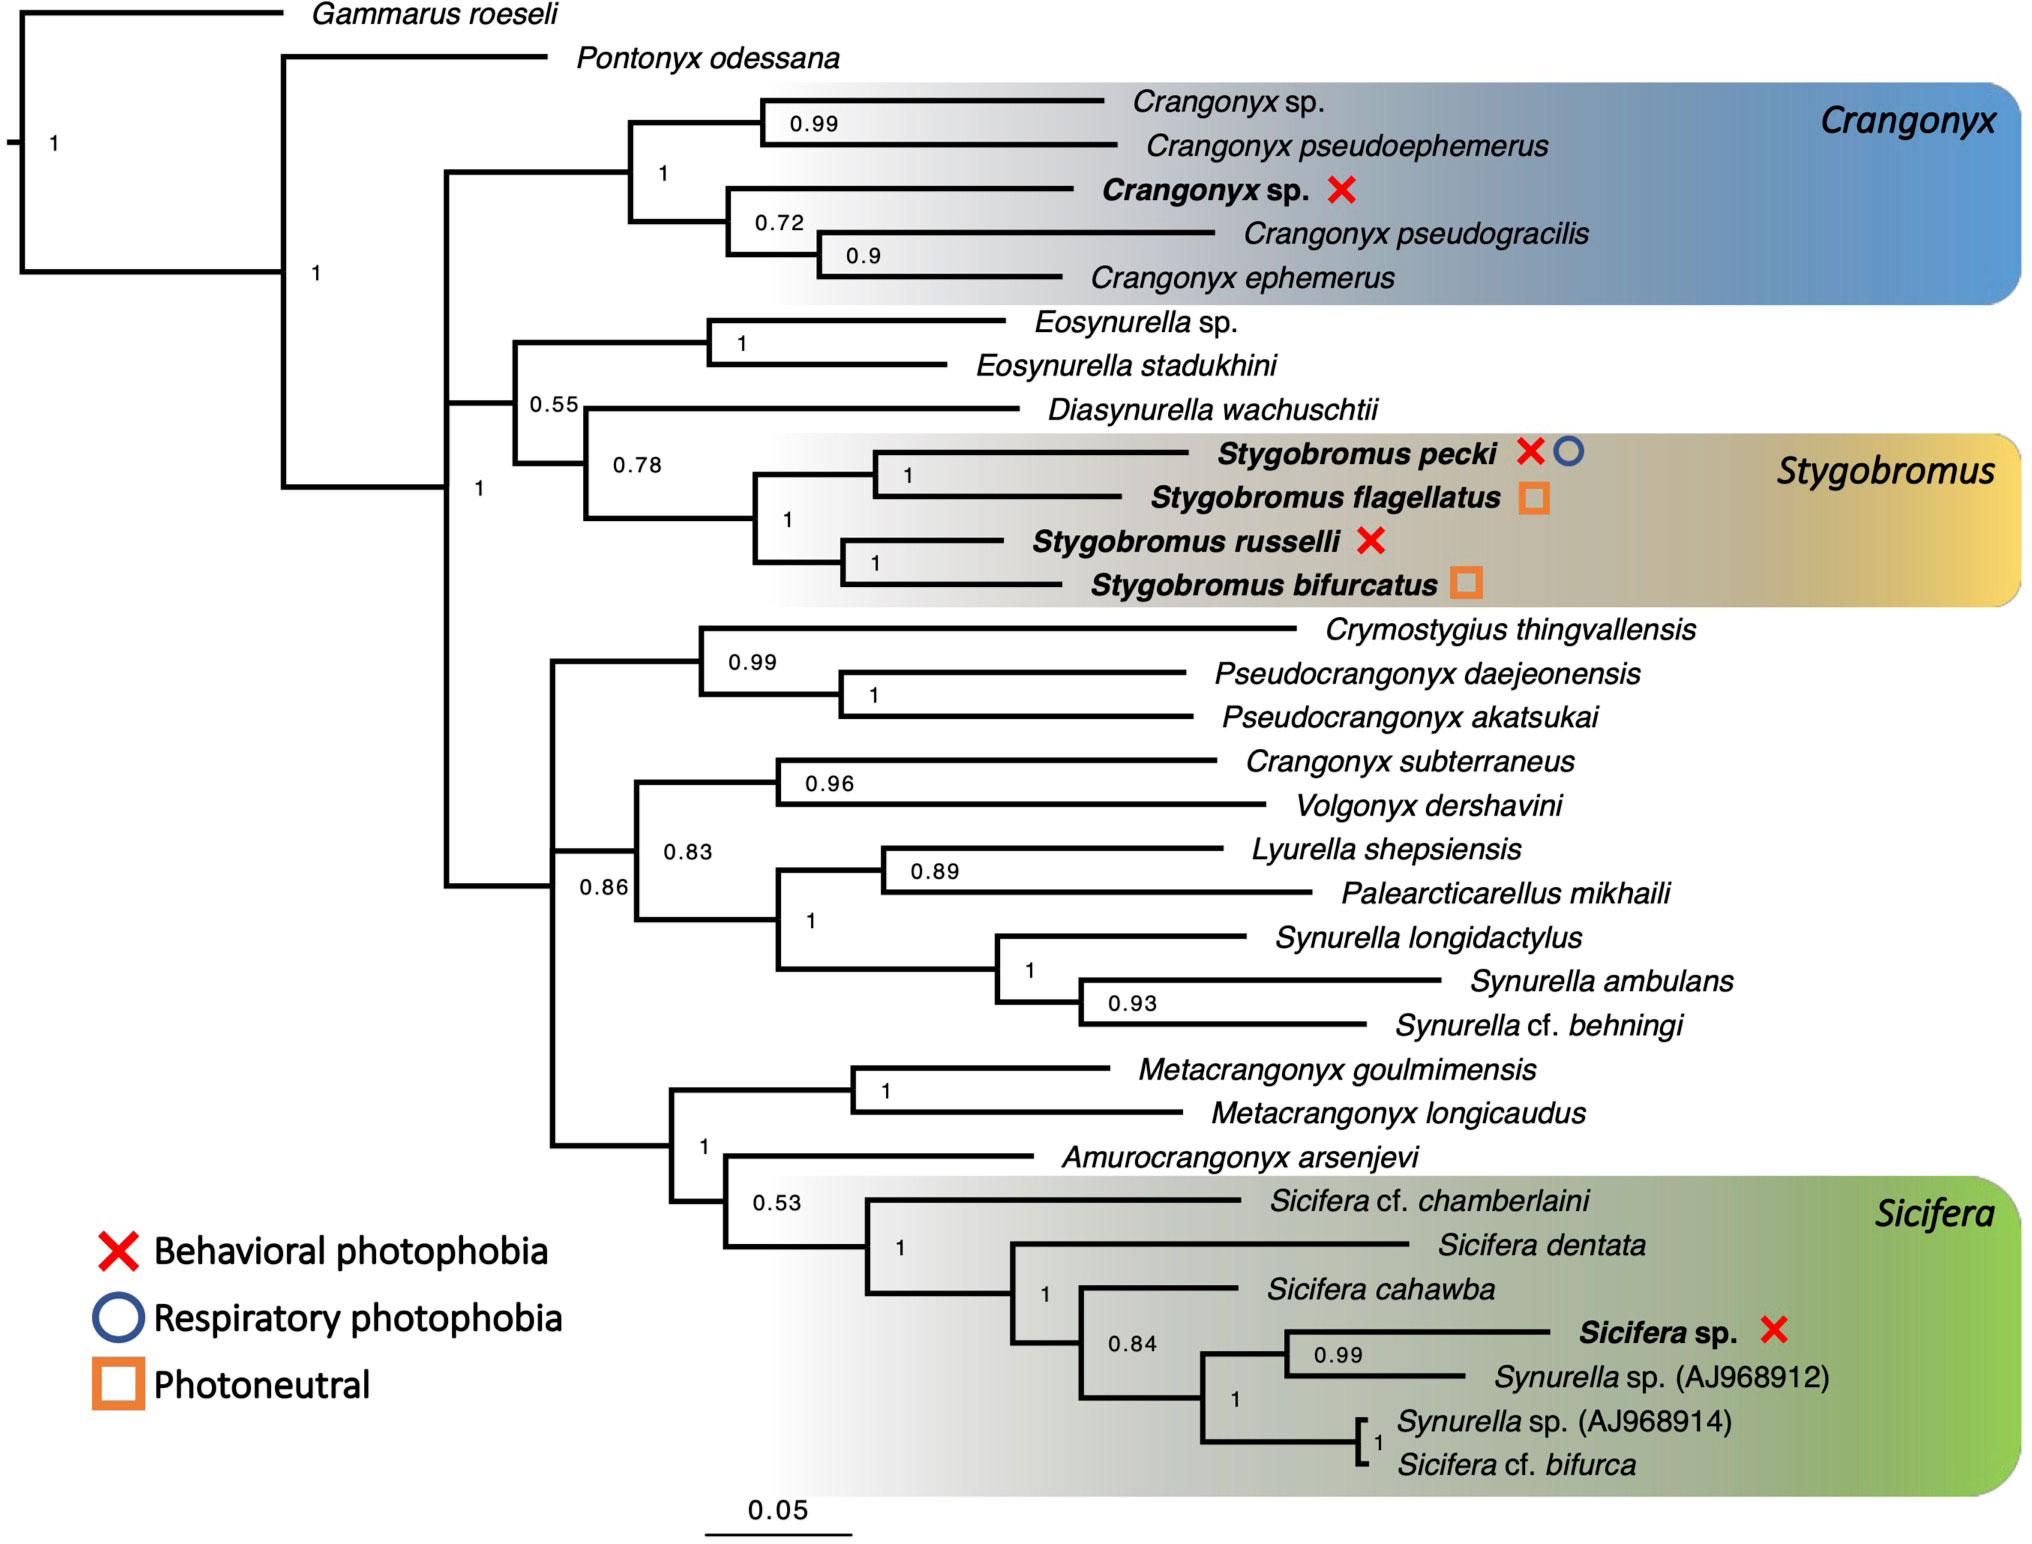
Figure 3 Bayesian phylogeny based on 34 sequences of the same 468-bp region of the COI gene for multiple Crangonyctidae species. Terminal nodes represent species designations. Bayesian posterior probabilities are given at all major nodes. Genera studied for phenotype are highlighted and sampled species names are written in bold. Phototaxis categories are indicated by the legend on the left of figure. Full phylogeny containing 79 sequences can be found in Figure S5.
The means of the behavioral and respiratory phototaxis phenotypes were not found to have strong phylogenetic signals (Figure 4, λbehavior ≈ 0, λrespiratory ≈ 0). However, there is association between the phylogeny and the CVs of the behavioral and respiratory phenotypes (Figure 5, λbehavior = 0.85, λrespiratory = 0.44). ANS modeling suggested that the common ancestor of the species evaluated was behaviorally photophobic, and that respiratory stress in response to light evolved independently in some species (Figure 6). Of the two fitted phylogenetic regressions and the non-phylogenetic regression, the non-phylogenetic simple regression was found to better explain the residual variation in both the trait means and the CVs (Table 2). Among the phylogenetic macroevolutionary models for the means of both phenotypes, Brownian motion using the habitat tree was found to be the best model for explaining variation in behavior while white noise using the phylogenetic tree was found to best explain variation in the respiratory data (Table 3). For the trait CVs Brownian motion using the phylogenetic tree was found to best explain variation in the behavioral data while Brownian motion using the habitat tree was found to best explain variation in the respiratory data (Table 3).
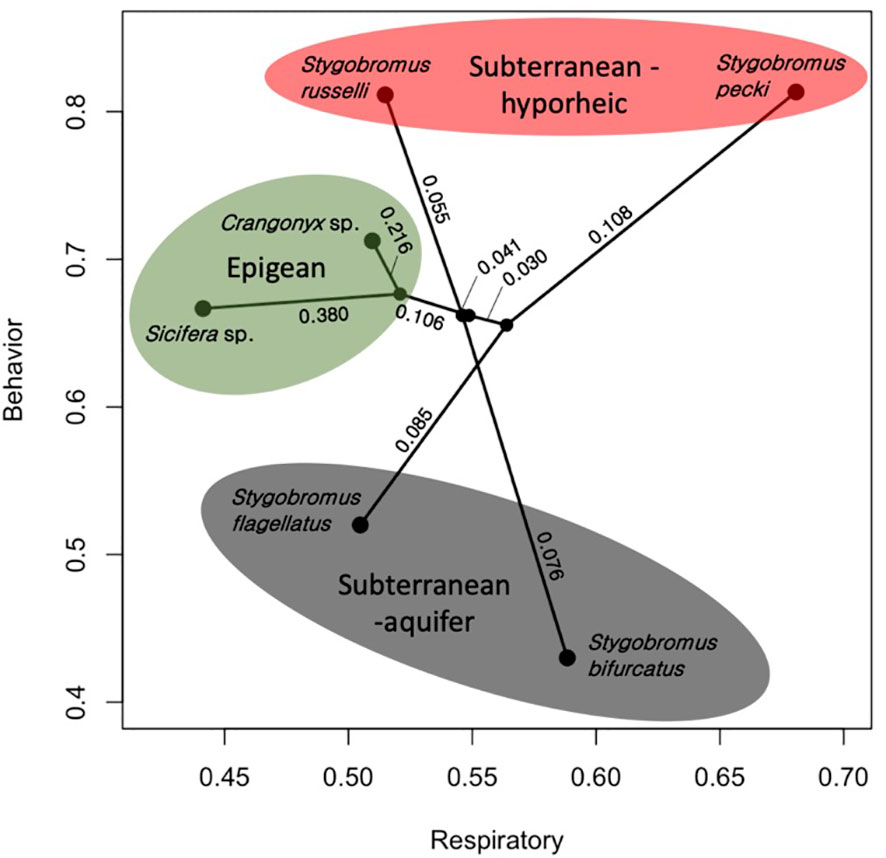
Figure 4 Phylomorpho plot depicting the means of the two traits measured for each species of amphipod studied. Each terminal point represents the mean of these two traits (Respiratory = proportion of total DO consumption, Behavior = proportion of time avoiding light exposure) for each species. The phylogeny is the same as in Figure 3. Numeric values represent proportion of divergence between nodes. Color shading reflects the habitat classes.
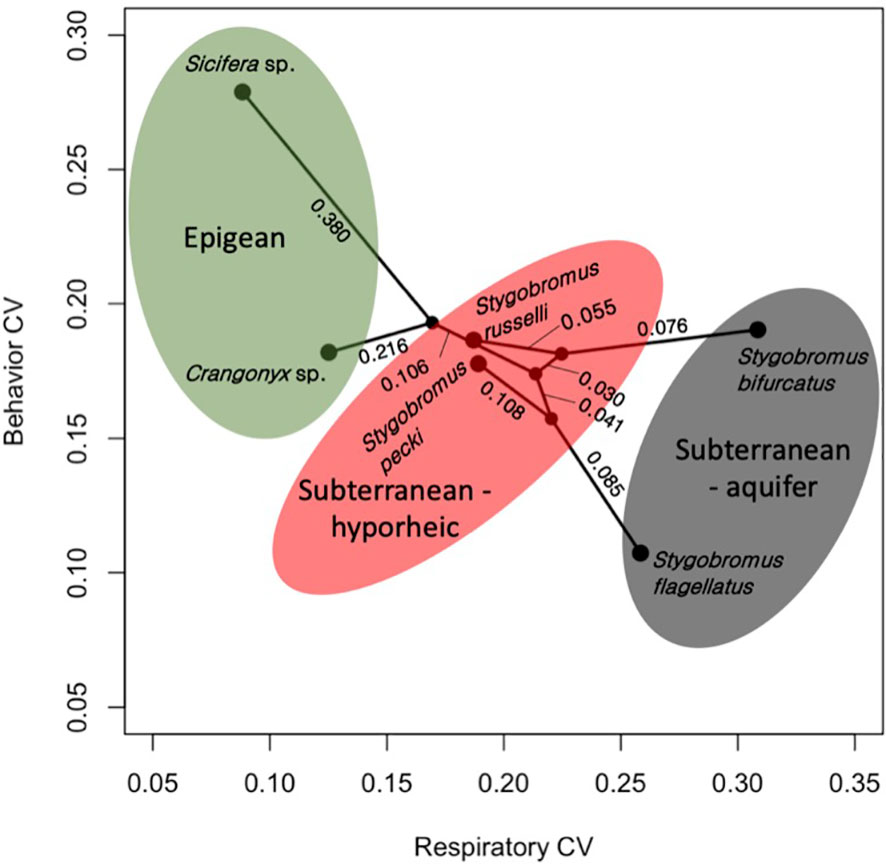
Figure 5 Phylomorpho plot depicting coefficient of variation (CV) of the two phenotypes measured for each species. Each point represents the relationship between the CVs for each species. The phylogeny is the same as in Figure 3. Numeric values represent proportion of divergence between nodes. Color shading reflects the habitat classes.
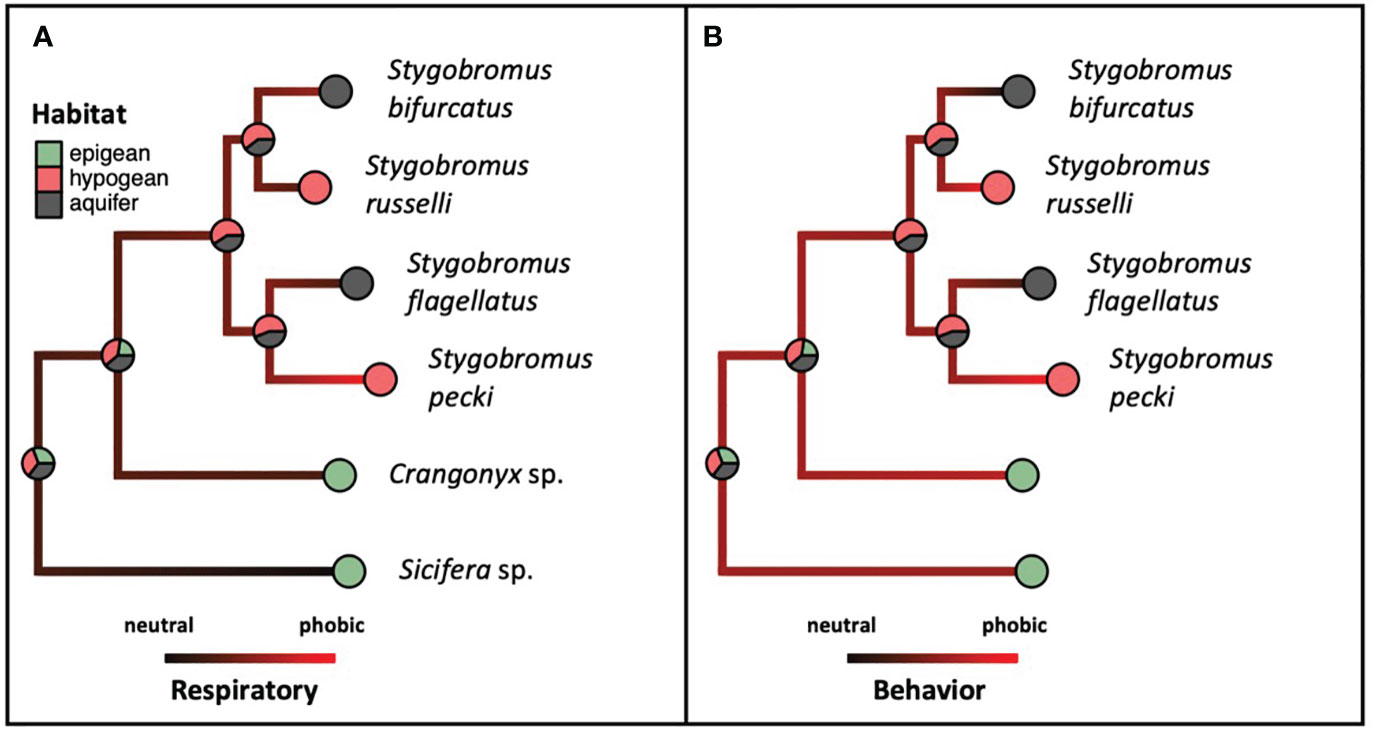
Figure 6 Ancestral state reconstructions of both habitat association (pies) and phenotype [(A). Respiratory, (B). Behavior, shading: neutral (black) to phobic (red)] referencing the same phylogeny as in Figure 3, and phenotype and habitat categories from Table 1.
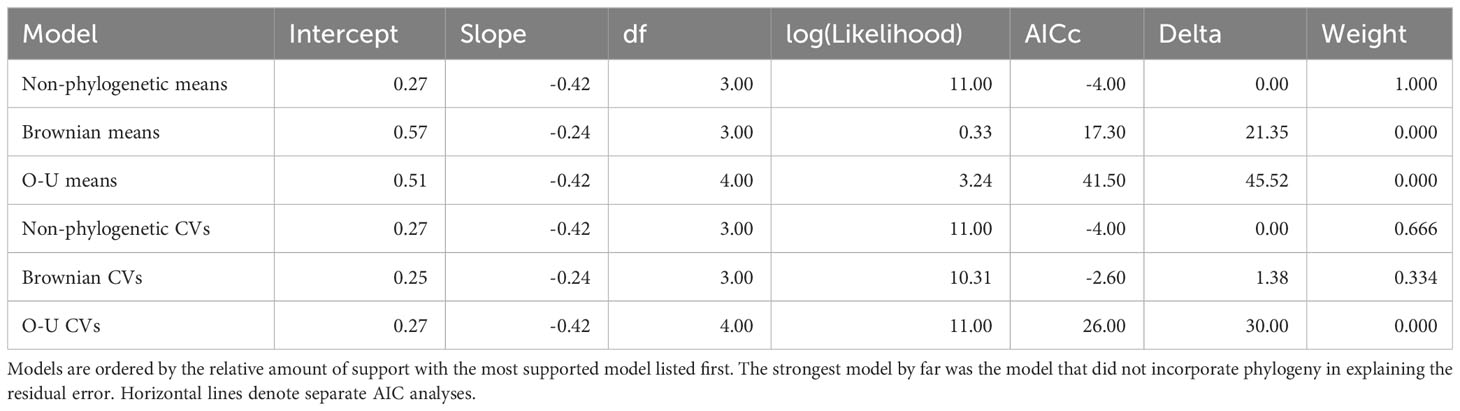
Table 2 Results of regression model comparisons.
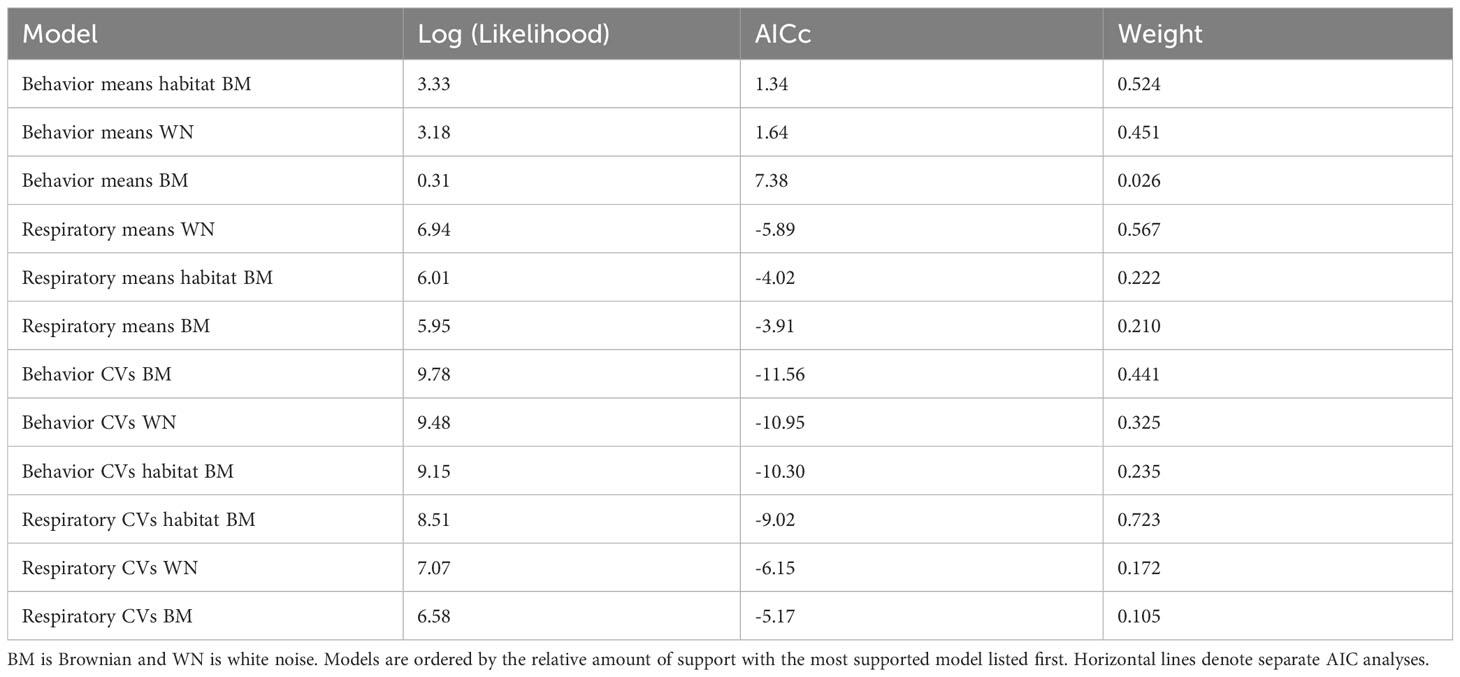
Table 3 Results of phylogenetic macroevolutionary model comparisons.
4 Discussion
Four of the six crangonyctids were behaviorally photophobic (eyed species: Crangonyx sp., Sicifera sp., and eyeless: Stygobromus pecki and S. russelli) while the remaining two eyeless species (S. flagellatus and S. bifurcatus) were photoneutral. This result indicates that at least some Stygobromus, and perhaps other species of eyeless Crangonyctidae, have the capacity to detect light although there is currently no obvious anatomical or molecular evidence for this. This finding is consistent with recent studies on subterranean amphipods in Europe (Fišer et al., 2016), subterranean beetles in Australia (Langille et al., 2018), and subterranean crayfish in the USA (Li and Cooper, 2002), suggesting photoreceptors could be widespread in subterranean eyeless arthropods. Although our sample size was relatively small (n = 5–10 individuals per species), the relatively low CVs suggest that these estimates adequately capture variation for these traits within these species.
All Stygobromus species are eyeless, and Stygobromus was recovered in our analysis to be a monophyletic taxon, thus the eyeless phenotype appears to have evolved once in a common ancestor of all extant Stygobromus. Eyelessness in stygobiontic species is hypothesized to be due to strong selection against visual organs in lightless environments because eyes are energetically wasteful in subterranean environments where sight is not possible and food is scarce (Green and Romero, 1997; Moran et al., 2015). However, along with the ANSs, the paraphyletic distribution of photic behavior and respiratory phenotypic trait means across the phylogeny suggests that photoneutrality vs. photophobia evolved independently in various species.
Unfortunately, because we were only able to obtain a maximum of two species per habitat category, we were not able to quantitatively test the relationship between habitat association and phenotype. This limitation is unavoidable, as the species sampled are rare, often at low densities, and in the case of some habitats, the species sampled are the only locally available crangonyctids adapted to their respective habitats. To overcome this, we also performed an ANS for habitat association which found that epigean vs. subterranean habitat associations are monophyletic among these species, though subterranean phenotypes are known to have evolved independently multiple times in Crangonyctidae (Holsinger, 1967; Cannizzaro et al., 2021; Marin and Palatov, 2021).
Though the phylogenetic distribution of trait means were found to be paraphyletic with little to no phylogenetic signal, there was phylogenetic signal for the CVs of phenotypes. At least in the case of Stygobromus, this might be due to neutral processes under relaxed selection because photophobia is not relevant in deep phreatic waters (i.e., these species never encounter light and therefore any phenotypes relating to light responses cannot be advantageous and are therefore either neutral and evolving due to genetic drift, or negative if they are energy expensive).
The habitat model was found to be the strongest for two of the four evolutionary model comparisons, suggesting that habitat largely determines phototaxis in this group of species (Table 3). We hypothesize that this result could be because behavioral photophobia is maintained by selection in interstitial and spring-associated species to protect members of these species from entering inhospitable environments (i.e., an epigean environment with visual predators). Even though the eyeless phenotype may be highly advantageous in subterranean habitats, it is presumed to be highly disadvantageous in surface habitats because sightlessness in an epigean environment is likely an evolutionary dead end due to predation and other nonlethal risks including scarcity of suitable mates (Tobler, 2009; Horstkotte et al., 2010; Klaus and Plath, 2011). Therefore, selection on near-surface sightless species to remain in a subterranean environment likely outweighs any fitness disadvantages associated with maintaining light sensitive photoreceptors.
Presently, it is unclear if convergent phenotypes in Stygobromus are the result of selection operating on novel or standing genetic variation. However, research in other stygobiontic organisms has suggested that convergent characteristics in related organisms can be attributed to genetic changes that are unique to each instance of adaptation (Protas and Patel, 2008), suggesting that adaptation of similar phenotypes can be due to unique lineage-specific genomic changes rather than reuse of standing genetic variation.
A possible explanation for the inverse relationship between the CVs of the behavioral and respiratory phenotypes (Figure 5) is balancing of the trait phenotype with the level of familiarity of the stimulus. In other words, an environmental stimulus to which a population is naïve to is expected to be stressful, whereas a familiar environmental stimulus is expected to be less stressful, and the population’s phenotype is expected to be tuned to stimulus through selection. In this study, both species collected from deep aquifer environments (S. flagellatus and S. bifurcatus) showed the highest CV for respiratory response while the epigean species showed the lowest; the opposite was found for behavior. This suggests that the respiratory trait contains neutral variation in the species that never encounter light while the trait is closer to fixed in the species that encounter light regularly. Considering that deep aquifer species essentially never encounter light, the broader variation in the respiratory response of deep aquifer species suggests that neutral variation exists for how stressful light is perceived to be by these naïve species. Likewise, it is not surprising that they would also have little variation in a photic behavioral response (i.e., organisms don’t adapt to stimuli they have never experienced before). In contrast, we see that the epigean species show low variation in stress response (i.e., light is a daily factor for these species, and they all find it non-stressful) but high variation in behavioral response. This would suggest that avoiding light bears relatively neutral consequences for these species, which makes sense: if light is deleterious to a species that encounters light every day, it is unlikely for that species to persist. Following this logic, we see that the ecotone species show moderate variation for both phenotypes. This is not surprising as these species are likely under directional selection with respect to how they deal with light, and therefore have ‘pruned down’ neutral variation. In summary, if an organism was completely naïve to an environmental stimulus, the stimulus could be quite stressful; however, a stimulus that is common to the evolution of the species may elicit an adaptive behavioral response without causing much stress.
The phylogenetic signal for the phenotypic CVs suggests that the relationship between the mean and the amount of variation for a trait in a population may be phylogenetically constrained. This could be due to certain lineages having higher standing genetic variation for the measured phenotypes, or at least some other mechanism of maintaining higher population-level phenotypic variation, which may affect the evolvability of a lineage. In essence, a population with an exceptionally low CV for a trait could be said to be fixed for that trait because there is almost no intrapopulation variation for selection to operate on; whereas a population with a relatively high CV could be expected to have individuals within the population affected quite differently by the same selection pressures due to considerable differences in their phenotype. Therefore, populations with higher trait CVs could be said to have greater evolutionary potential as a population because individuals are expected to have variable and unequal fitness and therefore, as a population, have the possibility of tolerating greater variation in selection.
These findings support the hypothesis that, under certain circumstances, motile organisms can evolve behaviors in response to environmental indicators to avoid inhospitable habitats and deleterious effects associated with those habitats. Thus, it is likely that behavior mediates nonrandom dispersal and habitat occupancy, functioning to maintain biogeographic distributions of populations (Binckley and Resetarits, 2005; Resetarits, 2005; Edelaar et al., 2008; Fišer et al., 2016; Kralj-Fišer et al., 2020). If standing genetic variation can affect the evolution of behavior, and behavior can affect population structure and thus gene flow, then it is possible that behaviors and genetic structure form a positive feedback loop affecting speciation.
Data availability statement
The datasets presented in this study can be found in online repositories. The names of the repository/repositories and accession number(s) can be found in the article/Supplementary Material.
Ethics statement
The manuscript presents research on animals that do not require ethical approval for their study.
Author contributions
Conceptualization: MW, PN, JG, BS, and WN. Methodology: MW, PN, JG, DR, BS, and WN. Software: MW. Validation: MW, PN, JG, DR, BS, and WN. Formal analysis: MW. Investigation: MW, PN, and DR. Resources: JG, DR, BS, and WN. Data curation: MW, PN, and DR. Writing—original draft preparation: MW. Writing—review and editing: MW, PN, JG, DR, BS, and WN. Visualization: MW. Supervision: JG, BS, and WN. Project administration: MW, BS, and WN. Funding acquisition: BS and WN. All authors contributed to the article and approved the submitted version.
Funding
This research was funded by the Edwards Aquifer Authority, under the Refuge Research program of the Habitat Conservation Plan (HCP) for the Edwards Aquifer.
Acknowledgments
We thank all who assisted with collection of specimens for this study, and those who gave preliminary reviews of the manuscript. Use of trade names or mention of specific companies does not imply endorsement of these companies or their products. Thank you to Andrew Cannizzaro for sharing data and insight on Cragonyctidae. We thank Daniel Puckett for assistance with the molecular genetics. The views presented herein are those of the authors and do not necessarily reflect those of the U.S. Fish and Wildlife Service. This study is dedicated to the late Eric Julius and Emmett Worsham who both devoted their young lives to the study, conservation, and husbandry of rare and endangered aquatic and marine organisms.
Conflict of interest
The authors declare that the research was conducted in the absence of any commercial or financial relationships that could be construed as a potential conflict of interest.
Publisher's note
All claims expressed in this article are solely those of the authors and do not necessarily represent those of their affiliated organizations, or those of the publisher, the editors and the reviewers. Any product that may be evaluated in this article, or claim that may be made by its manufacturer, is not guaranteed or endorsed by the publisher.
Supplementary material
The Supplementary Material for this article can be found online at: https://www.frontiersin.org/articles/10.3389/fevo.2023.1234244/full#supplementary-material
References
Aden E. (2005). “Adaptation to darkness,” in Encyclopedia of caves. Eds. Culver D. C., White W. B. (Amsterdam: Elsevier Academic Press), 1–3.
Aspiras A. C., Rohner N., Martineau B., Borowsky R. L., Tabin C. J. (2015). Melanocortin 4 receptor mutations contribute to the adaptation of cavefish to nutrient-poor conditions. Proc. Natl. Acad. Sci. 112, 9668–9673. doi: 10.1073/pnas.1510802112
Barton K., Barton M. K. (2015) Package ‘MuMIn’. Version 1, 18. Available at: https://cran.r-project.org/web/packages/MuMIn/MuMIn.pdf.
Bethel W. M., Holmes J. C. (1973). Altered evasive behavior and responses to light in amphipods harboring Acanthocephalan Cystacanths. J. Parasitol. 59 (6), 945–956. doi: 10.2307/3278623
Bilandžija H., Laslo M., Porter M. L., Fong D. W. (2017). Melanization in response to wounding is ancestral in arthropods and conserved in albino cave species. Sci. Rep. 7, 17148. doi: 10.1038/s41598-017-17471-2
Binckley C. A., Resetarits W. J. Jr (2005). ). Habitat selection determines abundance, richness and species composition of beetles in aquatic communities. Biol. Lett. 1, 370–374. doi: 10.1098/rsbl.2005.0310
Borowsky B. (2011). Responses to light in two eyeless cave dwelling amphipods (Niphargus ictus and Niphargus Frasassianus). J. Crustacean Biol. 31, 613–616. doi: 10.1651/10-3450.1
Cannizzaro A. G., Daniels J. D., Berg D. J. (2021). Phylogenetic analyses of a new freshwater amphipod reveal polyphyly within the Holarctic family Crangonyctidae, with revision of the genus Synurella. Zool. J. Linn. Soc 195, 1100–1115. doi: 10.1093/zoolinnean/zlab092
Carlini D. B., Fong D. W. (2017). The transcriptomes of cave and surface populations of Gammarus minus (crustacea: Amphipoda) provide evidence for positive selection on cave downregulated transcripts. PloS One 12. doi: 10.1371/journal.pone.0186173
Culver D. C., Holsinger J. R., Christman M. C., Pipan T. (2010). Morphological differences among eyeless amphipods in the genus Stygobromus dwelling in different subterranean habitats. J. Crust. Biol. 30, 68–74. doi: 10.1651/09-3156.1
Darriba D., Posada D., Kozlov A. M., Stamatakis A., Morel B., Flouri T. (2020). ModelTest-NG: A new and scalable tool for the selection of DNA and protein evolutionary models. Mol. Biol. Evol. 37, 291–294. doi: 10.1093/molbev/msz189
Darwin C. R. (1859). On the origin of species by means of natural selection, or the preservation of favoured races in the struggle for life (London: John Murray).
Edelaar P., Siepielski A. M., Clobert J. (2008). Matching habitat choice causes directed gene flow: A neglected dimension in evolution and ecology. Evolution 62, 2462–2472. doi: 10.1111/j.1558-5646.2008.00459.x
Espinasa L., Collins E., Finocchiaro A., Kopp J., Robinson J., Rutkowski J. (2016). Incipient regressive evolution of the circadian rhythms of a cave amphipod. Subterr. Biol. 20, 1–13. doi: 10.3897/subtbiol.20.10010
Ethridge J. Z., Gibson J. R., Nice C. C. (2013). Cryptic diversity within and amongst spring-associated Stygobromus amphipods (Amphipoda: Crangonyctidae). Zool. J. Linn. Soc 167, 227–242. doi: 10.1111/j.1096-3642.2012.00877.x
Felsenstein J. (1973). Maximum-likelihood estimation of evolutionary trees from continuous characters. Am. J. Hum. Genet. 25, 471–492.
Fišer Ž., Novak L., Luštrik R., Fišer C. (2016). Light triggers habitat choice of eyeless subterranean but not of eyed surface amphipods. Sci. Nat. 103, 1–2. doi: 10.1007/s00114-015-1329-9
Folmer O., Black M., Hoeh W., Lutz R., Vrijenhoek R. (1994). DNA primers for amplification of mitochondrial cytochrome c oxidase subunit I from diverse metazoan invertebrates. Mol. Mar. Biol. Biotechnol. 3, 294–299.
Fong D. W., Kane T. C., Culver D. C. (1995). Vestigialization and loss of nonfunctional characters. Annu. Rev. Ecol. Syst. 26, 249–268. doi: 10.1146/annurev.es.26.110195.001341
Geber M. A., Eckhart V. M. (2005). Experimental studies of adaptation in Clarkia Xantiana. II. fitness variation across a subspecies border. Evolution 59, 521. doi: 10.1554/04-265
Gibson J. R., Harden S. J., Fries J. N. (2008). Survey and distribution of invertebrates from selected springs of the Edwards Aquifer in Comal and Hays counties, Texas. Southwest. Nat. 53, 74–84. doi: 10.1894/0038-4909(2008)53[74:sadoif]2.0.co;2
Green S. M., Romero A. (1997). Responses to light in two blind cave fishes (Amblyopsis spelaea and Typhlichthys subterraneus) (Pisces: Amblyopsidae). Environ. Biol. Fishes 50, 167–174. doi: 10.1023/a:1007321031997
Harmon L. J., Weir J. T., Brock C. D., Glor R. E., Challenger W. (2007). Geiger: Investigating evolutionary radiations. Bioinformatics 24, 129–131. doi: 10.1093/bioinformatics/btm538
Holsinger J. R. (1967). Systematics, speciation, and distribution of the subterranean amphipod genus Styognectes (gammaridae). Bull U S Natl Mus 259, 1–176. doi: 10.5479/si.03629236.259.1
Horstkotte J., Riesch R., Plath M., Jäger P. (2010). Predation by three species of spiders on a cave fish in a mexican sulphur cave. Arachnology 15, 55–58. doi: 10.13156/arac.2010.15.2.55
Hutchins B. T., Swink A. P., Diaz P. H., Schwartz B. F. (2020). Environmental influences on invertebrate diversity and community composition in the Hyporheic Zone Ecotone in Texas, USA: Contrasts between co-occurring Epigean taxa and stygobionts. Hydrobiologia 847, 3967–3982. doi: 10.1007/s10750-020-04379-8
Jarosz A. F., Wiley J. (2014). What are the odds? A practical guide to computing and reporting bayes factors. J. Probl. Solving 7, 2–9. doi: 10.7771/1932-6246.1167
Jeffery W. R. (2005). Adaptive evolution of eye degeneration in the Mexican blind cavefish. J. Hered. 96, 185–196. doi: 10.1093/jhered/esi028
Kearse M., Moir R., Wilson A., Stones-Havas S., Cheung M., Sturrock S., et al. (2012). Geneious basic: An integrated and extendable desktop software platform for the organization and analysis of Sequence Data. Bioinformatics 28, 1647–1649. doi: 10.1093/bioinformatics/bts199
Kedwards T. J., Blockwell S. J., Taylor E. J., Pascoe D. (1996). Design of an electronically operated flow-through Respirometer and its use to investigate the effects of copper on the respiration rate of the amphipod Gammarus pulex (L.). Bull. Environ. Contam. Toxicol. 57, 610–616. doi: 10.1007/s001289900234
Klaus S., Plath M. (2011). Predation on a cave fish by the freshwater crab Avotrichodactylus bidens (Bott 1969) (Brachyura, Trichodactylidae) in a mexican sulfur cave. Crustaceana 84, 411–418. doi: 10.1163/001121611x560853
Kralj-Fišer S., Premate E., Copilaş-Ciocianu D., Volk T., Fišer Ž., Balázs G., et al. (2020). The interplay between habitat use, morphology and locomotion in subterranean crustaceans of the genus Niphargus. Zoology 139, 125742. doi: 10.1016/j.zool.2020.125742
Lange R., Marshall D. J. (2016). Propagule size and dispersal costs mediate establishment success of an invasive species. Ecology 97, 569–575. doi: 10.1890/15-1573
Langecker T. G. (2000). “The effects of continuous darkness on cave ecology and cavernicolous evolution,” in Ecosystems of the World: Subterranean Ecosystems, vol. 30 . Eds. Wilkens H., Culver D. C., Humphreys W. F. (Amsterdam: Elsevier Academic Press), 135–158.
Langille B. L., Tierney S. M., Austin A. D., Humphreys W. F., Cooper S. J. (2018). How blind are they? phototactic responses in stygobiont diving beetles (Coleoptera: Dytiscidae) from calcrete aquifers of Western Australia. Aust. Entomol. 58, 425–431. doi: 10.1111/aen.12330
Li H., Cooper R. L. (2002). The effect of ambient light on Blind Cave Crayfish: Social Interactions. J. Crustacean Biol. 22, 449–458. doi: 10.1163/20021975-99990252
Little A. G., Seebacher F. (2017). “Acclimation, acclimatization, and seasonal variation in amphibians and reptiles,” in Amphibian and Reptile Adaptations to the Environment (Boca Raton, FL: CRC Press), 41–62.
Macneil C., Dick J. T. A. (2014). Physicochemical tolerance, habitat use and predation are drivers of patterns of coexistence and exclusion among invasive and resident amphipods. Freshw. Biol. 59, 1956–1969. doi: 10.1111/fwb.12399
Marin I. N., Palatov D. M. (2021). Volgonyx gen.n. and Pontonyx gen.n., two new genera of the family Crangonyctidae (Crustacea: Amphipoda) from the Southeastern Europe. Arthropoda Sel. 30, 43–61. doi: 10.15298/arthsel.30.1.05
Moran D., Softley R., Warrant E. J. (2015). The energetic cost of vision and the evolution of eyeless Mexican cavefish. Sci. Adv. 1, e1500363. doi: 10.1126/sciadv.1500363
Nair P., Huertas M., Nowlin W. H. (2020). Metabolic responses to long-term food deprivation in subterranean and surface amphipods. Subterr. Biol. 33, 1–15. doi: 10.3897/subtbiol.33.48483
Nissen B. D., Devitt T. J., Bendik N. F., Gluesenkamp A. G., Gibson R. (2018). New occurrence records for stygobiontic invertebrates from the Edwards and Trinity Aquifers in west-Central Texas, USA. Subterr. Biol. 28, 1–13. doi: 10.3897/subtbiol.28.29282
Nowicki C. J., Bunnell D. B., Armenio P. M., Warner D. M., Vanderploeg H. A., Cavaletto J. F., et al. (2017). Biotic and abiotic factors influencing zooplankton vertical distribution in Lake Huron. J. Great Lakes Res. 43, 1044–1054. doi: 10.1016/j.jglr.2017.08.004
Pagel M. (1999). Inferring the historical patterns of Biological Evolution. Nature 401, 877–884. doi: 10.1038/44766
Palatov D. M., Marin I. N. (2023). Diversity of the Caucasian genus Diasynurella Behning 1940 (Amphipoda: Crangonyctidae) with description of four new species. Arthropoda Sel. 32, 23–55. doi: 10.15298/arthsel.32.1.03
Paradis E., Claude J., Strimmer K. (2004). Ape: Analyses of phylogenetics and evolution in R language. Bioinformatics 20, 289–290. doi: 10.1093/bioinformatics/btg412
Pipan T., Culver D. C. (2012). Convergence and divergence in the subterranean realm: A reassessment. Biol. J. Linn. Soc 107, 1–14. doi: 10.1111/j.1095-8312.2012.01964.x
Protas M. E., Patel N. H. (2008). Evolution of coloration patterns. Annu. Rev. Cell Dev. Biol. 24, 425–446. doi: 10.1146/annurev.cellbio.24.110707.175302
Reddell J. R. (1986). Studies on the Cave and Endogean Fauna of North America, I (Austin, Texas: Texas Natural Science Center, The University of Texas at Austin).
Resetarits W. J. Jr (2005). Habitat selection behaviour links local and regional scales in Aquatic Systems. Ecol. Lett. 8, 480–486. doi: 10.1111/j.1461-0248.2005.00747.x
Revell L. J. (2012). Phytools: An R package for phylogenetic comparative biology (and other things). Methods Ecol. Evol. 3, 217–223. doi: 10.1111/j.2041-210x.2011.00169.x
Riesch R., Plath M., Schlupp I. (2011). Speciation in caves: Experimental evidence that permanent darkness promotes reproductive isolation. Biol. Lett. 7, 909–912. doi: 10.1098/rsbl.2011.0237
Ronquist F., Teslenko M., van der Mark P., Ayres D. L., Darling A., Höhna S., et al. (2012). MrBayes 3.2: Efficient Bayesian phylogenetic inference and model choice across a large model space. Syst. Biol. 61, 539–542. doi: 10.1093/sysbio/sys029
Simčič T., Brancelj A. (2007). The effect of light on oxygen consumption in two amphipod crustaceans–the hypogean Niphargus stygius and the epigean Gammarus fossarum. Mar. Freshw. Behav. Physiol. 40, 141–150. doi: 10.1080/10236240701452465
Tobler M. (2009). Does a predatory insect contribute to the divergence between cave- and surface-adapted fish populations? Biol. Lett. 5, 506–509. doi: 10.1098/rsbl.2009.0272
Trontelj P., Blejec A., Fišer C. (2012). Ecomorphological convergence of cave communities. Evolution 66, 3852–3865. doi: 10.1111/j.1558-5646.2012.01734.x
Tung Ho L. s., Ané C. (2014). A linear-time algorithm for Gaussian and Non-Gaussian Trait Evolution models. Syst. Biol. 63, 397–408. doi: 10.1093/sysbio/syu005
Uyeda J. C., Harmon L. J. (2020). treeplyr: ‘dplyr’ functionality for matched tree and data objects. R package version 0.1.9. Available at: https://github.com/uyedaj/treeplyr.
Keywords: evolvability, stress, aquifer, hyporheic, epigean, Stygobromus, Sicifera, Crangonyx
Citation: Worsham MLD, Nair P, Gibson JR, Rodriguez D, Schwartz BF and Nowlin WH (2023) Phylogenetically independent behavior mediating geographic distributions suggests habitat is a strong driver of phenotype in crangonyctid amphipods. Front. Ecol. Evol. 11:1234244. doi: 10.3389/fevo.2023.1234244
Received: 03 June 2023; Accepted: 04 September 2023;
Published: 18 September 2023.
Edited by:
Donald Price, University of Nevada, Las Vegas, United StatesReviewed by:
Dmitry Sidorov, Far Eastern Branch of the Russian Academy of Sciences, RussiaWenhao Li, Shanghai Ocean University, China
Copyright © 2023 Worsham, Nair, Gibson, Rodriguez, Schwartz and Nowlin. This is an open-access article distributed under the terms of the Creative Commons Attribution License (CC BY). The use, distribution or reproduction in other forums is permitted, provided the original author(s) and the copyright owner(s) are credited and that the original publication in this journal is cited, in accordance with accepted academic practice. No use, distribution or reproduction is permitted which does not comply with these terms.
*Correspondence: McLean L. D. Worsham, bWNsZWFud0BoYXdhaWkuZWR1