 Laura G. Perry
 Patrick B. Shafroth
 Samuel J. Alfieri2
 Ian M. Miller
- 1Biology Department, Colorado State University, Fort Collins, CO, United States
- 2U.S. Geological Survey, Fort Collins Science Center, Fort Collins, CO, United States
- 3Washington Sea Grant, University of Washington, Port Angeles, WA, United States
Introduction: Large dam removals provide a restoration opportunity for shrinking coastal wetland habitats. Dam removal can increase sediment delivery to sediment-starved river deltas and estuaries by restoring natural sediment transport and mobilizing reservoir-impounded sediment. However, rapid mobilization of massive quantities of sediment stored behind large dams also constitutes a major ecological perturbation. Information is lacking on coastal habitat responses to sediment pulses of this magnitude.
Methods: Removal of two large dams along the Elwha River (Washington, USA) in 2011–2014 released ~20.5 Mt of impounded sediment, ~5.4 Mt of which were deposited in the delta and estuary (hereafter, delta). We used time series of aerial imagery, digital elevation models, and vegetation field sampling to examine plant community responses to this sediment pulse across seven years during and after dam removal.
Results: Between 2011 and 2018, the Elwha River delta increased by ~26.8 ha. Vegetation colonized ~16.4 ha of new surfaces, with mixed pioneer vegetation on supratidal beach, river bars, and river mouth bars and emergent marsh vegetation in intertidal aquatic habitats. Colonization occurred on surfaces that were higher and more stable in elevation and farther from the shoreline. Compared to established delta plant communities, vegetation on new surfaces had lower cover of dominant species and functional groups, with very low woody cover, and lower graminoid cover than dunegrass and emergent marsh communities. Over time following surface stabilization, however, vegetation on new surfaces increased in species richness, cover, and similarity to established communities. By 2018, ~1.0 ha of vegetation on new surfaces had developed into dunegrass or willow–alder communities and ~5.9 ha had developed into emergent marsh. At the same time, dam removal had few discernible effects on established delta plant communities.
Discussion: Together, these results suggest that rapid sediment mobilization during large dam removal has potential to expand coastal wetland habitat without negatively affecting established plant communities. However, as sediment loads declined in 2016–2018, new delta surfaces decreased by ~4.5 ha, and ~1.6 ha of new vegetation reverted to no vegetation. Long-term persistence of the expanded coastal habitat will depend on ongoing erosional and depositional processes under the restored natural sediment regime.
1 Introduction
Coastal wetland habitats have declined dramatically over recent centuries (Davidson, 2014). Along the United States West Coast, an estimated 85% of river delta, riverine estuary, and embayment wetlands have been lost since European settlement (Brophy et al., 2019). Coastal wetlands provide valuable ecosystem services, including nursery habitat for marine fisheries and invertebrates, shorebird breeding grounds and migratory stopovers, coastal storm protection, erosion control, and water purification (Barbier et al., 2011). Restoration efforts for coastal wetlands are widespread, but with mixed success (Elliot et al., 2016; Cadier et al., 2020).
Human-induced changes to river sediment transport are an important factor contributing to loss of river delta and riverine estuary habitats. Upstream dams and levees capture sediment, reducing downstream sediment loads by 50–100% on many regulated rivers and resulting in erosion and subsidence of coastal habitats (Tessler et al., 2018; Besset et al., 2019). Over longer time-scales (i.e., centuries or millennia), deforestation and cropping also have increased river sediment loads and transport to coastal habitats, but often not enough to offset recent and rapid effects of dams and channelization on coastal erosion and subsidence (Meade, 1996).
Dam removal is an increasingly common approach for restoring sediment transport to riparian and riverine ecosystems (O'Connor et al., 2015). Dam removal can have myriad positive ecological effects, improving connectivity (e.g., fish passage, hydrochory, transport of large woody debris), restoring natural hydrologic regimes, and increasing sediment delivery to sediment-starved downstream channels, floodplains, estuaries, and deltas (Bellmore et al., 2019). However, dam removal also constitutes a major ecological perturbation, as conditions maintained for decades by dam emplacement are changed over a period of weeks to years (depending on removal approach; Foley et al., 2017a). In particular, dam removal can lead to rapid mobilization and downstream transport of decades worth of sediment impounded upstream of the dam. While small to moderate sediment pulses from small dam removals mainly affect river geomorphology <5 km downstream, removal of large dams, which can store very large quantities of sediment, can generate large pulses of gravel, sand and mud that travel at least 30 km in the first few years, affecting the geomorphology of downstream coastal wetland habitats if the dam is within reach of the coast (Major et al., 2017; East et al., 2023).
Understanding and predicting both short-term and long-term effects of dam removal on downstream delta and estuary vegetation is important to inform coastal wetland habitat conservation and restoration as well as management practices in preparation for and following dam removal (Foley et al., 2017a). These communities may respond positively to large sediment pulses caused by large dam removal; like major sediment erosion and deposition events associated with large floods, large sediment pulses may create new geomorphic surfaces that can be colonized rapidly by riparian plants adapted to fluvial disturbance, thus maintaining or restoring the shifting habitat mosaic of different-aged stands along riparian corridors (Shafroth et al., 2002; Stanford et al., 2005). However, it is uncertain whether and how riparian vegetation responses might differ in the context of very high sediment loads persisting for months or years during and after large dam removal (Major et al., 2017), compared to much briefer high sediment loads caused by large floods. Such large disturbances could facilitate invasion by weedy, introduced species or otherwise result in novel successional trajectories (Shafroth et al., 2002). Large sediment pulses to watersheds, rivers, river deltas, and coasts also occur episodically as a result of landslides, volcanic eruptions, intensive mining, dam failures, and other major disturbances (Shafroth et al., 2002; Sutherland et al., 2002; Pierson and Major, 2014; Ferguson et al., 2015), but responses of river delta or riverine estuary vegetation to such large sediment-pulse events have rarely, if ever, been examined.
Recent removal of two large dams on the Elwha River, Washington, USA, in 2011–2014, provided an opportunity to examine coastal vegetation responses to a major sediment pulse event during large dam removal. Prior to removal, the Glines Canyon (64-m tall) and Elwha (32-m tall) dams reduced downstream sediment loads by >85% (Curran et al., 2009), capturing and storing ~30 Mt of sediment during the 84 and 98 years that they were in place (Randle et al., 2015). Among many effects on Elwha riverine and riparian ecosystems, reduced downstream sediment loads resulted in substantial and accelerating erosion at the Elwha River delta and adjacent coastline, with shoreline retreat of up to 160 m between 1939 and 2006 (Warrick et al., 2009). Effects of the dams on delta vegetation were not examined prior to dam removal, but shoreline retreat presumably resulted in loss of coastal vegetation. Plant community composition in the delta also may have been altered by the near century of reduced sediment deposition, large wood deposition and hydrochorous seed dispersal, as well as mildly altered streamflows (Shafroth et al., 2016).
Removal of the Glines Canyon and Elwha dams resulted in mobilization and release of 20.5 ± 3.2 Mt of sediment during the first five years (2012–2016), >5× more sediment than the next-largest dam removal in history and ~10× times more than the natural 5-yr sediment load for the Elwha River (Ritchie et al., 2018). This sediment release occurred as the dams were gradually removed in carefully timed phases designed to minimize negative effects of high sediment loads on fish populations (one year for Elwha Dam (2011–2012) and three years for Glines Canyon Dam (2011–2014)) (Randle et al., 2015; Warrick et al., 2015) and as reservoir sediments continued to erode after dam removal was complete (Ritchie et al., 2018). Of the released reservoir sediment, 5.4 ± 1.6Mt (~26%) were deposited in the Elwha River estuary and delta (Ritchie et al., 2018). These deposits were initially largely submarine, but sediment reworking by ocean swell and wind waves created extensive supratidal river mouth bars (Ritchie et al., 2018), increasing the surface area of the delta by ~15 ha by 2014 (Foley et al., 2017b). By 2016, ~1 Mt of sediment had been reworked to intertidal and subaerial positions in the delta (Warrick et al., 2019). These new surfaces were dynamic, with sediment reworking by waves and currents across and along-shore leading to local and seasonal erosion (Ritchie et al., 2018) and to down-shore sediment waves as new river mouth bars welded to the shoreline (Warrick et al., 2019).
Rapid, large-scale, and dynamic sediment deposition in the Elwha River estuary and delta (hereafter, the delta) has likely provided opportunities for extensive establishment of new coastal wetland habitats on the primary successional landforms of the expanded delta. Smaller sediment pulses and sediment trapping structures have led to rapid establishment and expansion of estuarine vegetation in other river deltas (Elsey-Quirk et al., 2019; Hu et al., 2019; Fivash et al., 2021). In the Elwha River delta, vegetation was already beginning to colonize some new landforms by the time dam removal was complete in 2014 (Foley et al., 2017b). However, information is lacking on the persistence, abundance, and composition of vegetation on these new surfaces, likely successional trajectories, whether these communities are at higher risk of invasion by introduced species, and how spatial variation in environmental conditions might influence these outcomes.
In addition, sediment deposition in the delta may have affected habitat structure and composition of plant communities that existed prior to dam removal. Prior to dam removal, the delta contained a patchy mosaic of riparian community types, including dunegrass communities at high topographic positions on beach berms, emergent marsh in narrow bands along tidally influenced margins of estuarine ponds, riparian shrub communities at intermediate positions along topographic gradients between emergent marsh and forest communities or interspersed within forest communities, young, dense willow–alder forest on gravel bars typically near the active river channel, extensive mixed riparian forest, including large trees, on older landforms, and less common mixed pioneer vegetation on frequently disturbed surfaces adjacent to the main channel and beach (Shafroth et al., 2011; Foley et al., 2017b). High sediment deposition and mobility may have influenced species composition of these established communities. Sediment deposition (e.g., during floods) can alter riparian community composition, particularly affecting herbaceous species and young woody plants (Lowe et al., 2010; Kui and Stella, 2016; Gonzalez et al., 2020). Upstream on the Elwha River, sediment deposition during and after dam removal altered species composition on bars, floodplains, and terraces between and below the former dams (Brown et al., 2022). In the delta, composition of established plant communities remained fairly stable during dam removal, with no significant change in species richness or community composition except for an increase in the invasive grass Phalaris arundinacea (reed canarygrass) and decrease in Argentina egedii (Pacific silverweed) in some emergent marsh plots (Foley et al., 2017b). However, longer-term responses to ongoing sediment deposition are possible, especially for species sensitive to burial or changes in tidal inundation and salinity (Shafroth et al., 2002).
In this study, we used time series of aerial imagery, digital elevation models (DEMs) derived from field topography surveys, and vegetation plot sampling to examine plant community development and change in the Elwha River delta in the first seven years during and after dam removal (2011–2018). Our overarching objective was to quantify and understand effects of large dam removal on abundance and composition of coastal wetland habitat. Specifically, for new delta surfaces that were created by sediment deposition during and after dam removal, we asked: (1) Which landscape positions and elevational histories supported vegetation establishment and persistence on new surfaces? (2) How did vegetation composition on new surfaces compare to delta plant communities that existed prior to dam removal? (3) How did vegetation on new surfaces change as surfaces aged? and (4) How did environmental conditions (i.e., elevation, soil depth and particle size) affect species and functional group composition? In addition, for delta plant communities that existed prior to dam removal, we asked: (5) Were there temporal changes in species and functional group composition that could be attributed to effects of dam removal? Finally, for both new and previously established vegetation, we asked (6) Did dam removal facilitate invasion by introduced species in the delta?
2 Materials and methods
2.1 Study area
The Elwha River flows northward 72 km from the Olympic Mountains to the Strait of Juan de Fuca on the Olympic Peninsula, Washington, USA (Figures 1, S1). Most (83%) of its 833 km2 watershed is located within Olympic National Park, which is largely undeveloped. The Elwha River mouth is ~10 km west of the town of Port Angeles, which receives mean annual precipitation of 0.64 m and has mean maximum summer temperatures of 19.9°C (July–August) and mean minimum winter temperatures of 1.2–1.9°C (December–February) (Western Regional Climate Center, https://wrcc.dri.edu/, accessed October 6, 2022). Mean annual flow is 43 m3 s−1 based on 104 years of discharge data at USGS streamflow gage 12045500, 13.8 km upstream from the river mouth (USGS, 2023). Peak flows occur during both winter rainfall and spring snowmelt. Annual exceedance probabilities of peak discharge prior to dam removal indicated 2-year floods of 400 m3 s−1, 25-year floods of 948 m3 s−1, and 100-year floods of 1,240 m3 s−1 (Duda et al., 2011). The dams probably attenuated peak flows, so these values were predicted to increase by 10–15% after dam removal (Duda et al., 2011).
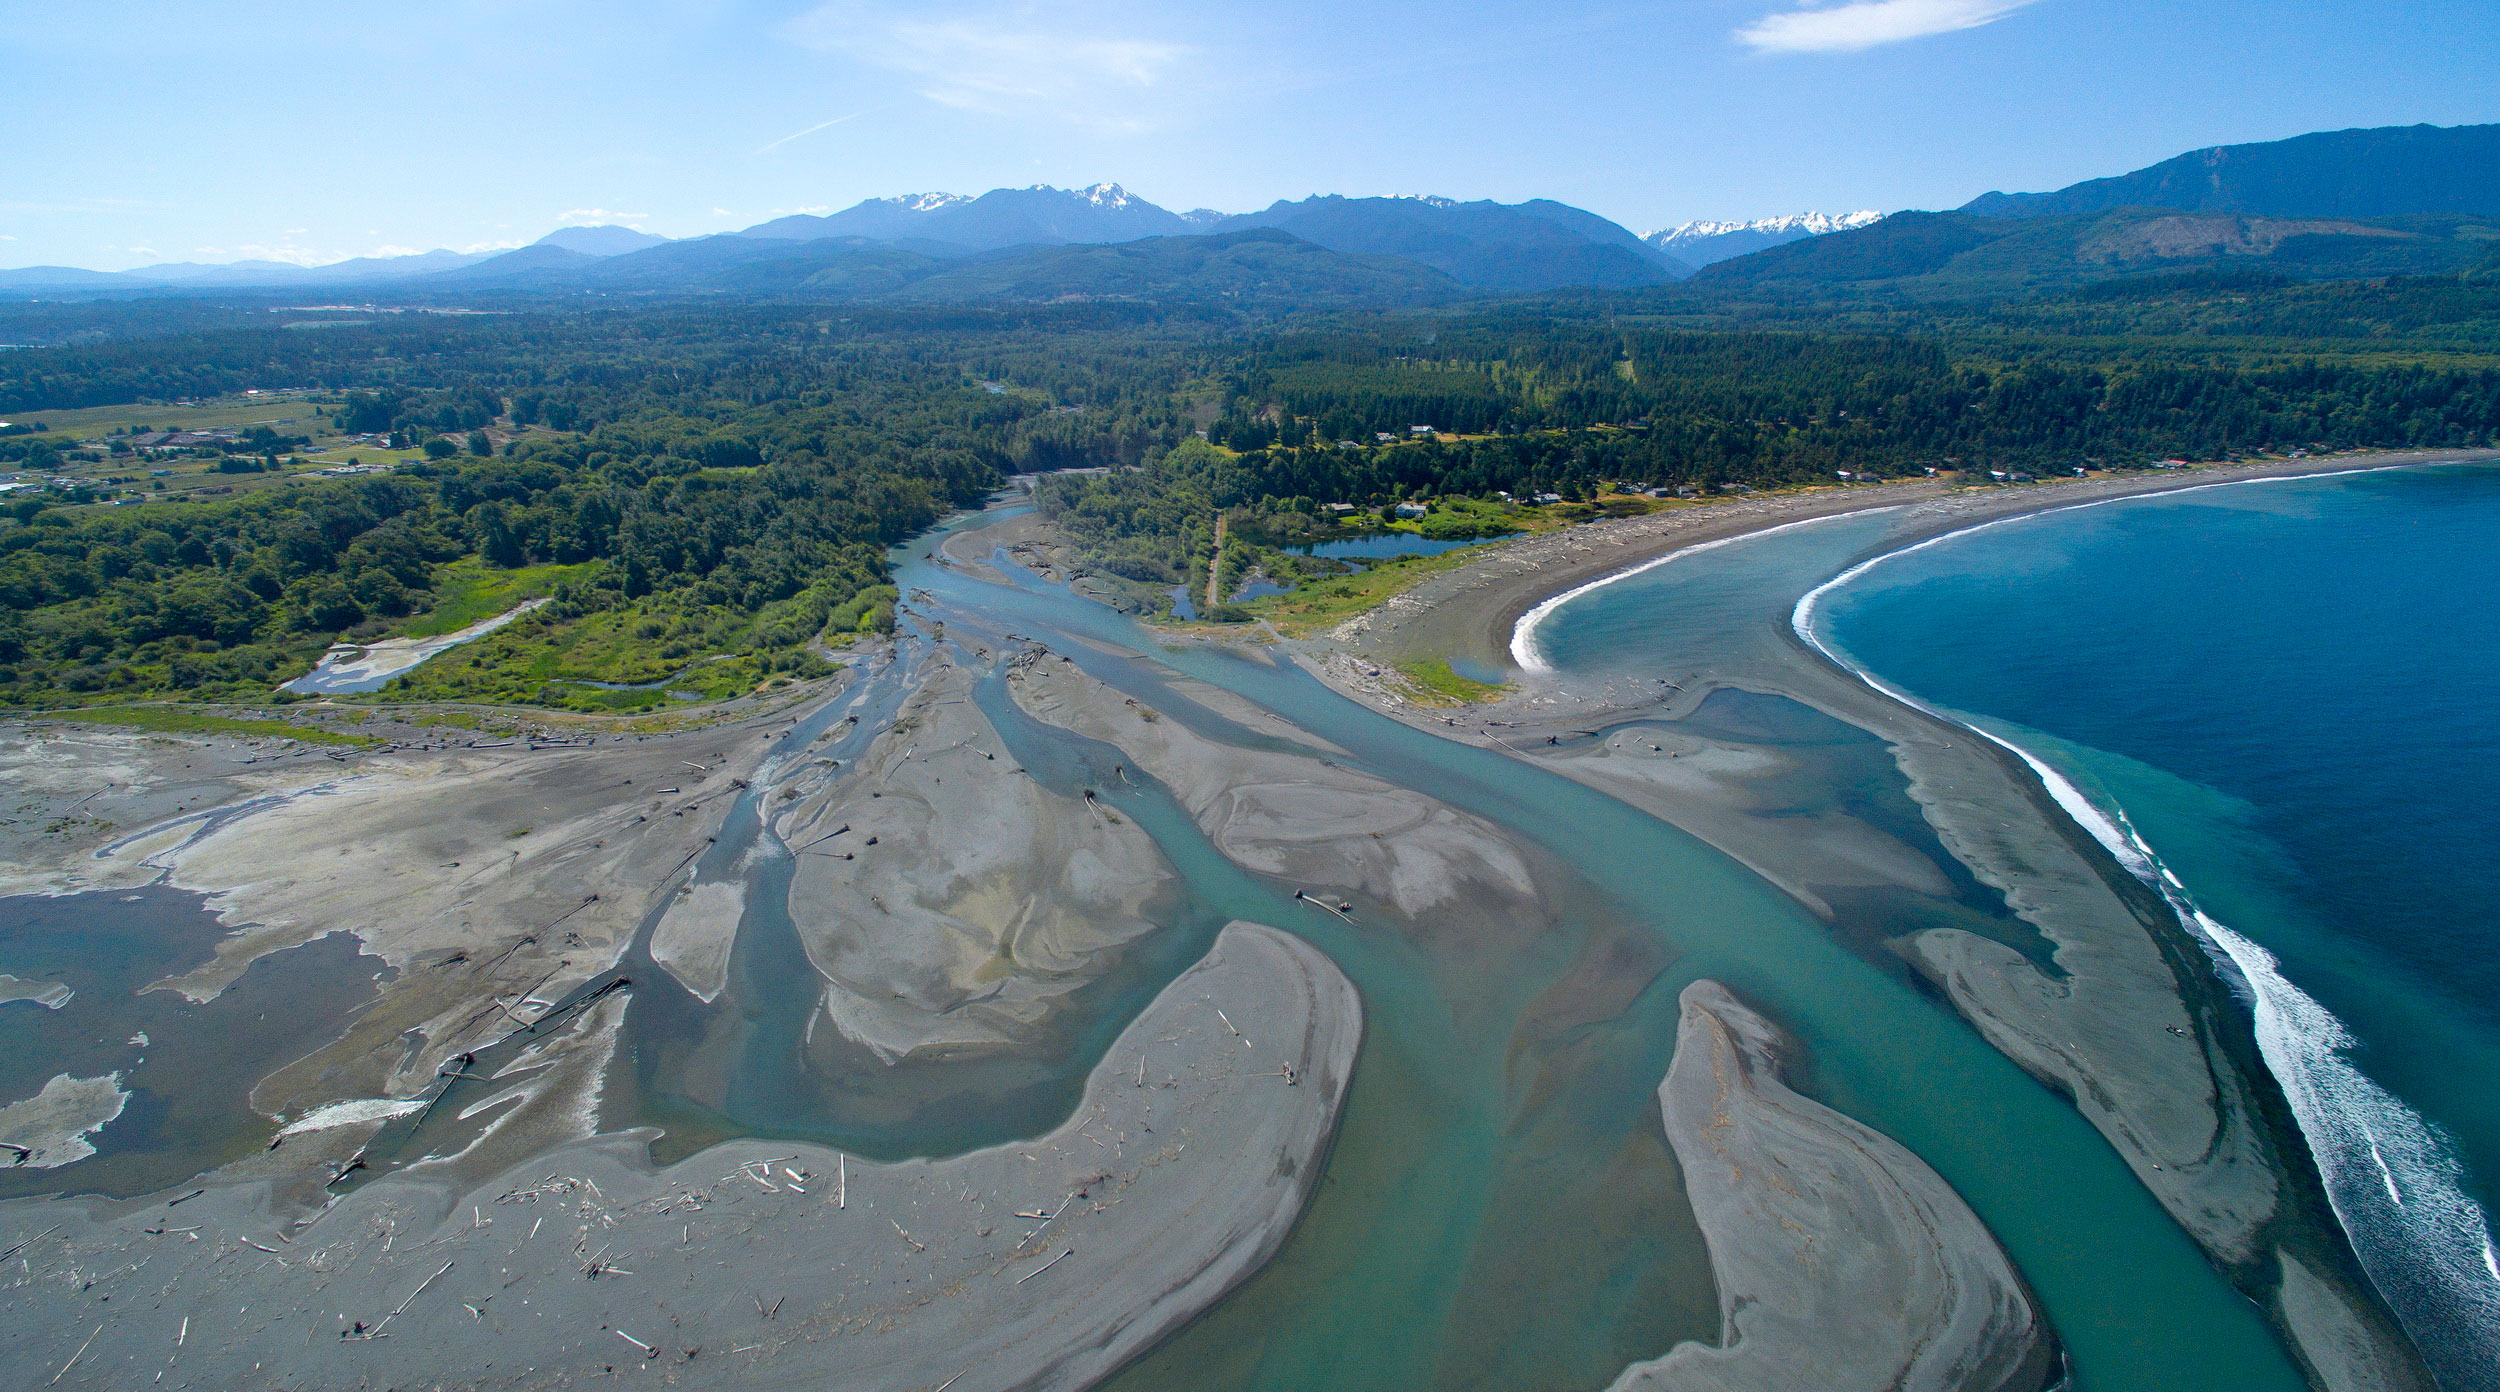
Figure 1 Oblique aerial image of the Elwha River delta (U.S. state of Washington) taken May 30, 2016, ~20 months after removal of two dams on the Elwha River was completed. Image by John Gussman.
2.2 Aerial imagery
In previous work to assess changes to the Elwha River delta during dam removal, annual maps of geomorphic and vegetative cover types were developed for 2011–2014 using a combination of summer ortho-referenced, high-resolution aerial imagery and topographic data (Foley et al., 2017b). To evaluate ongoing change after dam removal, we developed maps for 2016 and 2018 following the same protocols, using aerial imagery (RGB) collected on 11 August 2016 and 19 July 2018 (imagery and metadata available in Perry et al., 2023) coupled with 1-m2 resolution DEMs derived from topography and bathymetry field surveys conducted on 15–17 July 2016 and 23–26 July 2018 (Stevens et al., 2017). Habitat cover types included four geomorphic classes (beach, river bar, river mouth bar, aquatic), six vegetation cover types (mixed pioneer vegetation, dunegrass, emergent marsh, riparian shrub, willow–alder forest, mixed riparian forest), and a human-developed landscape class (roads and residential). The geomorphic classes were further subdivided by elevation into subtidal (below mean lower low water, MLLW), intertidal (between MLLW and mean higher high water, MHHW), and supratidal (above MHHW) subclasses, using the local coastal water datum from the NOAA tidal station at Port Angeles, Washington (NOAA Station ID 9444090). Starting from the 2014 map from Foley et al. (2017b), we used heads up digitizing to adjust polygon boundaries where existing patches changed in size and to delineate new polygons where new surfaces had formed. All work was done in ArcGIS (version 10.3), Esri, Redlands, California, USA with imagery zoomed to 1:1,500. Minimum polygon size was 100 m2 for geomorphic and vegetation classes and 40 m2 for elevational subdivisions of the geomorphic classes. We used field observations of estuary vegetation in summer 2016, 2017, 2018, and 2020 to verify and inform vegetation classifications, particularly in areas that appeared to have changed since 2014. This approach overlooked small patches and likely included location errors of up to a few meters in the boundaries between patches but provided a broad-scale view of the abundance of different habitat types over time.
To assess the timing and magnitude of habitat change, we summed polygon areas by habitat type within each image-year. Further, to characterize new habitat created by sediment deposition during and after dam removal, we summed 2018 polygon areas by habitat type for areas that were unvegetated prior to dam removal in 2011. In addition, we calculated mean annual elevation (m above MHHW) and mean annual change in elevation from 2011–2018 in vegetated versus unvegetated portions of the new habitat, using 1-m2 resolution, annual DEMs derived from surveys of the delta in August 2011, August 2012, September 2013, September 2014, July 2015, July 2016, July 2017, and July 2018 (Stevens et al., 2017). Finally, to characterize predominant vegetation colonization and successional trajectories, we overlapped vegetation cover polygons from all years across the entire study area, and summed areas for each unique temporal sequence of vegetation cover types.
2.3 Vegetation plots
We sampled forty vegetation plots in the Elwha River delta for plant community composition, soil depth, and soil surface particle size distribution (Figure S2). Twenty-one of these plots were originally sampled in August 2007 as a stratified random sample of predominant vegetation types in the delta prior to dam removal, including dunegrass (3 plots), emergent marsh (5 plots), riparian shrub (5 plots), willow–alder forest (3 plots), and mixed riparian forest (5 plots) (Shafroth et al., 2011; Foley et al., 2017b). We resampled all 21 of these plots in August 2014, and 18 again in August–September 2018; two plots (emergent marsh, mixed riparian forest) were subsumed by the channel between 2014 and 2018, and data were lost for a third (mixed riparian forest). We added 12 new plots in 2014, mainly to sample vegetation on new surfaces that developed during dam removal (9 plots), but also to sample mixed pioneer vegetation that existed prior to dam removal (2 plots) and to add one new willow–alder forest sample (1 plot). We resampled 11 of these plots in 2018; one plot (new-surface vegetation) was subsumed by the channel. Finally, we added seven plots in 2018 to sample vegetation on new surfaces that developed after dam removal. Thus, sample size varied among years, but total N=16 new-surface vegetation, 2 mixed pioneer, 3 dunegrass, 5 emergent marsh, 5 riparian shrub, 4 willow–alder forest, and 5 mixed riparian forest plots.
All plots were 100 m2. Two-thirds of plots were 10 × 10 m, while plots in narrow vegetation patches were 5 × 20 m or rarely 4 × 25 m. In each plot, we visually estimated cover by each vascular plant species within ten classes (trace, 0–1%, 1–2%, 2–5%, 5–10%, 10–25%, 25–50%, 50–75%, 75–95%, >95%). We obtained information on species functional group (woody, forb, graminoid, perennial, annual/biennial, native, introduced) and wetland indicator value from the U.S. Department of Agriculture plants database (https://plants.usda.gov) (Table S1). For each plot in each year, we summed species richness and cover (midpoints of cover classes) by functional group and calculated a community-weighted mean wetland indicator value, weighted by the proportion of total plot cover occupied by each species (lower values indicate greater wetland adaptation).
We determined plot mean soil depth by measuring depth to refusal (rock or wood) at each plot corner using a 119-cm soil probe. We characterized the soil surface particle size distribution by calculating percent gravel/cobble (2–256 cm diameter) from Wolman pebble counts at 100 random points within each plot (Wolman, 1954). We surveyed elevations of dunegrass, emergent marsh, and riparian shrub plots in August 2007, 2014, and 2018 with a Magellan ProMark 3 Differential Global Positioning System in Real-Time Kinematic mode (RTK-DGPS) mounted on a survey pole, receiving corrections from a base station on a permanent survey monument (estimated systematic + random error = ± 10 cm). For new-surface vegetation plots, we calculated annual mean plot elevations from 1-m2 resolution, annual DEMs derived from surveys of the delta in September 2010, August 2011, August 2012, September 2013, September 2014, July 2015, July 2016, July 2017, and July 2018 (Stevens et al., 2017). We adjusted all elevation data to units of m above MHHW using the local coastal water datum from the NOAA tidal station at Port Angeles, Washington (NOAA Station ID 9444090).
All data generated in this study are available in a U.S. Geological Survey data release (Perry et al., 2023).
2.4 Statistical analysis
We conducted all statistical analyses using R 4.1.0 (R-Core-Team, 2021). To evaluate effects of sediment dynamics and elevation on vegetation colonization of new delta surfaces created during dam removal, we took a stratified random sample of 326 points across polygons that had been unvegetated in 2011, with 88 points in polygons that were vegetated in 2018 and 238 points in polygons that remained unvegetated in 2018 (in proportion to 11.2 ha of vegetated polygons and 29.5 ha of unvegetated polygons). We restricted point selection to a 15-m minimum distance between points, resulting in a maximum of 326 points across polygons. Smaller minimum distances led to significant spatial autocorrelation, assessed using testSpatialAutocorrelation in the DHARMa package (Hartig, 2021). We developed logistic regression models of 2018 vegetation occurrence as a function of 2018 surface age (i.e., time since surface stabilization), 2018 elevation (m above MHHW), and distance to the nearest 2018 subtidal aquatic shoreline polygon (hereafter, distance to shoreline), using glm in the lme4 package with a binomial distribution and logit link (Bates et al., 2015). We defined surface age as the number of years since net annual erosion or deposition slowed to a threshold rate that colonizing vegetation could potentially tolerate. To select the most informative threshold for this purpose, we used Akaike information-theoretic criteria adjusted for small sample size (AICc) to compare models with surface age defined by thresholds of 10, 15, 20, 25, 30, 35, 40, 45, or 50 cm of net annual erosion or deposition (i.e., 9 models).
For vegetation plots, we evaluated variation in species composition using non-metric multi-dimensional scaling (NMDS) ordinations of species cover (sqrt-transformed midpoints of cover classes) across all plots in all sampling years (N=90), computed using metaMDS in the vegan package (Oksanen et al., 2020) with Bray-Curtis distances, try=250, and trymax=500. We grouped species by genus for species that were rare or could not be distinguished with certainty, and excluded genera that were present in <5% of samples (i.e., <5 plot-years) (Table S1). We used envfit to compute vectors for correlations between the ordination and functional group composition.
To examine temporal trends and differences among community types in species and functional group composition in vegetation plots, we performed three sets of analyses using generalized linear models (GLMs), PERMANOVA, and SIMPER. For most GLMs, we used lmer in the lme4 package with a Gaussian distribution (Bates et al., 2015), but for response variables with zero-inflation and/or significant heteroscedasticity, we used the glmmTMB package with a nbinom1 or nbinom2 distribution and log link (Brooks et al., 2017). For PERMANOVA and SIMPER analyses, we used adonis and simper with Bray-Curtis distances in the vegan package (Oksanen et al., 2020).
In the first set of analyses, we examined differences between community composition in new-surface vegetation plots versus other delta community types that existed prior to dam removal (mixed pioneer, dunegrass, emergent march, riparian shrub, willow–alder forest, mixed riparian forest). We used PERMANOVA to compare species composition between new-surface vegetation versus other delta community types (effects: community type, year), and used pairwise SIMPER analyses to characterize significant differences between community types. Further, we used GLMs to compare functional group species richness and cover and NMDS ordination scores among community types, with community type included as a fixed effect and year and plot nested within community type as random effects. We performed post-hoc, pairwise comparisons between new-surface vegetation and other community types using “trt.vs.ctrl” in the emmeans package (Lenth, 2021).
In the second set of analyses, we examined plant community development on new surfaces created during dam removal. We used PERMANOVA to analyze change in species composition between 2014 and 2018 in new-surface vegetation plots (effects: year, plot), and used SIMPER analyses to characterize significant differences in species composition between years. Further, we examined relationships between new-surface vegetation development and new-surface edaphic conditions using Akaike information-theoretic model selection. We developed GLMs of functional group species richness and cover and NMDS ordination scores in new-surface vegetation plots in 2014 and 2018 as functions of surface age (i.e., years since surface stabilization), mean annual elevation since surface stabilization (m above MHHW), soil depth (cm), and soil surface gravel/cobble (log-transformed %), with plot included in all models as a random effect. We defined the timing of surface stabilization a priori as the year when net annual erosion or deposition slowed to <25 cm yr−1, a rate that we expected colonizing vegetation could potentially survive. This choice was subsequently supported by the logistic regression results for vegetation occurrence on new surfaces on aerial imagery (see statistical analysis methods above and aerial imagery results). Annual elevation data were unavailable for two new-surface vegetation plots located inland of the pre-dam-removal beach, so these plots were excluded from this analysis, resulting in N=22. To avoid overfitting, we evaluated support only for univariate and bivariate models, resulting in 11 models including the null model. To avoid discussing poorly supported models, we did not consider results for vegetation metrics with ΔAICc<4.0 for the null model relative to the best model.
In the third set of analyses, we examined temporal change in community composition during and after dam removal within established plant communities that were sampled both before and after dam removal (dunegrass, emergent march, riparian shrub, willow–alder forest, mixed riparian forest). For each community type, we used PERMANOVA to compare species composition among sampling years (2007, 2014, 2018) (effects: year, plot), and used pairwise SIMPER analyses to characterize significant differences between years. Further, we used GLMs to compare functional group species richness and cover and NMDS ordination scores among years, with year, community type and year × type included as fixed effects and plot nested within type as a random effect. To avoid confounding temporal change in community composition with change in sample size and plot identity, we included only plots that were sampled in all three years in these analyses (N=18).
3 Results
3.1 Aerial imagery
3.1.1 Expansion of the delta following dam removal
During dam removal, supratidal river bars, supratidal river mouth bars, supratidal beach, and intertidal aquatic habitats in the Elwha River delta increased dramatically, with a net increase of 24.6 ha of delta habitat between 2011 and 2014 (Figures 2, 3A; Foley et al., 2017b). Supratidal river bar, river mouth bar, and beach habitats continued to grow between 2014 and 2016, adding another 6.8 ha (Figures 2, 3B). In addition, ~5 ha of intertidal beach and aquatic habitats increased in elevation to supratidal positions during those years. However, between 2016 and 2018, these trends slowed or reversed; total delta habitat declined by 4.5 ha (14% of the new habitat created since 2011; Figure 3A), mainly reflecting losses of supratidal river mouth bars, intertidal beach, and intertidal aquatic habitat (Figure 3B) as coastal erosion and sediment reworking pushed the outermost new river mouth bars inland towards the pre-dam-removal shoreline (Figure 2).
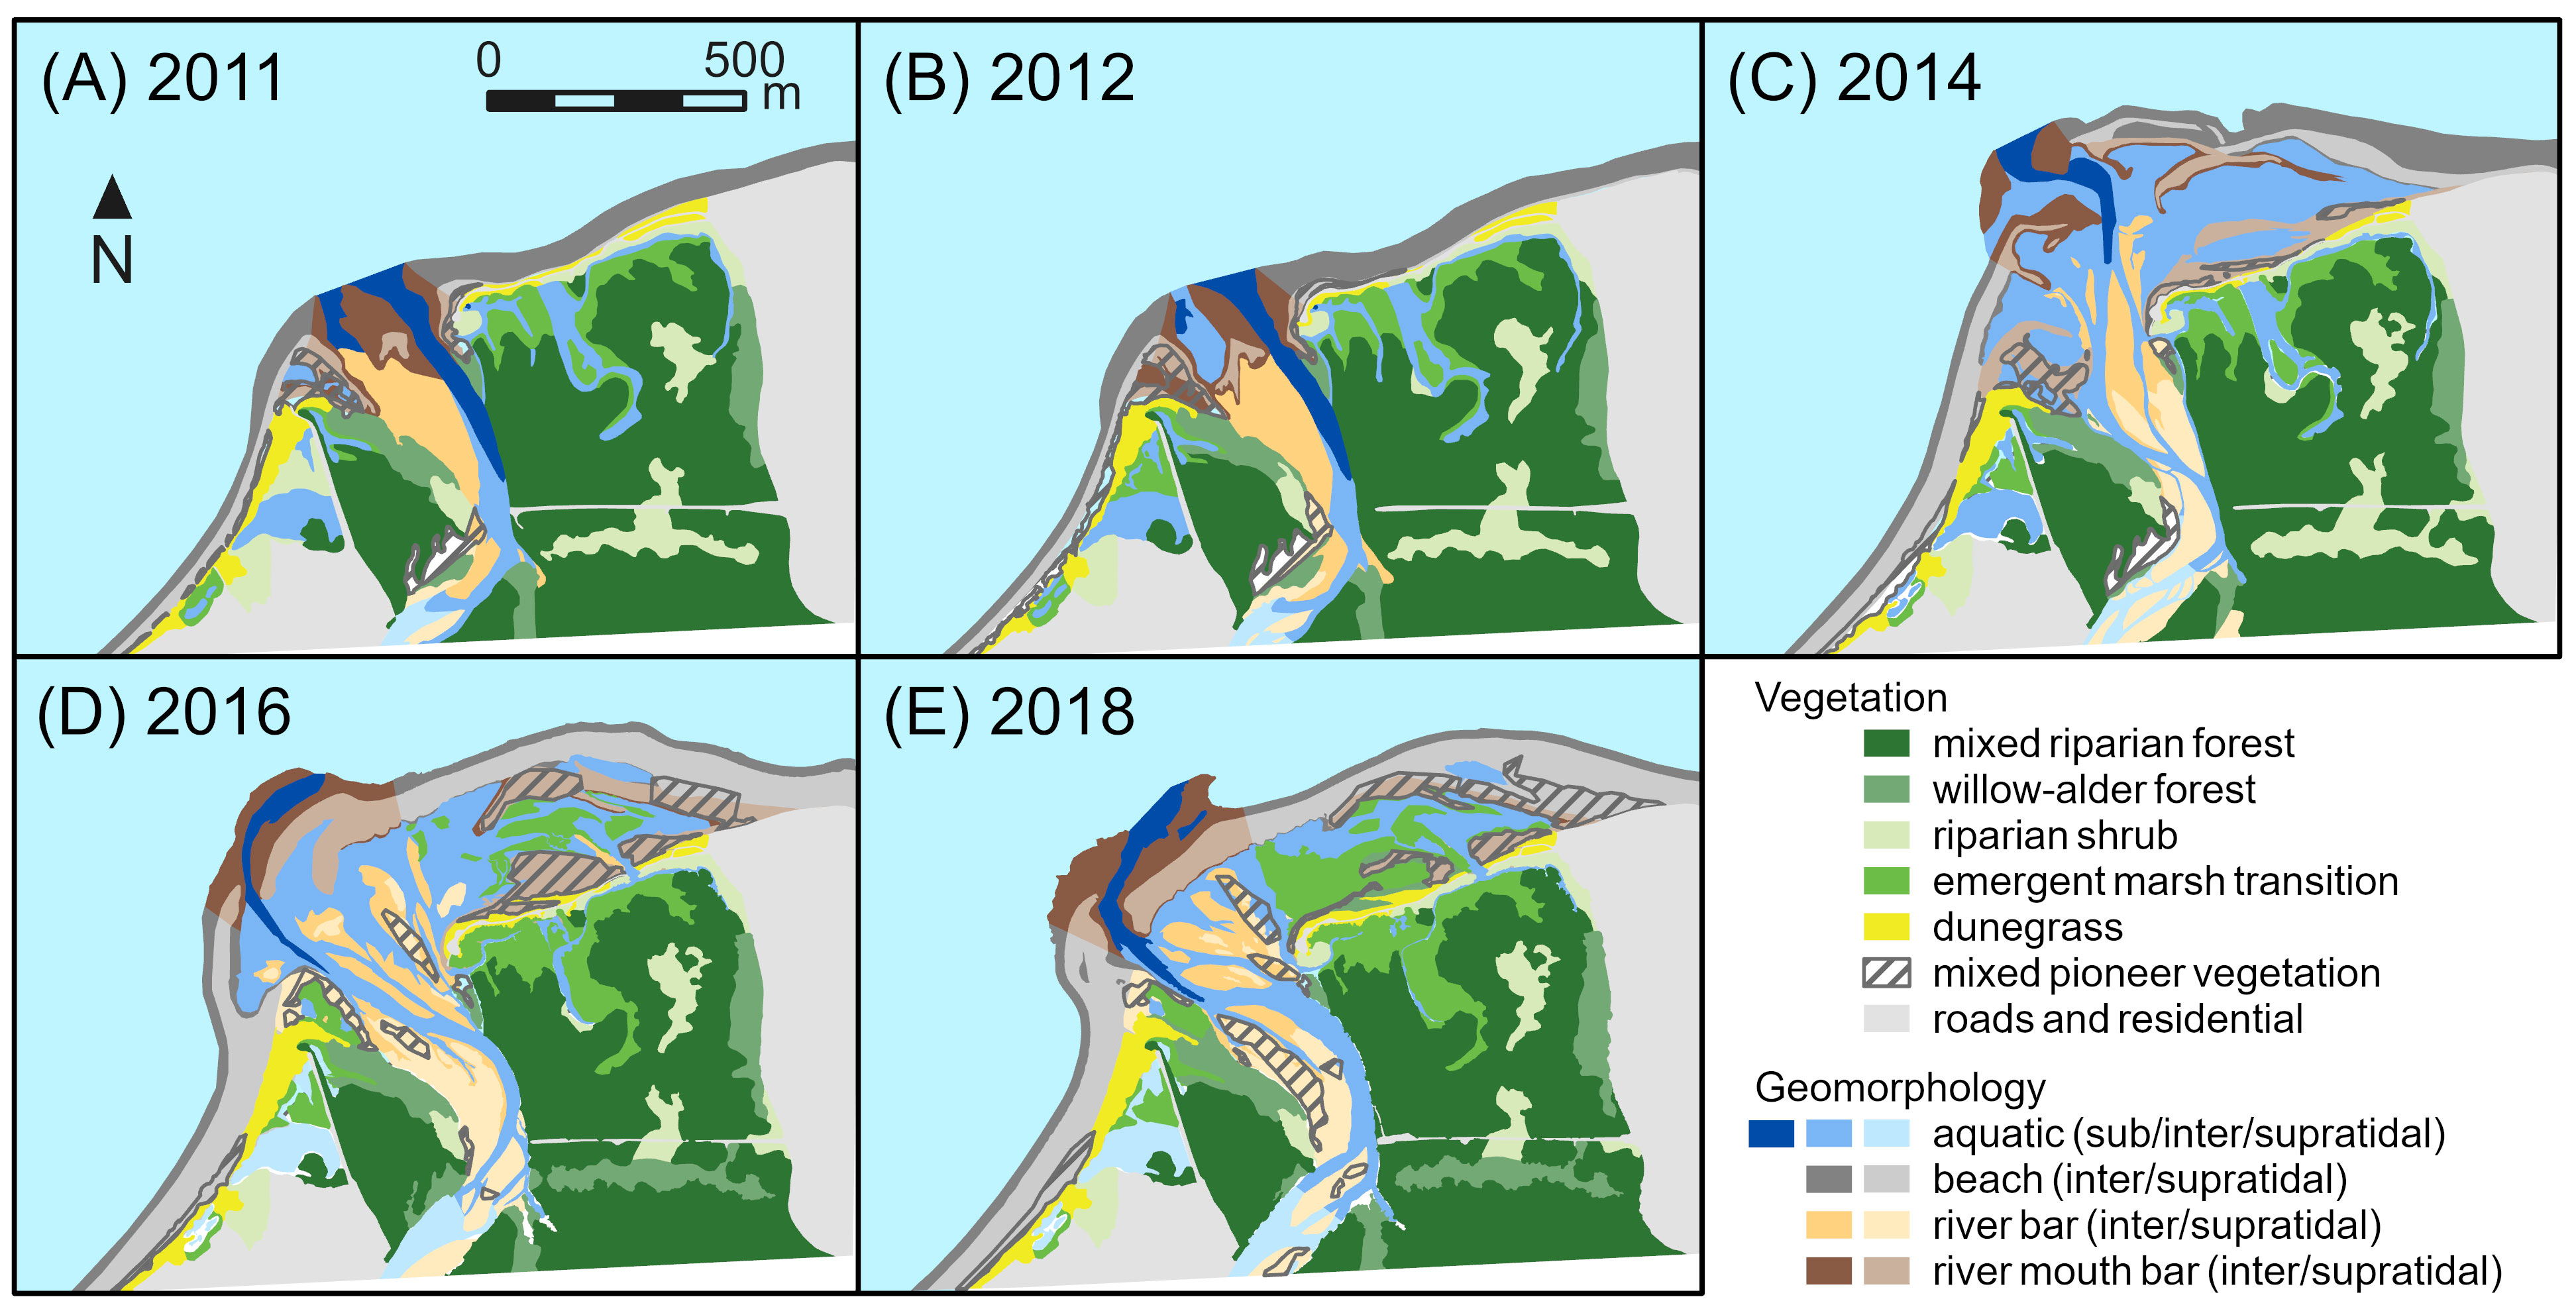
Figure 2 Changes in geomorphic and vegetation habitat types classified using aerial imagery from (A) 2011, (B) 2012, (C) 2014, (D) 2016, and (E) 2018 for the Elwha River delta (U.S. state of Washington). Removal of two dams on the Elwha River began in 2011 and was completed in 2014.
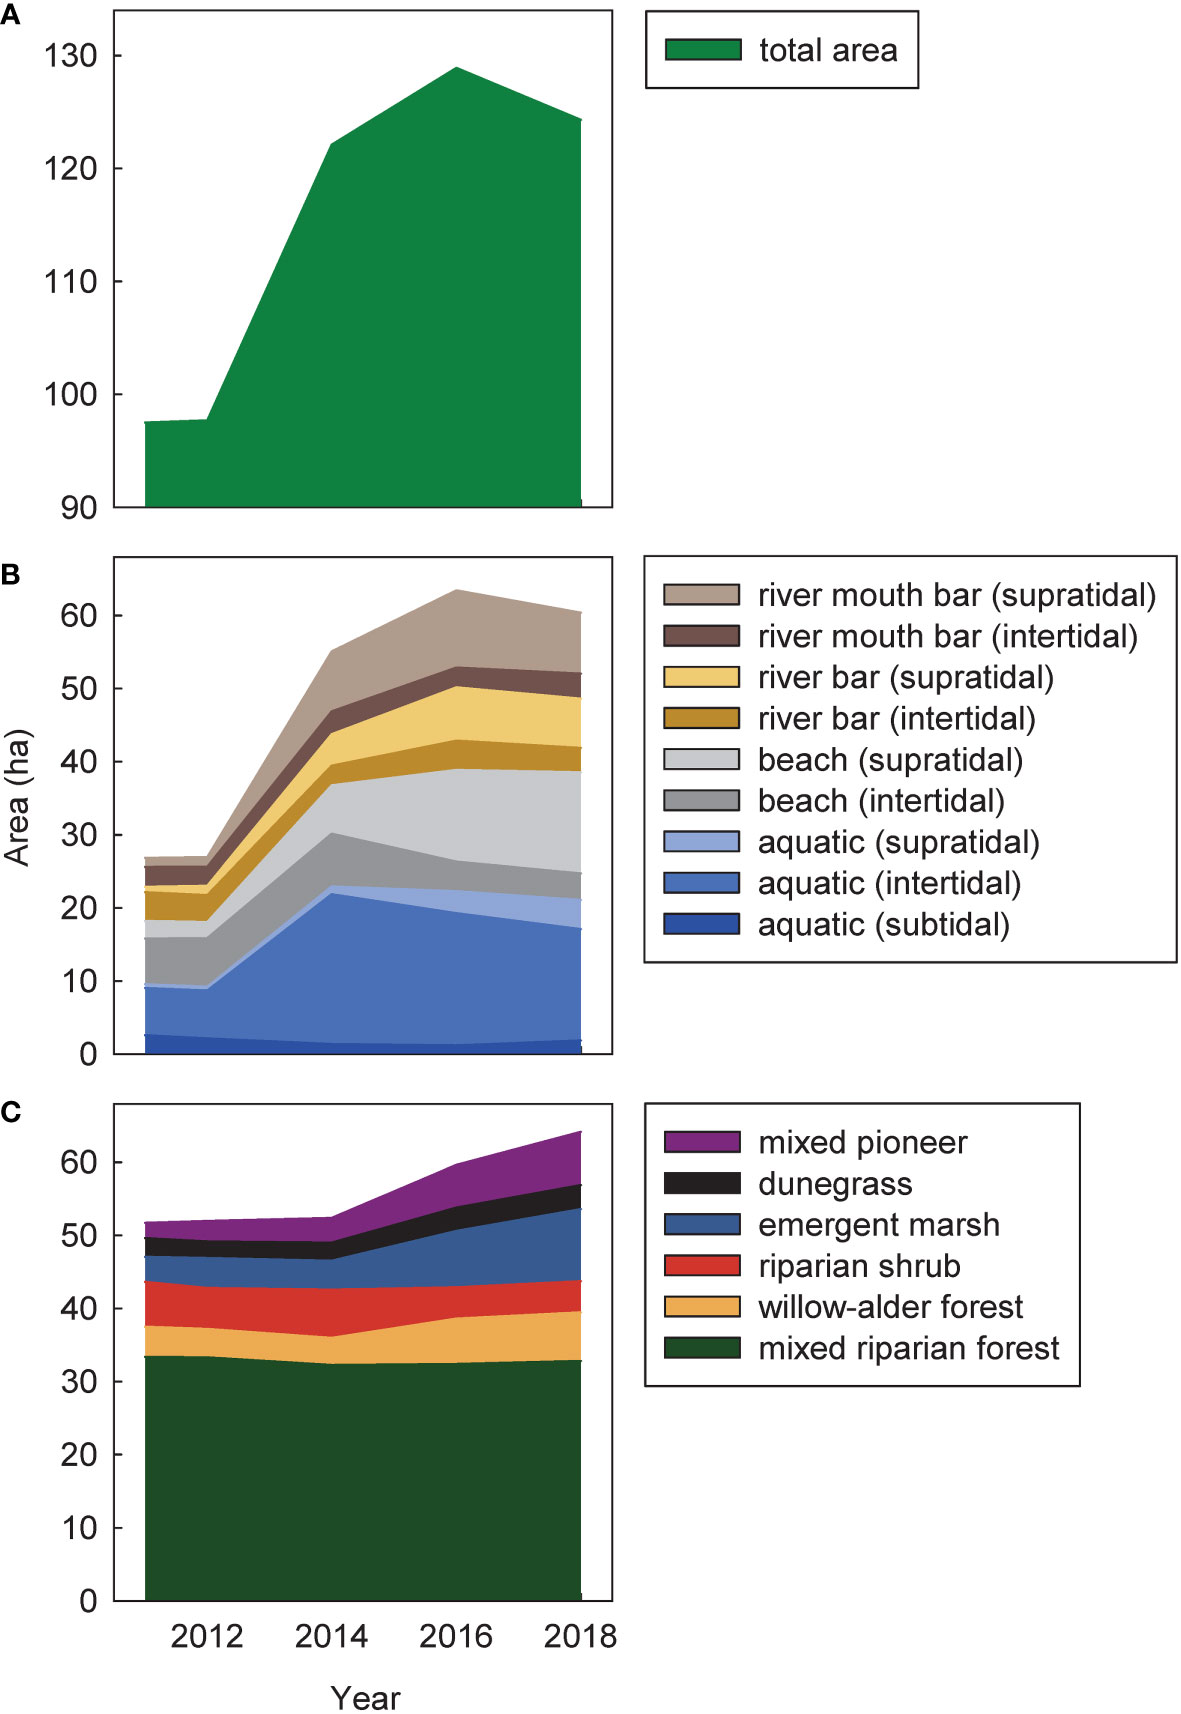
Figure 3 Temporal changes during (2011–2014) and after (2014–2018) dam removal in total cover of (A) all intertidal and supratidal surfaces, (B) geomorphic habitat types, and (C) vegetation habitat types in the Elwha River delta (U.S. state of Washington). Cover was estimated from polygons derived from aerial imagery. Areas in (B, C) overlapped where mapped geomorphic habitat types were vegetated. The total area in (A) accounted for those overlapping areas, but still was higher than the sum of the areas in (B, C) because it included areas with the human-developed landscape class, which changed minimally over time and were not depicted in (B) or (C).
3.1.2 Vegetation colonization of new surfaces created by dam removal
Between 2011 and 2018, a total of 16.4 ha of the delta that had been unvegetated prior to dam removal were colonized by vegetation (Figure 4). Of these 16.4 ha of new-surface vegetation, 58% (9.5 ha) were initially colonized by new-surface mixed pioneer vegetation, i.e., areas identified as early-successional communities too young and undeveloped to be defined as a particular established community type. Another 37% (6.1 ha) were initially colonized by new-surface early-successional emergent marsh vegetation. The remaining 5% (0.8 ha) were initially colonized by mixed riparian forest, willow–alder forest, riparian shrub or dunegrass communities. As these later-successional community types could not have developed within the 1–2 years between aerial images, recorded change in these 0.8 ha likely reflected either expansion of established plant canopies over adjacent bare ground or open water, or error due to small differences between years in aerial imagery analysis at the edges of established communities.
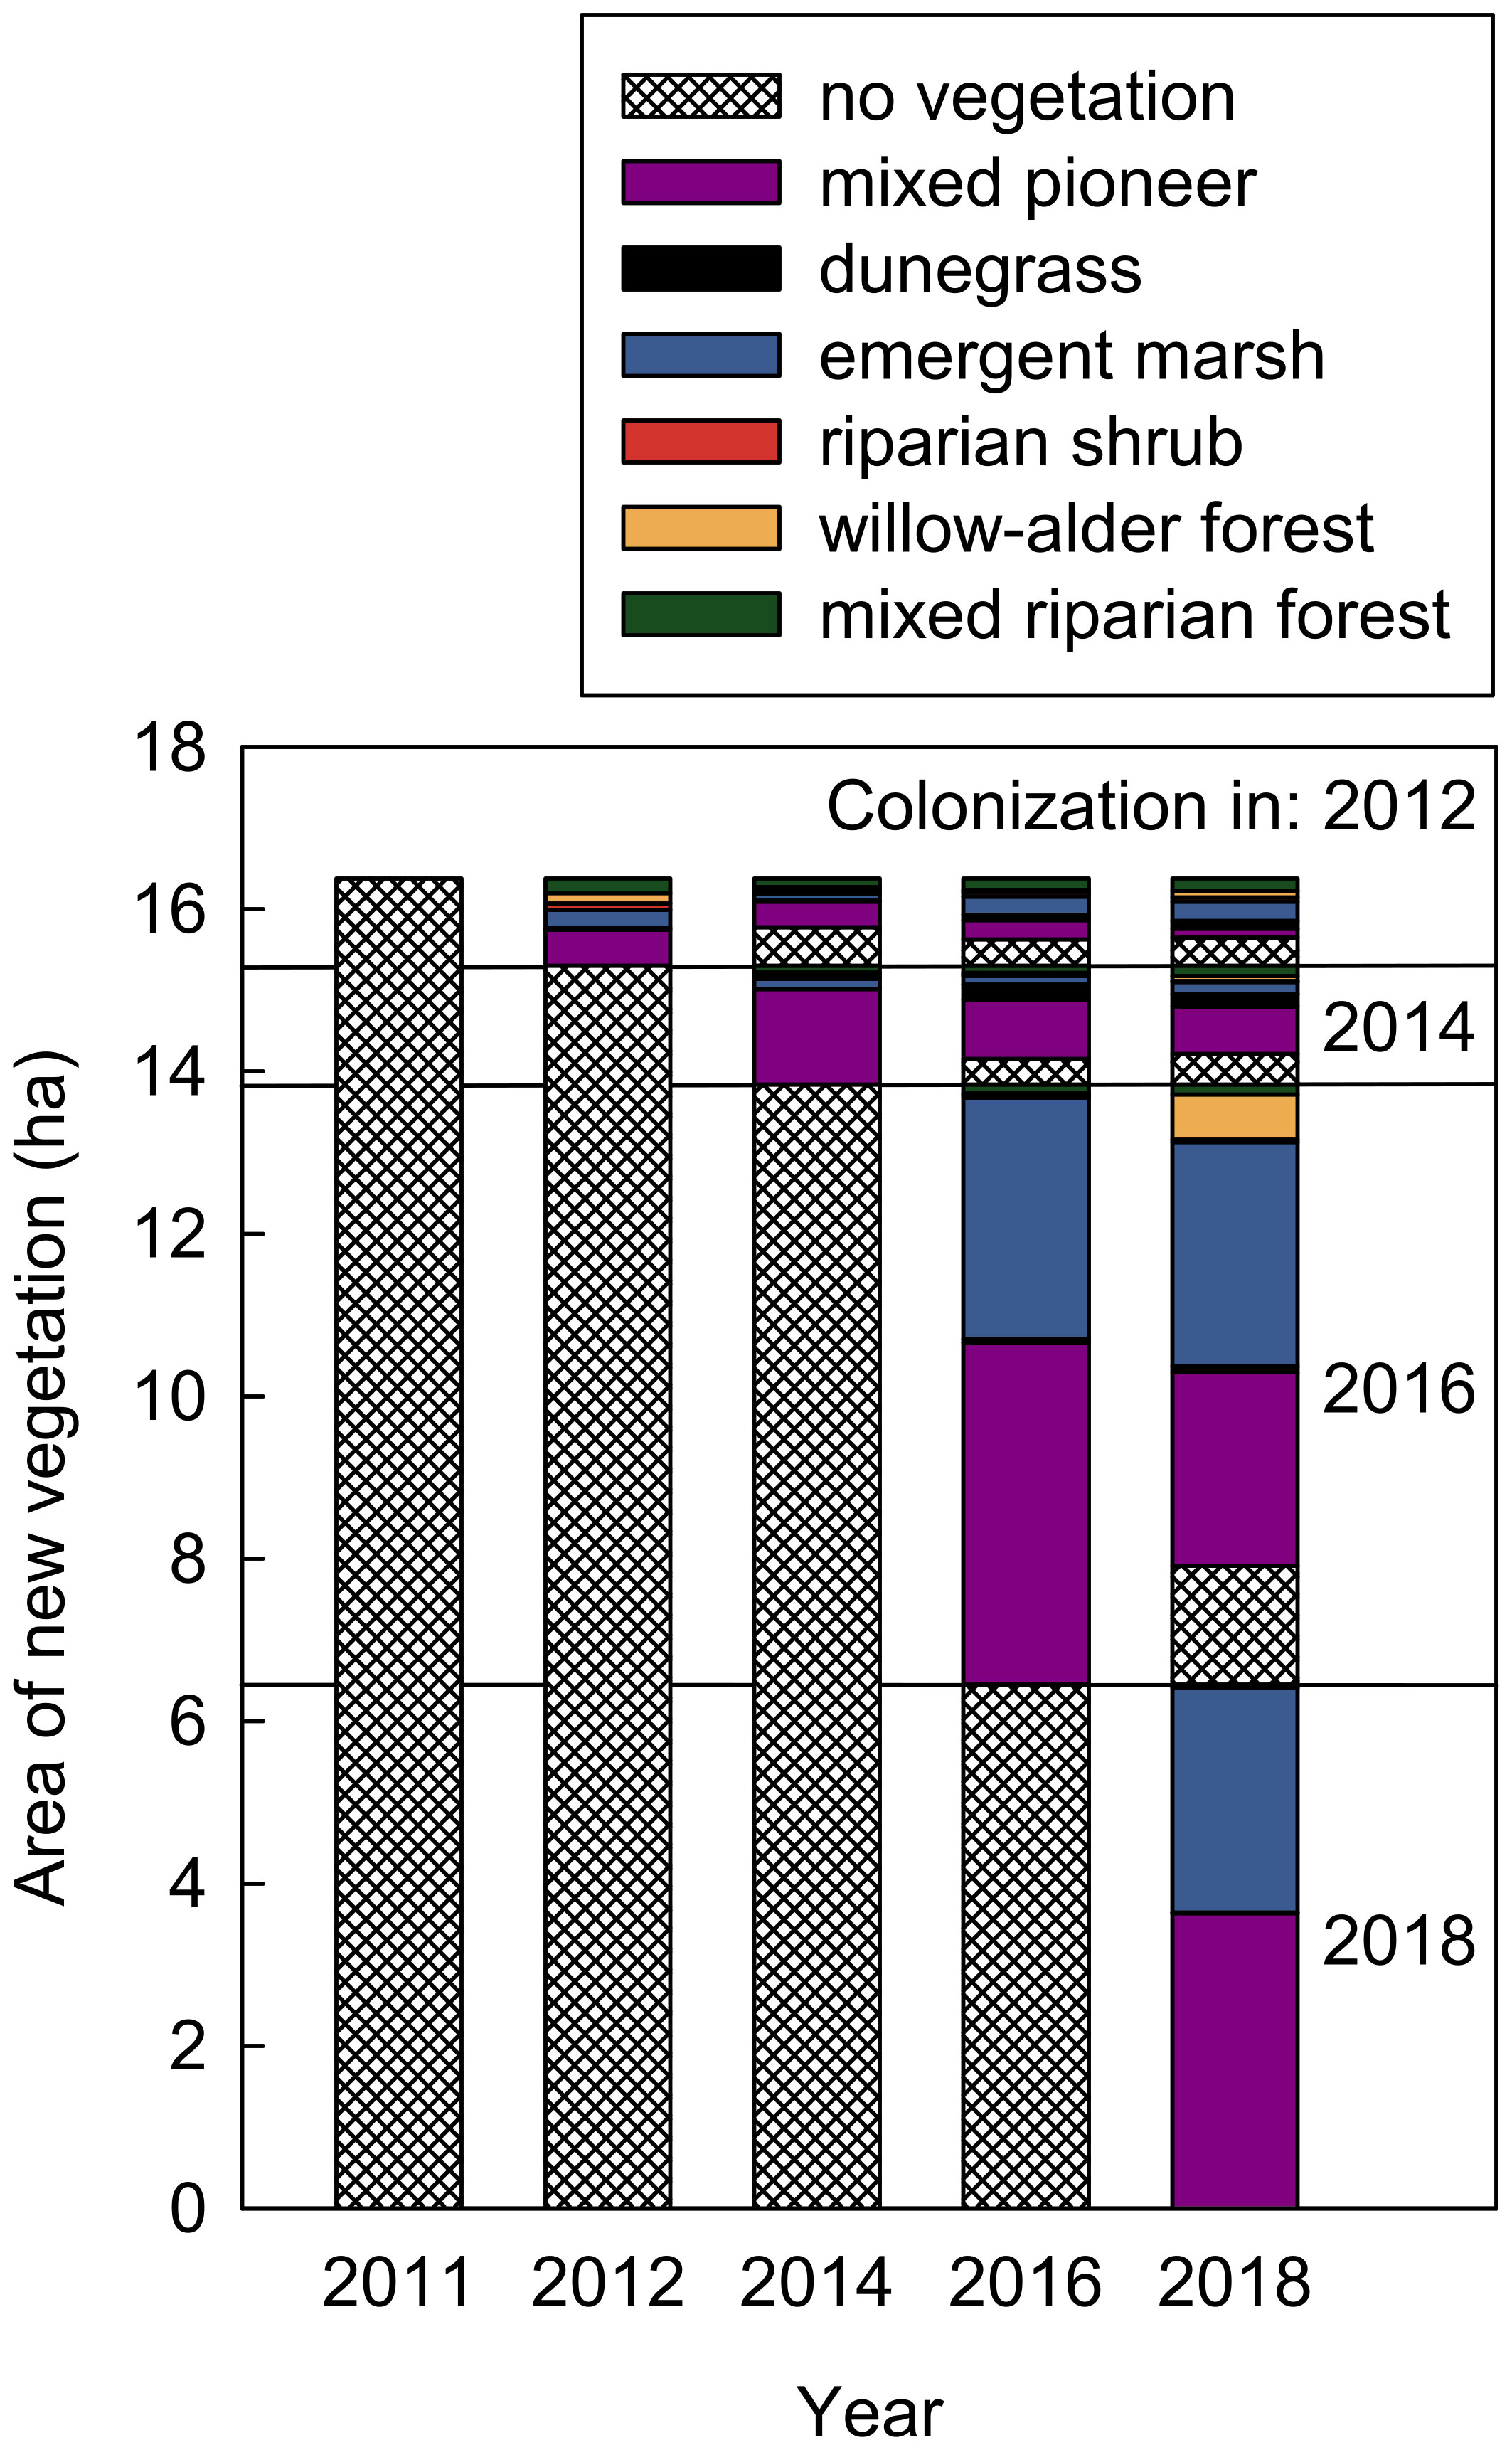
Figure 4 Colonization of new and previously unvegetated geomorphic surfaces during (2011–2014) and after (2014–2018) dam removal by different plant community types in the Elwha River delta (U.S. state of Washington). Vertical subsections of the stacked bars show community types for surfaces colonized in 2011–2012 (top), 2013–2014, 2015–2016, and 2017–2018 (bottom), including abundances of different community types in the first year of colonization and changes in those abundances in subsequent years. Cover was estimated by overlapping polygons derived from aerial imagery from different years.
Most new vegetation established after 2014 (83% of new-surface mixed pioneer vegetation and 94% of new-surface emergent marsh; Figure 4). Also, much of the new vegetation persisted through 2018. Of new-surface mixed pioneer vegetation and emergent marsh that established in 2012–2016, 52% and 73%, respectively, remained mixed pioneer vegetation and emergent marsh in 2018. Another 28% of new-surface mixed pioneer vegetation matured into discernible, established community types by 2018, resulting in 0.3, 0.7, and 0.6 ha of new-surface dunegrass, emergent marsh, and willow–alder forest, respectively. However, not all new vegetation persisted; 20% of new-surface mixed pioneer vegetation and 24% of new-surface emergent marsh that established in 2012–2016 had reverted to no vegetation by 2018 (~1.9 ha in total, ~1.6 ha of which occurred after 2016).
Vegetation colonized new surfaces created by sediment deposition as well as existing surfaces that aggraded, stabilized, and/or became protected from wave action by adjacent new surfaces during dam removal (Figure 2). Where geomorphic surface types were also mapped (83% of newly vegetated areas), over half (52%) of newly vegetated areas occurred in intertidal aquatic and supratidal beach habitats, which comprised 51% of 2018 geomorphic surfaces available for colonization (i.e., not already vegetated in 2011) (Figure 5). However, only slightly less colonization (41%) occurred on supratidal river bars and river mouth bars, even though these made up only 22% of available surfaces, suggesting that supratidal bars provided particularly suitable habitat for colonizing vegetation. Persistent new-surface mixed pioneer vegetation was evenly distributed among supratidal beach, river mouth bar, and river bar surfaces, whereas new-surface mixed pioneer vegetation developed into dunegrass and willow–alder forest predominately on supratidal river mouth bars, and new-surface emergent marsh predominately colonized aquatic intertidal habitat (Figure 5).
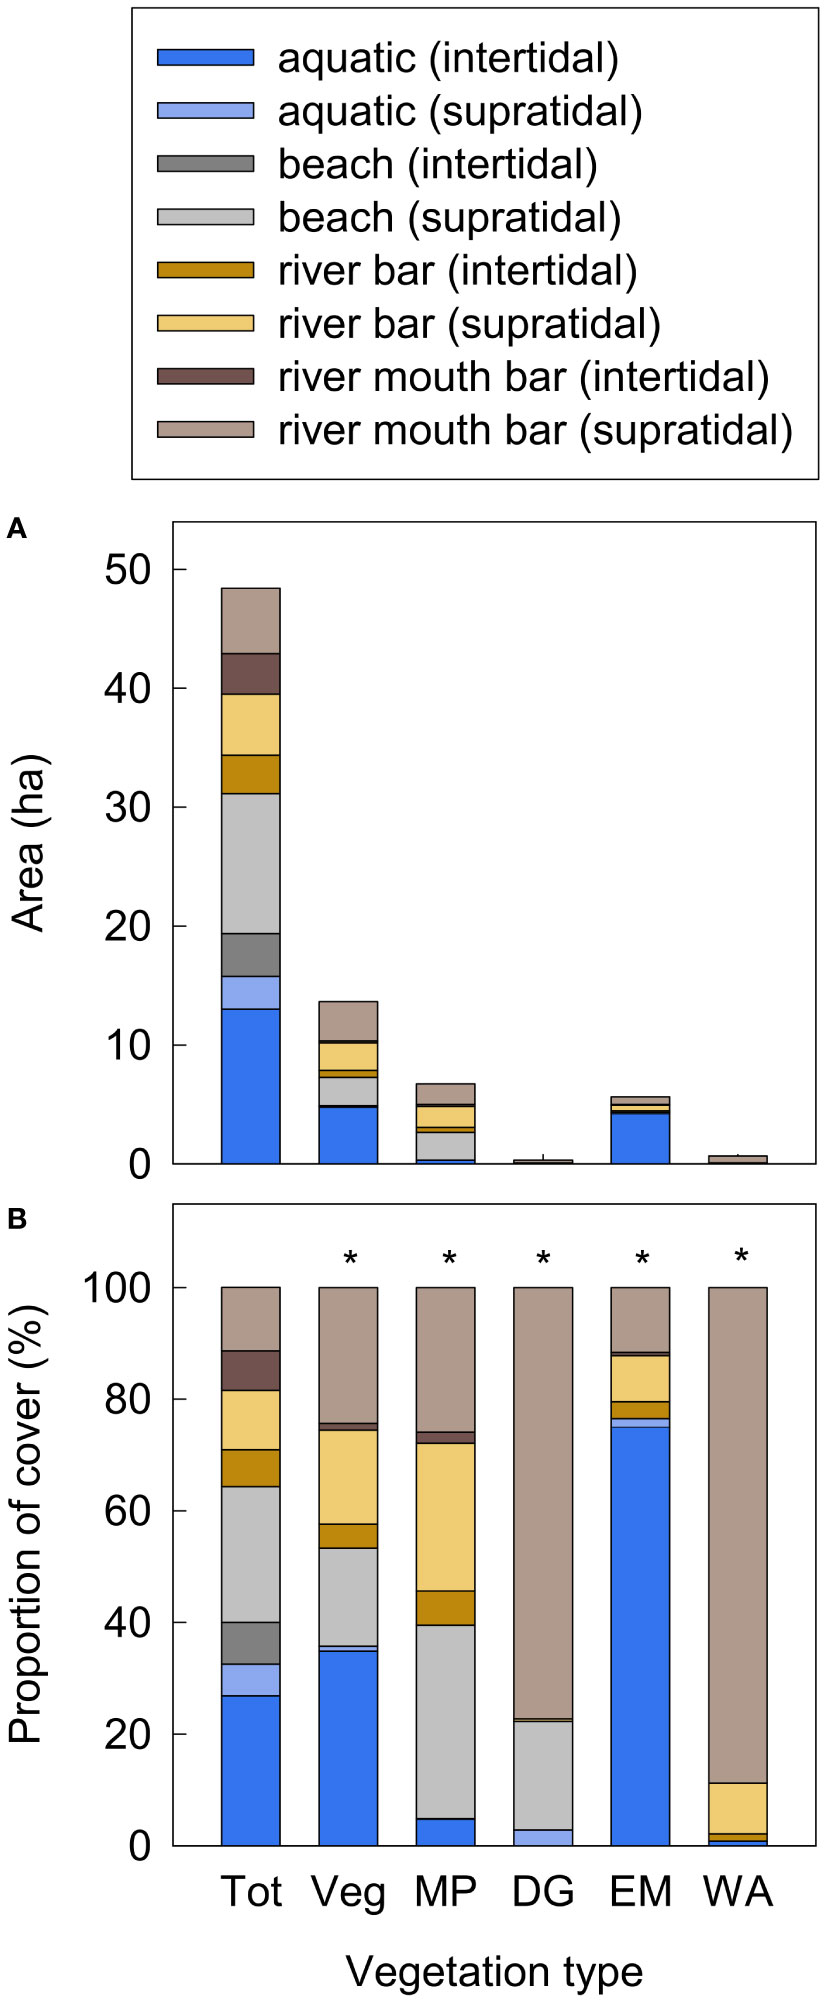
Figure 5 (A) Area (ha) and (B) proportional cover of mapped 2018 geomorphic surface classes in the Elwha River delta (U.S. state of Washington) that were unvegetated or did not exist in 2011 (i.e., prior to dam removal) and that were colonized by different vegetation types by 2018: total new area including surfaces that remained unvegetated (Tot), total new-surface vegetation (Veg), new-surface mixed pioneer vegetation (MP), new-surface dunegrass (DG), new-surface emergent marsh (EM) and new-surface willow–alder forest (WA). Colors indicate cover separately by geomorphic surface type. Asterisks (*) indicate p<0.0001 from Pearson’s Chi-square frequency tests for each vegetation type comparing the frequency of different geomorphic surface types to expected frequencies based on the total area (Tot). Community types with total colonized area <0.2 ha are not shown.
Surfaces that supported new vegetation in 2018 were, on average, ~0.4 m higher in elevation (Figure 6) and ~85 m farther from the shoreline than surfaces that remained unvegetated (158 ± 63 m compared to 72 ± 67 m). They were also less dynamic, with only 7–21 cm of mean net annual deposition and 6–12 cm of mean net annual erosion in 2015–2018, compared to 42–97 cm of deposition and 53–60 cm of erosion on unvegetated surfaces (Figure 6). Logistic regression of 2018 vegetation occurrence on surfaces that were unvegetated or did not exist in 2011 indicated that elevation, distance from shoreline, and surface age (i.e., time since surface stabilization) all influenced the likelihood of vegetation establishment and persistence (Figure 7). Response curves suggested that the likelihood of occurrence increased rapidly with increasing elevations >−0.5 m above MHHW and distances from shoreline >75 m (Figures 7A, B). The model with surface age defined as the number of years since there was >25 cm yr−1 of net annual erosion or deposition received considerably more AICc support than models with surface age defined by higher or lower thresholds of maximum net annual erosion or deposition (20-cm, ΔAICc=5; all others (10–50-cm), ΔAICc>14), suggesting that colonizing vegetation may frequently tolerate net annual erosion or deposition of <25 cm, but not larger perturbations. The likelihood of occurrence increased rapidly with increasing surface ages >2 years (Figure 7C), suggesting a 1–3-year lag between surface stabilization and discernible vegetation colonization on aerial imagery. The predicted likelihood of vegetation occurrence was 35% 3 years after surface stabilization, 60% after 4 years, 80% after 5 years and >90% after 6 years.
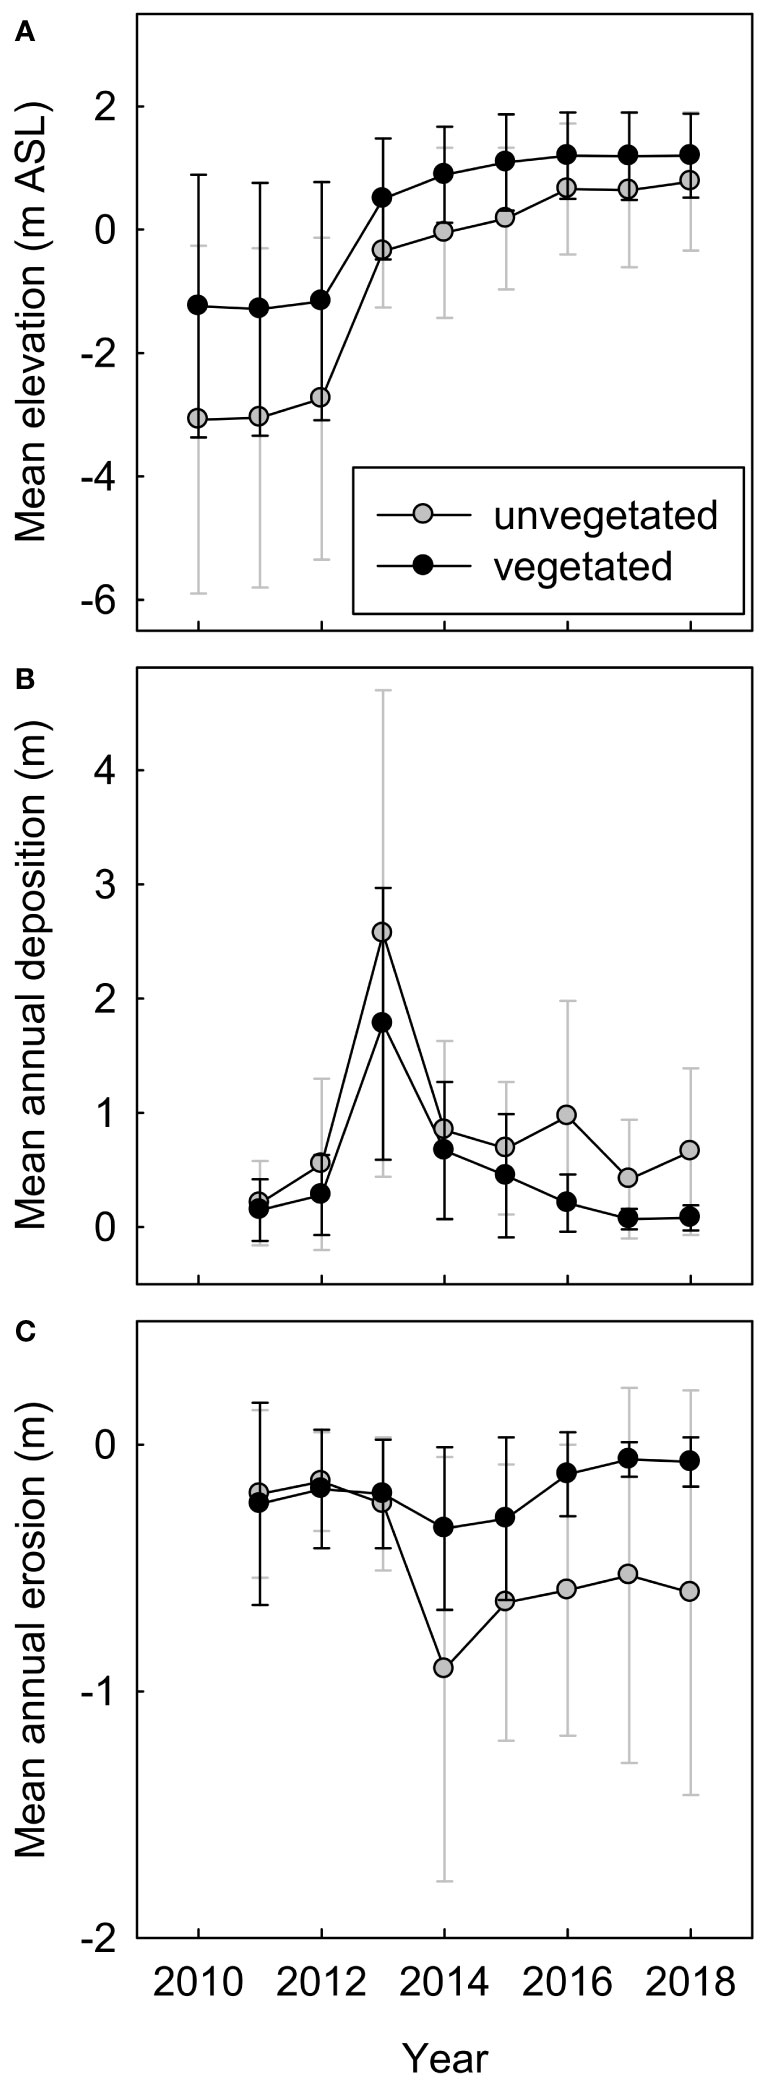
Figure 6 Temporal trends in elevation of new and previously unvegetated geomorphic surfaces in the Elwha River delta (U.S. state of Washington) during (2011–2014) and after (2014–2018) dam removal, comparing surfaces that were colonized by vegetation by 2018 versus surfaces that remained unvegetated: (A) mean surface elevation (m above mean higher high water), (B) mean annual net deposition (i.e., mean change in elevation for surfaces that increased in elevation that year), and (C) mean annual net erosion (i.e., mean change in elevation for surfaces that decreased in elevation that year). Error bars are one standard deviation of the mean.
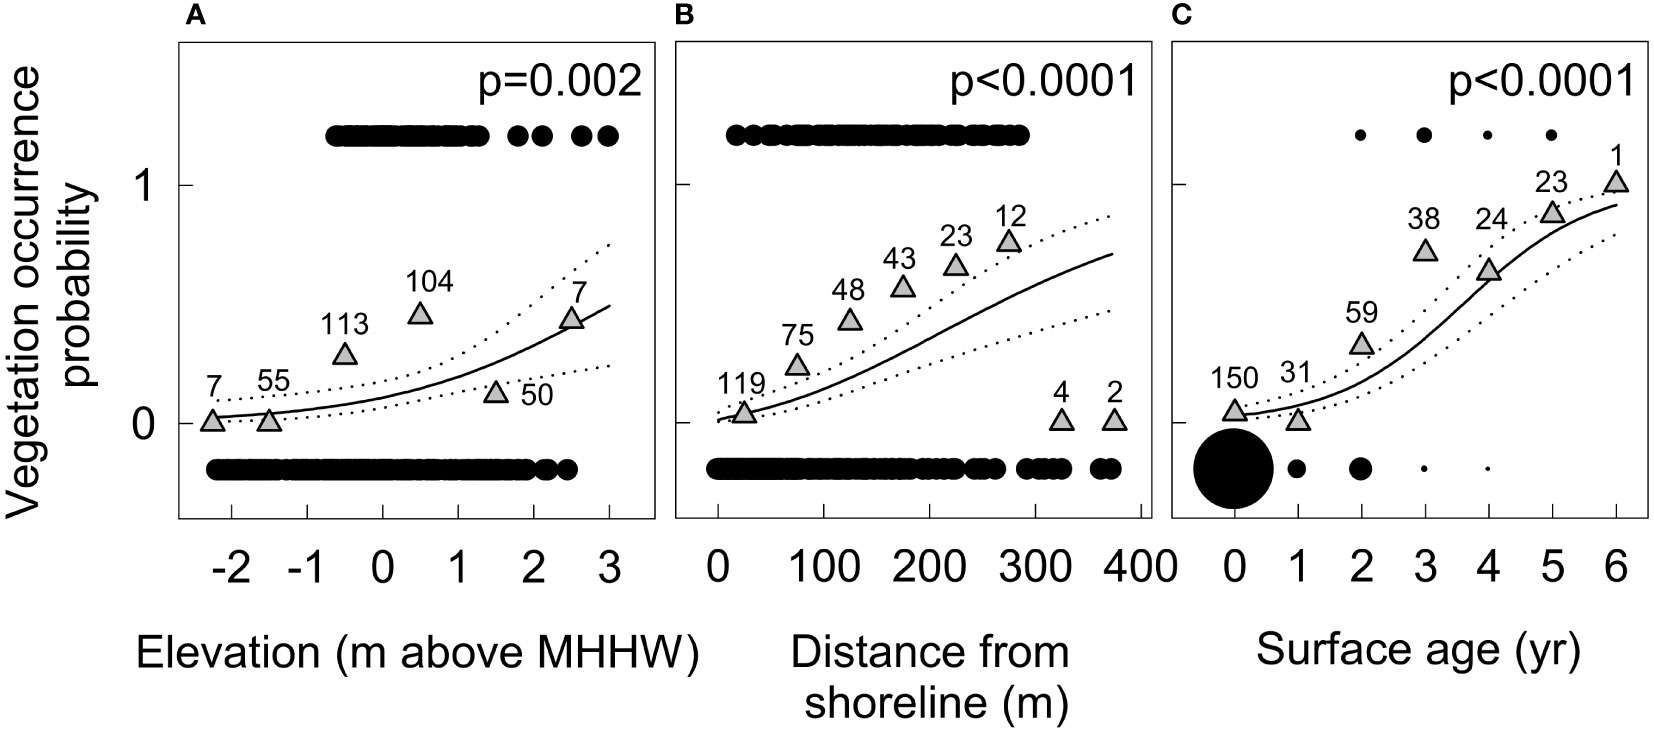
Figure 7 Response curves from logistic regression of 2018 vegetation occurrence on new and previously unvegetated geomorphic surfaces in the Elwha River delta (U.S. state of Washington) as a function of (A) surface elevation (m above mean higher high water) in 2018, (B) distance from shoreline in 2018, and (C) surface age, defined as years since >25 cm yr−1 of net annual erosion or deposition. Black circles in (A, B) show vegetation occurrence (presence/absence) for each random point in the dataset. The bubble plot in (C) shows the frequency of vegetation presence and absence for each year of surface age. Grey triangles show percent occurrence across points within evenly distributed bins (by meter in (A), 50 m in (B) and year in (C)), labeled with the sample size within each bin. Distance from shoreline was square-root transformed for analysis; back-transformed values are shown in (B).
3.1.3 Temporal trends in delta plant community abundance
Cover by mixed pioneer and emergent marsh communities in the delta tripled between 2011 and 2018 (Figures 2, 3C; Table S2), with a net increase of 5.2 and 6.5 ha, respectively. This increase mainly reflected colonization of new surfaces that had been unvegetated in 2011 (see above). However, emergent marsh vegetation also colonized 1.0 ha that had been mixed pioneer or riparian shrub vegetation in 2011, further increasing emergent marsh cover and offsetting the increase in mixed pioneer cover (Table S2). Also, some mixed pioneer and emergent marsh vegetation that was already established by 2011 developed into other, later-successional community types by 2018, or reverted to no vegetation, further offsetting the increases in cover.
During the same period, willow–alder forest cover in the delta increased by 2.6 ha (>50% increase), while riparian shrub cover decreased by 1.9 ha (>30% decrease) (Figures 2, 3C; Table S2). Although mixed pioneer vegetation development into willow–alder forest contributed to the increase in willow–alder forest cover, a larger portion of new willow–alder forest occurred in areas that had been riparian shrub in 2011 (1.4 ha; Table S2). Willow and especially alder were common in riparian shrub communities. As these willow and alder grew larger over time, they likely became more discernible on aerial imagery, changing the appearance of some communities from dominance by riparian shrubs to dominance by willow and alder, particularly in the southeastern corner of the study area farther from tidal and river influence. Development into willow–alder forest was the primary reason for declining riparian shrub community cover through 2018, although some 2011 riparian shrub cover also changed to emergent marsh or mixed riparian forest.
3.2 Vegetation plots
3.2.1 Plant community ordination
Three-dimensional NMDS ordination of species cover in vegetation plots (final stress=0.1097) captured compositional differences between the seven riparian community types (Figures 8, S3). Dimension 1 distinguished woody from herbaceous communities, with high scores corresponding to higher tree and shrub species richness and cover and low scores corresponding to higher forb, graminoid, introduced, and annual/biennial species richness and cover. Dimension 2 captured variation in wetland adaptation, with high scores corresponding to lower community-weighted wetland indicator values and higher emergent macrophyte cover. Dimension 3 separated communities with higher graminoid cover and shrub richness and cover from communities with higher tree richness and cover. For both Dimensions 1 and 2, high scores were associated with lower annual/biennial species richness and cover. For both Dimensions 1 and 3, high scores were associated with higher total, native, and perennial cover.
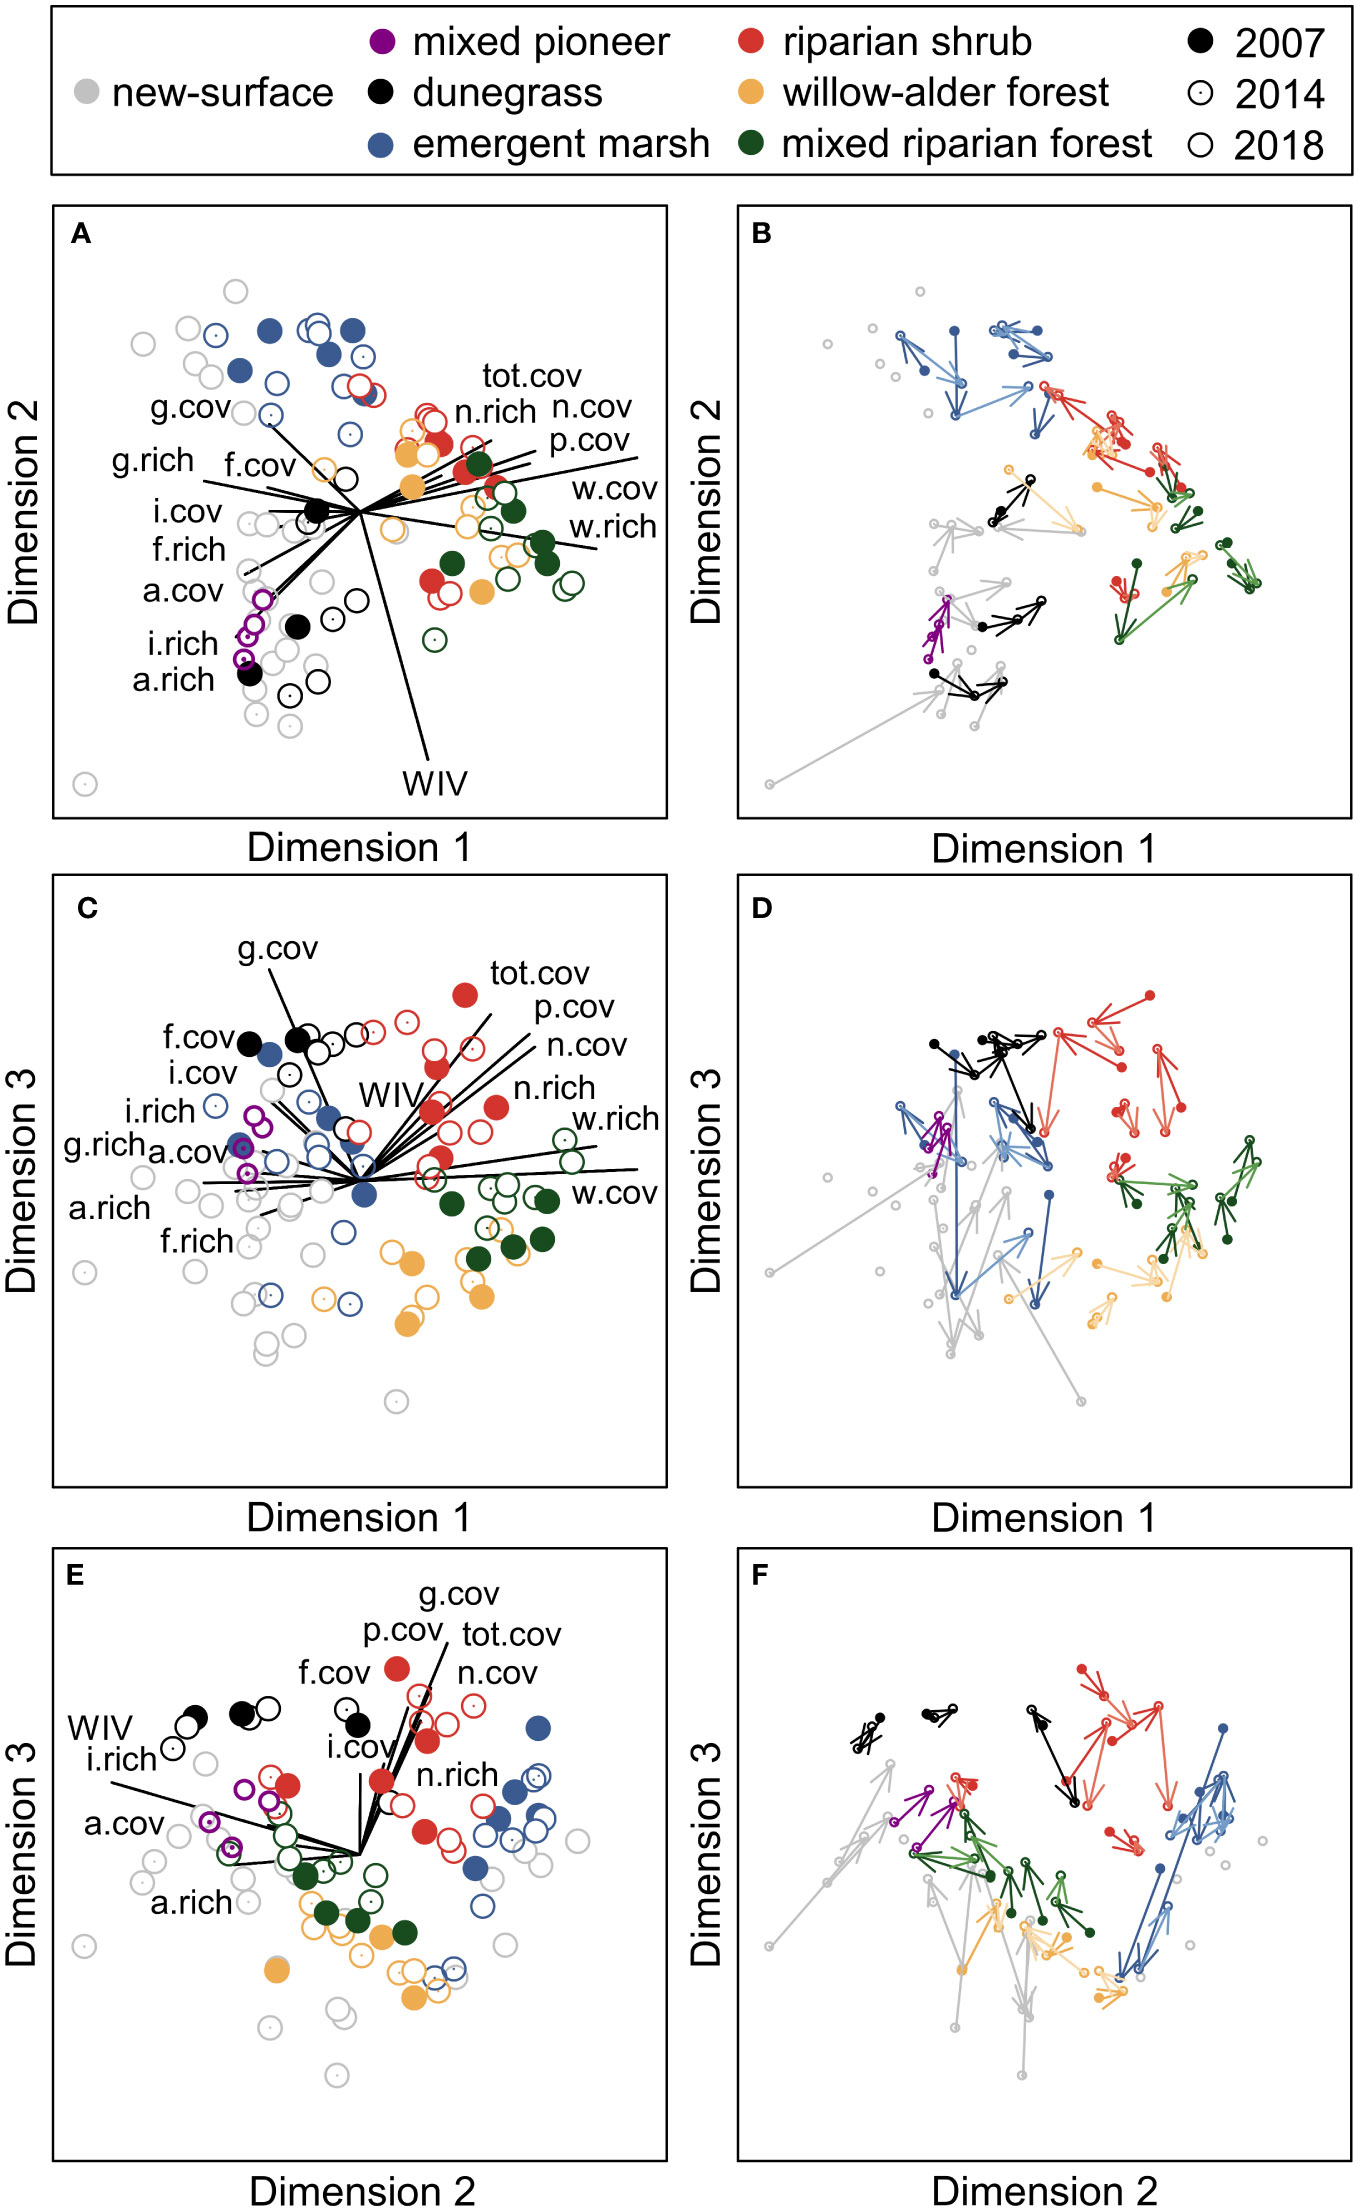
Figure 8 Non-metric multi-dimensional scaling (NMDS) ordination of plant species cover in vegetation plots in the Elwha River delta (U.S. state of Washington), showing each pairwise combination of three dimensions. (A, C, E) Overlay plots of community type (different colors) and year of measurement (filled circles=2007, dotted circles=2014, empty circles=2018). Joint plots illustrate the relative strength of correlations between ordination scores and functional group richness (“.rich”) and cover (“.cov”); relationships with Pearson’s r≥0.2 are shown. “tot”=all plants, “w”=woody, “f”=forb, “g”=graminoid, “p”=perennial, “a”=annual/biennial, “n”=native”, “i”=introduced, and “WIV”=the community-weighted mean wetland indicator value. (B, D, F) Vector plots indicating the direction of temporal change for each plot from 2007 (before removal of two dams on the Elwha River) to 2014 (during dam-removal) to 2018 (after dam-removal).
3.2.2 Compositional differences between new-surface vegetation and established plant communities
Vegetation on new surfaces was dominated by sparse mixtures (66 ± 13% total cover) of native and introduced forbs and graminoids, with few woody plants. Not surprisingly, functional group composition of these pioneer communities differed strongly from other, well-established community types in the delta (Table S3).
Compared to mixed riparian forest, willow–alder forest, and riparian shrub plots, new-surface vegetation plots had lower woody, perennial, and native species cover, and lower woody species richness. New-surface vegetation also had lower total cover than mixed riparian forest and riparian shrub plots, lower forb cover than willow–alder forest and riparian shrub plots, higher introduced species cover, graminoid cover, and graminoid richness than mixed riparian forest plots, and higher annual/biennial richness and cover and lower native richness than riparian shrub plots.
New-surface vegetation was more similar to herbaceous-dominated, pre-dam-removal community types (mixed pioneer, emergent marsh, dunegrass), but still differed in several respects (Table S3). New-surface vegetation had lower graminoid cover than dunegrass and emergent marsh plots, lower woody species richness than dunegrass plots, lower perennial and native cover than emergent marsh plots, and higher annual/biennial richness and cover than emergent marsh plots. New-surface vegetation also had lower annual/biennial richness and higher woody cover than pre-dam-removal mixed pioneer plots.
Pairwise PERMANOVAs indicated that species composition in new-surface vegetation differed significantly from all other community types (Table S4). Generalized linear mixed models indicated that new-surface vegetation had lower NMDS Dimension 1 scores than mixed riparian forest, willow–alder forest, and riparian shrub plots (all t32>7.0, p<0.0001; Figures 8A, B) and lower NMDS Dimension 3 scores than dunegrass and riparian shrub plots (both t26>5.0, p<0.0001; Figures 8C, E). NMDS axis 2 scores were lower for most new-surface vegetation plots than emergent marsh plots (t33=2.9, p=0.03; Figures 8A, E), but not for six plots (Figure 8A) that were on intertidal new surfaces in protected lagoons, classified as emergent marsh on aerial imagery. SIMPER analyses suggested that these differences were driven by substantially higher cover of dominant species in established community types than in new-surface vegetation (e.g., Leymus mollis in dunegrass communities, Eleocharis palustris and Carex obnupta in emergent marsh, Rosa sp. and Malus fusca in riparian shrub communities, Alnus rubra and Salix sitchensis in willow–alder forest, and Oemleria cerasiformis, Alnus rubra, and Rubus spectabilis in mixed riparian forest), as well as by higher cover of Lathyrus japonicus, a dune legume, in new-surface vegetation than in other community types (Table S4).
3.2.3 Vegetation development on new surfaces
In new-surface vegetation plots, rapid sediment accretion (up to 4.0 m yr−1) began with initial dam removal in 2011–2012 in most plots (Figure 9). Sediment accretion slowed to <0.25 m yr−1 in different years in different plots (2012–2015), resulting in differences in surface age of up to six years among plots. In four plots, channel movement and sediment re-working during the 2014–2015 winter (following 2014 sampling) resulted in >1 m of erosion (Figures 9G–I, M). One of these plots was lost to the active channel (Figure 9I), but the other three received substantial re-deposition (0.4–0.9 m) in 2016, resulting in new, lower surfaces. Mean elevations following surface establishment varied among plots and sampling years from −0.6 m (intertidal) to 1.1 m (supratidal) relative to MHHW.
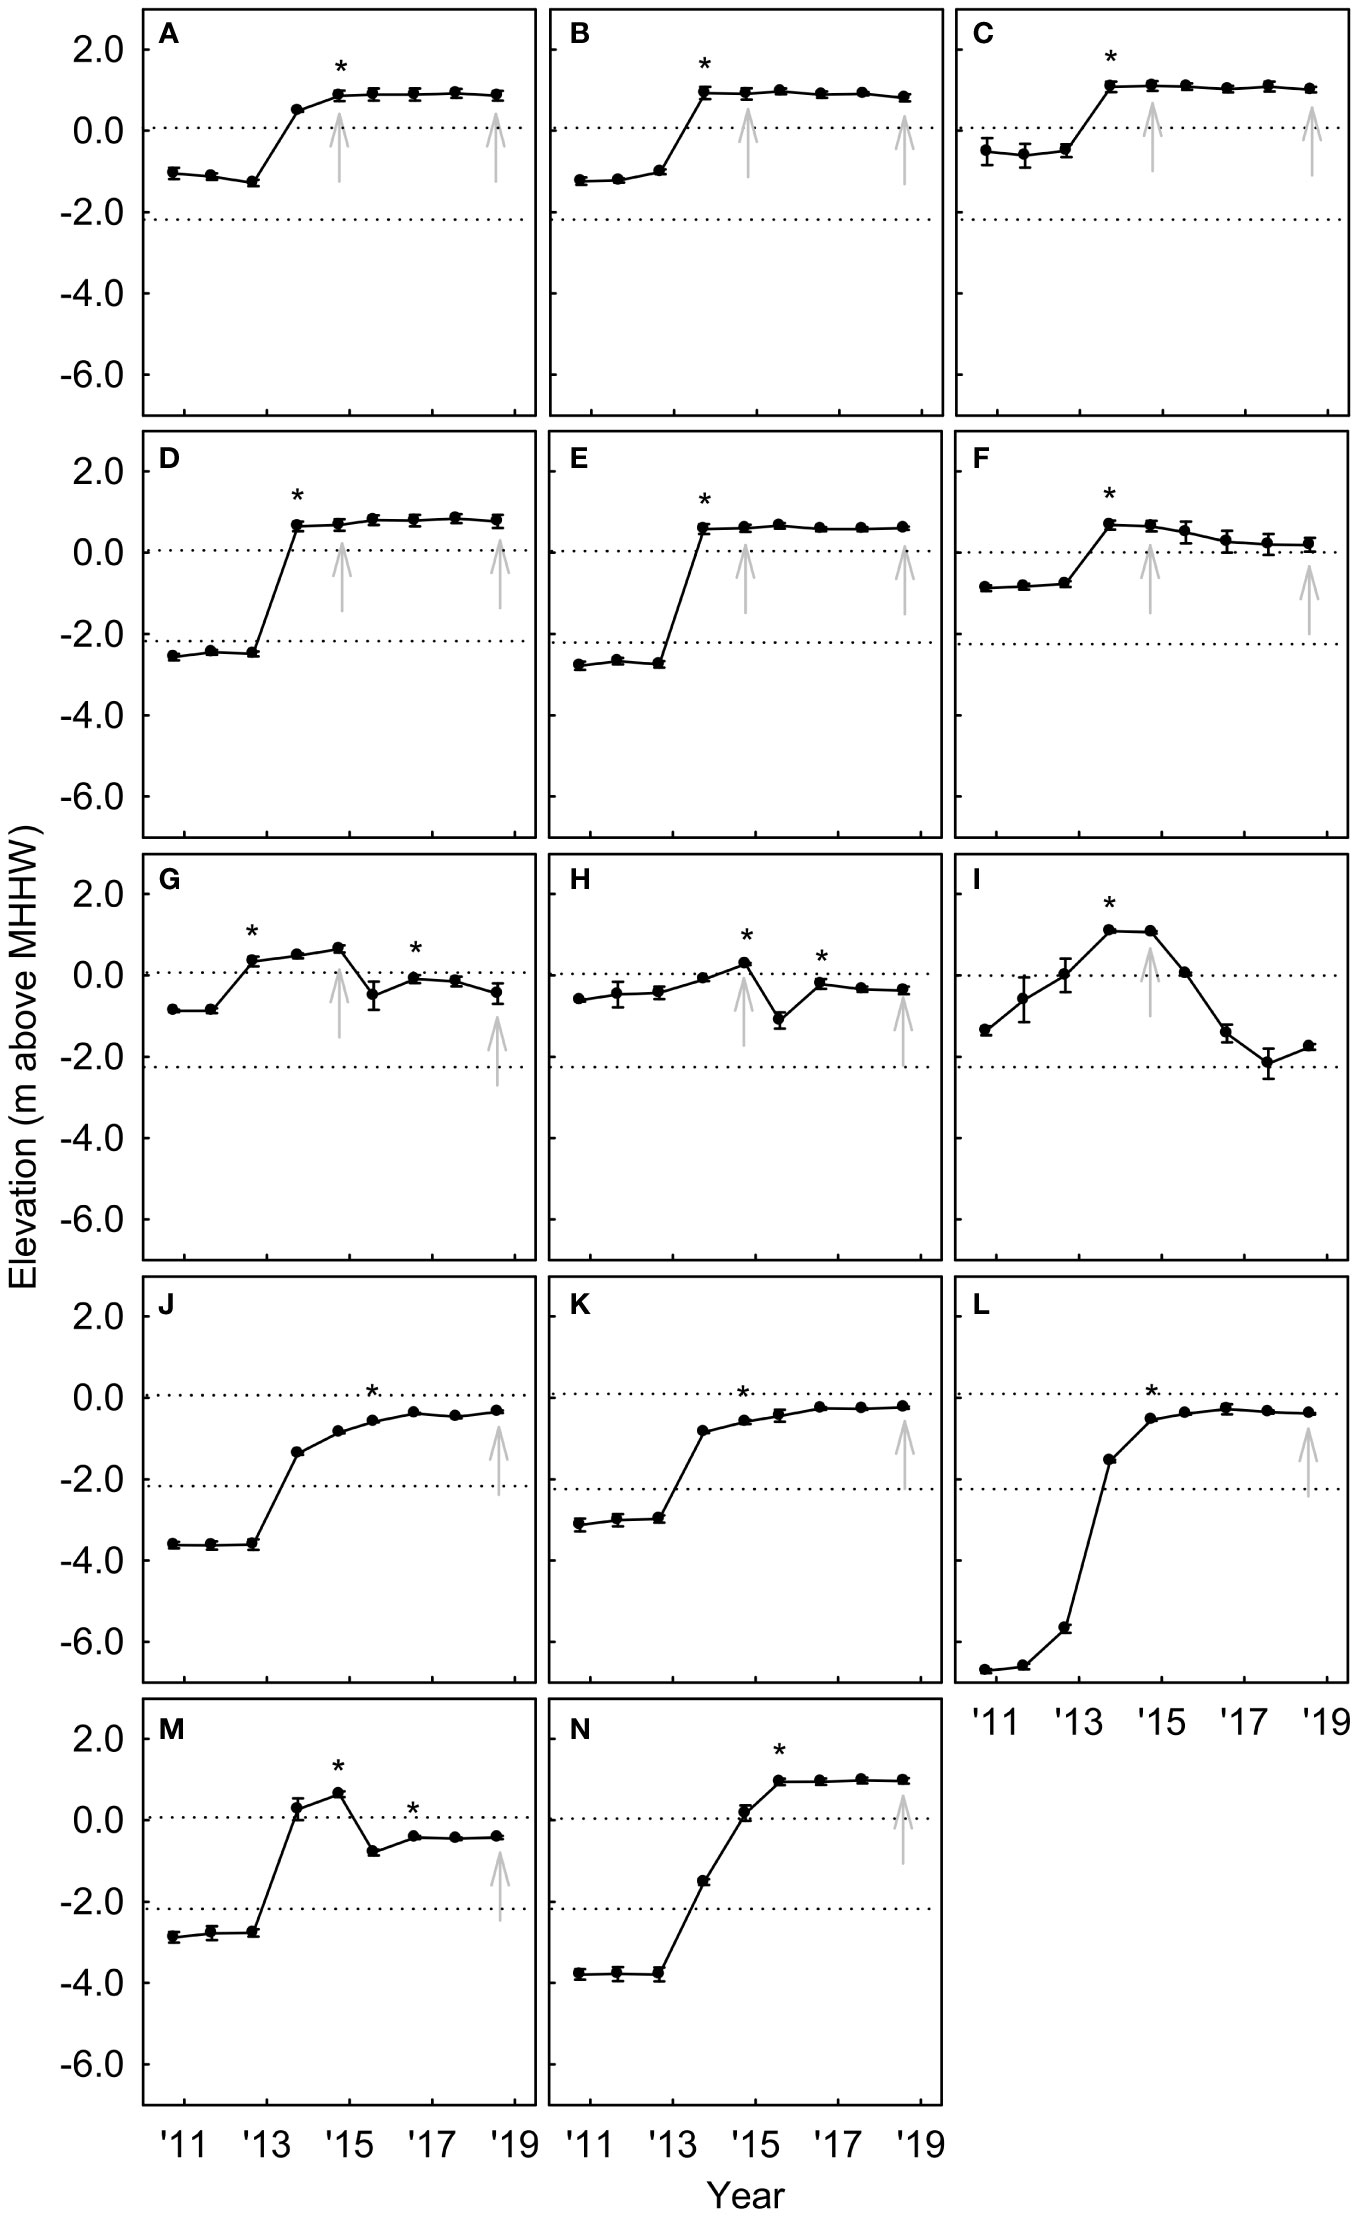
Figure 9 Annual surface elevation (m above mean higher high water) in new-surface vegetation plots from pre-dam-removal (2010) to four years post-dam-removal (2018) in the Elwha River delta (U.S. state of Washington). Each panel (A–N) depicts annual mean surface elevation over time within a single 100 m2 vegetation plot. Dashed lines indicate elevations of mean higher high water (MHHW) and mean lower low water (MLLW) (USA NOAA Tidal Datums for Port Angeles, WA; https://tidesandcurrents.noaa.gov/). Gray arrows indicate years in which vegetation was sampled. Asterisks indicate timing of surface establishment, determined from cessation of substantial sediment accretion (≥0.25 m yr−1). In panels (G, H, M), there are two asterisks, because channel movement and sediment re-working during the 2014–2015 winter removed initially established surfaces and sediment deposition in 2016 created new established surfaces. Error bars are one standard deviation of the mean.
Model selection indicated that surface age, elevation, substrate gravel/cobble, and soil depth influenced different components of plant community composition on new surfaces (Table S5). We defined surface age (i.e., years since surface stabilization) a priori as the number of years since net annual erosion and deposition slowed to <25 cm yr−1, a rate that we expected colonizing vegetation could potentially survive. This choice was subsequently supported by logistic regression model selection results for vegetation occurrence on new surfaces on aerial imagery (see Vegetation colonization of new surfaces created by dam removal results above). Models that included surface age received AICc support for both species richness and cover of nearly all functional groups, with substantially higher richness and cover on older surfaces for the total plant community, perennials, forbs, graminoids, native species, and introduced species (Figure 10). Lower-elevation new surfaces supported vegetation with lower community-weighted mean wetland indicator values, lower perennial cover, higher introduced species cover, and higher annual/biennial species richness and cover (Figure 11). Total, forb, and introduced species richness were higher on coarser substrates, while total, forb, and native species cover were higher on deeper soils (Figure 11). By contrast, woody species richness was lower on both deeper and coarser soils. Many of these relationships with elevation, soil depth, and soil particle size were largely driven by high species richness and low cover in two plots on an intertidal river bar adjacent to the active channel, on relatively young (0–2 yr), recently-reworked surfaces at low elevations with shallow, coarser soils (Figures 9G, H, 11A, D–G, I–K). Some of the relationships between cover and elevation or soil depth were driven in addition or instead by high cover in 1–3 plots on intermediate-aged (2–4 yr) intertidal aquatic surfaces at low elevations with deep soils within a newly formed lagoon (Figures 9J, L, M, 11B, C, E–G).
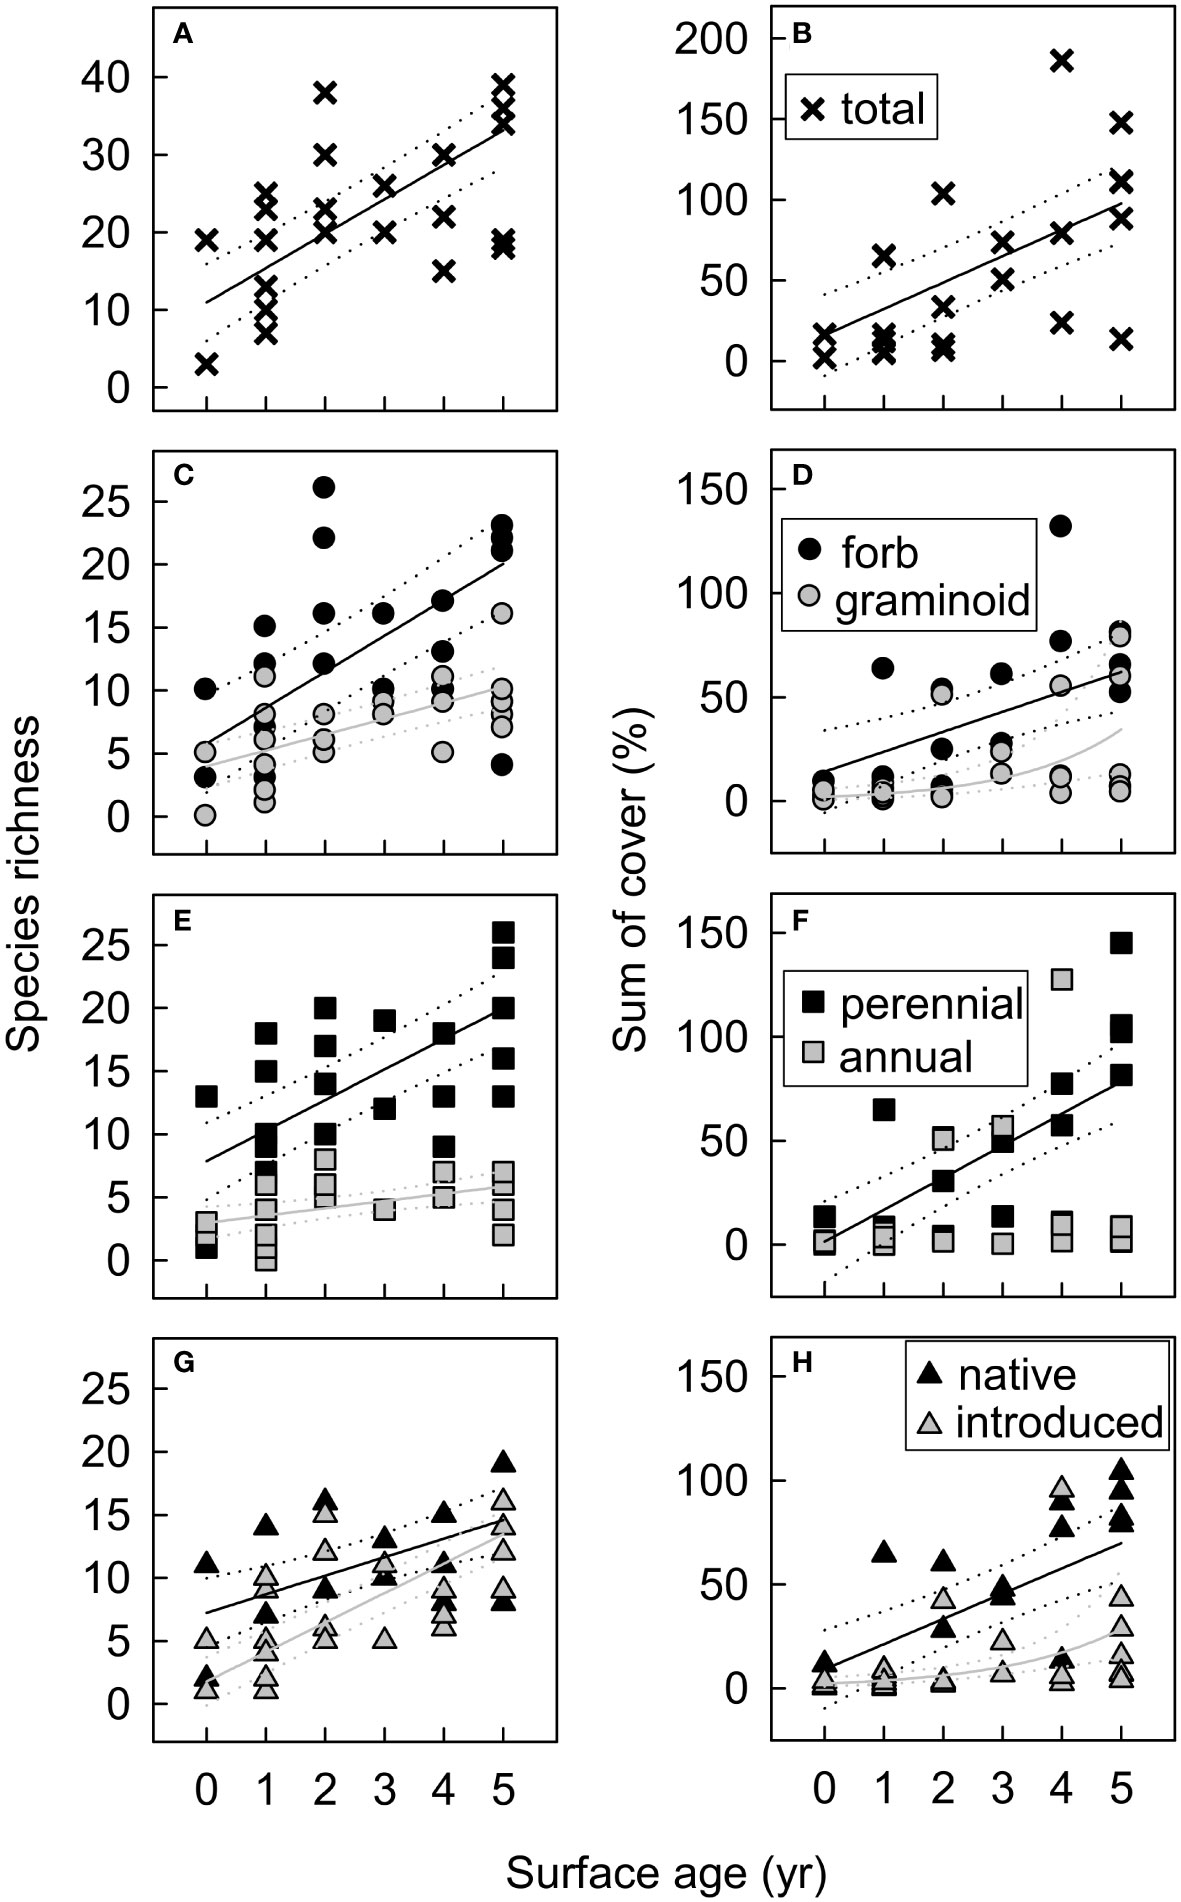
Figure 10 Functional group species richness and cover in new-surface vegetation plots in the Elwha River delta (U.S. state of Washington) as a function of plot surface age (years since >25 cm yr−1 of net annual erosion or deposition) for (A, B) the total plant community, (C, D) by growth form (forbs, graminoids), (E, F) by life history (perennials, annual/biennials), and (G, H) by origin (native, introduced). Model selection (delta Akaike information-theoretic criteria adjusted for small sample size (ΔAICc)) indicated support for surface age as a predictor for all functional groups shown (Table S5). Fitted lines and 95% confidence limits are from models that received the most AICc support, with a Gaussian distribution for most functional groups and a nbinom2 distribution for graminoid and introduced species cover (D, H). Cover values are the sums of estimated cover across species within each functional group. Because species cover often overlapped, the sum of cover across species exceeded 100% in some plots.
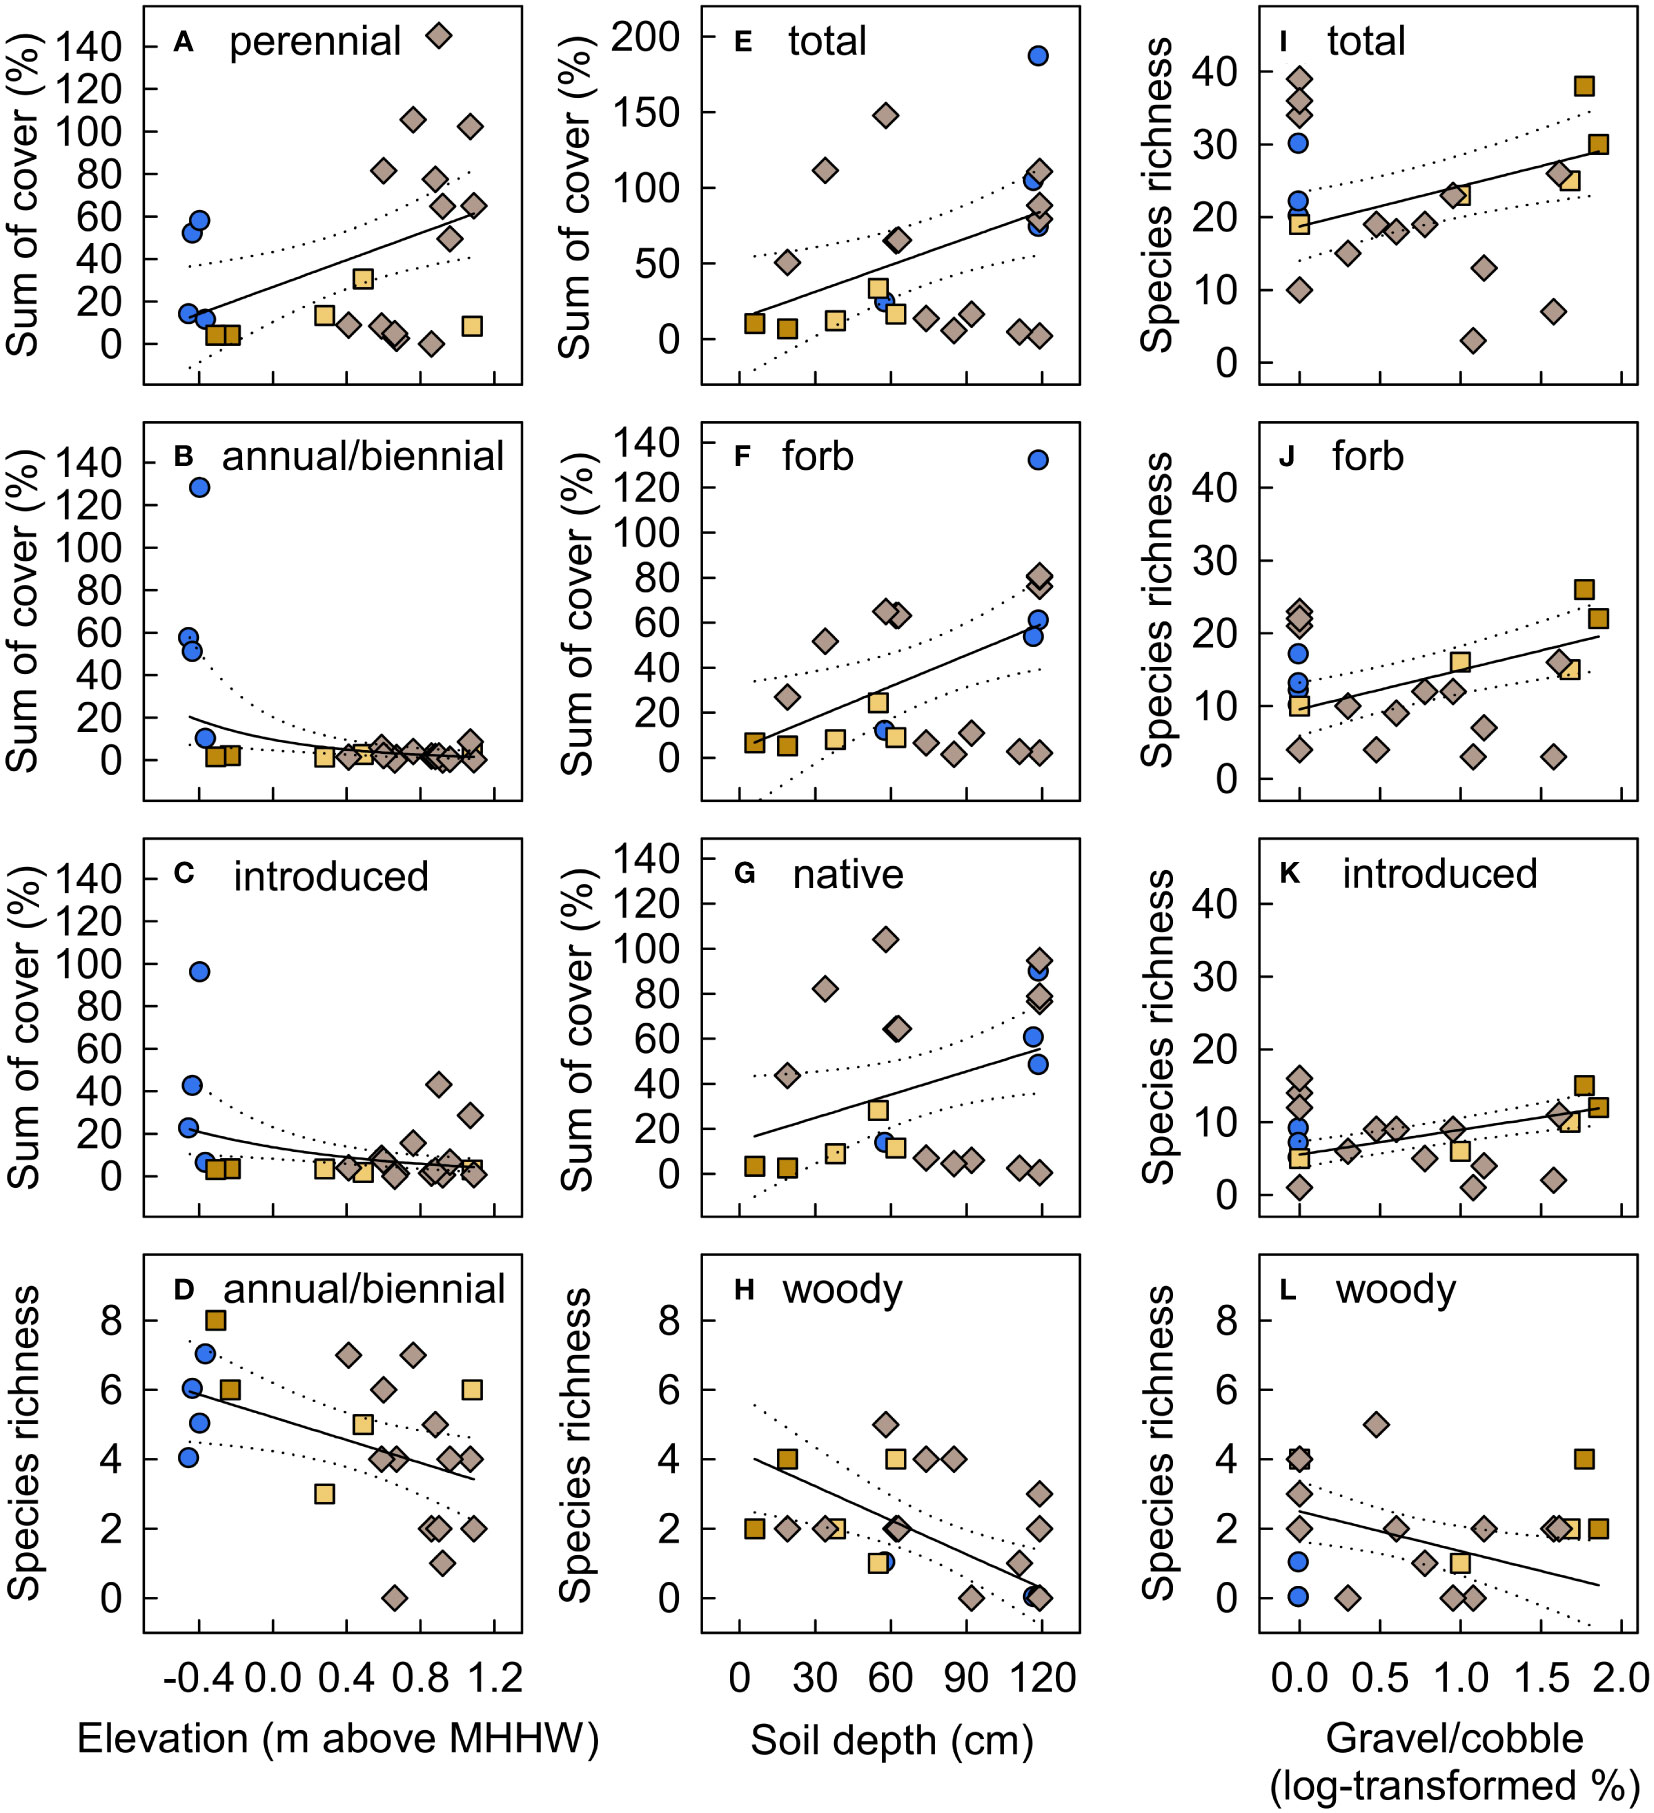
Figure 11 Functional group species richness and cover in new-surface vegetation plots in the Elwha River delta (U.S. state of Washington) as a function of plot (A–D) elevation (m above mean higher high water), (E–H) soil depth, and (I–L) substrate gravel/cobble. Model selection (delta Akaike information-theoretic criteria adjusted for small sample size (ΔAICc)) indicated support for these variables as predictors for the functional groups shown (Table S5). Fitted lines and 95% confidence limits are from models that received the most AICc support, with a Gaussian distribution for most functional groups and a nbinom2 distribution for annual/biennial and introduced species cover and woody species richness (B, C, H, L). The best models also included plot surface age for all response variables except annual/biennial cover and woody species richness (Figure 10). Symbol shapes and colors are from Figure 3B, indicating plots on intertidal aquatic (blue circles), intertidal river bar (dark tan squares), supratidal river bar (light tan squares), and supratidal river mouth bar (light brown diamonds) surfaces. Cover values are the sums of estimated cover across species within each functional group. Because species cover often overlapped, the sum of cover across species exceeded 100% in some plots.
Model selection also indicated that lower-elevation plots with finer substrates had higher NMDS Dimension 2 scores, indicating similar species composition to emergent marsh plots (Figure 8A), while higher-elevation, older plots had higher NMDS Dimension 3 scores, indicating more similar composition to dunegrass plots (Figure 8E). For the six plots on surfaces that established before 2014 and were not reworked during the 2014–2015 winter, NMDS Dimension 3 scores increased notably between 2014 and 2018, resulting in closer proximity of these older plots to established community types in ordination space (Figures 8B, D, F). PERMANOVA indicated that species composition in these plots differed significantly between 2014 and 2018 (F1,11=2.5, p=0.02). SIMPER analyses suggested that this temporal change was driven by higher cover of the most common species in 2018 (e.g., Lathyrus japonicus, Leymus mollis, and Holcus lanatus; Table S6).
3.2.4 Temporal change during and after dam removal in established plant communities
Plant communities that existed prior to dam removal changed in several ways between 2007 and 2018 that may have been related to dam removal but also could be related to successional processes. Across community types, woody cover increased from 75 ± 16% in 2007 to 83 ± 19% in 2014 and 89 ± 15% in 2018, while introduced species richness decreased from 6 ± 1 in 2007 to 5 ± 1 in 2014 and 4 ± 1 in 2018 (Table S7).
Significant year × community type interactions indicated additional temporal changes in dunegrass, emergent marsh, riparian shrub, and willow–alder forest plots but not in mixed riparian forest plots (Table S7). PERMANOVAs also indicated that species composition changed over time in dunegrass, emergent marsh, and riparian shrub plots (Table S8), but not in willow–alder and mixed riparian forest plots (p>0.05).
In dunegrass plots, SIMPER analyses suggested that temporal change was driven by substantial decreases in cover by dominant dunegrass community species (Leymus mollis, Lathyrus japonicus) and increases in cover by woody species (e.g., Rosa spp.), Artemisia suksdorfii, and introduced annual grasses (Aira spp.) (Table S8). Dunegrass plots also had higher NMDS Dimension 1 scores in 2018 than 2007 (year × type, F8,26=2.3, p=0.048; Figures 8A, B), reflecting increased woody species cover. Further, forb cover in dunegrass plots decreased from 55 ± 25% in 2007 to 14 ± 2% in 2014 and 13 ± 4% in 2018 (Table S7). Plot topographic surveys indicated that the dunegrass plots received 11–57 cm of net sediment deposition between 2007 and 2014 (Figure S4). No net deposition was apparent between 2014 and 2018.
In emergent marsh plots, SIMPER analyses suggested that temporal change was driven by increases in obligate wetland species cover (Carex obnupta, Typha latifolia) and decreases in facultative wetland species cover (Argentina egedii, Juncus arcticus) (Table S8). Accordingly, community-weighted mean wetland indicator values in emergent marsh plots also decreased from 2.2 ± 0.3 in 2007 to 1.5 ± 0.2 in 2014 and 1.4 ± 0.2 in 2018 (Table S7). This increase in wetland adaptation occurred in conjunction with ongoing sediment deposition, with 23–55 cm of net deposition between 2007 and 2014 in three of the four plots and 12–23 cm of net deposition between 2014 and 2018 in all plots (Figure S4).
In riparian shrub plots, SIMPER analyses suggested that temporal change was driven by decreases in shrub cover (Rosa spp.) and increases in riparian tree cover (Salix sitchensis, Populus balsamifera, Alnus rubra) (Table S8). Forb species richness in riparian shrub plots increased from 7 ± 1% to 11 ± 2% between 2007 and 2014, but then returned to 7 ± 2% in 2018 (Table S7). Riparian shrub plots received more gradual sediment deposition than dunegrass or emergent marsh plots, with 6–19 cm of net deposition in three of the four plots in 2007–2014 and 9–14 cm in 2014–2018 (Figure S4).
4 Discussion
Removal of two large dams on the Elwha River created substantial new coastal habitat at the river mouth. Sediment release and transport during and following dam removal increased the total area of intertidal and supratidal habitats in the delta and estuary by 26.8 ha between 2011 (prior to dam removal) and 2018 (four years after dam removal was complete) (Figures 1–3). Coastal wetland, riparian, and dune vegetation colonized 16.4 ha of new and previously unvegetated surfaces that aggraded with sediment from the former reservoirs.
4.1 Which landscape positions and elevational histories supported vegetation establishment and persistence on new delta surfaces?
Among the new coastal geomorphic surfaces that were created following dam removal, vegetation colonized surfaces that remained relatively stable for at least 2–3 years (<25 cm net annual elevation change), were high enough in elevation to support wetland vegetation (>−0.5 m above MHHW), and were far enough from the sea to be protected from over-topping waves (>~75 m) (Figures 6, 7). Mixed pioneer vegetation colonized new supratidal beach, river bars, and river mouth bars, while emergent marsh vegetation colonized new intertidal aquatic habitats (Figure 5). In particular, supratidal river bars and river mouth bars supported >40% of new vegetation even though they made up <25% of new surfaces, suggesting that these surface types provided particularly suitable habitat for colonization. The importance of surface stabilization for vegetation establishment likely explains why most new-surface vegetation established after 2014 (Figure 4), as most new surfaces were highly dynamic during the first three years of dam removal (Ritchie et al., 2018; Warrick et al., 2019). Surface elevation and elevational dynamics have also been identified as key predictors in transitions between unvegetated tidal flats and vegetated saltmarsh in other coastal areas (Fagherazzi et al., 2006; Wang and Temmerman, 2013; Jia et al., 2023). Elevation in coastal habitats can serve as a proxy for more mechanistic predictors, such as inundation depth and duration. In the Elwha River delta, calculating these inundation metrics would require hydrologic models to integrate tidal and fluvial inflows and outflows, including within increasingly disconnected lagoons, which was beyond the scope of this study.
4.2 How did vegetation composition on new delta surfaces compare to other Elwha River plant communities?
Not surprisingly, vegetation on new surfaces retained early-successional characteristics into 2018 compared to the plant communities that existed in the delta prior to dam removal. New-surface vegetation had substantially lower cover of the dominant species typical of the established community types (Table S4). Low woody cover made new-surface vegetation resemble emergent marsh and dunegrass communities more closely than riparian shrub, willow–alder, and mixed riparian forest communities (Figure 8), but new-surface vegetation also differed meaningfully from emergent marsh and dunegrass communities, with lower graminoid cover than both emergent marsh and dunegrass communities, and lower native and perennial cover and higher annual/biennial cover than emergent marsh (Table S3).
The species present in new-surface vegetation, however, included a large proportion of the species present in established delta plant communities, as well as upstream on the Elwha River. Of the 88 species that occurred in >5% of established delta plant community plots in 2007–2018, 55% (49) occurred in new-surface vegetation plots, including 48% (29) of the 60 species that occurred in woody-dominated delta community types. Similarly, in vegetation establishing in the former Mills Lake reservoir upstream, 66% of indicator species identified on different surface types (Chenoweth et al., 2022) occurred frequently (>15% of plots) in new-surface vegetation in the delta, as did 42% of all species in the former reservoir with >1% mean cover (not including where planted) (Prach et al., 2019). On river reaches between and below the former dams, 90% of indicator species identified on gravel bars and 43% of indicator species identified on floodplains (Brown et al., 2022) also occurred frequently in new-surface vegetation in the delta, including common early-successional woody species (Populus balsamifera, Salix sitchensis) and native and introduced herbaceous perennials (e.g., Agrostis stolonifera, Epilobium ciliatum, Equisetum arvense, Holcus lanatus, Artemisia suksdorfii). However, none of the indicator species identified on upstream terraces (Brown et al., 2022) occurred in >5% of new-surface vegetation plots, suggesting that the new delta surfaces were not yet suitable for the latest-successional species along the Elwha River.
4.3 How did vegetation on new delta surfaces change as surfaces aged?
Although vegetation on new surfaces remained early-successional in 2018, differences with established delta plant communities diminished over time as new-surface vegetation developed, suggesting that new-surface vegetation may eventually mature into later-successional delta community types. On aerial imagery, ~1 ha of new-surface mixed pioneer vegetation developed into what appeared to be young dunegrass or willow–alder communities by 2018 (Figure 4). In vegetation plots, new-surface vegetation that established before 2014 (all supratidal) increased in compositional similarity to other delta plant communities by 2018 (Figure 8). Further, species richness and cover in new-surface vegetation plots increased with time since surface stabilization for all functional groups except woody species (Figure 10). Although woody cover remained low, early-successional woody riparian species (Alnus rubra, Salix spp., Populus balsamifera) occurred in 67% of new-surface vegetation plots, with potential to grow and spread. These trends of increasing species richness, cover, and presence of typical early-successional riparian woody and herbaceous species suggest similarities to typical early-successional riparian vegetation development following large floods (Gregory et al., 1991; Stromberg et al., 1993; Friedman et al., 1996; Van Pelt et al., 2006). In the future, vegetation at the tops of beach-facing new surfaces may develop into dunegrass communities, whereas vegetation on new surfaces more protected from salt spray and waves may develop into riparian shrub communities or willow–alder forest.
4.4 How did environmental conditions affect species and functional group composition on new delta surfaces?
Elevation strongly influenced community composition on new surfaces, with primarily obligate-wetland species in lower elevation (intertidal) plots versus facultative-wetland and upland species in higher elevation (supratidal) plots. Elevations of intertidal new-surface vegetation plots were similar to established emergent marsh plots, while elevations of most supratidal new-surface vegetation plots were intermediate between established riparian shrub plots and the higher dunegrass plots (Figures 9, S4). In particular, obligate-wetland vegetation established where sediment deposition formed shallow pools and lagoons that were largely cut off from the river and sea, creating new brackish and freshwater habitats (Figure 2). Species composition in the six new-surface vegetation plots in these protected intertidal areas resembled emergent marsh species composition (Figures 8A, E), although with lower cover of the dominant species (Table S4). A few of these plots also had relatively high cover of introduced and annual/biennial forbs (Figures 11B, C, E, F), driven by abundant obligate-wetland annuals, Lythrum portula (introduced) and Limosella aquatica (native), which did not occur in supratidal plots or established emergent marsh plots. These short-statured, short-lived species are likely to decline in abundance if longer-lived, more competitive species increase in these plots (Grime, 1977). Given the already close resemblance in species composition, vegetation on these protected intertidal new surfaces seems likely to continue to increase in similarity to established emergent marsh vegetation over time. However, it could develop into other community types if and where ongoing sediment deposition substantially increases surface elevation.
Community composition on new surfaces also varied with soil depth and particle size, with higher plant cover on deeper soils and higher species richness on coarser soils (Figure 11). These trends were driven largely by two new-surface vegetation plots that were on a recently reworked, intertidal river bar along the active channel (Figures 9G, H). These plots had higher gravel/cobble cover and shallower soils than most new-surface vegetation plots and supported unusually high plant species richness for such young surfaces, and low cover. Most delta deposits during dam removal were coarse (sand, gravel, cobble), and most fines (1/3 of released sediment; Warrick et al., 2019) were transported offshore (Ritchie et al., 2018), but surficial fines were deposited on protected surfaces in the developing delta (Miller et al., 2015). In particular, the former beach received large inputs of organic matter followed by sediment after removal of the upper dam, resulting in different soil from elsewhere in the delta. By 2018, the only new-surface vegetation plots with substantial gravel or cobble (>40%) and shallow soils (<20 cm) were on surfaces exposed to ongoing marine or fluvial disturbance, either on river bars along the channel or on the new beach. Spatial heterogeneity in inundation, erosion/deposition, soil particle size, and/or soil depth in these plots at the river margin may have created suitable niches for a greater variety of early-successional species than other new-surface vegetation plots (Naiman and Decamps, 1997; Lundholm, 2009), while recent fluvial reworking and/or low organic matter and nutrient availability maintained low cover. Similar patterns were observed in the former Vezins reservoir (France) during dam removal, with higher species richness on dynamic new surfaces closer to the channel, attributed to lower cover of competitive, later-successional species (Ravot et al., 2019). Regardless of the mechanism, high species richness and low cover on coarser, dynamic intertidal new surfaces along the active channel suggest that ongoing fluvial dynamics may result in different vegetation trajectories than on other new surfaces in the delta.
4.5 In established delta plant communities, were there temporal changes in species and functional group composition that could be attributed to effects of dam removal?
In contrast to new surfaces in the delta, dam removal had few discernible effects on delta plant communities that existed prior to dam removal. Many temporal trends in the composition of established delta plant communities seemed as or more likely to reflect natural successional processes than responses to sediment and organic matter deposition from dam removal, such as the increases in woody cover and decreases in introduced species richness across community types, the increase in wetland adaptation in emergent marsh communities, and the increase in riparian tree cover in riparian shrub communities and development of riparian shrub communities into willow–alder forest (Figures 2, 3; Table S7). Over time, these successional processes have potential to homogenize vegetation structure and composition on older, more protected surfaces in the delta, but on-going fluvial and marine disturbance are likely to continue to maintain a patchy mosaic of early-successional community types on less protected surfaces.
However, the decreases in dominant dunegrass community species (Leymus mollis, Lathyrus japonicus) and forb cover and increases in woody cover in some dunegrass plots were less typical of natural dunegrass succession. These changes may have resulted from increased protection from salt spray and storm waves by adjacent new river mouth bars, lagoons, and beach surfaces, particularly for dunegrass communities east of the main channel, where more of these new surfaces formed (Figure 2). Increased nutrients due to sediment and organic matter deposition (Figure S4) also may have contributed to vegetation change in dunegrass plots, particularly the increase in introduced, annual grasses (Aira spp.) (Table S8), which tend to be adapted to disturbed soils and high nutrient availability (Norton et al., 2007). Aira spp. cover increased only in the dunegrass plot west of the main channel, which received substantial deposition (~60-cm) and remained relatively exposed to marine forces. If these trends continue, much of the dunegrass communities along the former beach east of the main channel may develop into woody-dominated, riparian shrub communities, and perhaps eventually mixed riparian forest.
4.6 Did dam removal facilitate invasion by introduced species in the delta?
Dam removal appeared to increase overall introduced species richness but not local abundance in the delta. Prior to dam removal (in 2007), we identified 42 introduced species across vegetation plots (Shafroth et al., 2011), most of which were perennial grasses and forbs (62%) and most of which persisted in the plots in 2018 (74%). During and after dam removal (2014, 2018), we identified an additional 34 introduced species in the delta, most of which were annual/biennial grasses and forbs (59%; most frequently Sonchus asper, Vulpia myuros, Medicago lupulina, Aira caryophyllea, Lythrum portula, Melilotus officinalis, and Poa annua). Twelve of these new species were observed only in new-surface vegetation plots, but the other 22 species invaded established community types in addition or instead, most often dunegrass communities. Bare ground created by sediment deposition may have facilitated establishment by these short-lived, disturbance-adapted species, particularly on new surfaces and perhaps also in established communities.
However, the proportion of total species richness in the delta that was composed of introduced species remained unchanged from 2007 to 2018 at 35%, which was slightly elevated relative to typical riparian floras (Tullos et al., 2016). Further, dam removal did not increase plot-scale introduced species richness or abundance. Introduced species richness per plot in established plant communities declined during and after dam removal (Table S7), indicating that introduced species that were present before dam removal became less frequent during this period, sufficient to more than counterbalance the influx of new introduced species. New-surface vegetation had similar introduced species richness to established communities, and higher introduced species cover only than late-successional, mixed riparian forest communities (Table S3), suggesting that the freshly disturbed new surfaces did not facilitate introduced species to a greater extent than established plant communities in the delta.
Results from a recent study of Elwha riparian vegetation upstream of the delta suggest that some of the introduced species in the delta may have reached the delta via hydrochory from upstream seed sources (Brown et al., 2022). Of the 76 introduced species we identified in the delta, ~70% (54) were also observed in upstream riparian areas, including >50% (18) of the introduced species that invaded the delta during and after dam removal. An additional 44 introduced species were observed upstream but not in the delta, including 21 annual/biennials, suggesting potential for additional invasion from upstream sources in the future.
Short-lived weedy plants that initially colonize disturbed areas are often displaced over time by later-successional perennials (Bazzaz, 1996). The future status of introduced species in the delta will depend on outcomes of ongoing colonization and competition by native and introduced annuals and perennials as these communities continue to develop.
4.7 Will restored coastal habitat in the delta persist?
Long-term persistence of new coastal habitat in the Elwha River delta is uncertain. As downstream transport of former reservoir sediment decreases and the river gradually returns to a quasi-equilibrium natural sediment regime, it is unclear whether ongoing sediment inputs will be sufficient to maintain the expanded delta. River sediment loads declined after dam removal was complete, but they were still elevated at 2.8× the estimated natural sediment load in 2016 (Ritchie et al., 2018). Accordingly, delta progradation continued after dam removal in 2014–2016, although more slowly than during dam removal (Figure 2A; Foley et al., 2017b). The net loss of 4.5 ha of new surfaces in the delta in 2016–2018 suggests that river sediment loads declined further during this period, such that shoreline erosion outweighed deposition of river-transported sediment, as sediments in the former reservoirs and downstream river corridor continued to stabilize and sediment transport gradually approached the natural sediment regime. As a result, ~10% (1.6 ha) of new coastal vegetation in the delta was lost in 2016–2018 (Figure 4), mainly to channel migration and landward migration of the beach east of the river mouth (Figures 2D, E). A series of “sedimentation waves” along the shoreline in 2015, 2017, and 2018 eroded surfaces east of the river mouth, re-depositing the sediment farther down the coast (Warrick et al., 2019).
Long-term persistence and/or expansion of the remaining 90% of new coastal vegetation in the delta will depend on the balance between ongoing erosional and depositional processes, as fluvial and marine forces continue to transport and rework former reservoir sediment in the context of the restored natural sediment regime (Ritchie et al., 2018). New vegetation is most likely to persist on higher new surfaces (e.g., the former beach), but also may persist on relatively protected, lower surfaces (e.g., new lagoons and their margins). In particular, vegetation on some lower surfaces may persist by generating positive feedbacks in which increasingly dense and structurally diverse plant communities facilitate sediment deposition, accumulate organic matter, develop complex root systems, and thereby create and maintain higher, more stable geomorphic surfaces (Miller et al., 2008; Nardin and Edmonds, 2014; Larsen, 2019; Weisscher et al., 2022).
4.8 Insights for coastal responses to future large dam removals
Rapid vegetation colonization and development on new surfaces in the Elwha River delta suggest that coastal surfaces created by dam removal can quickly support plant communities dominated by locally common, native species. The Elwha River dam removals were exceptional, however, in the magnitude of sediment released and their proximity to the coast (Foley et al., 2017b), resulting in larger, longer-lasting morphological changes in the delta than other large dam removals to date (Ritchie et al., 2018). Expansion of coastal habitat during and after dam removal depends on the ability of the river to mobilize and transport large quantities of former reservoir sediments to the coast, and then to retain those sediments within the delta and estuary. These processes will vary among dam removals depending on geographic and landscape context, reservoir sediment characteristics, dam removal strategies, downstream channel characteristics, and more (Foley et al., 2017a). In particular, dam removals that are designed to minimize mobilization of reservoir sediment in order to protect downstream infrastructure are unlikely to create substantial new coastal habitat (East et al., 2023). Coastal habitat also may respond differently to removal of dams that substantially alter streamflow, because the restored natural flow regime is likely to influence coastal geomorphic and vegetation dynamics, but to date few dams (and no large dams) that substantially alter streamflow have been removed and studied (Foley et al., 2017a).
5 Conclusion
Coastal responses to the Elwha River dam removals suggest that sediment pulses during large dam removal have potential to restore substantial coastal wetland habitat within a few years of dam removal, without negatively affecting established coastal plant communities. However, the long-term development and longevity of this restored habitat is not yet known. Vegetation establishment, persistence, and development on new coastal surfaces formed during dam removal depends on surface stability, elevation, exposure to fluvial and marine forces, and soil characteristics, all of which may change over time. Long-term monitoring of the Elwha River and future large dam-removals near coasts is needed to determine the long-term efficacy of large dam removal for restoring coastal wetland habitat under different conditions.
Data availability statement
The datasets presented in this study can be found in online repositories. The names of the repository/repositories and accession number(s) can be found below: LP, PS, SA, IM and Ritchie, A. C. (2023). Vegetation and geomorphic surfaces in the Elwha River delta, Washington, after dam removal, derived from 2016 and 2018 aerial imagery and 2007, 2014, and 2018 field surveys. US Geological Survey Data Release. doi: 10.5066/P9O6NML1.
Author contributions
LP wrote the original draft, performed the statistical analyses, and created the figures. PS conceived of and administered the project, designed the methodology, collected field data, and edited the manuscript. SA performed GIS analyses and interpretation and edited the manuscript. IM performed GIS analyses and interpretation and edited the manuscript. All authors contributed to the article and approved the submitted version.
Acknowledgments
We thank the Lower Elwha Klallam Tribe for logistical support and access to field sites. Many people assisted with data collection, including Vanessa Beauchamp, Matthew Beirne, Erin Cubley, Tracy Fuentes, Allyce Miller, Laurel Moulton, Jamie Michel, Rebecca Paradis, Cynthia Pritekel, Sonny Sampson, Jarrett Schuster, Justin Stapleton, Cody Thomas, and Kimberly Williams. This research was funded by the U.S. Geological Survey, Ecosystems Mission Area. Any use of trade, firm, or product names is for descriptive purposes only and does not imply endorsement by the U.S. Government.
Conflict of interest
The authors declare that the research was conducted in the absence of any commercial or financial relationships that could be construed as a potential conflict of interest.
Publisher's note
All claims expressed in this article are solely those of the authors and do not necessarily represent those of their affiliated organizations, or those of the publisher, the editors and the reviewers. Any product that may be evaluated in this article, or claim that may be made by its manufacturer, is not guaranteed or endorsed by the publisher.
Supplementary material
The Supplementary Material for this article can be found online at: https://www.frontiersin.org/articles/10.3389/fevo.2023.1233903/full#supplementary-material
References
Barbier E. B., Hacker S. D., Kennedy C., Koch E. W., Stier A. C., Silliman B. R. (2011). The value of estuarine and coastal ecosystem services. Ecol. Monogr. 81, 169–193. doi: 10.1890/10-1510.1
Bates D., Machler M., Bolker B. M., Walker S. C. (2015). Fitting linear mixed-effects models using lme4. J. Stat. Softw. 67, 1–48. doi: 10.18637/jss.v067.i01
Bazzaz F. A. (1996). Plants in Changing Environments: Linking Physiological, Population, and Community Ecology (Cambridge, UK: Cambridge University Press).
Bellmore J. R., Pess G. R., Duda J. J., O'Connor J. E., East A. E., Foley M. M., et al. (2019). Conceptualizing ecological responses to dam removal: if you remove it, what's to come? Bioscience 69, 26–39. doi: 10.1093/biosci/biy152
Besset M., Anthony E. J., Bouchette F. (2019). Multi-decadal variations in delta shorelines and their relationship to river sediment supply: an assessment and review. Earth-Sci Rev. 193, 199–219. doi: 10.1016/j.earscirev.2019.04.018
Brooks M. E., Kristensen K., van Benthem K. J., Magnusson A., Berg C. W., Nielson A., et al. (2017). glmmTMB balances speed and flexibility among packages for zero-inflated generalized linear mixed modeling. R J. 9, 378–400. doi: 10.32614/RJ-2017-066
Brophy L. S., Greene C. M., Hare V., Holycross B., Lanier A., Heady W. N., et al. (2019). Insights into estuary habitat loss in the western United States using a new method for mapping maximum extent of tidal wetlands. PloS One 14, 1–34. doi: 10.1371/journal.pone.0218558
Brown R. L., Thomas C. C., Cubley E. S., Clausen A. J., Shafroth P. B. (2022). Does large dam removal restore downstream riparian vegetation diversity? Testing predictions on the Elwha River. Ecol. Appl. 32, 1–24. doi: 10.1002/eap.2591
Cadier C., Bayraktarov E., Piccolo R., Adame M. F. (2020). Indicators of coastal wetlands restoration success: a systematic review. Front. Mar. Sci. 7. doi: 10.3389/fmars.2020.600220
Chenoweth J., Bakker J. D., Acker S. A. (2022). Planting, seeding, and sediment impact restoration success following dam removal. Restor. Ecol. 30, 1–13. doi: 10.1111/rec.13506
Curran C. A., Konrad C. P., Higgins J. L., Bryant M. K. (2009). “Estimates of sediment load prior to dam removal in the Elwha River, Clallam County, Washington”. US Geological Survey Scientific Investigations Report 2009-5221 (Reston, VA: US Geological Survey).
Davidson N. C. (2014). How much wetland has the world lost? Long term and recent trends in global wetland area. Mar. Freshw. Res. 65, 934–941. doi: 10.1071/Mf14173
Duda J. J., Warrick J. A., Magirl C. S. (2011). “Coastal and lower Elwha River, Washington, prior to dam removal - history, status, and defining characteristics", in Coastal Habitats of the Elwha River, Washington - Biological and Physical Patterns and Processes Prior to Dam Removal,” in US Geological Survey Scientific Investigations Report 2011-5120. Eds. Duda J. J., Warrick J. A., Magirl C. S. (Reston, VA: US Geological Survey), 1–25.
East A. E., Harrison L. R., Smith D. P., Logan J. B., Bond R. M. (2023). Six years of fluvial response to a large dam removal on the Carmel River, California, USA. Earth Surface Processes Landforms 48, 1487–1501. doi: 10.1002/esp.5561
Elliot M., Mander L., Mazik K., Simenstad C., Valesini F., Whitfield A., et al. (2016). Ecoengineering with ecohydrology: successes and failures in estuarine restoration. Estuarine Coast. Shelf Sci. 176, 12–35. doi: 10.1016/j.ecss.2016.04.00
Elsey-Quirk T., Graham S. A., Mendelssohn I. A., Snedden G., Day J. W., Twilley R. R., et al. (2019). Mississippi River sediment diversions and coastal wetland sustainability: synthesis of responses to freshwater, sediment, and nutrient inputs. Estuar. Coast. Shelf Sci. 221, 170–183. doi: 10.1016/j.ecss.2019.03.002
Fagherazzi S., Carniello L., D'Alpaos L., Defina A. (2006). Critical bifurcation of shallow microtidal landforms in tidal flats and salt marshes. Proc. Natl. Acad. Sci. U.S.A. 103, 8337–8341. doi: 10.1073/pnas.0508379103
Ferguson R. I., Church M., Rennie C. D., Venditti J. G. (2015). Reconstructing a sediment pulse: modeling the effect of placer mining on Fraser River, Canada. J. Geophysical Res-Earth Surface 120, 1436–1454. doi: 10.1002/2015jf003491
Fivash G. S., Temmink R. J. M., D'Angelo M., van Dalen J., Lengkeek W., Didderen K., et al. (2021). Restoration of biogeomorphic systems by creating windows of opportunity to support natural establishment processes. Ecol. Appl. 31, 1–16. doi: 10.1002/eap.2333
Foley M. M., Bellmore J. R., O'Connor J. E., Duda J. J., East A. E., Grant G. E., et al. (2017a). Dam removal: listening in. Water Resour. Res. 53, 5229–5246. doi: 10.1002/2017wr020457
Foley M. M., Warrick J. A., Ritchie A., Stevens A. W., Shafroth P. B., Duda J. J., et al. (2017b). Coastal habitat and biological community response to dam removal on the Elwha River. Ecol. Monogr. 87, 552–577. doi: 10.1002/ecm.1268
Friedman J. M., Osterkamp W. R., Lewis W. M. (1996). Channel narrowing and vegetation development following a Great Plains flood. Ecology 77, 2167–2181. doi: 10.2307/2265710
Gonzalez E., Shafroth P. B., Lee S. R., Ostoja S. M., Brooks M. L. (2020). Combined effects of biological control of an invasive shrub and fluvial processes on riparian vegetation dynamics. Biol. Invasions 22, 2339–2356. doi: 10.1007/s10530-020-02259-9
Gregory S. V., Swanson F. J., Mckee W. A., Cummins K. W. (1991). An ecosystem perspective of riparian zones. Bioscience 41, 540–551. doi: 10.2307/1311607
Grime J. P. (1977). Evidence for the existence of three primary strategies in plants and its relevance to ecological and evolutionary theory. Am. Nat. 111, 1169–1194. doi: 10.1086/283244
Hartig F. (2021) DHARMa: Residual Diagnostics for Hierarchical (multi-level / mixed) Regression Models. R package version 0.4.4. Available at: https://CRAN.R-project.org/package=DHARMa.
Hu M. Y., Ge Z. M., Li Y. L., Li S. H., Tan L. S., Xie L. N., et al. (2019). Do short-term increases in river and sediment discharge determine the dynamics of coastal mudflat and vegetation in the Yangtze Estuary? Estuar. Coast. Shelf Sci. 220, 176–184. doi: 10.1016/j.ecss.2019.03.004
Jia X., J. Y., Wang C., Liu B., Zheng H., Zou Y., et al. (2023). Predicting the regime shift of coastal wetlands based on the bistability features in the intertidal zone: a case study in the Liaohe estuary. Front. Mar. Sci. 10. doi: 10.3389/fmars.2023.1126682
Kui L., Stella J. C. (2016). Fluvial sediment burial increases mortality of young riparian trees but induces compensatory growth response in survivors. For. Ecol. Manage. 366, 32–40. doi: 10.1016/j.foreco.2016.02.001
Larsen L. G. (2019). Multiscale flow-vegetation-sediment feedbacks in low-gradient landscapes. Geomorphology 334, 165–193. doi: 10.1016/j.geomorph.2019.03.009
Lenth R. V. (2021) emmeans: Estimated Marginal Means, aka Least-Squares Means. R package version 1.7.0. Available at: https://CRAN.R-project.org/package=emmeans.
Lowe B. J., Watts R. J., Roberts J., Robertson A. (2010). The effect of experimental inundation and sediment deposition on the survival and growth of two herbaceous riverbank plant species. Plant Ecol. 209, 57–69. doi: 10.1007/s11258-010-9721-1
Lundholm J. T. (2009). Plant species diversity and environmental heterogeneity: spatial scale and competing hypotheses. J. Vegetation Sci. 20, 377–391. doi: 10.1111/j.1654-1103.2009.05577.x
Major J. J., East A. E., O'Connor J. E., Grant G. E., Wilcox A. C., Magirl C. S., et al. (2017). “Geomorphic responses to dam removal in the United States: a two-decade perspective,” in Gravel-Bed Rivers: Processes and Disasters. Eds. Tsutsumi D., Laronne J. B. (Chichester, UK: Wiley-Blackwell).
Meade R. H. (1996). “River-sediment inputs to major deltas",” in Sea-Level Rise and Coastal Subsidence. Coastal Systems and Continental Margins, volume 2. Eds. Milliman J. D., Haq B. U. (Dordecht: Springer).
Miller R. L., Fram M. S., Fujii R., Wheeler G. (2008). Subsidence reversal in a re-established wetland in the Sacramento-San Joaquin Delta, California, USA. San Francisco Estuary Watershed Sci. 6, 1–20. doi: 10.15447/sfews.2008v6iss3art1
Miller I. M., Ogston A., Dolan J. (2015). “Sedimentology of intertidal sediment deposits after dam removal on a coastal river,” in The Proceedings of Coastal Sediments 2015, San Diego, USA, 11-15 May 2015. Eds. Wang P., Rosati J. D., Cheng J. (Singapore: World Scientific).
Naiman R. J., Decamps H. (1997). The ecology of interfaces: riparian zones. Annu. Rev. Ecol. Syst. 28, 621–658. doi: 10.1146/annurev.ecolsys.28.1.621
Nardin W., Edmonds D. A. (2014). Optimum vegetation height and density for inorganic sedimentation in deltaic marshes. Nat. Geosci. 7, 722–726. doi: 10.1038/Ngeo2233
Norton J. B., Monaco T. A., Norton U. (2007). Mediterranean annual grasses in western North America: kids in a candy store. Plant Soil 298, 1–5. doi: 10.1007/s11104-007-9364-8
O'Connor J. E., Duda J. J., Grant G. E. (2015). 1000 dams down and counting. Science 348, 496–497. doi: 10.1126/science.aaa9204
Oksanen J., Blanchet F. G., Friendly M., Kindt R., Legendre P., McGlinn D., et al. (2020) Vegan: Community Ecology Package. R package version 2.5-7. Available at: https://CRAN.R-project.org/package=vegan.
Perry L. G., Shafroth P. B., Alfieri S. J., Miller I. M., Ritchie A. C. (2023). “Vegetation and geomorphic surfaces in the Elwha River delta, Washington, after dam removal, derived from 2016 and 2018 aerial imagery and 2007, 2014, and 2018 field surveys, US Geological Survey Data Release. ScienceBase: US Geological Survey. doi: 10.5066/P9O6NML1
Pierson T. C., Major J. J. (2014). Hydrogeomorphic effects of explosive volcanic eruptions on drainage basins. Annu. Rev. Earth Planetary Sci. 42, 469–507. doi: 10.1146/annurev-earth-060313-054913
Prach K., Chenoweth J., del Moral R. (2019). Spontaneous and assisted restoration of vegetation on the bottom of a former water reservoir, the Elwha River, Olympic National Park, WA, USA. Restor. Ecol. 27, 592–599. doi: 10.1111/rec.12915
Randle T. J., Bounty J. A., Ritchie A., Wille K. (2015). Large-scale dam removal on the Elwha River, Washington, USA: erosion of reservoir sediment. Geomorphology 246, 709–728. doi: 10.1016/j.geomorph.2014.12.045
Ravot C., Laslier M., Hubert-Moy L., Dufour S., Le Coeur D., Bernez I. (2019). Large dam removal and early spontaneous riparian vegetation recruitment on alluvium in a former reservoir: Lessons learned from the pre-removal phase of the Sélune River project (France). River Res. Appl. 36, 894–906. doi: 10.1002/rra.3535
R-Core-Team (2021). R: A Language and Environment for Statistical Computing, version 4.1.0 (Vienna, Austria: R Foundation for Statistical Computing). Available at: https://www.R-project.org/.
Ritchie A. C., Warrick J. A., East A. E., Magirl C. S., Stevens A. W., Bountry J. A., et al. (2018). Morphodynamic evolution following sediment release from the world's largest dam removal. Sci. Rep. 8, 1–13. doi: 10.1038/s41598-018-30817-8
Shafroth P. B., Friedman J. M., Auble G. T., Scott M. L., Braatne J. H. (2002). Potential responses of riparian vegetation to dam removal. Bioscience 52, 703–712. doi: 10.1641/0006-3568(2002)052[0703:Prorvt]2.0.Co;2
Shafroth P. B., Fuentes T. L., Pritekel C., Beirne M., Beauchamp V. B. (2011). Vegetation of the Elwha river estuary, in Coastal Habitats of the Elwha River, Washington ‐ Biological and Physical Patterns and Processes Prior to Dam Removal, US Geological Survey Scientific Investigations Report 2011-5120. Eds. Duda J. J., Warrick J. A., Magirl C. S. (Reston, VA: US Geological Survey), 225–247.
Shafroth P. B., Perry L. G., Rose C. A., Braatne J. H. (2016). Effects of dams and geomorphic context on riparian forests of the Elwha River, Washington. Ecosphere 7, 1–24. doi: 10.1002/ecs2.1621
Stanford J. A., Lorang M. S., Hauer F. R. (2005). The shifting habitat mosaic of river ecosystems. Internationale Vereinigung Für Theoretische Und Angewandte Limnol: Verhandlungen 29, 123–136. doi: 10.1080/03680770.2005.11901979
Stevens A. W., Gelfenbaum G., Warrick J. A., Miller I. M., Weiner H. M. (2017). “Bathymetry, topography, and sediment grain-size data from the Elwha River Delta, Washington”, U.S. Geological Survey Data Release (Reston, VA: US Geological Survey).
Stromberg J. C., Richter B. D., Patten D. T., Wolden L. G. (1993). Response of a Sonoran riparian forest to a 10-year return flood. Great Basin Nat. 53, 118–130. Available at: https://www.jstor.org/stable/41712765.
US Geological Survey. (2023). USGS 12045500 Elwha River at McDonald BR near Port Angeles, WA, in USGS Water Data for the Nation. In: U.S. Geological Survey National Water Information System database. Available at: https://waterdata.usgs.gov/nwis/dv?referred_module=sw&site_no=12045500 (Accessed March 23, 2023).
Sutherland D. G., Ball M. H., Hilton S. J., Lisle T. E. (2002). Evolution of a landslide-induced sediment wave in the Navarro River, California. Geol Soc. America Bull. 114, 1036–1048. doi: 10.1130/0016-7606(2002)114<1036:Eoalis>2.0.Co;2
Tessler Z. D., Vorosmarty C. J., Overeem I., Syvitski J. P. M. (2018). A model of water and sediment balance as determinants of relative sea level rise in contemporary and future deltas. Geomorphology 305, 209–220. doi: 10.1016/j.geomorph.2017.09.040
Tullos D. D., Collins M. J., Bellmore J. R., Bountry J. A., Connolly P. J., Shafroth P. B., et al. (2016). Synthesis of common management concerns associated with dam removal. J. Am. Water Resour. Assoc. 52, 1179–1206. doi: 10.1111/1752-1688.12450
Van Pelt R., O'Keefe T. C., Latterell J. J., Naiman R. J. (2006). Riparian forest stand development along the Queets River in Olympic National Park, Washington. Ecol. Monogr. 76, 277–298. doi: 10.1890/05-0753
Wang C., Temmerman S. (2013). Does biogeomorphic feedback lead to abrupt shifts between alternative landscape states?: an empirical study on intertidal flats and marshes. J. Geophysical Res-Earth Surface 118, 229–240. doi: 10.1029/2012jf002474
Warrick J. A., Bountry J. A., East A. E., Magirl C. S., Randle T. J., Gelfenbaum G., et al. (2015). Large-scale dam removal on the Elwha River, Washington, USA: source-to-sink sediment budget and synthesis. Geomorphology 246, 729–750. doi: 10.1016/j.geomorph.2015.01.010
Warrick J. A., George D. A., Gelfenbaum G., Ruggiero P., Kaminsky G. M., Beirne M. (2009). Beach morphology and change along the mixed grain-size delta of the dammed Elwha River, Washington. Geomorphology 111, 136–148. doi: 10.1016/j.geomorph.2009.04.012
Warrick J. A., Stevens A. W., Miller I. M., Harrison S. R., Ritchie A. C., Gelfenbaurn G. (2019). World's largest dam removal reverses coastal erosion. Sci. Rep. 9, 1–12. doi: 10.1038/s41598-019-50387-7
Weisscher S. A. H., Van den Hoven K., Pierik H. J., Kleinhans M. G. (2022). Building and raising land: mud and vegetation effects in infilling estuaries. J. Geophysical Res-Earth Surface 127, 1–24. doi: 10.1029/2021JF006298
Keywords: coastal wetland restoration, dam removal, ecological succession, pioneer geomorphic surfaces, riparian, river delta, riverine estuary, sediment deposition
Citation: Perry LG, Shafroth PB, Alfieri SJ and Miller IM (2023) Coastal vegetation responses to large dam removal on the Elwha River. Front. Ecol. Evol. 11:1233903. doi: 10.3389/fevo.2023.1233903
Received: 02 June 2023; Accepted: 01 September 2023;
Published: 29 September 2023.
Edited by:
Laura Soissons, INRAE Bretagne Normandie, FranceReviewed by:
Ivan Bernez, Institut Agro Agrocampus Ouest Inrae Rennes, FranceGreg Fivash, Royal Netherlands Institute for Sea Research (NIOZ), Netherlands
Copyright © 2023 Perry, Shafroth, Alfieri and Miller. This is an open-access article distributed under the terms of the Creative Commons Attribution License (CC BY). The use, distribution or reproduction in other forums is permitted, provided the original author(s) and the copyright owner(s) are credited and that the original publication in this journal is cited, in accordance with accepted academic practice. No use, distribution or reproduction is permitted which does not comply with these terms.
*Correspondence: Laura G. Perry, bHBlcnJ5QGNvbG9zdGF0ZS5lZHU=