 Lina Liang1
 Xiumei Tang
95% of researchers rate our articles as excellent or good
Learn more about the work of our research integrity team to safeguard the quality of each article we publish.
Find out more
ORIGINAL RESEARCH article
Front. Ecol. Evol. , 23 August 2023
Sec. Urban Ecology
Volume 11 - 2023 | https://doi.org/10.3389/fevo.2023.1233388
This article is part of the Research Topic Evaluation of Urban Ecological Security and Measurement of Urban Ecological Resilience View all 18 articles
Agricultural green development (AGD) plays an important role in achieving a sustainable society. This paper evaluates the AGD level of Beijing from 1978 to 2022 by means of a comprehensive evaluation method, coupling coordination degree (CCD), and grey relational degree model (GRA) with the purpose of exploring relevant stages and characteristics, as well as analyzing the characteristics of different stages and the coupling relationship of various factors and quantitatively calculating the driving factors for AGD change. The results showed that: 1) the AGD level of Beijing generally improved from 1978 to 2022, mainly involving four stages of steady rising, fluctuating, oscillating decreasing, and rapid upgrading; 2) the CCD of the development subsystems of AGD, agricultural resource utilization, agricultural environment conditions, agricultural industry development, and farmers’ living standard, all rose and the coordination type of each subsystem gradually went through a verge imbalance stage, reluctantly coordinated stage, and primary coordinated stage to an intermediate coordinated stage, and then reached a well-coordinated stage in 2019; 3) the AGD level of Beijing is influenced by economic development, the industrial structure, urbanization, technological progress, and agricultural structure. Finally, some policy suggestions to promote AGD in Beijing are put forward. This paper is of great significance to promoting the green and sustainable development of agriculture in Beijing and provides technical support and policy guidance for AGD in other regions.
Agriculture is not only the foundation of China’s national economy, but also an important barrier of ecology, and the key to the problems of Three Rural Problems (Chen et al., 2021). Since China’s reform and opening up, agriculture has developed rapidly, especially since 1978, when China generally implemented the household contract responsibility system, which greatly promoted the all-round development of rural economy. After years of development, China’s agriculture witnessed rapid growth from extensive agricultural production to green agriculture and smart agriculture (Cui et al., 2019). China’s agriculture has undergone a major transformation from collectivization to marketization and from the small-scale peasant economy to scale management and achieved remarkable results, feeding 18% of the world’s population with 8% of the world’s cultivated land. However, accompanied by economic development are many issues faced by traditional agriculture, such as the low utilization efficiency of natural resources and soil pollution. With ecological civilization and green development put on the agenda, regional development is no longer in the traditional single economy-oriented model, but emphasizes green development, coordination, and sustainability (Zhou and Liu, 2021). The 19th and 20th National Congress of China respectively proposed to revitalize rural areas and promote green development. As clearly stated in China’s “14th Five-Year Plan and the Outline of Long-term Goals in 2035”, it is necessary to accelerate AGD and continuously improve the rural ecological environment. The Strategic Plan for Rural Revitalization (2018-2022) clearly leads rural revitalization with green development. In the context of the rural revitalization strategy, it is urgent to solve how to guide rural agriculture from extensive agricultural production to efficient modern agricultural sustainable development and achieve the green transformation of agricultural development (Li and Gong, 2020). AGD is characterized by attaching great importance to agricultural economic growth, ecological environment friendliness, and social progress. It is a new agricultural development paradigm, which profoundly interprets the connotation of high-quality agricultural development. Green agriculture is essentially a new industrial revolution and technological revolution and is also an important symbol for mankind to enter the era of green civilization (Jin et al., 2020; Yin et al., 2021). Developing green agriculture is a way to achieve sustainable development and environmental protection. Actively developing green agriculture has become a strategic measure to meet international challenges.
In recent years, AGD has gradually become a research hotspot, which serves as an important way to explore the high-quality development of agriculture (Su et al., 2021). The research on green agriculture originated from ecological agriculture proposed in 1970 by W Albrech, a professor in soil science at the University of Missouri. In 1981, the American agricultural scientist Lester R Brown laid the theoretical foundation for the sustainable development of agriculture (Ma et al., 2022). In November 1996, the World Food Summit emphasized green revolution technologies such as improving new varieties (Zhang et al., 2020; Pan et al., 2021; Wang et al., 2021). In recent years, research on green agriculture has been gradually carried out in Japan, Germany, and other regions. The research has been mainly carried out from the following perspectives: Firstly, some researchers have concentrated on the concept connotations of green agriculture, including interpreting the definition of green agriculture and analyzing development trends and research priorities (Xu, 2000; Shi and Gill, 2005; Guo et al., 2020; Liu et al., 2020a). Secondly, some have focused on the evaluation indices and methods of green agriculture, of which the evaluation index system consists of resource utilization, ecological environment, social conditions, human settlements, etc. (Bastan et al., 2018; Ruan et al., 2019; Benabderrazik et al., 2021; Su et al., 2021; Hou and Wang, 2022), and evaluation methods include the comprehensive evaluation method, analytic hierarchy process, and entropy weight method (Clark et al., 1970; Cheng et al., 2018; Contesse et al., 2018; Xiao et al., 2020). Thirdly, the spatial distribution characteristics of AGD are mainly analyzed through spatial autocorrelation and hot spot analysis methods (Feng, 2019; Liu et al., 2020b; Zha et al., 2022). Fourthly, some scholars use grey relational analysis, the spatial weight matrix, and other methods to analyze the driving factors and spatial and temporal changes of AGD (Pham and Smith, 2014; Wu et al., 2017; Pigford et al., 2018). Generally speaking, scholars have carried out research on the definition of green agriculture, index system construction, temporal and spatial changes, and the coupling relationship with other related factors. At present, most of the existing studies focus on regional and provincial large-scale research objects (Wu et al., 2013; Cao, 2012), and cross-sectional data are mainly used (Zhang and Wang, 2018; Shafaei et al., 2020). Therefore, currently there is little research on the development stage of regional green agriculture (Mahmud et al., 2019; Pan et al., 2019; Sun et al., 2020).
Beijing is the capital of China, and its agricultural development stage is ahead of many other regions. It is also one of the first regions to try out green development. Drawing on lessons from existing research results, this paper constructs an index system for green agriculture development in Beijing, evaluates the changes and stages of the rural green agriculture development level over more than 40 years from 1978 to 2022, and analyzes the driving factors for its changes. The research reveals the development stages and characteristics of green agriculture and clarifies the driving factors of AGD in Beijing. The research results can not only support the sustainable development of agricultural green in Beijing, but also provide experience and program guidance for AGD in other regions.
Beijing is located in the northwest of the North China Plain. It is about 176 km long from north to south and 160 km wide from east to west, with a total area of 1,641,054 hm2. Beijing is surrounded by mountains and seas, with a vast hinterland and excellent natural conditions. Beijing is the capital of China and the political, economic, and cultural center of China, and it is also the first region in China to implement AGD. Therefore, it is of great significance to analyze the characteristics and driving factors of AGD in Beijing, so as to provide guidance for agricultural development in Beijing and similar regions. Beijing has released an action plan to basically realize the modernization of agriculture and rural areas. In the future, it will implement the “three major projects”, namely, the project to improve the ability to ensure stable production and supply, the project to build a modern agricultural development carrier, and the project to cultivate business entities and service entities. It will develop the “five major industries” of the modern seed industry, green organic agriculture, construction agriculture, characteristic agriculture, hobby farms, and rural tourism, and comprehensively improve the quality, efficiency, and competitiveness of agriculture (Figure 1).
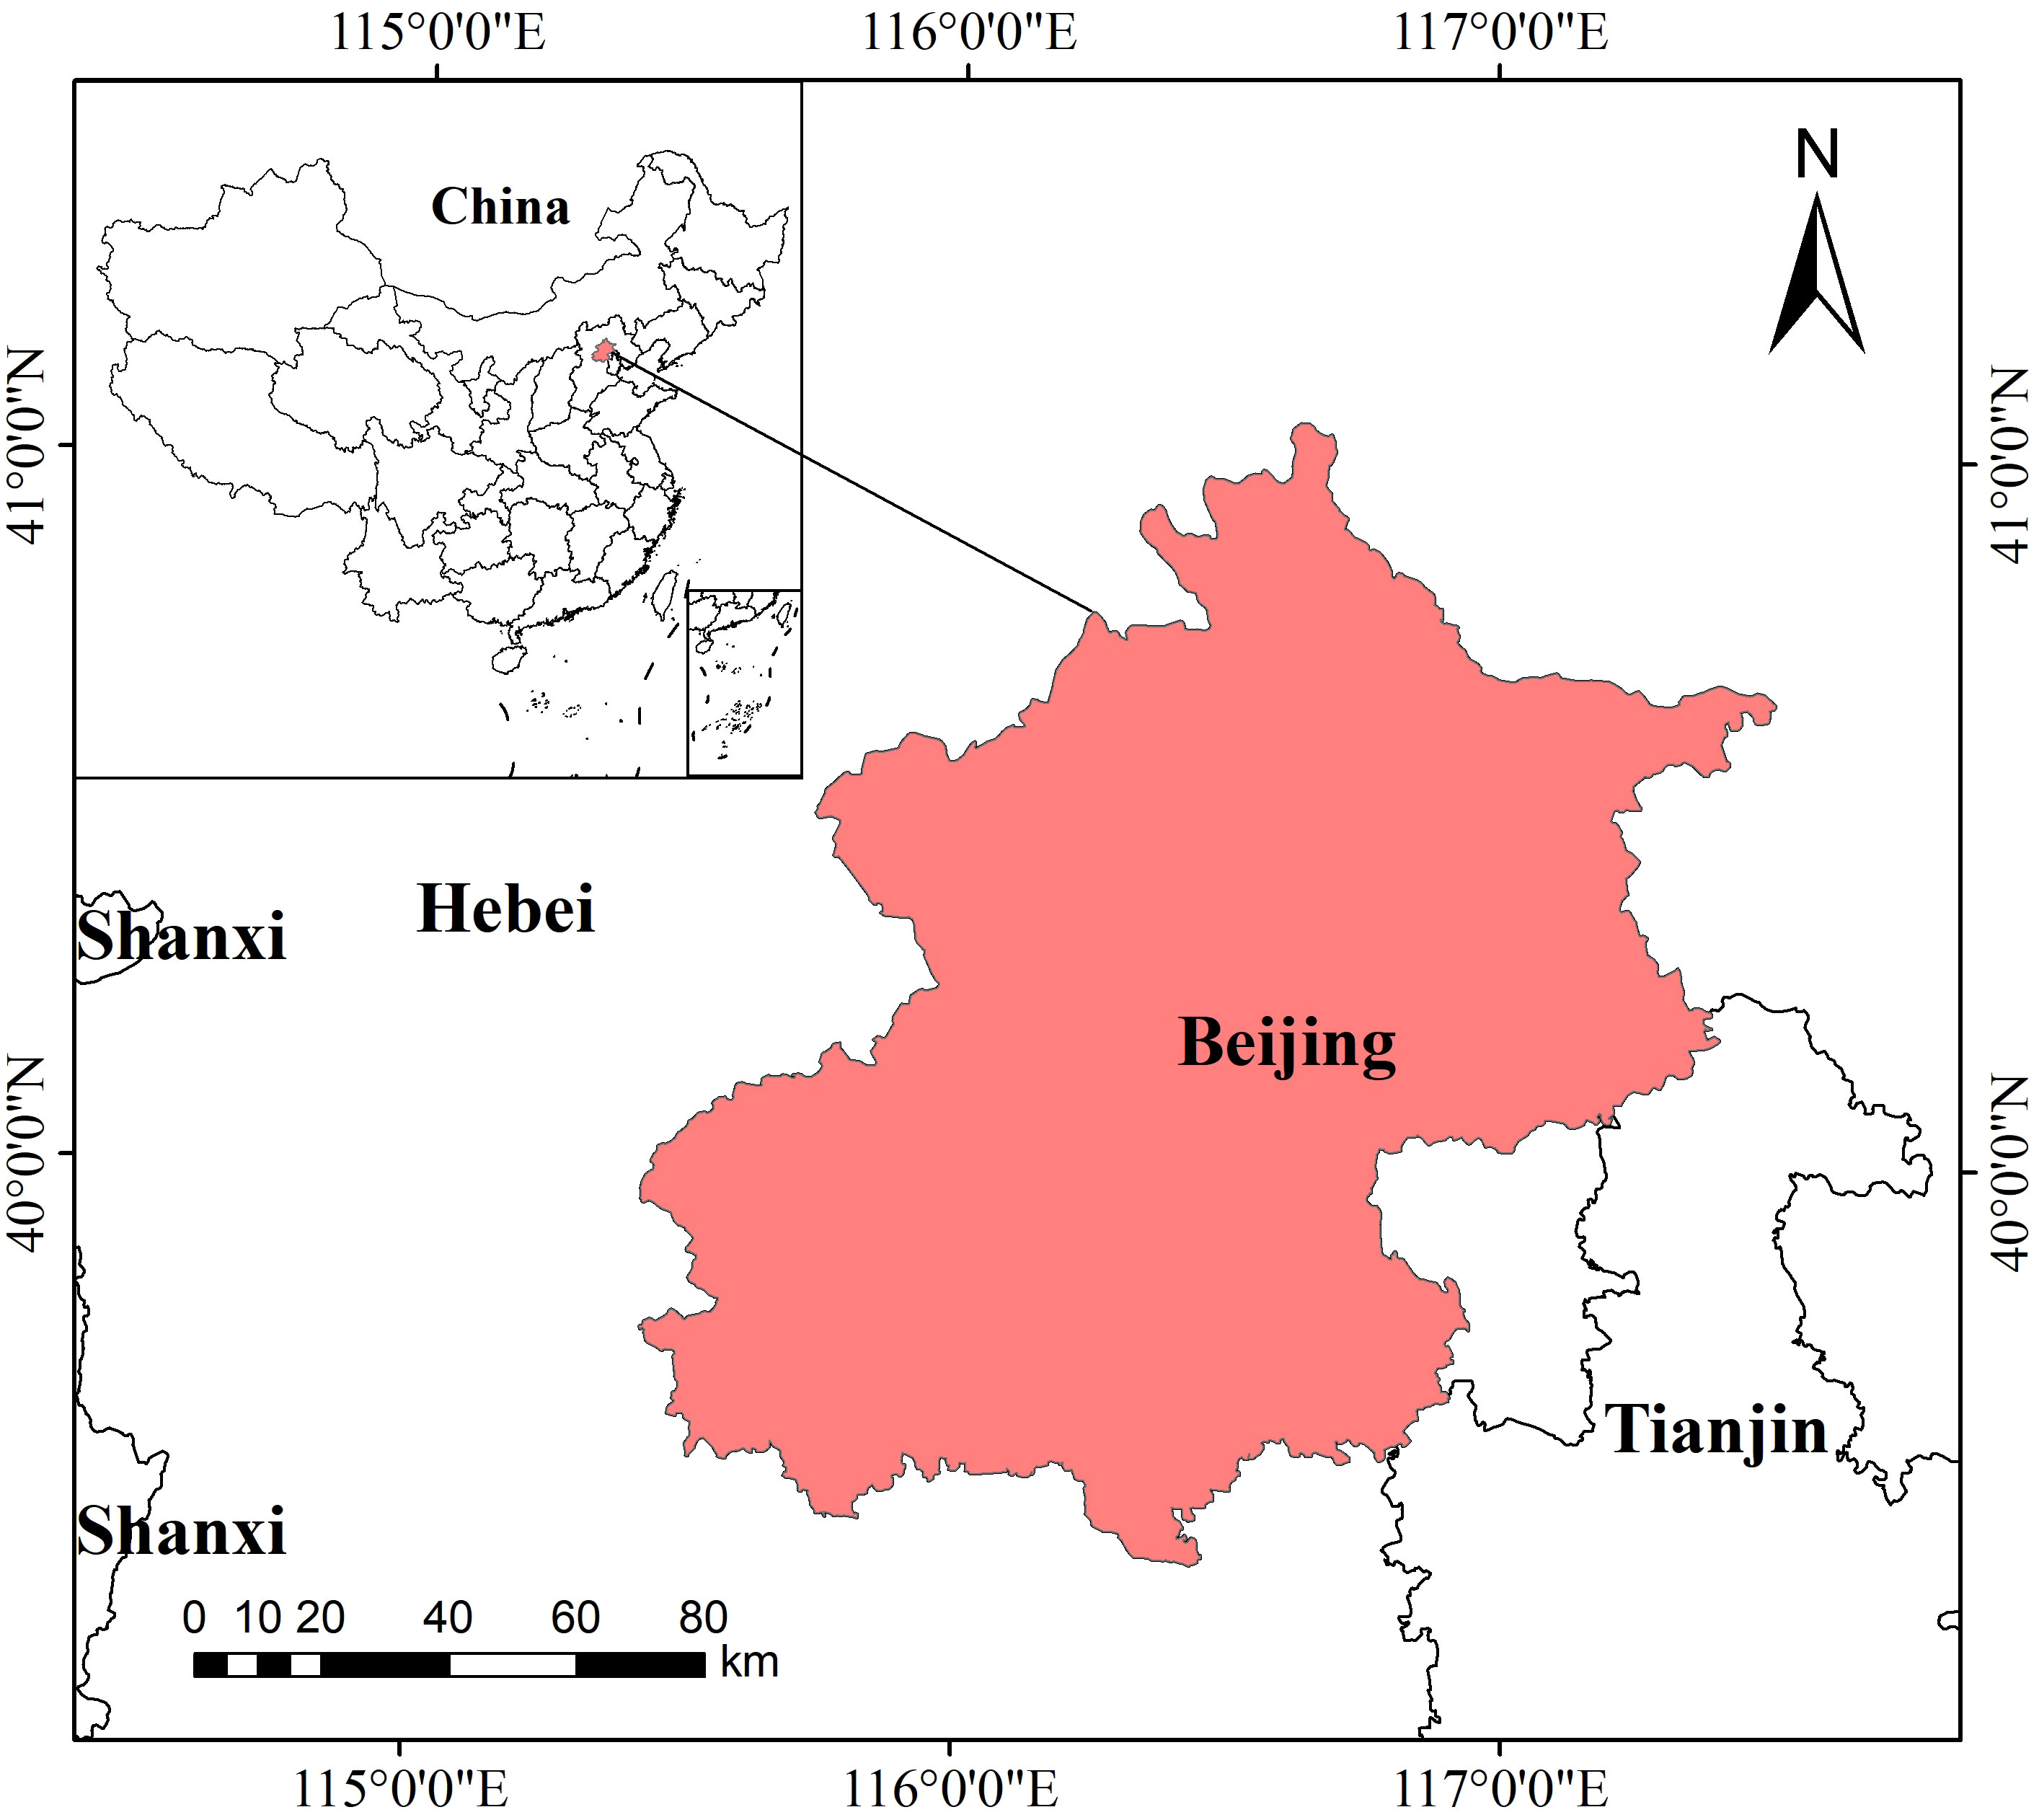
Figure 1 Study area.
This paper is structured as follows: Section 1 is the introduction; Section 2 introduces the general situation and research ideas of Beijing and introduces the data sources and research methods, including the data processing methods, index system construction, green development level evaluation, CCD model, and driving force analysis; Section 3 provides the analysis results associated with the change of AGD level, CCD change, and driving forces in Beijing from 1978 to 2022; Section 4 analyzes and discusses the results; and Section 5 summarizes the main conclusions Figure 2.
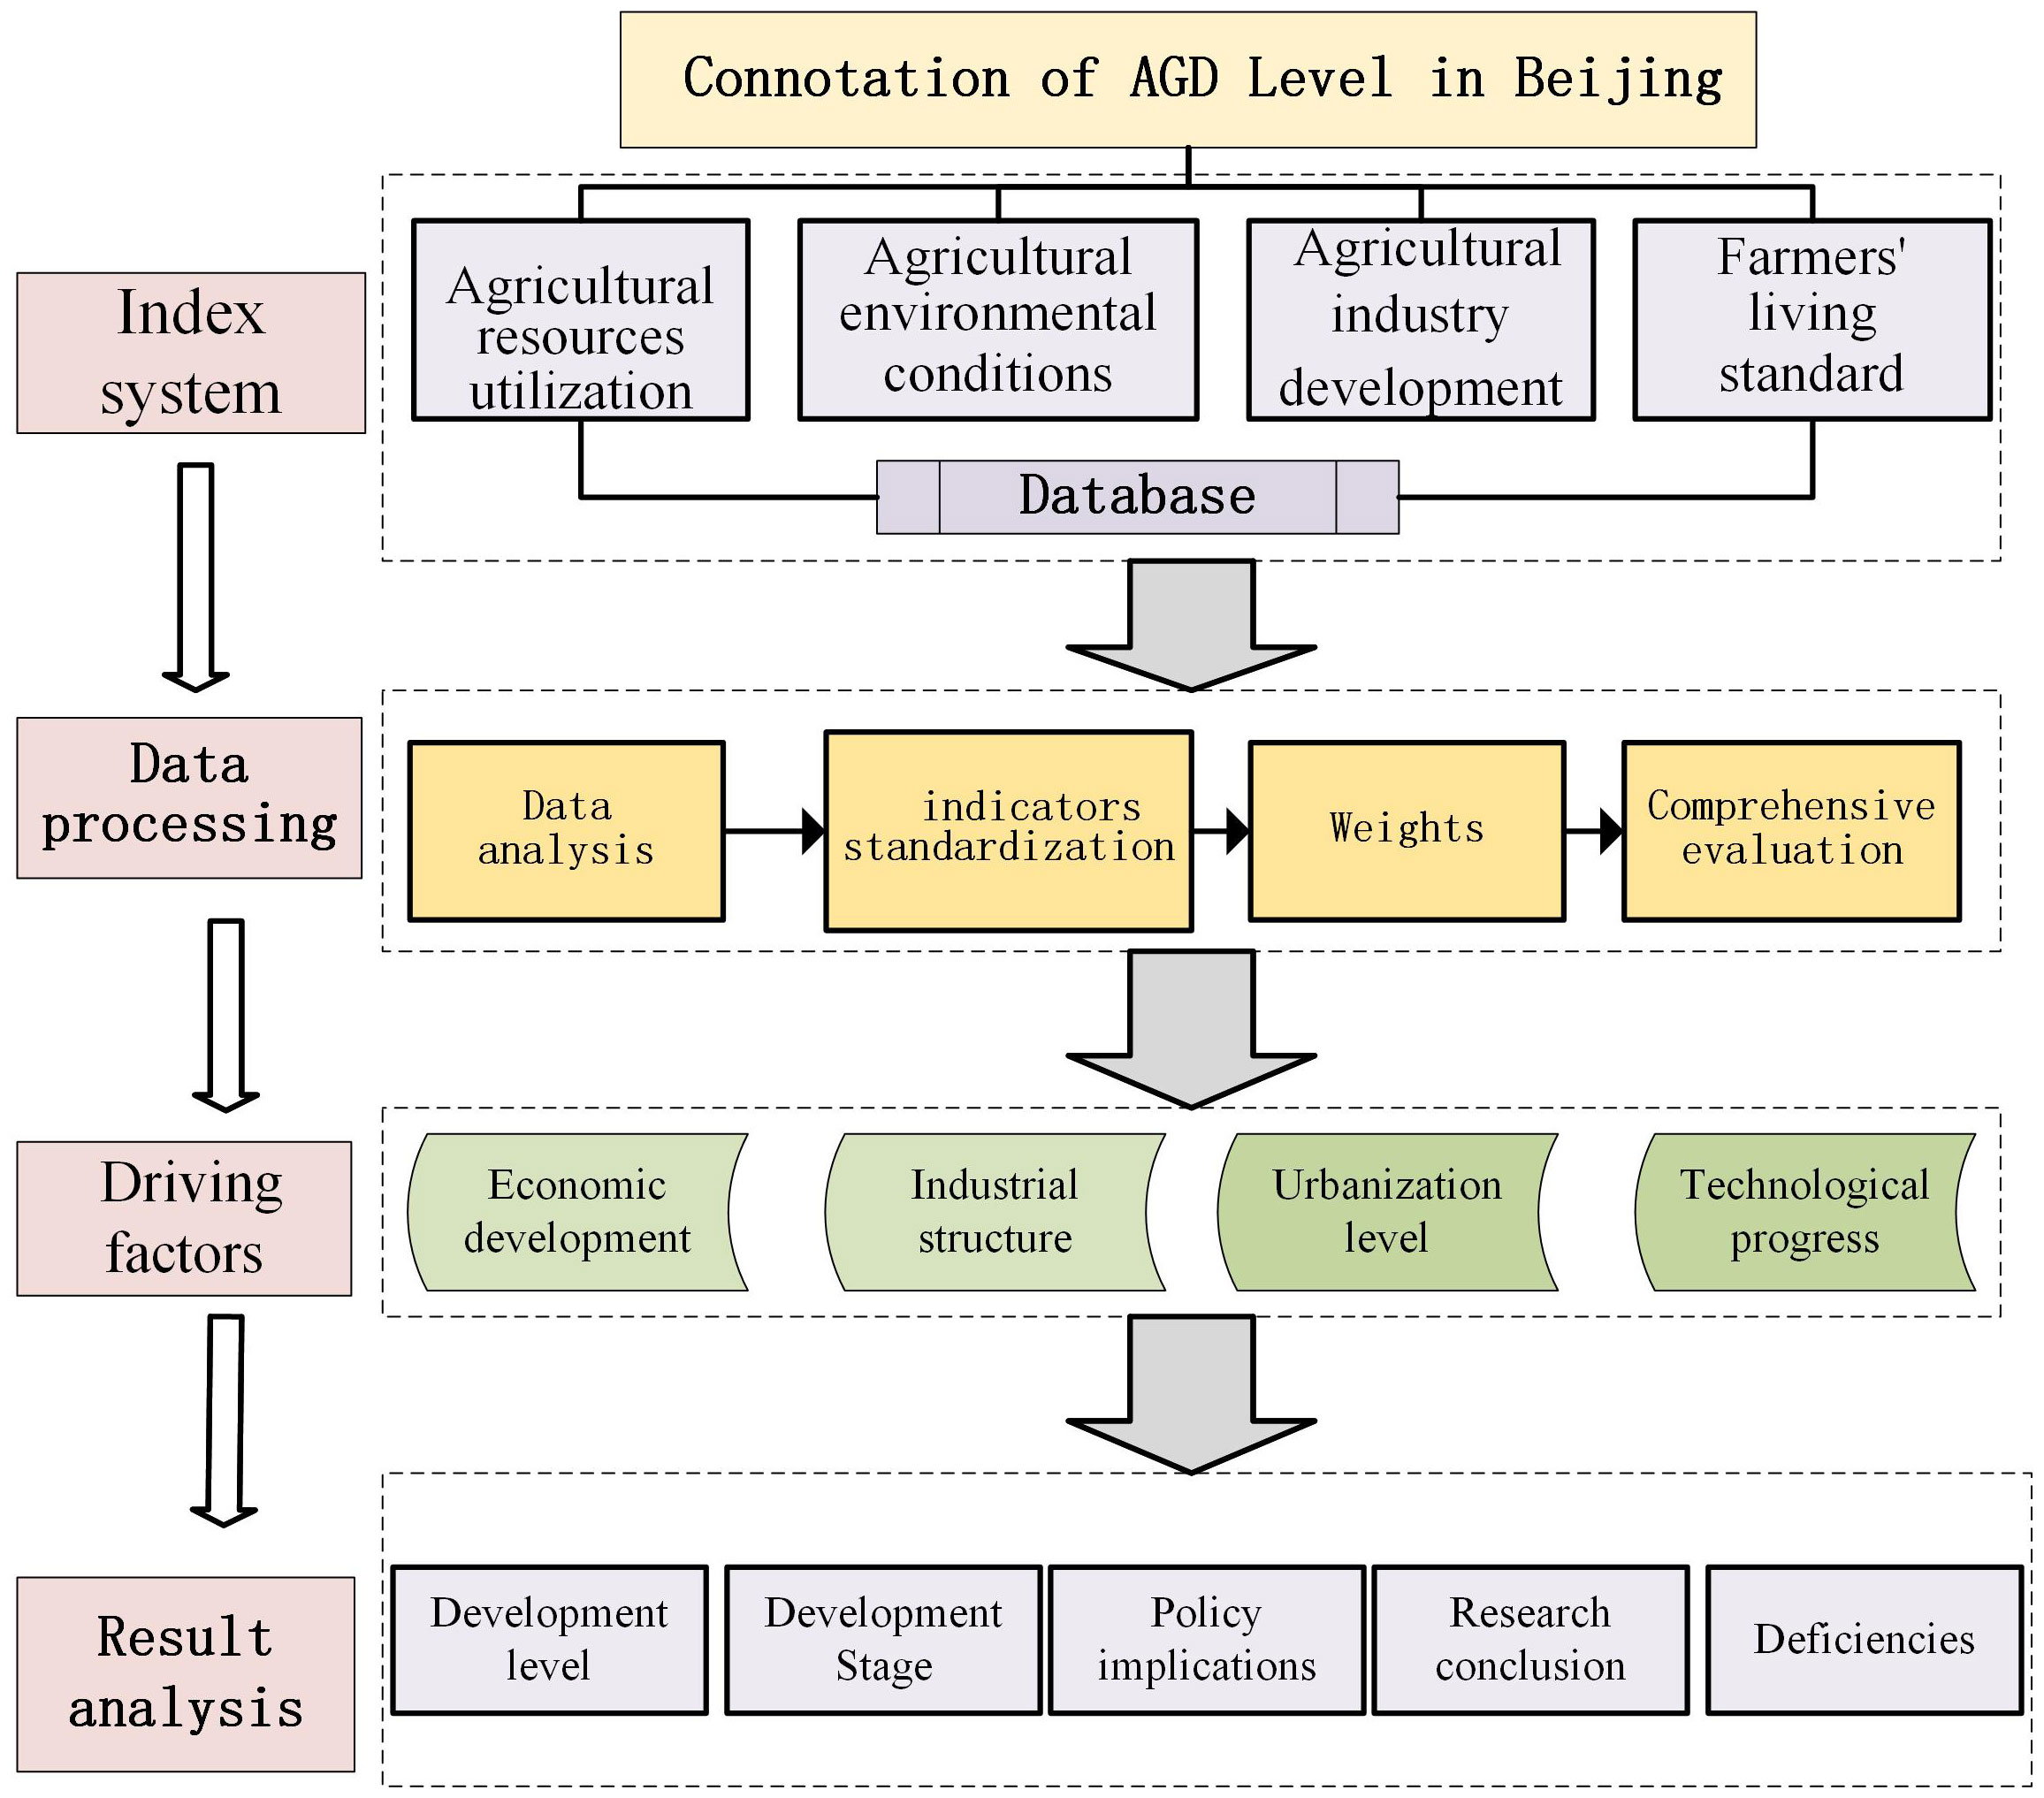
Figure 2 Research framework.
The data used in this study originated from the Beijing Statistical Yearbooks (1978-2022), China Population and Employment Statistical Yearbooks, Beijing District Statistical Yearbooks, and Beijing Municipal Government Work Reports. Referring to the latest version of economic data, the data were officially revised to make the data of different years comparable. In addition, for statistical caliber and other reasons, some data were missing, so the data trend line fitting method was adopted for data acquisition.
In order to effectively explore the AGD level and driving factors in Beijing, it is of great importance to scientifically and systematically construct an evaluation index system (Guo et al., 2023). AGD level has obvious regional differences. According to the principles of scientific, systematic, and accessible properties and drawing lessons from existing research results, this paper constructs an evaluation index system of AGD consisting of four subsystems, namely agricultural resource utilization, agricultural environment conditions, agricultural industry development, and farmers’ living standard. 1) Agricultural resource utilization mainly reflects the level of agricultural resource conservation, and resource conservation is the basic feature of AGD, which emphasizes the improvement of the utilization rate of cultivated land, water resources, agricultural machinery power, and labor productivity. This study mainly selected the number of the labor force per unit of agricultural land, land multiple cropping index, yield of cultivated land per unit area, and total power of agricultural machinery per unit sown area as evaluation indexes. 2) Agricultural environment conditions refers to the production mode that is beneficial to environmental safety and sustainable development. This study selected indicators based on the impact of agricultural development on the regional natural environment, which mainly reflects the impact of agricultural non-point source pollution on an environmental level, including fertilizer application intensity, pesticide use intensity, agricultural film application intensity, and sewage treatment rate. Sewage treatment rate is a positive indicator and the rest are negative indicators. 3) AGD also includes agricultural industry development. Only by improving regional agricultural production level and agricultural economic development can AGD be better promoted. This study mainly selected the output brought by agricultural development as indicators, including the proportion of output value of agriculture, forestry, animal husbandry, and fishery to GDP and the rural per capita output value of agriculture, forestry, animal husbandry, and fishery, all of which are positive indicators. (4) The last subsystem is farmers’ living standard. The ultimate goal of the green development of agriculture is to promote human well-being, and living standards reflect both economic and social benefits. Therefore, indicators were selected from farmers’ employment and living standards, including the proportion of township employees, the per capita disposable income of rural residents, and the rural Engel’s coefficient, all of which are positive indicators. The constructed index system is displayed in Table 1.
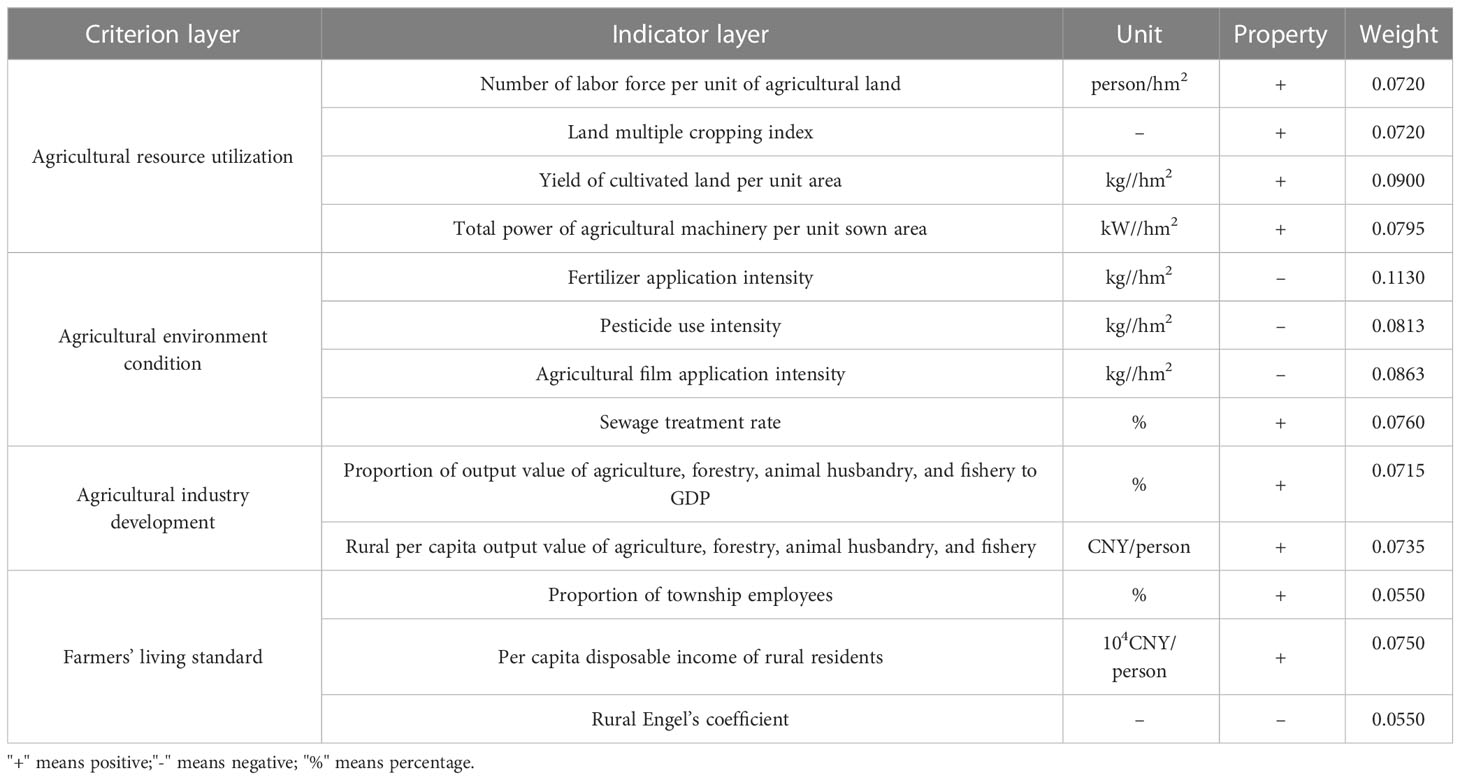
Table 1 Index system and weight of agricultural green development from 1978 to 2022 in Beijing.
As the selected indices vary in property and measurement degree, index data standardization is essential to comprehensive evaluation. Index data are standardized by means of the range standardization method, expert scoring method, order standardization method, and other methods. According to the existing research results (He et al., 2020), the range standardization method was employed in this paper to standardize the original index data. There are subjective weighting methods to determine the weight of evaluation indicators, such as the expert scoring method and analytic hierarchy process. The subjective weighting methods are simple and easy, but sometimes the results are far from objective. The objective weighting methods include the entropy weight method, deviation maximization method, and principal component analysis method, whose results are significantly affected by data. In this study, the weights calculated by the subjective weighting method (AHP) and objective weighting method (entropy method) were combined, and the Lagrange multiplier method was used to calculate the combined weights, , as shown in Table 1.
In the formula, represents the index weight calculated by analytic hierarchy process and is the index weight calculated by the entropy method.
According to the calculated standardized value and weight of each index, this study uses the multifactor comprehensive evaluation model to calculate the comprehensive index of the two. The calculation formula is:
where represents the j index, represents the standardized value of the j index, and represents the weight of the j index.
Coupling is actually a physical concept, which represents the interaction and influence between two or more subsystems (Wang and Tang, 2018). With the help of capacity coupling model in physics, the internal synergy mechanism of interaction and mutual influence between systems can be revealed. The coupling degree calculation model is:
In the formula, C represents the coupling degree and the value range is 0 ≤ C ≤ 1. When C = 0, the systems are in state of disorde; When C=1, benign resonance is achieved among the systems, and they develop in an orderly and stable way. U1, U2, U3, and U4 are the comprehensive evaluation indexes of four subsystems, namely, agricultural resource utilization, agricultural environment conditions, agricultural industry development, and farmers’ living standard.
The coupling degree model can only reflect the close relationship between systems, but cannot well reflect the level and direction of interaction between systems. Therefore, it is necessary to introduce the CCD model to comprehensively reflect the coupling and coordination level between the ecological product supply and economic development in ecological conservation areas (Liu et al., 2005). The CCD calculation model is:
In the formula, D is the CCD and the value range is 0 ≤ D ≤ 1. The closer the D value is to 1, the better the coordinated development level, and the closer the D value is to 0, the worse the coordinated development level. T is the comprehensive coordination index between the ecological product supply and economic development; a1, a2, a3, and a4 are parameters, a1+a2+a3+a4 = 1. In this study, the values of a1, a2, a3, and a4 are all 0.25. Considering its characteristics and based on existing research (Liu and Cui, 2008) Which are divided into the following types: Table 2.
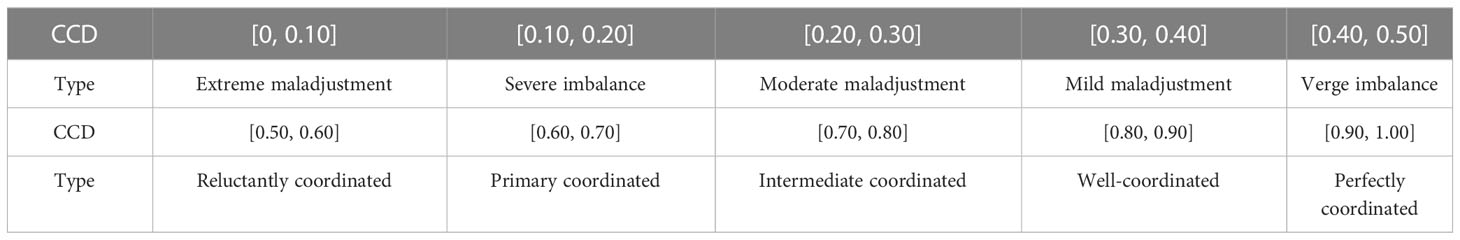
Table 2 Coupling coordination degree and types.
In order to quantitatively evaluate the driving factors of green development in Beijing, the correlation degree of each evaluation index was calculated by constructing the GRA model. The greater the correlation degree, the higher the influence degree of this index on AGD. The calculation steps are as follows:
(1) This paper adopted the initial value processing method and carried on the dimensionless processing to the variable. The processing method is dividing each number of each sequence by the first one of each sequence;
(2) The correlation coefficient is calculated to get the grey correlation coefficient matrix:
where is the resolution function with a value of 0-1. According to common experience, the value of this study is 0.5.
(3) The correlation degree is calculated:
The closer the GRA is to 1, the greater the influence of driving factors on AGD level. On the contrary, if the GRA of an industry is closer to 0, the smaller the influence of driving factors on AGD level. Combined with the actual situation of Beijing, this study selected indicators from five aspects, economic development, industrial structure, urbanization, technological progress, and agricultural structure, and analyzed the driving factors of AGD and forestry in Beijing. The specific factors are as follows: Table 3.

Table 3 Factors affecting the agricultural green development and indicators from 1978 to 2022 in Beijing.
Using the index system constructed in Section 3.2.1 and the research method adopted in Section 3.2.2, the AGD level in Beijing was evaluated, as shown in Figure 3. As can be seen from the figure, from 1978 to 2022, the AGD level in Beijing showed a fluctuating upward trend, and the comprehensive evaluation index greatly increased from 0.4156 in 1978 to 0.6104 in 2022. The AGD index increased steadily with an average growth rate from 1978 to 1998 except a decrease in 1995. The AGD index fluctuated horizontally from 1998 to 2010, during which the level of AGD varied, showing a weak upward trend as a whole. The AGD level demonstrated a fluctuating downward trend from 2010 to 2016 but then a rapid upward trend after 2016. In terms of types, the resource utilization level slightly increased as a whole. To be specific, the resource utilization level increased from 1978 to 2000, greatly fluctuated from 2000 to 2020, and then gradually began to rise after 2020. In general, the industrial development level showed an upward trend year by year, especially from 1990 to 2015, when it increased rapidly, then declined to a certain extent after 2015, and finally gradually stabilized. The environmental conditions were generally stable from 1978 to 1995 without any significant changes, but decreased to varying degrees and then gradually increased after 2020. The farmers’ living standard basically increased on a yearly basis except a decline in 2006.
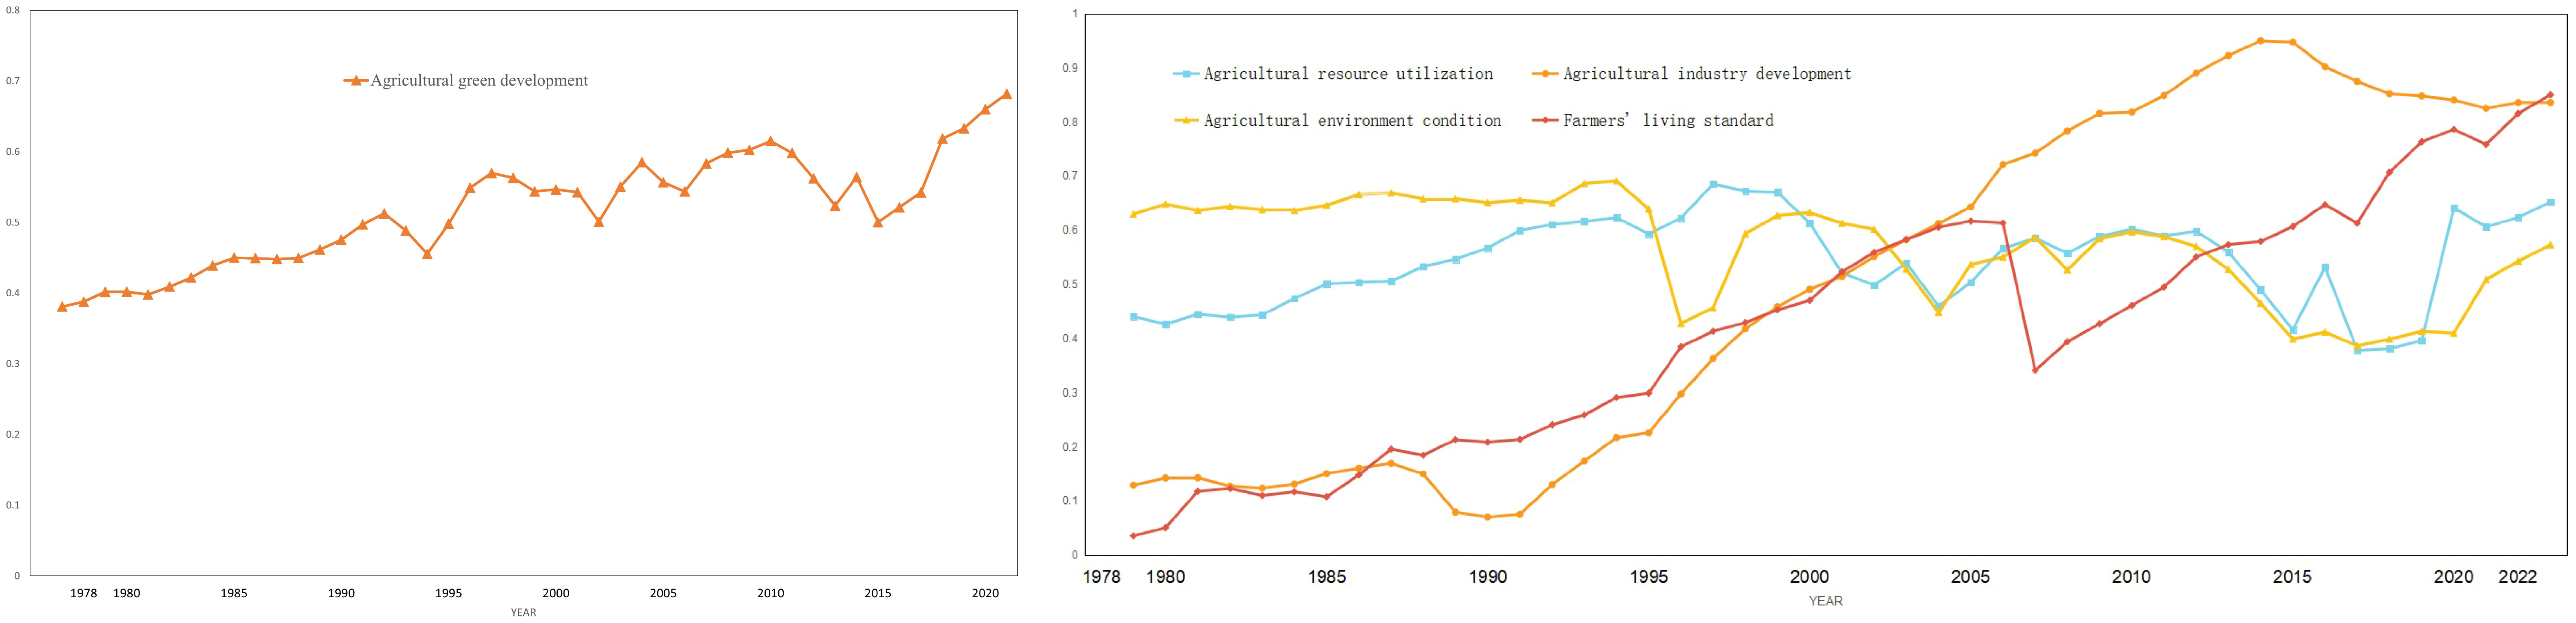
Figure 3 Evaluation results of agricultural green development in Beijing from 1978-2022.
The CCD model mentioned in Section 3.2.3 was used to analyze the subsystems of AGD in Beijing, that is, the CCD situation of agricultural resources utilization, agricultural environmental conditions, agricultural industry development, and farmers’ living standards, as shown in Figure 4. It can be seen from the figure that the CCD among various evaluation factors increased year by year from 0.4557 in 1978 to 0.8482 in 2022. The CCD level underwent five stages, namely a verge imbalance stage from 1978 to 1979, a reluctantly coordinated stage from 1980 to 1991, a primary coordinated stage from 1992 to 1996, an intermediate coordinated stage from 1997 to 2018, and a well-coordinated stage after 2019. As a whole, the coupled and coordinated development level was gradually improved.
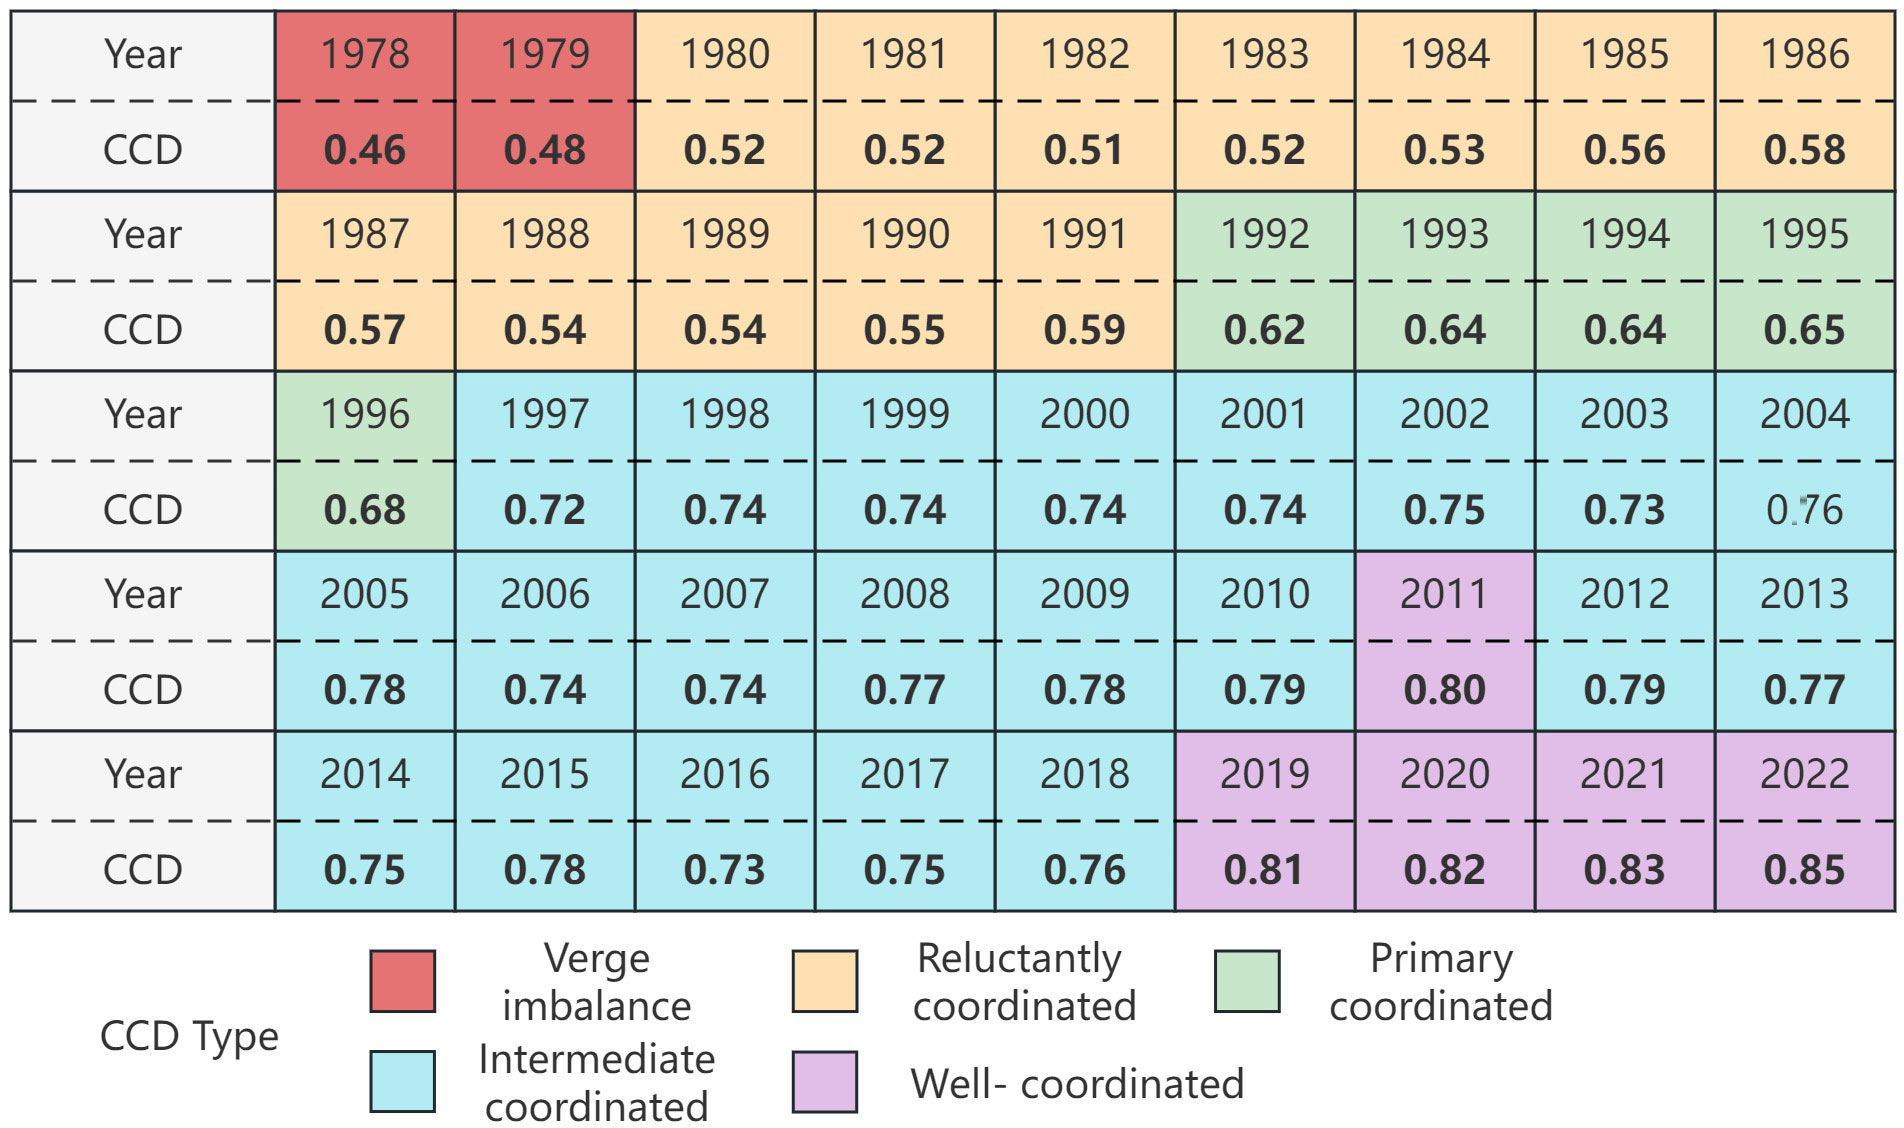
Figure 4 CCD of agricultural green development from 1978 to 2022 in Beijing.
The GRA model was used to analyze the driving factors of AGD level in Beijing, as exhibited in Table 4. The analysis results showed that the correlation coefficients between the five factors and AGD level in Beijing were all greater than 0.8, indicating that the AGD level in Beijing was affected by all the five driving factors. The driving forces from large to small were: per capita GDP > the proportion of urban population > the proportion of tertiary industry > the proportion of food crops > the number of granted patents. The correlation coefficients of per capita GDP, the proportion of urban population, and the proportion of tertiary industry were all greater than 0.95, and that of the number of granted patents was the lowest, being only 0.8114.
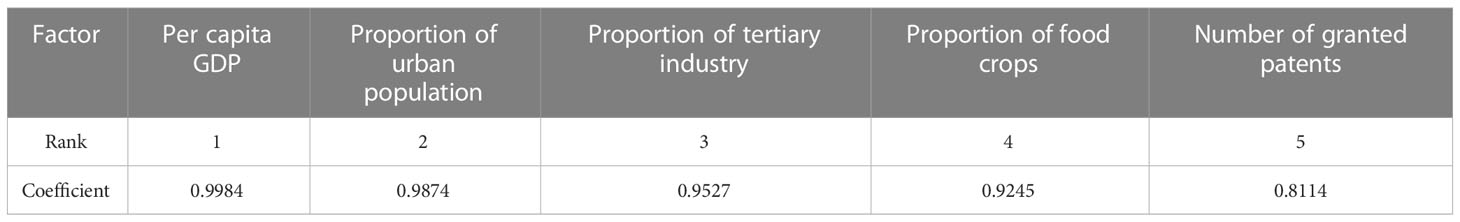
Table 4 Correlation coefficients of influencing factors.
According to the evaluation results of the AGD level in Beijing, the AGD in Beijing could be divided into the following stages, and the characteristics of the different stages and the changes of each index were also analyzed.
The AGD in Beijing was in a steady rising stage from 1978 to 1998, when agriculture rapidly developed before and after China’s reform and opening up. Especially after the household contract responsibility system was implemented in Beijing, the agricultural productivity level was greatly improved, agricultural resource utilization was steadily increased, agricultural environmental conditions were gradually enhanced, agricultural industry rapidly developed, and the farmers’ living standard were also significantly raised. Therefore, the AGD level index quickly increased.
The AGD in Beijing was in a fluctuating stage from 1998 to 2010, when agriculture developed to a certain stage. The agricultural resource utilization gradually stabilized and rural industrial development and rural living standards also showed an upward trend year by year, but this was accompanied by fluctuations in rural resource utilization. In order to improve agricultural productivity, the utilization level of chemical fertilizers, pesticides, and agricultural films in this stage was higher. As a result, the agricultural environmental conditions declined to a certain degree. The AGD level horizontally fluctuated, with insignificant changes for each year.
The AGD in Beijing was in an oscillating decreasing stage from 2010 to 2016, when agriculture began to transform in Beijing. In the context of the developing metropolitan agriculture, the planting mode of small farmers and small households had certain limitations and could no longer adapt to the agricultural development level in the new stage. Agricultural resource utilization and the agricultural environment conditions witnessed a downward trend. The main reason was that with the increase of agricultural input, the scale benefits of resource utilization was affected, and the utilization of agricultural fertilizers, pesticides, and agricultural films was excessively high, which further affected the environmental conditions and sewage treatment rate. However, the development level of the agricultural industry reached a certain height, which was difficult to increase in the later period, while farmers’ living standard in rural areas was improved to some extent.
The AGD in Beijing was in a rapid upgrading stage from 2016 to 2022, during which agriculture in Beijing started a new stage of development. In this stage, agricultural development gradually entered a new stage of green development, agricultural land management gradually changed to large-scale, the cultivated land utilization capacity increased, and agricultural resources utilization increased. The government began to attach great importance to green agriculture, and the consumption of chemical fertilizers, pesticides, and agricultural films decreased year by year, while the sewage treatment rate increased. The agricultural industry development gradually stabilized and farmers’ living standard was steadily improved. The AGD level index showed a rapid upward trend.
From 1978 to 2022, the CCD among the evaluation factors of AGD in Beijing increased year by year, involving five stages from an extreme maladjustment stage in 1978, severe imbalance stage in 1980, moderate maladjustment stage in 1992, mild maladjustment stage in 1997, and well-coordinated stage in 2019. The development trend in the CCD and AGD levels in Beijing was consistent, that is, the level of AGD was improved and the CCD, among its various factors, gradually changed from uncoordinated development to coordinated development, implying that the promotion of the AGD level was closely related to the coordinated development among its various factors. In order to promote the level of regional AGD, it is necessary to simultaneously improve agricultural resource utilization, agricultural environment conditions, agricultural industry development, and farmers’ living standard, and promote the coordinated level among various factors. At the same time, different factors also promote each other. An improved agricultural resource utilization level also leads to an upward trend in production efficiency, agricultural development, and improves the regional ecological environment conditions. Agricultural development also mirrors agricultural resource utilization. The improved resource utilization, environmental conditions, and industry will be accompanied by raised farmers’ living standards. The improvement of farmers’ living standards and awareness of environmental protection will also promote agricultural resources utilization and the agricultural environment conditions. To sum up, several factors promote each other and work together.
According to the CCD analysis of the changes and factors of AGD in Beijing, the AGD level in Beijing was intimately related to national policies and urban development. The main factors affecting AGD were analyzed using the GRA analysis model. Economic development, industrial structure, urbanization, technological progress, and agricultural structure all played an important role in promoting AGD. Economic development and industrial development were the driving forces of AGD, and provided the economic foundation for AGD. Urbanization reduced the rural population in Beijing, thus forcing Beijing’s agriculture to abandon the mode of concentrated labor forces, improve production efficiency, and embark on a road to more efficient and large-scale agricultural development. Consequently, the agricultural structure in Beijing was adjusted. Technical progress is also an important factor affecting AGD. New agricultural technology can promote the technical level of AGD and enhance the pace of AGD.
According to the above analysis, this paper puts forward some policy suggestions to promote AGD in Beijing: firstly, Beijing’s economy is developing rapidly, which lays a good economic and environmental foundation for AGD. It is necessary to seize current opportunity, improve agricultural capital investment, transform agricultural development mode, and promote the AGD level. Secondly, AGD in Beijing is mainly limited by industrial development and the environmental conditions. Therefore, we should further optimize the industrial structure, develop advantageous and characteristic industries, reduce the use of pesticides, fertilizers, and agricultural films, and improve the agricultural environmental level. Thirdly, the impact of science and technology investment on AGD cannot be ignored. With the advent of the digital information age, agricultural informal ionization has become the main driving force to promote agricultural total factor productivity. Beijing should further increase science and technology investment, especially strengthening the research on AGD-applied science and technology. Fourth, the joint development of all aspects is required to promote the AGD level. The agricultural resource utilization, agricultural environment conditions, agricultural industry development, and farmers’ living standard are indispensable, so we should pay attention to the coordinated promotion in these four aspects. Beijing should adhere to the principle of “big cities driving big suburbs and big suburbs serving big cities”, consolidate the foundation of agriculture, rural areas, and farmers, improve the level of AGD, and strive to promote high-quality and efficient agriculture, livable and suitable rural areas, and prosperous farmers.
Based on the analysis of the existing AGD evaluation and the actual situation of Beijing, this paper constructed an index system of the AGD level in Beijing, which consisted of the agricultural resource utilization, agricultural environment conditions, agricultural industry development, and farmers’ living standard, and put forward a method of determining the index weight and evaluation scheme. Based on the AGD level in Beijing, the CCD of each factor was evaluated, and the driving factors of the AGD level in Beijing were analyzed by grey relational analysis. The research results can provide policy recommendations for AGD in Beijing and other regions. The evaluation timespan selected in this study was long, from 1978 to 2022, a total of 45 years, which is longer than that in most existing studies. This paper also analyzed the different stages and corresponding characteristics of AGD in Beijing, which is helpful to fully understand the status of AGD in Beijing.
There are some limitations to this study. Firstly, the evaluation index can be further improved. Because of the long timespan of this study, most of the data used are statistical data, so some natural geospatial data were not included in the evaluation index system, such as land use structure and forest coverage rate. With the progress of technology, relevant indicators can be included in future index systems. Secondly, this study mainly focused on the changes of the AGD level in different years in Beijing, and the AGD level in different regions of Beijing is quite different, so it is advisable to analyze the spatial difference of different districts, counties, and towns in the future, and the influencing factors and driving mechanism should be analyzed by region. Lastly, this study conducted an evaluation of the AGD of the Beijing from 1978 to 2022, and the comparative analysis with other regions is insufficient. In the future, relevant measures should be strengthened.
Using the period from 1978 to 2022 as the timespan and the comprehensive evaluation method of the CCD analysis model and GRA model as the research methods, this paper explored the evaluation methods of the AGD level and CCD among different factors, analyzed the driving factors of AGD level, and proposed policy enlightenment to promote AGD in Beijing. The main conclusions are as follows: firstly, the AGD level in Beijing gradually increased from 1978 to 2022 and can be divided into four different stages, namely, a steady rising stage from 1978 to 1998, a fluctuating stage from 1998 to 2010, an oscillating decreasing stage from 2010 to 2016, and a rapid upgrading stage from 2016 to 2022. Secondly, the CCD of agricultural resource utilization, agricultural environment conditions, agricultural industry development, and farmers’ living standard showed an upward trend during the research period, and its coordination type gradually changed from a verge imbalance stage in 1978 to 1979 to a reluctantly coordinated stage in 1980 to 1991, a primary coordinated stage in 1992 to 1996, an intermediate coordinated stage in 1997 to 2018, and then reached a well-coordinated stage in 2019. Thirdly, the coefficients between AGD and per capita GDP, the proportion of urban population, the proportion of tertiary industry, the proportion of food crops, and the number of granted patents in Beijing were 0.9984, 0.9874, 0.9527, 0.9254, and 0.8114, respectively. Therefore, Beijing should develop the economy, improve the industrial structure, adjust planting structures, and attach importance to technological innovation in order to promote AGD.
The original contributions presented in the study are included in the article/supplementary material. Further inquiries can be directed to the corresponding authors.
LL: conceptualization, methodology, formal analysis, and writing—original draft. HH: review and writing—review and editing. XT: conceptualization and formal analysis. All authors contributed to the article and approved the submitted version.
This research was supported by the Beijing Industrial Economy and Policy Innovation Team (BAIC11-2023) and the National Key R&D Program of China (2022YFC3802805) , and Youth Fund of Beijing Academy of Agricultural and Forestry Sciences (QNJJ202126).
The authors declare that the research was conducted in the absence of any commercial or financial relationships that could be construed as a potential conflict of interest.
All claims expressed in this article are solely those of the authors and do not necessarily represent those of their affiliated organizations, or those of the publisher, the editors and the reviewers. Any product that may be evaluated in this article, or claim that may be made by its manufacturer, is not guaranteed or endorsed by the publisher.
Bastan M., Ramazani Khorshid-Doust R., Delshad Sisi S., Ahmadvand A. (2018). Sustainable development of agriculture: a system dynamics model. Kybernetes. 47, 142–162. doi: 10.1108/K-01-2017-0003
Benabderrazik K., Kopainsky B., Tazi L., Joerin J., Six J. (2021). Agricultural intensification can no longer ignore water conservation – a systemic modelling approach to the case of tomato producers in Morocco. Agric. Water Manage. 256, 107082. doi: 10.1016/J.AGWAT.2021.107082
Cao Z. (2012). The construction and evaluation of regional agricultural sustainable development index system—A case study of Hengyang City. Economic Geography. 32, 113–116. doi: 10.15957/j.cnki.jjdl.2012.08.002
Chen Z., Li X., Xia X. (2021). Measurement and spatial convergence analysis of China’s agricultural green development index. Environ. Sci. Pollut. Res. 28, 19694–19709. doi: 10.1007/s11356-020-11953-z
Cheng X., Shuai C., Liu J., Wang J., Liu Y., Li W., et al. (2018). Modelling environment and poverty factors for sustainable agriculture in the Three Gorges Reservoir Regions of China. Land Degrad. Dev. 29, 3940–3953. doi: 10.1002/ldr.3143
Clark W. A. V., Rushton G., Golledge R. G. (1970). The spatial structure of the iowa urban network. Geogr. Anal. 2, 301–313. doi: 10.1111/j.1538-4632.1970.tb00861.x
Contesse M., van Vliet B. J. M., Lenhart J. (2018). Is urban agriculture urban green space? A comparison of policy arrangements for urban green space and urban agriculture in Santiago de Chile. Land Use Policy. 71, 566–577. doi: 10.1016/j.landusepol.2017.11.006
Cui H., Zhao T., Tao P. (2019). Evolutionary game study on the development of green agriculture in China based on ambidexterity theory perspective. Pol. J. Environ. Stud. 28, 1093–1104. doi: 10.15244/pjoes/87139
Feng M. (2019). Regional characteristics and evaluation of green agricultural development im Sichuan province. Chin. J. Agric. Resour. Regional Planning. 40, 42–47. doi: 10.7621/cjarrp.1005-9121.20190106
Guo B., He D., Zhao X., Zhang Z., Dong Y. (2020). Analysis on the spatiotemporal patterns and driving mechanisms of China’s agricultural production efficiency from 2000 to 2015. Phys. Chem. Earth. 120, 102909. doi: 10.1016/j.pce.2020.102909
Guo Y., Yao Y., Wang Z., Ren C. (2023). Green development evaluation and problem areas identification of Yangtze River Economic Belt from the perspective of major function-oriented zones. Acta. Ecologica Sinica. 43, 2569–2582. doi: 10.5846/stxb202204221098
He Q., Li H., Ouyang X. (2020). Coupling Coordination Analysis and Simulation Forecast of urbanization and Ecological Environment of Urban agglomeration in the Middle reaches of the Yangtze River. Ecol. Science. 39, 182–190. doi: 10.14108/j.cnki.1008-8873.2020.02.022
Hou D., Wang X. (2022). Measurement of agricultural green development level in the three provinces of northeast China under the background of rural vitalization strategy. Front. Public Health 10. doi: 10.3389/fpubh.2022.824202
Jin F., Ma L., Xu D. (2020). Environmental stress and optimized path of industrial development in the Yellow River Basin. Resour. Science. 42, 127–136. doi: 10.18402/resci.2020.01.13
Li X., Gong Q. (2020). Since the founding of New China, agricultural green development support policy evolution and optimization approach. World Agriculture. 492, 40–50. doi: 10.13856/j.cn11-1097/s.2020.04.005
Liu Y., Li R., Song X. (2005). Analysis on the Coupling degree of urbanization and Ecological Environment in China. J. Natural Resources. 01, 105–112. doi: 10.3321/j.issn:1000-3037.2005.01.015
Liu G., Wang B., Cheng Z., Zhang N. (2020a). The drivers of China’s regional green productivity 1999–2013. Resour. Conserv. Recycl. 153, 104561. doi: 10.1016/j.resconrec.2019.104561
Liu M., Xu X., Jiang Y., Huang Q., Huo Z., Liu L., et al. (2020b). Responses of crop growth and water productivity to climate change and agricultural water-saving in arid region. Sci. Total Environ. 703, 134621. doi: 10.1016/j.scitotenv.2019.134621
Ma X., Hu Y., Huang B. (2022). Spatial-temporal characteristics and influencing factors of rural green development in Jiangsu Province. Economic Geography. 42, 159–167. doi: 10.15957/j
Mahmud M. S. A., Abidin M. S. Z., Mohamed Z., Rahman M. K. I. A., Iida M. (2019). Multi-objective path planner for an agricultural mobile robot in a virtual greenhouse environment. Comput. Electron. Agric. 157, 488–499. doi: 10.1016/j.compag.2019.01.016
Pan C., Jiang Y., Wang M., Xu S., Xu M., Dong Y. (2021). How can agricultural corporate build sustainable competitive advantage through green intellectual capital? A new environmental management approach to green agriculture. Int. J. Environ. Res. Publ. Health 18(15):7900. doi: 10.3390/ijerph18157900
Pan W., Pan W., Hu C., Tu H., Zhao C., Yu D., et al. (2019). Assessing the green economy in China: an improved framework. J. Cleaner Production 209, 680–691. doi: 10.1016/j.jclepro.2018.10.267
Pham L. V., Smith C. (2014). Drivers of agricultural sustainability in developing countries: a review. Environ. Syst. Decis. 34, 326–341. doi: 10.1007/s10669-014-9494-5
Pigford A.-A. E., Hickey G. M., Klerkx L. (2018). Beyond agricultural innovation systems? Exploring an agricultural innovation ecosystems approach for niche design and development in sustainability transitions. Agric. Syst. 164, 116–121. doi: 10.1016/j.agsy.2018.04.007
Ruan J., Wang Y., Chan F. T. S., Hu X., Zhao M., Zhu F., et al. (2019). A life cycle framework of green IoT-based agriculture and its finance, operation, and management issues. IEEE Commun. Mag. 57, 90–96. doi: 10.1109/MCOM.2019.1800332
Shafaei S. M., Nour-Moghadami A., Kamgar S., Eghtesad M. (2020). Development and validation of an integrated mechatronic apparatus for measuring agricultural product friction coefficients. Inf Process Agric. 7, 93–108. doi: 10.1016/j.inpa.2019.04.006
Shi T., Gill R. (2005). Developing effective policies for the sustainable development of ecological agriculture in China: the case study of Jinshan County with a systems dynamics model. Ecol. Econ. 53, 223–246. doi: 10.1016/J.ECOLECON.2004.08.006
Su K., Meng H., Zhang H. (2021). Construction of the green development indicators for agriculture and its prediction in the 14th Five-Year Plan in China. Trans. Chin. Soc. Agric. Engineering. 37, 287–294. doi: 10.11975/j.issn.1002-6819.2021.20.032
Sun Y., Ding W., Yang Z., Yang C., Du J. (2020). Measuring China's regional inclusive green growth. Sci. Total Environment. 713, 136367. doi: 10.1016/j.scitotenv.2019.136367
Wang W., Feng L., Zheng T., Liu Y. (2021). The sustainability of ecotourism stakeholders in ecologically fragile areas: implications for cleaner production. J. Clean. Prod. 279, 123606. doi: 10.1016/J.JCLEPRO.2020.123606
Wang C., Tang N. (2018). The Spatio-temporal characteristics and pattern Evolution of Spatial function Coupling Coordination of Rural Sansheng in Chongqing. Geographical Res. 37, 1100–1114. doi: 10.11821/dlyj201806004
Wu C., Huang X., Chen B., Li J., Xu J. (2017). Analysis of economic and spatial linkage and economic integration trend in Yangtze River economic belt from social network analysis perspective. Econ. Geogr. 37, 71–78. doi: 10.15957/j.cnki.jjdl.2017.07.010
Wu L., Zhong Y., Shan L., Qin W. (2013). Public risk perception of food additives and food scares. The case in Suzhou, China. Appetite. 70, 90–98. doi: 10.1016/j.appet.2013.06.091
Xiao S., Dong H., Geng Y., Tian X., Liu C., Li H. (2020). Policy impacts on Municipal Solid Waste management in Shanghai: a system dynamics model analysis. J. Clean. Prod. 262, 121366. doi: 10.1016/j.jclepro.2020.121366
Xu X. (2000). The applicable eco-agricultural models and territorial structure of agriculture in the Yellow River Delta. Scientia Geographica Sinica. 01, 27–32. doi: 10.13249/j.cnki.sgs.2000.01.005
Yin C., Li F., Wang S., Hao A. (2021). The concepe, connotation and principle of agricultural green development in China. Chin. J. Agric. Resour. Regional Planning. 42, 1–6. doi: 10.7621/cjarrp.1005-9121.20210101
Zha J., Zhou X., Zhou Y. (2022). Evaluation of agrigultural green development level in the Yellow River. Chin. J. Agric. Resour. Regional Planning. 43, 18–28. doi: 10.7621/cjarrp.1005-9121.20220103
Zhang J., Cui S., Ma L., Meng F., Song C., Li Y., et al. (2020). Construction of a green development index system for agriculture in China and examples. Chin. J. Eco-Agriculture. 28, 1113–1126. doi: 10.13930/j.cnki.cjea.200069
Zhang Q., Wang Y. (2018). Struggling towards virtuous coevolution: institutional and strategic works of Alibaba in building the Taobao e-commerce ecosystem. Asian Bus. Manage. 17, 208–242. doi: 10.1057/s41291-018-0037-7
Keywords: agricultural green development, evaluation, driving factors, coupling coordination degree, Beijing
Citation: Liang L, Huai H and Tang X (2023) Evaluation and driving factors analysis of agricultural green development level in Beijing from 1978 to 2022. Front. Ecol. Evol. 11:1233388. doi: 10.3389/fevo.2023.1233388
Received: 02 June 2023; Accepted: 27 July 2023;
Published: 23 August 2023.
Edited by:
Wei Song, Chinese Academy of Sciences (CAS), ChinaReviewed by:
Zhengyi Hu, University of Chinese Academy of Sciences, ChinaCopyright © 2023 Liang, Huai and Tang. This is an open-access article distributed under the terms of the Creative Commons Attribution License (CC BY). The use, distribution or reproduction in other forums is permitted, provided the original author(s) and the copyright owner(s) are credited and that the original publication in this journal is cited, in accordance with accepted academic practice. No use, distribution or reproduction is permitted which does not comply with these terms.
*Correspondence: Heju Huai, aHVhaWhqQG5lcmNpdGEub3JnLmNu; Xiumei Tang, eGl1bWVpdGFuZzZAMTI2LmNvbQ==
Disclaimer: All claims expressed in this article are solely those of the authors and do not necessarily represent those of their affiliated organizations, or those of the publisher, the editors and the reviewers. Any product that may be evaluated in this article or claim that may be made by its manufacturer is not guaranteed or endorsed by the publisher.
Research integrity at Frontiers
Learn more about the work of our research integrity team to safeguard the quality of each article we publish.