 Sicheng Wang
 Guoen Wei
 Mingming Gao
 Yuemin Fan
- 1College of Architecture and Urban Planning, Guizhou University, Guiyang, China
- 2College of Urban and Environmental Sciences, Peking University, Beijing, China
- 3College of Resources and Environment, Nanchang University, Nanchang, China
- 4New Development Institute, Guangdong University of Finance & Economics, Guangzhou, China
The stressful effects of urbanization on vegetation net primary productivity (NPP) and vegetation–carbon cycle functions within the Yangtze River Economic Belt (YEB) under the sustainable development goals (SDG) and the concept of coordinated regional development, have garnered growing attention. Existing studies have been insufficient in comprehensively examining both the global effects and local variations resulting from urbanization in the region. Additionally, insufficient attention has been given to the heterogeneity of the ecological negative effects of urbanization in the three major urban agglomerations within the YEB. Based on multivariate remote sensing image and socioeconomic statistics data, this study integrates population, economic and land dimensions to construct comprehensive urbanization indexes and quantify the spatio-temporal evolution patterns of NPP and urbanization in the YEB. The focus is on detecting the global response of NPP to urbanization using the Spatial Durbin model and discussing the local heterogeneity of the effect in the Yangtze River Delta urban agglomeration (YRD), the middle reaches of Yangtze River urban agglomeration (MRYRU), and the Chengdu-Chongqing urban agglomeration (CCU) based on a geographically weighted regression model. The results show that the average NPP of the YEB increased from 592g*c/m2 to 670g*c/m2 at a rate of 0.621% from 2000 to 2020, with the most significant growth in the CCU, and the overall pattern of change is “increased in the north and decreased in the south”. The negative spatial autocorrelation between urbanization and NPP is becoming increasingly significant, and the negatively correlated clusters is the dominant type of local autocorrelation, among which the number of “High-Low” type cities is the largest and growing, mainly located in the northern regions of Anhui and Jiangsu. The significant negative effect of urbanization on the productive capacity of vegetation cover systems was verified, and a negative spillover effect that far exceeded the local negative effect was also confirmed. The effect of urbanization on NPP has significant local variability and gradually shifts to the effect pattern of positive effect in the east and negative effect in the west, while the pattern of urbanization-driven effects in the three urban agglomerations also continues to change. This study increases the concern about the negative ecological effects of urbanization, and more importantly, provides a basis for the joint action of ecological restoration and management in the Yangtze River Economic Belt and the implementation of differentiated governance policies around urban agglomerations.
1 Introduction
Net primary productivity (NPP) of vegetation is the residual of the total organic matter produced by photosynthesis in a green plant community per unit area and per unit time, after deducting the organic matter required for its own respiration (Zhong et al., 2023). NPP is a key element in measuring the health and resilience of terrestrial ecosystems. It has also been shown to be an important indicator for regulating the “structure-function” of ecosystems, their carbon sequestration capacity, sustainability of material cycles and even the evolution of ecosystem dynamics (Yang et al., 2021). NPP’s response to long-term global climate change has been confirmed by numerous investigations. Climate change factors such as precipitation, temperature, and humidity affect NPP levels through direct or indirect pathways and have complex implications for ecosystem suitability management in human settlements (Wei et al., 2021). As human activities have increased, the increasing conflicts between human and natural systems due to the migration of residents, urban land expansion, and predatory exploitation of natural resources have attracted worldwide attention (Liu et al., 2019; Wang et al., 2022; Wei et al., 2023; Wei G.E. et al., 2023). In particular, the global urban land area grew from 239,000 km2 to 519,800 km2 in the first two decades of the 21st century, an increase of 117.49% (Liu et al., 2019). Accelerated urbanization has changed the structure of urban land use and the size of built-up areas, and consequently affected soil fertility, space for vegetation growth and the risk of growth pollution (Muhammad et al., 2023). These process pathways put a heavy burden on urban landscape ecological patterns and global vegetation cover systems, and have become important constraints on sustainable urban development goals such as sustainable urban construction (Goal11, SDG), maintenance of ecosystem carbon cycles (Goal13, SDG), and ecosystem conservation (Goal15, SDG) (Chen et al., 2023). Therefore, it is important to reveal the response pattern of NPP to urbanization and provide macro-management strategies to mitigate the stressful effects of urbanization. This is important for deepening the knowledge and understanding of global environmental change, promoting urban ecosystem restoration and resilience enhancement, and even sustainability of urban planning and land use management (Tang et al., 2023; Wei et al., 2022).
To mitigate the negative effects of human activities on NPP represented by urbanization, national organizations and local governments have put a lot of practice based on consensus frameworks such as the 2030 Agenda for Sustainable Development, the Paris Agreement, and the International Geosphere-Biosphere Programme (IGBP) (Saiu et al., 2022). For example, the U.S. Strategic Plan for the Conservation of Ecosystems and Biodiversity, China’s Plan for the Advancement of Ecological Civilization, and Europe’s Biodiversity Strategy 2020 all consider harmonious, orderly, and healthy urban development as an important area for restoring the carbon storage and species conservation capacity of vegetated ecosystems (Guido et al., 2017). Scholars have mainly developed case studies on the mechanisms of urbanization on NPP in terms of the impact of urban land expansion, population urbanization and economic urbanization processes on NPP and the simulation of future trends of this impact. For example, Liu et al. (2020) investigated global built-up land expansion encroaching on terrestrial vegetation NPP at a rate of 22.4 Tg-C per year in the early decade of the 21st century and offsetting 30% of climate change-driven NPP growth. Li et al. (2022) revealed that there are direct and indirect effects of urbanization on NPP, and the direct effects have significant spatial non-stationarity characteristics, providing evidence for the development of differentiated urban ecological governance strategies. These studies have focused more on the negative ecological effects of urbanization unidimensionally on NPP, while rarely examining the integrated effects of urbanization as a systemic project on NPP in multiple domains such as residential migration, economic growth, and land use change. This has led to a significant reduction in quantitative support for relevant urbanization management strategies (Wu et al., 2014). In addition, the transboundary spillover effects of urbanization on NPP have not been generally appreciated, which clearly lacks support for carrying out joint conservation and restoration strategies for regional vegetated ecosystems (Zhong et al., 2021).
The Yangtze River Economic Belt (YEB) is a major national strategic development region spanning three geographic regions in China: the east, the middle and the west, and an inland urban economic belt with global influence. It contains the Yangtze River Delta urban agglomeration (YRD), the middle reaches of Yangtze River urban agglomeration (MRYRU), and the Chengdu-Chongqing urban agglomeration (CCU), which are strategic national urban agglomerations in China and bring together internationally important cities such as Shanghai, Wuhan, Chengdu and Chongqing (Liu et al., 2023). According to data from China’s National Bureau of Statistics, the YEB has a key position in China’s macroeconomic growth and human capital market with a total GDP and population of 47.15 trillion yuan and 606 million people in 2020, accounting for 46.4% and 42.92% of China’s total, respectively (Yang et al., 2022). The rapid clustering of economic and demographic elements promotes rapid urbanization and changes the form, compactness and structure of urban land, which in turn affects regional landscape patterns and ecological networks. This generates ecological problems such as habitat degradation, species loss, carbon sequestration and water retention capacity decay (Yan et al., 2021). Although in 2016, the Chinese government issued the initiative of “Grasping great protection and not engaging in great development” for the YEB, and released the Ecological Protection Plan for the YEB focusing on key ecological elements such as vegetation cover systems. It aims to enhance the conservation of ecosystem diversity, resilience, and sustainability in the region (Bai et al., 2023). However, monitoring the response rule of vegetation ecosystem production capacity to urbanization is still an urgent issue to understand the ecological carbon cycle process and ecological sustainable development path in the YEB.
Existing studies have focused more on changes in vegetation ecosystem response to human urban construction activities in a single province or urban agglomeration in the YEB, providing an effective reference for ecosystem restoration and management in the region. For example, Li et al. (2022) analyzed the local direct and spatial spillover effects of urbanization on NPP using the CCU as a case study; Wang et al. (2021) measured changes in vegetation carbon stocks in the Yangtze River basin based on NPP data and revealed the synergistic effects of urbanization-dominated human activities and climate factors on different segments of the Yangtze River basin. However, as an important strategic region crossing different economic and topographic divisions and population density boundaries in China (the “Heihe-Tengchong” line), significant regional differences in industrial structure, urban form, and population migration patterns dominated by urban agglomerations have developed within the YEB (Li et al., 2022). More often, existing studies need to focus more on the intrinsic variability of urbanization impacts on NPP in the YEB in the context of such significant cross-regional differences in natural (topography, climate, etc.) and human factors (population size, city size, etc.) (Chen et al., 2023; Xia and Zhai, 2022). Otherwise, this will create a realistic gap that makes it difficult to provide site-specific and systematic urbanization optimization strategies and urban vegetation ecological conservation solutions for the YEB from a theoretical perspective.
In summary, existing studies have made prominent contributions to the understanding of the spatial dependence pattern of NPP, the response of NPP under the influence of climate change and human activities represented by urbanization, but the exploration of the mechanism of the impact of urbanization on NPP in the YEB is still far from being addressed: (1) Rarely considered urbanization as a multi-dimensional whole encompassing residential migration, economic growth and land use change, and considered the driving impact of integrated urbanization on NPP; (2) The comprehensive assessment of the local direct effects and cross-border spillover effects of urbanization on NPP in the YEB needs to be strengthened; (3) The response mechanism of NPP to urbanization in the YEB is clearly site-specific, influenced by the disparities in topography, urbanization stage and economic base, while previous studies have paid insufficient attention to the local heterogeneity of the influence mechanism within it dominated by urban agglomerations. To fill these knowledge gaps, our study uses the YEB as a case study to analyze the spatio-temporal evolution patterns of NPP based on MODIS-17A3HF NPP image products. The comprehensive urbanization index is also constructed based on population urbanization, land urbanization and economic urbanization. The focus is on investigating the global and local effects of comprehensive urbanization on the impact of NPP in the Yangtze River Economic Zone using spatial econometric regression models and geographically weighted regression models. The focus is on the use of spatial regression models to investigate the global effects of integrated urbanization on NPP impacts in the YEB, and the local effects and spatial heterogeneity of the impacts of the three major urban agglomerations are further diagnosed under Geographically Weighted Regression (GWR) models.
2 Study area, methods and data sources
2.1 Study area
The YEB is a major national strategic development area in China with the Yangtze River basin as the main trunk, which contains three national strategic urban agglomerations: YRD, MRYRU and CCU (Figure 1). YEB involves 130 prefecture-level cities in 11 provinces and municipalities, including Shanghai, Jiangsu, Zhejiang, Anhui, Jiangxi, Hubei, Hunan, Chongqing, Sichuan, Yunnan, and Guizhou (Chen et al., 2023). This study takes the YEB as the case study, with 130 cities within it as the research sample. The Yangtze River basin, with its warm climate, abundant rainfall, numerous tributary lakes and rich species resources, is a concentrated distribution area for rare and endangered wildlife in China. The per capita GDP of Yangtze River Economic Zone increased from 7506.25 yuan to 71,102.70 yuan from 2000 to 2020, an increase of 8.472 times, and the population density increased from 454.65 person/km2 to 490.6 person/km2, an increase of 7.907%. Despite the Chinese government’s initiative of “Grasping the big protection, not big development”, the conservation and restoration of forest and ecological space in the YEB has achieved significant achievements. However, the rapid growth of economic scale and population size, as well as the significant disparities between provinces and cities in socio-economic and natural contexts have led to the continued contradiction between human urban activities and ecological environmental protection in the region. Therefore, it is important to study the impact mechanism of urbanization on NPP in the YEB for the construction of ecological resilience and sustainable development in the region.

Figure 1 Study area.
2.2 Methods
2.2.1 Comprehensive urbanization level accounting
Urbanization is a systemic project involving multi-domain contents such as urban population growth, land expansion and economic revitalization (Figure 2). The comprehensive urbanization level referred to in this study includes three dimensions of population, land and economic urbanization. Referring to the studies of Peng et al. (2020), Wei G. et al. (2023) and Ouyang et al. (2021), the above indicators were measured in terms of urban resident population share, urban land area share and GDP density. Based on Chen et al. (2022), the data of urbanization sub-dimension indicators were standardized based on the extreme value method, and the standardized results were summed and averaged to obtain the comprehensive urbanization level of each city in the YEB. The formula is as follows:
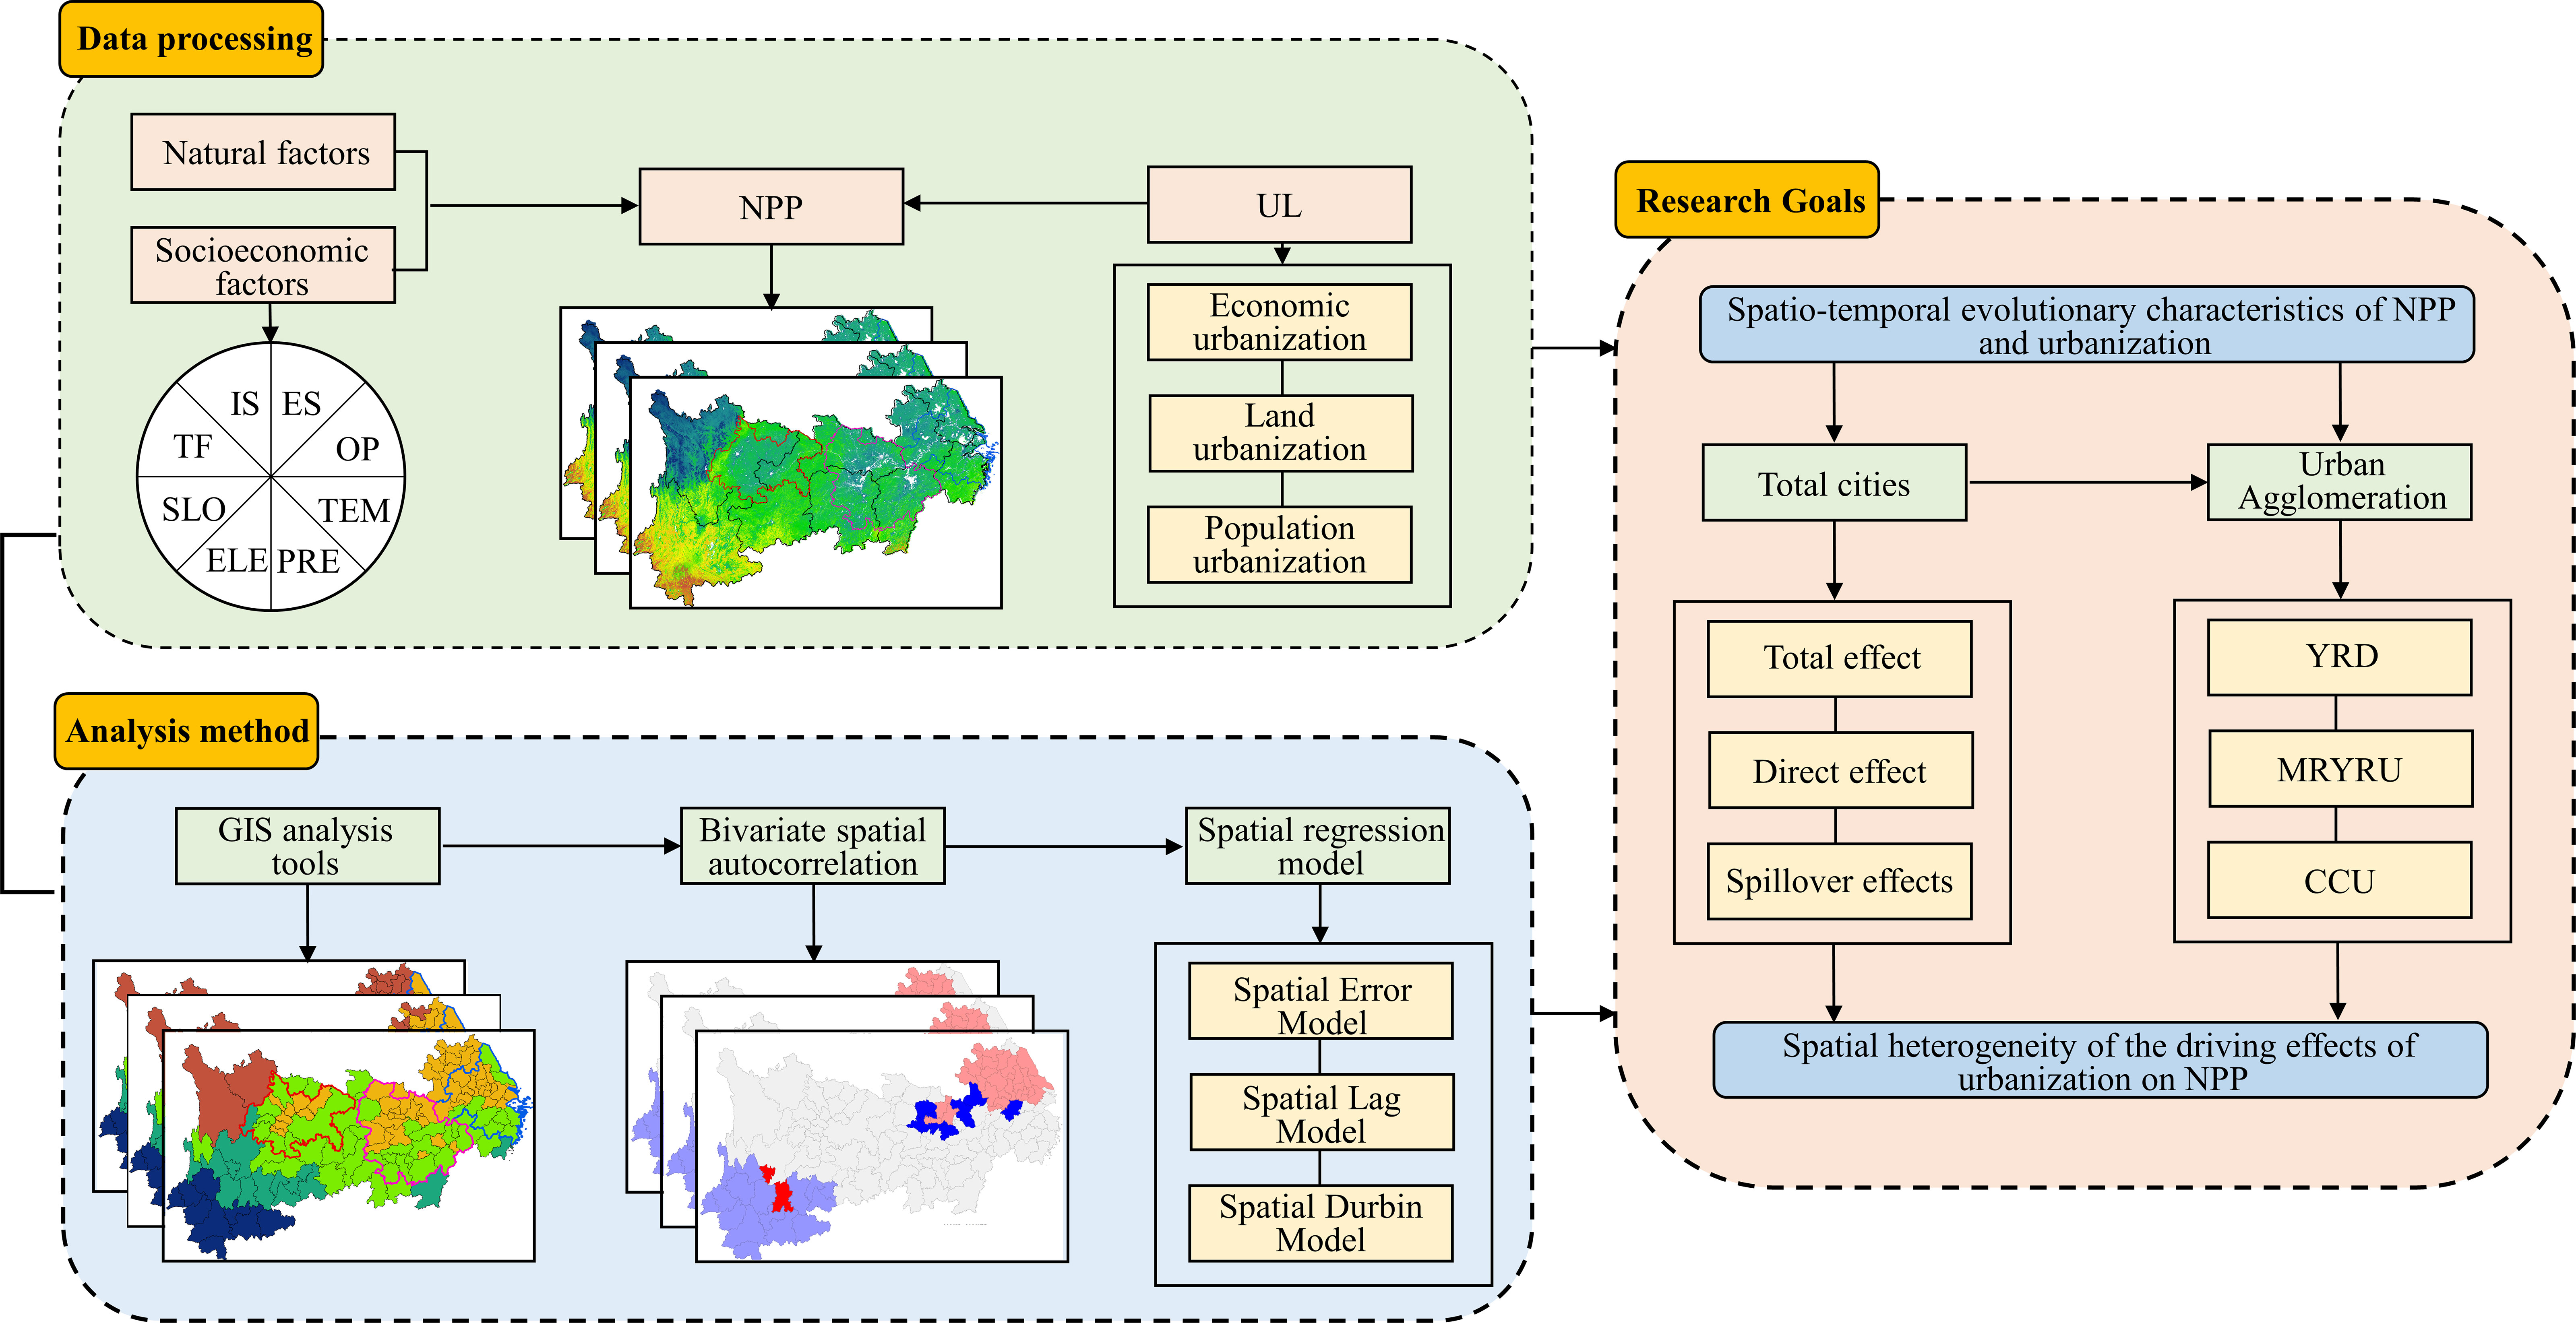
Figure 2 Study route.
Where: xij′ is the standardized value of the j indicator of city i; xiPU, xiLU and xiEU are the indexes of city i after standardization, respectively; ULi is the comprehensive urbanization level of city i.
2.2.2 Bivariate spatial autocorrelation
The bivariate spatial autocorrelation model is used to analyze the spatial correlation between integrated urbanization and NPP. Among them, the local bivariate spatial autocorrelation is calculated as:
Where: Wij is the spatial weight matrix; ULi and NPPj are the UL and NPP of cells i and j, respectively; σUL and σNPP are the variances of UL and NPPl, respectively (Dong et al., 2023).
2.2.3 Spatial regression model
The study investigates the global driving effect of urbanization on NPP in the YEB with a spatial regression model. Compared to the Spatial error model (SEM) and Spatial lag model (SLM), the Spatial Durbin model (SDM) integrates the quantitative advantages of both for exogenous and endogenous interaction effects of variables and can decompose the driving effects into direct and spillover effects based on partial differential equations (P.D.E.) (Guo et al., 2023). The calculation formula of SDM is as follows:
Where: NPPit is the explanatory variable NPP for region i in period t; ULit~PREit is the explanatory variable for region i in period t, containing the key explanatory variables integrated urbanization and other control variables (including natural and socioeconomic control variables); ϵ is a normally distributed random disturbance term; ρ, β and θ are parameters to be estimated; W is the spatial weight matrix; WY is the spatial lagged dependent variable; and WX is the spatial error independent variable. The Lagrange multiplier (LM) was used to assess the necessity of incorporating spatial effects into the regression model; the Likelihood Ratio estimation (LR) was used to evaluate whether the SDM can be reduced to SLM or SEM.
2.2.4 Geographically weighted regression model
This study measures the local variation effect of urbanization on NPP in the YEB based on the GWR model for discussing the differential performance of the driving effect among the three major urban agglomerations (Tian et al., 2023). The model is calculated as follows:
Where: (ui,vi) is the geographic location coordinates of region i; βi is the corresponding geospatial location function of region i; ULi~PREi are the explanatory variables for region i, containing the key explanatory variable UL and other control variables.
2.3 Data sources
2.3.1 Urbanization level
The three urbanization dimensions of population urbanization, land urbanization and economic urbanization are measured by the percentage of urban resident population, the percentage of urban land area and GDP density, respectively. Among them, the data of urban resident population ratio are mainly from the statistics of population number in China Urban Statistical Yearbook, China Statistical Yearbook; the data of urban land area and GDP density are from the remote sensing dataset of land use (30m) and spatialized dataset of GDP density (1km) provided by the Environment and Resources Data Center of Chinese Academy of Sciences (http://www.resdc.cn).
2.3.2 Net primary productivity of vegetation
The NPP data were taken from the MOD17A3 Global Net Primary Productivity product (https://modis.gsfc.nasa.gov/) from NTSG (Numerical Terradynamic Simulation Group), USA, with a spatial resolution of 500m. This dataset has now been used in a large number of research areas such as global NPP spatial distribution and carbon cycle.
2.3.3 Control variables
In addition to urbanization, regional physical context and socioeconomic development are also considered to have important effects on NPP in existing research and theoretical systems. Referring to studies such as Yue et al. (2022) and Sun et al. (2016), we also selected socioeconomic indicators such as industrial structure share, energy consumption, actual utilization of foreign investment, and pressure on transportation infrastructure, as well as natural indicators such as slope, elevation, average annual precipitation, and average annual temperature as control variables to improve the fit of the regression model (Table 1). Among them, the data of natural control variables were mainly obtained from the relevant data products provided by the Geographic Data Cloud Platform of CAS (http://www.gscloud.cn/sources/index) and the Earth System Science Data Center (http://www.geodata.cn/). We extracted the dataset of 130 prefecture-level cities in the Yangtze River Economic Belt based on the image cropping and zoning statistics tools of ArcGIS platform. The socio-economic control variables were mainly obtained from the China City Statistical Yearbook, the China Energy Statistical Yearbook, and the statistics of relevant index data from the provincial and municipal statistical yearbooks. We extracted the dataset of 130 prefecture-level cities in the Yangtze River Economic Belt based on the image cropping and zoning statistics tools of ArcGIS platform. The socio-economic control variables data were mainly obtained from the China City Statistical Yearbook, the China Energy Statistical Yearbook, and the statistics of relevant index data from the provincial and municipal statistical yearbooks.
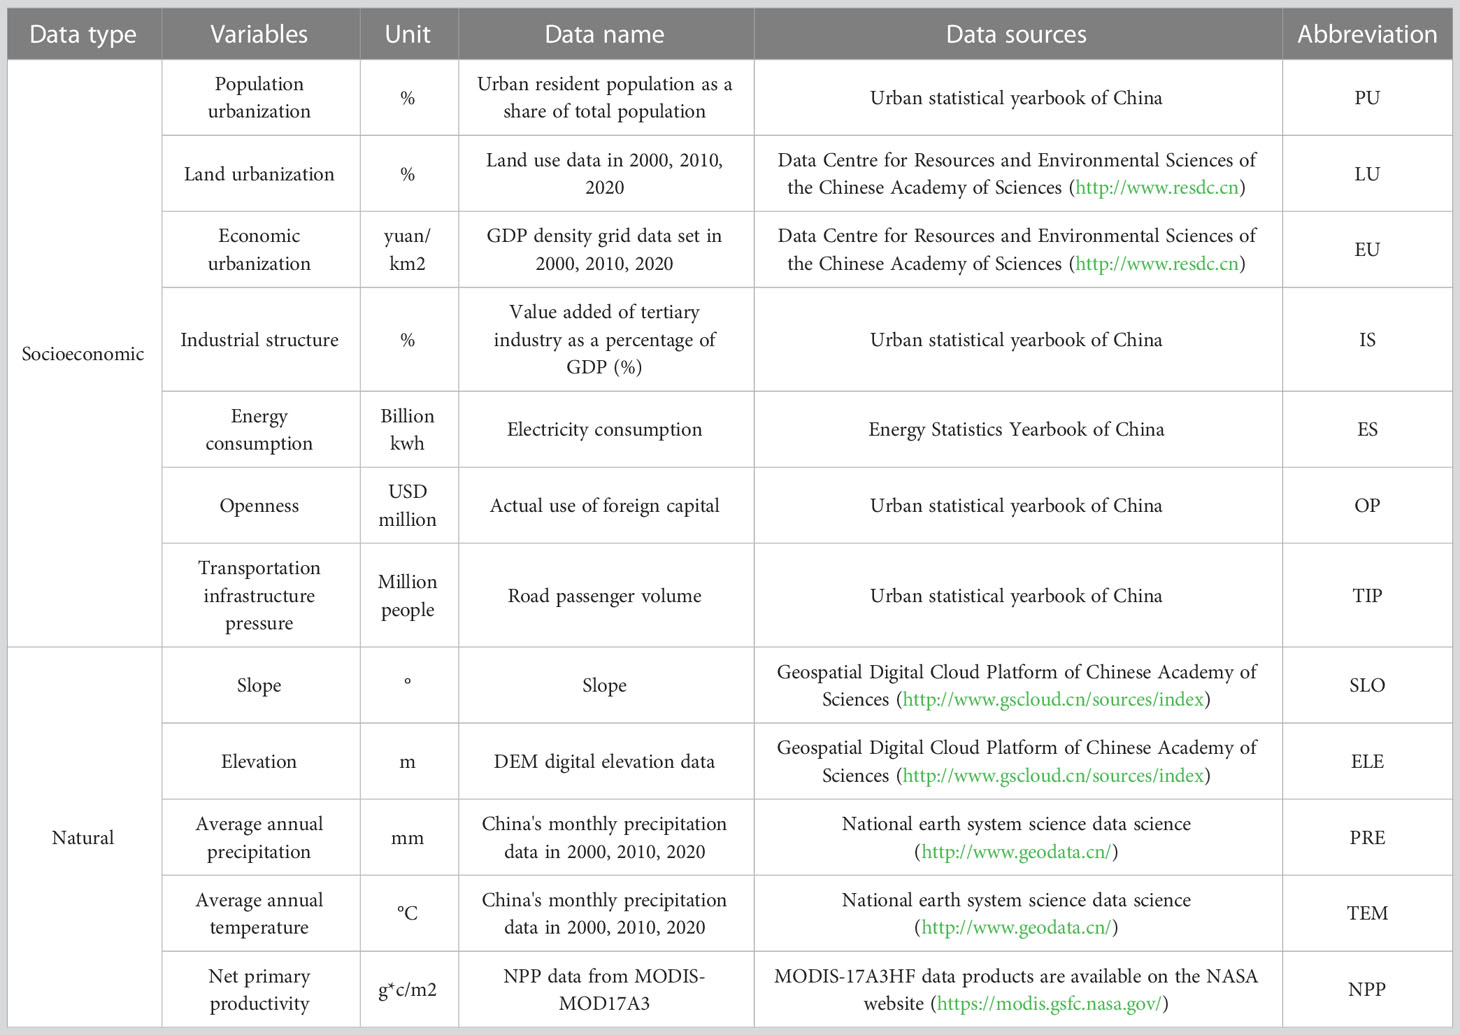
Table 1 Indicator data sources.
3 Result
3.1 Spatio-temporal evolution patterns of NPP and urbanization in the YEB
Combining GIS zoning statistics tools and spatial interpolation techniques to measure the dynamic trend of NPP in the YEB, as shown in Figures 3, 4. The investigation shows that the average NPP in the YEB increased from 592 g*c/m2 to 670 g*c/m2 at a rate of 0.621% from 2000 to 2020 (Figure 3A). Among them, the NPP growth of CCU is the most significant, with an increase of 39.387% from 2000 to 2020, followed by MYRYU and YRD, with increases of 14.867% and 6.495%, respectively. In terms of spatio-temporal dynamics, the NPP level in the YEB shows a clustering pattern of “high in the south and low in the north, high in the west and low in the east” (Figure 4), both in terms of remote sensing images and distribution based on administrative districts. The three major low-value clusters (NPP<450 g*c/m2) in the eastern, central and western parts of the study area in 2000 gradually developed toward dispersion in 2020, and the high-value clusters, mainly in Yunnan Province, spread further in 2020. In terms of the change trend, the average NPP of the YEB shows a general pattern of change of “increased in the north and decreased in the south”. The NPP degraded cities with 13.178% of all cities are mainly located in the southeastern and southern part of the YEB. The most prominent NPP degradation is Xishuangbanna and Lishui, with decreases of 9.787% and 4.575%, respectively. The cities with high values of NPP growth are mostly distributed in the CCU and northern areas of the MYRYU, especially Suining and Ziyang with increases of 84.486% and 78.810%, respectively.
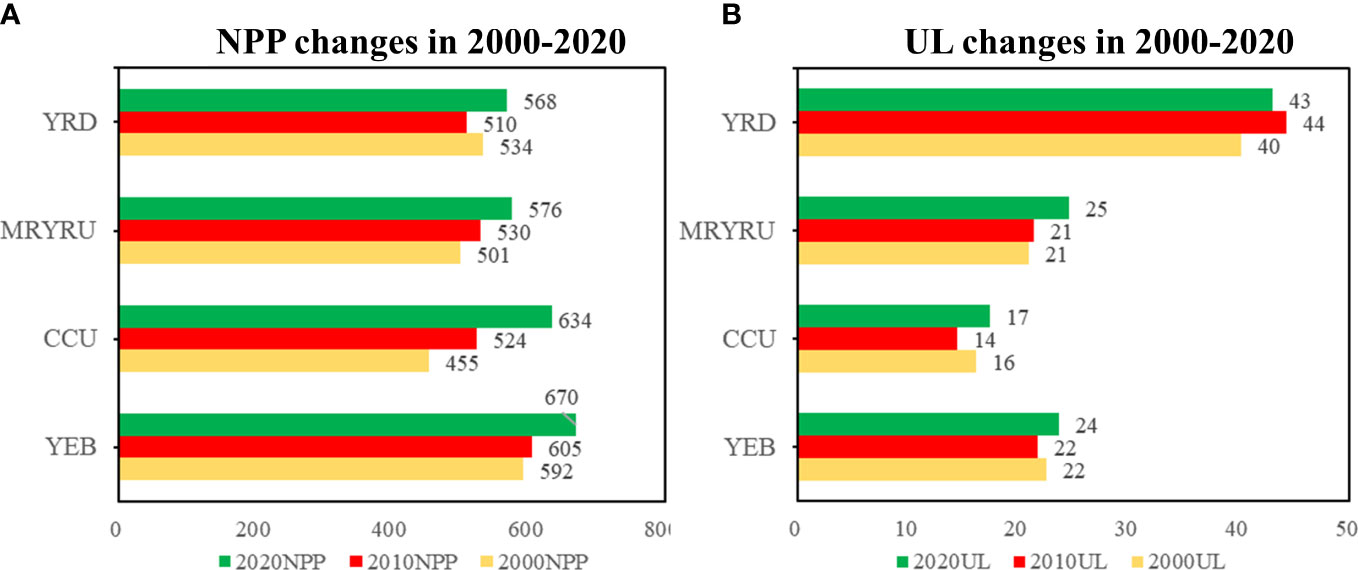
Figure 3 Dynamics of NPP (g*c/m2) (A) and urbanization (%) (Bs) (B), 2000–2020.
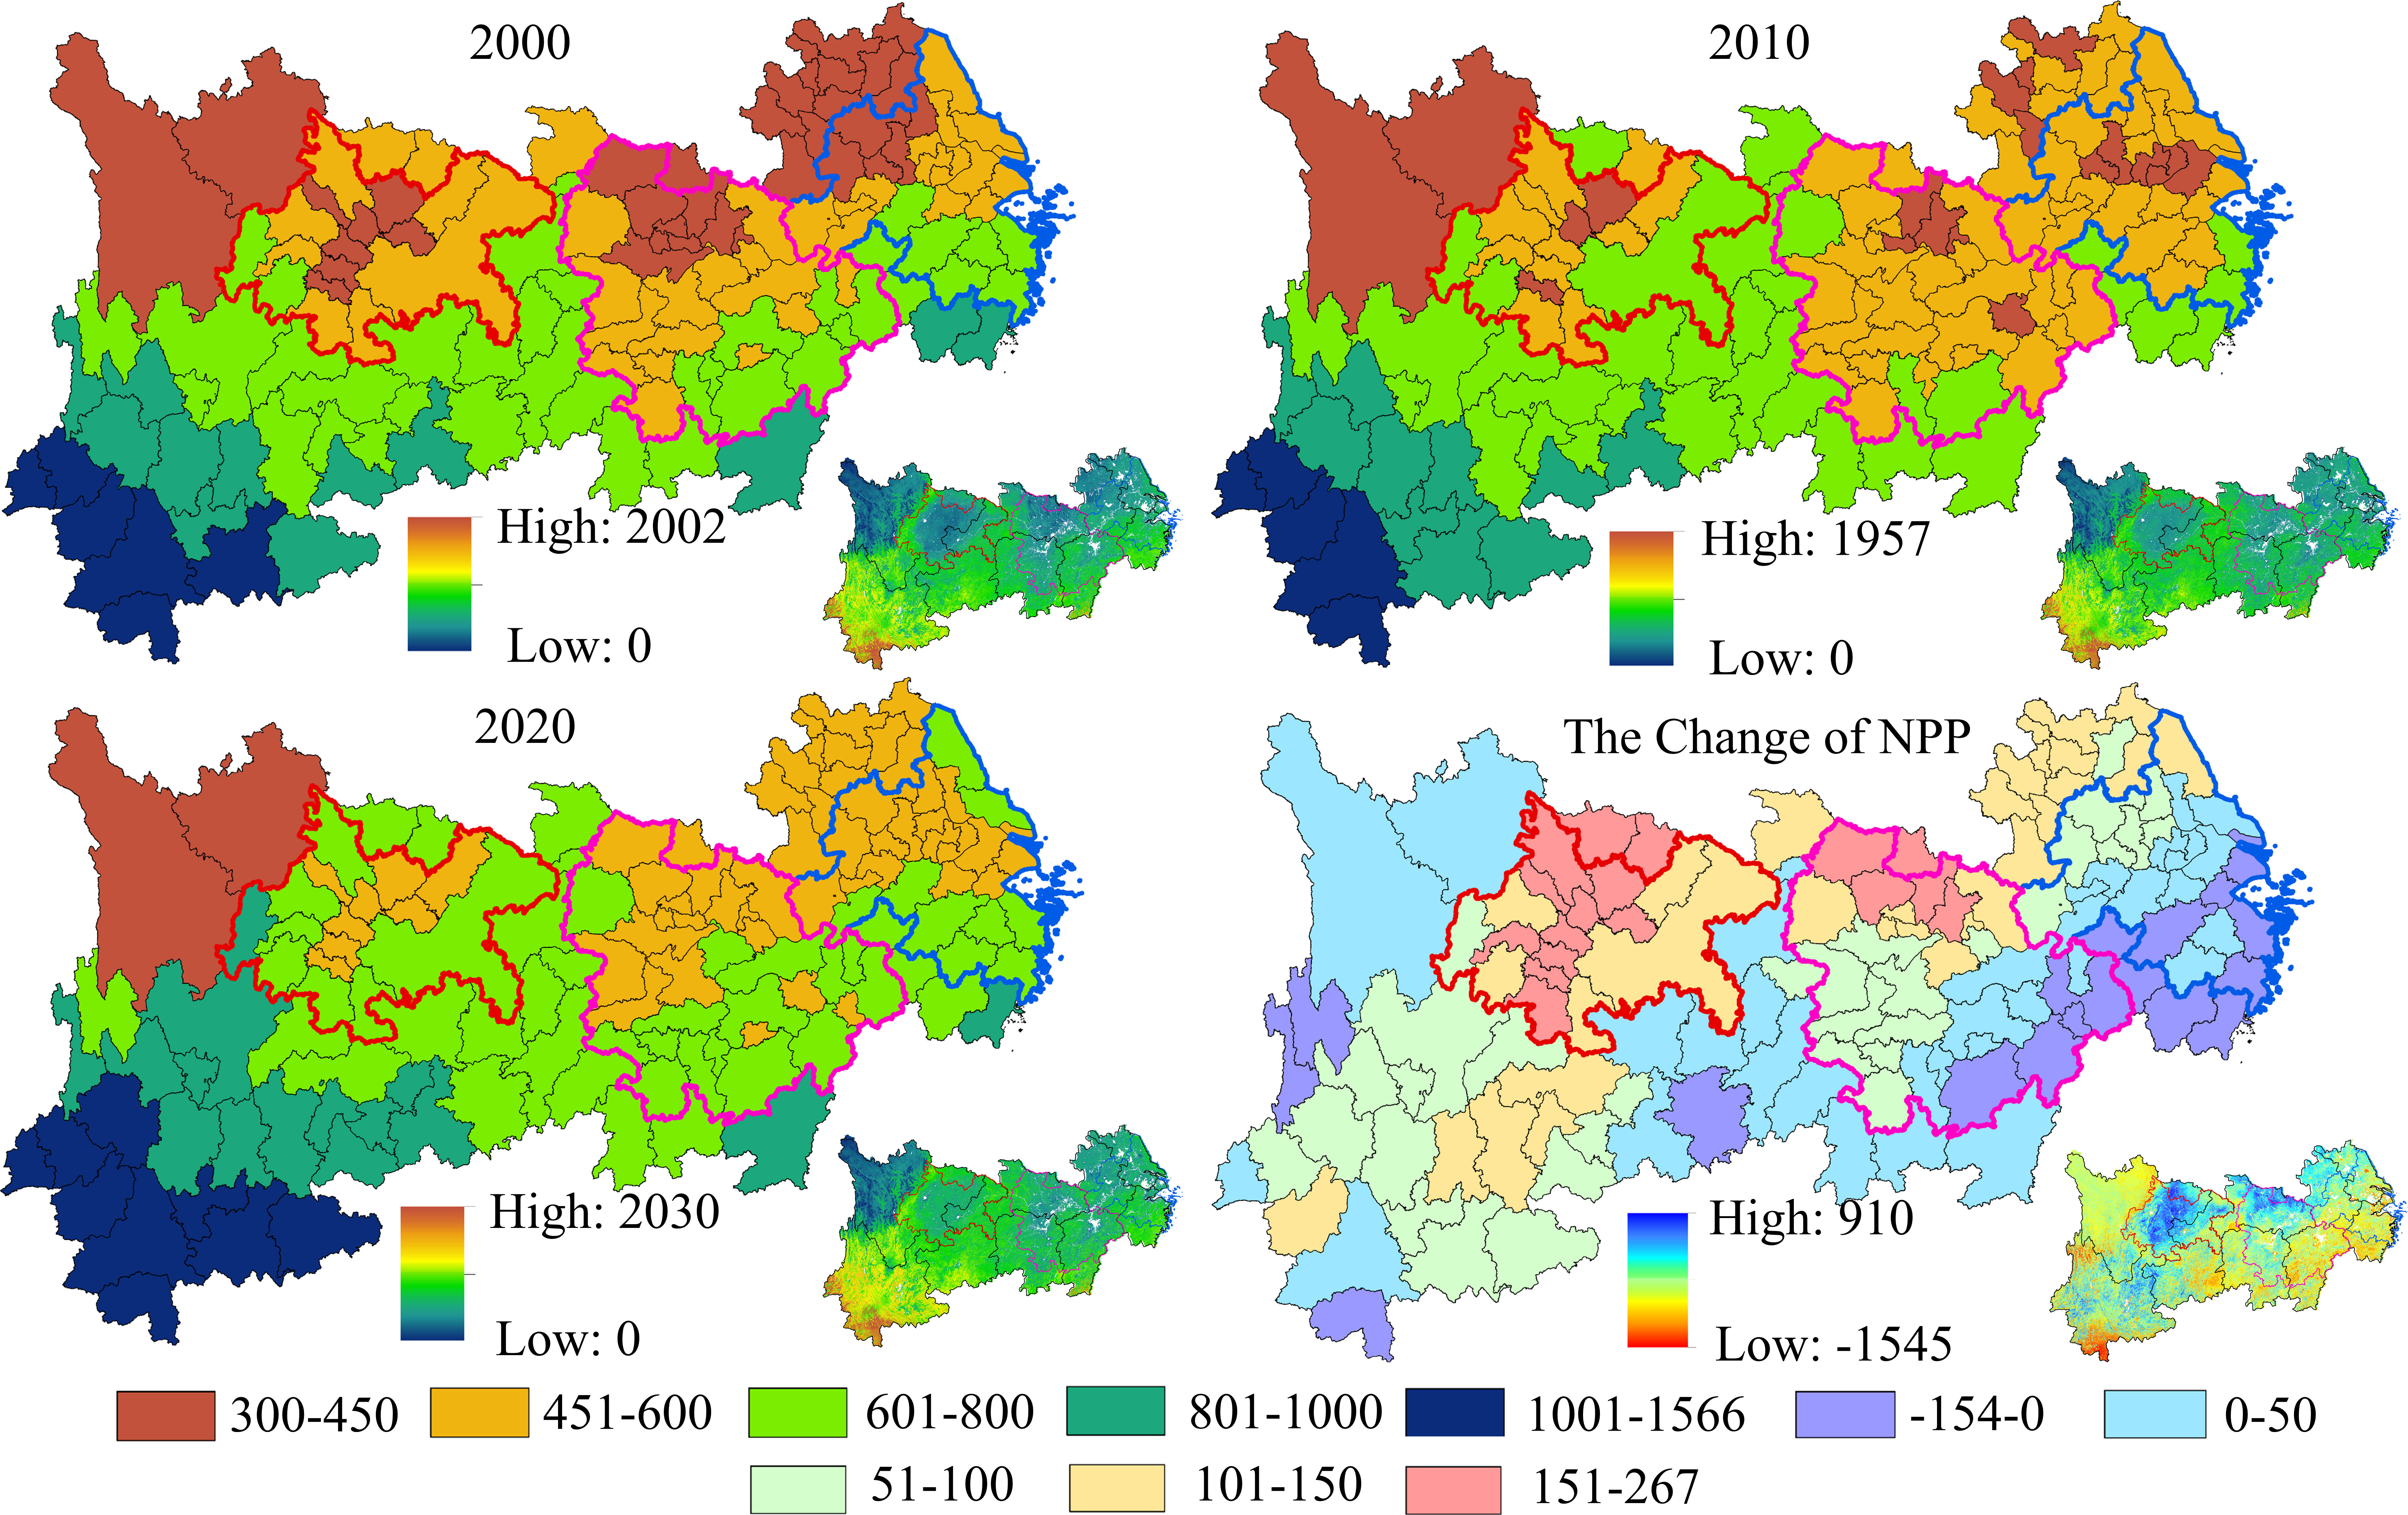
Figure 4 Spatio-temporal changes of NPP in YEB, 2000–2020.
The overall average UL index of the YEB grew from 22.485% to 23.652% with an average annual growth rate of 0.253% from 2000 to 2020 (Figure 5). Among them, the UL index of the MYRYU has the most significant growth, with an increase of 17.455% from 2000 to 2020, followed by CCU and YRD, while the UL index of YRD is usually the highest, with a UL index of 42.982% in 2020. In terms of spatio-temporal dynamic distribution, the level of urbanization in the YEB gradually changes from “high in the east and low in the west” to a distribution pattern with urban agglomerations as the regional core. In 2000, it was presented as the eastern UL high-value group with Shanghai as the core. By 2010 and 2020, the UL indexes of Wuhan, Changsha, Chongqing and other central cities in the central and western regions grew rapidly, gradually forming a pattern of UL high-value distribution led by the core cities of urban agglomerations. In terms of the change trend, 37.984% of the cities in the YEB have a decreasing trend in UL index, mainly in the northwestern cities represented by Aba and the northeastern cities represented by Bozhou. However, this does not imply a degradation of the urbanization process, as the UL index is performed based on a standardized formula (Eq. 2), the variation of the UL index mainly shows the degree of difference in urbanization levels and the change in the rank order among cities in the YEB. The cities with significant UL index growth are mainly located in the eastern part of the MYRYU and the southern part of the YRD. In particular, the UL indexes of Jiujiang, Suzhou and Changsha increased by 17.747%, 14.900% and 15.444%, respectively.
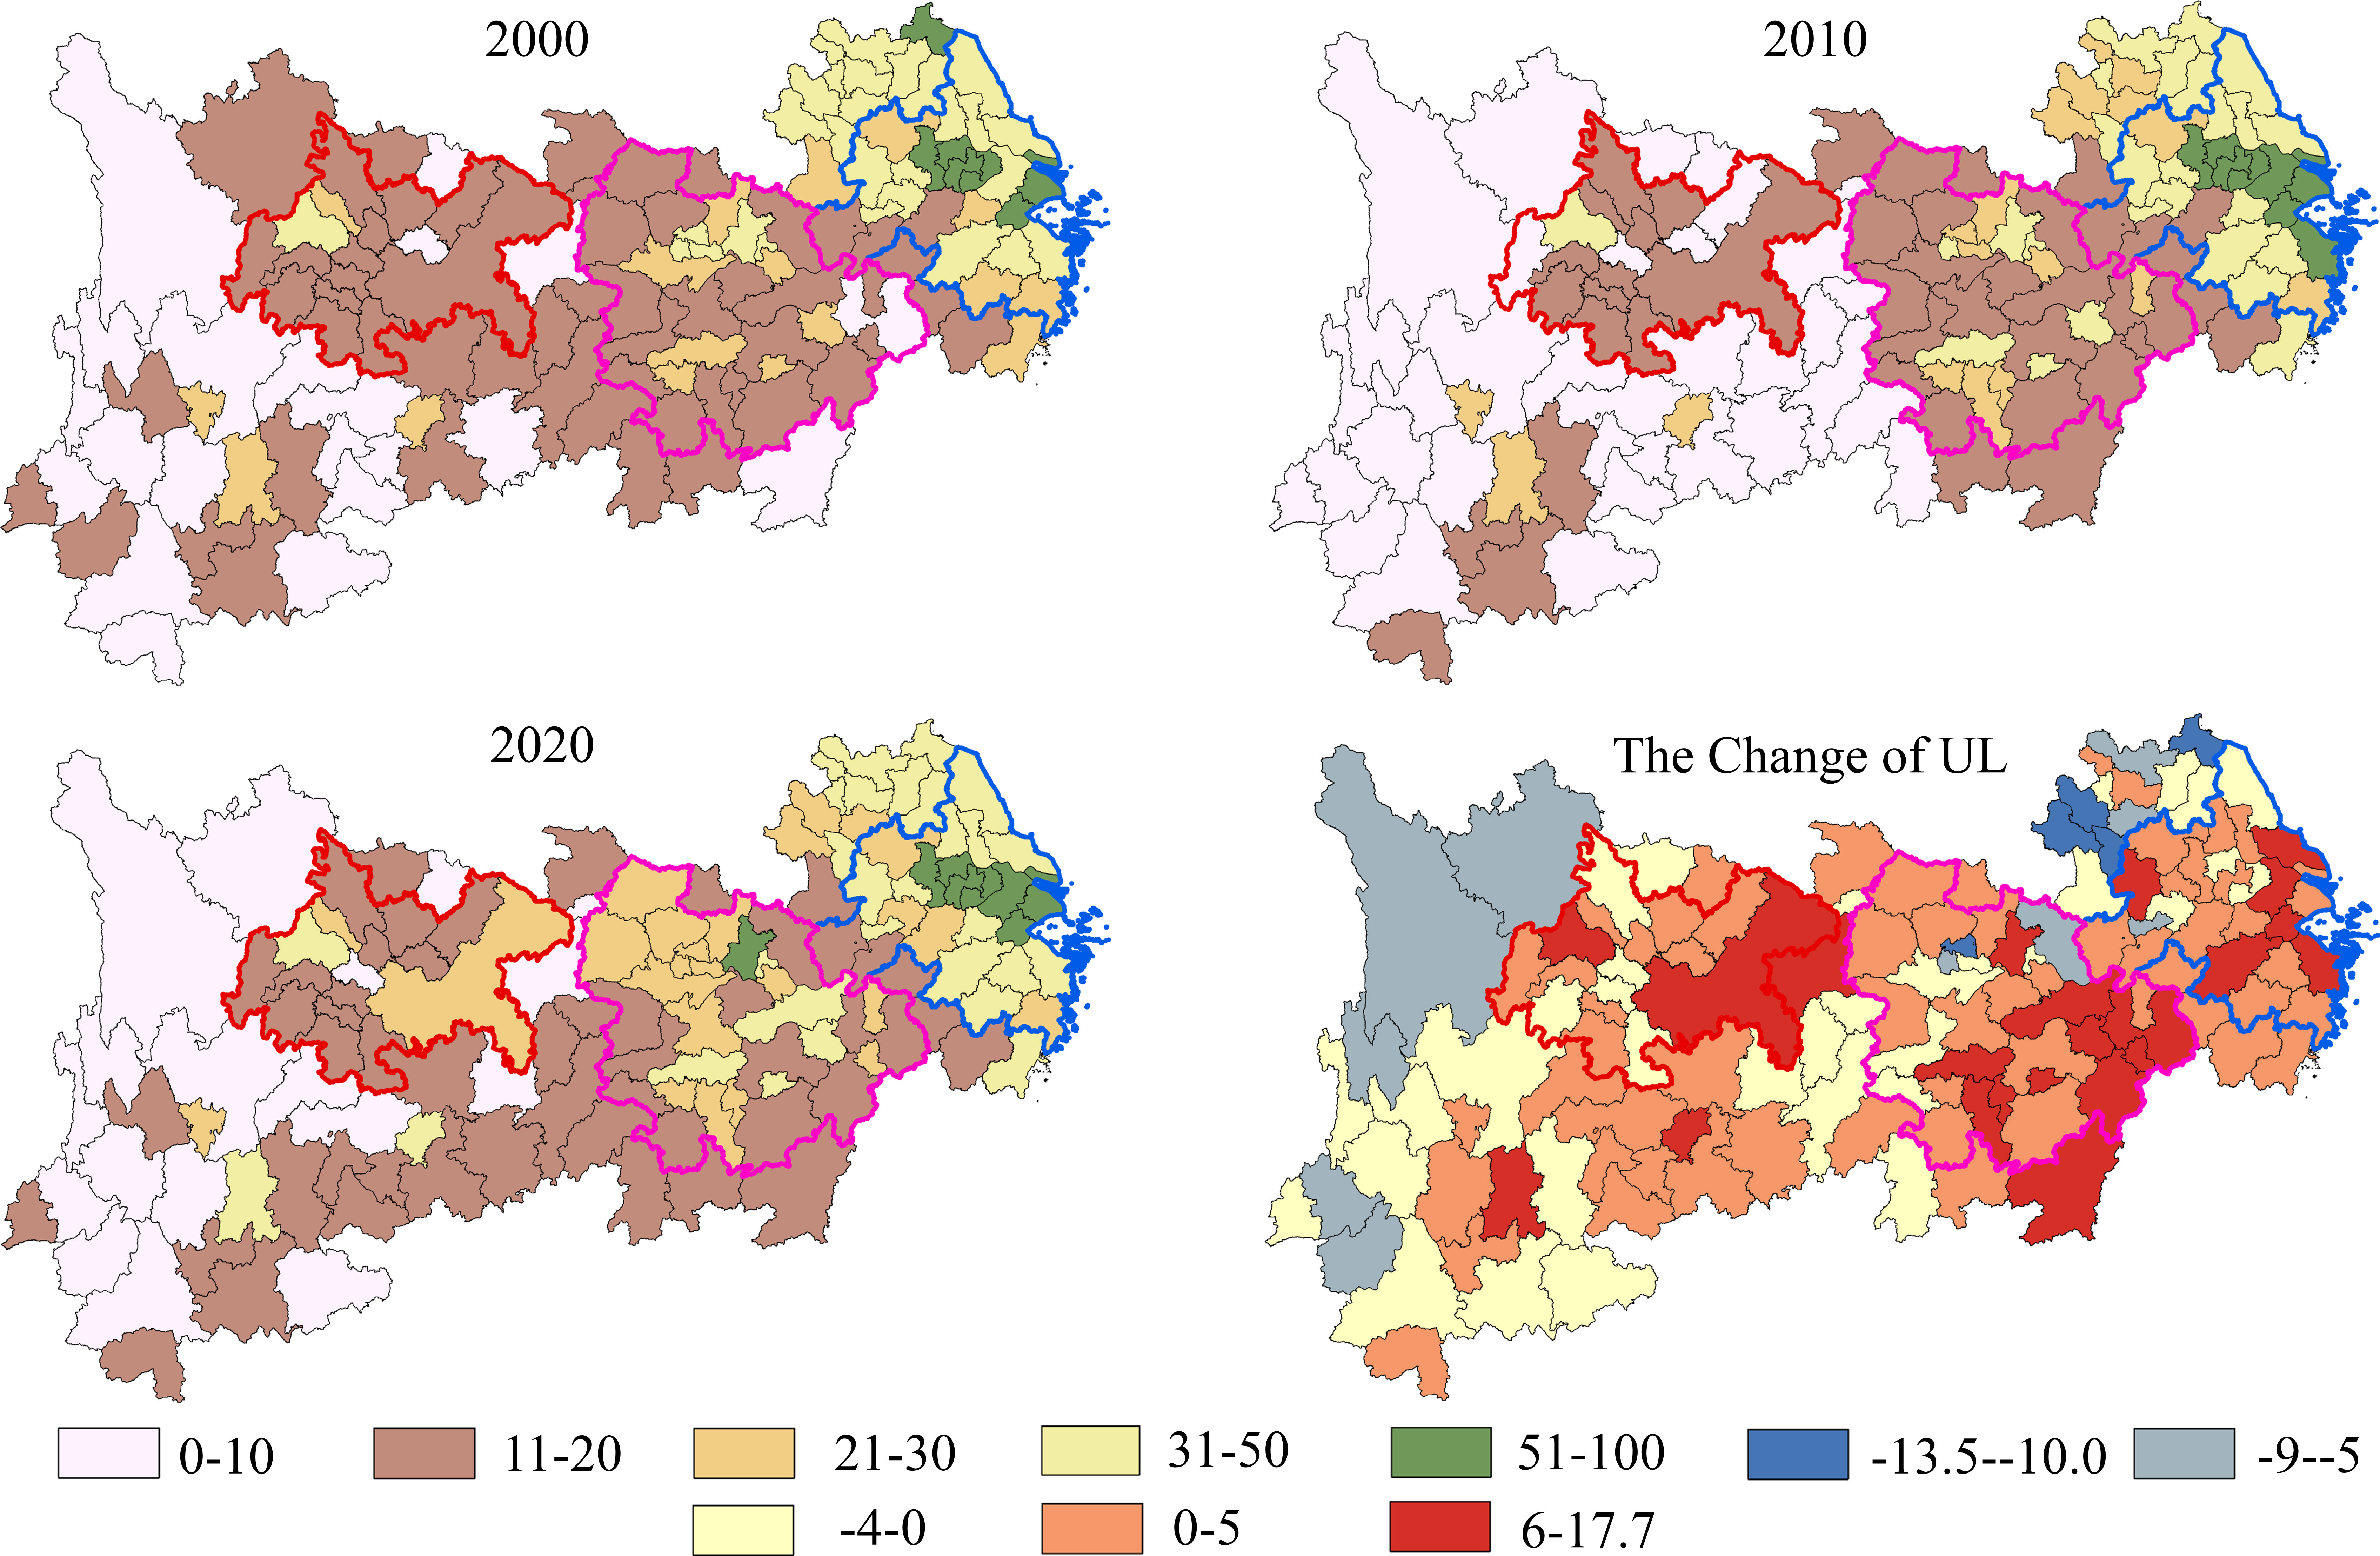
Figure 5 Spatio-temporal changes in urbanization levels in the YEB, 2000–2020.
3.2 Spatial correlation analysis of urbanization and NPP in YEB
Figure 6 shows the change trend of bivariate global autocorrelation and local autocorrelation of UL index with NPP in YEB from 2000 to 2020. The global Moran’s I for UL and NPP in 2000, 2010 and 2020 are −0.350, −0.380 and −0.419 (p-value = 0.001), respectively, which indicate an overall increasingly significant negative spatial autocorrelation between urbanization and NPP in the YEB. In terms of bivariate local autocorrelations, UL and NPP negatively correlated cluster cities (containing both High-Low and Low-High cluster types) are dominant, and the share increases from 24.806% to 33.333% during the study period. This validates the increasingly significant negative spatial autocorrelation between urbanization and NPP in the YEB, and confirms the urgent need to adjust urbanization pathways in the region to reduce the negative impacts on vegetation ecosystems and carbon cycle functions. “High-Low” is the dominant cluster type in the bivariate spatial correlation, and the number of cities increased from 13.178% to 20.930%, followed by “Low-High” clusters, whose overall share also increased from 11.628% to 12.403%. In terms of spatio-temporal evolution, the distribution pattern of bivariate local spatial autocorrelation cluster types is relatively stable during the study period. Specifically, the “High-Low” negative correlation clusters are mainly located in Bozhou, Huai’an and other cities in Anhui and northern Jiangsu. The prominent scale of population, arable land, and construction land in these cities (Figure 1) generates significant encroachment on vegetated ecosystems, resulting in relatively high levels of urbanization and relatively low NPP in the region.
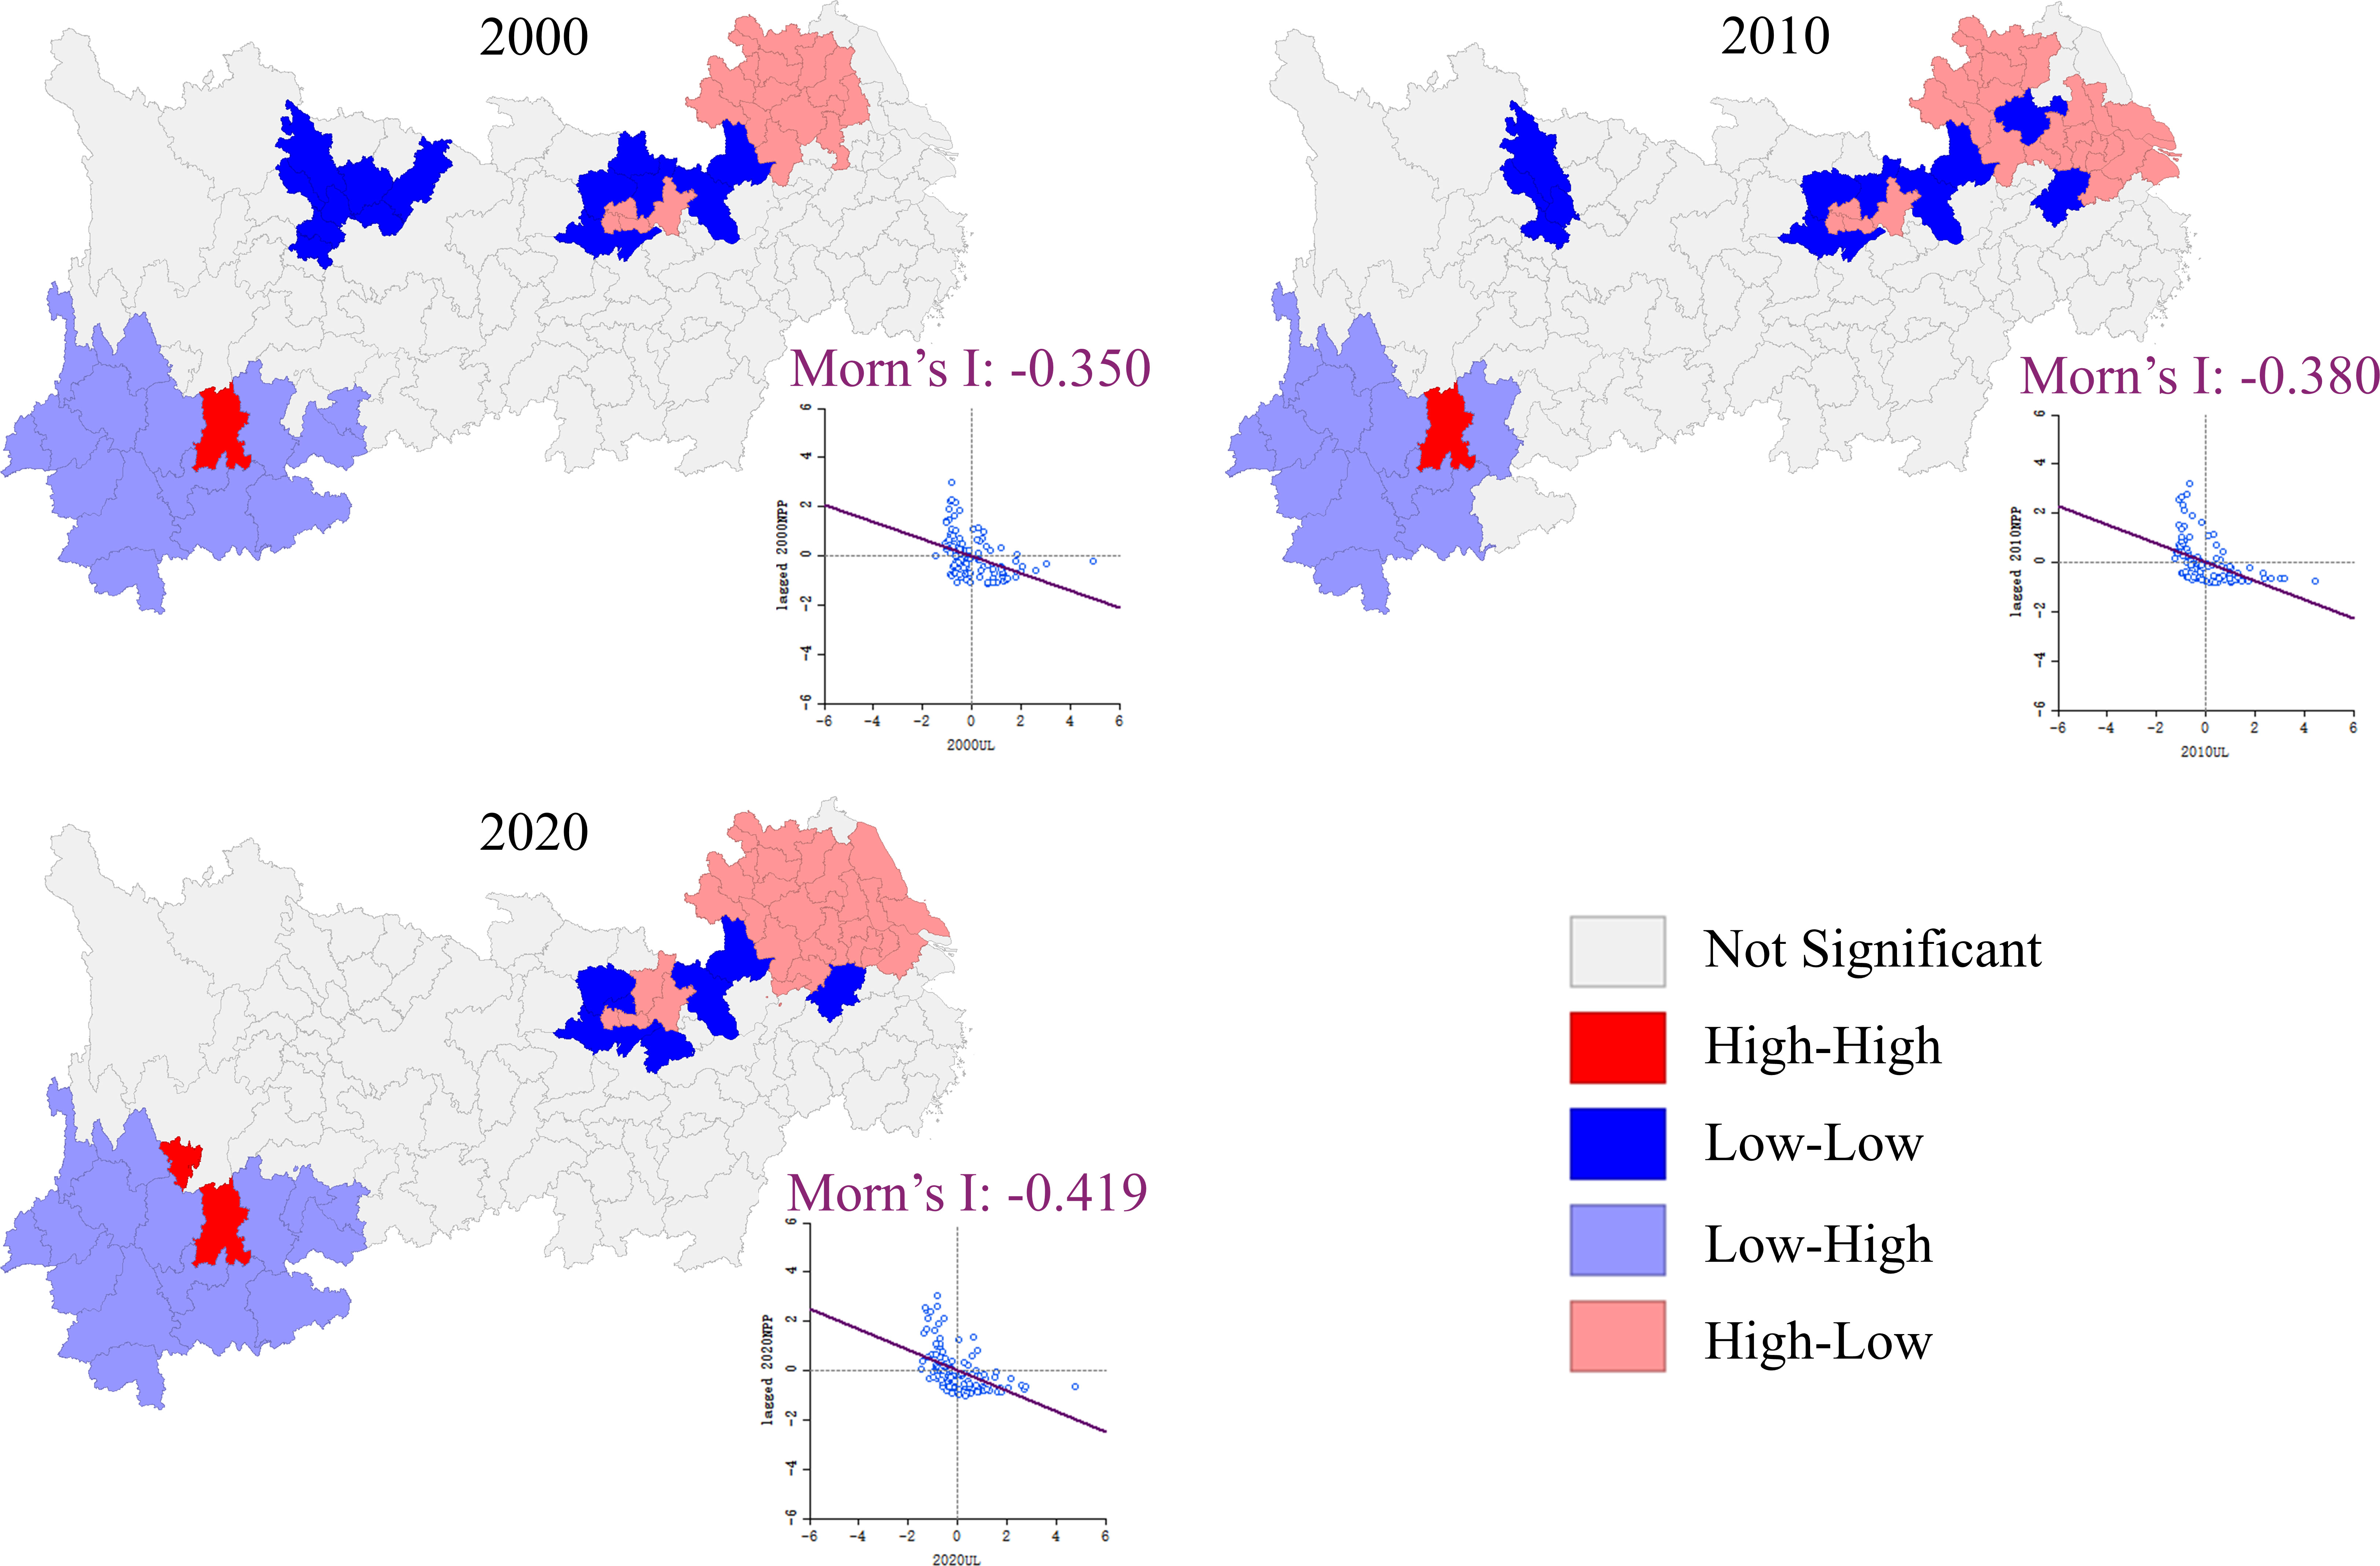
Figure 6 Bivariate spatial global autocorrelation scatter plot and local autocorrelation LISA plot of urbanization and NPP in YEB, 2000–2020.
The “Low-High” negative correlation clusters cities are generally located in the southwestern region, such as Xishuangbanna, Lincang and Pu’er. These cities are located near the “Hu Huanyong population density line” in China, where the human footprint is relatively sparse and the terrain is complex, with many forested and mountainous areas off the beaten path. The excellent natural ecological background and the low intensity of urban development have contributed to the low level of urbanization but high quality plant ecosystems in the area. The “High-High” positive correlation clusters are mainly located in Kunming, reflecting the high quality ecological environment and the strong “siphon effect” of population, industry and resources in the region. The “Low-Low” positive correlation agglomeration is mainly laid out in Huanggang, Jingzhou and Jingmen and other cities in the middle reaches of the Yangtze River. Combined with the performance of multidimensional urbanization, these cities have low levels of land and economic urbanization, have significant gaps in urban development intensity compared to Wuhan, and are subject to significant resource siphoning. At the same time, due to the location in Jianghan Plain, organic matter produced by photosynthesis of grassland vegetation is more disadvantaged than that of mountainous woodlands in humid climate, resulting in relatively disadvantaged urbanization level and vegetation ecosystem productivity in this region.
3.3 Analysis of the driving impact of urbanization on NPP in the YEB
3.3.1 Driving impact of urbanization on NPP in a global perspective
All variables after logarithmization and normalization passed the multi-collinearity and Moran tests, while LM-SLM, LM-SEM tests and LR-SLM and LR-SEM significantly rejected the original hypothesis at 1% confidence level (Table 2). Based on this, we used SDM model to detect the driving impact of urbanization on NPP, and the regression results are shown in Table 2. It was found that the driving effect of UL on NPP was significantly negative in different periods, verifying the significant negative feeder effect of urbanization on the productive capacity of vegetation cover systems in the YEB. In terms of coefficient changes, the driving influence of UL showed an inverted “U” shape, with statistically significant regression coefficients of −0.165, −0.223 and −0.166 in 2000, 2010 and 2020, respectively. The effect of control variables also received further attention. For example, the driving influence of the value added of the tertiary sector as a share of GDP on NPP is significantly positive in different periods. This indicates that the tertiary sector not only has low consumption and emission characteristics, but also the businesses involved in computer and digital information technology contribute to the restoration and management of urban vegetation ecosystem. Slope and elevation had a significantly positive effect on NPP during some periods, indicating that slope and elevation also played a significant role in contributing to the conservation of vegetated ecosystems.

Table 2 Regression results based on SDM model.
However, according to LeSage and Pace (2009), the SDM coefficients do not reflect either the direct, spillover, or total effects of the independent variables. This is because analyzing the spatial spillover effects between regions through simple point regressions would produce erroneous estimates, and a decomposition with reference to P.D.E is needed to better understand the effect of urbanization on NPP. It is found that urbanization in both local and neighboring regions has a significant negative effect on NPP in the Yangtze River Economic Zone in some periods. For example, every 1% increase in the UL index in 2020 will directly lead to a 0.277% decrease in local NPP and indirectly lead to a 1.319% decrease of NPP in neighboring regions. Among them, the direct negative effect of urbanization is statistically significant in all periods, and this direct effect generally fluctuates in growth, with direct effect elasticity coefficients of −0.274 and −0.277 in 2000 and 2020, respectively. Although the elasticity coefficient is not significant in 2010, the spillover effect of urbanization on the impact of NPP achieves an overall convergence from 2000 to 2020. The elasticity coefficients of spillover effects for UL are −1.463 and −1.319 in 2000 and 2020, respectively, with an absolute decrease of 9.843% in the regression coefficient. This indicates that the negative effect of urbanization on NPP in neighboring areas has converged. In addition, the comparison of the direct effect with the spillover effect raises concern, as the survey shows that the spillover effect of urbanization on NPP is much more than the direct effect in a statistical sense. For example, the elasticity coefficient of the direct effect of urbanization in 2000 is −0.274, while the spillover effect is −1.463.
3.3.2 Driving impact of urbanization on NPP in a local perspective
To further analyze the local effects of urbanization on the NPP in the YEB, especially to reveal the local heterogeneous characteristics of the impact in the three major urban agglomerations, we constructed a GWR analysis model based on ArcGIS platform (Figure 7). The investigation showed that the Adjusted R2 was 0.945, 0.909 and 0.971, Sigma was 57.816, 78.262 and 46.461, and AICc was 1430.183, 1508.319 and 1374.427 for the three periods in GWR estimation, respectively. The spatially heterogeneous characteristics of the impact of urbanization on NPP in the YEB are significant, validating the need to monitor the driving effects from a local perspective. Specifically, urbanization in the west maintains a significant negative shock, while the overall pattern of the driving effect of UL on NPP gradually shifts to a regional heterogeneity of positive in the east and negative in the west. The reason may be that western cities such as Lincang and Baoshan are located on the Yunnan-Guizhou Plateau where forest vegetation is abundant, and the base of urban development intensity is low, but the risk sensitivity of the forest cover system is higher, and they are more affected by the disturbance of human activities in the crude urban construction activities. In contrast, with the continuous development of urban ecological resilience construction concepts and low-carbon green development technologies in the eastern region, the impact of urbanization on vegetation ecosystems and their productivity has gradually diminished. It even promotes the growth of urban NPP to some extent based on urban ecological planning policies such as park cities and green corridors.
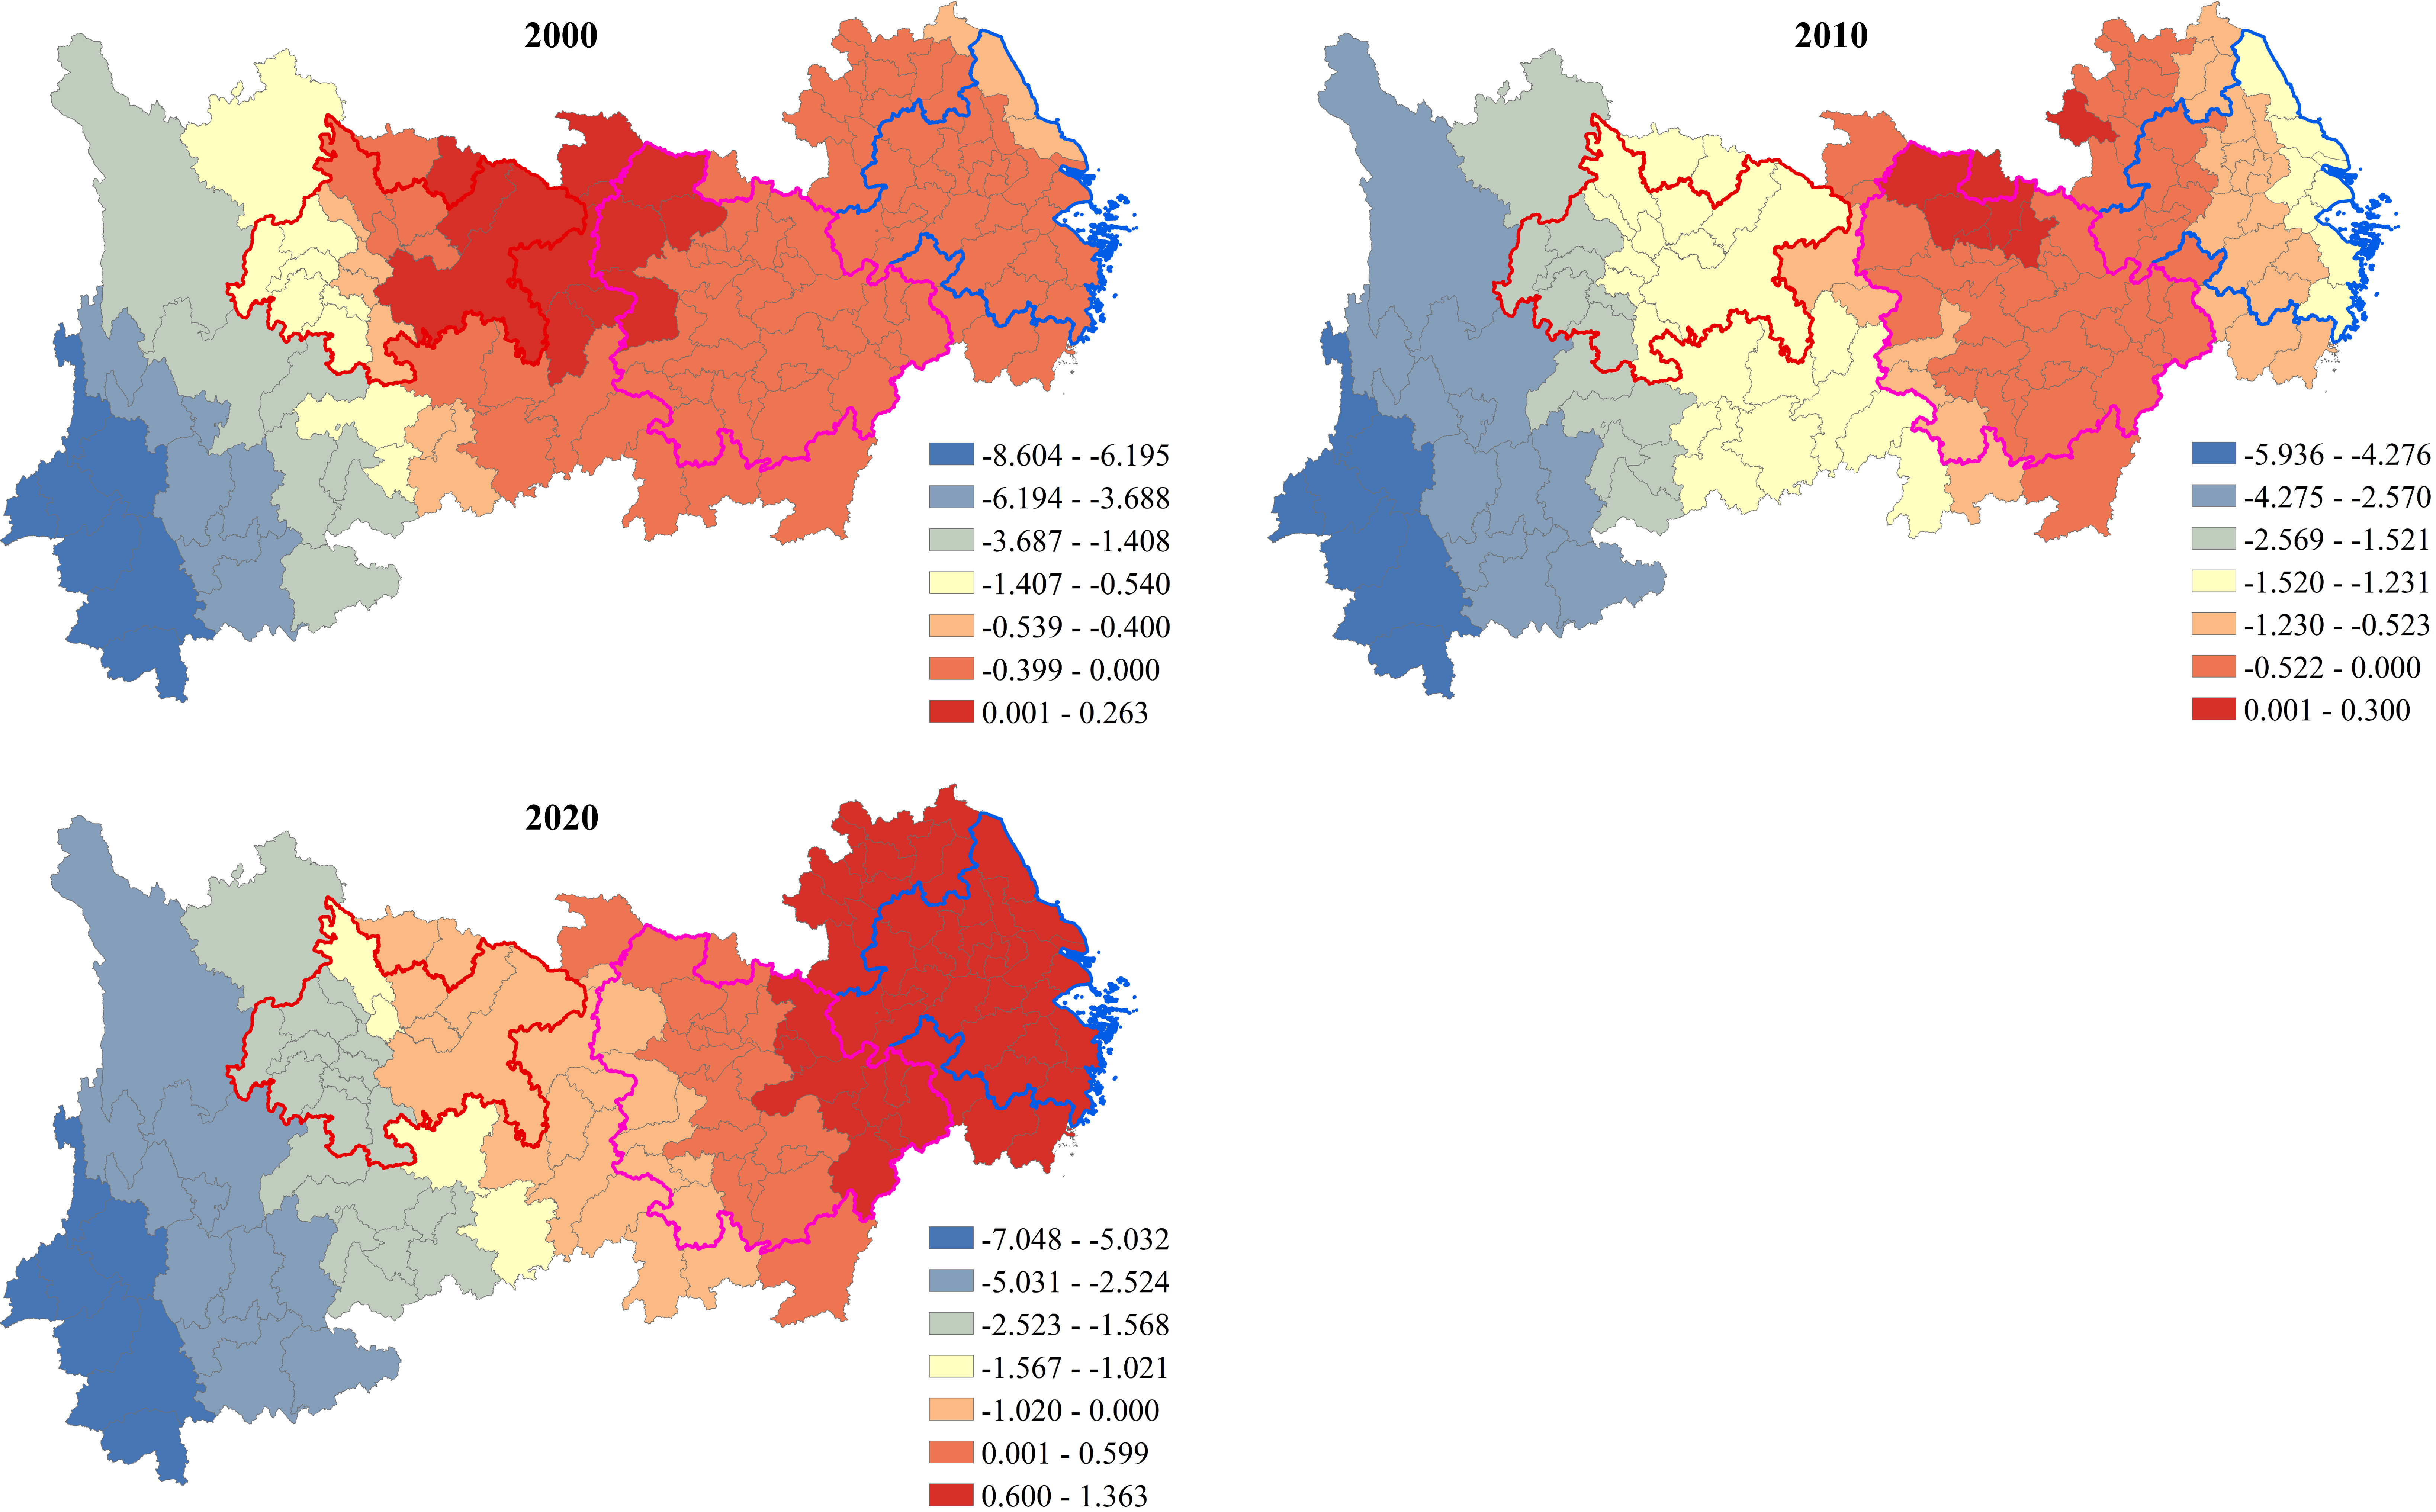
Figure 7 Distribution of regression coefficients based on GWR model.
In terms of the divergent performance of the urban agglomerations, the effect of UL on NPP is negative for all of the YRD in 2000. While most of the cities in the MYRYU show negative effects, the effects in western mountainous cities such as Jingmen, Xiangyang and Yichang are positive. The driving influence of UL in the western cities of CCU is significantly negative, while Chongqing and Dazhou show positive effects. In 2010, the negative effect of UL in the YRD urban agglomeration further increases and shows a gradient pattern of decreasing from east to west. The pattern of regression coefficients is more stable in the MYRYU, but the negative effect of UL on NPP increases overall, and the UL turns negative in the whole area of CCU. In 2020, the impact of UL on NPP for cities in the whole YRD turns from negative to positive, the positive effect cities in the MYRYU shift to eastern cities such as Shangrao, Huanggang and Jiujiang, and the impact of UL on NPP for cities in CCU are still all negative, but the overall negative impact has converged.
4 Discussion
4.1 Direct and spillover effects of the impact of urbanization on NPP
The direct effect of urbanization on NPP has been confirmed in previous studies, which emphasize the substantial conversion of ecological spaces such as grasslands and woodlands to production-living spaces during urbanization, resulting in the derogation of vegetation cover systems and leading to a decrease in regional NPP levels (Yang et al., 2021). Our study considers urbanization as a unified system, integrating urbanization elements such as population urbanization, economic urbanization, and land urbanization, providing an comprehensive perspective for investigating the impact of urbanization on NPP (Chen et al., 2020). The findings emphasize that the negative effect of urbanization on NPP is not only in the local area, but more widely a spillover effect that goes far beyond the local effect. The former may be related to the inherent resource-consuming activities of cities (Sharma et al., 2022; Zhong et al., 2021; Chen et al., 2023). Urban population migration and industrial boom increase the demand for natural resources and production-living space, while land urbanization implies the conversion of a large amount of ecological space to artificial impervious surfaces. These urbanization processes have, to some extent, directly or indirectly enhanced the encroachment on native vegetation cover systems and challenged the carbon cycling capacity of vegetation. The latter may have some connection with the regional integration construction of the Yangtze River Economic Belt. As a national strategic development region in China, the Yangtze River Economic Belt forms an integrated cooperation space with Shanghai as the leader and urban agglomerations along the route as the core. The region has gradually built synergistic channels in technological innovation, data integration, and industrial chain construction (Tian and Pang, 2022). With the support of regional integration, ecological product consumption actions can influence neighboring urban markets through the integrated “land, water, and air” channel, thus indirectly causing cross-regional ecological consumption of vegetation (Wang et al., 2022).
4.2 Heterogeneity in the impact of urbanization on NPP in three major urban agglomerations
The spatial heterogeneity of the impact of UL on NPP in urban agglomerations in the YEB is verified in this study, which complements previous studies based on individual urban agglomerations or the YEB as a whole. For example, Qiao and Huang (2022) assessed the ecosystem health of the YRD and evaluated the impact of land urbanization on ecosystem health. Chen et al. (2022) based on NDVI index explored the ecosystem health level of the MYRYU, and pointed out a U-shaped relationship between urbanization and ecosystem health. Our investigation finds that the NPP of the CCU is most strongly influenced by UL, especially the negative influence of western cities is significantly stronger than that of eastern cities such as Chongqing. The reason for this phenomenon may be that the western part of the CCU is surrounded by mountains and hills, with a high quality forest ecological substrate and carbon sequestration capacity, and urban development activities have modified the local forest ecosystem to a more obvious extent. In contrast, most of the eastern cities such as Chongqing are located in the plains and have relatively more homogeneous NPP of grassland ecosystems, which, together with more modern urban planning and green economy construction, contribute to the ecological resilience of these cities to resist urbanization (Li et al., 2023; Luo et al., 2023). The distribution pattern of UL effects in the MYRYU remains relatively stable, but it is noteworthy that the UL of cities in the eastern part of the urban agglomeration is positive in 2020. This may have some synergistic relevance to urban ecological planning in the region (Chen et al., 2022; Liu et al., 2023; Ma et al., 2023). At the end of 2009, China released the “Poyang Lake Ecological Economic Zone Plan”, which tries to build the Poyang Lake area into an advanced and efficient ecological industrial cluster and gradually build a new urban agglomeration with ecological livability. This promotes the ecological restoration of vegetation and the sustainable construction of urbanization in the area. The driving effect of UL on NPP in the YRD turns from negative to positive, which may be related to the implementation of ecological co-protection planning in the region. By proliferating green production processes, circular economy technologies and energy saving and emission reduction standards of the core cities of Shanghai, Nanjing, Hangzhou and Hefei, the overall ecological restoration governance and urban sustainability of the YRD urban agglomeration can be promoted (Luo et al., 2021; He et al., 2023).
4.3 Policy implications
Our study confirms that widespread significant negative ecological effects of urbanization exist in the YEB, where vegetation carbon cycle function and ecological stability were challenged, and ecological resilience building strategies based on optimal urbanization management perspectives should receive attention. In terms of land urbanization, constraints on the rough expansion of production-living space should be strengthened, and more attention should be paid to the vegetation protection and land development approval in new urban areas. The renewal of urban parks, corridors, green space construction and intensive and optimal use of land in old urban areas should also be mentioned more often. In terms of population urbanization, a concept that focuses on green and low-carbon living and consumption should be mentioned more often, with attention to people-centered vegetation and ecological restoration efforts. In terms of economic urbanization, we will strengthen the breakthrough of circular economy and green production process, and accelerate the transformation of low carbon and green industry for alleviating the plundering of vegetation and ecological resources by urban economic development. Moreover, our study confirms that the negative ecological effect of urbanization has a significant spillover effect, which actually provides fundamental evidence for the joint regional ecological management of the YEB. More improved communication channels on information technology, greening industrial chains and pollutant emission standards should be established between cities. Meanwhile, the sharing of information related to ecological monitoring, pollution emission and climate change should be enhanced to optimize the urbanization paths and patterns of the YEB from an overall perspective. From the direction of urban agglomeration optimization, the CCU needs to strengthen the ecological restoration of vegetation in western cities and formulate gradual construction of human settlements and resource extraction activities. The MYRYU should pay more attention to the ecological conservation work in the western Hunan region, and strengthen the protection of mountainous forests and grassland management. The YRD should further improve urban ecological planning policies and enhance urban livability, focusing on the transmission of urban ecological resilience construction ideas and the diffusion effect of green production technologies. In this way, to promote the YEB to form a green development path guided by urban agglomerations.
5 Conclusion
Previous studies have rarely considered the global and local effects of urbanization on NPP in the YEB, and the direct and spillover effects of urbanization have rarely been systematically investigated. This study analyzed the spatio-temporal dynamic patterns of NPP and urbanization levels in the YEB based on remote sensing images and socioeconomic statistics, and investigated the global and local impacts of urbanization on NPP based on the SDM and GWR model. The highlight of our study is to focus on the direct and spillover effects of urbanization on NPP, in particular, we also explore the regional heterogeneity of the impact of urbanization on NPP at the scale of urban agglomerations based on local effects analysis. To our knowledge, this is rare in previous studies on the linkage between urbanization and ecological environment in the Yangtze River Economic Belt, especially since the natural and socio-economic differences among the three major urban agglomerations prompt this impact differentiation analysis to be more instructive. Some meaningful conclusions are drawn as a result: (1) From 2000 to 2020, the average NPP of Yangtze River Economic Zone increased from 592g*c/m2 to 670g*c/m2 at a rate of 0.621% (Figure 3A), and showed a distribution pattern of “high in the south and low in the north, high in the west and low in the east” and the change pattern of “increasing in the north and decreasing in the south”. (2) The average UL index of the YEB in general grew from 22.485% to 23.652% with an average annual growth rate of 0.253% from 2000 to 2020, and gradually changed to a clustering pattern with urban agglomerations as the regional core. (3) There is an increasingly significant negative spatial autocorrelation between urbanization and NPP in general, with “High-Low” being the dominant cluster type in the bivariate spatial correlation between UL and NPP, followed by “Low-High” clusters. (4) The negative direct effect of urbanization on NPP in the Yangtze River Economic Zone shows a fluctuating growth trend, while a negative spillover effect, which far exceeds the direct effect and declines slowly, is widespread. In addition, the local non-stationarity of the impact of urbanization on NPP is verified, and the three major urban agglomerations show a differentiated pattern and development direction of the driving effect. More importantly, based on the “population–land–nature” complex ecosystem theory, our study explores the optimal strategies for vegetation ecological security maintenance and sustainable urban development in the YEB. Mainly from various aspects, including multi-dimensional urbanization management, joint spatial governance and ecological conservation paths of urban agglomerations.
This study provides new evidence to reveal the driving mechanism of vegetation net primary productivity by urbanization construction in the YEB. The study of local changes in the mechanisms of the impact of urbanization on vegetation ecosystems can provide important conditions for the development of vegetation ecosystem management strategies in the YEB. The discussion of direct and spillover effects has the potential to provide the necessary support for joint urban governance and ecological synergistic optimization pathways. There are still some shortcomings. First, the study is based on cross-sectional data, which makes it difficult to observe long-term continuous changes in the impact of urbanization on NPP. In the future, a panel database will be established to focus on the long time series variation of the driving effects based on the SPDM model. Second, the study focused on the driving effect of the combined urbanization indicators on NPP, but the decomposition effects of population urbanization, economic urbanization, and land urbanization on NPP could not be investigated. The heterogeneity of the effects of urbanization sub-dimensional indicators on NPP will be further analyzed in the future.
Data availability statement
Publicly available datasets were analyzed in this study. This data can be found here: http://www.geodata.cn/.
Author contributions
SW and GW conceived the study. SW obtained funding for the study. SW, MG and YF performed the statistical analysis. SW produced the figures and tables and wrote the first draft of the manuscript. GW and YF modified and checked this manuscript. All authors contributed to the article and approved the submitted version.
Funding
This research was supported by Guizhou Provincial Science and Technology Projects (Qian Ke He Ji Chu-ZK[2022] General 234).
Conflict of interest
The authors declare that the research was conducted in the absence of any commercial or financial relationships that could be construed as a potential conflict of interest.
Publisher’s note
All claims expressed in this article are solely those of the authors and do not necessarily represent those of their affiliated organizations, or those of the publisher, the editors and the reviewers. Any product that may be evaluated in this article, or claim that may be made by its manufacturer, is not guaranteed or endorsed by the publisher.
References
Bai J., Guo K., Liu M., Jiang T. (2023). Spatial variability, evolution, and agglomeration of eco-environmental risks in the Yangtze river economic belt, China. Ecol. Indic. 152, 110375. doi: 10.1016/j.ecolind.2023.110375
Chen W., Gu T., Zeng J. (2022). Urbanisation and ecosystem health in the middle reaches of the Yangtze river urban agglomerations, China: a U-curve relationship. J. Environ. Manage. 318. doi: 10.1016/j.jenvman.2022.115565
Chen M., Jia W., Du C., Shi M., Henebry G., Wang K. (2023). Carbon saving potential of urban parks due to heat mitigation in Yangtze river economic belt. J. Cleaner Production 385, 135713. doi: 10.1016/j.jclepro.2022.135713
Chen Y. X., Liu C., Li H. F., Xue X. Z. (2023). How do countries along the maritime silk road perform in sustainable use of natural resources? progress of natural resources-related SDGs. Ecol. Indic. 149, 110194. doi: 10.1016/j.ecolind.2023.110194
Chen J., Wang L. J., Li Y. Y. (2020). Research on the impact of multi-dimensional urbanization on china's carbon emissions under the background of COP21. J. Environ. Manage. 273, 111123. doi: 10.1016/j.jenvman.2020.111123
Dong Y., Peng F., Li H., Men Y. (2023). Spatial autocorrelation and spatial heterogeneity of underground parking space development in Chinese megacities based on multisource open data. Appl. Geogr. 153, 102897. doi: 10.1016/j.apgeog.2023.102897
Guido S., Christian K., Katerina T., David D., Jeffrey D. S. (2017). National baselines for the sustainable development goals assessed in the SDG index and dashboards. Nat. Geosci. 10 (8), 547–555. doi: 10.1038/ngeo2985
Guo Q., Dong Y., Feng B., Zhang H. (2023). Can green finance development promote total-factor energy efficiency? empirical evidence from China based on a spatial durbin model. Energy Policy 177, 113523. doi: 10.1016/j.enpol.2023.113523
He T., Dai X., Li W., Zhou J., Zhang J., Li C., et al. (2023). Response of net primary productivity of vegetation to drought: a case study of qinba mountainous area, China, (2001–2018). Ecol. Indic. 149, 110148. doi: 10.1016/j.ecolind.2023.110148
Li J., Bi M., Wei G. (2022). Investigating the impacts of urbanization on vegetation net primary productivity: a case study of Chengdu–Chongqing urban agglomeration from the perspective of townships. Land 11 (11), 2077. doi: 10.3390/land11112077
Li W., Kang J., Wang Y. (2023). Spatiotemporal changes and driving forces of ecological security in the chengdu-chongqing urban agglomeration, China: quantification using health-services-risk framework. J. Cleaner Production 389, 136135. doi: 10.1016/j.jclepro.2023.136135
Li W., Zhang Y., Yang C., Gong W., Wang C., Zhang R. (2022). Does producer services agglomeration improve urban green development performance of the Yangtze river economic belt in China? Ecol. Indic. 145, 109581. doi: 10.1016/J.ECOLIND.2022.109581
Liu X., Huang Y., Xu X., Li X., Ciais P., Lin P., et al. (2020). High-spatiotemporal-resolution mapping of global urban change from 1985 to 2015. Nat. Sustainability 3 (7), 564-570. doi: 10.1038/s41893-020-0521-x
Liu X., Pei F., Wen Y., Li X., Wang S., Wu C., et al. (2019). Global urban expansion offsets climate-driven increases in terrestrial net primary productivity. Nat. Commun. 10 (1), 1–8. doi: 10.1038/s41467-019-13462-1
Liu L., Yang Y., Liu S., Gong X., Zhao Y., Jin R., et al. (2023). A comparative study of green growth efficiency in Yangtze river economic belt and yellow river basin between 2010 and 2020. Ecol. Indic. 150, 110214. doi: 10.1016/j.ecolind.2023.110214
Luo D., Liang L., Wang Z., Chen L., Zhang F. (2021). Exploration of coupling effects in the economy–Society–Environment system in urban areas: case study of the Yangtze river delta urban agglomeration. Ecol. Indic. 128, 107858.
Luo T., Zeng J., Chen W., Wang Y., Gu T., Huang C. (2023). Ecosystem services balance and its influencing factors detection in China: a case study in chengdu-chongqing urban agglomerations. Ecol. Indic. 151, 110330. doi: 10.1016/j.ecolind.2023.110330
Ma F., Wang J., He Y., Luo Y., Zhang R., Tian D., et al. (2023). Nitrogen enrichment differentially regulates the response of ecosystem stability to extreme dry versus wet events. Sci. total Environ. 887, 164152. doi: 10.1016/J.SCITOTENV.2023.164152
Muhammad Y. R., Maruf H. M., Chen Y. (2023). Role of economic growth, urbanization and energy consumption on climate change in Bangladesh. Energy Strategy Rev. 2023, 47. doi: 10.1016/J.ESR.2023.101088
Ouyang X., Tang L., Wei X., Li Y. (2021). Spatial interaction between urbanization and ecosystem services in Chinese urban agglomerations. Land Use Policy 2021, 109. doi: 10.1016/j.landusepol.2021.105587
Peng J., Wang X. Y., Liu Y. X., Zhao Y., Xu Z., Zhao M., et al. (2020). Urbanization impact on the supply-demand budget of ecosystem services: decoupling analysis. Ecosystem Serv. 44, 101139. doi: 10.1016/j.ecoser.2020.101139
Qiao W., Huang X. (2022). The impact of land urbanization on ecosystem health in the Yangtze river delta urban agglomerations, China. Cities 130, 103981. doi: 10.1016/j.cities.2022.103981
Saiu V., Blečić I., Meloni I. (2022). Making sustainability development goals (SDGs) operational at suburban level: potentials and limitations of neighbourhood sustainability assessment tools. Environ. Impact Assess. Rev. 96, 106845. doi: 10.1016/j.eiar.2022.106845
Sharma S., Joshi P. K., Fürst C. (2022). Unravelling net primary productivity dynamics under urbanization and climate change in the western Himalaya. Ecological Indicators 144, 109508.
Sun B., Zhao H., Wang X. (2016). Effects of drought on net primary productivity: roles of temperature, drought intensity, and duration. Chin. Geographical Sci. 26 (2), 270–282. doi: 10.1007/s11769-016-0804-3
Tang J., Zhou L., Dang X. W., Hu F. N., Yuan B., Yuan Z. F., et al. (2023). Impacts and predictions of urban expansion on habitat quality in the densely populated areas: a case study of the yellow river basin, China. Ecol. Indic. 151, 110320. doi: 10.1016/j.ecolind.2023.110320
Tian Y., Pang J. (2022). The role of internet development on green total-factor productivity–an empirical analysis based on 109 cities in Yangtze river economic belt. J. Cleaner Production 378, 134415. doi: 10.1016/j.jclepro.2022.134415
Tian A., Xu T., Gao J., Liu C., Han L. (2023). Multi-scale spatiotemporal wetland loss and its critical influencing factors in China determined using innovative grid-based GWR. Ecol. Indic. 149, 110320. doi: 10.1016/j.ecolind.2023.110144
Wang J., Delang C. O., Hou G., Gao L., Lu X. (2021). Net primary production increases in the Yangtze river basin within the latest two decades. Global Ecol. Conserv. 26, e01497. doi: 10.1016/j.gecco.2021.e01497
Wang S. C., Lu F., Wei G. E. (2022). Direct and spillover effects of urban land expansion on habitat quality in chengdu-chongqing urban agglomeration. Sustainability 14 (22), 14931. doi: 10.3390/su142214931
Wang Y., Yu X., Zhao B., Xiong X., Li Y., Zhang M. (2022). Evaluation of ecological carrying capacity in Yangtze river economic belt and analysis of its spatial pattern evolution. Ecol. Indic. 144, 109535. doi: 10.1016/j.ecolind.2022.109535
Wei G., Bi M., Liu X., Zhang Z., He B. (2023). Investigating the impact of multi-dimensional urbanization and FDI on carbon emissions in the belt and road initiative region: direct and spillover effects. J. Cleaner Production 384, 135608. doi: 10.1016/j.jclepro.2022.135608
Wei G. E., He B. J., Sun P. J., Liu Y. B., Li R. Z., Luo K., et al. (2023). Evolutionary trends of urban expansion and its sustainable development: evidence from 80 representative cities in the belt and road initiative region. Cities 138, 104353. doi: 10.1016/j.cities.2023.104353
Wei X. D., Yang J., Luo P. P., Lin L. G., Lin K. L., Guan J. M. (2022). Assessment of the variation and influencing factors of vegetation NPP and carbon sink capacity under different natural conditions. Ecol. Indic. 138. doi: 10.1016/j.ecolind.2022.108834
Wei G., Zhang Z., Ouyang X., Shen Y., Jiang S., Liu B., et al. (2021). Delineating the spatial-temporal variation of air pollution with urbanization in the Belt and Road Initiative area. Environmental Impact Assessment Review 91, 106646.
Wu S., Zhou S., Chen D., Wei Z., Dai L., Li X. (2014). Determining the contributions of urbanisation and climate change to NPP variations over the last decade in the Yangtze river delta, China. Sci. Total Environ. 472, 397–406. doi: 10.1016/j.scitotenv.2013.10.128
Xia C., Zhai G. (2022). The spatiotemporal evolution pattern of urban resilience in the Yangtze river delta urban agglomeration based on TOPSIS-PSO-ELM. Sustain. Cities Soc. 87, 104223. doi: 10.1016/J.SCS.2022.104223
Yan Y., Wu C., Wen Y. (2021). Determining the impacts of climate change and urban expansion on net primary productivity using the spatio-temporal fusion of remote sensing data. Ecol. Indic. 127, 107737. doi: 10.1016/j.ecolind.2021.107737
Yang H., Zhong X., Deng S., Xu H. (2021). Assessment of the impact of LUCC on NPP and its influencing factors in the Yangtze river basin, China. Catena 206, 105542. doi: 10.1016/j.catena.2021.105542
Yang T., Zhou K., Ding T. (2022). Air pollution impacts on public health: evidence from 110 cities in Yangtze river economic belt of China. Sci. total Environ. 851 (P1), 158125. doi: 10.1016/J.SCITOTENV.2022.158125
Yue D., Zhou Y., Guo J., Chao Z., Guo X. (2022). Relationship between net primary productivity and soil water content in the Shule River Basin. Catena 208, 105770.
Zhong S., Liu P. K., Jiao C., Lian C., Xu C., Zhou C. (2021). Assessing the comprehensive impacts of different urbanization process on vegetation net primary productivity in Wuhan, China, from 1990 to 2020. Sustainable Cities and Society 75, 103295.
Keywords: net primary productivity of vegetation, urbanization, driving effect, ecological restoration, Yangtze River Economic Belt (YEB)
Citation: Wang S, Wei G, Gao M and Fan Y (2023) Investigating the mechanism of urbanization on the net primary productivity of vegetation in the Yangtze River Economic Belt: a comprehensive analysis from global and local effects. Front. Ecol. Evol. 11:1231487. doi: 10.3389/fevo.2023.1231487
Received: 30 May 2023; Accepted: 22 June 2023;
Published: 12 July 2023.
Edited by:
Juergen Pilz, University of Klagenfurt, AustriaReviewed by:
Shengnan Jiang, Changzhou University, ChinaHaimeng Liu, Chinese Academy of Sciences (CAS), China
Copyright © 2023 Wang, Wei, Gao and Fan. This is an open-access article distributed under the terms of the Creative Commons Attribution License (CC BY). The use, distribution or reproduction in other forums is permitted, provided the original author(s) and the copyright owner(s) are credited and that the original publication in this journal is cited, in accordance with accepted academic practice. No use, distribution or reproduction is permitted which does not comply with these terms.
*Correspondence: Yuemin Fan, ZmFueXVlbWluQGdkdWZlLmVkdS5jbg==