
95% of researchers rate our articles as excellent or good
Learn more about the work of our research integrity team to safeguard the quality of each article we publish.
Find out more
ORIGINAL RESEARCH article
Front. Ecol. Evol. , 23 August 2023
Sec. Interdisciplinary Climate Studies
Volume 11 - 2023 | https://doi.org/10.3389/fevo.2023.1231394
This article is part of the Research Topic Interplay between Climate Change, Land Use Change, and Human Health: Opportunities and Challenges View all 7 articles
 Qingsong Li†
 Jincai Zhang†Jiawen Zhang
 Huishan GaoWeiqiang ChenJunchang Huang
 Yulong GuoShuaijun YueGenming Li*
The aim of this study was to explore the characteristics of non-point source pollution of nitrogen (N) and phosphorus (P) under the background of climate and land use in Shandong Province. First, using the InVEST NDR module in the model, N and P non-point source pollution in 2010 and 2020 in Shandong Province were simulated; then, based on precipitation data under three different global climate models (MRI-ESM-0, GFDL-ESM4, and Ec-Earth3) and two Shared Socioeconomic Pathways (SSP245 and SSP585), land use data under two Shared Socioeconomic Pathways (SSP245 and SSP585) were used to simulate and predict the non-point source pollution of N and P in Shandong Province in 2030. The results showed the following: (1) On the time scale, the output load and total output of N and P decreased during 2010–2020, while the output load and total output of N and P increased during 2020–2030. (2) On the spatial scale, the spatial distribution of N and P output loads in 2010, 2020, and 2030 is roughly the same, being “low in the northwest and high in the southeast”. (3) Different climate scenarios have a great influence on N and P output load and total output, and the N and P pollution in the SSP585 scenario is more serious. The total output of N and P did not change much in different climate models, while the spatial distribution of the output load of N and P varied significantly, indicating that different climate models had a greater impact on the spatial distribution of the output load of N and P. (4) The overall cold hot spot pattern of nitrogen and phosphorus pollution in Shandong Province is stable, basically showing a “band + cluster + scatter” distribution pattern; the hot spot area in the central and southern region of Shandong Province changes little regardless of the model, the northwest is basically a cold spot area, and the nitrogen and phosphorus hot spot area under the SSP245 scenario in Ec-Earth3 model had the least amount of change. According to research results, combined with the actual situation of Shandong Province, it is hoped that it can provide theoretical basis for the prevention and control of non-point source pollution in Shandong Province in the future.
The rapid socioeconomic development, the continuous population growth, the development needs of the economy, and the increasing demand for food have forced an increasing imbalance between industrial and agricultural production and the environment. The waste of resources and environmental pollution problems brought about by the irrational use of a large number of factors of production have aggravated the deterioration of water bodies and soils and triggered serious surface pollution (Carpenter et al., 1998). At present, in the context of climate and land use, the world is under constant threat. Surface pollution can cause water pollution and eutrophication of lakes, and inhibit crop growth, seriously affecting China’s water resources and food security and limiting sustainable socioeconomic development (He and Hu, 2022). At present, in the context of climate and land use, the world is under constant threat of survival, and the problem of surface source pollution has become a research hotspot worldwide. Therefore, it is important to analyze the spatial and temporal distribution of nitrogen (N) and phosphorus (P) surface source pollution to improve the water environment and ensure food security.
The study of surface source pollution has received increasing attention from many scholars for quite some time. Most scholars mainly use risk evaluation or model simulation methods (Geng et al., 2017) to study the spatial distribution of surface source pollution loads. Most of the risk evaluation methods represented by the N and P index method are not comprehensive in the selection of indicators and too coarse in the unit study, which cannot assess the surface source pollution load more accurately and quantitatively. The model simulation method can fill the gap of risk evaluation. The SWAT model (Lam et al., 2010; Romagnoli et al., 2017), output coefficient model (ECM) (Johnes, 1996; Li et al., 2009), and domestic and international studies mainly used AnnAGNPS (Villamizar and Brown, 2016) and average concentration (Li et al., 2011) modeling methods. Among them, the SWAT model, AnnAGNPS, and other mechanistic models are not suitable for large-area simulation due to high data requirements and difficult-to-obtain and complicated calculation (Feng et al., 2019).
The parameters required for InVEST’s nutrient transport rate model (NDR) are easily accessible, the mechanism is clear, and the calculation is simple. It is currently the most widely used integrated platform for ecosystem service assessment internationally and is suitable for large-scale surface source pollution simulation studies (Xue, 2017). At present, many scholars at home and abroad use the NDR model to study the non-point source pollution load in the basin. Scholars have conducted in-depth studies on the uncertainty of NDR models. For example, the Benez-S team from the University of Georgia studied the influence of dataset accuracy on the InVEST nutrient delivery module Benez-Secanho and Dwivedi, 2019. Silata found that it was the key to improve the accuracy of the model to select the appropriate cumulative flow threshold and the DEM that correctly represented the nutrient flow path Stefano et al., 2017. Some scholars have used this model in actual watershed simulation. For example, in the White River basin in the Midwest of the United States, the NDR model has better distinguished regions with high nitrogen and phosphorus output loads under different land use scenarios Han et al., 2021. In the UK, the NDR model performs well in terms of the relative size of nitrogen and phosphorus output load nutrient output Redhead et al., 2018. These results indicate that the InVEST nutrient transport model is stable and reliable in pattern research. In China, Wu Zhe of Hainan University used the NDR model to evaluate the risk of nitrogen and phosphorus export in Hainan Island Wu et al., 2014. Yan Yiyun et al. evaluated the total nitrogen removal effect of constructed wetlands in Jiulong River Basin and obtained the relationship between wetland proportion and reduction effect Yan et al., 2018. Liu Ju used the NDR model to estimate the total output of nitrogen and phosphorus pollutants in mountainous areas of Baoxing County, Sichuan Province Liu J et al., 2019. Zhang et al. studied the spatial distribution characteristics of farmland non-point sources in the Haihe River Basin and identified the key source areas Zhang et al., 2021 and Zhao et al., 2014. These cases prove that the NDR model can well simulate the non-point source pollution in small and medium-sized watersheds, but few scholars have studied it at the provincial scale.
Shandong Province, as a large production province based on agriculture and industry, has 7% of the country’s population but only 1% of its water resources, and the high level of water exploitation and use of production factors has led to more serious pollution in the region. The Second National Pollution Source Census of Shandong Province shows the following statistics: Shandong Province water pollution chemical oxygen demand (COD) emissions of 1.14116 million tons, total nitrogen (TN) emissions of 162,600 tons, and total phosphorus (TP) emissions of 14,000 tons, accounting for 6.58%, 5.35%, and 4.44% of the national water pollutant emissions in China. In 2021, approximately 25% of the water environment of surface water in the “Shandong Province Ecological Environment Status Bulletin” still belongs to Class IV water bodies. The situation of surface source pollution of N and P is not optimistic, and water pollution prevention and control need to be further strengthened, especially since surface source pollution has a great impact on the social and economic development of Shandong Province.
In view of this, Shandong Province was selected as the study area for this paper. The improved InVEST model was used to calculate watershed surface source pollution loads. The use of GIS technology InVEST model coupling, through the GIS technology, is proposed to determine the source pollution load of N and P from the spatial and temporal distribution pattern analysis of surface source pollution. Finally, based on three different global climate models (MRI-ESM-0, GFDL-ESM4, and Ec-Earth3) and future annual precipitation data under two Shared Socioeconomic Pathways (SSP245 and SSP585), the future land use data under two Shared Socioeconomic Pathways (SSP245 and SSP585) and future non-point source pollution in Shandong Province are predicted and analyzed. This study can provide an objective assessment of the current situation of N and P surface pollution in Shandong Province, with a view to providing scientific support for the control and management of surface pollution in Shandong Province.
Shandong Province is located at N34°22.9’–N38°24.01’, E114°47.5’–E122°42.3’ (Xu et al., 2020; Wang et al., 2022), in the northern part of the North China Plain in China, with a land area of approximately 155,800 km2 (Wang et al., 2023) (Figure 1). The region’s topography is complex and diverse; the south-central part is mostly mountainous, accounting for approximately 14.59% of the province; the southwest and northwest are dominated by plains, accounting for approximately 65.56% of the province; and the east is mostly hilly, accounting for approximately 15.39% of the province. The zone has a warm-temperate monsoon climate, with an average annual temperature of 11°C to 14°C (Gao et al., 2014; Jiang et al., 2022). The temperature varies widely, with greater differences between east and west than between north and south. Precipitation is mainly concentrated in summer from the time distribution. In terms of spatial distribution, precipitation decreases from southeast to northwest. Owing to the extremely unbalanced distribution of precipitation, flooding usually occurs during the rainy period and drought typically occurs during the dry period, which poses a great challenge to the agricultural development of Shandong Province.
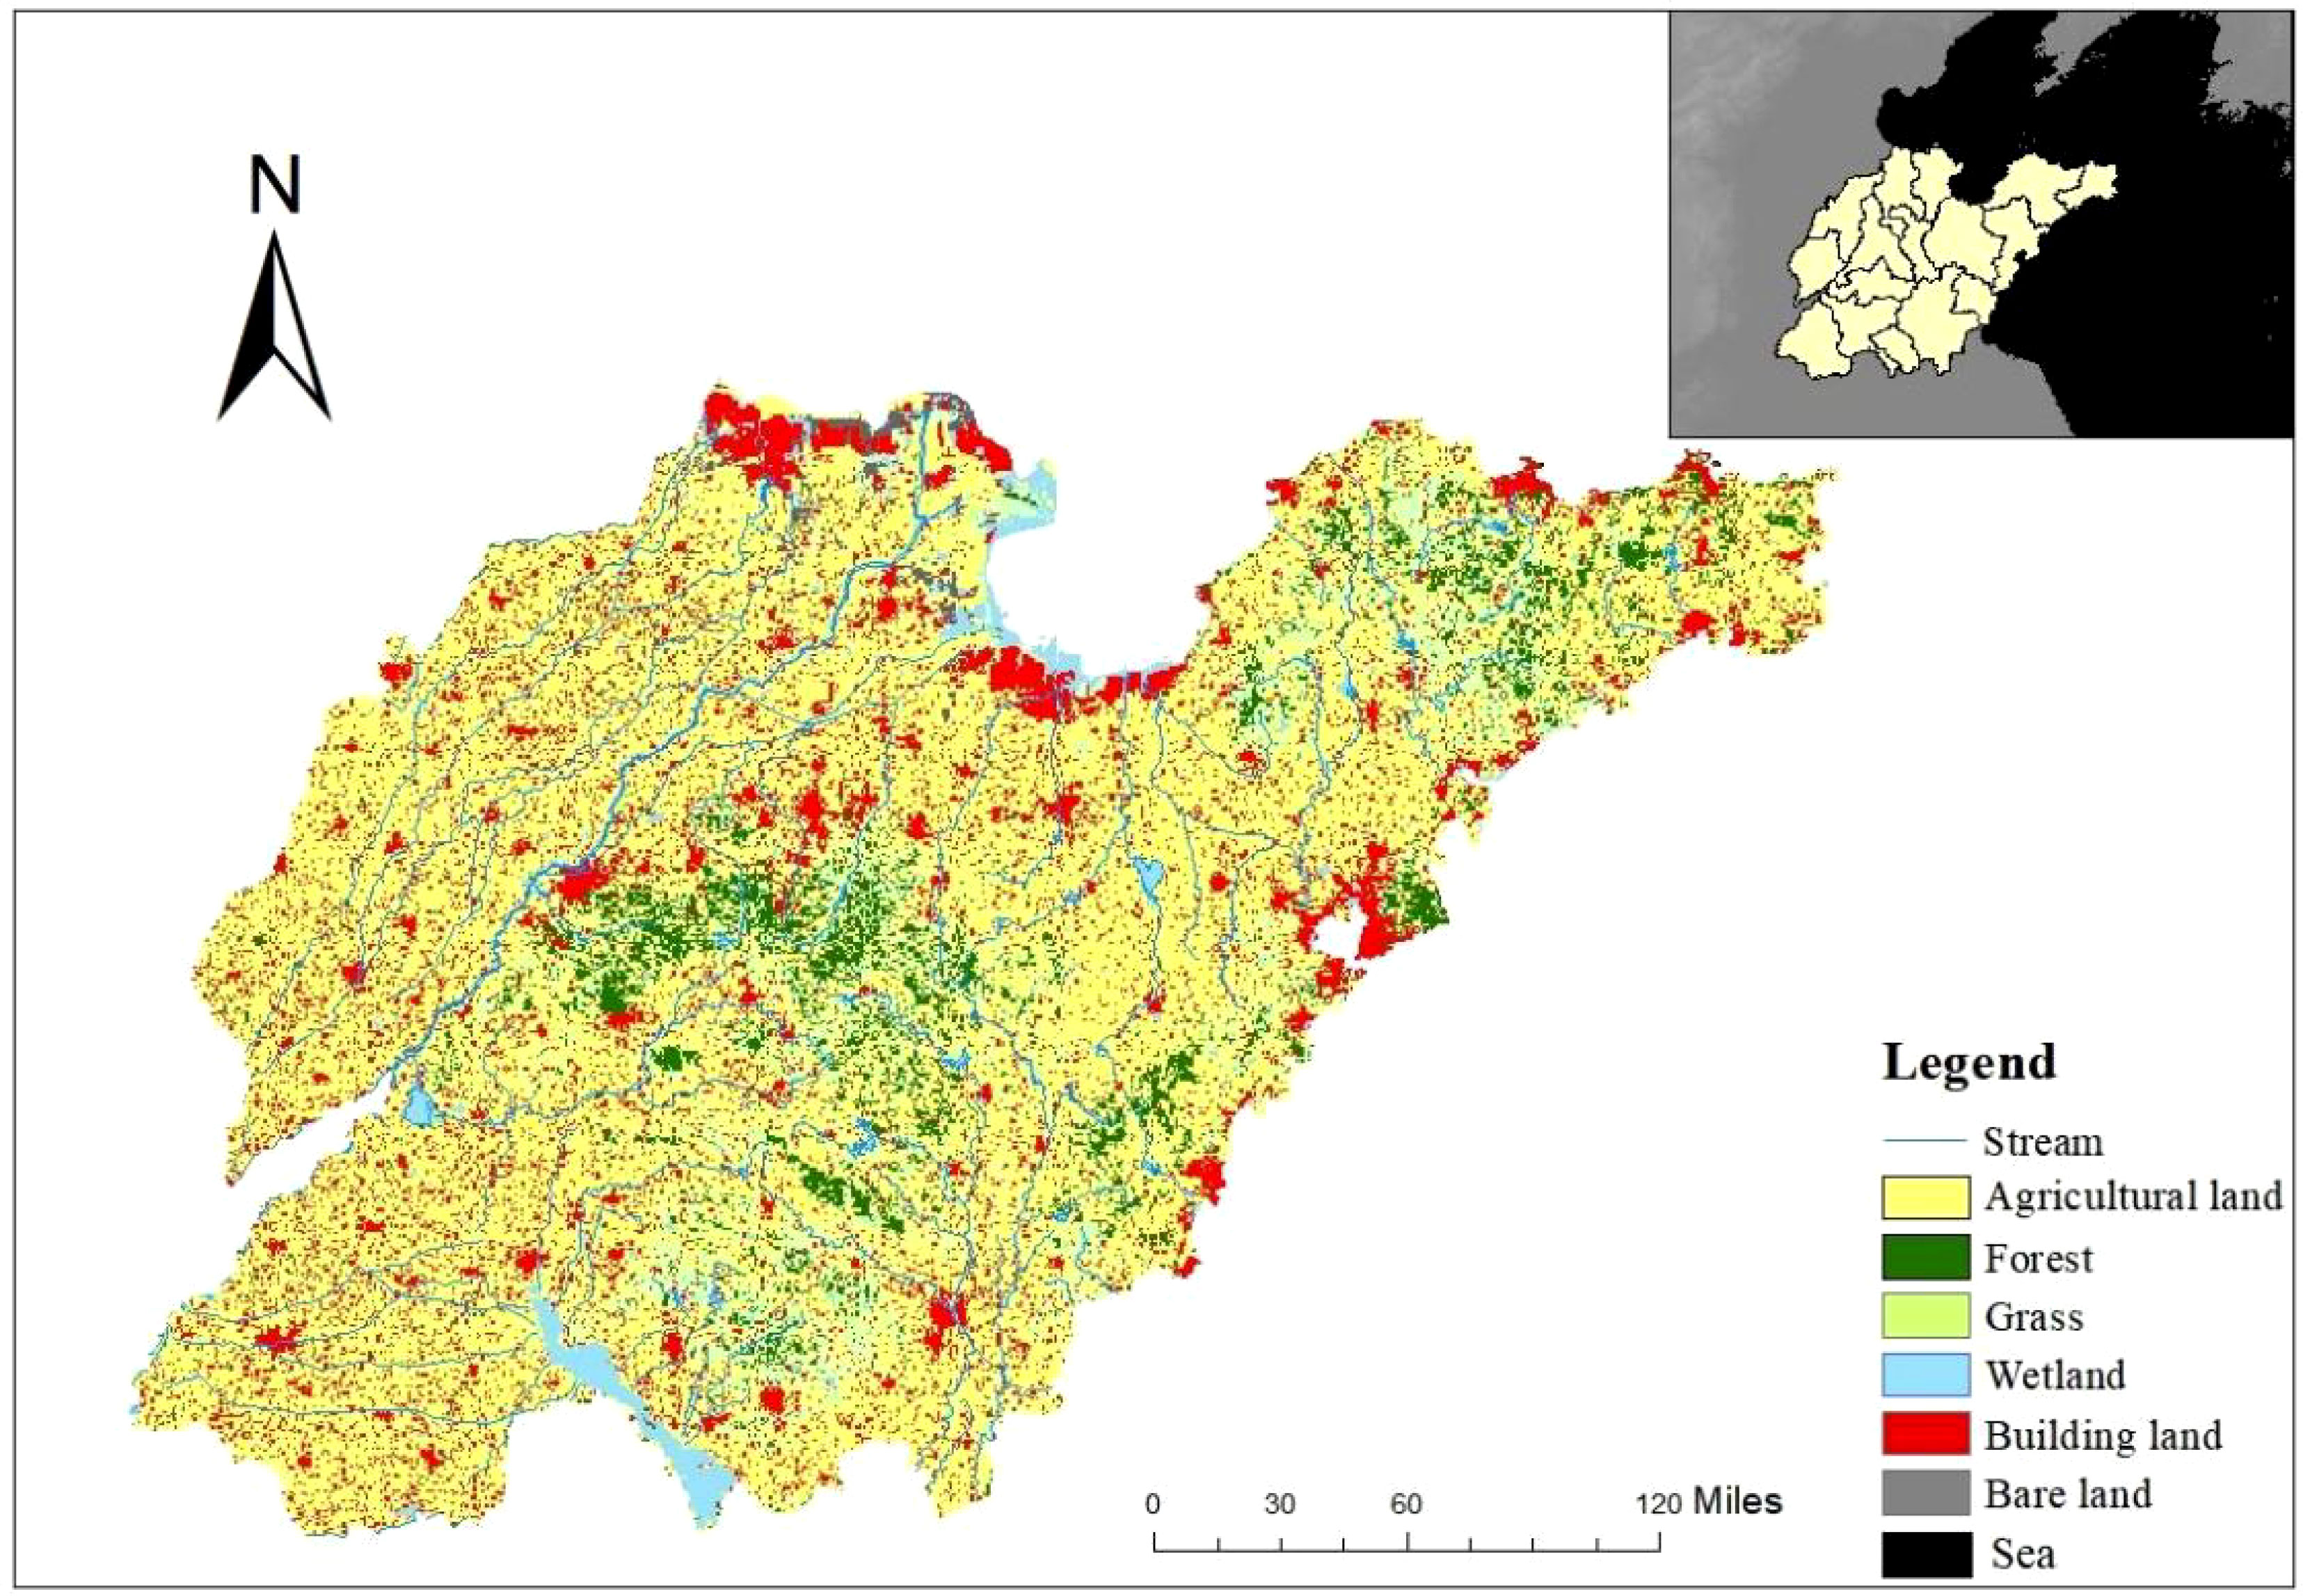
Figure 1 Location of study region.
(1) The statistics were mainly from the statistical yearbooks of counties and cities included that in Shandong Province.
(2) The Digital Elevation Model (DEM) was downloaded from the Geospatial Data Cloud platform with a spatial resolution of 1000 m (http://www.gscloud.cn). ArcGIS technology was used to extract river basin data in Shandong Province.
(3) The land use-type data of Shandong Province were obtained from the Institute of Geography, Chinese Academy of Sciences, with a spatial resolution of 1000 m (http://www.resdc.cn). The land use-type data for future periods were obtained from a set of 1-km-resolution future land cover type data based on IGBP classification (2015–2100, with 5-year intervals) simulated by Li Xia’s team at East China Normal University using the FLUS model, with a spatial resolution of 1000 m (Liu X et al., 2019).
(4) The meteorological data were obtained from the China Meteorological Data Network, a dataset that is widely used for research. The annual average daily precipitation data from weather stations in Shandong Province were used to estimate the annual precipitation. Future precipitation data for the two scenarios SSP245 and SSP585 for three different climate models (MRI-ESM-0, GFDL-ESM4, and Ec-Earth3) were obtained from the National Earth System Science Data Center (http://www.geodata.cn/).
N and P loading to the river model (Sharp et al., 2016)
(1) N and P loss loads are allocated to the surface and subsurface layers according to a certain ratio, calculated as
where load_xi is the N and P loss load, proportionsubsurface is the proportion of nutrients N and P in the subsurface layer, loadsurf,i is the surface nutrient N and P load, and loadsubsurf,iis the subsurface nutrient N and P load.
(2) The surface nutrient transport rate is calculated as
where NDR0,i is the nutrient transport rate that is not retained by downstream pixels, ICa is a topographic index, IC0 and k are calibration parameters, and is the maximum interception efficiency between surface grid unit i and the river.
(3) The formula for calculating the transport rate of subsurface nutrients is:
where is the maximum nutrient retention efficiency that can achieve underground flow and is the interception length of groundwater flow. Assuming that the soil maintains its maximum capacity of nutrients at a distance, l is the distance from the pixel to the stream.
(4) The formula for calculating nutrient output is:
where is the nutrient N and P output load of each grid unit i, is the N and P load of surface nutrients, is the N and P transport rate of surface nutrients, is the N and P load of subsurface nutrients, is the transport rate of subsurface nutrients, and is the total output of nutrient N and P in the sub-watershed.
In order to more intuitively show the changes of land use in Shandong Province from 2010 to 2030, we summarized the land use data from 2010 to 2030, and the results are shown in Table 1.
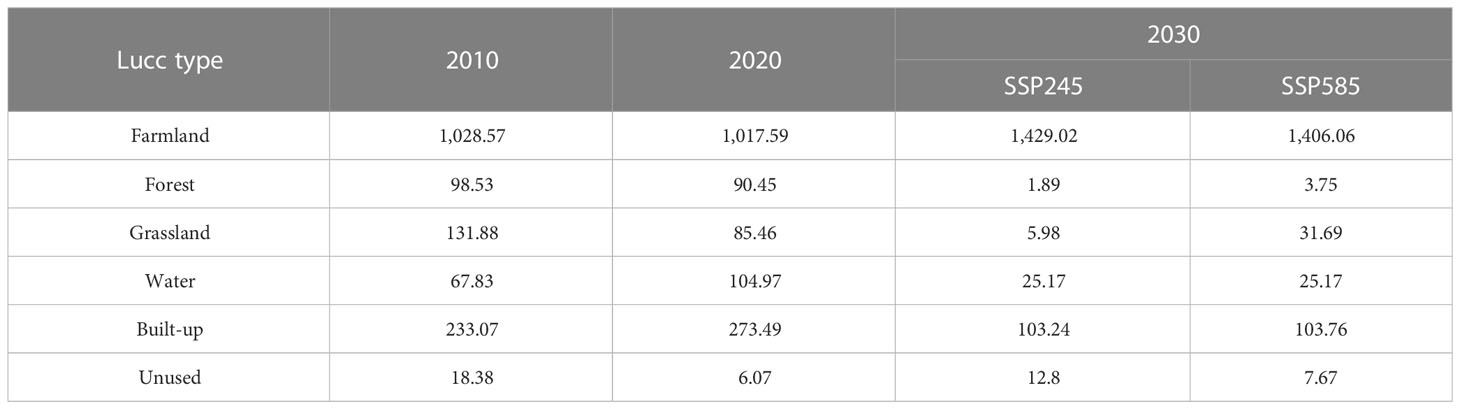
Table 1 Land use in Shandong Province (by million hectares).
It can be seen from Table 1 that the area of farmland, forest land, grassland, and unused land in Shandong Province decreased in 2020 compared with that in 2010. The reduction of grassland accounted for 2.94% of the total, followed by 0.78% and 0.7% of unused land and farmland, respectively, and the minimum of forest land was 0.51%. Water area and construction land increased by 2.35% and 2.56%, respectively. Under the SSP245 scenario, the area of forest land, grassland, water area, and construction land in Shandong Province would decrease in 2030, with a maximum reduction of 10.79% for construction land, a reduction of 5.61% for forest land, 5.06% for water area, and 5.04% for grassland, and an increase of 26.07% for farmland and 0.43% for unused land. Under the SSP585 scenario, the area of forest land, grassland, water area, and built-up land in Shandong Province would decrease in 2030, with a maximum reduction of 10.75% for built-up land, 5.49% for forest land, 5.06% for water area, 3.41% for grassland, 24.61% for farmland, and 0.10% for unused land. It can be seen that the land use change in Shandong Province in the next decade is more drastic under the scenarios of SSP245 and SSP585, and the farmland area of SSP245 increases more than that of SSP585.
Based on DEM data, 2010 and 2020 land use-type data and 2010 and 2020 average rainfall data of Shandong Province were determined. The InVEST model was used to estimate the output loads of N and P surface source pollution in Shandong Province in 2010 and 2020. The simulated N and P output loads from Shandong Province are shown in Figure 2. According to the analysis of N and P output load maps, it can be concluded that the output load of N in 2010 and 2020 is between 0 and 15.17 kg ha−1 year−1 and between 0 and 4.25 kg ha−1 year−1, respectively. The total output of N in Shandong Province was 56,100 tons and 17,900 tons in 2010 and 2020, respectively, and the average values of output load of N were 3.55 kg ha−1 year−1 and 1.13 kg ha−1 year−1 in 2010 and 2020, respectively. The output load of P in 2010 and 2020 is between 0 and 1.17 kg ha−1 year−1 and between 0 and 0.34 kg ha−1 year−1, respectively. The total output of P in Shandong Province in 2010 and 2020 is 0.41 million tons and 0.13 million tons, respectively, and the average output load of P in 2010 and 2020 is 0.26 kg ha−1 year−1 and 0.08 kg ha−1 year−1, respectively. In general, the total N and P output and output load in Shandong Province decreased during 2010–2020, which is consistent with the findings of Tao Yuan and other scholars (Tao et al., 2021). In terms of spatial distribution, the distribution of N and P output loads in 2010 and 2020 is the same, being “low in the northwest and high in the southeast”. The N and P output loads are significantly higher in the eastern and southern regions of Shandong Province than in the northwestern part, and the regions with high N and P output loads are generally characterized by high population density and large distribution of arable land.
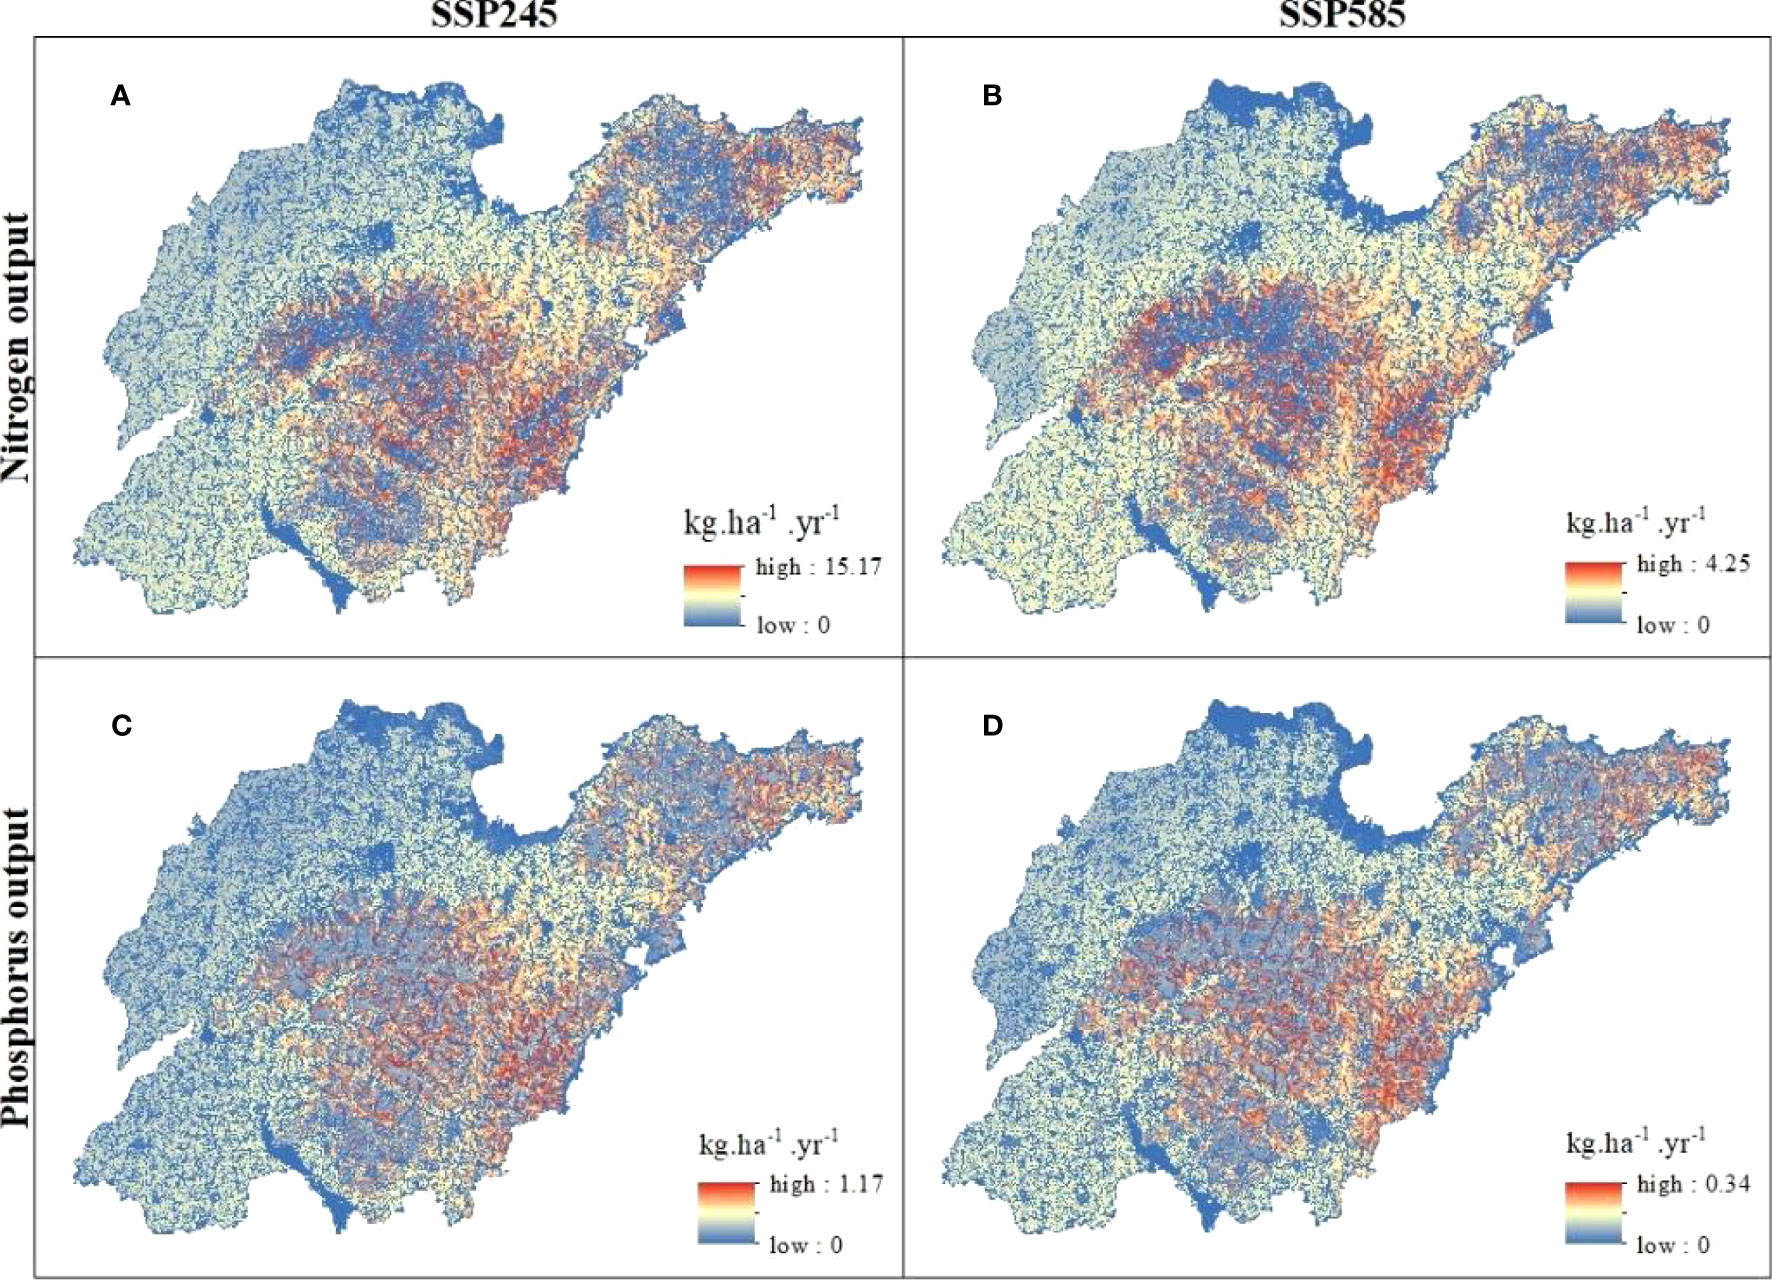
Figure 2 Historical status of N and P output. (A:2010 N output; B:2020 N output; C:2010 P output; D:2020 P output).
Based on the future land use data in 2030 under the two Shared Socioeconomic Pathways of SSP245 and SSP585, and the future annual precipitation data in 2030 under the two Shared Socioeconomic Pathways of SSP245 and SSP585 for three different climate models (MRI-ESM-0, GFDL-ESM4, and Ec-Earth3), three 2030 N and P output load distribution maps for Shandong Province were obtained.
Figure 3 shows the spatiotemporal distribution of N and P non-point source pollution in 2030 under the two scenarios of MRI-ESM-0 mode SSP245 and SSP585.
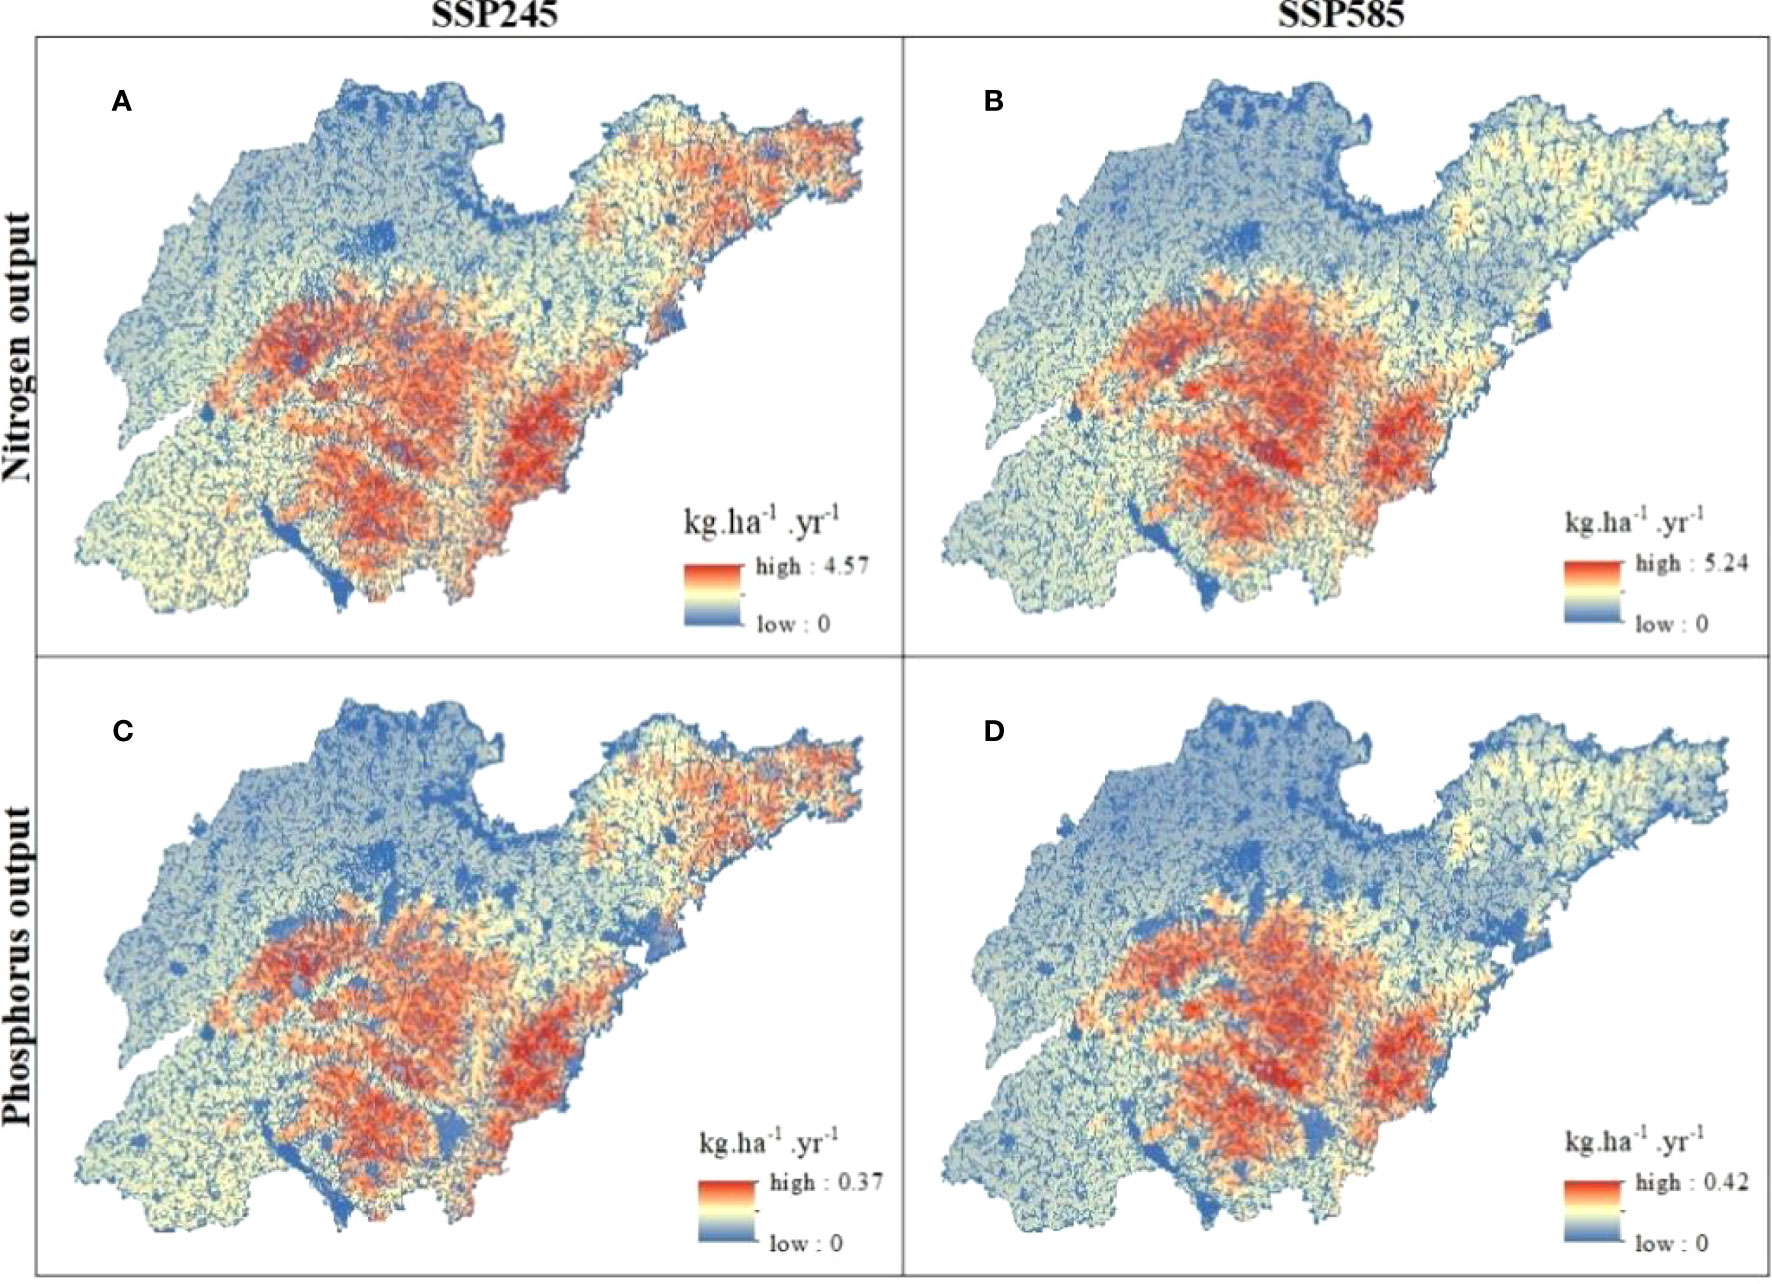
Figure 3 N and P output in MRI-ESM-0 mode. (A: SSP245 N output; B: SSP585 N output; C: SSP245 P output; D: SSP585 P output).
The total N output in 2030 under the SSP245 scenario is 22.82 million tons and the average N output load is 1.44 kg ha−1 year−1. The total N output in 2030 under the SSP585 scenario is 23.47 million tons and the mean N output load is 1.48 kg ha−1 year−1. In terms of spatial distribution, the N output load is mainly concentrated in the central and southern parts of Shandong Province. The total P output in 2030 under the SSP245 scenario is 1.76 million tons and the average P output load is 0.111 kg ha−1 year−1. The total P output in 2030 under the SSP585 scenario is 1.80 million tons and the mean P output load is 0.114 kg ha−1 year−1. In terms of spatial distribution, the P output load is mainly concentrated in the central and southern parts of Shandong Province.
Figure 4 shows the spatial and temporal distribution of N and P non-point source pollution in 2030 under GFDL-ESM4 models SSP245 and SSP585. The total N output in 2030 under the SSP245 scenario is 22.82 million tons and the average N output load is 1.44 kg ha−1 year−1. The total N output in 2030 under the SSP585 scenario is 23.31 million tons and the mean N output load is 1.47 kg ha−1 year−1. In terms of spatial distribution, the N output load is mainly concentrated in the central and southern parts of Shandong Province. The total P output in 2030 under the SSP245 scenario is 1.76 million tons and the average P output load is 0.111 kg ha−1 year−1. The total P output in 2030 under the SSP585 scenario is 1.79 million tons and the mean P output load is 0.113 kg ha−1 year−1. In terms of spatial distribution, the P output load is mainly concentrated in the central and southern parts of Shandong Province.
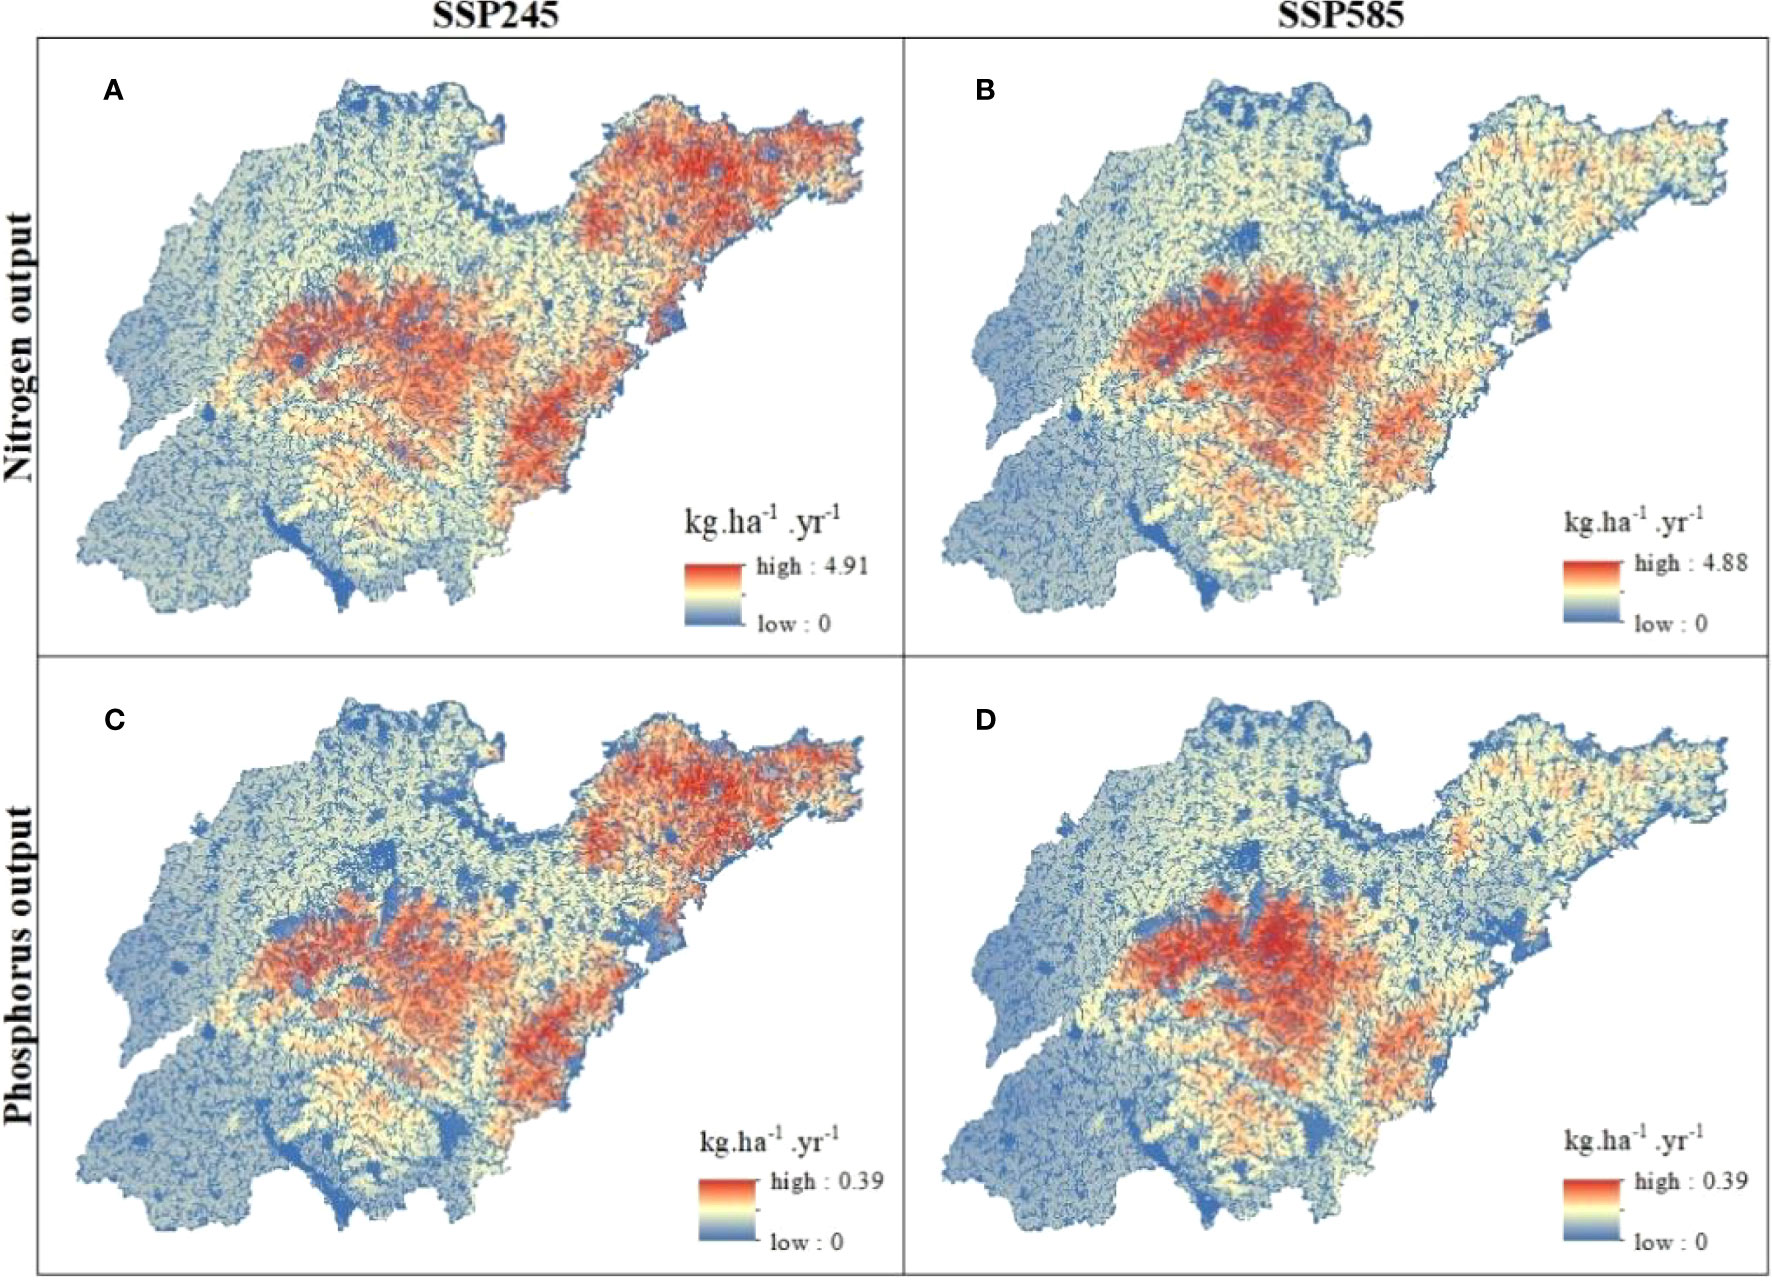
Figure 4 N and P output in GFDL-ESM4 mode. (A: SSP245 N output; B: SSP585 N output; C: SSP245 P output; D: SSP585 P output).
Figure 5 shows the spatial and temporal distribution of N and P non-point source pollution in 2030 under Ec-Earth3 models SSP245 and SSP585. The total N output in 2030 under the SSP245 scenario is 22.79 million tons and the average N output load is 1.44 kg ha−1 year−1. The total N output in 2030 under the SSP585 scenario is 23.50 million tons and the mean N output load is 1.48 kg ha−1 year−1. In terms of spatial distribution, the N output load is mainly concentrated in the central and southern parts of Shandong Province. The total P output in 2030 under the SSP245 scenario is 1.75 million tons and the average P output load is 0.111 kg ha−1 year−1. The total P output in 2030 under the SSP585 scenario is 1.80 million tons and the mean P output load is 0.114 kg ha−1 year−1. In terms of spatial distribution, the P output load is mainly concentrated in the central and southern parts of Shandong Province.
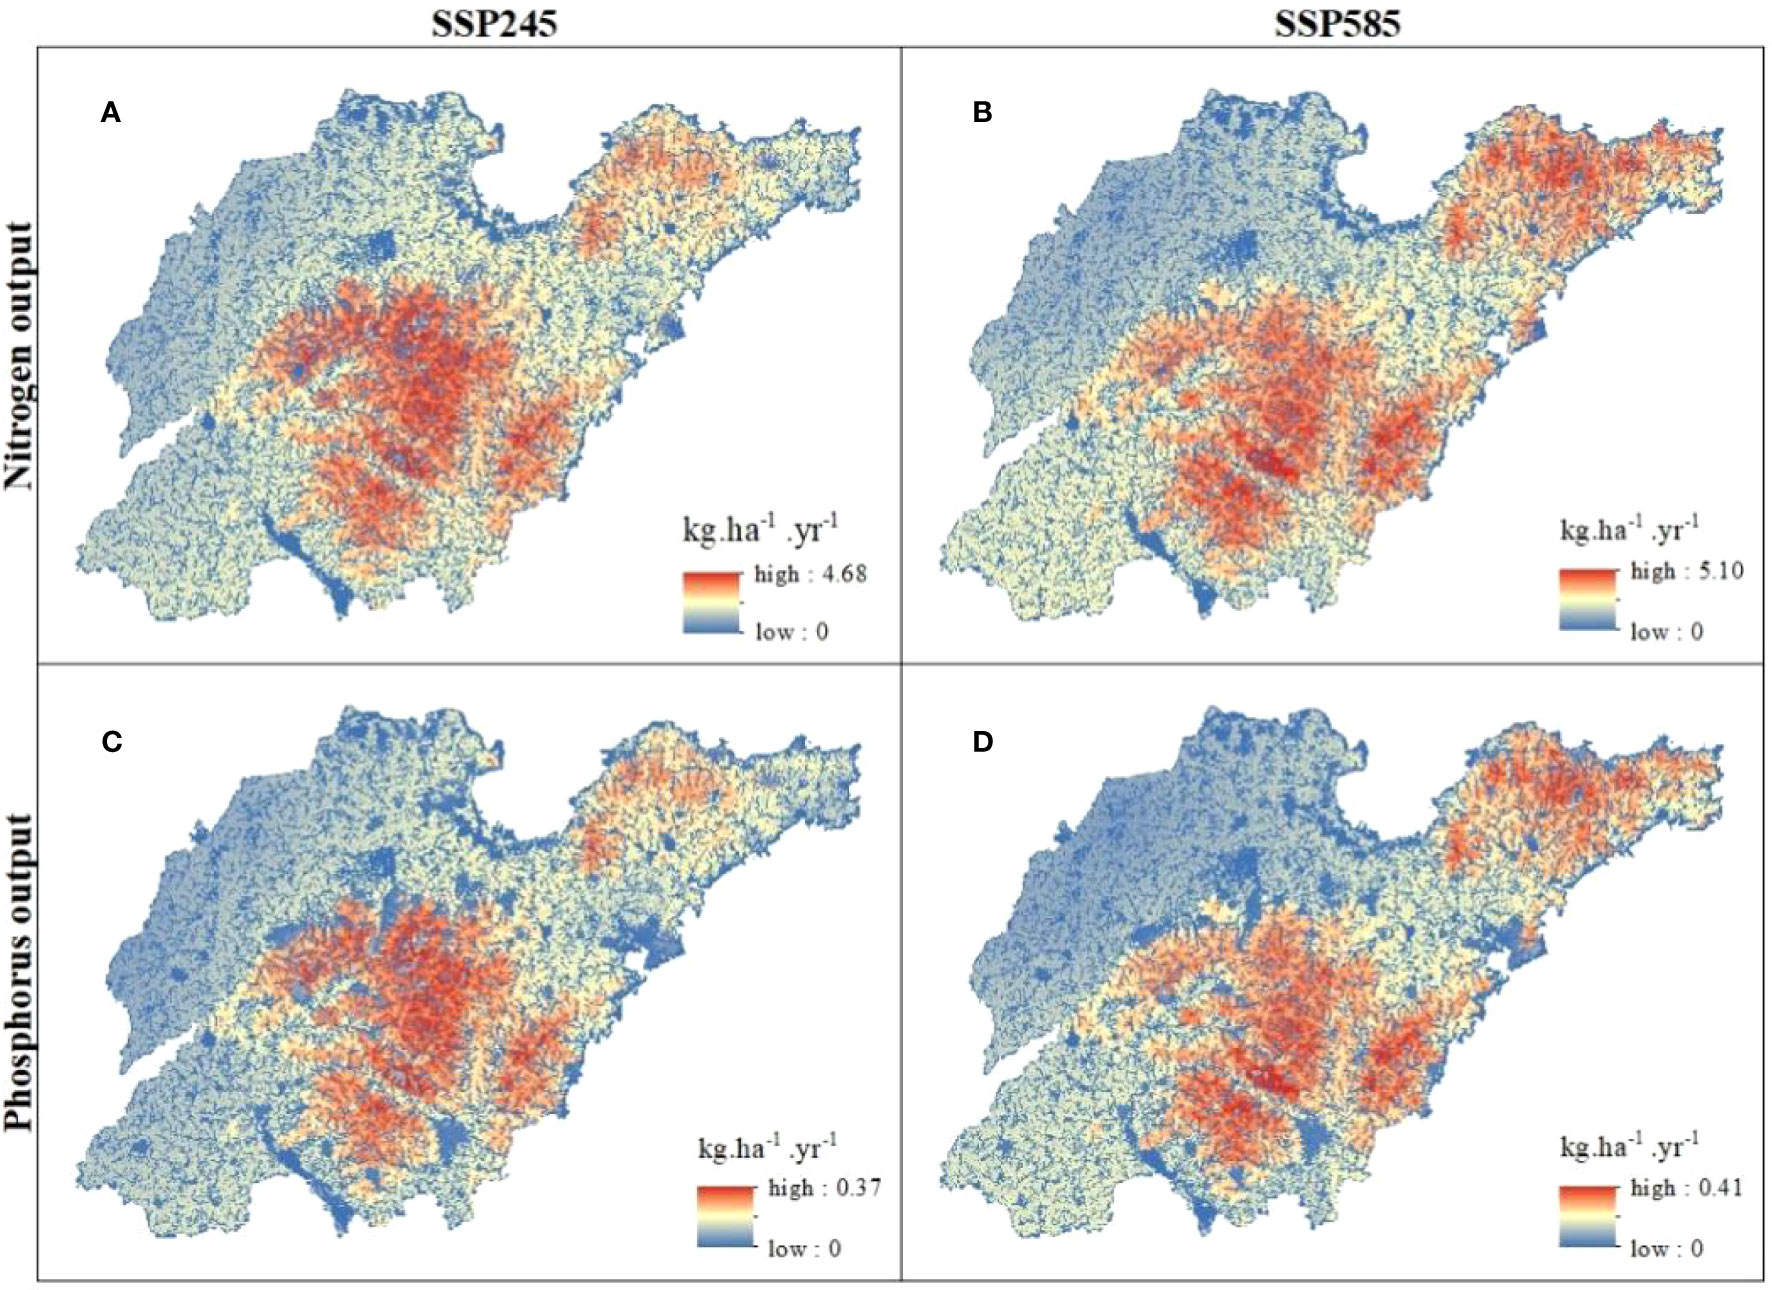
Figure 5 N and P output in Ec-Earth3 mode. (A: SSP245 N output; B: SSP585 N output; C: SSP245 P output; D: SSP585 P output).
In short, the output load and total output of nitrogen and phosphorus in Shandong Province will increase from 2020 to 2030. This may be related to the increase of cultivated land area in Shandong Province in 2030, which leads to an increase in the use of nitrogen- and phosphorus-containing substances such as fertilizers, resulting in an increase in the total amount of nitrogen and phosphorus, resulting, in turn, in an increase in the total amount of nitrogen and phosphorus output and output load. Among the three development models, the output load and total output of nitrogen and phosphorus under the SSP245 scenario in Ec-Earth3 model were the lowest. It is suggested that the future development of Shandong Province should be closer to the SSP245 scenario in the Ec-Earth3 model.
The changes of N and P output loads in Shandong Province from 2010 to 2020 were analyzed using ArcGIS software, and the results are shown in Figure 6. It can be seen from the figure that, overall, the N output load in Shandong Province decreases from 2010 to 2020 with an average value of −2.42 kg ha−1 year−1. Local output loads have increased in Shandong Province, mainly in the northern, central, and northeastern regions, all of which share the common characteristics of high population density and large arable land holdings. The graph shows an overall reduction in P export load in Shandong Province from 2010 to 2020 with an average value of −0.18 kg ha−1 year−1, which is a smaller reduction compared to N. The increased output load of P differs from the increased output load of N in that the increased output load of P has a smaller value and is more regionally dispersed, but is broadly concentrated in densely populated areas with more arable land.
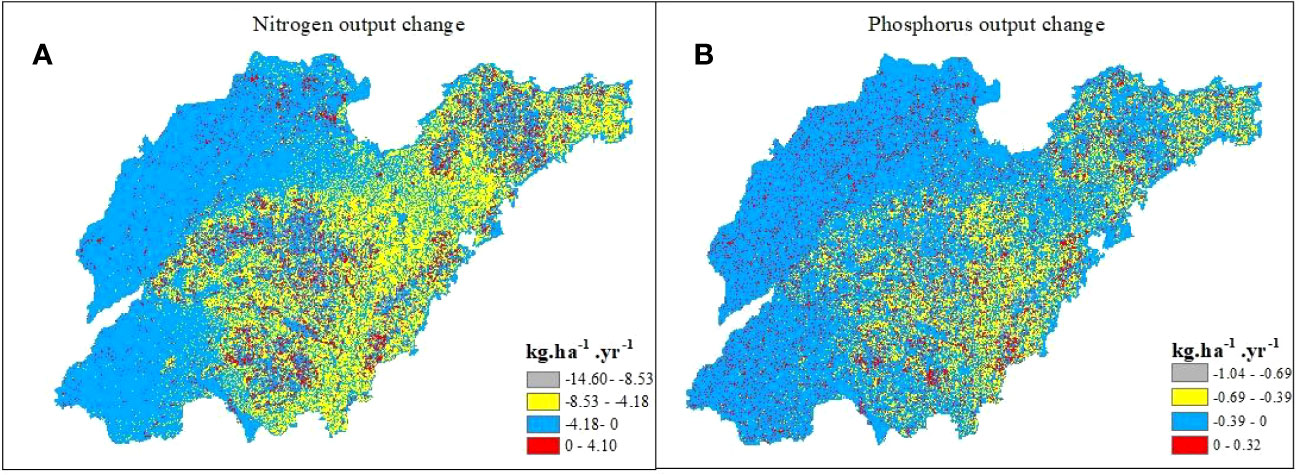
Figure 6 N and P historical output changes. (A:2010-2020 N output change; B:2010-2020 P output change).
Figure 7 shows the change in N output load from 2020 to 2030 for two scenarios with three different climate models (MRI-ESM-0, GFDL-ESM4, and Ec-Earth3), SSP245 and SSP585, and Figure 8 shows the change in P output load from 2020 to 2030 for two scenarios with three different climate models (MRI-ESM-0, GFDL-ESM4, and Ec-Earth3), SSP245 and SSP585.
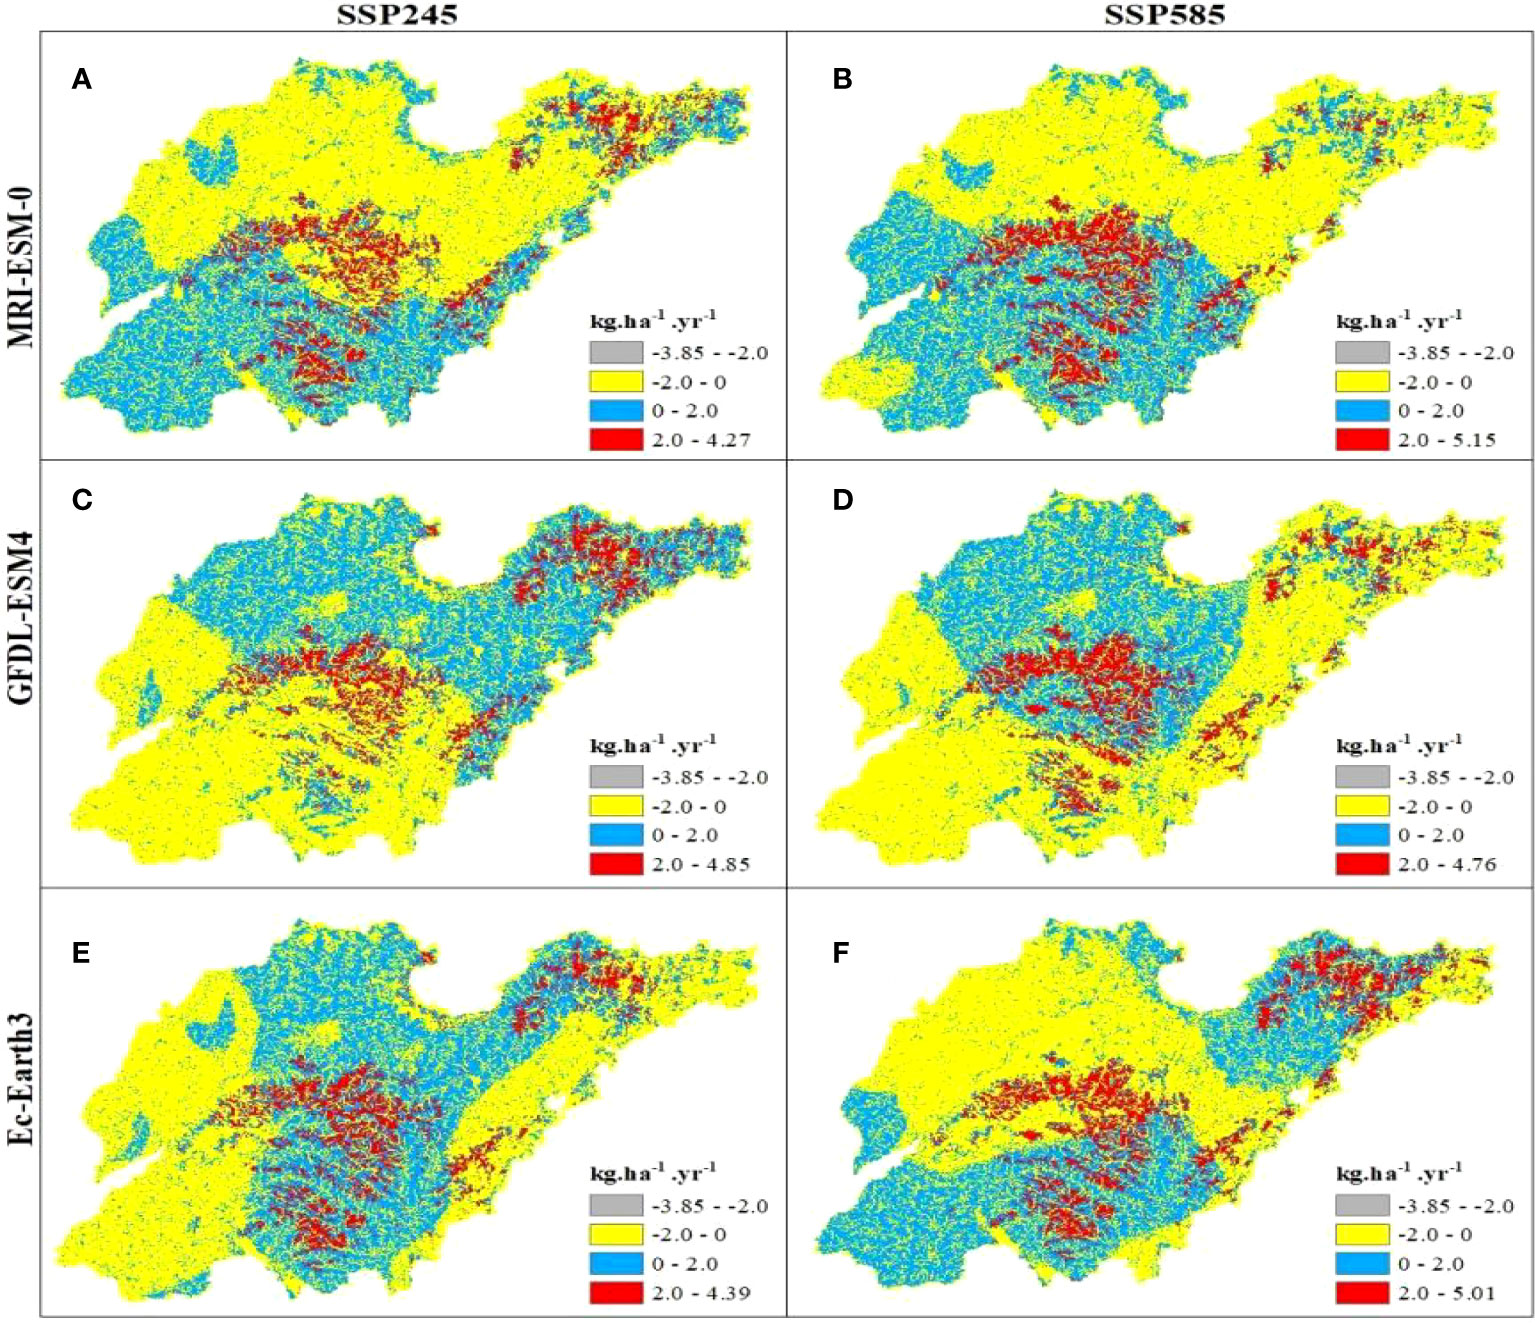
Figure 7 N future output changes. (A:2030 N output change in SSP245 and MRI-ESM-0; B:2030 N output change in SSP585 and MRI-ESM-0; C:2030 N output change in SSP245 and GFDL-ESM4; D:2030 N output change in SSP585 and GFDL-ESM4; E:2030 N output change in SSP245 and Ec-Earth3; F:2030 N output change in SSP585 and Ec-Earth3).
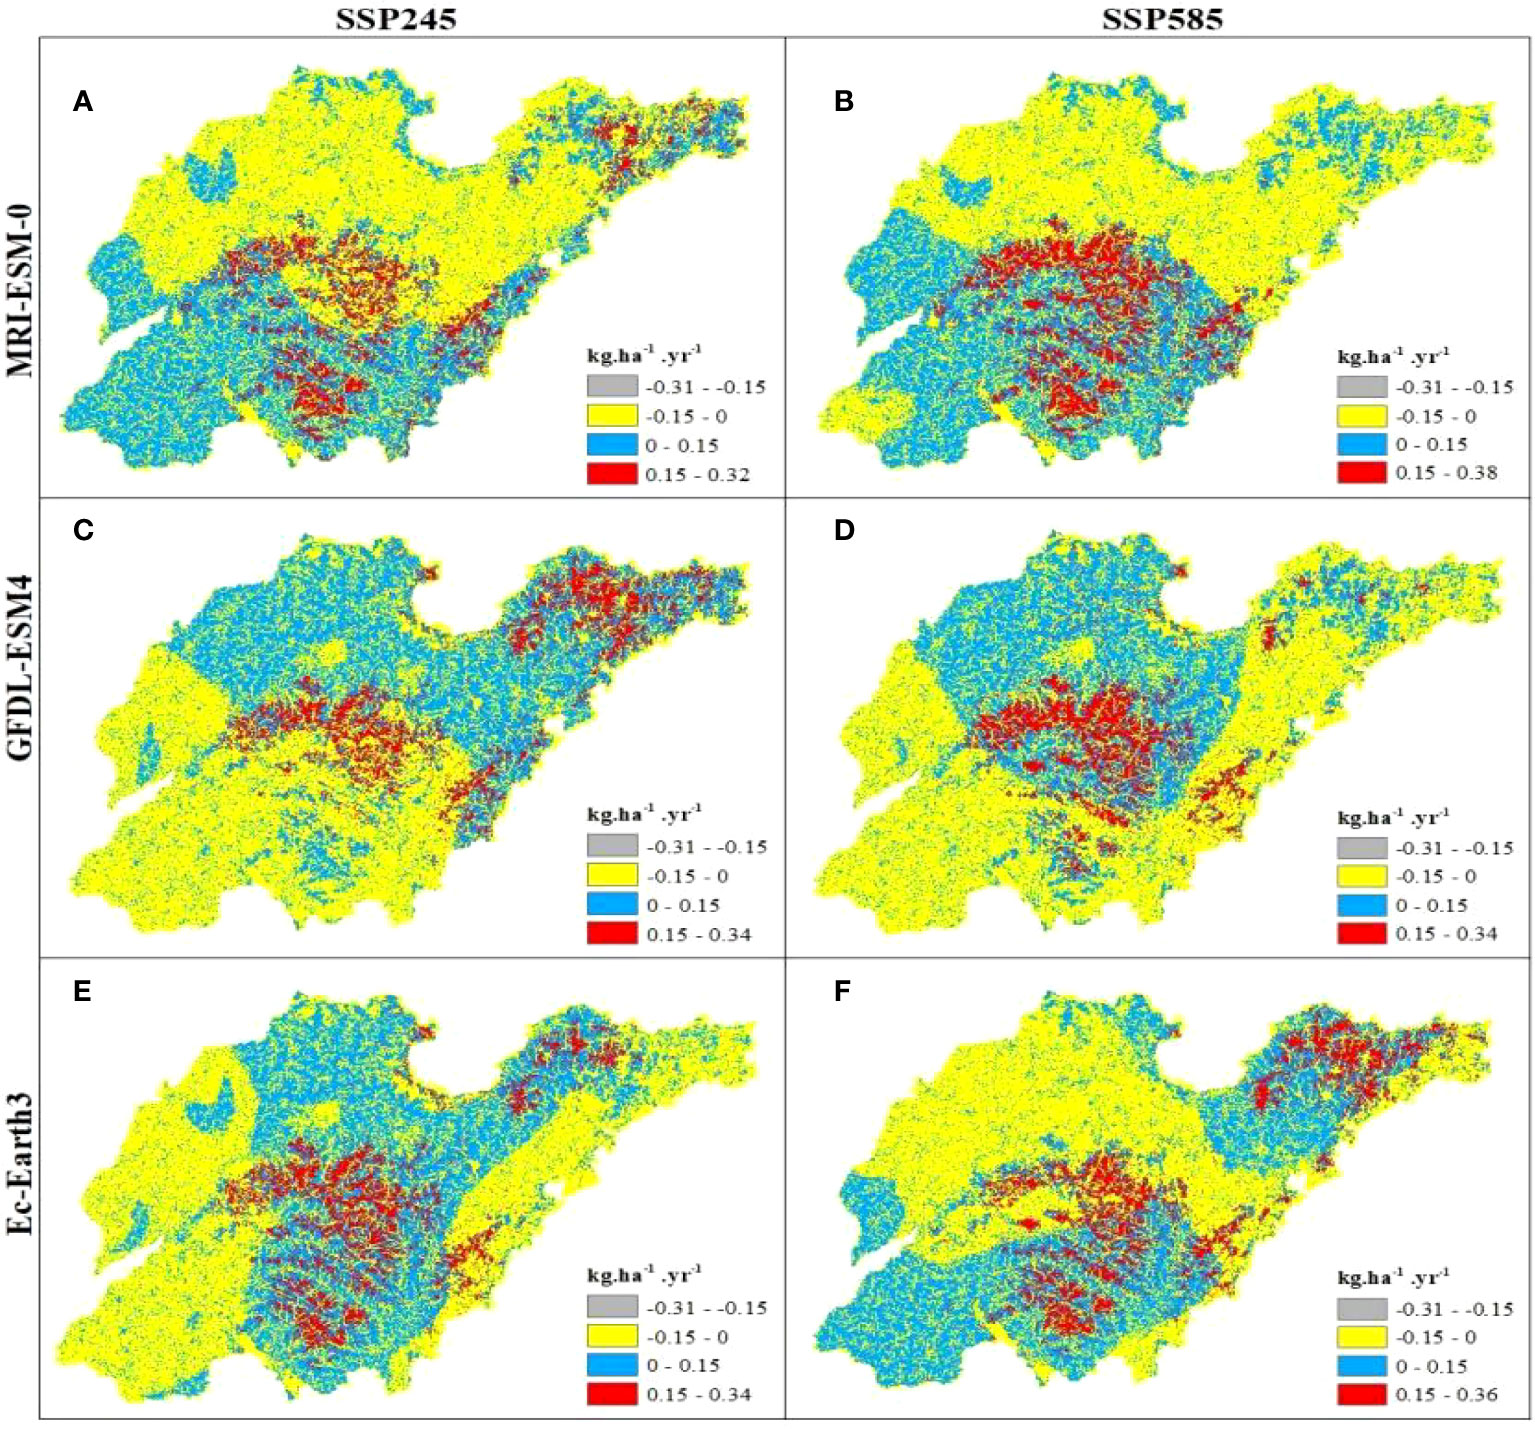
Figure 8 P future output changes. (A:2030 P output change in SSP245 and MRI-ESM-0; B:2030 P output change in SSP585 and MRI-ESM-0; C:2030 P output change in SSP245 and GFDL-ESM4; D:2030 P output change in SSP585 and GFDL-ESM4; E:2030 P output change in SSP245 and Ec-Earth3; F:2030 P output change in SSP585 and Ec-Earth3).
From Figures 7A, 8A, it can be seen that the mean value of the variable output load from 2020 to 2030 for the MRI-ESM-0 model SSP245 scenario is 0.313 kg ha−1 year−1 for N and 0.028 kg ha−1 year−1 for P. Overall, the output load of N and P has increased from 2020 to 2030. In terms of spatial distribution, the changing output load of N and the changing output load of N under the SSP245 scenario from 2020 to 2030 are basically the same distribution pattern. The increased N and P output loads are mainly concentrated in the southwestern and northeastern parts of Shandong Province, while the rest of the northern parts have relatively reduced N and P output loads. From Figures 7B, 8B, it can be seen that the mean value of the variable output load from 2020 to 2030 for the MRI-ESM-0 model SSP585 scenario is 0.350 kg ha−1 year−1 for N and 0.029 kg ha−1 year−1 for P. Overall, the output load of N and P increases from 2020 to 2030. In terms of spatial distribution, the changing output load of N from 2020 to 2030 under the SSP585 scenario and the changing output load distribution pattern of N are basically the same. The increased N and P output loads are mainly concentrated in the south of Shandong Province, the increased drastic loads are mainly in the south-central part, and the decreased N and P output loads are mainly concentrated in the north of Shandong Province. Based on the above changes, it can be seen that the distribution of variable output load of N and P is approximately the same for different scenarios in the MRI-ESM-0 model, but the output load of N and P in the SSP585 scenario has a wider area and a larger total amount.
From Figures 7C, 8C, it can be seen that the mean value of the variable output load for the GFDL-ESM4 model SSP245 scenario from 2020 to 2030 is 0.312 kg ha−1 year−1 for N and 0.027 kg ha−1 year−1 for P. Overall, the output load of N and P has increased from 2020 to 2030. In terms of spatial distribution, the changing output load of N and the changing output load of N under the SSP245 scenario from 2020 to 2030 are basically the same distribution pattern. The increased output loads of N and P were mainly distributed in the north, and the areas with drastic increases were mainly concentrated in the north-central and northeastern parts, while the output loads of N and P decreased in most areas in the south of Shandong Province. From Figures 7D, 8D, it can be seen that the mean value of the variable output load from 2020 to 2030 for the GFDL-ESM4 model SSP585 scenario is 0.342 kg ha−1 year−1 for N and 0.029 kg ha−1 year−1 for P. Overall, the output load of N and P increases from 2020 to 2030. In terms of spatial distribution, the changing output load of N from 2020 to 2030 under the SSP585 scenario and the changing output load distribution pattern of N are basically the same. The increased N and P output loads are mainly concentrated in the central and northwestern part of Shandong Province, the drastic load increase is mainly in the central region, and the reduced N and P output loads are mainly distributed in the southwestern and some eastern parts of Shandong Province. Based on the above changes, it can be seen that the spatial distribution of variable output loads of N and P differs for different scenarios in the GFDL-ESM4 model. The output load area of N and P decreased in the SSP585 scenario, but the total output increased, indicating that local N and P pollution became more severe.
From Figures 4E, 5E, it can be seen that the mean value of the variable output load from 2020 to 2030 for the EC-Earth3 model SSP245 scenario is 0.307 kg ha−1 year−1 for N and 0.027 kg ha−1 year−1 for P. Overall, the output load of N and P has increased from 2020 to 2030. In terms of spatial distribution, the changing output load of N and the changing output load of N under the SSP245 scenario from 2020 to 2030 are basically the same distribution pattern. The increased N and P output loads are mainly concentrated in the central, southern, and central regions of Shandong Province, and the areas of dramatic increase are mainly concentrated in the central and southern regions of Shandong Province, while the reduced N and P output loads are distributed in the western as well as some eastern regions of Shandong Province. From Figures 4F, 5F, it can be seen that the EC-Earth3 model SSP585 scenario has a mean value of 0.355 kg ha−1 year−1 for the changing output load of N and 0.030 kg ha−1 year−1 for the changing output load of P from 2020 to 2030. Overall, the output load of N and P has increased from 2020 to 2030. In terms of spatial distribution, the changing output load of N from 2020 to 2030 under SSP585 scenario and the changing output load distribution pattern of N are basically the same. The increased N and P output loads are mainly distributed in the central and southern part of Shandong Province as well as in the northeastern part of the country, the increased drastic loads are mainly in the central and southern part of the country, and the decreased N and P output loads are mainly distributed in the northwestern part of Shandong Province. Based on the above changes, it can be seen that the spatial distribution of output loads of N and P varies for different scenarios in the EC-Earth3 model. The output load area of N and P decreased in the SSP585 scenario, but the total output increased, indicating that local N and P pollution became more severe. From Figures 4A–F, 5A–F, it can be seen that the spatial distribution of output loads of N and P changes from 2020 to 2030 for three different climate models (MRI-ESM-0, GFDL-ESM4, and Ec-Earth3) under the same scenario, but the total output of N and P does not change much, indicating that different climate models only have an effect on the spatial distribution of output loads of N and P.
With the help of the hot spot analysis operation of the ArcGIS 10.7 software, the output load of nitrogen and phosphorus in Shandong Province in 2010, 2020, and 2030 was analyzed, and the cold hot spot distribution map of nitrogen and phosphorus in Shandong Province was obtained (Figures 9–12).
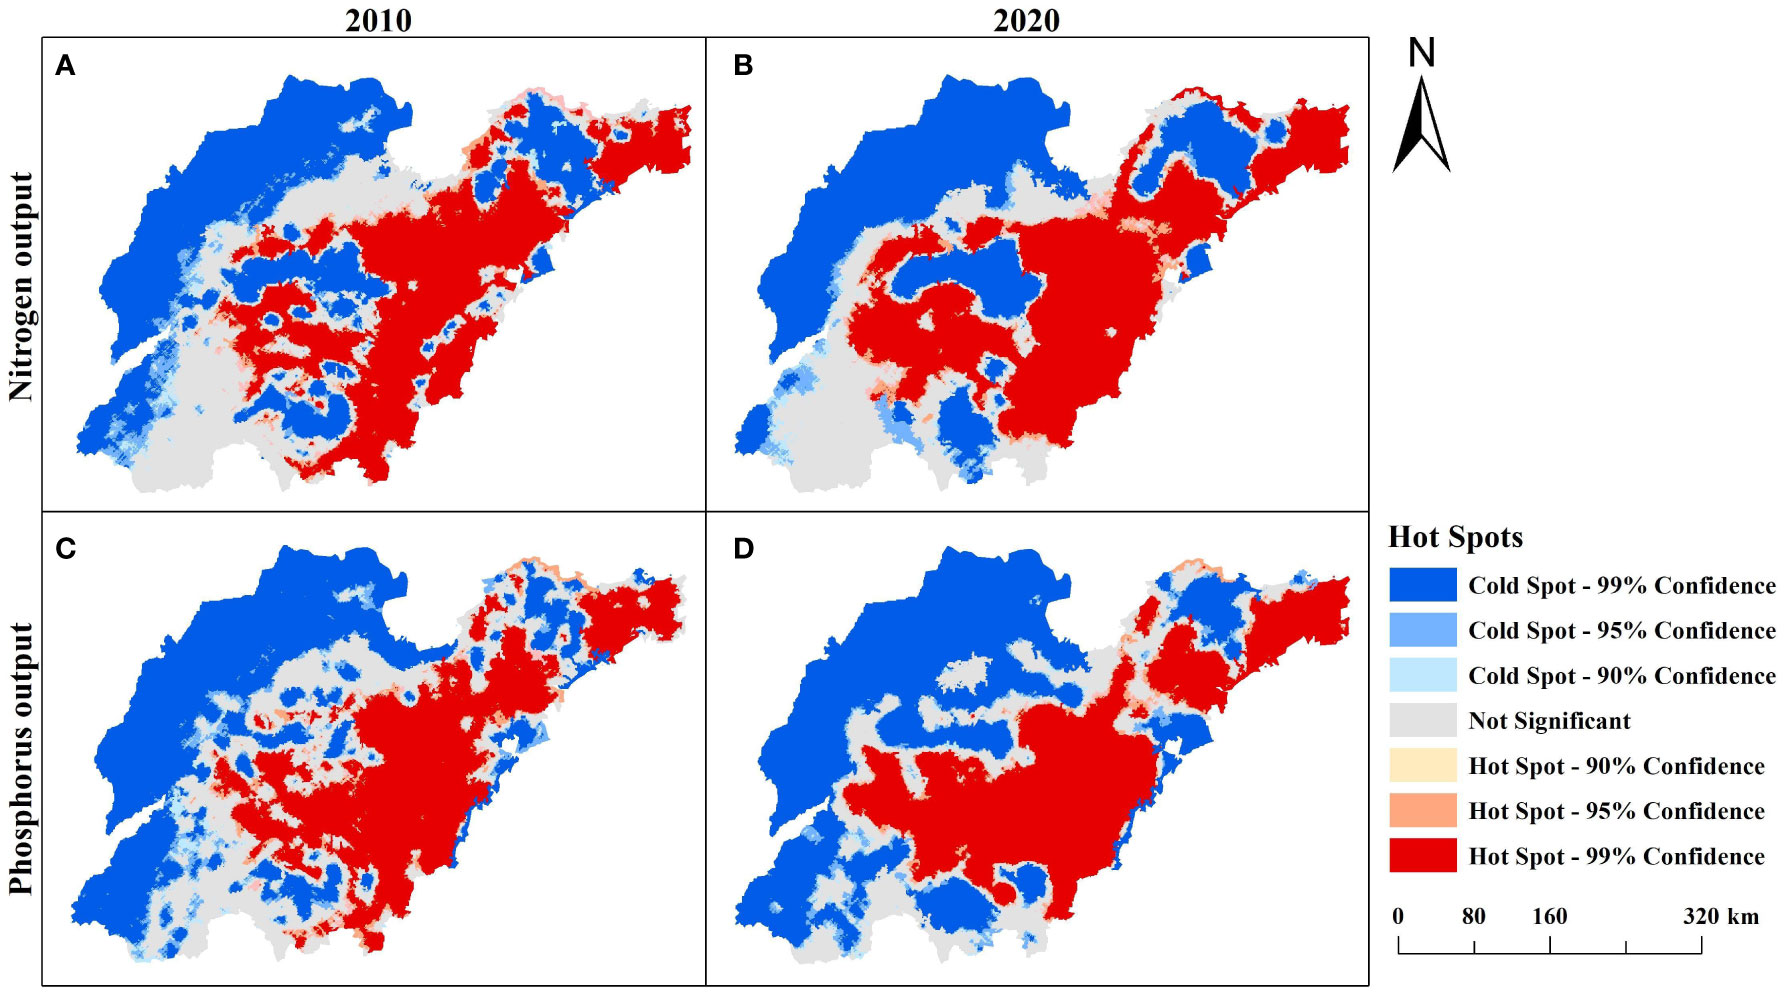
Figure 9 2010–2020 hot spot analysis of N and P. (A:2010 N Hot spot; B:2020 N Hot spot; C:2010 P Hot spot; D:2020 P Hot spot).
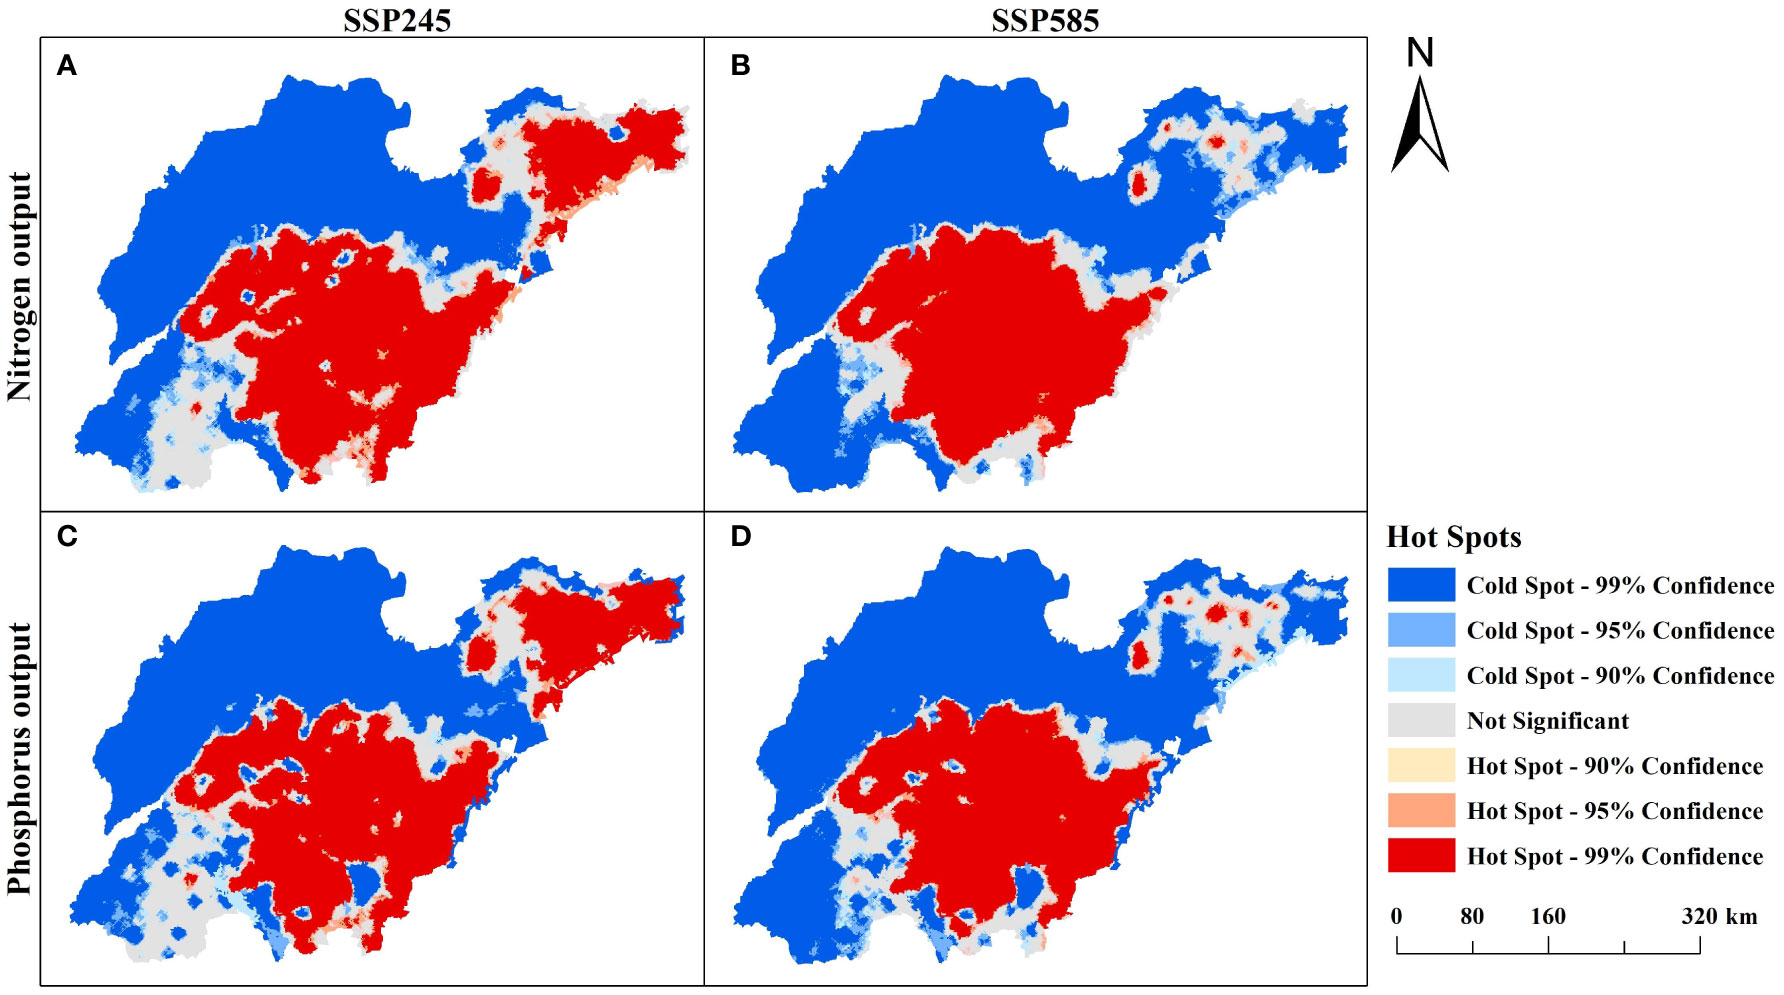
Figure 10 N and P hot spot analysis in MRI-ESM-0 mode. (A: SSP245 N Hot spot in 2030; B: SSP585 N Hot spot in 2030; C: SSP245 P Hot spot in 2030; D: SSP585 P Hot spot in2030).
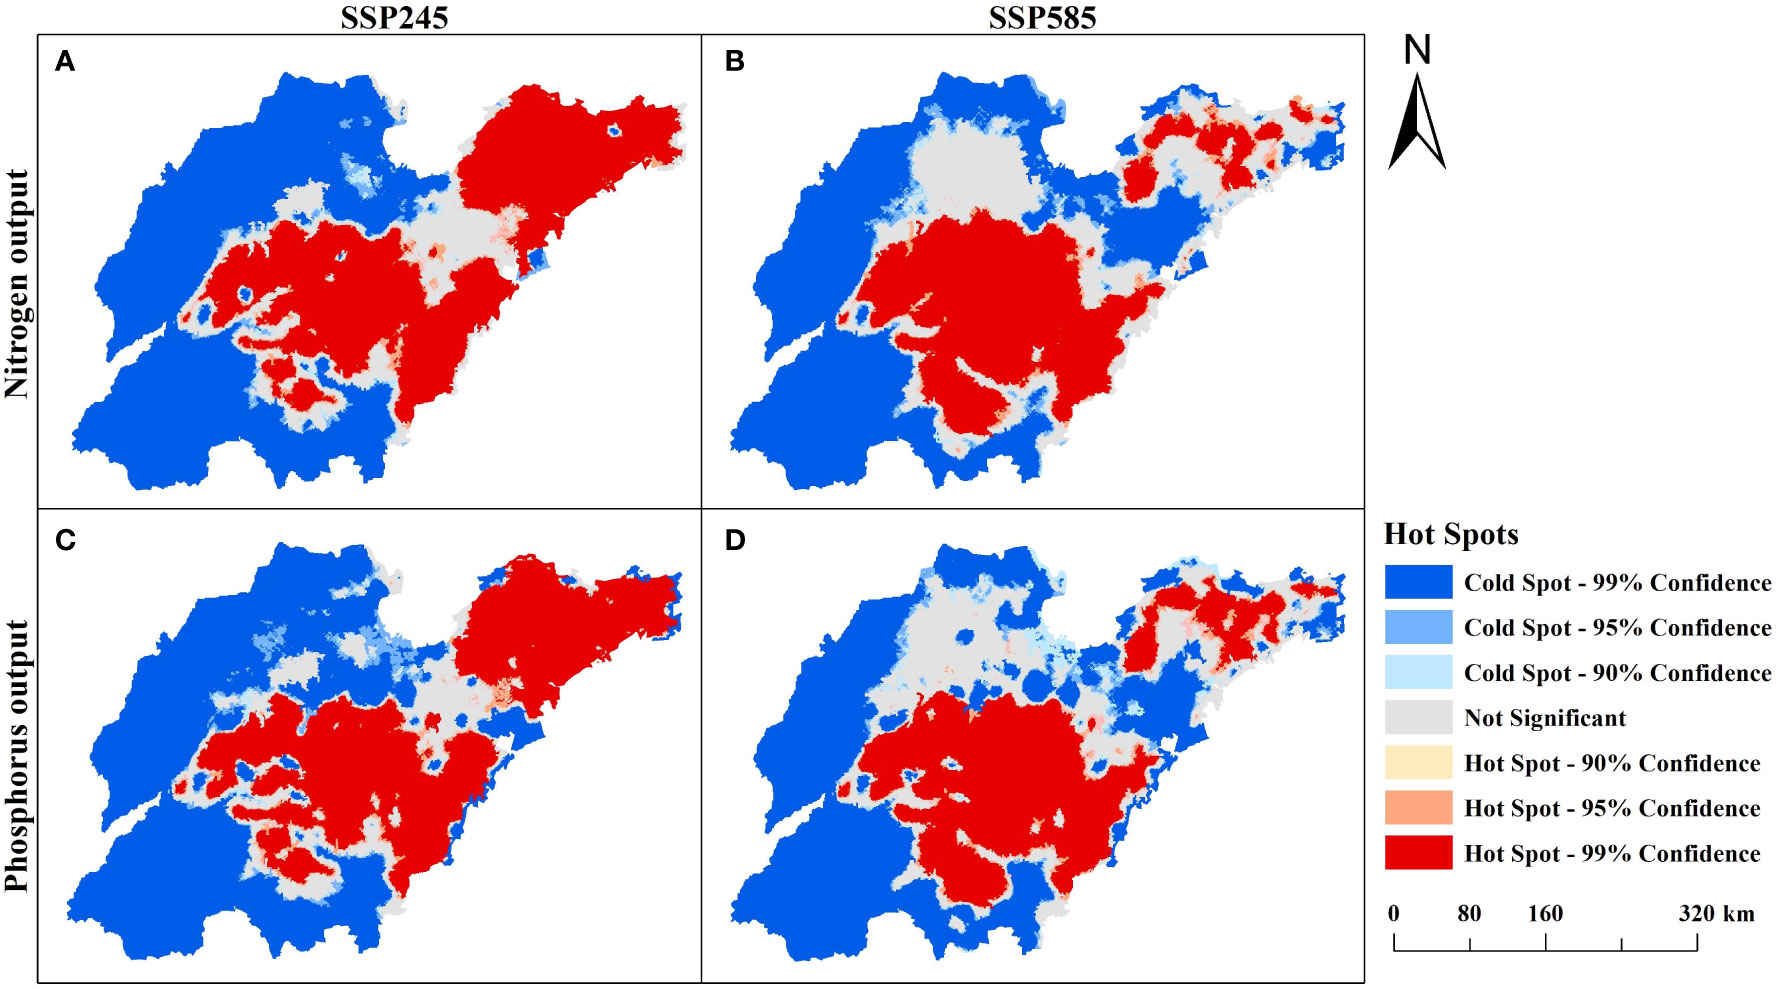
Figure 11 N and P hot spot analysis in Ec-Earth3 mode. (A: SSP245 N Hot spot in 2030; B: SSP585 N Hot spot in 2030; C: SSP245 P Hot spot in 2030; D: SSP585 P Hot spot in2030).
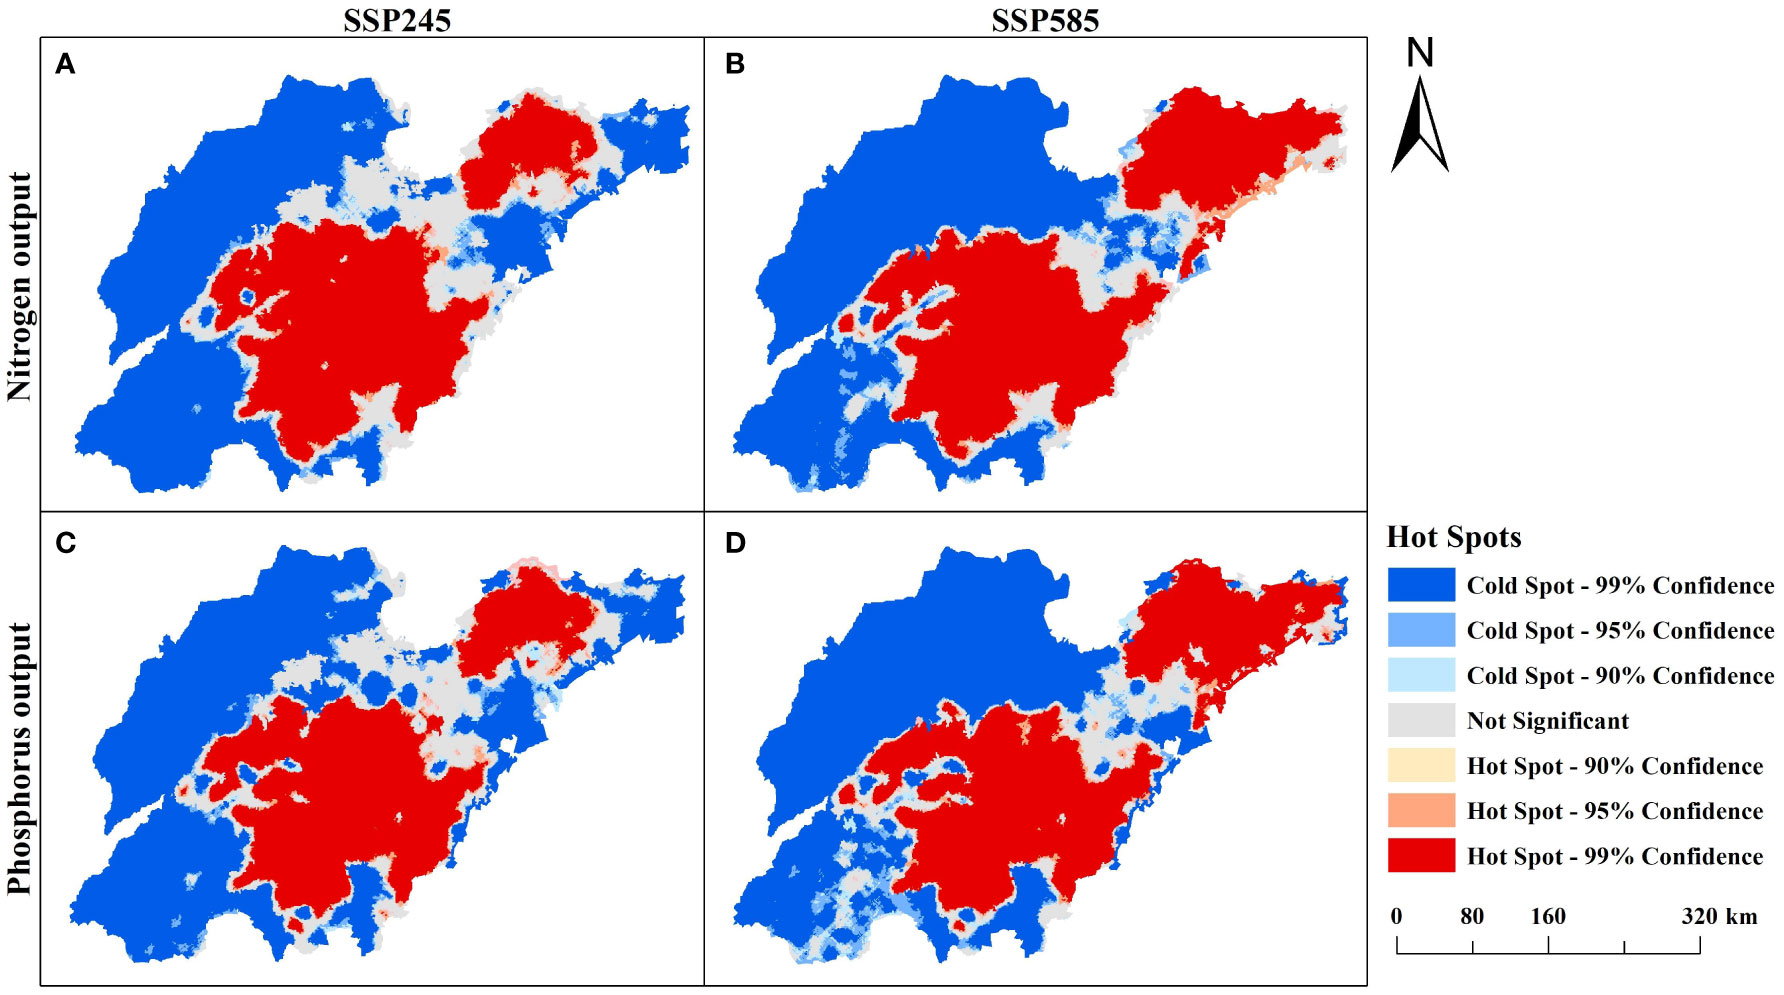
Figure 12 N and P hot spot analysis in Ec-Earth3 mode. (A: SSP245 N Hot spot in 2030; B: SSP585 N Hot spot in 2030; C: SSP245 P Hot spot in 2030; D: SSP585 P Hot spot in2030).
In 2010, the hot spots of nitrogen and phosphorus were mainly distributed in the central and northern part of Shandong Province, and the cold spots were mainly distributed in the southern part of Shandong Province. The hot spots of nitrogen were larger than those of phosphorus, and the cold spots of nitrogen were smaller than those of nitrogen. From 2010 to 2020, the hot spots of nitrogen and phosphorus decreased, but were still clustered in the central and northern regions, while the number of cold spots increased significantly from scattered to relatively concentrated, and the area of insignificant regions also decreased.
The analysis of nitrogen and phosphorus hotspots under the three global climate models in 2030 was compared with the distribution of nitrogen and phosphorus hotspots in 2020. The overall spatial pattern of the three climate models under the SSP245 scenario was relatively stable, and the distribution of cold hotspots was relatively concentrated, with cold spots mainly concentrated in the northwest region, and hot spots mainly concentrated in the northeast and central and southern regions. At the same time, in the MRI-ESM-0 mode, compared with 2020, the cold spot area is further expanded, the hot spot area is reduced, and the insignificant area is greatly reduced. In the GFDL-ESM4 model, compared with 2020, the cold spot area was further expanded, the hot spot area was reduced slightly, and the hot spot area in the northeast region increased sharply, while the insignificant area was reduced relatively little. In the Ec-Earth3 model, compared with 2020, the cold spot area is further expanded, the hot spot area is reduced less, and it is relatively concentrated in the central region, and the non-significant area is reduced less. Under the SSP585 scenario, the overall spatial pattern of the three climate models was relatively stable, and the distribution of cold hotspots was relatively concentrated. Under MRI-ESM-0 mode, compared with 2020, the cold spot areas were further expanded, mainly distributed in the north and southwest regions, while the hot spot areas were reduced, mainly concentrated in the central region, and the insignificant areas were significantly reduced. Under the GFDL-ESM4 model, compared with 2020, the cold spot areas were further expanded, the hot spot areas were reduced more, the hot spot areas were mainly concentrated in the central region and were scattered in the northeast, and the insignificant areas were reduced relatively less. Under the Ec-Earth3 model, compared with 2020, the cold spot area is further expanded, and the hot spot area is relatively reduced, but the hot spot area in the northeast region increases, and the insignificant area decreases.
In conclusion, regardless of the model, the hot spot area in the central and southern regions of Shandong Province did not change much, and the northwest was basically the cold spot area. The reason for this is that there are many farmlands in the central region of Shandong Province, and a large amount of nitrogen and phosphorus enter the farmlands due to the fertilization of farmers, thus forming pollution. The water system in northwest Shandong Province is relatively developed, and nitrogen and phosphorus pollution is washed into the Bohai Sea along with the river, which makes nitrogen and phosphorus pollution in northwest Shandong Province less serious. The overall cold hot spot pattern of nitrogen and phosphorus pollution in Shandong Province is stable, and basically shows the distribution pattern of “band + cluster + scatter”.
Based on the results of historical and future N and P surface source pollution simulations in Shandong Province output by the NDR module of InVEST, and the temporal and spatial analysis of the simulation results, the following results were obtained: (1) On the time scale, the output load and total output of N and P in Shandong Province decreased from 2010 to 2020, and the output load and total output of N and P in Shandong Province increased from 2020 to 2030. (2) On the spatial scale, the spatial distribution of N and P output loads in 2010, 2020, and 2030 is roughly the same, being “low in the northwest and high in the southeast”. (3) In the same climate model, the variation of N and P output load and total output in Shandong Province under different climate scenarios is different, and the total output of N and P is greater in the SSP585 scenario, indicating that N and P pollution is more serious in the SSP585 scenario. In the Ec-Earth3 model, the output load and total output of nitrogen and phosphorus in the SSP245 scenario are the lowest. It is suggested that the future development of Shandong Province should be as close as possible to the SSP245 scenario in the Ec-Earth3 model. (4) Under the same climate scenario, the spatial distribution of the variable output load of N and P differed under different climate models, but the total output of N and P did not change significantly, indicating that different climate models only had effects on the spatial distribution of the output load of N and P. (5) The overall cold hot spot pattern of nitrogen and phosphorus pollution in Shandong Province is stable, basically showing a “band + cluster + scatter” distribution pattern; the hot spot area in the central and southern region of Shandong Province changes little regardless of the model, the northwest is basically a cold spot area, and the nitrogen and phosphorus hot spot area under the SSP245 scenario in Ec-Earth3 model had the least amount of change.
The output load and total output of N and P in Shandong Province in 2030 simulated by three climate models and two climate scenarios in this paper are elevated. In order to prevent the increasing trend of N and P, the following recommendations are made for the future development of Shandong Province: (1) Reducing fertilizer use on cropland. Shandong Province is the main grain-producing area in China, and its farmland sowing area accounts for 69.89% of the total area (Statistical Bureau of Shandong Province, 2019). Shandong Province can maximize the use of its agricultural land by strengthening the rational use of fertilizer management, reducing the impact of fertilizer on the water environment, improving the level of agricultural management, and increasing the utilization rate of fertilizer, which can effectively curb the surface source pollution emissions in Shandong Province. (2) Adjust the planting structure. For areas with high output load of N and P, crops with high tolerance of N and P can be selected, thereby increasing the effectiveness of N and P while eliminating or reducing fertilizer application. Properly planned cropping systems and crop rotations can effectively reduce the risk of N and P entering the receiving water bodies (Duan et al., 2007). (3) Strengthen the supervision of livestock and poultry breeding. The scale of livestock and poultry breeding in Shandong Province is large; thus, the corresponding pollution caused is more serious (Yu et al., 2021). Therefore, it is important to accelerate the change from decentralized operation to large-scale farming, strengthen the supervision of small-scale farms and farmers, enhance the control of livestock and poultry manure emissions from retail households, and promote the institutionalization and standardization of livestock and poultry farming to reduce N and P surface source pollution in Shandong Province (Ma and Yue, 2021). (4) Strengthening prevention and control at the source. The government helps reduce the output load of N and P in Shandong Province by setting up buffer zones (Qu et al., 2022), ecological ditches, and vegetation buffer zones.
Publicly available datasets were analyzed in this study. This data can be found here: http://www.geodata.cn/.
Conceptualization: QL and GL. Data management: WC, JH, YG, and SY. Methods and writing – First draft: JCZ, JWZ, and HG. Funding sources: QL, GL, and WC. Project management department: JH and YG. Writing-comments and editing: QL, JCZ, HG and GL. All of the authors have contributed to this article and have approved the submitted version.
This research was funded by the National Key R&D Program of China (2021YFD1700900), the Research Project of Henan Federation of Social Sciences (2023-ZZJH-189), the Research Project of Henan Federation of Social Sciences (SKL-2022-2249), and the special fund for top talents in Henan Agricultural University (30501031).
The authors declare that the research was conducted in the absence of any commercial or financial relationships that could be construed as a potential conflict of interest.
All claims expressed in this article are solely those of the authors and do not necessarily represent those of their affiliated organizations, or those of the publisher, the editors and the reviewers. Any product that may be evaluated in this article, or claim that may be made by its manufacturer, is not guaranteed or endorsed by the publisher.
Benez-Secanho F., Dwivedi P. (2019). Does quantification of ecosystem services depend upon scale (Resolution and extent)? A case study using the inVEST nutrient delivery ratio model in Georgia, United States. Environments 6, 52. doi: 10.3390/environments6050052
Carpenter R., Caraco N., Correl D., Howarth R., Sharpley A., Smith V. (1998). Nonpoint polution of surface waters with phosphorus and nitrogen. Ecol. Appl. 8 (3), 559–568. doi: 10.1890/1051-0761(1998)008[0559:NPOSWW]2.0.CO;2
Duan L., Duan Z., Xia S. (2007). The reason and solution of nitrogen and phosphorus release to water from farmland. Soils Fertilizers Sci. China 4), 6–11. doi: 10.3969/j.issn.1673-6257.2007.04.002
Feng A., Wu C., Wang X., Wang H., Zhou Y., Zhao Q. (2019). Spatial character analysis on nitrogen and phosphorus diffuse pollution in Haihe River Basin by remote sensing. China Environ. Sci. 39 (7), 2 999–3 008. doi: 10.3969/j.issn.1000-6923.2019.07.037
Gao J., Zhang Z., Hu Yi, Bian J., Jiang W., Wang X., et al. (2014). Geographical distribution patterns of iodine in drinking-water and its associations with geological factors in Shandong Province, China. Int. J. Environ. Res. Public Health 11 (5), 5431–5444. doi: 10.3390/ijerph110505431
Geng R., Yin P., MA Q. (2017). Drinking water source divisions based on identification of critical source areas. Res. Environ. Sci. 30 (3), 329–339. doi: 10.13198/j.issn.1001-6929.2017.01.72
Han B., Reidy A., Li A. (2021). Modeling nutrient release with compiled data in a typical Midwest watershed. Ecol. Indic. 121, 107213. doi: 10.1016/j.ecolind.2020.107213
He B., Hu M. (2022). Evaluation of agriculture non-point pollution load and its characteristics in all districts and counties of Guangdong. Ecol. Environ. Sci. 04, 771–776. doi: 10.16258/j.cnki.1674-5906.2022.04.015
Jiang M., Xue X., Zhang L., Chen Y., Zhao C., Song H., et al. (2022). Peanut drought risk zoning in Shandong Province, China. Sustainability 14 (6), 3322. doi: 10.3390/su14063322
Johnes P. J. (1996). Evaluation and management of the impact of land use change on the nitrogen and phosphorus load delivered to surface waters: the export coefficient modelling approach. J. Hydrol. 183 (3), 323–349. doi: 10.1016/0022-1694(95)02951-6
Lam Q., Schmalz B., Fohrer N. (2010). Modelling point and diffuse source pollution of nitrate in a rural lowland catchment using the SWAT model. Agric. Water Manage. 97 (2), 317–325. doi: 10.1016/j.agwat.2009.10.004Ava
Li J., Li H., Dong W., Qin Y. (2011). Monitoring and load estimation of non-point source pollution on typical tributaries in the Guanzhong reach of the Weihe River. Acta Scientiae Circumstantiae 31 (7), 1470–1478. doi: 10.1002/pssr.200600016
Li Z., Yang G., Li H. (2009). Estimated nutrient export loads based on improved export coefficient model in Xitiaoxi watershed. Environ. Sci. 30 (3), 668–667. doi: 10.3321/j.issn:0250-3301.2009.03.008
Liu J., Fu B., Zhang C., Wang Y. (2019). Modelling spatial variation in the treatment costs of non-point source pollution in mountainous regions of southwest China. J. mountain Sci. 16 (8), 1901–1912. doi: 10.1007/s11629-018-5051-x
Liu X., Li X., Liang X., Shi H., Ou J. (2019). Simulating the change of terrestrial carbon storage in China based on the FLUS-inVEST model. Trop. Geogr. 39 (3), 397–409. doi: 10.13284/j.cnki.rddl.003138
Ma J., Yue Z. (2021). The analysis of the spatial difference and its influencing factors of agricultural non-point source pollution in China. Res. Agric. Modernization 06), 1137–1145. doi: 10.13872/j.1000-0275.2021.0114
Qu L., Yu Z., Hao Q., Sun X., Yin E. (2022). Best management practices for non-point source pollution in Nishan Reservoir based on SWAT model. J. Water Resour. Water Eng. 33 (04), 32–39+49. doi: 10.11705/j.issn.1672-643X.2022.04.05
Redhead J. W., May L., Oliver T. H., Hamel P., Sharp R., Bullock J. M. (2018). National scale evaluation of the InVEST nutrient retention model in the United Kingdom. Sci. Total Environ. 610-611, 666–677. doi: 10.1016/j.scitotenv.2017.08.092
Romagnoli M., Portapila M., Rigalli A., Maydana G., Burgués Martín, García C. M. (2017). Assessment of the swat model to simulate a watershed with limited available data in the Pampas region, Argentina. Sci. Total Environ. s 596–597 (OCT.15), 437–450. doi: 10.1016/j.scitotenv.2017.01.041
Sharp R., Chaplin-Kramer R., Wood S., Guerry A., Tallis H., Ricketts T, et al. (2018). InVEST User ’s Guide. Collaborative Publication by the Natural Capital Project, Stanford University, University of Minnesota, the Nature Conservancy, and World Wildlife Fund Stanford University: Stanford, CA, USA. doi: 10.13140/RG.2.2.32693.78567
Statistical Bureau of Shandong Province (2019). Statistical yearbook of Shandong Province 2019 (Beijing: China Statistics Press).
Stefano S., Gabriele G., Carlo B., Carolina G. (2017). The integration of ecosystem services in planning: an evaluation of the nutrient retention model using invest software. Land 6 (3), 48. doi: 10.3390/land6030048
Tao Y., Xu J., Ren H., Guan X., You L., Wang S. (2021). Spatiotemporal evolution of agricultural non-point source pollution and its influencing factors in the Yellow River Basin. Trans. Chin. Soc. Agric. Eng. 37 (04), 257–264. doi: 10.11975/j.issn.1002-6819.2021.04.031
Villamizar M. L., Brown C. (2016). Modelling triazines in the valley of the River Cauca, Colombia, using the annualized agricultural non-point source pollution model. Agric. Water Manage. 2016, 17724–17736. doi: 10.1016/j.agwat.2016.06.010
Wang X., Chen B., Dong Q. (2023). The limit of urban land expansion based on population growth and economic development: A case study of Shandong Province in China. Sustainability 15 (1), 73. doi: 10.3390/su15010073
Wang H., Gao Y., Sheng L., Wang Y., Zeng X., Kou W., et al. (2022). The impact of meteorology and emissions on surface ozone in Shandong Province, China, during summer 2014–2019. Int. J. Environ. Res. Public Health 19 (11), 6758. doi: 10.3390/ijerph19116758
Wu Z., Chen X., Liu B., Chu J., Peng L. (2014). Risk assessment of nitrogen and phosphorus loads in hainan island based on inVEST model. Chin. J. Trop. Crops 34 (9), 1791–1797. doi: 10.3969/j.issn.1000-2561.2013.09.029
Xu Y., Li Z., Wang L. (2020). Temporal-spatial differences in and influencing factors of agricultural eco-efficiency in Shandong province. Ciência Rural 50, 7. doi: 10.1590/0103-8478cr20190818
Xue Z. (2017). The assessment of ecosystem service functions in Yanhe River based on the InVEST model (Xi’an: Northwest University). Available at: https://kns.cnki.net/KCMS/detail/detail.aspx?dbname=CMFD201801&filename=1017117257.nh.
Yan Y., Guan Q., Wang M., Su X., Wu G., Chiang P., et al. (2018). Assessment of nitrogen reduction by constructed wetland based on InVEST: A case study of the Jiulong River Watershed, China. Mar. pollut. Bull. 133, 349–356. doi: 10.1016/j.marpolbul.2018.05.050
Yu N., Wang X., Li T., Wang Q., Zhai S., Li Q. (2021). Risk assessment of farmland and water contamination with livestock manure in Shandong Province. J. Agric. Resour. Environ. 38 (05), 820–828. doi: 10.13254/j.jare.2020.0590
Zhang Q., Hu H., Wang D., Qiu C., Li C., Bai C., et al. (2021). Spatial distribution of nitrogen and phosphorus in haihe basin and their determinants. J. Irrigation Drainage 40 (04), 97–106. doi: 10.13522/j.cnki.ggps.2020411
Keywords: non-point sources, InVEST, global climate models, shared socioeconomic, land use
Citation: Li Q, Zhang J, Zhang J, Gao H, Chen W, Huang J, Guo Y, Yue S and Li G (2023) Spatial and temporal distribution characteristics and prediction analysis of nitrogen and phosphorus surface source pollution in Shandong Province under the climate and land use changes. Front. Ecol. Evol. 11:1231394. doi: 10.3389/fevo.2023.1231394
Received: 30 May 2023; Accepted: 28 July 2023;
Published: 23 August 2023.
Edited by:
Ning Niu, Henan University of Economic and Law, ChinaCopyright © 2023 Li, Zhang, Zhang, Gao, Chen, Huang, Guo, Yue and Li. This is an open-access article distributed under the terms of the Creative Commons Attribution License (CC BY). The use, distribution or reproduction in other forums is permitted, provided the original author(s) and the copyright owner(s) are credited and that the original publication in this journal is cited, in accordance with accepted academic practice. No use, distribution or reproduction is permitted which does not comply with these terms.
*Correspondence: Genming Li, Z20ubGlAaGVuYXUuZWR1LmNu
†These authors have contributed equally to this work
Disclaimer: All claims expressed in this article are solely those of the authors and do not necessarily represent those of their affiliated organizations, or those of the publisher, the editors and the reviewers. Any product that may be evaluated in this article or claim that may be made by its manufacturer is not guaranteed or endorsed by the publisher.
Research integrity at Frontiers
Learn more about the work of our research integrity team to safeguard the quality of each article we publish.