 Pere Pons
 Roger Puig-Gironès
 Carles Tobella
 Andreu Peiris1
94% of researchers rate our articles as excellent or good
Learn more about the work of our research integrity team to safeguard the quality of each article we publish.
Find out more
METHODS article
Front. Ecol. Evol., 22 August 2023
Sec. Population, Community, and Ecosystem Dynamics
Volume 11 - 2023 | https://doi.org/10.3389/fevo.2023.1219636
Cicadas are a fascinating group of insects that play an essential role in terrestrial ecosystems. Their long-lasting association with plant roots encourages their use as indicators of vegetation and soil integrity. Cicada-MET is a novel, standardized method for monitoring cicada populations by counting cicada exuviae (i.e., the skin of emerged nymphs), providing an effective and efficient means to study their distribution, abundance, and ecology. The method involves annual exuviae counts along transects and fixed plots sampled throughout the emergence season. We validated Cicada-MET using a database of 466 counts from 64 transects over 10 years and the sampling of 60 plots for one season. Methodological aspects tested included sampling speed, exuviae detectability in successive counts, exuviae loss due to weather, and cicada species detection performance using exuviae counts compared to auditory methods. Transects captured approximately 10% of the total number of emerged nymphs across one season, demonstrating the protocol’s reliability in estimating emerging cicada population numbers. However, caution is needed when inferring densities for larger areas, separated from paths where transects are located. The standardized nature of Cicada-MET reduces spatial and temporal biases, allowing for interspecific comparisons and monitoring interannual variations in abundances and emergence timing. This method is well-suited for studying the impact of natural and anthropogenic disturbances. The high-resolution data obtained can be easily combined with environmental variables, enhancing the value of cicada data as bioindicators. In summary, Cicada-MET offers a versatile and efficient tool for monitoring cicada populations, with applications in ecological indication, conservation, and management. The adaptability of Cicada-MET to various research questions, spatial scales, and long-term approaches, along with its quantitative accuracy and ease of use, make it a valuable resource for researchers and practitioners working with cicadas and their associated ecosystems.
Graphical Abstract
Cicadas (Cicadoidea) are an interesting focal group for ecological studies. They are abundant in diverse natural and artificial habitats around the world, including in the Americas, Africa, Eurasia, Australia, New Guinea, Borneo, Madagascar, and most non-arctic large islands (Marshall et al., 2018). Juvenile cicadas or nymphs are root feeders, feeding on the xylem fluid of plant species for several years, and thus are potential indicators of the integrity of the root system, and of the water and nutrients that host plants are absorbing (Williams and Simon, 1995). Nymphs also need uncompacted substrates to construct their burrows and feeding cells; their abundance being indicative of well-structured and healthy soils (Boulard, 1965; Smith and Hasiotis, 2008). Consequently, cicada nymphs have been used so far as bioindicators of human impacts on the soil, including its compaction (Moriyama and Numata, 2015), degradation (Hou et al., 2018) and contamination by mercury (Zheng et al., 2010).
Estimated biomasses of North American periodical cicadas (i.e. those whose adults appear synchronically every 13 or 17 years) are amongst the highest of any animal in terrestrial ecosystems (Karban, 2014). Yet, non-periodical cicadas (i.e. those whose adults can appear each year) can also reach tens of thousands of individuals per hectare (Patterson et al., 1997). As a result, the growth of trees holding large cicada numbers is limited through the costs imposed by chronic root herbivory (Karban, 1980; Yang and Karban, 2009). However, plant growth can also benefit from fertilization due to carcass deposition and belowground water transport by high-density cicada populations (Andersen, 1994; Yang, 2004). The aggregate nature of these populations could lead to increased spatial variability in vegetation growth and recovery after disturbances.
Cicada adults are important prey for arthropods (Suzuki and Mukaimine, 2021) and vertebrates (Pons, 2020). Their abundance may enhance the survival and reproduction of predator species (Karban, 1982; Koenig and Liebhold, 2005) and thereby contribute to the regulation of insectivorous populations. Nonetheless, high cicada population densities, as found in emergence years of periodical cicadas, are able to satiate the local community of avian predators, thus increasing the likelihood of adult cicadas escaping predation (Karban, 1982). Furthermore, dead cicadas can provide a significant input of insect biomass into forest soils (Yang and Gratton, 2014). The specialised relationships of cicadas with fungi and arthropod parasites and bacterial endosymbionts have also been described recently (Liu et al., 2018; Simon et al., 2022).
In temperate latitudes, cicadas have a relatively short and predictable period of emergence from their belowground life (Smith et al., 2006), whereas in tropical ecosystems adults occur for longer periods of time (Lee et al., 2010), or even year round (Hart et al., 2015). When emerged nymphs moult into adults, they leave exuviae (skins) attached to the lowest vegetation strata. Exuviae mark the precise location where nymphs have occurred belowground for several years (Boulard, 1965), and can therefore be used to gather information about cicada juvenile life and environment and be accurate soil bioindicators. Ecological relevance, indicator use, accessibility of exuviae, population densities and global distribution, all make Cicadoidea a candidate focal group for promising ecological studies. However, a standardised method for quantifying cicada exuviae in natural habitats is lacking.
Insect moult is the casting of the external cuticle that functions as the body exoskeleton. The skin or shed left after a moult is known as the exuvia. It is composed of chitin (a polysaccharide that amounts to 20-50% of the cuticle dry weight), proteins, lipids and minerals (Chapman, 2012). Lasting for several weeks before degrading, insect exuviae can be used in ecological studies. Insect exuviae have been counted and collected by different methods, especially in dragonflies and damselflies (Odonata; Raebel et al., 2010, but see Bried et al., 2012) and midges (Diptera: Chironomidae; Ruse, 2010). Their sampling is not weather dependent, as it is for adults, it provides an accurate estimation of sex ratios and numbers of emerged imago (Dolný et al., 2014), and does not affect population numbers or the welfare of sampled animals. Methods used to collect dragonfly exuviae include unspecified sampling on different substrates or areas (Raebel et al., 2010; Dolný et al., 2018), line transects for which area but not time is specified (Dolný et al., 2014), and time-limited sampling of sites of an unspecified area (Hardersen et al., 2017). Most studies do not describe methods used in detail and standardization was lacking until the work of Arguel et al. (2022) for riverine dragonfly communities.
In cicadas, the last moult separates the final instar nymph, living belowground, from the adult living aboveground (Boulard, 1965). Final instar nymphal exuviae are found attached to grasses, shrubs and tree trunks, in well-exposed supports, since the newly emerged adult needs open space to unfold its wings and start the first fly (Boulard and Mondon, 1995). Body length of cicada exuviae (between the head and the last abdominal segment) oscillates from less than one to a few centimetres (Motta, 2003; Logan and Connolly, 2005; Lee et al., 2012). Direct sunlight and rainfall seem to accelerate their degradation, although this is poorly understood. Detectability of exuviae may vary according to their size, colour contrast with the background, density of low vegetation and whether they remain attached to the moulting support or have fallen from it (pers. obs.). Taxonomical and sexual identification of cicada exuviae by morphology or genetic analyses allows population studies to be conducted (Lee et al., 2012; Pons, 2015).
In contrast to the numerous studies based on odonata exuviae, cicada ecological studies have seldom used this source of information. More often, traps are used to capture newly emerged adults for estimating their feeding ecology (Callaham et al., 2000) or their density and emergence phenology (Smith et al., 2006; Whiles et al., 2019). Counting emergence holes or recording sound levels are also means to estimate cicada densities (Patterson et al., 1997; Maier, 2015). Cicada exuviae, specifically, have been counted in small quadrats of 0.125 m2 along transects (Andersen, 1994), in 100 m2 plots distributed on two-dimension grids (Lee et al., 2010) or in individual plots of variable size (35 to 14,000 m2) (Kim et al., 2014; Moriyama and Numata, 2015; Sato and Sato, 2015). Although several studies collect cicada exuviae, methodological limitations, such as poor sampling design, unknown sampled area or time, unmeasured detectability of exuviae, etc., usually prevent estimating population densities. To our knowledge, no cicada exuviae counting method exists that is described in detail and standardized so it can be used for monitoring cicada emergence in most regions and habitat types and estimate population densities.
We describe here a Cicada Monitoring protocol using Exuviae Transects, Cicada-MET. It allows abundances of emerging cicadas to be estimated in natural or semi-natural habitats. The method can be used to obtain long-term temporal trends, to monitor populations after natural or human induced disturbances, and to compare among experimental treatments, among habitats or, given some conditions, among taxa. This paper describes the different steps and gives recommendation for the use of the method and ideas for further studies. The quantitative aspects of the method rely on a 10-year database originated from the sampling of transects and plots in Catalonia (NE Spain).
The materials needed for doing the transect (T) and plot (P) counts include: a GPS device (T, P), field data sheets (T, P), a 1-m long stick (T), a photographic camera (T), measuring tape (T, P), stakes and string (P), and labelable containers for exuviae collection (T, P).
The method was developed in the frame of a fire ecology study and was inspired in transects conducted previously (Pons, 2015). Data used to describe procedures and test assumptions were gathered from burned and unburned Mediterranean-type forests. Cicada-MET has been used in the field by trained observers who have conducted transect counts for ten years (PP and JMB) and plot counts for one year (AP and Gemma Banchs).
To conduct Cicada-MET, we recommend following seven consecutive steps that are summarized in Table 1 and described in detail in following sections. Additionally, a sample of transects can be counted twice successively to account for species detectability (see section 4.2). The procedure works if phenology is predictable and its interannual changes are moderate. It can be used for a focal species or for several species (with enough sample size in the study area), separately. It combines a time-consuming method (plots) that has to be applied once per study region (and ideally repeated each 5-10 years to account for longer term variability in phenology), with a rapid method (transects) that allows a high number of replicates each year.
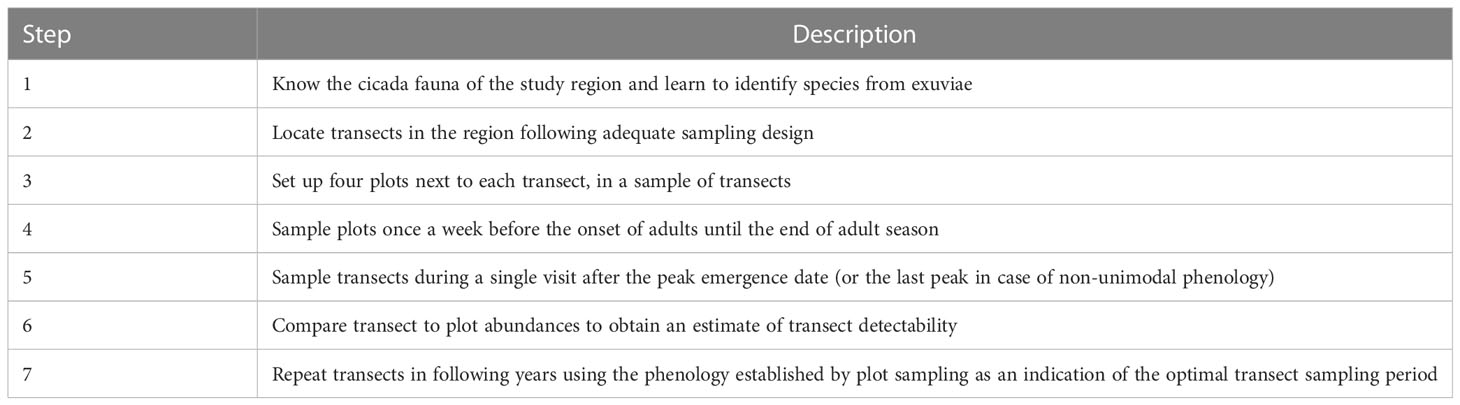
Table 1 Summary of the Cicada-MET protocol.
For transects to be comparable, path characteristics have to be fixed in advance. This includes defining the range of track type, width and embankment occurrence that can be sampled. We avoided paved roads and paved margins since pavements can affect root systems. Embankments are often unsuitable for sampling because of high slopes and absence of cover. It is therefore better to avoid those track sections or to sample from behind the road banks.
Another aspect to consider is the human impact on roadside vegetation that may include clearing of grass and shrub layers, tree thinning, livestock grazing or controlled burning. When these disturbances take place before the start of the emergence season, they have limited effects on counts. However, if any of them takes place during the emergence season, the affected transect should not be counted (or the counts not pooled to the rest) because part of the existing exuviae would be lost.
The usual spatial sampling design choices apply to this method. These include an adequate spatial replication with interspersion of treatments (Hurlbert, 1984), and selecting a limited and well-known range of environmental characteristics for the study sites.
Regarding the temporal design for transect censuses, one visit per year may be sufficient if repeated monitoring of plots has been performed across an emergence season. The selection of sampling dates for plots can rely on expert knowledge of the emergence phenology of the species in the region, on scientific publications, on open biodiversity databases, or on previous fieldwork. Sampling dates for transects should start after the peak of emergence of the focal species and take place for no more than one month, although the extent of the sampling period should depend on local meteorological conditions. The percentage of exuviae fallen from their moult support can therefore be used as an indicator of the effect of rain and wind (but also other potential perturbations) on exuviae persistence (See under 4.3. Loss of exuviae due to weather).
The dates of counts have to be distributed among the different treatments/habitats so that temporal variation related to meteorology affects them equally. In practice, the optimal solution is to cover approximately the same number of transects per treatment or habitat to be compared, each sampling day.
Transects follow paths or tracks along natural or semi-natural vegetation (e.g. forests and tree plantations). Both sides of the path can be sampled by two observers simultaneously, or by the same person on the way out and on the way back. A standard area for transects is 200 m2, with 100 m of length and 1 m of width on each side of the way. Transect width can be checked using a 1-m long stick while walking. We do not recommend sampling more than 1.5 m of width, because the visibility of exuviae rapidly decreases with increasing distance from the observer.
Observers need to be trained in finding exuviae (Appendix A shows the exuviae morphology and length for the five species found in this study) in the vegetation and on the ground, before transects can be done reliably. Observers walk slowly surveying all visible vegetation and ground, with the help of the stick. The walking speed depends on the structure of the low vegetation and the percentage of bare ground, a usual speed is 0.4-0.6 km/h. However, the overall speed to cover a transect is lower, because it diminishes with the number of exuviae found and the number of field variables collected (see under 4.1. Sampling speed in transects). A 200-m2 transect typically needs 30 to 90 minutes to be completed when exuviae are collected and three field variables (GPS position, plant species as support and height of exuviae) are measured. The time needed to complete the count is halved if two observers walk on each side of the path simultaneously.
Identifying cicada species through exuviae depends on coloration, size, and shape of the exuviae structures (Motta, 2003; Lee et al., 2012, Appendix A). As a result, conducting a preliminary study becomes imperative in the absence of species identification keys. While some exuviae can be identified solely at the genus level, such as Cicadetta spp., specific determination is still feasible provided the cicada fauna in the study areas is well-documented. For example, if only one species from the genus is present, or if adults have been collected or their sound recorded near the transect. Moreover, a single exuvia provides a sufficient quantity and quality of DNA for genetic analyses and species identification (Bouwer et al., 2014). Additionally, distinguishing between males and females is feasible by examining the shape of the genitalia in the terminal abdominal segments of the exuvia (Motta, 2003).
It is important to clearly define transect limits. As it is difficult for markings to last for a long time on roadsides, we used a standard GPS device for an approximate location (usual precision +/- 3 to 7 m) of both ends. Then, a wide angular lens was used to take pictures at both extremes of the transect to achieve precise localization (usually +/- 1 m) in subsequent years (the same camera and lens should be used for this aim). Pictures can also be used to follow interannual changes in habitat structure (Figure 1).
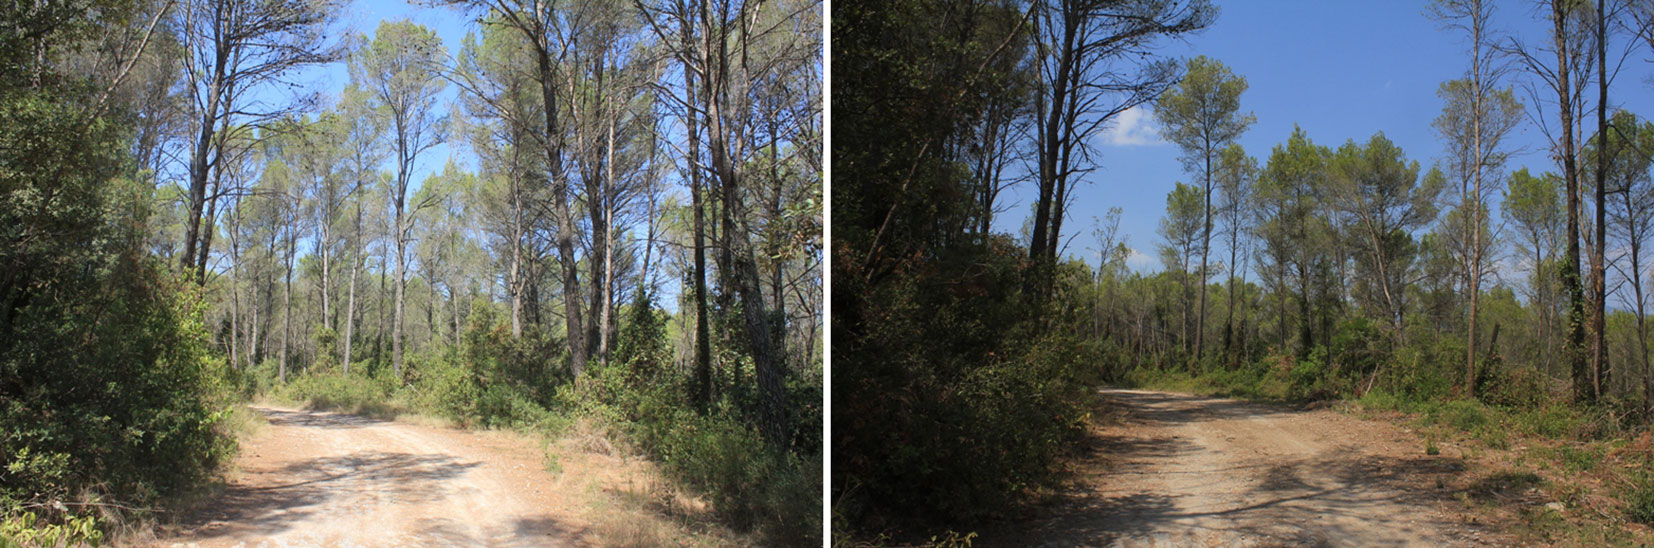
Figure 1 Pictures taken to locate the start of transect LJNC-8 in 2021 (left), and in 2022 (right), before and after pine forest thinning.
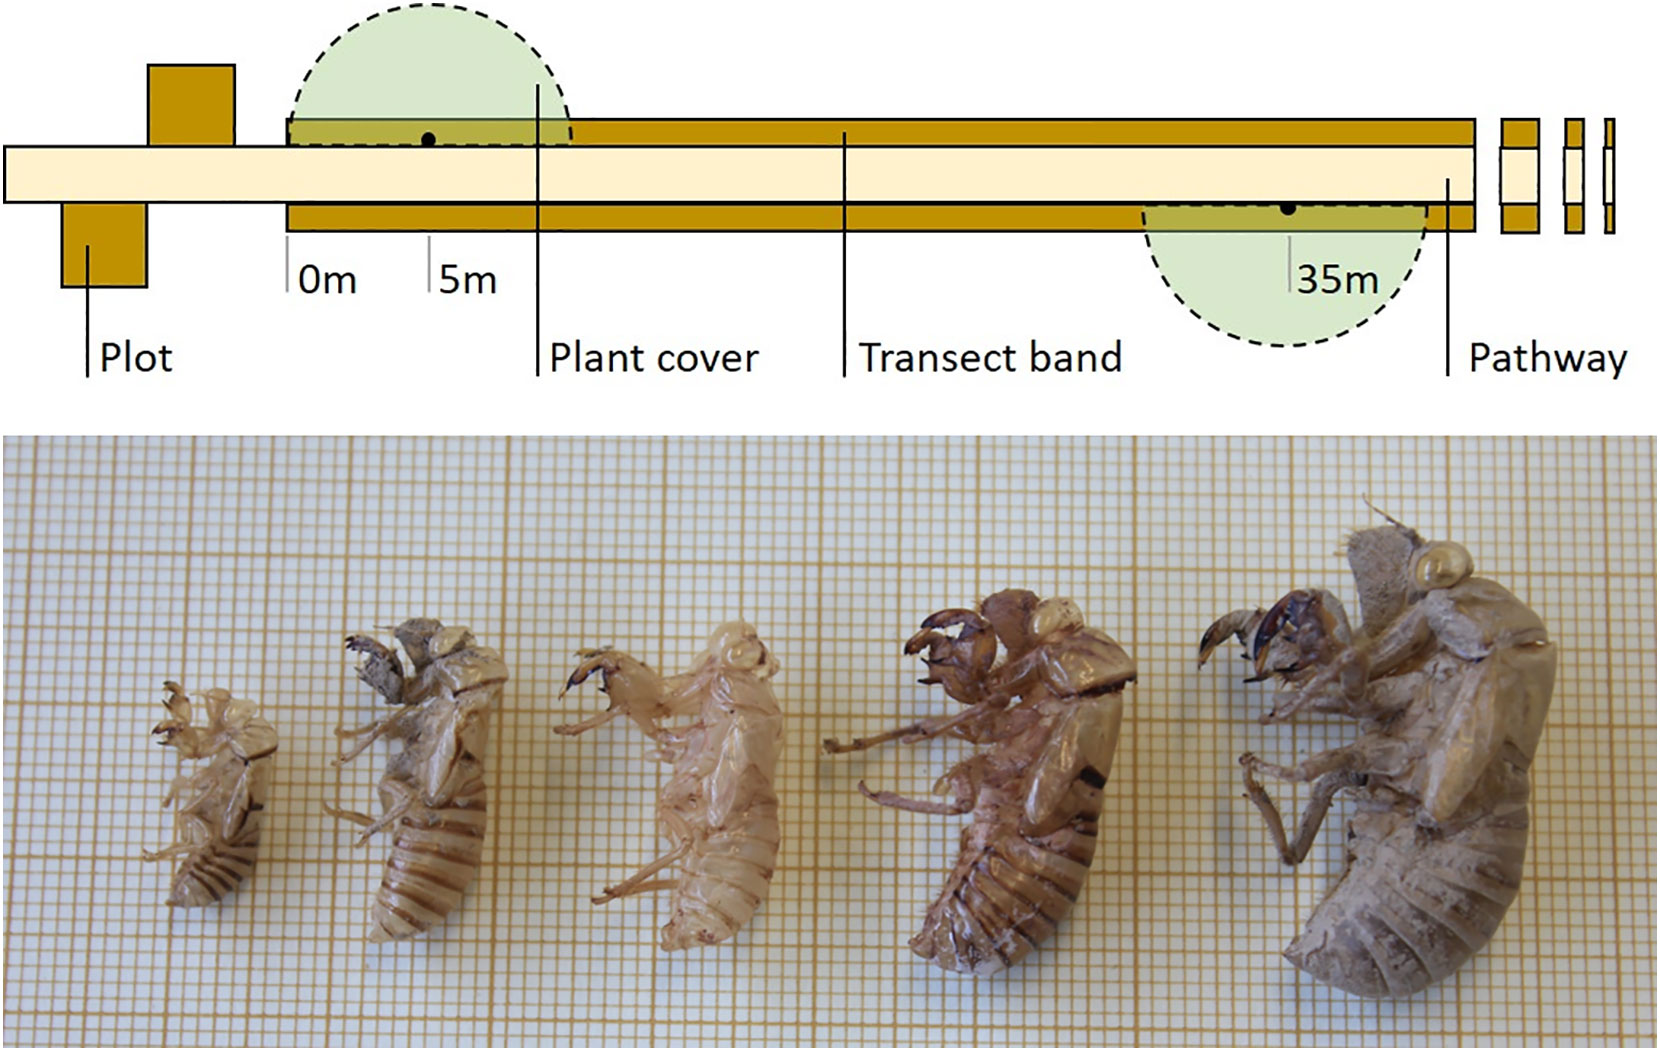
Habitat structure of sampled areas can be visually estimated with the help of reference charts (e.g. Prodon and Lebreton, 1981). We conducted an annual estimation of plant cover at the grass, shrub, subcanopy and canopy layers. To this aim, we sampled four virtual 5-m radius semicircles centred at 5, 35, 65 and 95 m from one end of the transect (Figure 2) a few weeks after each exuviae sampling. If required for the study, more precise (and time-consuming) plant cover sampling using line transects or plots can be performed in sections of the exuviae transect.
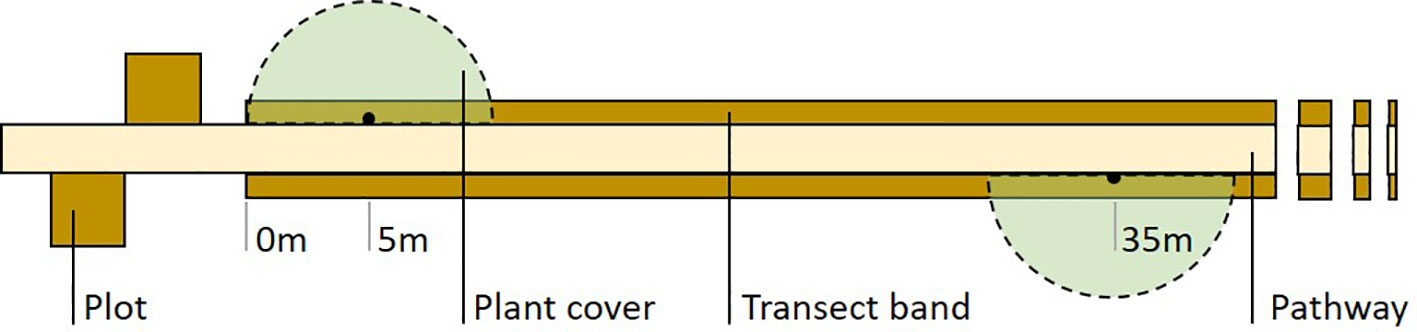
Figure 2 Field design of Cicada-MET for cicada exuviae counts. The method combines a two-band line transect (100 x 2 m) sampled once a year with four square plots (3 x 3 m or 2 x 2 m) sampled once a week throughout the first cicada emergence period of the study (associated to a sample of transects). Four semicircles for plant cover estimation can also be sampled once a year. The figure shows half of the plots and semicircles and 42-m of the transect length.
Plots are used to describe the phenology of focal species in the study region (see under 4.6. Cicada emergence phenology) and determine sampling dates more precisely. They also allow densities of exuviae to be estimated and related with transect counts (see under 4.4. Estimation of absolute densities of exuviae). If cicada emergence phenology in the region is unknown, plot sampling has to be done before the start of transect monitoring. Four plots are located near a sample of transects, two at each end, following the design found in Figure 2 and Appendix B.
For this study we selected 15 transects evenly distributed among three vegetation age classes (one and two years after fire and unburned forests) and a total of 60 plots. Plots were 3 x 3 m squares in sparse vegetation (one and two years after fire) and 2 x 2 m in dense vegetation (>40 year-old forest). Exuviae were carefully searched by two people for four minutes per plot so that virtually all of them were collected. This procedure was repeated every 7 days across the summer, from before the onset of the emergence period until two weeks after the last exuvia was found. In our case, plots were sampled 13 times in 2014, from June 18 to September 11, finding four cicada species, Cicada orni being the dominant one (N= 315 C. orni of a total of 342 exuviae).
The following sections are based on the exploration of a database of 466 transect counts (in 64 different transects) from 2013 to 2022 and 780 plot counts (in 60 plots) in 2014. For transects, the sampling speed (section 4.1), detectability of exuviae (section 4.2), loss of exuviae due to weather (section 4.3), comparison with sound detection (section 4.5) and interannual variation in abundance (section 4.7) were examined. For plots, we estimated absolute densities (section 4.4) and emergence phenology (section 4.6). The sample size that could be used for analyses depended on the available information in each aspect of interest.
We tried to keep walking speed constant among observers, transects and years (around 12-15 minutes to walk 100 m without stops, sampling one side of the path). However, overall sampling speed was also affected by stops to collect exuviae and to measure field variables. In addition, sampling speed could be lower when plant cover was denser if more time was needed to revise potential moult supports. We used linear mixed models (LMM) with Gaussian error structure to analyse the effects of four explanatory variables (number of exuviae found, number of field variables measured, grass cover and shrub cover) on the sampling speed (m/min) of 283 transects. The ‘transect’, nested within ‘burned area’, was included as a random factor in order to control for possible spatial autocorrelation. Details on model selection can be found in Appendix C.
The best averaged model showed that sampling speed was affected by the number of exuviae found and the number of field variables measured, but not by grass and shrub cover (Appendix C). Both selected explanatory variables had a negative effect on speed, as predicted. However, the impact of finding a higher number of exuviae was more marked than the effect of increasing the number of variables measured on-site (Figure 3), probably because the range of the latter was small.
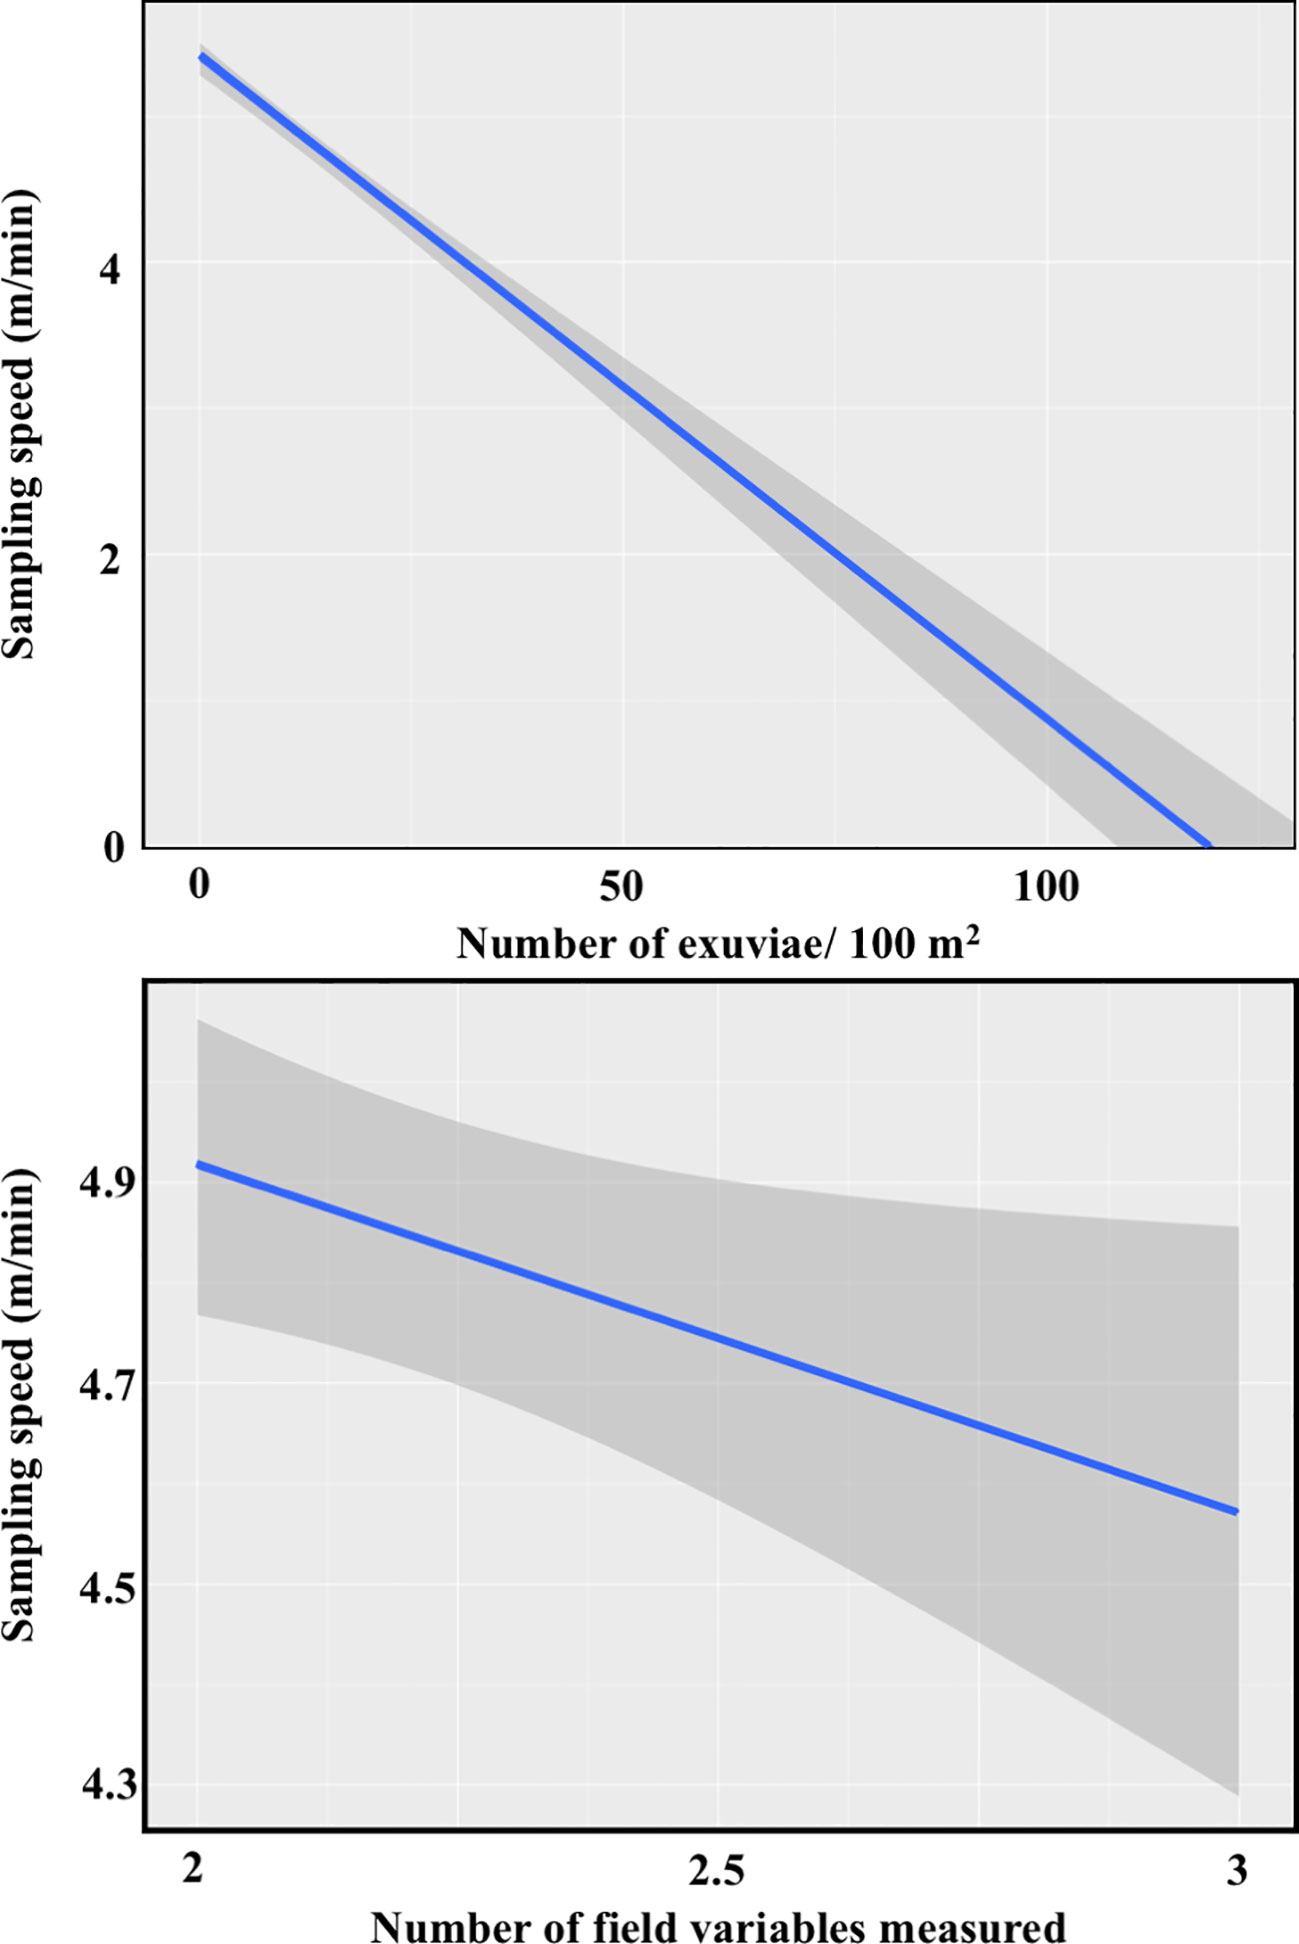
Figure 3 Effects of the number of exuviae found (top) and the number of variables measured in the field (bottom) on the sampling speed of transect (N=283 counts).
A total of 24 transects (12 in burned areas and 12 in unburned areas) were used to assess detectability. They were sampled twice successively and at the same speed, with the second count progressing in the opposite direction to the first one. Exuviae were determined and counted as usual. We found 1,212 exuviae in the first walk of the 24 transects and 328 exuviae in the second. We analysed detectability for the two species with more than 20 records, Cicada orni and Tettigettalna argentata. We assumed that the proportion of undetected exuviae in successive counts (third, fourth…) would be the same as that calculated between the first and second counts. In C. orni, the second count produced 26.4% of the exuviae counted in the first walk (N=1166). For this species, two counts would already produce 93.0% of the total number of existing and visible exuviae. In T. argentata, the second count produced 46.9% of the exuviae counted in the first walk (N=32). For this species, two counts would produce 78.0% of the total number of existing and visible exuviae and four counts would be needed to reach 95.2% (Table 2).
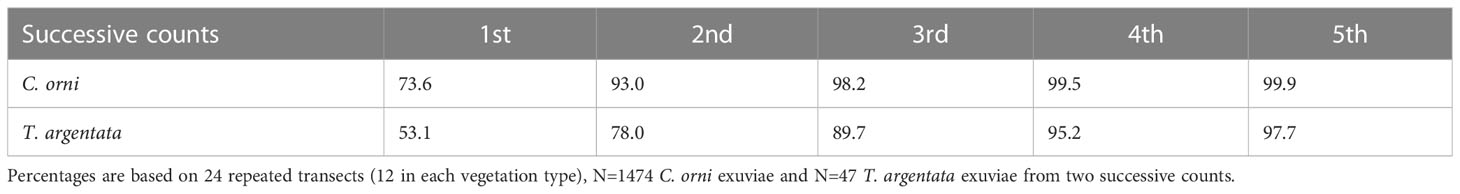
Table 2 Estimated percentage (%) of total visible exuviae detected by first and successive transect counts (cumulated values) for two cicada species (overall results combining burned and unburned areas).
The detectability of C. orni exuviae appeared higher in burned sites than in unburned sites, with an estimated 77.5% vs. 69.2% of exuviae found in the first count, respectively (Appendix D). However, this difference was non-significant (t= -1.553, df= 22, p= 0.135). Exuviae numbers were insufficient to conduct the same burned vs. unburned comparison in T. argentata.
Exuviae fallen to the ground seemed less detectable than exuviae attached to vegetation. We used transects with at least 6 exuviae found at the second count (N=12), to compare the percentage of exuviae on the ground between the first and the second walk of the transect. Although this percentage was on average 13.6% in the first count and 21.2% second count (pointing towards fallen exuviae undetected in the first count because they were less visible), the difference between counts was non-significant (One-factor Anova, F=0.657, p=0.426).
We tested the effect of intense weather conditions on the persistence of exuviae on their supports, because fallen exuviae seemed harder to detect, especially under dense cover, and they were likely to degrade sooner. To this aim, we used 196 transect counts that met two requirements: having a minimum number of 15 exuviae, and having a recorded number of exuviae attached to vegetation or fallen from their support. We collected meteorological data from the closest weather station according to the Catalan Meteorological Service. Stations were located at distances ranging from 1.5 to 13.5 km from selected transects. We used half-hour data (48 periods per day) for the period encompassing from 1st July to the date of each count, for each year of sampling. The response variable analysed was the proportion of fallen exuviae out of the total number. As we hypothesized that exuviae were dragged down by the intensity of meteorological phenomena, we built a model using the maximum rainfall (mm) and the maximum wind speed (m/s) in a half-hour period, as explanatory variables, including also the quadratic term of the wind speed because of its non-linear relationship with the proportion of fallen exuviae. The study area was used as a random factor to account for the spatial correlation of transects.
Both variables were significant in models (Appendix E). The effect of rainfall, which had been intense in a small number of meteorological stations and emergence periods, was positive and clearer than that of the wind (Figure 4). Our model predicted that, in absence of rain, less than 10% of exuviae would have fallen to the ground when the transects were covered, whereas for rainfall exceeding 20 mm in half an hour, half of them would have fallen. Wind had a positive quadratic effect, with no clear effects at low wind intensities and exuviae starting to fall at wind speed above 20 m/s. It is important to note that both wind and rain are usually mild in our study region during the emergence period.
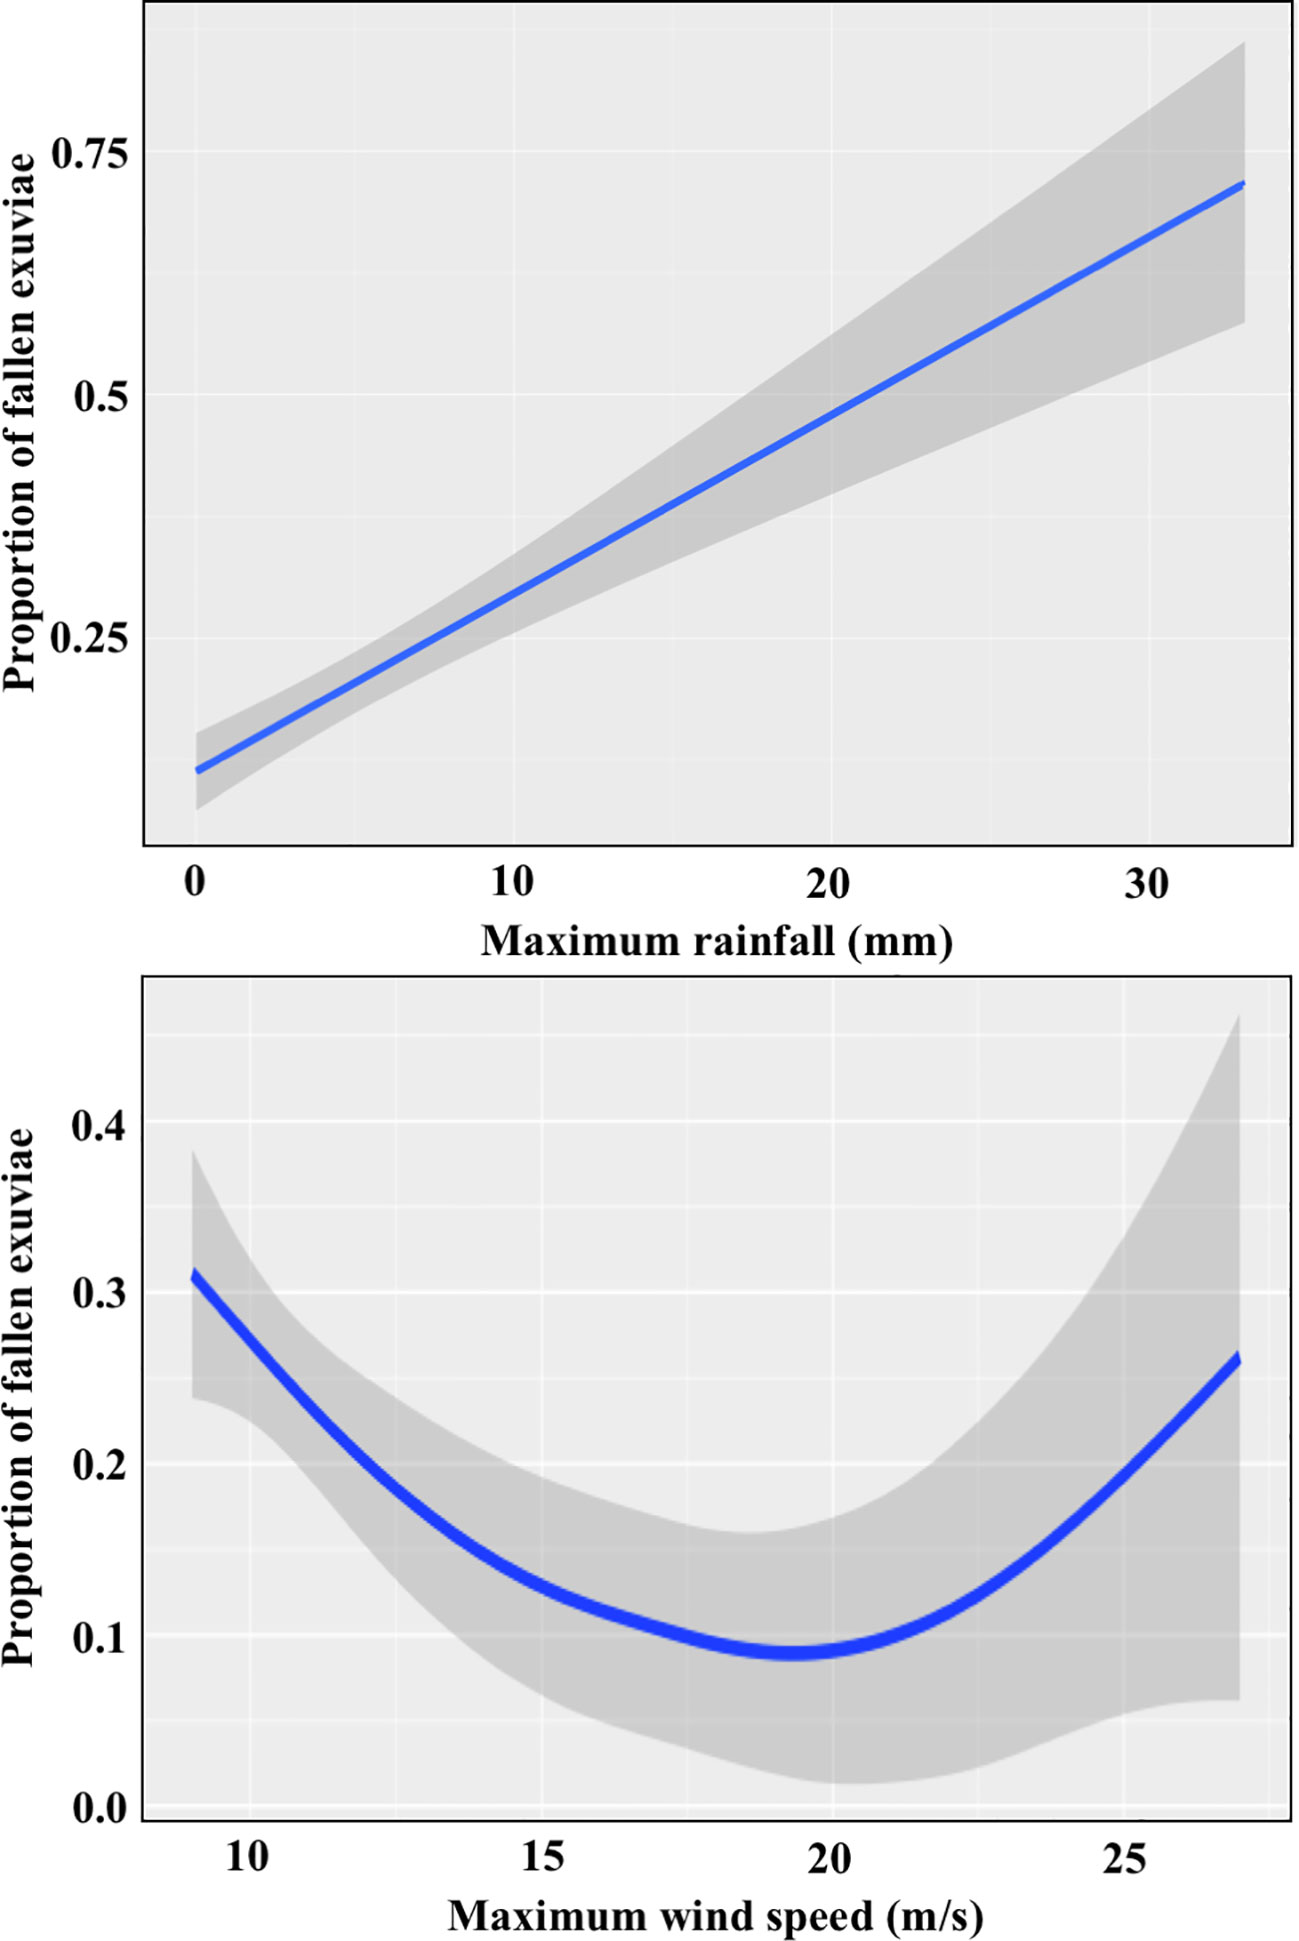
Figure 4 Effect of the maximum rainfall and the maximum wind speed across the emergence period on the proportion of fallen exuviae.
The accumulated counts of exuviae in the study plots throughout the whole emergence period provided a precise estimation of the density of emerging final instar nymphs. In small plots, the proportion of missed exuviae was greatly reduced after a careful search. We found a variable density of exuviae in the three vegetation age classes and between two species, C. orni and T. argentata (Table 3). For both species, the highest density was found one year after fire, reaching a mean density of 121 emerged C. orni nymphs in 100 m2 across one season (N= 20 plots).

Table 3 Absolute densities (mean number of exuviae/100 m2 ± SE) of emerged cicadas obtained from 13 successive counts of 20 4-m2 plots in unburned forest, 20 9-m2 plots in one-year postfire forest and 20 9-m2 plots in two year-postfire forest.
Linear models show that counts in the 15 selected transects were strongly related to both the density of exuviae in nearby plots until the date when the transect was sampled and the density of exuviae in the same plots for the whole emergence period. The equation (y=0.0994x + 0.3226) indicates that the transect counts accounted for 10.3% of the exuviae emerged in plots until the transect sampling date. Similarly, transect counts accounted for 9.9% of the exuviae emerged throughout that season (y=0.0985x + 0.0996) (Figure 5).
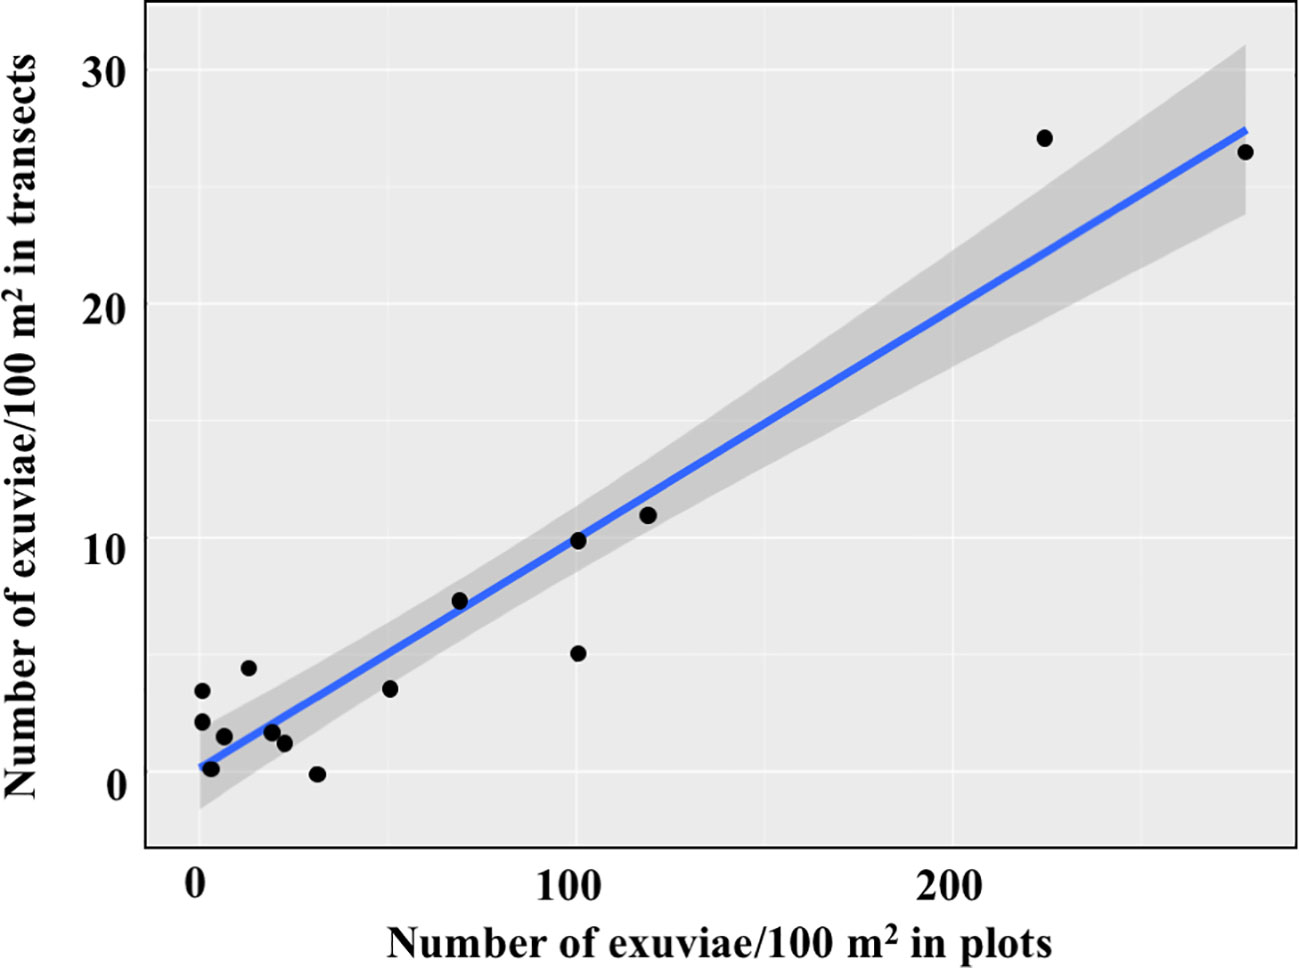
Figure 5 Relationships of transect counts (N=15) with the density of exuviae in four nearby plots sampled throughout the whole emergence period.
The ability of Cicada-MET to record species occurrence can be compared to common methods used for the study of cicada distribution and ecology. Since adult cicadas use sound to communicate, bioacoustics has been a prominent field of study in Cicadidae. From 2014 onwards, we recorded the presence of singing males of cicada species, while walking along the transects. A total of 394 exuviae counts coupled with singing information of five species was available. Aural species determination on-site by trained observers was based on sound recordings and sonograms found in Gogala (2009). Most species were easily distinguished; only Tibicina garricola was recorded and photographed to confirm species identity. Each species could be either undetected, or detected only by exuviae, by sound or by both methods in each transect (Figure 6). We used the paired-samples McNemar test to test for the difference in the frequency of detection exclusively by exuviae or by sound, for each species separately. C. orni was significantly more detected by exuviae (p<0.001). Cicadatra atra (p<0.001) and T. argentata (p<0.05) were significantly more detected by sound. Lyristes plebejus (p=0.32) and Tibicina garricola (p=0.22) showed non-significant differences.
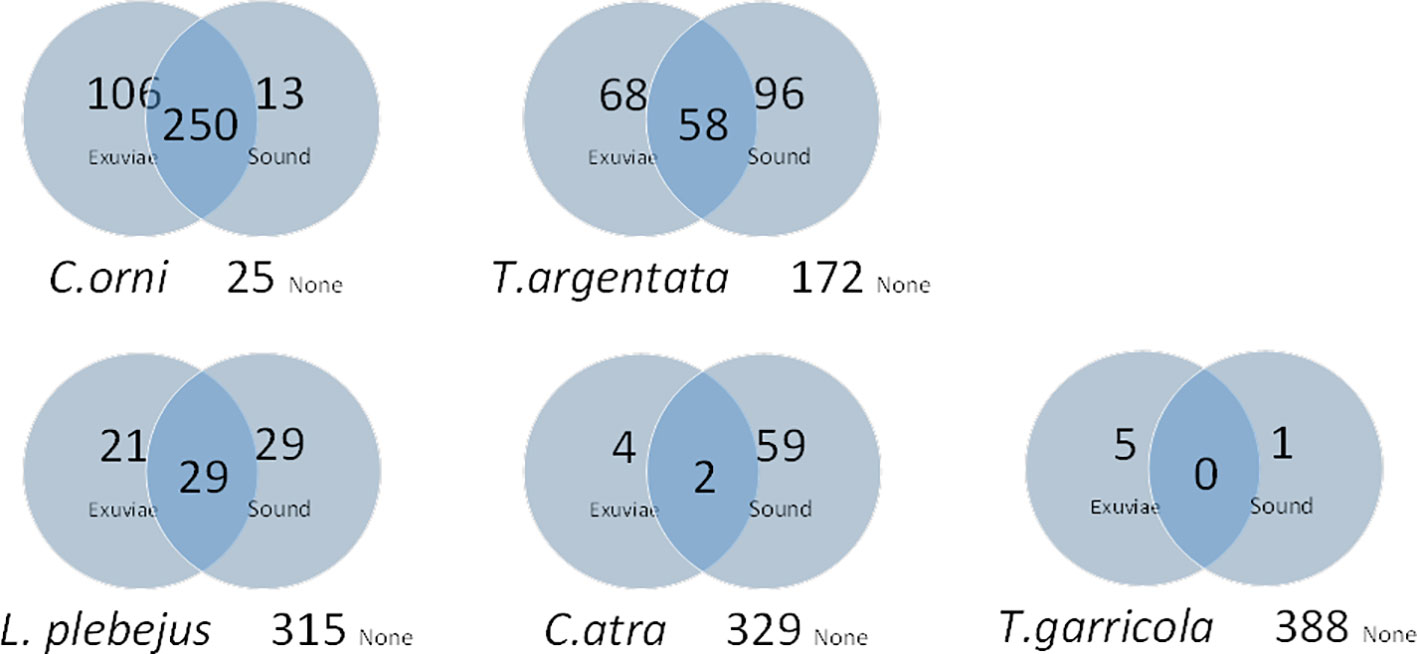
Figure 6 Vehn diagrams showing the number of detections (by exuviae, sound and both methods), of five cicada species during 394 transect counts. None: number of counts without detection of the species.
The consecutive sampling of fixed plots across the emergence season allowed emergence phenology to be studied. To this aim, we used the 60 plots previously described, equally distributed among burned (one and two years after fire) and unburned pine forests. The temporal evolution of density across the 2014 season followed a unimodal pattern in the three vegetation types. However, the corresponding emergence peaks were separated by seven days each. The peak was around July 3 in one-year postfire forest, July 10 in two-year postfire forest, and July 17 in unburned forest (Figure 7). The length of the period with cicada emergences also increased with increasing time since fire, from 5 weeks in one-year postfire forest to 10 weeks in unburned forest.
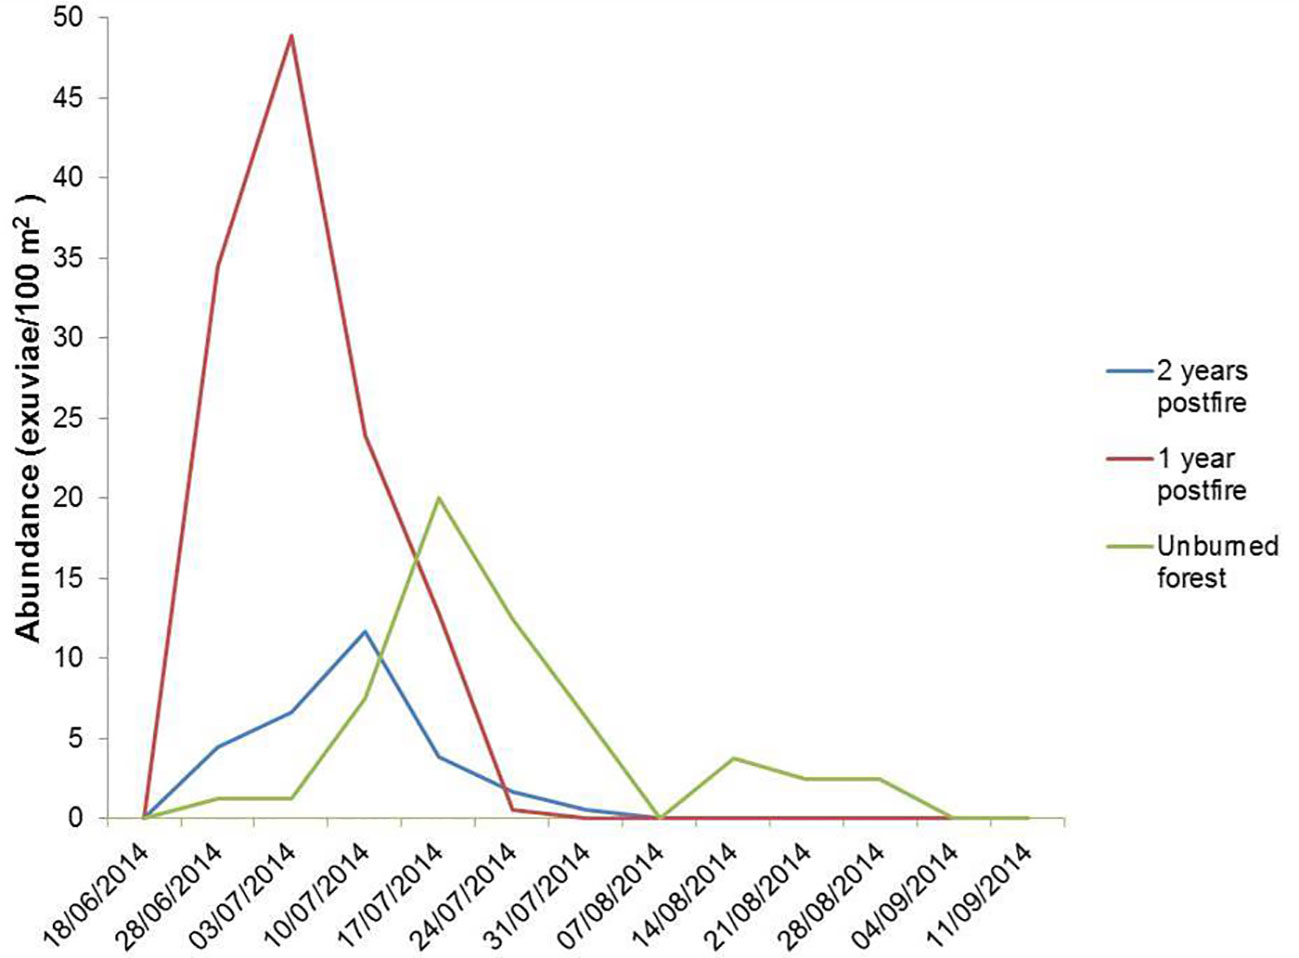
Figure 7 Density of C. orni exuviae found in plots of unburned forest, one-year postfire forest and two-year postfire forest (N=20 plots each) throughout summer 2014. Each date in abscissae represents the previous 7 days of accumulated nymph emergence. To improve graph clarity error bars are not shown.
To determine if there were temporal differences in the number of captures between the three vegetation types, a repeated measures analysis of variance was used (Appendix F). Results showed that both time since fire and calendar date were relevant elements. Moreover, the interaction of both temporal variables indicated that the effect of time since fire on cicada numbers depended on the day on which the measurements were taken. In other words, temporal trends were different among vegetation categories.
Fixed transects repeated yearly allowed monitoring of population trends over longer periods of time. As an example, we used 21 transects distributed in three study areas of unburned Aleppo pine forest in L’Empordà region, sampled between six and ten years (2013-2022). The transects selected were separated by a maximum distance of 31 km, in similar altitudes (40-350 m a.s.l. and distance to the sea (15-26 km), so that climate effects were likely irrelevant. The abundance of emerging Cicada orni in the three study areas was different, especially when comparing more distant La Jonquera to the two closer areas of Colomers and Vilopriu (Figure 8). However, interannual variation was very similar, the only exception being the period 2015-2017, even with a modest number of transects per study area.
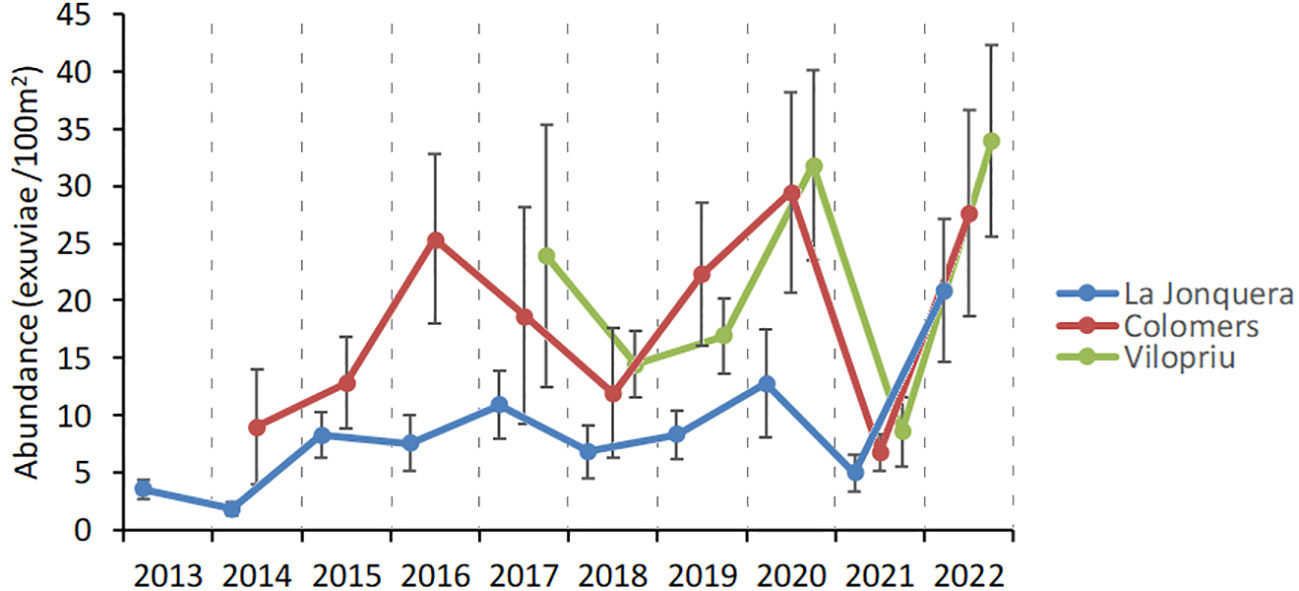
Figure 8 Interannual variation in exuviae abundance of Cicada orni in unburned Aleppo pine forests of l’Empordà region, from 181 counts from 2013 to 2022. Error bars are standard errors. Study areas are La Jonquera (N=10 transects), Colomers (N=5 transects) and Vilopriu (N= 6 transects).
We propose a conceptual diagram to synthesize the factors affecting the number of exuviae recorded during transect sampling and the direction of their influence (Figure 9). Some of these factors have been analysed in the present study. The observer’s skill and speed of progression directly influence the number of exuviae that are found or left behind. Although no data was available to assess observers’ skill in our case, observer differences are a common bias in visual censuses (see, e.g., Bernard et al., 2013). The number of exuviae collected significantly influenced the time needed to cover a transect, because more stops were made. Conversely, walking speed necessarily affects exuviae numbers because higher speed means less time for properly searching vegetation and the ground, although an experimental approach would be needed to describe this relationship. Other drivers of exuviae detectability could have been included but their effects are poorly known. For example, some animals (ants, other insects and small vertebrates) might consume or carry exuviae but, to our knowledge, this has not been described and is unlikely to significantly alter counts (we have never observed this behaviour in our sites).
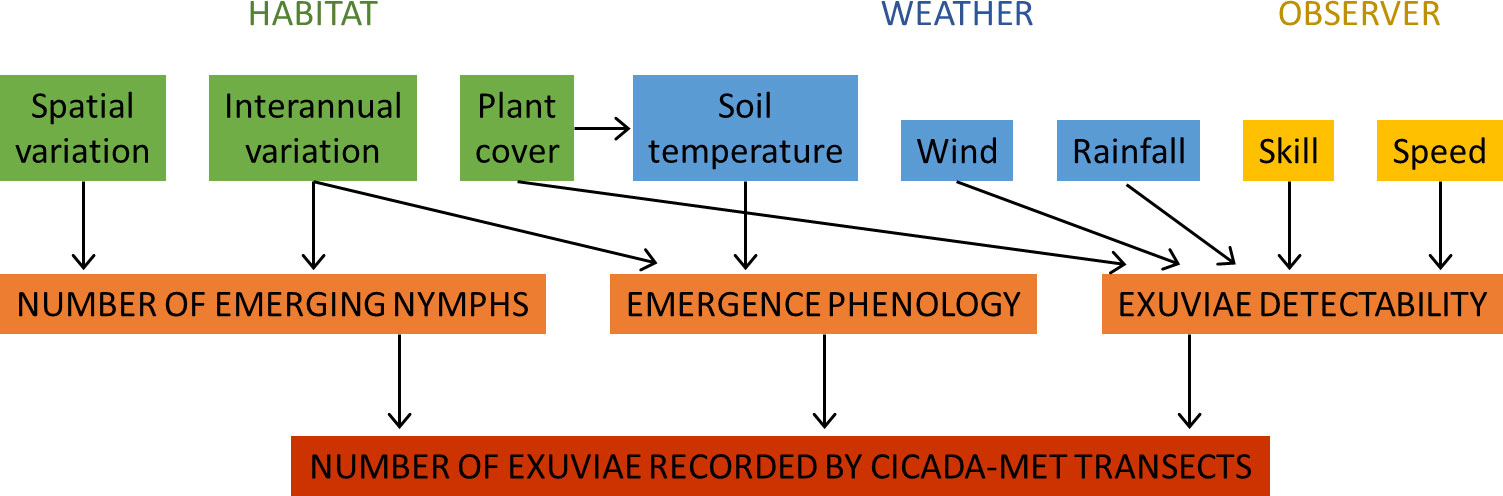
Figure 9 Variables influencing the number of exuviae recorded during Cicada-MET transects, classified into habitat, weather and observer drivers. The eight variables affect (the direction of their effects is shown with arrows) one or two of the processes (emerging nymphs’ quantity, emergence phenology and exuviae detectability) that determine the number of exuviae found.
Weather has several implications on the results of the method. Soil temperature, when reaching around 18°C, is the proximate cue for last instar nymphs of studied species to emerge (Heath, 1968). In warmer pre-emergence periods or sites, the soil is heated since an earlier date, triggering earlier nymph emergence (Smith et al., 2006; Sato and Sato, 2015). Large interannual (and spatial) differences in emergence phenology could entail the sampling date to be sub-optimal. Sampling could then be too early, i.e. before the peak of emergence, detecting few exuviae; or too late, i.e. too many days elapsed since the emergence peak, so that many exuviae have fallen from their support, degraded or disappeared. If this is suspected, repeated plot sampling across the emergence period would be necessary. We have also shown that intense rain and wind increase the number of exuviae fallen from their support. Fallen exuviae can be dragged out of the sampled area or remain on-site in the ground and be found, although they are usually less apparent than when attached to vegetation. Detectability tends to decrease under these circumstances.
Habitat characteristics are important in exuviae counts. Plant cover did not influence observer speed, according to our results. It can, however, affect the detectability of exuviae since attached and fallen exuviae are less visible under high foliage density (pers. obs.). The shadow produced by plant cover also limits solar radiation and therefore soil temperature (Smith et al., 2006), with the consequences on emergence phenology discussed above. Interannual differences in host plant productivity or quality can also entail more or fewer nymphs being ready for emergence each year (Karban, 2022). Finally, spatial and temporal variations in habitat quality, predation, parasitism and competition influence the density of cicada species at each location and year.
In sum, the number of exuviae recorded in transects is not only determined by the number of emerging nymphs at each site and time. Multiple factors affecting the timing of emergence and the detectability of exuviae also influence the counts generated. This will be discussed in more detail in the next section.
Our results show that Cicada-MET is an effective and efficient method to count emerged cicadas in natural and semi-natural habitats. The amount of data obtained per time invested is high. In our study areas, we obtained an average of 24.9 exuviae (all species combined) per hour of transect (N= 350 counts, randomly selected, therefore including zero counts), while simultaneously measuring field variables related to location, habitat and moult support. Eight to twelve transect counts can be done per day by two observers working together, with adequate light conditions and avoiding the hottest hours of the day. Likewise, it is possible for two people to count 60 nearby plots in one day. The method needs minimal and non-expensive material and can therefore be used when research funds are scarce.
Sampling plots along the whole emergence period provide absolute densities of emerged cicadas. Our results show that they are very highly correlated to single transect counts, making it possible to estimate cicada densities from transects with measurable error. We estimated that transects capture about 10% of the total number of emerged nymphs in surveyed areas. Cicada-MET can therefore be used in ecological studies for which knowing absolute numbers of individuals or biomass of cicadas is necessary, for example, for understanding nutrient pools, trophic networks or biotic communities (Yang and Gratton, 2014).
The density of cicada nymphs along paths and tracks may be different to that of other parts of the habitat. This could result from females preferring sunnier locations in forest edges to oviposit (Yang, 2006), where trees grow more rapidly and attain greater root biomass (McDonald and Urban, 2004). Nymphs can also grow heavier and adult females be more fertile, in these areas, as indicated by slight differences in a 17-year life cycle species (Karban, 2014). On the other hand, the lack of vegetation on the track reduces oviposition rates in the transect or plot vicinity. Caution is therefore needed to infer mean densities for larger areas. A way to overcome this limitation can be to sample fixed plots at increasing distances from the path and compare the differences in exuviae abundance between them.
The method assumes that none or insignificant numbers of exuviae can remain from one year to the next (Moriyama and Numata, 2015, pers. obs.). If there are reasons to think that some proportion of exuviae can last on-site for one year, it would be necessary to remove them from transects and plots before the start of the emergence period.
The method should be adapted to study habitats holding the extremely high-density species that occur among cicadas (Karban, 1982). This can be achieved by reducing the area sampled, the number of variables measured, and/or by collecting only a sample of the exuviae found. If the study deals with periodical cicadas, in addition to these modifications, sampling has to be adapted to match the temporal and spatial occurrence of 13-year and 17-year species.
The standardised nature of Cicada-MET, a protocol that records precise location, area and transect speed, reduces the bias between sites that have been pointed out in former methods (Moriyama and Numata, 2015). The estimation of species detectability using repeated transects can allow interspecific comparisons in relative abundance of emerging cicadas. Additionally, the measurement of population densities with fixed plots makes such comparisons more robust. When possible, it is worth taking weather, observer differences and walking speed into account in models of exuviae abundance. Even if it is not, the results are highly consistent (see sections 3.2, 3.4, 3.5 and 3.7). To cope with emergence phenology variations in the longer term due to environmental change, plot counts across the emergence season could be repeated every 5 to 10 years.
Cicada-MET performs well when compared to auditory detection (presence/absence) of cicada species. Cicada orni, a loud species that can be heard from hundreds of meters away, was detected more frequently by exuviae than by hearing in our transects. To avoid the hottest hours of the day, transect sampling started at sunrise, when cicadas have not usually started to sing because of cooler temperatures. This can explain the better performance of exuviae detection, but is also a benefit for fieldwork in hot regions where sampling during the peak cicada song period can be a challenge. For other species, we obtained similar or more auditory detections. In Cicadatra atra, we recorded few individuals by exuviae counts because the pine forests surveyed are not a preferred habitat, whereas we could hear their song from nearby broadleaf trees. Nonetheless, the association between exuviae numbers and the abundance of recently emerged imagos is direct. In contrast, estimating animal densities from sound recording, albeit a promising field of study, needs expensive material and important data storage and processing capacity (Darras et al., 2019; Pérez-Granados and Traba, 2021).
Our results confirm the advance on peak emergence date in burned vegetation compared to unburned vegetation, which has also been found in riparian forests of North America (Smith et al., 2006). That study found earlier dates and shorter periods of emergence in burned forests related to mean soil temperature, being lower in sites with higher tree cover. Cicada-MET provides a fine-resolution description of phenology based on replicated plots. We specifically found a one-week delay on the peak emergence date between the first and second year after fire and between second-year vegetation and unburned forests. Our study therefore demonstrates that wildfire can have significant impacts on cicada emergence phenology, and highlights the importance of understanding how natural disturbances (Viljur et al., 2022) affect the timing and duration of population processes. Further research is needed to fully understand the ecological implications of advanced cicada emergence and how it may impact cicada mortality and reproduction as well as the derived interactions in ecosystems.
The similarity we found in interannual abundance trends between nearby study areas is remarkable (Figure 8). As discussed above, this finding supports the consistency of the method. Transects are effective in capturing population numbers while biases and errors do not produce important random differences in temporal patterns between areas. The pattern found also leads us to assume that factors governing the quantity of emerging cicadas operate evenly at a landscape scale in the study region. Interannual climate variability seems to be the main factor here, because it affects plant productivity, disturbance regime, species interactions, cicada reproduction, and survival and length of the nymphal phase (Boulard, 1965; Williams and Simon, 1995), therefore modulating cicada numbers. On the other hand, poor nutrition (xylem fluid exclusively) and intrinsic biological traits also determine the length of the nymphal phase (Karban, 2022). Altogether, it appears that some interannual spatial synchronicity is possible in common species such as Cicada orni. In its extreme form, emergence synchronicity occurs in periodical cicadas, which include seven species in North America, one in India and one in Fiji (Simon et al., 2022).
C. orni was the most abundant species in all study areas and years. When considering fixed plots, C. orni mean densities were higher in recently burned (121 emerged nymphs/100 m2) than in unburned Aleppo pine forests (29 emerged nymphs/100 m2), across the emergence season. When considering the 466 transect counts, only 9.4% of them did not detect the species whereas the mean count was 11.7 exuviae/100 m2. Although this figure corresponds to pine forest located along paths, which could hold denser nymph populations than more shadowed areas, it is within the range of former counts on transects located outside paths (Pons, 2015). The maximum recorded count in our transects was 191 exuviae/100 m2, corresponding to an absolute density of 1,926 +/- 331 emerged nymphs/100 m2 across the whole season, according to our plot-transect model. This is a considerable density, but still comparable to former estimations. Patterson et al. (1997) estimated densities between 712 and 1,117 of belowground C. orni final instar nymphs/100 m2 in Italian pine forests (most of them emerging that year, according to their counts of emergence holes and exuviae). These numbers are, however, far from the densities found for periodical cicadas in North America, which can reach locally 57,900 emerged nymphs/100 m2 (Karban, 2014).
Cicada-MET can obtain a large number of replicates and be used in a variety of ecological studies. This is facilitated because counting cicada exuviae can be easily combined with collecting diverse variables of interest. Measurements can be done on-site while sampling the transects or plots. They can be focused on exuviae (Table 4A), such as determining taxonomic identity, abundance, location, type and use of moulting support; or consider their fine-scale environment, including the lithology, topography, meteorology, and habitat composition, structure and function. Environmental data at a coarser scale can be obtained from Geographical Information Systems, remote sensing databases and UAV sensors (Table 4B). Due to the low mobility of nymphs, both belowground and once emerged heading to a moulting support (Oberdörster and Grant, 2006; Karban, 2014), the measurements in exuviae locations allow testing spatial hypotheses about oviposition and nymph occurrence sites (Bergh et al., 2022). The coupling of environmental and biological variables thus obtained increases the value of cicadas as soil and vegetation indicators.
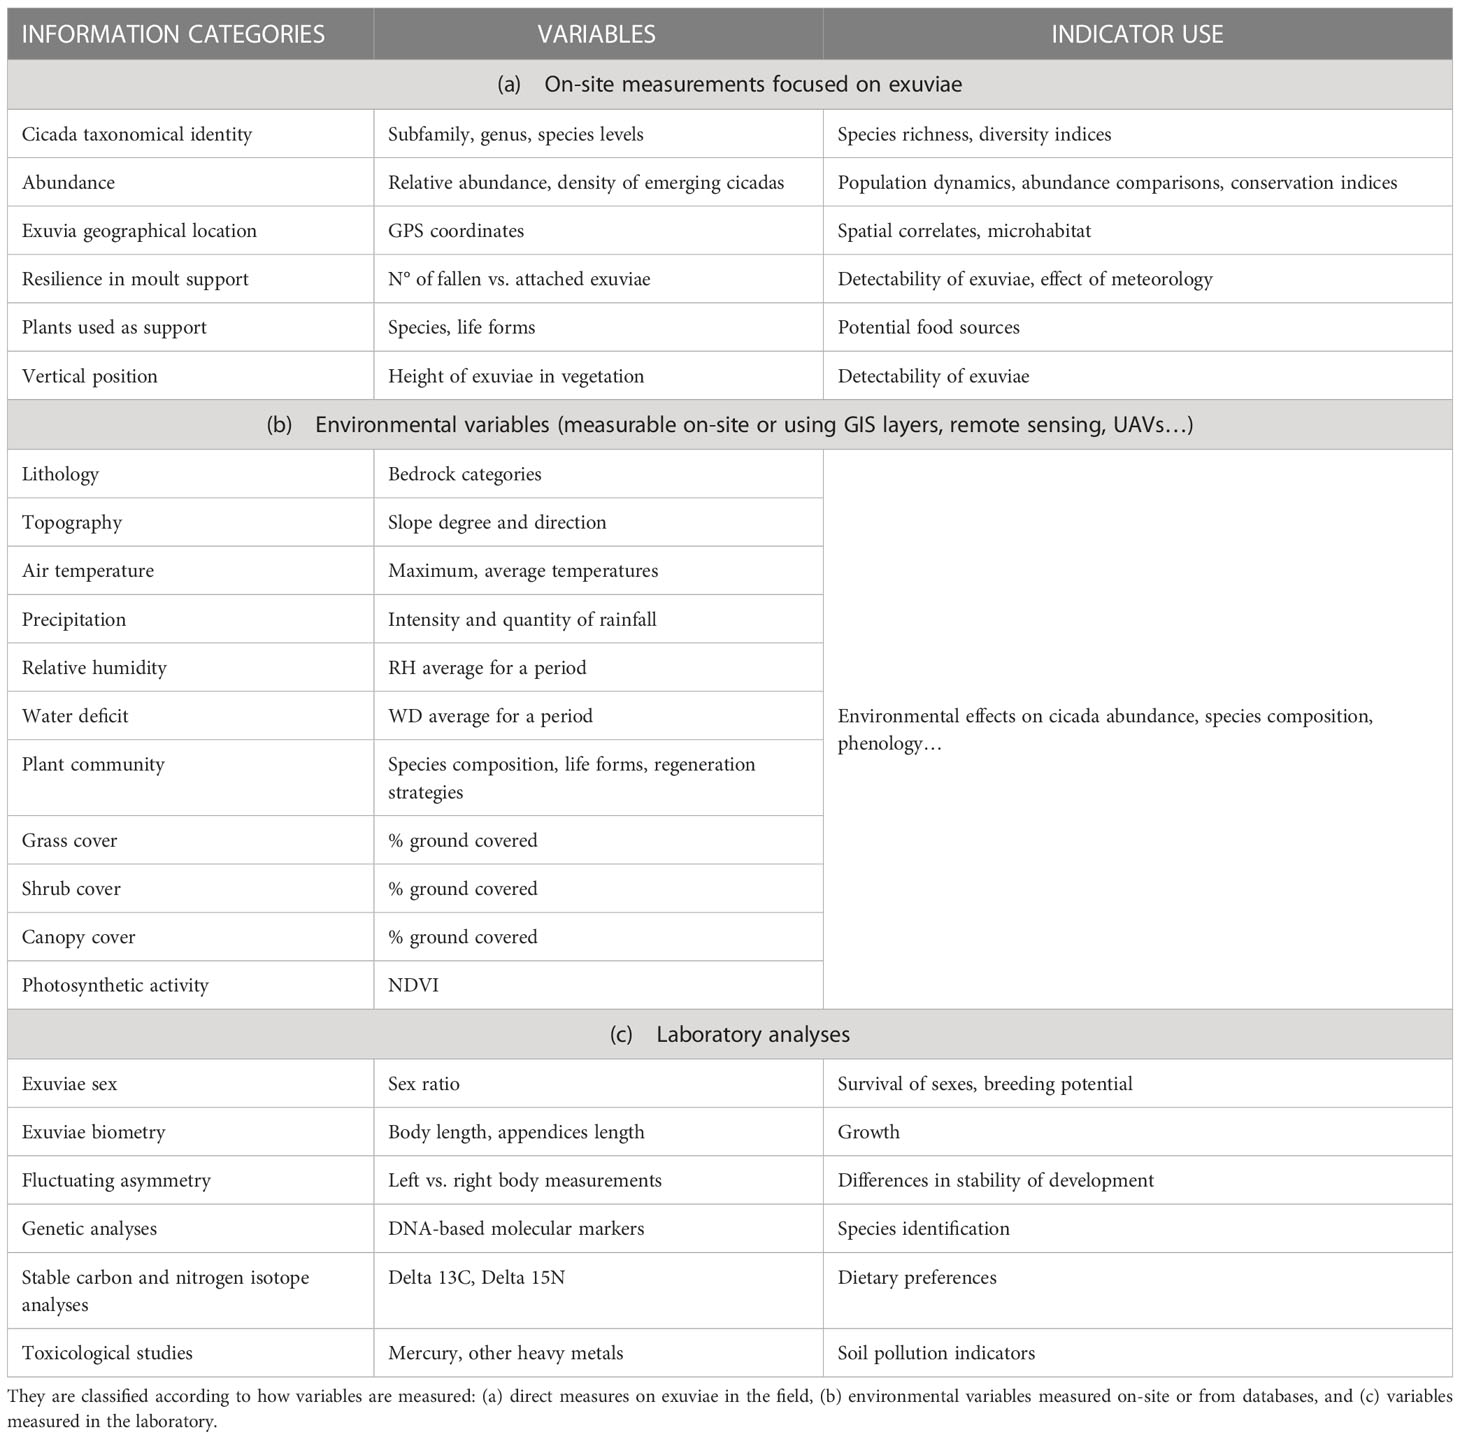
Table 4 Possible variables that can be incorporated to Cicada-MET studies and the ecological indicators that can be derived.
Other research questions can benefit from the collection of exuviae in transects and plots of known location (Table 4C). Stored exuviae can last for long periods without degradation, more than one decade in absence of preservative (own collection at Univ. of Girona), and more than one century in museum collections with preservative (Cicada orni exuviae coded 75-8984, dated 1900 at the Natural Sciences Museum of Barcelona). Preserved exuviae can be used to determine sex ratios, to do biometric studies, or for genetic, isotopic or ecotoxicological studies. Their analyses can indicate population structure, dietary changes, root and soil health, etc. (Zheng et al., 2010; Lee et al., 2012; Bouwer et al., 2014).
Depending on the temporal and spatial arrangement of transects, Cicada-MET can be used at different scales going from intensive studies focused on habitats or study sites, to large-scale monitoring programs. The method is well suited for Before-After-Control-Impact studies (BACI) because it allows adequate replication in space and across time (Stewart-Oaten et al., 1986). It is also usable in ‘opportunistic’ studies after ecological disturbances in terrestrial ecosystems, including wildfires, wind blows, biological invasions, tree mortality due to insect explosions, or water stress. For this type of studies, the simplicity of the method facilitates an immediate start after the disturbance, and also a long-term approach (e.g. Figure 8), which is fundamental for population biology studies (Reinke et al., 2019).
Population densities derived from standardized counts of exuviae can be relevant for conservation purposes, as illustrated by dragonfly studies (Khelifa et al., 2018). Since cicadas are sensitive to changes in habitat quality and environmental condition, Cicada-MET data on species composition and abundance can produce informative ecological indicators (Table 4). Changes in environmental conditions affect the timing and success of emergence (Smith et al., 2006) as cicadas are highly dependent on their host plants and the overall health of the soil. Emerged numbers over long periods can therefore serve as an indicator of changes in habitat quality and ecological integrity (Karban, 2014). Monitoring cicada populations and their emergence patterns therefore provides evidence to help act upon ecological conditions and long-term trends of terrestrial ecosystems.
The raw data supporting the conclusions of this article will be made available by the authors, without undue reservation.
The manuscript presents research on animals that do not require ethical approval for their study.
PP: conceptualization, methodology, validation, formal analysis, investigation, data curation, visualization, writing- original draft. RP-G: formal analysis, visualization, writing- review & editing. CT: investigation, data curation, writing- review & editing. AP: investigation, data curation, writing- review & editing. JB: methodology, validation, investigation, writing- review & editing. All authors contributed to the article and approved the submitted version.
The study was partially supported by grant CGL2014-54094-R of the Spanish Ministry of Economy and Competitiveness.
Thanks are due to Gemma Banchs, Aitor Domingo and Gemma Vila for help during the fieldwork of this study. Marçal Pons and Elena Puigdemasa helped with figures, Berta Caballero provided museum data and Diane Harper revised the English. Meteorological data were provided by Servei Meteorològic de Catalunya.
The authors declare that the research was conducted in the absence of any commercial or financial relationships that could be construed as a potential conflict of interest.
All claims expressed in this article are solely those of the authors and do not necessarily represent those of their affiliated organizations, or those of the publisher, the editors and the reviewers. Any product that may be evaluated in this article, or claim that may be made by its manufacturer, is not guaranteed or endorsed by the publisher.
The Supplementary Material for this article can be found online at: https://www.frontiersin.org/articles/10.3389/fevo.2023.1219636/full#supplementary-material
Andersen D. C. (1994). Are cicadas (Diceroprocta apache) both a “keystone” and a “critical-link” species in lower Colorado River riparian communities? Southwest. Nat. 39, 26–33. doi: 10.2307/3672188
Arguel L., Denis A. S., Danflous S., Gouix N., Santoul F., Buisson L., et al. (2022). Detection and monitoring of riverine dragonfly of community interest (Insecta: Odonata): proposal for a standardised protocol based on exuviae collection. Diversity 14, 728. doi: 10.3390/d14090728
Bergh J. C., Nita M., Dyer J. E., Brandt S. N., Cullum J. P., Nixon L. J., et al. (2022). Spatial distribution of 17-year periodical cicada (Hemiptera: Cicadidae) exuviae and oviposition injury in Mid-Atlantic, USA apple orchards and implications for management. Crop Prot. 162, 106095. doi: 10.1016/j.cropro.2022.106095
Bernard A. T. F., Götz A., Kerwath S. E., Wilke C. G. (2013). Observer bias and detection probability in underwater visual census of fish assemblages measured with independent double-observers. J. Exp. Mar. Biol. Ecol. 443, 75–84. doi: 10.1016/j.jembe.2013.02.039
Boulard M. (1965). Notes sur la biologie larvaire des cigales (Hom. Cicadidae). Ann. Soc Entomol. Fr. 1, 503–521.
Boulard M., Mondon B. (1995). Vies et mémoires de cigales (Barbentane, France: Editions de l’Equinoxe).
Bouwer N., Midgley J. M., Timm A. E., Villet M. H. (2014). Successful identification of the final instar nymph of Quintilia carinata (Thunberg) (Hemiptera: Cicadidae) by DNA extraction from the exuvium. J. Nat. Hist. 48, 937–943. doi: 10.1080/00222933.2013.836759
Bried J. T., D’Amico F., Samways M. J. (2012). A Critique of the dragonfly delusion hypothesis: why sampling exuviae does not avoid bias. Insect Conserv. Divers. 5, 398–402. doi: 10.1111/j.1752-4598.2011.00171.x
Callaham M. A., Whiles M. R., Meyer C. K., Brock B. L., Charlton R. E. (2000). Feeding ecology and emergence production of annual cicadas (Homoptera: Cicadidae) in tallgrass prairie. Oecologia 123, 535–542. doi: 10.1007/s004420000335
Chapman R. F. (2012). The Insects: Structure and Function. 5 edition (Cambridge, UK: Cambridge University Press).
Darras K., Batáry P., Furnas B. J., Grass I., Mulyani Y. A., Tscharntke T. (2019). Autonomous sound recording outperforms human observation for sampling birds: a systematic map and user guide. Ecol. Appl. 29, e01954. doi: 10.1002/eap.1954
Dolný A., Harabiš F., Mižičová H. (2014). Home range, movement, and distribution patterns of the threatened dragonfly Sympetrum depressiusculum (Odonata: Libellulidae): A thousand times greater territory to protect? PloS One 9, e100408. doi: 10.1371/journal.pone.0100408
Dolný A., Šigutová H., Ožana S., Choleva L. (2018). How difficult is it to reintroduce a dragonfly? Fifteen years monitoring Leucorrhinia dubia at the receiving site. Biol. Conserv. 218, 110–117. doi: 10.1016/j.biocon.2017.12.011
Gogala M. (2009) Songs of European singing cicadas. Available at: http://www.cicadasong.eu (Accessed 2023-03-30).
Hardersen S., Corezzola S., Gheza G., Dell’Otto A., La Porta G. (2017). Sampling and comparing odonate assemblages by means of exuviae: statistical and methodological aspects. J. Insect Conserv. 21, 207–218. doi: 10.1007/s10841-017-9969-z
Hart P. J., Hall R., Ray W., Beck A., Zook J. (2015). Cicadas impact bird communication in a noisy tropical rainforest. Behav. Ecol. 26, 839–842. doi: 10.1093/beheco/arv018
Heath J. E. (1968). Thermal synchronization of emergence in periodical “17-year” cicadas (Homoptera, Cicadidae, Magicicada). Am. Midl. Nat. 80, 440–448. doi: 10.2307/2423537
Hou Z., Liu Y., Wei C. (2018). Influence of construction and demolition waste on fitness and community structure of cicada nymphs: New bioindicators of soil pollution. PloS One 13, e0203744. doi: 10.1371/journal.pone.0203744
Hurlbert S. H. (1984). Pseudoreplication and the design of ecological field experiments. Ecol. Monogr. 54, 187–211. doi: 10.2307/1942661
Karban R. (1980). Periodical cicada nymphs impose periodical oak tree wood accumulation. Nature 287, 326–327. doi: 10.1038/287326a0
Karban R. (1982). Increased reproductive success at high densities and predator satiation for periodical cicadas. Ecology 63, 321–328. doi: 10.2307/1938949
Karban R. (2014). Transient habitats limit development time for periodical cicadas. Ecology 95, 3–8. doi: 10.1890/13-1518.1
Karban R. (2022). Why cicadas (Hemiptera: Cicadidae) develop so slowly. Biol. J. Linn. Soc 135, 291–298. doi: 10.1093/biolinnean/blab152
Khelifa R., Zebsa R., Amari H., Mellal M. K., Zouaimia A., Bensouilah S., et al. (2018). The hand of man first then Santa Rosalia’s blessing: a critical examination of the supposed criticism by Samraoui, (2017). J. Insect Conserv. 22, 351–361. doi: 10.1007/s10841-018-0045-0
Kim T. E., Oh S.-Y., Chang E., Jang Y. (2014). Host availability hypothesis: complex interactions with abiotic factors and predators may best explain population densities of cicada species. Anim. Cells Syst. 18, 143–153. doi: 10.1080/19768354.2014.906501
Koenig W. D., Liebhold A. M. (2005). Effects of periodical cicada emergences on abundance and synchrony of avian populations. Ecology 86, 1873–1882. doi: 10.1890/04-1175
Lee Y. F., Lin Y. H., Wu S. H. (2010). Spatiotemporal variation in cicada diversity and distribution, and tree use by exuviating nymphs, in East Asian tropical reef-karst forests and forestry plantations. Ann. Entomol. Soc Am. 103, 216–226. doi: 10.1603/AN09100
Lee H. Y., Oh S. Y., Jang Y. (2012). Morphometrics of the final instar exuviae of five cicada species occurring in urban areas of central Korea. J. Asia-Pac. Entomol. 15, 627–630. doi: 10.1016/j.aspen.2012.07.004
Liu Y., Yang Z., Zhang G., Yu Q., Wei C. (2018). Cicada parasitic moths from China (Lepidoptera: Epipyropidae): morphology, identity, biology, and biogeography. Syst. Biodivers. 16, 417–427. doi: 10.1080/14772000.2018.1431319
Logan D. P., Connolly P. G. (2005). Cicadas from kiwifruit orchards in New Zealand and identification of their final instar exuviae (Cicadidae: Homoptera). N. Z. Entomol. 28, 33–44. doi: 10.1080/00779962.2005.9722684
Maier C. T. (2015). Habitat and estimated density of Magicicada septendecula (Hemiptera: Cicadidae), a 17-year periodical cicada newly discovered in Connecticut, United States of America. Can. Entomol. 147, 51–58. doi: 10.4039/tce.2014.40
Marshall D. C., Moulds M., Hill K. B. R., Price B. W., Wade E. J., Owen C. L., et al. (2018). A molecular phylogeny of the cicadas (Hemiptera: Cicadidae) with a review of tribe and subfamily classification. Zootaxa 4424, 1–64. doi: 10.11646/zootaxa.4424.1.1
McDonald R. I., Urban D. L. (2004). Forest edges and tree growth rates in the North Carolina piedmont. Ecology 85, 2258–2266. doi: 10.1890/03-0313
Moriyama M., Numata H. (2015). Urban soil compaction reduces cicada diversity. Zool. Lett. 1, 19. doi: 10.1186/s40851-015-0022-3
Motta P. C. (2003). Cicadas (Hemiptera, Auchenorrhyncha, Cicadidae) from Brasília (Brazil): exuviae of the last instar with key of the species. Rev. Bras. Zool. 20, 19–22. doi: 10.1590/S0101-81752003000100005
Oberdörster U., Grant P. R. (2006). Predicting emergence, chorusing, and oviposition of periodical cicadas. Ecology 87, 409–418. doi: 10.1890/05-0547
Patterson I. J., Massei G., Genov P. (1997). The density of cicadas Cicada orni in Mediterranean coastal habitats. Ital. J. Zool. 64, 141–146. doi: 10.1080/11250009709356187
Pérez-Granados C., Traba J. (2021). Estimating bird density using passive acoustic monitoring: a review of methods and suggestions for further research. Ibis 163, 765–783. doi: 10.1111/ibi.12944
Pons P. (2015). Delayed effects of fire and logging on cicada nymph abundance. J. Insect Conserv. 19, 601–606. doi: 10.1007/s10841-015-9781-6
Pons P. (2020). True cicadas (Cicadidae) as prey for the birds of the Western Palearctic: a review. Avian Res. 11, 14. doi: 10.1186/s40657-020-00200-1
Prodon R., Lebreton J.-D. (1981). Breeding avifauna of a Mediterranean succession: the holm oak and cork oak series in the eastern Pyrenees, 1. Analysis and modelling of the structure gradient. Oikos 37, 21–38. doi: 10.2307/3544069
Raebel E. M., Merckx T., Riordan P., Macdonald D. W., Thompson D. J. (2010). The dragonfly delusion: why it is essential to sample exuviae to avoid biased surveys. J. Insect Conserv. 14, 523–533. doi: 10.1007/s10841-010-9281-7
Reinke B. A., Miller D. A. W., Janzen F. J. (2019). What have long-term field studies taught us about population dynamics? Annu. Rev. Ecol. Evol. Syst. 50, 261–278. doi: 10.1146/annurev-ecolsys-110218-024717
Ruse L. (2010). Classification of nutrient impact on lakes using the chironomid pupal exuvial technique. Ecol. Indic. 10, 594–601. doi: 10.1016/j.ecolind.2009.10.002
Sato Y., Sato S. (2015). Spring temperature predicts the long-term molting phenology of two cicadas, Cryptotympana facialis and Graptopsaltria nigrofuscata (Hemiptera: Cicadidae). Ann. Entomol. Soc Am. 108, 494–500. doi: 10.1093/aesa/sav036
Simon C., Cooley J. R., Karban R., Sota T. (2022). Advances in the evolution and ecology of 13- and 17-year periodical cicadas. Annu. Rev. Entomol. 67, 457–482. doi: 10.1146/annurev-ento-072121-061108
Smith J. J., Hasiotis S. T. (2008). Traces and burrowing behaviors of the cicada nymph Cicadetta calliope: Neoichnology and paleoecological significance of extant soil-dwelling insects. Palaios 23, 503–513. doi: 10.2110/palo.2007.p07-063r
Smith D. M., Kelly J. F., Finch D. M. (2006). Cicada emergence in Southwestern riparian forest: Influences of wildfire and vegetation composition. Ecol. Appl. 16, 1608–1618. doi: 10.1890/1051-0761(2006)016[1608:CEISRF]2.0.CO;2
Stewart-Oaten A., Murdoch W. W., Parke K. R. (1986). Environmental impact assessment: “pseudoreplication” in time? Ecology 67, 929–940. doi: 10.2307/1939815
Suzuki Y., Mukaimine W. (2021). Prey–predator interactions and body size relationships between annual cicadas and spiders in Japan. J. Nat. Hist. 55, 2749–2760. doi: 10.1080/00222933.2021.2019340
Viljur M.-L., Abella S. R., Adámek M., Alencar J. B. R., Barber N. A., Beudert B., et al. (2022). The effect of natural disturbances on forest biodiversity: an ecological synthesis. Biol. Rev. 97, 1930–1947. doi: 10.1111/brv.12876
Whiles M. R., Snyder B. A., Brock B. L., Bonjour S., Callaham M. A. Jr., Meyer C. K., et al. (2019). Periodical cicada emergence resource pulse tracks forest expansion in a tallgrass prairie landscape. Ecosphere 10, e02779. doi: 10.1002/ecs2.2779
Williams K. S., Simon C. (1995). The ecology, behavior, and evolution of periodical cicadas. Ann. Rev. Entomol. 40, 269–295. doi: 10.1146/annurev.en.40.010195.001413
Yang L. H. (2004). Periodical cicadas as resource pulses in North American forests. Science 306, 1565–1567. doi: 10.1126/science.1103114
Yang L. H. (2006). Periodical cicadas use light for oviposition site selection. Proc. R. Soc B. 273, 2993–3000. doi: 10.1098/rspb.2006.3676
Yang L. H., Gratton C. (2014). Insects as drivers of ecosystem processes. Curr. Opin. Insect Sci. 2, 26–32. doi: 10.1016/j.cois.2014.06.004
Yang L. H., Karban R. (2009). Long-term habitat selection and chronic root herbivory: explaining the relationship between periodical cicada density and tree growth. Am. Nat. 173, 105–112. doi: 10.1086/593360
Keywords: cicadidae, soil indicators, transect counts, population monitoring, exuviae, method description
Citation: Pons P, Puig-Gironès R, Tobella C, Peiris A and Bas JM (2023) Cicada-MET: an efficient ecological monitoring protocol of cicada populations. Front. Ecol. Evol. 11:1219636. doi: 10.3389/fevo.2023.1219636
Received: 09 May 2023; Accepted: 04 August 2023;
Published: 22 August 2023.
Edited by:
Andrea Sciarretta, University of Molise, ItalyReviewed by:
Philippe Vernon, University of Rennes 1, FranceCopyright © 2023 Pons, Puig-Gironès, Tobella, Peiris and Bas. This is an open-access article distributed under the terms of the Creative Commons Attribution License (CC BY). The use, distribution or reproduction in other forums is permitted, provided the original author(s) and the copyright owner(s) are credited and that the original publication in this journal is cited, in accordance with accepted academic practice. No use, distribution or reproduction is permitted which does not comply with these terms.
*Correspondence: Pere Pons, cGVyZS5wb25zQHVkZy5lZHU=
Disclaimer: All claims expressed in this article are solely those of the authors and do not necessarily represent those of their affiliated organizations, or those of the publisher, the editors and the reviewers. Any product that may be evaluated in this article or claim that may be made by its manufacturer is not guaranteed or endorsed by the publisher.
Research integrity at Frontiers
Learn more about the work of our research integrity team to safeguard the quality of each article we publish.