 Jingxuan Ma
 Jinhe Zhang1,2*
94% of researchers rate our articles as excellent or good
Learn more about the work of our research integrity team to safeguard the quality of each article we publish.
Find out more
ORIGINAL RESEARCH article
Front. Ecol. Evol., 10 November 2023
Sec. Urban Ecology
Volume 11 - 2023 | https://doi.org/10.3389/fevo.2023.1214741
This article is part of the Research TopicEvaluation of Urban Ecological Security and Measurement of Urban Ecological ResilienceView all 18 articles
It is of important theoretical and practical value to scientifically evaluate tourism ecological security for the sustainable development of tourist cities. The study focuses on the “characteristics of the impact factors on tourism ecological security at different levels” of tourism ecological security that have been neglected in the previous literature. From the perspective of Compound Ecological systems theory, we built an evaluation index system for tourism ecological security in Huangshan City based on the Pressure-State-Impact-Economic-Environmental-Social (PSR-EES) model and used a combination of the entropy weight TOPSIS (Technique for Order Preference by Similarity to an Ideal Solution) method, traditional and spatial Markov chains, and panel quantile regression to analyze and characterize the spatial-temporal dynamics of security levels and driving factors. The results showed that (1) the level of tourism ecological security of the districts and counties in Huangshan City improved rapidly, but the difference was expanding. The level of tourism ecological security in the four counties was generally higher than that in the three districts. (2) In terms of the spatial-temporal dynamic evolutionary characteristics, the transfer of tourism ecological security in Huangshan City has its characteristics of stability and path dependence. Type transfers usually occur between adjacent levels. The lower the level of tourism ecological security, the higher the probability of upward transfer. A neighborhood background plays an important role in the process by which a higher neighborhood rank increases the probability of upward transfer. (3) Regarding the driving factors, environmental pollution and economic development have a negative inhibitory effect on tourism ecological security, and the negative effect decreases as the level of TES improves. The top three positive effects were government intervention and educational levels. The degree of regional greening and government intervention had greater positive marginal effects on lower-level areas. In contrast, tourism development, educational level, and labor input had greater positive marginal effects on areas with higher TES levels.
As a key policy objective at the global, national, and local levels (Peng et al., 2017), development of sustainable tourism has long been a focus worldwide (Ahmad et al., 2018). With its dual attributes of environmental friendliness and resource consumption, the tourism industry exhibits a binary relationship with the environment (Shi et al., 2019). Once considered a “clean” industry, tourism has become an important driver of urbanization in cities with abundant tourism resources, and many government incentives have been introduced to promote its development (Tao et al., 2017; Kapera, 2018). However, the utilization of resources in tourism development has significant negative externalities. The negative impacts of increasing tourist activities, consumption, and development are becoming increasingly evident, contradicting the need to protect the ecological environment (Williams and Ponsford, 2009). These negative effects hinder the development of the tourism industry and form a vicious cycle that impairs the integrity and services of tourism destination ecosystems, posing a threat to their ecological security (Qian et al., 2018; Xiaobin et al., 2021). It has become a consensus of all sectors of society to ensure the integrity of the structure and function of the tourist destination ecosystem, maintain the safety and stability of tourism ecology, and promote sustainable development of the tourism industry. (Ruan et al., 2019). Tourism ecological security has become a primary indicator for assessing environmental impacts and sustainable development and now it is a focal point in current research (Liu et al., 2017a). This is also in response to China’s major national strategy to promote the progress of the ecological civilization established in 2012 and the policy of developing tourism into a core industry of ecological civilization construction and becoming a strategic pillar industry of the national economy. In this context, scientifically describing the spatiotemporal evolution of tourism ecological security and its influence and driving factors in the long-term dimension of tourist cities is conducive to improving the degree of ecological security and service levels in tourist destinations and formulating targeted tourism development policies. It also has significance in promoting the coordinated and sustainable development of tourist cities.
The application of complex ecosystem and system theories provides a theoretical basis and an innovative foundation for developing an ecological security evaluation index system for tourist cities. The essence of complex ecosystem theory is that social, economic, and environmental systems differ from and restrict each other; however, they connect to form an open and complex composite ecological system with structure and function. A tourist city can be regarded as a complex ecosystem comprising economic, environmental, and social subsystems (Zhou et al., 2015). Each subsystem includes certain elements, including organisms and circumstances. Through energy flow, material circulation, and information transmission, a state of high adaptation, coordination, and unity can be achieved (Liu et al., 2007). System theory emphasizes the overall concept of the system and believes that the elements of the system are not mechanical existence and combination, but the organic relationship between the whole and parts, part and part, whole and external environment (Kenneth, 1956). However, the index system of many previous studies is only a simple list of statistical data. This not only ignores the essential issues of ecological security, that is the human-land interaction in pursuit of sustainable development and harmonious symbiosis, but also the multilevel characteristics of the economic-environmental-social subsystems of tourism cities. Additionally, it fails to evaluate the interaction between the internal elements of each system. On a theoretical basis, this study adopts the pressure-state-response-economy-environment-society model (PSR-EES) (Wang et al., 2021c), comprehensively considers the economic, environmental, and social subsystems in tourist cities, clarifies the logic between pressure-state-response (P-S-R) model (Zhou et al., 2002), innovates the ecological security evaluation index system of tourism cities, and expounds the mechanism of interaction among tourism, economy, society, and the environment in the sustainable development of tourism.
This study chose Huangshan City as the research region (Figure 1) for the following reasons: as a typical and world-famous mountainous tourist city in China, Huangshan City boasts superior cultural and tourism resources, including Mount Huangshan, which is a UNESCO-approved cultural and natural dual heritage site, and the ancient villages in Southern Anhui (Xidi and Hongcun) are listed as World Cultural Heritage sites. The city also had 5A-level scenic spots, 8 scenic areas, and 22 4A-level scenic spots. The tourism industry has experienced rapid growth, receiving a total of 71.153 million domestic and foreign tourists by 2019, with a cumulative tourism income of 59.52 billion yuan, accounting for over 70% of the city’s GDP. Therefore, the selection of this region for the case study is of significant practical importance. (2) Huangshan City is a typical mountainous tourist city with a forest coverage rate of over 82.9%, driven by the urbanization of the tourism industry (Leung, 2001; Xie et al., 2021), and faces a sharp contradiction between development and protection. With the rapid development of the tourism industry, the increasing input of resource elements and tourism waste (Wang and Chen, 2021), poses significant pressure on natural (Leung, 2001), economic, and ecological systems in scenic spots. Because the ecosystems of mountainous tourist areas are relatively fragile and easily damaged (Scott, 2006), a mountainous tourist city would lose its value as a tourist attraction without a good natural ecological environment (Lin, 1997). The districts and counties of Huangshan City have abundant cultural and tourism resources, and their tourism economies are closely linked. According to related research, tourism flows are geographically concentrated (Mou et al., 2020). The self-driving tourism flow in Huangshan City presents characteristics of agglomeration, circumnavigation, and radiation, with tourists frequently moving between districts and counties (Song et al., 2013). Therefore, high-intensity tourism activities over short distances bring about the transfer of tourism waste and pollutants, which deepens the impact on the ecological security of tourism destinations and transfers and changes between regions.
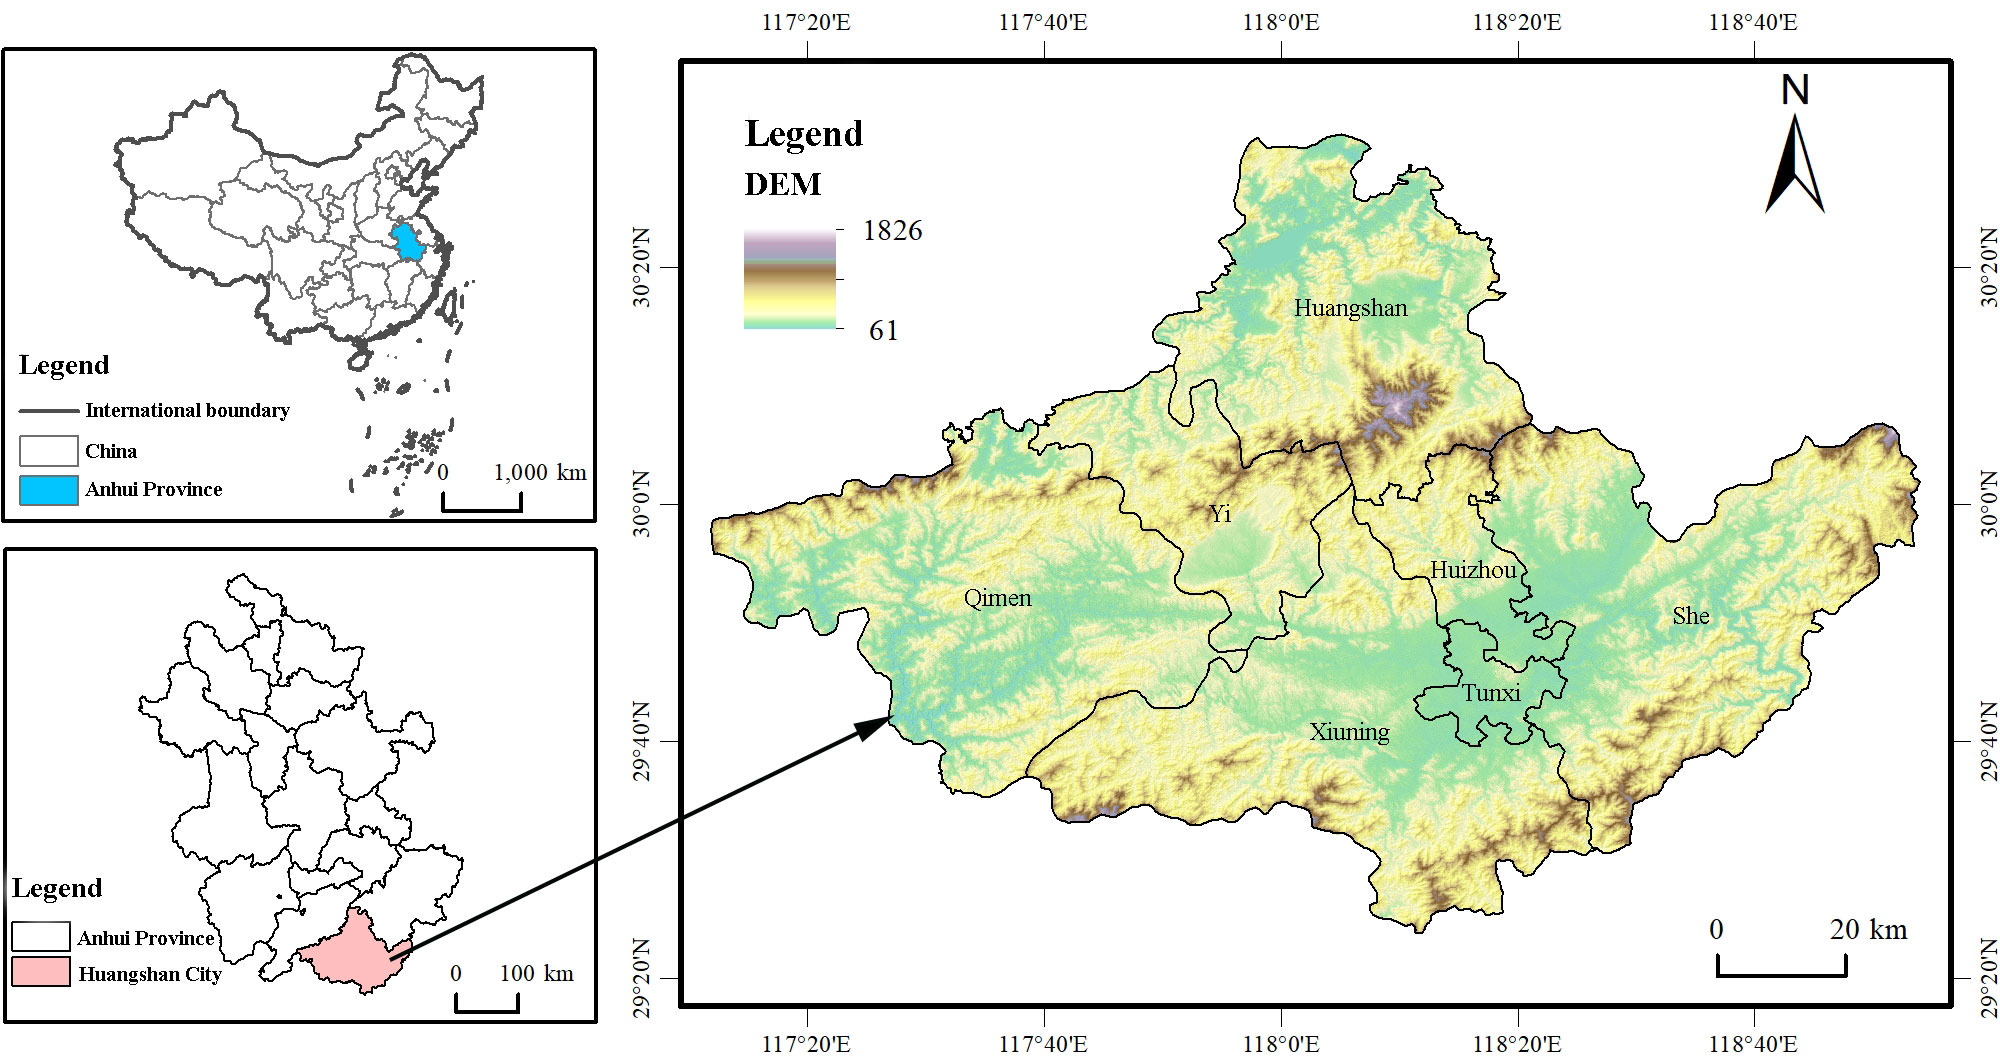
Figure 1 Study site map.
This study focuses on the following key objectives and innovations: (1) Construct an evaluation index system from the perspective of complex ecosystem theory and system theory, comprehensively considering multidimensional factors and the logical relationship between various systems and elements. In addition, innovating the tourism ecological security evaluation model for tourist cities. (2) Innovate research methods to investigate the transition probability, as well as the temporal and spatial evolution characteristics of security levels among districts and counties in tourist cities from a small-scale regional perspective. (3) It clarifies the key factors affecting tourism ecological security, defines the degree and characteristics of the effects of different factors at different levels, and constructs tourism ecological security driving mechanisms in different dimensions. Additionally, it enriches the content and research methods of tourism ecological security research and provides a scientific reference for promoting the sustainable development of the tourism industry in other tourist cities.
Ecological security is an important field in the study of the sustainable development of tourist destinations (Liu et al., 2009). It refers to the state in which human survival, health, well-being, basic rights, sources of life security, necessary resources, social order, and human ability to adapt to environmental changes are not threatened. Tourism ecological security refers to the ability of ecosystem of tourist destination to provide services for the sustainable development of human society and the economy within a certain time and space to maintain the long-term coordinated development of the natural-society-economic complex system (Li et al., 2019; Fan and Fang, 2020). This allowed it to become a new conceptual paradigm (Tang et al., 2018). Comparing with ecological security involves protecting an entire ecosystem, tourism ecological security focuses on protecting and managing the impact of tourism on the ecological environment. The goal is to protect and maintain the ecological environment and resources of tourist destinations during the tourism season (Zhang et al., 2008). Tourism ecological security mainly focuses on practitioners, tourists, and local communities, as well as the ecological environment directly related to tourism activities (Qin et al., 2019). This study mainly focuses on the following aspects: From a disciplinary perspective, research on tourism ecological security is distributed across tourism (Liu and Yin, 2022), landscape ecology (Malekmohammadi and Jahanishakib, 2017; Chen et al., 2021), geography (Tang et al., 2018), management (Wolfslehner and Vacik, 2008), environmental science (Jurado et al., 2012), system dynamics (Qin et al., 2019), and energy science (Tang et al., 2015) as well as presents multidisciplinary features. The research content presents the characteristics of continuous expansion from shallow to deep and has gradually expanded from the origin of ideas (Lv, 2007), concepts and connotation (Zhang et al., 2008), evaluation (Li et al., 2017a), spatiotemporal characteristics (Ruan et al., 2019; Chen et al., 2023), influencing factors, trend forecasting (Cheng and Yue, 2011), early warning system construction (Xu et al., 2017), dynamic simulation, and other issues (Lu et al., 2019). The case studies included islands (Xiao et al., 2011; Chen et al., 2021; Wang et al., 2021a), wetlands (Li et al., 2012; Sun et al., 2021), grasslands (Lu et al., 2008), mountains (Chen et al., 2022), forests (Zheng et al., 2015), and coastal cities (Wang et al., 2016), etc. The research scale is comprehensive and covers the country (Liu and Yin, 2022), region (Ruan et al., 2019), city (Tang et al., 2018), and scenic spots (Wang et al., 2021b). Evaluation methods include the use of the environmental impact of tourism to assess (Green and Hunter, 1992) the tourism carrying capacity assessment (O’Reilly, 1986), and an acceptable change limit system for tourism development (McCool, 1994). Currently, the index evaluation model method has become the choice of most scholars for the quantitative calculation of TES because of its high applicability, strong operability, and high comparability. Scholars usually use the following models: P-S-R (Zhou et al., 2015); DPSIR (Xiaobin et al., 2021); PSR-EES (Tang et al., 2018); and the Ecological Footprint (Zhang et al., 2008; Zhou et al., 2016); the capacity-support-attraction-continuation-development capacity (CSAED) model; the threaten-quality-regulation (TQR) model (Zheng et al., 2015);and the Institutional environment-Regulatory and construction acts-Disturbing Activation-Security state (IRDS) model. The evaluation and measurement methods chosen by scholars are different. Measurement methods for tourism ecological security include the improved Technique for Order Preference by Similarity to an Ideal Solution (TOPSIS) and linear weighting method (Li et al., 2017a), fuzzy comprehensive evaluation method (Du et al., 2021), ecological footprint method (Qian et al., 2018), grey relational projection method (He et al., 2018), system dynamics model (Qin and Cheng, 2019), and DEA data envelopment analysis (Ruan et al., 2019), etc. In previous studies, the research case, temporal and spatial evolution, and influencing factors are key issues that lay the foundation for current and future tourism research. Not only can it help us effectively understand the spatiotemporal evolution characteristics and driving factors of tourism ecological security in tourist cities, but it can also provide theoretical guidance for the sustainable development of tourism.
Spatiotemporal pattern evolution is the focus of tourism geography research and has been widely applied in tourism ecological security research in recent years. (Liu et al., 2022) used a spatial autocorrelation model to analyze the spatial-temporal differentiation pattern characteristics of Chongqing’s ecological security. (Zheng et al., 2023) used the standard deviation ellipse method, and the center of gravity model method was used for analysis in 31 provinces of China. (Wang and Chen, 2021) used interpolation analysis and spatial variation models to analyze the temporal and spatial dynamic evolution characteristics of the tourism ecological security level in 11 provinces of the Yangtze River Economic Belt from 1998 to 2017. (Xiaobin et al., 2021) used the spatial measurement model Spatial Durbin Model (SDM) to analyze the spatial characteristics of tourism ecological security in 41 cities in the Yangtze River Delta. Additionally, there was also the kernel density analysis (Wang et al., 2021c; Chen et al., 2023) and the dynamic degree model method (Tang et al., 2018). (Mu et al., 2022) used Markov and space Markov chains to explore the dynamic evolutionary characteristics of tourism ecological security in the Yellow River Basin. Compared with other spatial-temporal pattern analysis methods that focus on the spatial-temporal differentiation characteristics and changes in the entire study area and use cross-sectional data of the entire study area, a single year, or between years. The Markov chain and space Markov chain theory can not only be used to describe the spatial and temporal evolution of the ecological security level but also to analyze the probability of ecological security level evolution over time. Overall, considering the influence between neighborhoods, the analysis of the evolution probability and spatial-temporal evolution characteristics of the ecological security level of all research units in all years has the advantage of being meticulous and comprehensive. Used in this research,it not only explores the spatial effect of tourism but also helps to provide targeted policy formulation suggestions for units with different ecological security levels and different development levels to promote the sustainable development of tourism.
In recent years, research on the factors influencing tourism ecological security has become a popular topic, which is also a manifestation of the expansion of the content to deeper issues and a symbol of the gradual maturity of tourism ecological security research. To scientifically and reasonably explore the effects and mechanisms of tourism’s ecological security and its driving factors within a system, the choice of research methods for the influencing factors is crucial. Current research on the factors driving tourism ecological security involves research areas, including China (Qin and Cheng, 2019; Liu and Yin, 2022), the Yangtze River Delta (Ruan et al., 2019; Xiaobin et al., 2021), Shaanxi Province (Zhang et al., 2022) and other large-scale regions, Beijing(Tang et al., 2018), Dalian (Lu et al., 2019) Jiuzhaigou Scenic Area (Zhang et al., 2008), and other small-scale areas. In the research method of influencing factors, the gray correlation model was used to measure the degree of correlation between the 39 indicators in the evaluation system and the tourism ecological security index to research influencing factors (Tang et al., 2018). (Zhao and Guo, 2022) used geographic detectors to study the impact of 33 evaluation indicators on system security (Xiaobin et al., 2021) and spatial econometric models (SLM model and SEM models) to calculate the direct effects of influencing factors and indirect effects, as well as the obstacle model (Mu et al., 2022). The grey relational degree analyses the degree of influence according to the similarity degree of the geometric relationship of the data sequence curve; however, this method does not carry out the statistical testing of data; the obstacle degree calculates the influencing factors by calculating the weight of each index. This method also does not carry out the statistical testing of data, and the geographic detector method only measures the q value of the degree of influence at a single time point and cannot explore the positive and negative effects of the influence. Compared with the above methods, the panel quantile regression method must test the stationarity of each influencing factor before use, which ensures the rationality of the method. It can not only analyze the overall influencing factors of all research units at all-time points simultaneously but also explore the positive and negative effects of influencing factors, with comprehensive and holistic advantages. Moreover, compared to other methods, it has the characteristics and advantages of observing the changing trend of the independent variable regression coefficient value when the dependent variable is at different quantile points. It is convenient to draw more reliable research conclusions that have been applied and confirmed in some studies (Mu et al., 2022).
To clarify the necessity of this study to better explore the innovation of tourism ecological security evaluation methods and the key driving mechanisms, this paper comprehensively reviews previous related research and highlights the current research gap in tourism science. (1) In previous studies, when constructing the evaluation index system, researchers only referred to previous studies or simply listed them based on existing data, while ignoring the importance of providing a theoretical basis for the evaluation of tourism ecological security. However, a strong theoretical background not only helps to elucidate the interactions among multiple actors in tourism ecosystems but also helps to translate complex system operating mechanisms into simple explanations. Therefore, this study introduces the ecological system as well as the system theory. (2) In terms of spatiotemporal evolution, existing studies mostly start from spatial autocorrelation and analyze the spatial evolution pattern of a large number of city-level research units based on large-scale research areas, such as provinces, river basins (Xu and Liu, 2018), and economic belts. It is significant to explore the temporal and spatial evolutionary characteristics of small-scale regional tourism ecological security especially tourist cities, and innovative research methods. (3) Scholars have previously used a variety of methods to study the influencing factors of tourism ecological security. However, these methods have limitations in terms of data inspection, reliability, and time. The panel quantile regression method has advantages and is conducive to the establishment of a comprehensive, multilevel, scientific, and accurate driving mechanism for tourism ecological security.
The methodology used by this study for evaluating tourism ecological security of Huangshan City is composed of three parts: indicators selection and evaluation system construction, data collecting and processing, and research method including: entropy-weighted TOPSIS model, Markov chain, spatial Markov chain, panel quantile regression. The study’s method framework is shown in Figure 2.
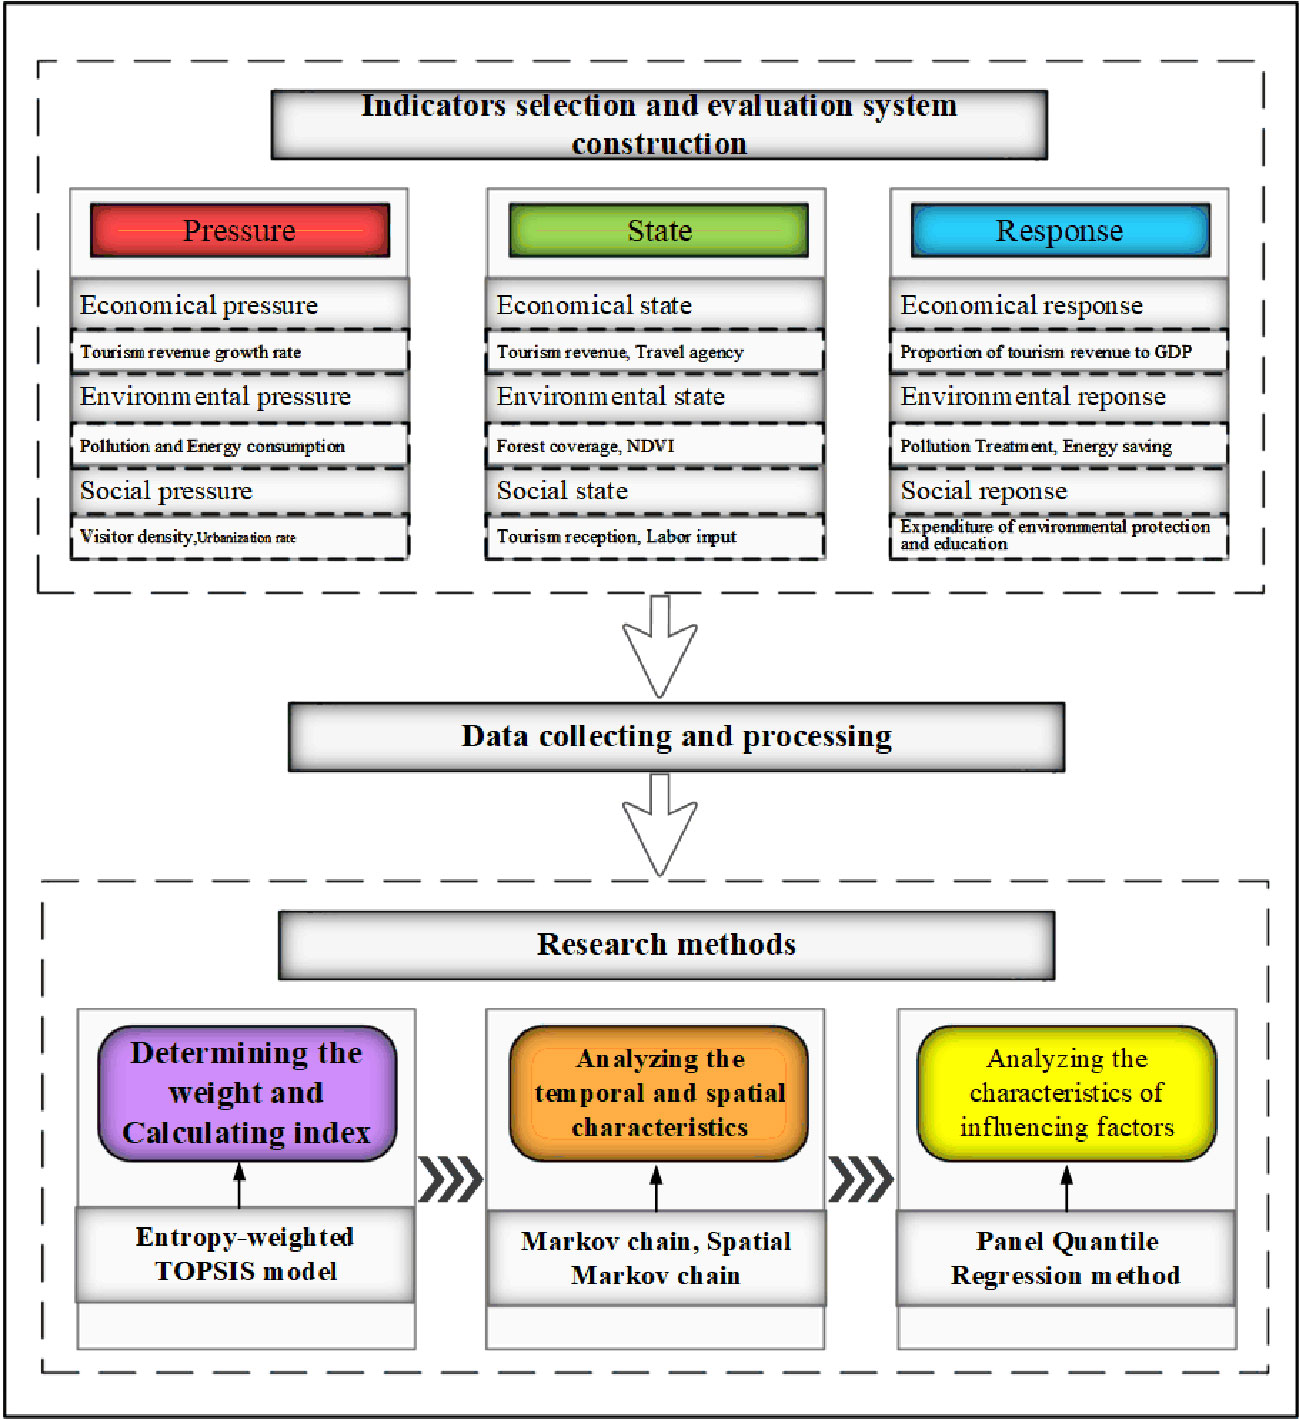
Figure 2 The method framework for evaluating tourism ecological security in Huangshan City.
The scientific selection of indicators is key to ensuring research results and is the core of evaluating tourism ecological security (Liu and Yin, 2022). Based on the perspective of the composite ecological system theory, this study considers tourism cities as a system composed of economic-environment-social subsystems that are mutually different, mutually restrictive, and interrelated: comprehensive consideration of economy, society, tourism, transportation, energy consumption, ecology, environmental protection, and other factors. At the same time, based on the system theory, focusing on the integrity, relevance, hierarchical structure, and dynamic balance characteristics of the evaluation system, an evaluation index system based on the PSR-EES model was constructed, and it was applied to the research on the operation mechanism of the tourism ecological security system. Mountain-type tourism city: Huangshan City tourism ecological security issues are to be re-examined.
The operating mechanism of the PSR-EES model in tourism ecological security can be expressed as follows: human tourism activities exert economic, environmental, and social pressures on the ecosystem (P), which is the dominant cause of ecological security problems in tourist destinations; under the impact of pressure, the function and state (S) of tourism and ecological dual system change, which leads to a change in destination tourism ecological security level; to reduce risk pressure and continue the positive effect to promote and maintain the benignity of tourism and ecological environment development, tourism stakeholders are bound to exert their subjective initiative.
Taking appropriate measures to respond positively (R), this study combines the theory of tourism ecological security, following the principles of scientificity, comprehensiveness, systematization, hierarchy, and data availability, and starts from the perspective of the interaction of the three subsystems of economy, society, and the ecological environment. Using indicators with their characteristics in the tourism industry and soliciting relevant expert opinions, a tourism ecological security evaluation index system consisting of three subsystem-level first-level indicators and 38 factor-level second-level indicators was constructed, and the weight of each indicator is determined by the entropy weight method for all administrative units and 38 indicator data from 2000 to 2019. Table 1 shows the units, positive and negative attributes, weights and related references of the 38 indicators.
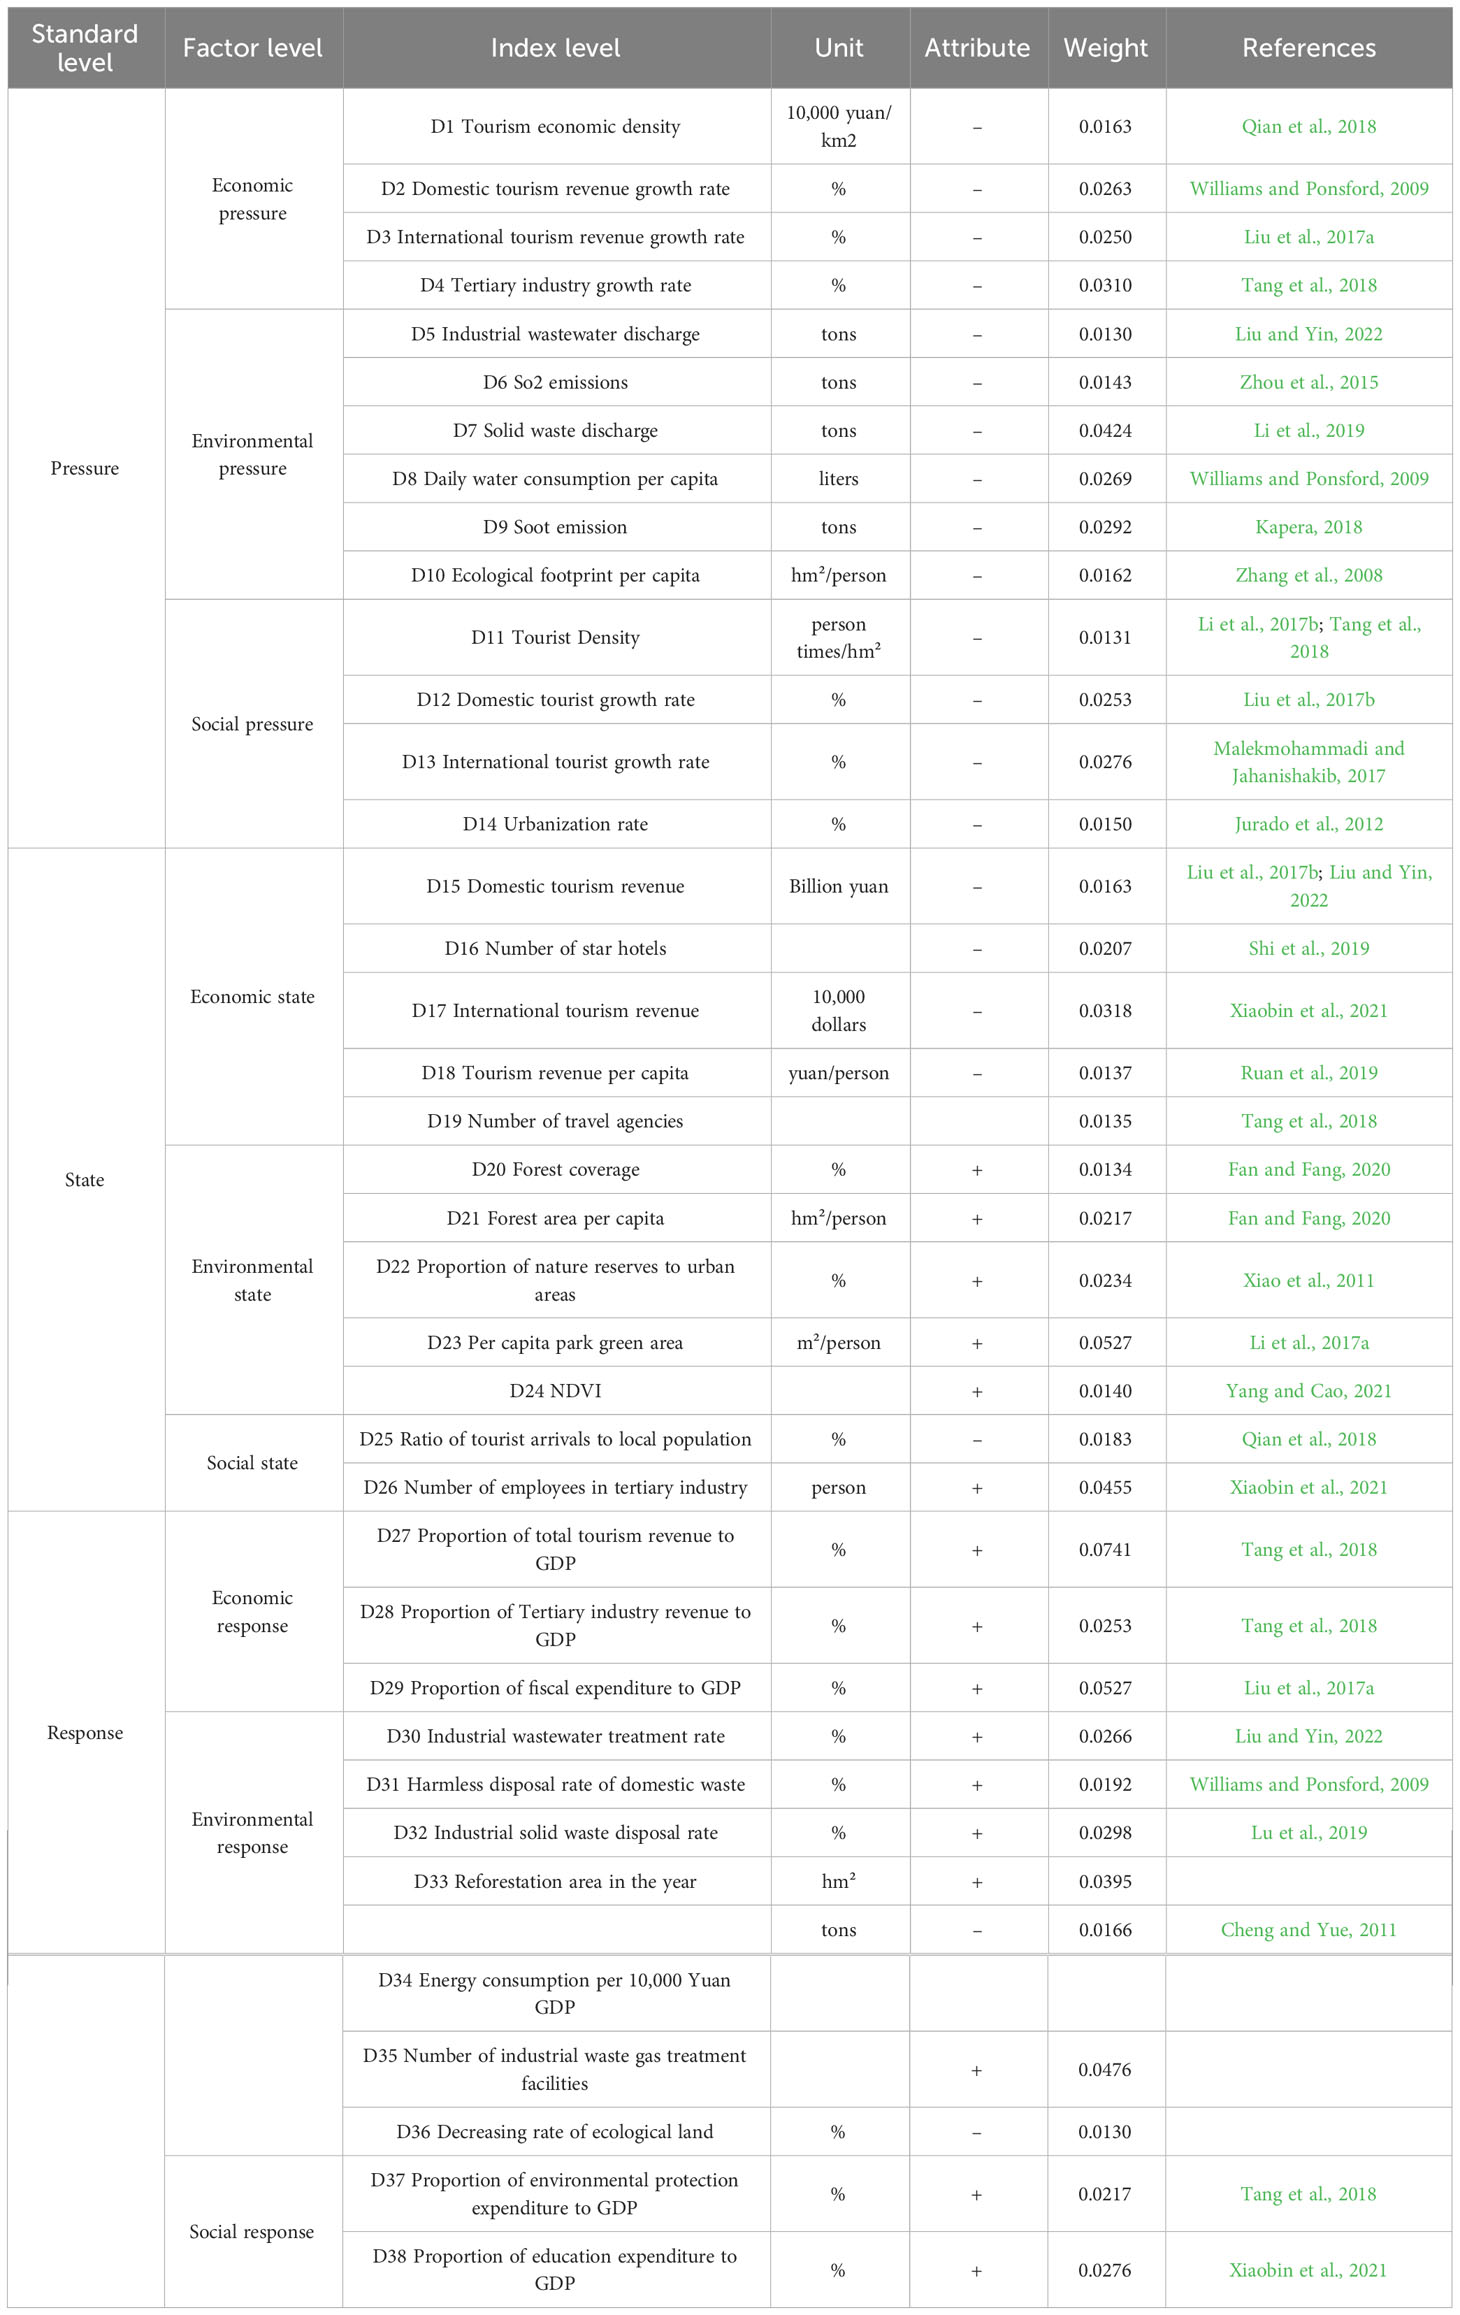
Table 1 Evaluation index system of tourism ecological security in Huangshan City.
Currently, there is no unified standard in the academic community for evaluating tourism ecological security. This study proposes a grading standard based on existing research results (Yajuan et al., 2013; Tang et al., 2018), and the actual situation in Huangshan City (Peng et al., 2017; Hu et al., 2019; Yu et al., 2020). The proposed standard divides tourism ecological security into seven categories: deterioration, risk, sensitivity, critical security, general security, relative security, and extreme security.
The statistical data used in this paper come from the Huangshan City Statistical Yearbook “Huangshan City Statistical Yearbook,” “Anhui Statistical Yearbook,” “China Tourism Statistical Yearbook,” “China County Statistical Yearbook,” “China City Statistical Yearbook,” “China Energy Statistics Yearbook” from 2001 to 2020 Yearbook”, the National Economic and Social Development Statistical Bulletin of Huangshan City and its seven districts and counties from 2000 to 2019, the Environmental Status and Environmental Protection Work Target Completion Report, and so on. NDVI data were obtained from the Resource and Environment Science and Data Center of the Chinese Academy of Sciences (https://www.resdc.cn/) from 2000 to 2019, and the Chinese 30 m land cover fine classification product (CLCD30) of Yang Jie’s team at Wuhan University (https://zenodo.org/record/5210928) from 1999 to 2019. Linear interpolation was used for the missing data to complement and complete the dataset.
TOPSIS was first proposed by Hwang and Yoon (1981). This method constructs the optimal and worst-case scenarios for each indicator and then calculates the relative closeness to the optimal and worst-case scenarios. It evaluates the advantages and disadvantages of each scenario based on the distance between positive and negative ideal solutions. This method has the advantages of being true, intuitive, and reliable, with no strict restrictions on data distribution, sample size, or the number of indicators, and has been used successfully by many scholars (Zhou et al., 2015). In this study, we use this method to evaluate the level of tourism ecological security in Huangshan City. The steps are as follows: (1) standardize the evaluation indicators using the range method; (2) calculate the indicator weights using the entropy weight method, which has strong objectivity; (3) establish a weighted normalization matrix; (4) determine the positive and negative ideal solutions; (5) calculate the distance from the target value to the positive and negative ideal solutions; and (6) calculate the proximity index of each evaluation object to the optimal solution in each year, with a value range of [0,1]. The larger the value, the safer the tourism ecological system of the research unit, and vice versa. The specific calculation formula can be found in the reference (Huang, 2008; Behzadian et al., 2012).
A Markov chain is a type of Markov process in which both the time and state are discrete (Hastings, 1970).This method discretizes the continuous tourism ecological security index into k categories and calculates the probability distribution and interannual transition changes of the corresponding categories to approximate the entire regional evolution process. It can be used to analyze the probability of the evolution of tourism ecological security levels over time and extreme security, and the specific level classification is shown in Table 2. The probability distribution of tourism ecological security levels in year can be represented as a state probability vector . The transition between different tourism security levels in different years is represented by the Markov transition probability matrix .
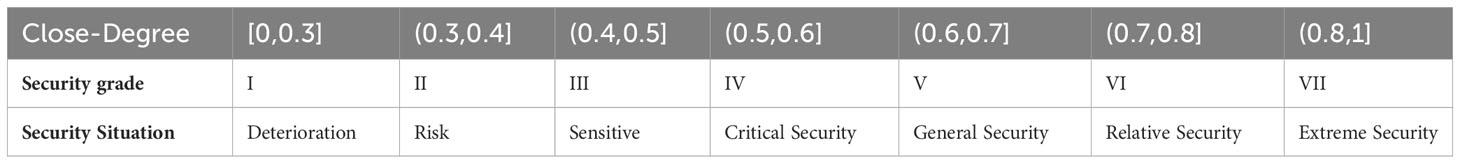
Table 2 Tourism ecological security level standard in Huangshan City.
The element represents the probability of a region belonging to category in year t transitioning to category in the following year, where . Here, represents the sum of the number of regions belonging to category in year , that transitioned to category in year , and represents the sum of the number of regions belonging to category during the study period. If the tourism ecological security of a region remains the same in the following year as it was in the initial year, it indicates that its transition is in a steady state. If the tourism ecological security level improves, it is defined as an upward transition; otherwise, it is defined as a downward transition.
A spatial Markov chain is a combination of the traditional Markov chain method and spatial lag (Roberts and Rosenthal, 2004). By introducing spatial lag factors, the spatial Markov chain accounts for the states of neighboring regions, thereby compensating for the shortcomings of traditional Markov chains in terms of spatiality. This method can be used to analyze the possibility of upward or downward transitions of tourism ecological security in a unit affected by neighboring units and reveal the spatial interaction relationship in the process of tourism ecological security change and the relationship between the probability of tourism ecological security type transition and neighboring counties.
The spatial Markov transition probability matrix decomposes the traditional Markov matrix into transition probability matrices, based on the spatial lag type of region i in the initial year. For the th conditional matrix, the element represents the one-step spatial transition probability that the region belongs to type in the current year and transitions to type in the following year, given that the spatial lag type is . The spatial lag value of unit is the weighted average of the observation values of its neighboring units, as shown in the following formula:
represents the observation value of unit ; is the spatial weight matrix. Because of the significant spatial adjacency and continuity among the districts and counties of Huangshan City, this study used the adjacency weight matrix, where adjacent units have a weight of 1 and otherwise a weight of 0, representing the spatial relationship between units and unit .
The quantile regression method was first proposed by (Koenker and Bassett, 1978), and has been widely used in panel data research in recent years (Huang et al., 2017). The quantile regression method has the characteristic of observing the regression coefficient values at different quantile points and can comprehensively and systematically study the influence of the independent variable X on the dependent variable Y (Koenker and Hallock, 2001). Compared with ordinary linear OLS regression, the quantile regression algorithm is more robust, and the conclusion is more testable when there are outliers in the data when the dependent variable Y is not normally distributed, or when heteroscedasticity problems occur. In short, panel quantile regression does not need to consider that the data obey a normal distribution and can also better eliminate the interference of outliers. Controlling for differences in the explanatory variables effectively describes the differences between the explained variables at different quantile points influences relationships (Koenker, 1994). Its expression is:
In the formula: is the conditional quantile function of tourism ecological security; is the value of tourism ecological security; is a constant item; is the explanatory variable matrix; is the research sample size; is the research period; Indicates the influence coefficient under the quantile; the quantile points set in this paper are 0.1, 0.25, 0.5, 0.75, 0.9
In the formula: is the influence coefficient; is the number of quantile arrays; is the th group of quantiles; is the quantile loss function; is the weight coefficient of the th quantile; is the influence coefficient of the th quantile.
Considering the real situation in Huangshan City and the calculated results of tourism ecological security in this study, a representative index was selected to construct a model system of driving factors for the comprehensive effect of multiple factors on tourism ecological security in Huangshan City. From the aspects of tourism development level, economic development level, labor input, environmental pollution, tourism load level, regional greening degree, government intervention, and education level, the spatiotemporal evolution process of tourism ecological security under the influence of multiple factors was systematically quantified. Table 3 shows types, interpretations, and statistical descriptions of the variables.
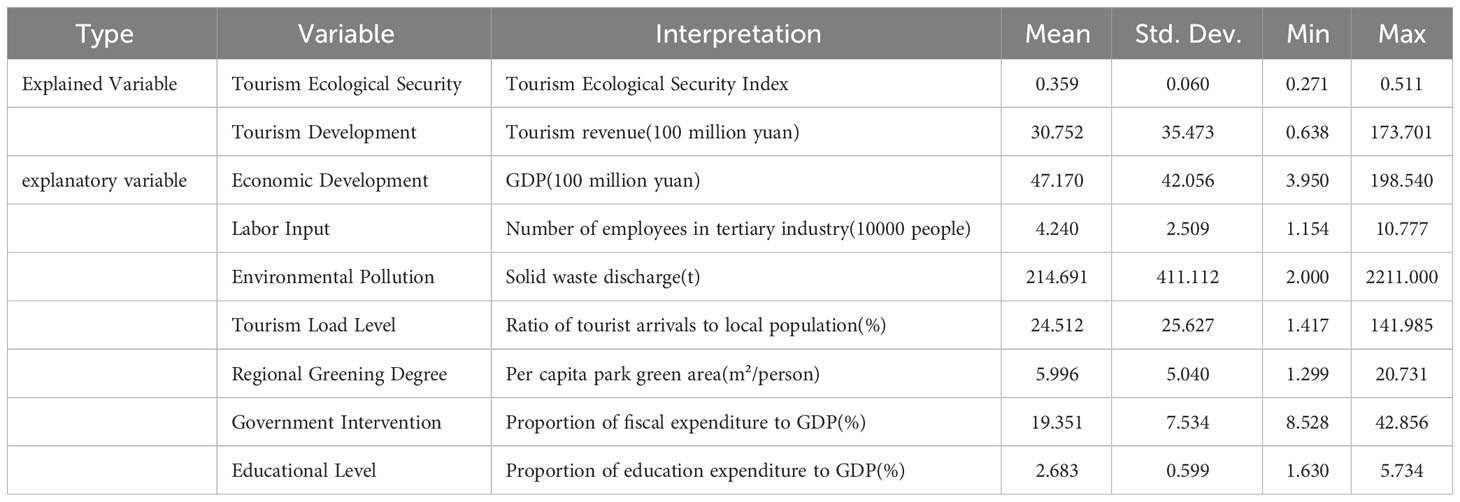
Table 3 The main variables of the panel quantile regression equation and their descriptive statistics.
To ensure the reliability and comprehensiveness of the data as much as possible, the time before COVID-19 was analyzed for as long as possible to better explore the cyclical characteristics of tourism ecological security. This paper analyzed and calculated the 2000–2019 Huangshan and comprehensive index of tourism ecological security in each district. The average index of tourism ecological security in Huangshan City and its districts steadily increased from 0.288 in 2000 to 0.432 in 2019, with an average annual growth rate of 2.16%, as shown by the line graph (Figure 3A) and box plot (Figure 3B). The development of tourism and protection of the ecological environment has been priorities for governments at all levels. Policies such as the State Council’s “Opinions on Accelerating the Development of Tourism” (No. 41, 2009), the Joint National Ecotourism Development Outline (2008–2015) issued by the former National Tourism Administration and the Ministry of Environmental Protection, and the “Huangshan Ecological Strong City Construction Implementation Plan” (No. 20, 2013) issued by the Huangshan City Government aim to strengthen the relationship between ecological protection and tourism development. These policies have led to a decrease in the number of counties and districts that are deteriorating or at risk, whereas the number of sensitive and critically safe areas has continued to increase, showing an overall positive trend (Figure 4). However, during the study period, different districts showed varying degrees of improvement in the ecological security of tourism. The difference in the tourism ecological security index among districts also showed a widening trend. Therefore, there remains great potential for improvement in the tourism ecological security level in Huangshan City.
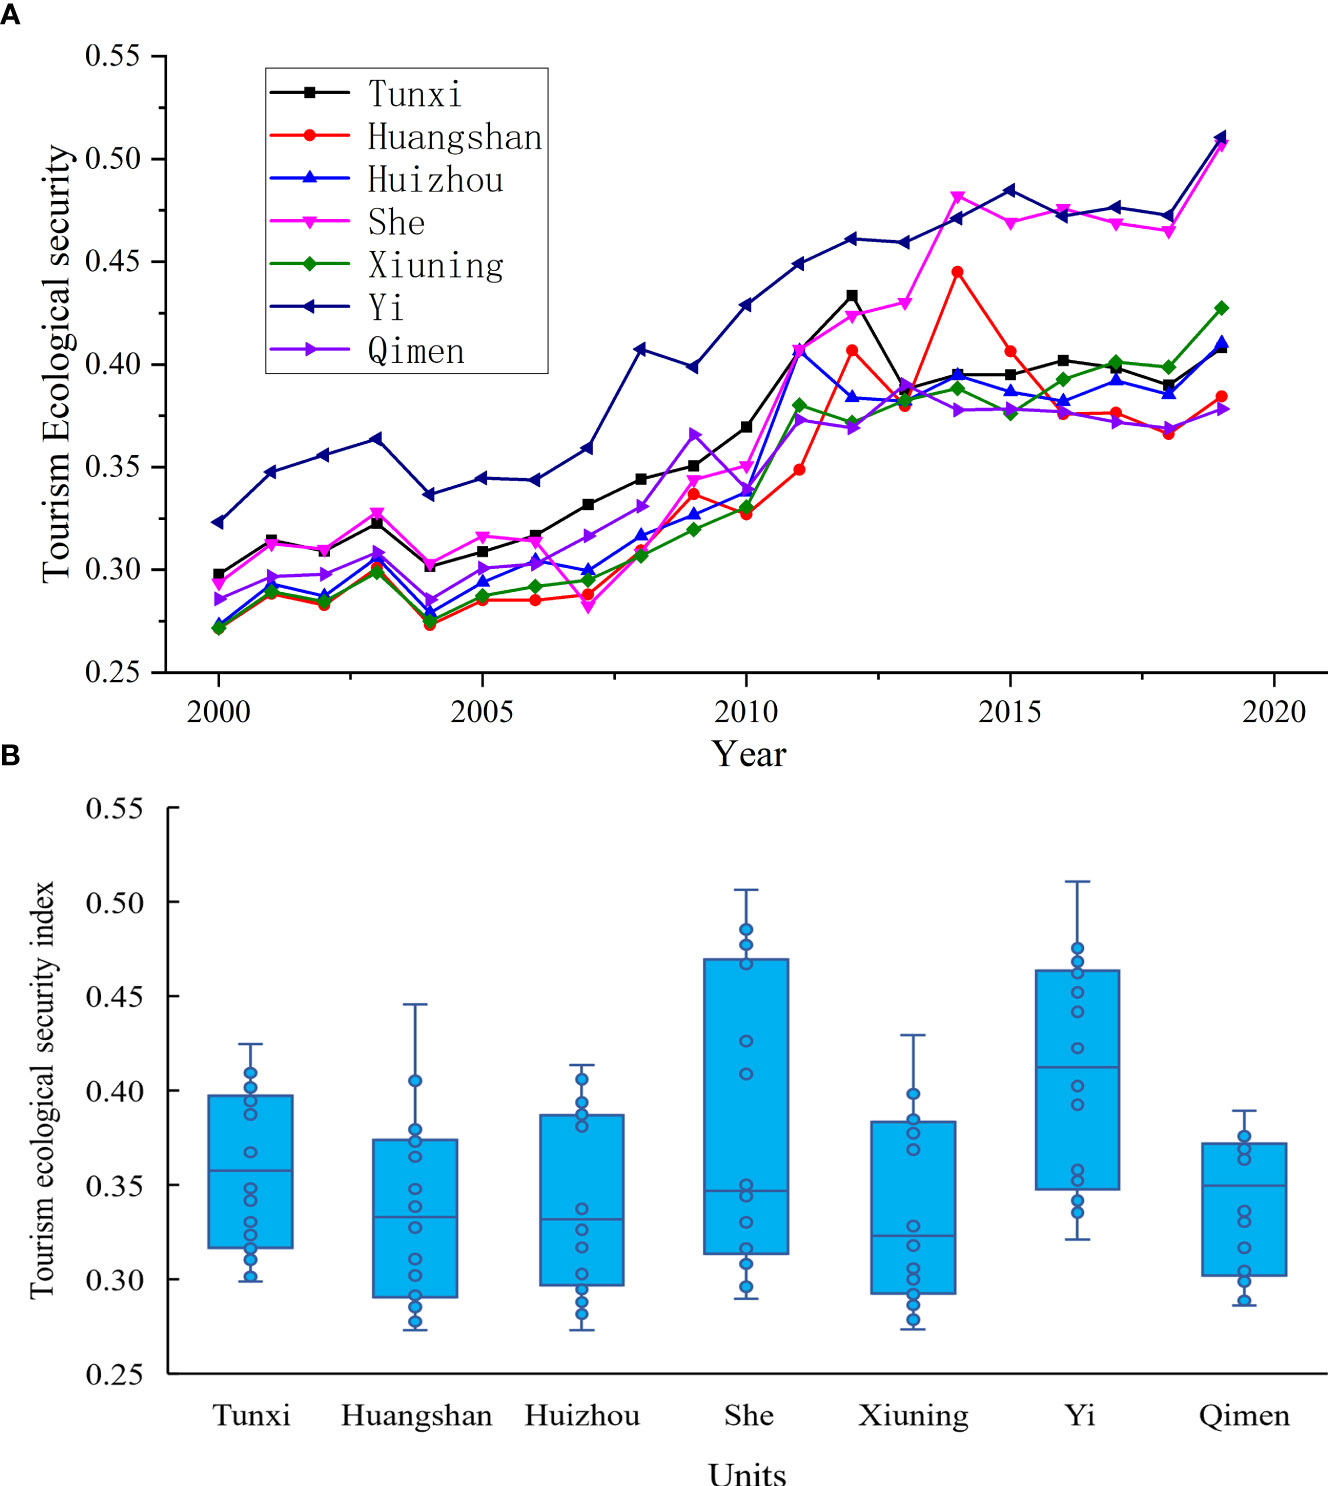
Figure 3 Changes and characteristics of tourism ecological safety index by districts and counties in Huangshan City from 2000 to 2019. (A) Folding line chart; (B) Box line chart.
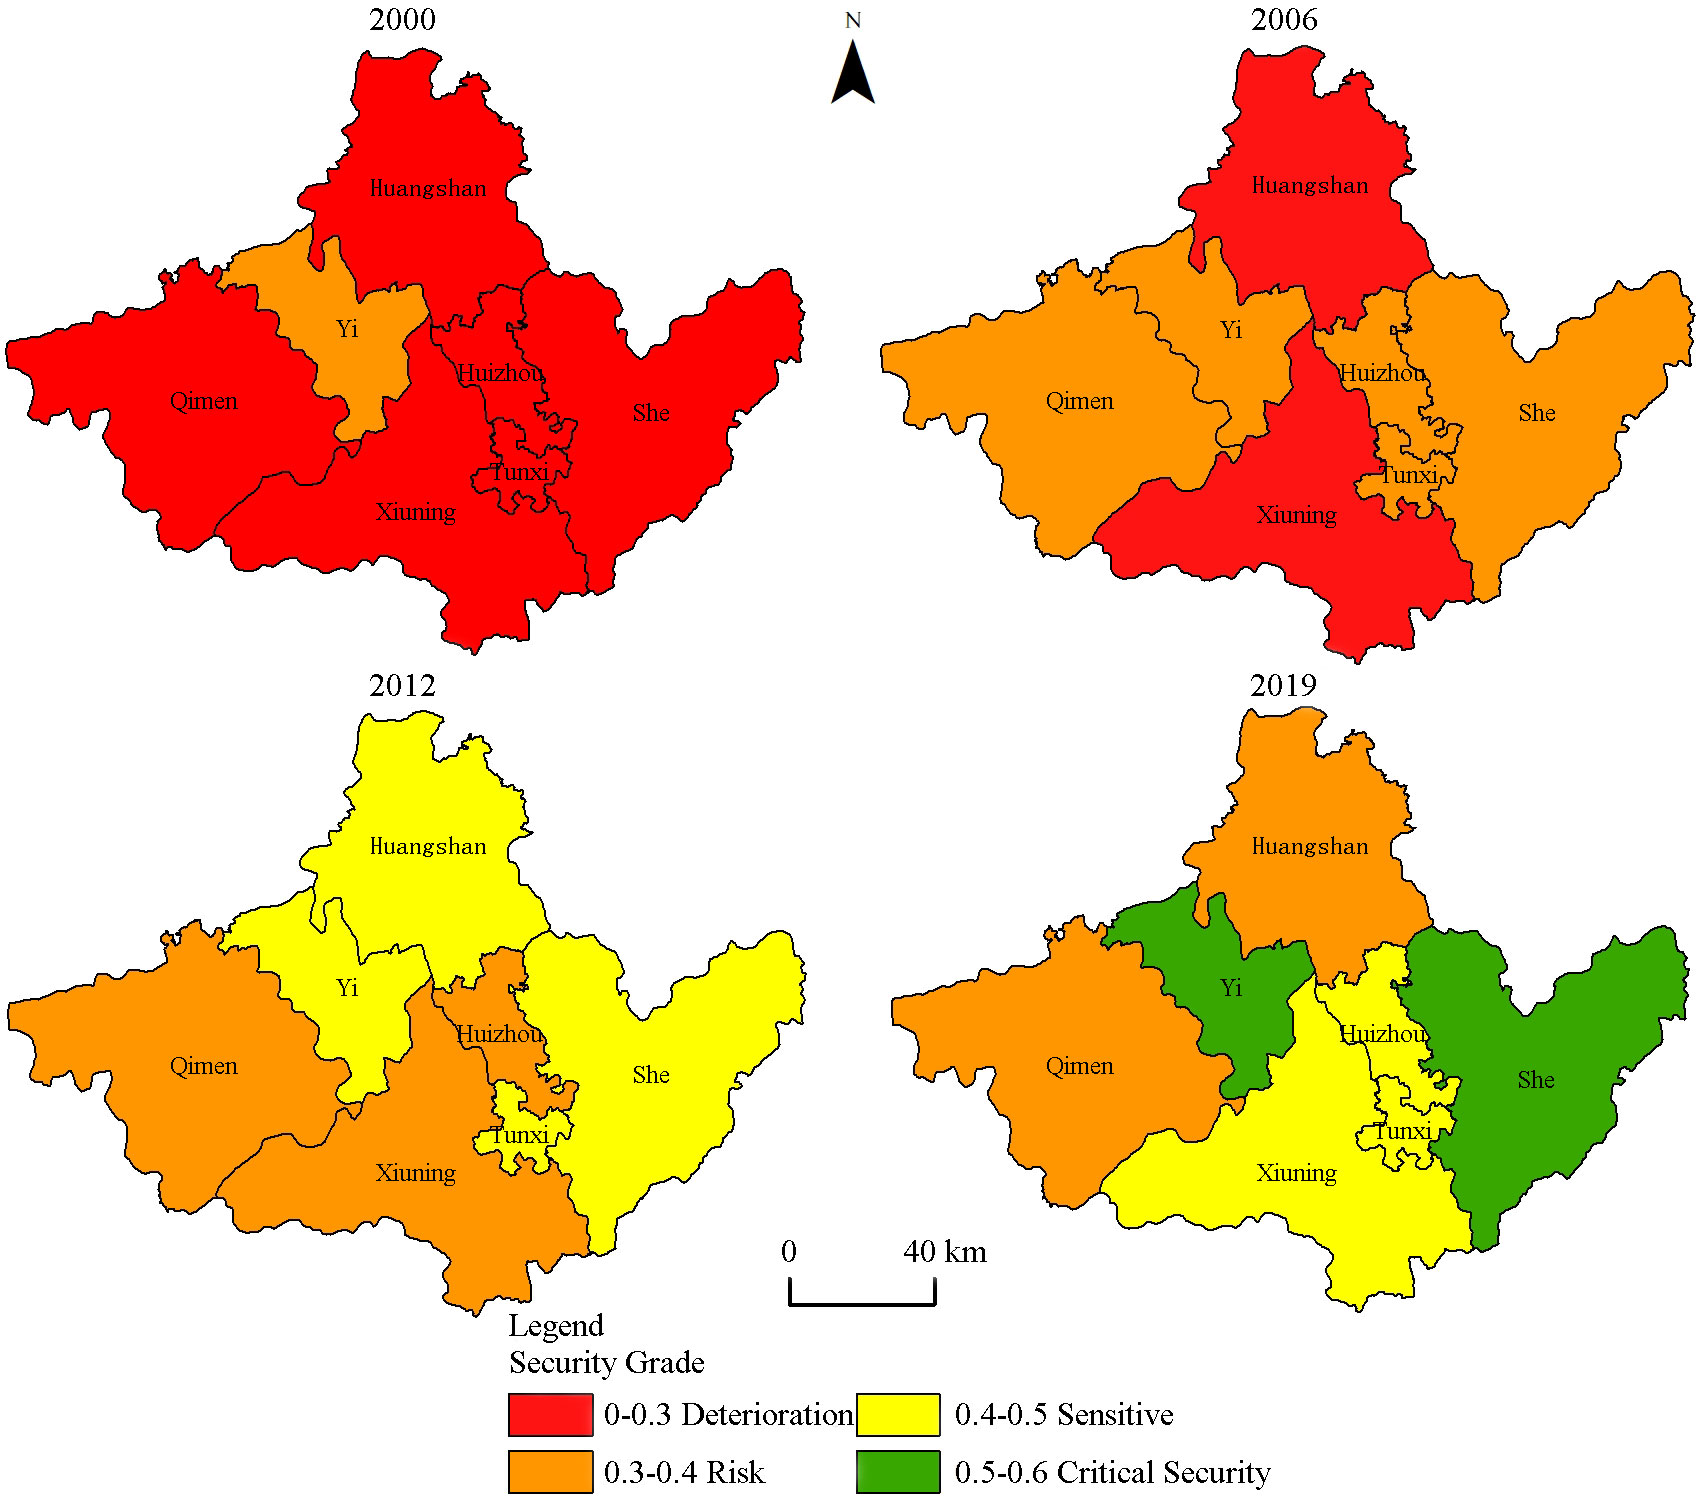
Figure 4 Spatial distribution of tourism ecological security types in Huangshan City.
The comprehensive tourism ecological safety index for Huangshan City and its districts and counties from 2000 to 2019 was analyzed and calculated, showing a steady upward trend in the overall index, with some fluctuations in certain years. However, the gap between the ecological safety indices of various districts and counties is continuously widening, and there are differences in the ecological safety status of each district and county. Specifically, She County, Xiuning County, and Yi County showed steady upward trends, reaching their highest values in 2019. Tunxi District experienced significant declines in 2003–2004 and 2012–2013 but has otherwise steadily increased. Qimen County and Huangshan District steadily increased before 2013–2014 but have since slowly decreased each year. Huizhou District steadily increased before 2011 and has remained stable since then. Sorting the average tourism ecological safety index of each district and county during the study period from the highest to lowest results in the following order: “Yi County (0.413) > She County (0.380) > Tunxi District (0.359) > Huizhou District (0.342) > Qimen County (0.341) > Huangshan District (0.338) > Xiuning County (0.337)”, with Yi County having the highest level of tourism ecological safety. From the perspective of the degree of improvement, the order of each district and county’s tourism ecological safety index increase value and proportion is: “She County (0.214, 72.76%) > Yi County (0.187, 57.98%) > Xiuning County (0.156, 57.37%) > Huizhou district (0.137, 50.23%) > Huangshan district (0.113, 41.63%) > Tunxi district (0.110, 37.02%) > Qimen county (0.093, 32.38%)”. The county had the highest increase in tourism ecological safety level during the study period, with an increase of 0.214 and an average annual growth rate of 2.92%, indicating that the degree and speed of tourism ecological safety optimization were better than those of other districts and counties.
This study examined the dynamic transfer characteristics of tourism ecological security levels among different districts and counties in Huangshan City by constructing traditional and spatial Markov transition matrices. According to the classification criteria of tourism ecological security levels, the ecological security of Huangshan City is divided into four types: deterioration level I (0, 0.3], risk level II (0.3, 0.4], sensitivity level III (0.4, 0.5], and critical safety level IV (0.5, 0.6].
In the Markov transition probability matrix, the diagonal elements represent the probability of a single unit’s tourism ecological security level remaining unchanged, while the off-diagonal elements represent the probability of transition between different tourism ecological security levels. Table 4 illustrates the dynamics of tourism ecological security transfer in Huangshan City from 2000 to 2019, disregarding the geographical spatial pattern. The results indicated that all level types showed convergence and stability, with values on the diagonal being higher than those off the diagonal. The probability of an area belonging to a particular level remaining in that level in subsequent years is at least 60.71%, 78.48%, and 69.23% for levels I, II, and III, respectively, and level-type transfers have a “path-dependent” effect. Additionally, off-diagonal elements indicate that transfers usually occur between adjacent levels, with few cross-level transfers. Finally, the probability of counties in level I remaining unchanged was 60.71%, while the probability of transferring to a higher level was 39.29%. The probability of counties in level II transferring to a higher level was 15.19%, while the probability of transferring to a lower level was 6.33%. Based on Table 4, the research findings suggest that the probability of upgrading Levels I and II tourism ecological security is relatively high, indicating the need for urgent promotion of the upgrading of low-level tourism ecological security regions. However, the probability of level III transferring to a higher level was only 7.69%, whereas the probability of transferring to a lower level was 23.08%. Thus, regions with tourism ecological security level III require attention to prevent them from falling to lower levels, expand their safety level, and guide them toward transforming into a higher safety level.
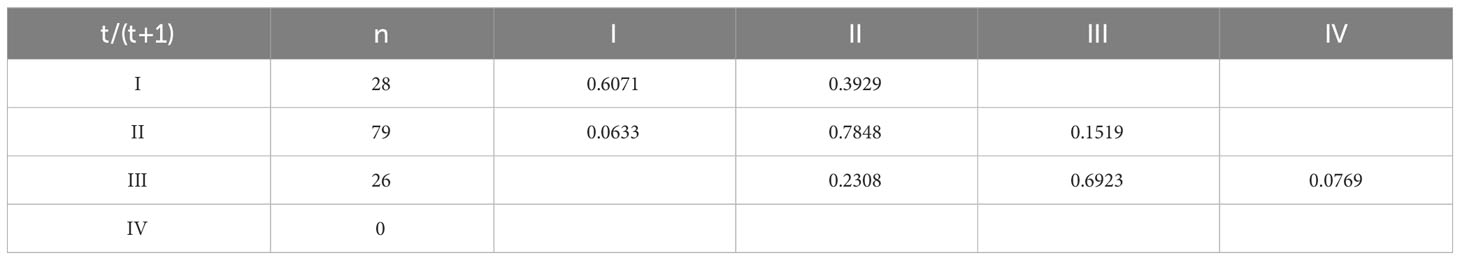
Table 4 Markov transition probability matrix of tourism ecological security types in Huangshan City from 2000 to 2019.
The level of tourism ecological safety is not isolated and is often influenced by changes in the safety level of the surrounding areas, exhibiting certain spatial agglomeration and spatial interaction effects. Compared with traditional Markov models, the traditional spatial Markov probability transition matrix not only reflects changes between different types but also considers the influence of changes in the safety level of neighboring counties on the tourism ecological safety type in the study area (Figure 5). By adding spatial lag terms to the traditional Markov transition probability matrix, we construct a spatial Markov transition probability matrix for tourism ecological safety in Huangshan City. Table 5 shows that compared with the traditional Markov transition matrix, the transition probabilities of tourism ecological safety types in Huangshan City have undergone significant changes under different neighborhood conditions. The neighborhood background plays a significant role in the dynamic changes in ecological safety levels in various districts and counties in Huangshan City, and the types of tourism ecological safety levels under different neighborhood backgrounds exhibit significant differences.
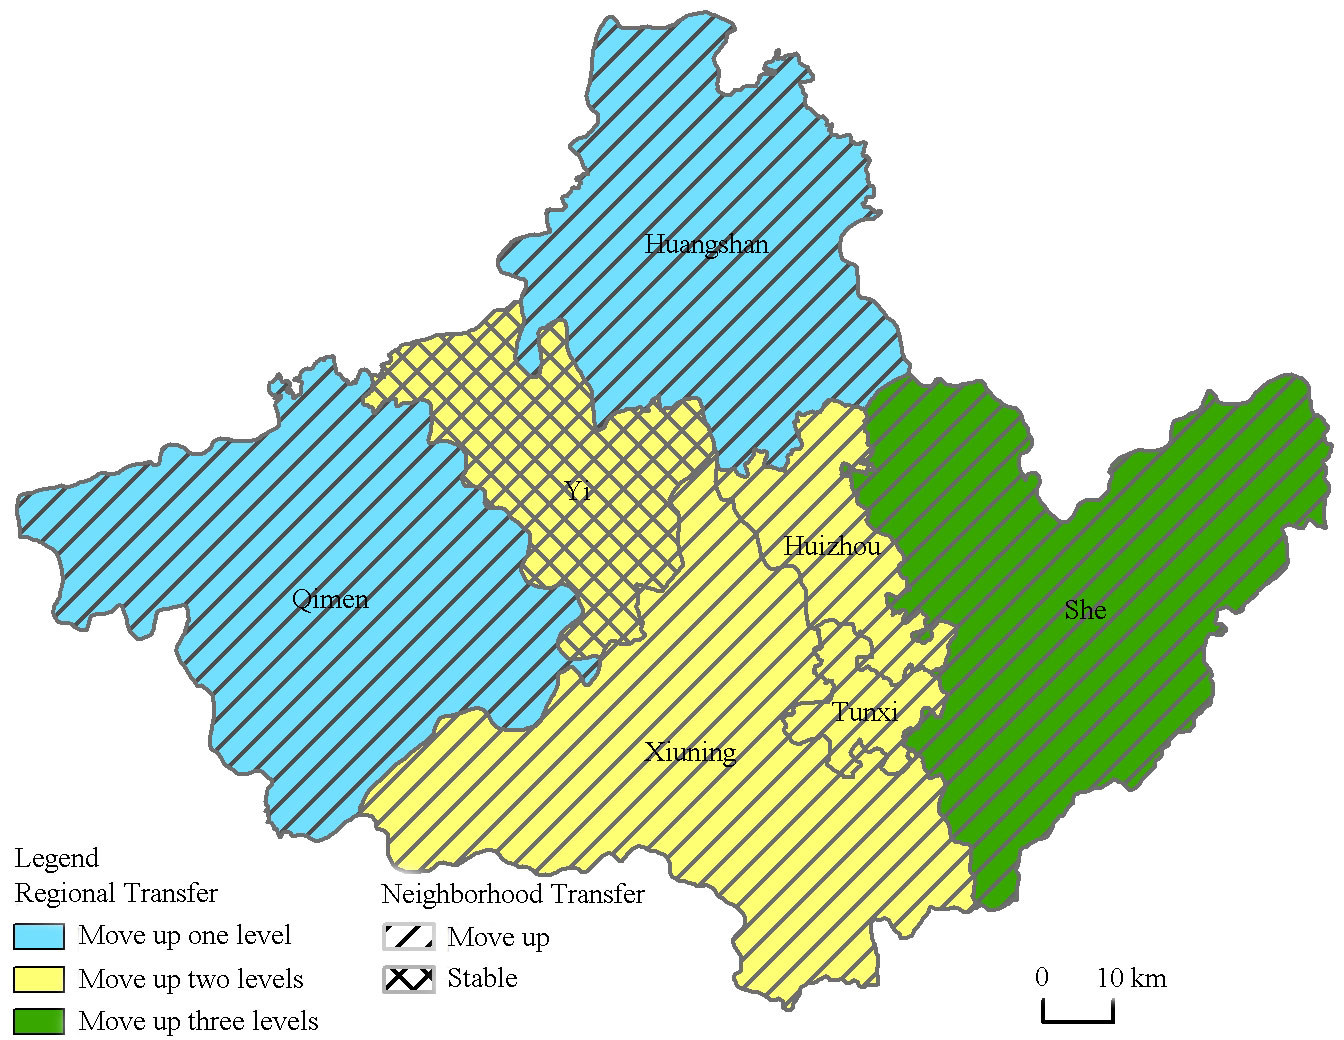
Figure 5 The spatial pattern of the types of tourism ecological security transfer and neighbor transfer types in Huangshan City.
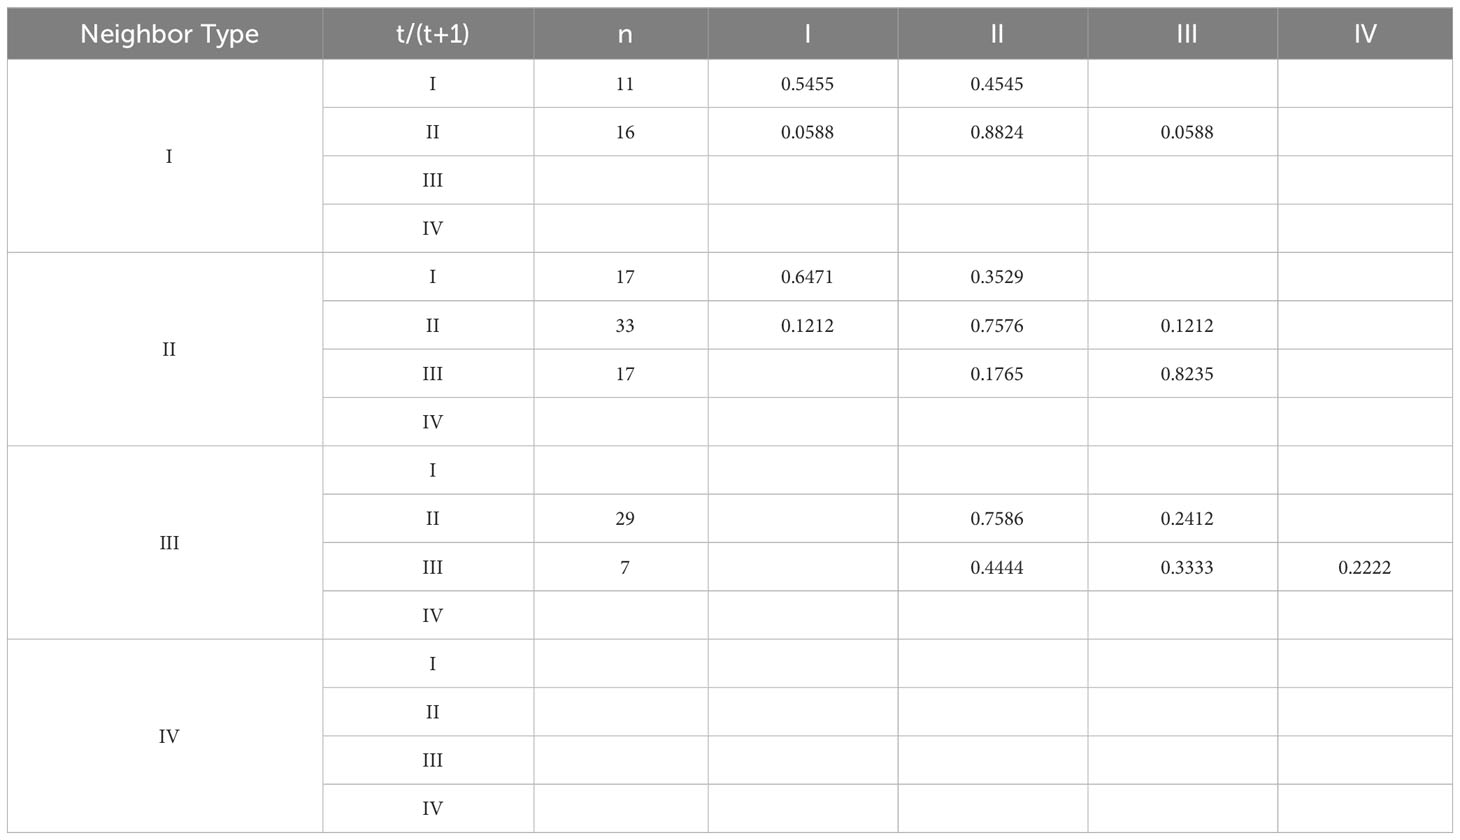
Table 5 Markov transition probability matrix of tourism ecological security type space in Huangshan City from 2000 to 2019.
Generally, if a region has high ecological safety level areas as neighbors, the probability of upward transition will increase and its probability of downward transition will decrease. Conversely, if it has low-level areas as neighbors, the probability of an upward transition decreases, and the probability of a downward transition increases. For example, in the traditional Markov transition probability matrix, the probability of level II transitioning to level III is 15.19%, whereas considering the spatial neighborhood background adjacent to level III, the transition probabilities are 24.12% and 0 when adjacent to levels II and III, respectively. The probability of level III transitioning to level IV was 7.69%. However, when adjacent to level II, the transition probability was 0, whereas it was 22.22% when adjacent to level III. There is a certain degree of “club convergence” phenomenon, and there is a certain spatial inertia in the spatial and temporal changes of each type’s transition probability. For Level II, the probabilities of maintaining itself unchanged when its neighborhood background is Level I, Level II, and Level III are 0.8824, 0.7576, and 0.7586, respectively. For level III, the probabilities of maintaining itself unchanged when its neighborhood background was level II and level III were 0.8235 and 0.3333, respectively.
To explore the influencing factors and driving mechanism of tourism ecological security in Huangshan City, this study chooses the panel quantile regression method for estimation and selects five representative quantile points: 0.1, 0.25, 0.5, 0.75, and 0.9 in the model, these five representative quantile points At the same time, the calculated ordinary OLS regression results are compared with the panel quantile regression results to explore the changes in the elastic coefficients of all influencing factors. To avoid the phenomenon of spurious regression, between panel quantile regression, this paper chooses Levin, Lin, and Chu’s t-test (LLC test), ADF-Fisher Chi-square (ADF test), and PP-Fisher Chi-square (PP test). Three commonly used unit root test methods are used to test the stationarity of panel data. As shown in Table 6, all the variables passed the test at a significance level of 1%.
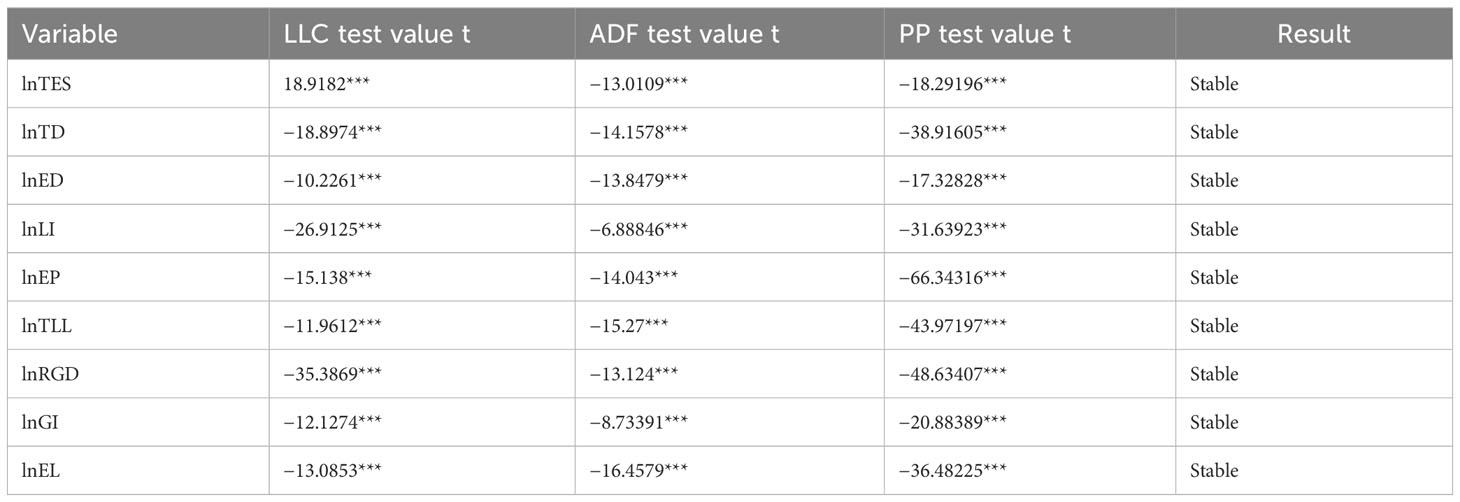
Table 6 Unit root test of panel data.
From the estimation of the panel quantile regression results (Table 6) and its visualization results (Figure 6), environmental pollution factors and economic development levels have a negative inhibitory effect on tourism ecological security in general, while other factors have a significant promotion effect. However, there were significant differences in the sizes of the influence coefficients of each variable at different quantile points.
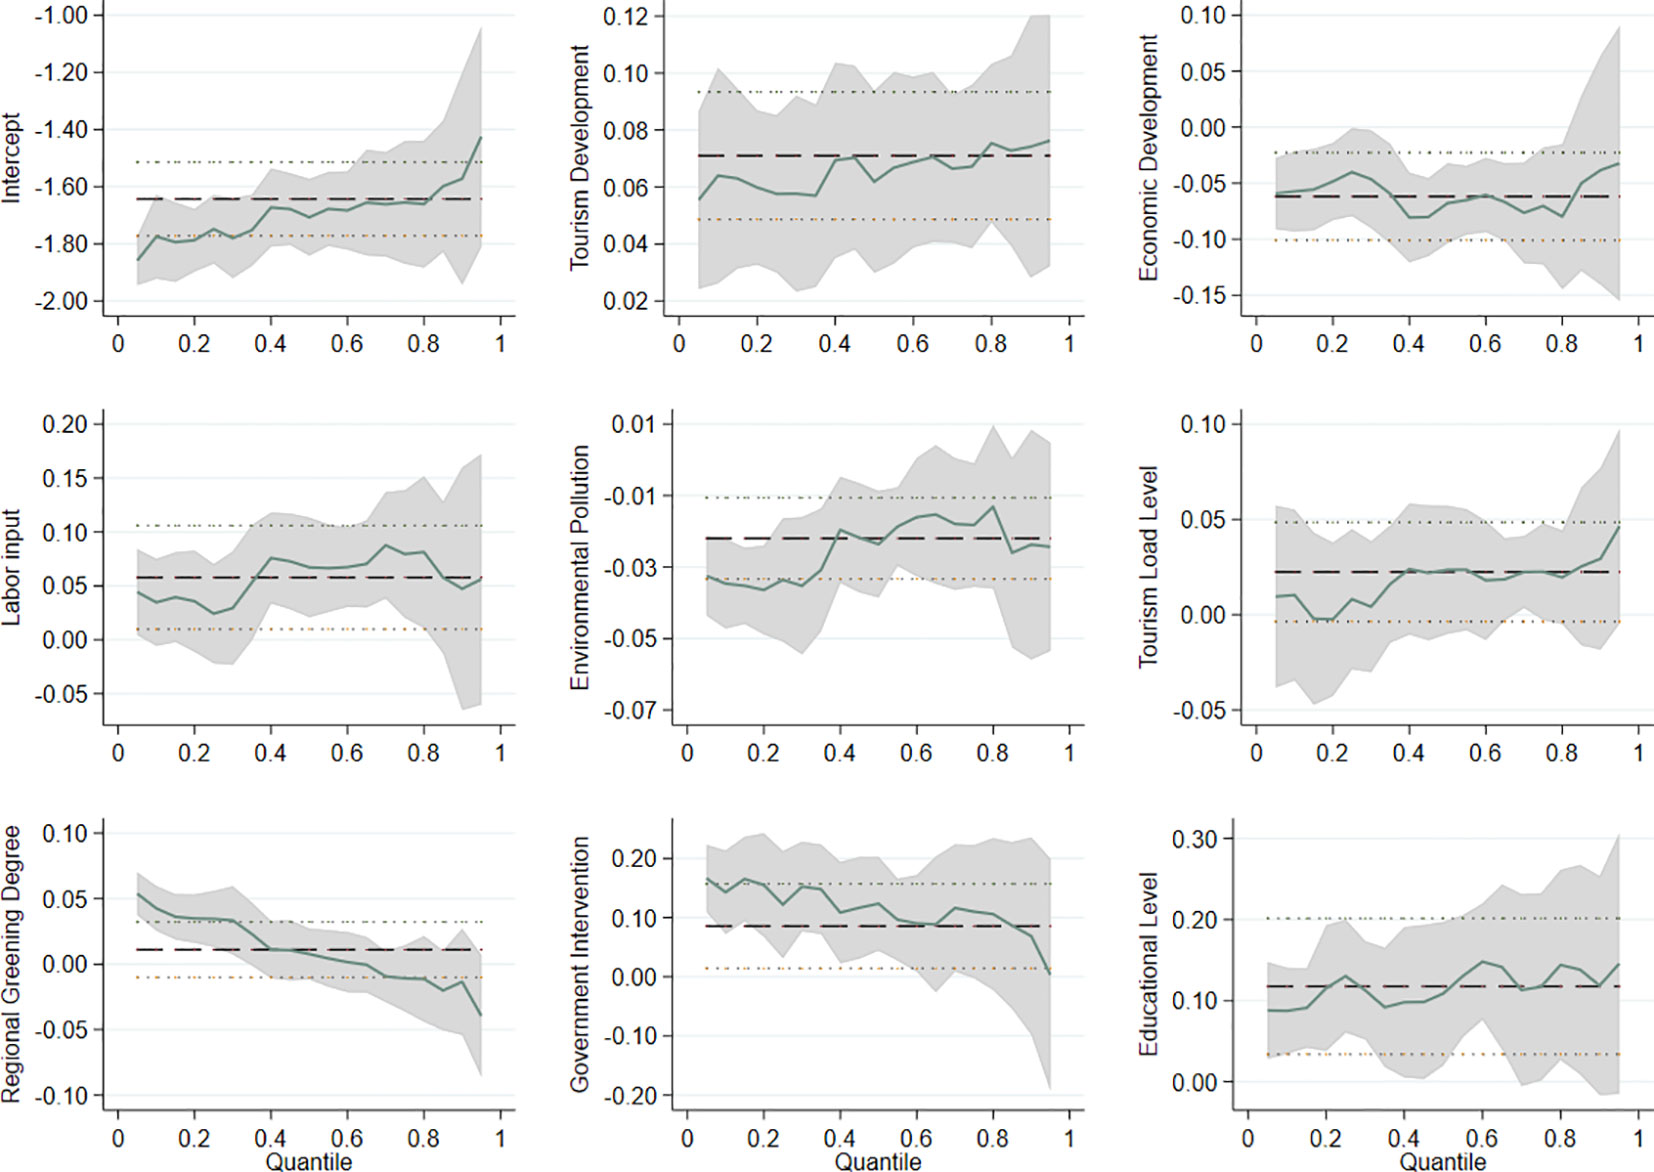
Figure 6 Quantile regression results of tourism ecological security in Huangshan City.
(1) In terms of the change in the impact coefficient of the tourism development level variable, the level of tourism development has a significant effect on the tourism ecological security of Huangshan City at each quantile point and continues to rise as the quantile point, from 0.064 at the 10th percentile point to 0.074 at the 90th percentile point. Owing to low resource consumption, low pollution, and recyclable green characteristics of tourism in the process of promoting economic development, tourism development is an important way to improve the level of tourism ecological security in various regions. (2) The overall economic development level negatively affected the change in the influence coefficient of the economic development level variable. The negative effect increased in the low quantile, decreased in the middle quantile, and gradually approached a positive effect above the 90% quantile. Overall, the higher the level of development, the smaller the negative effect. This shows that we must actively promote high-level and high-quality economic development, develop tourism, optimize and promote the evolution of the industrial structure toward rationalization and advanced development. (3) In terms of the change of the influence coefficient of the labor input variable, the labor input has a significant positive effect on the tourism ecological security, and the influence coefficient at each quantile point presents an inverted “N” trend. The impact coefficient was greater than that of the low quantiles. Tourism is a typical labor-intensive industry that can absorb large amounts of labor. This shows that vigorously developing the tourism industry, promoting the optimization of the labor force structure, increasing the number of people engaged in the tertiary industry, and increasing the proportion of the entire labor force in the station has a positive effect on improving the level of tourism ecological security. (4) In terms of the impact coefficient of environmental pollution variables, environmental pollution has a significantly negative inhibitory effect on the ecological security of tourism. Industrial solid waste, the largest and most important pollutant in Huangshan City, significantly impacts the ecological security of tourism. The estimated coefficient of the upper environmental pollution quantile decreased with an increase in the quantile, indicating that environmental pollution is the main obstacle in low-level tourism ecological security areas, and that strengthening environmental governance is an important measure to improve the safety of regional ecological systems. The negative effect of pollution at higher levels is weaker. This is attributed to the implementation of relevant policies on environmental governance, optimization of the energy structure, and the development of green emission reduction technologies. (5) The change in the impact coefficient of the tourism load level variable has a positive impact effect, and the effect increases from the low quantile point to the high quantile point, indicating that the tourism reception and tourism load of Huangshan City have not yet exceeded the reasonable carrying capacity of the regional tourism environment; however, there is still room to receive more tourists and promote the development of tourism. (6) In terms of the changes in the influence coefficient of the regional greening degree variable, the influence coefficient of the regional greening degree decreases from the low quantile point to the high quantile point, indicating that the greening level of lower-level tourism ecological security units is low, and the resource background is not good. Moreover, the carrying capacity of the tourism industry is limited, and the degree of greening of such units has a greater marginal effect on the improvement of tourism ecological security. At the same time, with improvements in the level of tourism ecological security, all regions must strengthen urban greening construction, and the degree of greening cannot keep pace with the development of tourism which has a negative effect. (7) In terms of changes in the influence coefficient of the government intervention variables, overall government intervention has a positive effect with a large influence coefficient, and the influence coefficient decreases from the low quantile point to the high quantile point. The relatively large influence coefficient of government intervention on the low quantile points indicates that government departments should pay more attention to and strengthen the maintenance and governance of tourism ecological security in low-level areas. At the same time, with the improvement in the level of tourism ecological security, change the government intervention model, increase investment, and be wary that government intervention will not keep pace with the development of tourism. Governments should increase investments in environmental protection funds, strengthen environmental protection publicity, integrate tourism resources, and improve management efficiency which would affect the tourism’s ecological security. (8) In terms of the change in the influence coefficient of the educational level variable, the overall effect was positive and fluctuated upward, and the influence coefficient was relatively large. Residents in areas with high educational levels have a strong awareness of environmental protection, and travel modes tend to be green and low. Carbon can improve the ecological security of tourism. Education levels should be improved, which is important for promoting tourism ecological security in various regions.
This study has important theoretical value for tourism ecological security, including the following points: First, from the perspective of composite ecological system theory and system theory, the interaction between the economy and environment-society subsystems in the tourism ecosystem is clarified. Moreover, the integrity, relevance, hierarchical structure, and dynamic balance of the evaluation system are emphasized. The PSR-EES evaluation index system was used to explore the temporal change and spatial evolution characteristics of tourism ecological security in Huangshan City. This is a follow-up research on ecotourism in tourism cities and has reference value for the evaluation of urban resilience and land security (Wang et al., 2021a).
Second, it explored the spatiotemporal evolution patterns and characteristics of tourism ecological security of tourism cities represented by Huangshan City and the small-scale regional perspectives at the district and county levels. This study not only provides a theoretical basis for the sustainable development of tourism ecology in the future but also makes great contributions to the implementation of policies and the coordinated development of regional tourism. This study not only reveals the characteristics of each grade transfer but also proves that the grade change process is affected by neighborhood grades. This study has theoretical contributions and practical value for the government to formulate policies that focus on the improvement of low-level areas, guard against the decline of high-level areas, promote the coordinated development and system of regional tourism, and improve the ecological security level of the entire tourist city.
Third, it clarifies the key factors of tourism ecological security and the direction and degree of different quantiles, which enriches the research methods for the factors affecting tourism ecological security. This solves the shortcomings of the lack of data verification and reliability in previous studies; only a single time point is calculated, and the direction of the influencing factors is lacking. This method not only measures the influencing factors of the whole period and the entire unit as a whole but also emphasizes the dynamic heterogeneity characteristics and changing trends of the driving factors under the background of different levels of tourism ecological security to better reflect the impact of various factors on tourism ecology. The reality of security impacts will help make policies more scientific and reasonable.
The results of this study will help maintain and improve the level of tourism ecological security and provide targeted improvement policies and suggestions. First, it is necessary to consider the systemic issues of the economy, environment, and society involved in the ecological security of tourism. Government managers should formulate policies to comprehensively promote tourism ecological security (Cernat and Gourdon, 2012), starting from the three levels of economy, environment, and society. It should strengthen restrictions on pressure factors, actively promote the improvement of tourists’ civilized quality and ecological awareness, reduce energy and resource consumption, and at the same time levy taxes on high-polluting industries to reduce pollutant emissions (Liu et al., 2017a); actively improve tourism ecology, strengthen regional greening, improve tourism service level and service quality, and actively promote the development of eco-tourism; take active response measures; strictly implement environmental protection-related policies; vigorously develop low-carbon industries and green industries; and strengthen pollution control (Ahmad et al., 2018), while strengthening spending on environmental protection and education, raising tourists’ awareness of ecotourism, and improving the cultural and professional levels of practitioners (Watson, 2008).
Second, the research results show that although the level of tourism ecological security in the districts and counties of Huangshan City has improved, there is an imbalance in the development of tourism ecological security between districts and counties. Simultaneously, the changes in the ecological security level of each district and county are affected by the neighborhood background. Therefore, the government must treat this phenomenon correctly, strengthen its guiding role, formulate targeted policies for the different development stages of each district and county, and promote the coordination and balance of development in each district and county (Liu, 2003). At the same time, it promotes inter-regional cooperation, giving full play to the leading role of regions with high levels of tourism ecological security such as She County and Huizhou District, each is the highest levels in counties and districts, promoting their governance experience, and providing experience and material support to regions with low levels. Promoting the coordinated development of tourism ecological security in Huangshan City and sustainable tourism development.
Third, the results show that government intervention, education level, and tourism development level have significant positive effects, whereas environmental pollution and economic development level have negative inhibitory effects on tourism ecological security. To promote sustainable development of the tourism industry, the government should actively promote the upgrading of the industrial structure, actively develop the tourism industry, and promote the development of the tourism industry from traditional to sustainable, green, and low-carbon to drive economic development (Ahmad et al., 2018). Large financial, environmental protection, and educational expenditures. Simultaneously, we formulated different strategies for different stages of ecological security levels, increased the degree of regional greening (Nepal et al., 2019), and fiscal expenditures in lower-level areas such as Qimen County and Huangshan District, and focused more on units with higher levels of tourism ecological security transformation and upgrading of the tourism industry, investment in education, and improvement in the overall quality of tourism practitioners.
Although this study draws some conclusions in the analysis of tourism ecological security in Huangshan City, there are still some deficiencies, such as the difficulty in obtaining statistical data on environmental pollution and energy consumption directly caused by tourism. Owing to the difficulty in collecting data from districts and counties, the absence of older data has led to certain limitations in the research results. At the same time, at the data level, data types can be enriched in future research (e.g., satellite remote sensing image data(Sun et al., 2021), especially hyperspectral (HS) data and high spatial resolution (HR) (Sun et al., 2022), tourism flow big data, pollution monitoring site data, tourists’ and residents’ ecological security perception questionnaire data) to further enrich the evaluation of the tourism ecological security index system.
Based on the PSR-SEE model, this study scientifically measures the tourism ecological security index of Huangshan City from 2000 to 2019 and uses the entropy weight method, the improved TOPSIS method, Markov chain, space Markov chain, gray correlation analysis, and other methods to analyze Huangshan. The characteristics and influencing factors of the dynamic evolution of the city’s tourism ecological security were deeply analyzed. The main conclusions are as follows.
During the study period, the average level of tourism ecological security in all districts and counties of Huangshan City was 0.359, and the average index increased from 0.288 in 2000 to 0.432 in 2019, showing a steady upward trend. The ecological security of tourism in Huangshan City lies between deterioration and risk levels. The number of districts and counties gradually decreased. In contrast, the number of sensitive levels and critical safety levels continued to increase. The overall development has been positive; however, there is still great potential for improvement. The ecological security indices of the four counties were generally higher than those of the three districts, and the tourism ecological security index of Yi County ranked first.
In terms of dynamic evolutionary characteristics, the type of transfer of tourism ecological security in Huangshan City has the characteristics of self-stability and path dependence. The transfer of regional tourism ecological security usually occurs sequentially between adjacent levels, and there is a risk of downward transfer. The transfer of tourism ecological security types in Huangshan City does not occur in isolation in geographical space. The neighborhood background plays a very important role in the dynamic change process of ecological security levels in various districts and counties of Huangshan City. There were significant differences in the types of tourism ecological security levels among different neighborhood backgrounds, which played different roles in the transfer of regional ecological security levels. The higher the neighborhood level, the higher the probability of upward transition.
In terms of influencing factors, tourism ecological security in Huangshan City is positively promoted by tourism development level, labor input, tourism load level, regional greening degree, government intervention, and education level. It is negatively affected by environmental pollution and economic development level inhibition. Among them, the negative inhibitory effect of environmental pollution and economic development level on low-level tourism ecological security units was more obvious, and the negative effect decreased with an increase in the tourism ecological security level. The overall positive impact coefficients of government intervention, educational level, and tourism development rank among the top three. The positive coefficients of the degree of regional greening and government intervention on low-level tourism ecological security units are larger, whereas the other indicators have larger impact coefficients on higher-level regions. The research results indicate that optimizing the structure of the above variables and improving the quality of comprehensive development is key to optimizing tourism ecological security in Huangshan City.
The original contributions presented in the study are included in the article/supplementary material. Further inquiries can be directed to the corresponding author.
Conceptualization, JZ and JM; methodology, JM and FS; software, JM, CZ, and TM; writing and original draft preparation, JM; writing—review and editing, JM and JZ; funding acquisition, JZ. All authors contributed to the article and approved the submitted version.
This research was funded by the National Natural Science Foundation of China (NSFC; grant number 42271251).
The authors declare that the research was conducted in the absence of any commercial or financial relationships that could be construed as a potential conflict of interest.
All claims expressed in this article are solely those of the authors and do not necessarily represent those of their affiliated organizations, or those of the publisher, the editors and the reviewers. Any product that may be evaluated in this article, or claim that may be made by its manufacturer, is not guaranteed or endorsed by the publisher.
The Supplementary Material for this article can be found online at: https://www.frontiersin.org/articles/10.3389/fevo.2023.1214741/full#supplementary-material
Ahmad F., Draz M. U., Su L., Ozturk I., Rauf A. (2018). Tourism and environmental pollution: Evidence from the one belt one road provinces of Western China. Sustainability 10 (10), 3520. doi: 10.3390/su10103520
Behzadian M., Otaghsara S. K., Yazdani M., Ignatius J. (2012). A state-of the-art survey of TOPSIS applications. Expert Syst. Appl. 39 (17), 13051–13069. doi: 10.1016/j.eswa.2012.05.056
Cernat L., Gourdon J. (2012). Paths to success: Benchmarking cross-country sustainable tourism. Tourism Manage. 33 (5), 1044–1056. doi: 10.1016/j.tourman.2011.12.007
Chen H., Chen C., Zhang Z., Lu C., Wang L., He X., et al. (2021). Changes of the spatial and temporal characteristics of land-use landscape patterns using multi-temporal Landsat satellite data: A case study of Zhoushan Island, China. Ocean Coast. Manage. 213, 105842. doi: 10.1016/j.ocecoaman.2021.105842
Chen C., Liang J., Yang G., Sun W. (2023). Spatio-temporal distribution of harmful algal blooms and their correlations with marine hydrological elements in offshore areas, China. Ocean Coast. Manage. 238, 106554. doi: 10.1016/j.ocecoaman.2023.106554
Chen M., Zheng L., Zhang D., Li J. (2022). Spatio-temporal evolution and obstacle factors analysis of tourism ecological security in huanggang dabieshan UNESCO global geopark. Int. J. Environ. Res. Public Health 19 (14), 8670. doi: 10.3390/ijerph19148670
Cheng G., Yue X.-P. (2011). Research and prediction of ecological security in Jiangsu province based on the ecological footprint. Asian Agric. Res. 3 (1812-2016-142952), 48–53. doi: 10.13989/j.cnki.0517-6611.2011.20.057
Du Y.-W., Fang J., Wang P. (2021). Ecological security evaluation of marine ranching based on DEMATEL-Fuzzy comprehensive evaluation. Math. Problems Eng. 2021, 1–14. doi: 10.1155/2021/4862451
Fan Y., Fang C. (2020). Evolution process and obstacle factors of ecological security in western China, a case study of Qinghai province. Ecol. Indic. 117, 106659. doi: 10.1016/j.ecolind.2020.106659
Green H., Hunter C. (1992). The environmental impact assessment of tourism development. Environ. Impact Assess. Tourism Dev., 29–47. doi: 10.1080/10425170701350784
Hastings W. K. (1970). Monte Carlo sampling methods using Markov chains and their applications. Biometrika (1), 97–109. doi: 10.1093/biomet/57.1.97
He G., Yu B., Li S., Zhu Y. (2018). Comprehensive evaluation of ecological security in mining area based on PSR–ANP–GRAY. Environ. Technol. 39 (23), 3013–3019. doi: 10.1080/09593330.2017.1371250
Hu H., Zhang J., Wang C., Yu P., Chu G. (2019). What influences tourists’ intention to participate in the Zero Litter Initiative in mountainous tourism areas: A case study of Huangshan National Park, China. Sci. Total Environ. 657, 1127–1137. doi: 10.1016/j.scitotenv.2018.12.114
Huang J. (2008). “Combining entropy weight and TOPSIS method for information system selection,” in 2008 IEEE conference on cybernetics and intelligent systems (Chengdu, China: IEEE), 1281–1284.
Huang Q., Zhang H., Chen J., He M. (2017). Quantile regression models and their applications: A review. J. Biometrics Biostatistics 8 (3), 1–6. doi: 10.4172/2155-6180.1000354
Hwang C. L., Yoon K. P. (1981). Multiple attribute decision making. Methods and applications. A state-of- the-art survey. Eur. J. Operational Res. doi: 10.1007/978-3-642-48318-9
Jurado E. N., Tejada M. T., García F. A., González J. C., Macías R. C., Peña J. D., et al. (2012). Carrying capacity assessment for tourist destinations. Methodology for the creation of synthetic indicators applied in a coastal area. Tourism Manage. 33 (6), 1337–1346. doi: 10.1016/j.tourman.2011.12.017
Kapera I. (2018). Sustainable tourism development efforts by local governments in Poland. Sustain. Cities Soc. 40, 581–588. doi: 10.1016/j.scs.2018.05.001
Kenneth B. (1956). General systems theory-the skeleton of science. Manage. Sci. 2 (3), 197–208. doi: 10.1287/mnsc.2.3.197
Koenker R. (1994). “Confidence intervals for regression quantiles,” in Asymptotic statistics: proceedings of the fifth prague symposium, September 4–9, 1993. (Springer), 349–359.
Koenker R., Bassett J. (1978). Regression quantiles. Econometrica: J. Econometric Soc. 46 (1), 33–50. doi: 10.2307/1913643
Koenker R., Hallock K. F. (2001). Quantile regression. J. Economic Perspect. 15 (4), 143–156. doi: 10.1257/jep.15.4.143
Leung Y.-F. (2001). Environmental impacts of tourism at China’s World Heritage sites: Huangshan and Chengde. Tourism Recreation Res. 26 (1), 117–122. doi: 10.1080/02508281.2001.11081186
Li J.-X., Chen Y.-N., Xu C.-C., Li Z. (2019). Evaluation and analysis of ecological security in arid areas of Central Asia based on the emergy ecological footprint (EEF) model. J. Cleaner Prod 235, 664–677. doi: 10.1016/j.jclepro.2019.07.005
Li Y., Liu Y., Yan X. (2012). A DPSIR-based indicator system for ecological security assessment at the basin scale. Acta Scientiarum Naturalium Universitatis Pekinensis 48 (6), 971–981. doi: 10.1007/s11783-011-0280-z
Li X., Wu L., Wu Q., Zhou Y. (2017a). Evaluation on tourism ecological security and diagnosis of its obstacle indictators in China. Ecol. Econ 33 (6) 90–95. doi: 1671-4407(2017)06-090-06
Li X., Wu Q., Zhou Y. (2017b). Spatio-temporal pattern and spatial effect of chinese provincial tourism eco-security. Economic Geogr. 37 (3), 210–217.
Lin L. (1997). A study on the life cycle of mountain resorts: A case study of Huangshan Mountain and Jiuhuashan Mountain. Sci Geographica Sin. 17 (1), 63–69. doi: 10.13249/j.cnki.sgs.1997.01.009
Liu Z. (2003). Sustainable tourism development: A critique. J. Sustain. Tourism 11 (6), 459–475. doi: 10.1080/09669580308667216
Liu J., Dietz T., Carpenter S. R., Alberti M., Folke C., Moran E., et al. (2007). Complexity of coupled human and natural systems. Science 317 (5844), 1513–1516. doi: 10.1126/science.1144004
Liu Y., Kong F., Gonzalez E. D. S. (2017b). Dumping, waste management and ecological security: Evidence from England. J. Cleaner Prod 167, 1425–1437. doi: 10.1016/j.jclepro.2016.12.097
Liu C., Wang C., Li Y., Wang Y. (2022). Spatiotemporal differentiation and geographic detection mechanism of ecological security in Chongqing, China. Global Ecol. Conserv. 35, e02072. doi: 10.1016/j.gecco.2022.e02072
Liu X., Yang Z., Di F., Chen X. (2009). Evaluation on tourism ecological security in nature heritage sites—Case of Kanas nature reserve of Xinjiang, China. Chin. Geographical Sci. 19, 265–273. doi: 10.1007/s11769-009-0265-z
Liu D., Yin Z. (2022). Spatial-temporal pattern evolution and mechanism model of tourism ecological security in China. Ecol. Indic. 139, 108933. doi: 10.1016/j.ecolind.2022.108933
Liu J., Zhang J., Fu Z. (2017a). Tourism eco-efficiency of Chinese coastal cities–Analysis based on the DEA-Tobit model. Ocean Coast. Manage. 148, 164–170. doi: 10.1016/j.ocecoaman.2017.08.003
Lu J., Chen T., Liu L. (2008). Analysis about ecological security system of regiontourismdevelopmentdtaking” gegentala grassland tourist center of siziwang banner of inner Mongolia” as an example. Prog. Geogr. 27 (2), 80–88. doi: 10.11820/dlkxjz.2008.02.011
Lu X., Yao S., Fu G., Lv X., Mao Y. (2019). Dynamic simulation test of a model of ecological system security for a coastal tourist city. J. Destination Marketing Manage. 13, 73–82. doi: 10.1016/j.jdmm.2019.05.004
Lv J. (2007). The origin of tourism ecological security thought and its safety state diagnosis. J. Inner Mongolia Univ. Finance Economics 5, 35–38. doi: 10.3969/j.issn.1004-5295.2007.05.008
Malekmohammadi B., Jahanishakib F. (2017). Vulnerability assessment of wetland landscape ecosystem services using driver-pressure-state-impact-response (DPSIR) model. Ecol. Indic. 82, 293–303. doi: 10.1016/j.ecolind.2017.06.060
McCool S. F. (1994). Planning for sustainable nature dependent tourism development: The limits of acceptable change system. Tourism recreation Res. 19 (2), 51–55. doi: 10.1080/02508281.1994.11014708
Mou N., Yuan R., Yang T., Zhang H., Tang J. J., Makkonen T. (2020). Exploring spatio-temporal changes of city inbound tourism flow: The case of Shanghai, China. Tourism Manage. 76, 103955. doi: 10.1016/j.tourman.2019.103955
Mu X., Guo X., Ming Q., Hu C. (2022). Dynamic evolution characteristics and driving factors of tourism ecological security in the Yellow River Basin. Acta Geogr. Sin. 77, 714–735. doi: 10.11821/dlxb202203015
Nepal R., Al Irsyad M. I., Nepal S. K. (2019). Tourist arrivals, energy consumption and pollutant emissions in a developing economy–implications for sustainable tourism. Tourism Manage. 72, 145–154. doi: 10.1016/j.tourman.2018.08.025
O’Reilly A. M. (1986). Tourism carrying capacity: Concept and issues. Tourism Manage. 7 (4), 254–258. doi: 10.1016/0261-5177(86)90035-X
Peng H., Zhang J., Lu L., Tang G., Yan B., Xiao X., et al. (2017). Eco-efficiency and its determinants at a tourism destination: A case study of Huangshan National Park, China. Tourism Manage. 60, 201–211. doi: 10.1016/j.tourman.2016.12.005
Qian J., Shen H., Law R. (2018). Research in sustainable tourism: A longitudinal study of articles between 2008 and 2017. Sustainability 10 (3), 590. doi: 10.3390/su10030590
Qin X., Cheng Y. (2019). Evaluation and type classification on Chinese tourist urban ecological security system: Based on the network DEA model with node weight. Sci Geographica Sin. 39 (1), 156–163. doi: 10.13249/j.cnki.sgs.2019.01.018
Qin X., Sun F., Yuan W. (2019). Research on action mechanism of ecological security system of Chinese tourist cities: Based on the combination of PLS model with SD model. China Population Resour. Environ. 29 (7), 31–40.
Roberts G. O., Rosenthal J. S. (2004). General state space Markov chains and MCMC algorithms. Probability Surveys 1 (1), 20–71. doi: 10.1214/154957804100000024
Ruan W., Li Y., Zhang S., Liu C.-H. (2019). Evaluation and drive mechanism of tourism ecological security based on the DPSIR-DEA model. Tourism Manage. 75, 609–625. doi: 10.1016/j.tourman.2019.06.021
Scott D. (2006). Global environmental change and mountain tourism. Tourism Global Environ. Change 54, 75. doi: 10.4324/9780203011911-4
Shi F., Weaver D., Zhao Y., Huang M.-F., Tang C., Liu Y. (2019). Toward an ecological civilization: Mass comprehensive ecotourism indications among domestic visitors to a Chinese wetland protected area. Tourism Manage. 70, 59–68. doi: 10.1016/j.tourman.2018.07.011
Song L., Hui J., Yunfeng C. (2013). A study on the spatial travel behavior of self-driving tourists into Huangshan City. Geographical Res. 32 (1), 179–190. doi: 10.11821/yj2013010018
Sun W., Liu K., Ren G., Liu W., Yang G., Meng X., et al. (2021). A simple and effective spectral-spatial method for mapping large-scale coastal wetlands using China ZY1-02D satellite hyperspectral images. Int. J. Appl. Earth Observation Geoinformation 104, 102572. doi: 10.1016/j.jag.2021.102572
Sun W., Ren K., Meng X., Yang G., Xiao C., Peng J., et al. (2022). MLR-DBPFN: A multi-scale low rank deep back projection fusion network for anti-noise hyperspectral and multispectral image fusion. IEEE Trans. Geosci. Remote Sens. 60, 1–14. doi: 10.1109/TGRS.2022.3146296
Tang C., Wu X., Zheng Q., Lyu N. (2018). Ecological security evaluations of the tourism industry in Ecological Conservation Development Areas: A case study of Beijing’s ECDA. J. Cleaner Production 197, 999–1010. doi: 10.1016/j.jclepro.2018.06.232
Tang C., Zhong L., Fan W., Cheng S. (2015). “Energy consumption and carbon emission for tourism transport in W orld H eritage S ites: a case of the W ulingyuan area in China,” in Natural Resources Forum (Wiley Online Library), 134–150.
Tao H., Liu J.-M., Deng Y., Du A. (2017). Tourism sectorization opportunity spectrum model and space partition of tourism urbanization area: a case of the Mayangxi ecotourism area, Fujian province, China. J. Mountain Sci. 14, 595–608. doi: 10.1007/s11629-015-3747-8
Wang Z., Chen Q. (2021). Spatio-temporal pattern evolution and trend prediction of tourism ecological security in the Yangtze River Economic Belt since 1998. J. Ecol. 41, 320–332. doi: 10.1007/S11356-020-12021-2
Wang L., Chen C., Xie F., Hu Z., Zhang Z., Chen H., et al. (2021a). Estimation of the value of regional ecosystem services of an archipelago using satellite remote sensing technology: A case study of Zhoushan Archipelago, China. Int. J. Appl. Earth Observation Geoinformation 105, 102616. doi: 10.1016/j.jag.2021.102616
Wang N., Li S., Kang Q., Wang Y. (2021c) Exploring the Land Ecological Security and its Spatiotemporal Changes in the Yangtze River Economic Belt of China 2000-2020. doi: 10.1016/j.jag.2021.102572
Wang S., Sun C., Li X., Zou W. (2016). Sustainable development in China’s coastal area: based on the driver-pressure-state-welfare-response framework and the data envelopment analysis model. Sustainability 8 (9), 958. doi: 10.3390/su8090958
Wang Y., Wu C., Wang F., Sun Q., Wang X., Guo S. (2021b). Comprehensive evaluation and prediction of tourism ecological security in droughty area national parks—a case study of Qilian Mountain of Zhangye section, China. Environ. Sci. pollut. Res. 28, 16816–16829. doi: 10.1007/s11356-020-12021-2
Watson S. (2008). Where are we now? A review of management development issues in the hospitality and tourism sector: Implications for talent management. Int. J. Contemp. Hospitality Manage. Vol 20 (7), 758–780. doi: 10.1108/09596110810897592
Williams P. W., Ponsford I. F. (2009). Confronting tourism’s environmental paradox: Transitioning for sustainable tourism. Futures 41 (6), 396–404. doi: 10.1016/j.futures.2008.11.019
Wolfslehner B., Vacik H. (2008). Evaluating sustainable forest management strategies with the Analytic Network Process in a Pressure-State-Response framework. J. Environ. Manage. 88 (1), 1–10. doi: 10.1016/j.jenvman.2007.01.027
Xiao J., Yu Q., Liu K., Chen D., Chen J., Xiao J. (2011). Evaluation of the ecological security of island tourist destination and island tourist sustainable development: A case study of Zhoushan Islands. Acta Geogr. Sin. 66, 842–852. doi: 10.11821/xb201106013
Xiaobin M., Biao S., Guolin H., Xing Z., Li L. (2021). Evaluation and spatial effects of tourism ecological security in the Yangtze River Delta. Ecol. Indic. 131, 108190. doi: 10.1016/j.ecolind.2021.108190
Xie X., Zhang L., Sun H., Chen F., Zhou C. (2021). Spatiotemporal difference characteristics and influencing factors of tourism urbanization in China’s major tourist cities. Int. J. Environ. Res. Public Health 18 (19), 10414. doi: 10.3390/IJERPH181910414
Xu M., Liu C. (2018). Tourism ecological security evaluation and obstacle factors analysis of Zhangjiajie. Resour. Environ. Yangtze Basin 27 (3), 605–614. doi: 10.11870/cjlyzyyhj201803016
Xu M., Liu C., Li D., Zhong X. L. (2017). Tourism ecological security early warning of Zhangjiajie, China based on the improved TOPSIS method and the grey GM (1, 1) model. J. Appl. Ecol. 28 (11), 3731–3739. doi: 10.13287/j.1001-9332.201711.017
Yajuan L., Tian C., Jing H., Jing W. (2013). Tourism ecological security in Wuhan. J. Resour. Ecol. 4 (2), 149–156. doi: 10.5814/j.issn.1674-764x.2013.02.007
Yang L., Cao K. (2021). Spatiotemporal pattern and driving mechanism of tourism ecological security in 85 counties and cities of Xinjiang. Acta Ecol Sin. 41 (23), 9239–9252. doi: 10.5846/stxb202008052042
Yu P., Zhang J., Wang Y., Wang C., Zhang H. (2020). Can tourism development enhance livelihood capitals of rural households? Evidence from Huangshan National Park adjacent communities, China. Sci. Total Environ. 748, 141099. doi: 10.1016/j.scitotenv.2020.141099
Zhang R., Li P., Xu L. (2022). Evaluation and analysis of ecological security based on the improved three-dimensional ecological footprint in Shaanxi Province, China. Ecol. Indic. 144, 109483. doi: 10.1016/j.ecolind.2022.109483
Zhang J., Zhang J., Wang Q. (2008). Measuring the ecological security of tourist destination: Methodology and a case study of Jiuzhaigou. Geographical Res. 27 (2), 449–458. doi: 10.3321/j.issn:1000-0585.2008.02.022
Zhao J., Guo H. (2022). Spatial and temporal evolution of tourism ecological security in the old revolutionary region of the Dabie Mountains from 2001 to 2020. Sustainability 14 (17), 10762. doi: 10.3390/su141710762
Zheng Y., Xue F., Zhang Z. (2015). Ecological security measurement using the IRDS model in forest scenic spots. Resour. Sci. 37 (12), 2350–2361.
Zheng X., Yang Z., Zhang X., Wang T., Chen X., Wang C. (2023). Spatiotemporal evolution and influencing factors of provincial tourism ecological security in China. Ecol. Indic. 148, 110114. doi: 10.1016/j.ecolind.2023.110114
Zhou B.-z., Yang H., Bao H.-S., Zhao Q.-G., Zhou S.-L. (2002). PSR model and its application in the evaluation of sustainable land-use in the region. J. Nat. Resour 5, 541–548. doi: 10.1007/s11769-002-0038-4
Zhou B., Yu H., Zhong L., Chen T. (2016). Developmental trend forecasting of tourism ecological security trends: The case of Mount Putuo Island. Acta Ecol. Sin. 36 (23), 7792–7803. doi: 10.5846/stxb201510232147
Keywords: tourism ecological security (TES), dynamic evolution characteristics, spatial Markov chains, panel quantile regression, Huangshan City
Citation: Ma J, Zhang J, Sun F, Zou C and Ma T (2023) Spatial-temporal pattern and influencing factors of tourism ecological security in Huangshan City. Front. Ecol. Evol. 11:1214741. doi: 10.3389/fevo.2023.1214741
Received: 30 April 2023; Accepted: 16 October 2023;
Published: 10 November 2023.
Edited by:
Wei Song, Chinese Academy of Sciences (CAS), ChinaReviewed by:
Chao Chen, Suzhou University of Science and Technology, ChinaCopyright © 2023 Ma, Zhang, Sun, Zou and Ma. This is an open-access article distributed under the terms of the Creative Commons Attribution License (CC BY). The use, distribution or reproduction in other forums is permitted, provided the original author(s) and the copyright owner(s) are credited and that the original publication in this journal is cited, in accordance with accepted academic practice. No use, distribution or reproduction is permitted which does not comply with these terms.
*Correspondence: Jinhe Zhang, emhhbmdqaW5oZUBuanUuZWR1LmNu
Disclaimer: All claims expressed in this article are solely those of the authors and do not necessarily represent those of their affiliated organizations, or those of the publisher, the editors and the reviewers. Any product that may be evaluated in this article or claim that may be made by its manufacturer is not guaranteed or endorsed by the publisher.
Research integrity at Frontiers
Learn more about the work of our research integrity team to safeguard the quality of each article we publish.