 Jun Zhang1*
 Xuan Zhang2
- 1WuShu College, Shandong Sport University, Rizhao, China
- 2Department of Computer Science, University of Pennsylvania, Philadelphia, PA, United States
Introduction: In sports competitions, using energy-saving and emission-reduction measures is an important means to achieve the carbon neutrality goal.
Methods: In this paper, we propose an attention mechanism-based convolutional neural network (CNN) combined with the gated recurrent unit (GRU) for carbon neutral energy saving and emission reduction prediction model in sports competitions, CNN is a feedforward neural network whose input is a two-dimensional matrix. The main feature of CNN is that it can handle multi-channel input data, and the use of GRU can make the model structure simple and largely reduce The use of GRU can make the model structure simple, which largely reduces the hardware computational power and time cost and also better solves the long dependency problem in RNN networks. CNN-GRU extracts the data for features and then optimized by the attention mechanism.
Results: The model collects real-time carbon emissions data from sports events, including game times, lighting usage, air conditioning emissions and other carbon emissions data, and uses deep learning algorithms to predict and compare carbon emissions from sports competition.
Discussion: In identifying energy saving and emission reduction measures conducive to the realization of the goal of carbon neutral sports events, the model has a certain reference value for realizing energy saving and emission reduction in sports competitions under carbon neutrality goals.
1 Introduction
With the application of various technologies in sports competitions, the carbon emissions generated by big sports competitions are increasing (Ning et al., 2023). In sports competitions, adopting energy-saving and emission reduction measure schemes is an important means to achieve the carbon neutrality goal, which not only helps reduce the organizers’ resource consumption but also achieves the carbon neutrality goal. Since the previous algorithms of deep learning technology cannot handle the relationship between data very well, especially the research on sports events with multiple influencing factors, and the calculation of data cannot be performed well, and with the iteration of deep learning technology, in The data prediction of energy-saving and emission-reduction measures has better performance than traditional linear and machine learning models. Therefore, this paper proposes a fusion model: the CNN-GRU model based on the attention mechanism, so as to be used in the research of energy-saving and emission-reduction schemes for sports events. The CNN-GRU-AM model we proposed can fully mine the features in time series data and extract multi-scale and multi-time domain feature information, so it can improve the modeling accuracy of the model. In the study of energy saving and emission reduction programs for sports events, the relationship between multiple variables and the analysis and modeling of historical game data can be processed to better predict the interaction between various indicators, and use this to predict The benefits of energy saving and emission reduction programs; the most important thing is that it can process time series data in real time and make predictions quickly, so the research results can be displayed in real time. The main methods commonly used in carbon-neutral research are statistical methods, machine learning algorithms, reinforcement learning algorithms, and deep learning algorithms:
Statistical model is a model that uses statistical methods to model and predict data, and is often used in climate change simulation, carbon sink assessment and other fields (Ran et al., 2023). Common statistical methods include time series analysis, spatial statistical analysis, regression analysis, etc. The advantages of this model are as follows: first, it can improve the interpretability of the model through the interpretation of formulas and parameters, so as to better understand the change law of data and predict the results; second, statistical models are usually based on simple mathematical formulas and Statistical methods do not require a large amount of data, so the data requirements are relatively low, and it is easier to understand and apply. However, in the study of energy-saving and emission-reduction schemes for sports events, statistical models can be used to analyze and predict energy-saving and emission-reduction indicators of competitions, such as energy consumption and carbon emissions during competitions. But its disadvantages are also obvious: statistical models are usually based on linear relationships, and the ability to model nonlinear relationships is weak. In sports events, indicators such as energy consumption and carbon emissions may have a nonlinear relationship, so statistical models may not be able to handle these indicators well. In addition, statistical methods have limitations and cannot fully reflect the research on carbon neutrality, complexity and variety (Ning et al., 2020).
A machine learning algorithm is an algorithm that uses computers to automatically learn patterns in data, classify and make predictions. It is often used in carbon emission prediction, energy management, climate change simulation and fields (He and Ye, 2022). Common models such as decision tree (Decision Tree), support vector machine (SVM), linear regression, etc. The advantage of this model is that it can process large-scale data, including nonlinear data and high-dimensional data, and improve the accuracy and efficiency of data analysis; it can automatically extract features from data, thereby reducing the work of manual feature engineering Quantity, and machine learning algorithms can help improve the modeling accuracy of the model by learning the patterns and characteristics of the data. But the disadvantage is that the realization of carbon neutrality goals in sports events is affected by many factors, and machine learning algorithms are usually presented in the form of black boxes, making it difficult to explain the prediction results of the model and the importance of features. Therefore, machine learning algorithms may not be suitable and machine learning algorithms require a large amount of high-quality data for training and testing (Hussain and Lee, 2022). If the data quality is poor or insufficient, the accuracy and predictive ability of the algorithm will be affected (Zhang et al., 2023).
The reinforcement learning algorithm is an algorithm that learns the optimal strategy through the interaction between the agent and the environment, and is often used in energy management, carbon emission control and other fields. Common reinforcement learning algorithms include Q-learning, policy gradient, etc. (Zhao et al., 2022). The model can handle dynamic and uncertain environments, and can learn optimal strategies in unknown or complex environments, so it can be applied to variable and complex problems in carbon neutrality research. At the same time, it can learn and optimize strategies independently to improve the intelligence and adaptability of carbon neutral decision-making. But the disadvantage is that the reinforcement learning algorithm usually requires a lot of time and computing resources for training and optimization, and the experimental conditions of some carbon neutral research problems may be limited, which may affect the efficiency and feasibility of the algorithm; and the reinforcement learning algorithm in the learning process There may be a problem of over-exploration in the game, resulting in low learning efficiency. In sports events, over-exploration may affect the energy-saving and emission-reduction effects of the game, so a reasonable exploration strategy design is required (Zhang et al., 2019).
Deep learning algorithms are a neural network-based learning method with excellent feature learning and representation learning capabilities and are commonly used in areas such as image recognition, natural language processing, and climate simulation. Common deep learning algorithms include deep recurrent neural networks (RNN), generative adversarial networks (GAN) (Shen et al., 2017), and bi-directional long and short-term memory neural networks (BiLSTM) (Shen et al., 2018), which learn from large amounts of data by automatically extracting data. The advantage of this model is that deep learning algorithms can handle large amounts of data and can learn nonlinear relationships between data, thus achieving higher accuracy in predicting carbon emissions. At the same time, deep learning algorithms can learn features automatically, allowing the algorithm to automatically find patterns and patterns in the data. However, the disadvantage is that its training time is long and its interpretability is poor, making it difficult to convince.
Based on the advantages and disadvantages of the above models, a convolutional neural network (CNN) and recurrent gated unit (GRU) prediction model based on the attention mechanism is proposed in this paper. As the first layer of the model, CNN can perform convolution operations on the input data to extract features with strong local correlation. These features play an important role in the classification or prediction tasks of sequence data. As the second layer of the model, GRU can model sequence data and solve the long-term dependency problem in sequence data. As the third layer of the model, AM can pay attention to the important parts of the sequence data and improve the model’s ability to understand the data and accuracy.
● The ability to deal with non-linear relationships that cannot be handled by statistical methods, and its scope of application is broader than that of statistical methods;
● The model is more capable of learning and more reliable and interpretable than machine learning models such as decision trees and support vector machines;
● Compared with deep learning algorithms such as RNN, GAN, and BiLSTM models, GRU models instead of LSTM models have a simple structure, can process data more quickly, and incorporates an attention mechanism to improve their prediction accuracy further.
The rest of the paper presents recent related work in Section 2. Section III presents our proposed approach: overview, convolutional neural network (CNN); gated recurrent unit (GRU); attention mechanism (Gui-xiang et al., 2018). Section IV presents the experimental part, including experimental details, experimental group comparison, etc. The fifth section concludes.
2 Related work
2.1 ARIMA model
ARIMA model is a forecasting model based on the analysis of time series (Han and Fu, 2023). The parameters of the ARIMA model can be obtained by analyzing the autocorrelation and partial autocorrelation functions of the time series to predict future time series values. The ARIMA model consists of three components: autoregression (AR), the difference (I) and moving average (MA)(Yang et al., 2023). The general steps of the ARIMA model include time series Visualization and preliminary analysis performed to determine whether differencing and smoothing are required. For the smoothed time series, the parameters of the ARIMA model are determined through the analysis of autocorrelation and partial autocorrelation functions, as well as the evaluation and optimization of the model type. The model is then tested and predicted, and the accuracy and reliability of the prediction results are evaluated.
ARIMA models are widely used in time series analysis and forecasting in finance, economics, meteorology, environment, etc. The disadvantages of ARIMA models are that they may require higher model orders and more historical data when forecasting long-term and complex time series, thus increasing the computational and time costs, and the model may not be suitable for time series analysis of multivariate and nonlinear relationships, requiring Combination of other methods for analysis and forecasting.
2.2 Decision tree model
The decision tree model is a classification and regression method based on a tree structure. In a decision tree model, each internal node represents an attribute or feature, each branch represents one value of that attribute or feature, and each leaf node represents a classification result or regression result. After the above operation, the decision tree may have a good classification ability for the training dataset (Li et al., 2023). Still, it may not have the same effect on the unknown dataset. To avoid the overfitting phenomenon, the generated tree needs to be pruned to simplify the tree so as t to better generalization ability.
Decision tree models are risk-based decision methods often used in artificial intelligence, medical diagnosis, planning theory, cognitive science, engineering, data mining, etc.
2.3 LSTM model
The LSTM (Long Short-Term Memory) model is a recurrent neural network model commonly used for sequence data analysis and prediction (Song et al., 2020). The main feature of the LSTM model is that it can effectively capture and process the long-term dependencies in sequence data through the gating mechanism, avoiding the gradient disappearance or explosion problem in traditional recurrent neural networks, and therefore is widely used in the fields of natural language processing, speech The basic structure of LSTM model includes input gates, forgetting gates, output gates and memory units, where input gates are used to control the weighted sum of input sequences, forgetting gates are used to control the update and forgetting of information in memory units, output gates are used to control the weighted sum of output sequences, and memory units are used to store the long-term dependencies in sequences.
However, the training time required for the LSTM model is too long due to the large number of parameters required and the complexity of parameter adjustment.
3 Methodology
3.1 Overview of our network
The CNN-GRU model based on the attention mechanism proposed in this paper can predict the impact data of energy-saving and emission-reduction measures on carbon neutral goals in sports competitions, which can effectively prevent gradient explosion and cumbersome algorithms, and at the same time improve the reliability and practicability of the prediction model.
Firstly, the data set of energy saving and emission reduction measures for carbon neutral targets in the sports competitions game is input, the data is pre-processed and normalized in the data input layer, and then the data set is put into the CNN unit for feature extraction, to make more effective feature extraction for carbon neutral data, here we choose the convolutional layer with one-dimensional structure, the data set is convolved and downscaled with the one-dimensional convolutional layer, after pooling After sampling and merging, the data is reorganized by the fully-connected layer to output the feature sequence, and then the feature data is entered into the GRU gated cyclic unit for carbon neutral feature learning, and finally into the attention module to obtain the optimal parameters of the model, improve the accuracy of prediction, optimize the CNN-GRU structure, and finally output the prediction results.
The CNN-GRU-AM model includes three parts: the CNN module, the GRU module and the attention module. The three parts complete the prediction of the carbon neutrality target of energy saving and emission reduction measures in sports competitions through their own merits, and the overall structure of the model is shown in Figure 1.
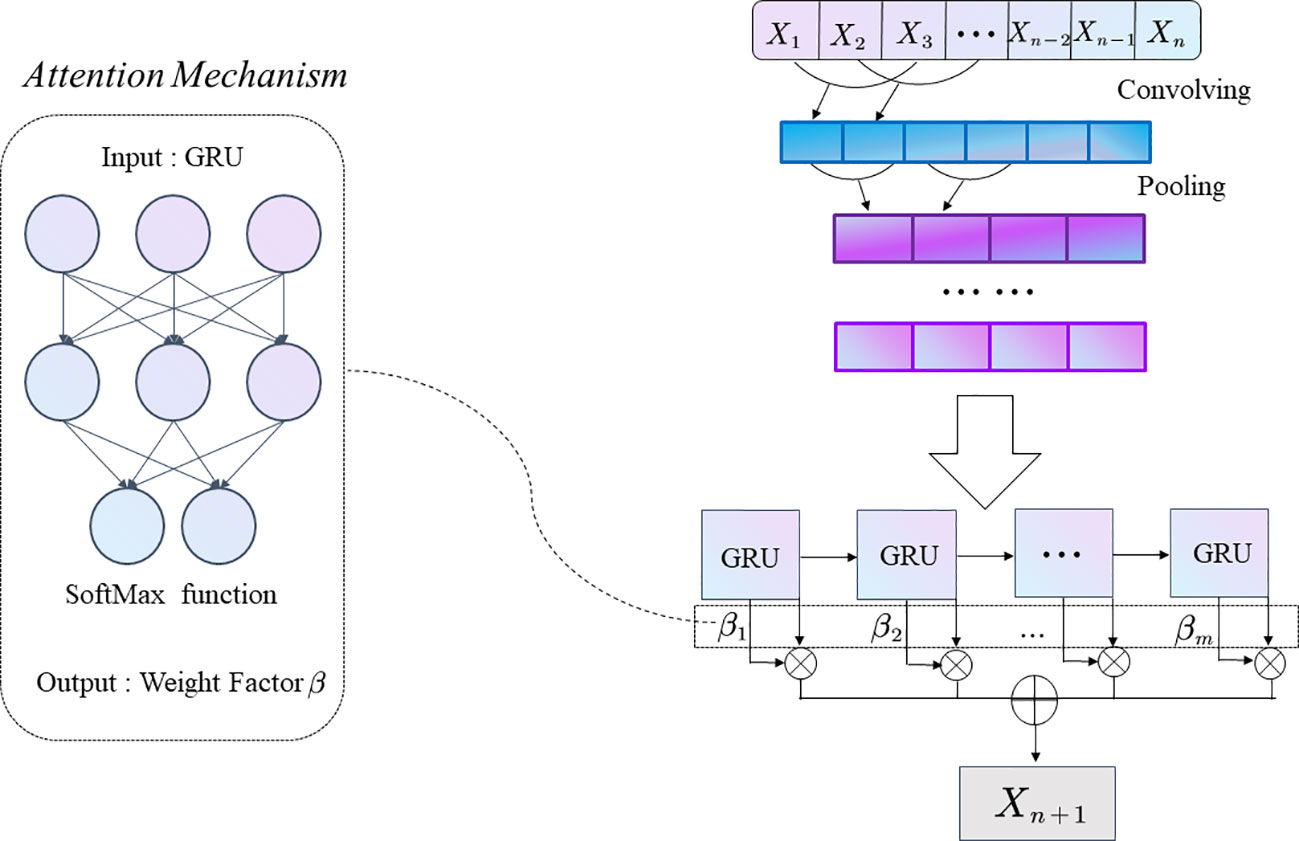
Figure 1 Detailed flow diagram of CNN-GRU-AM overall model.
3.2 CNN model
Convolutional Neural Network (CNN) (Wenya, 2021) is a deep learning model commonly used in image recognition and computer vision. The CNN model is divided into three main layers, convolutional layer, pooling layer, and fully connected layer. The convolution operation is the core of CNN, which extracts local features by sliding a convolution kernel (also called a filter) over the input feature map. The convolution layer convolves the input image with convolution kernels, the size and number of which can be adjusted as needed. After the convolution operation, a nonlinear mapping by an activation function is usually required to increase the expressiveness of the model (Song et al., 2021). Commonly used activation functions include ReLU and Tanh, etc. The feature maps obtained by convolution processing then enter the pooling layer for pooling, which reduces the dimensionality of the feature maps to reduce the model parameters and computation. Then the fully connected layer expands the feature map output from the pooling layer into a one-dimensional vector and performs classification or regression by a set of fully connected weight matrices. Finally, the loss function and optimizer are used to get the desired data. CNNs can be divided into one-dimensional CNNs and multidimensional CNNs according to their dimensions. In terms of data processing, multidimensional CNN models can handle multi-channel input data, i.e., they can simultaneously process data from multiple sensors, such as temperature, humidity, light, etc., which can provide a more comprehensive understanding of the environmental state of the game stadium. Since monitoring the sports competitions game Since monitoring carbon emissions in sports competitions requires considering multiple dimensions of data, these data cannot be represented by a single one-dimensional sequence. Therefore, we choose a multidimensional CNN model to process these multidimensional data better and extract the correlation between different dimensions for carbon emission prediction and monitoring. The model structure diagram is shown in Figure 2.
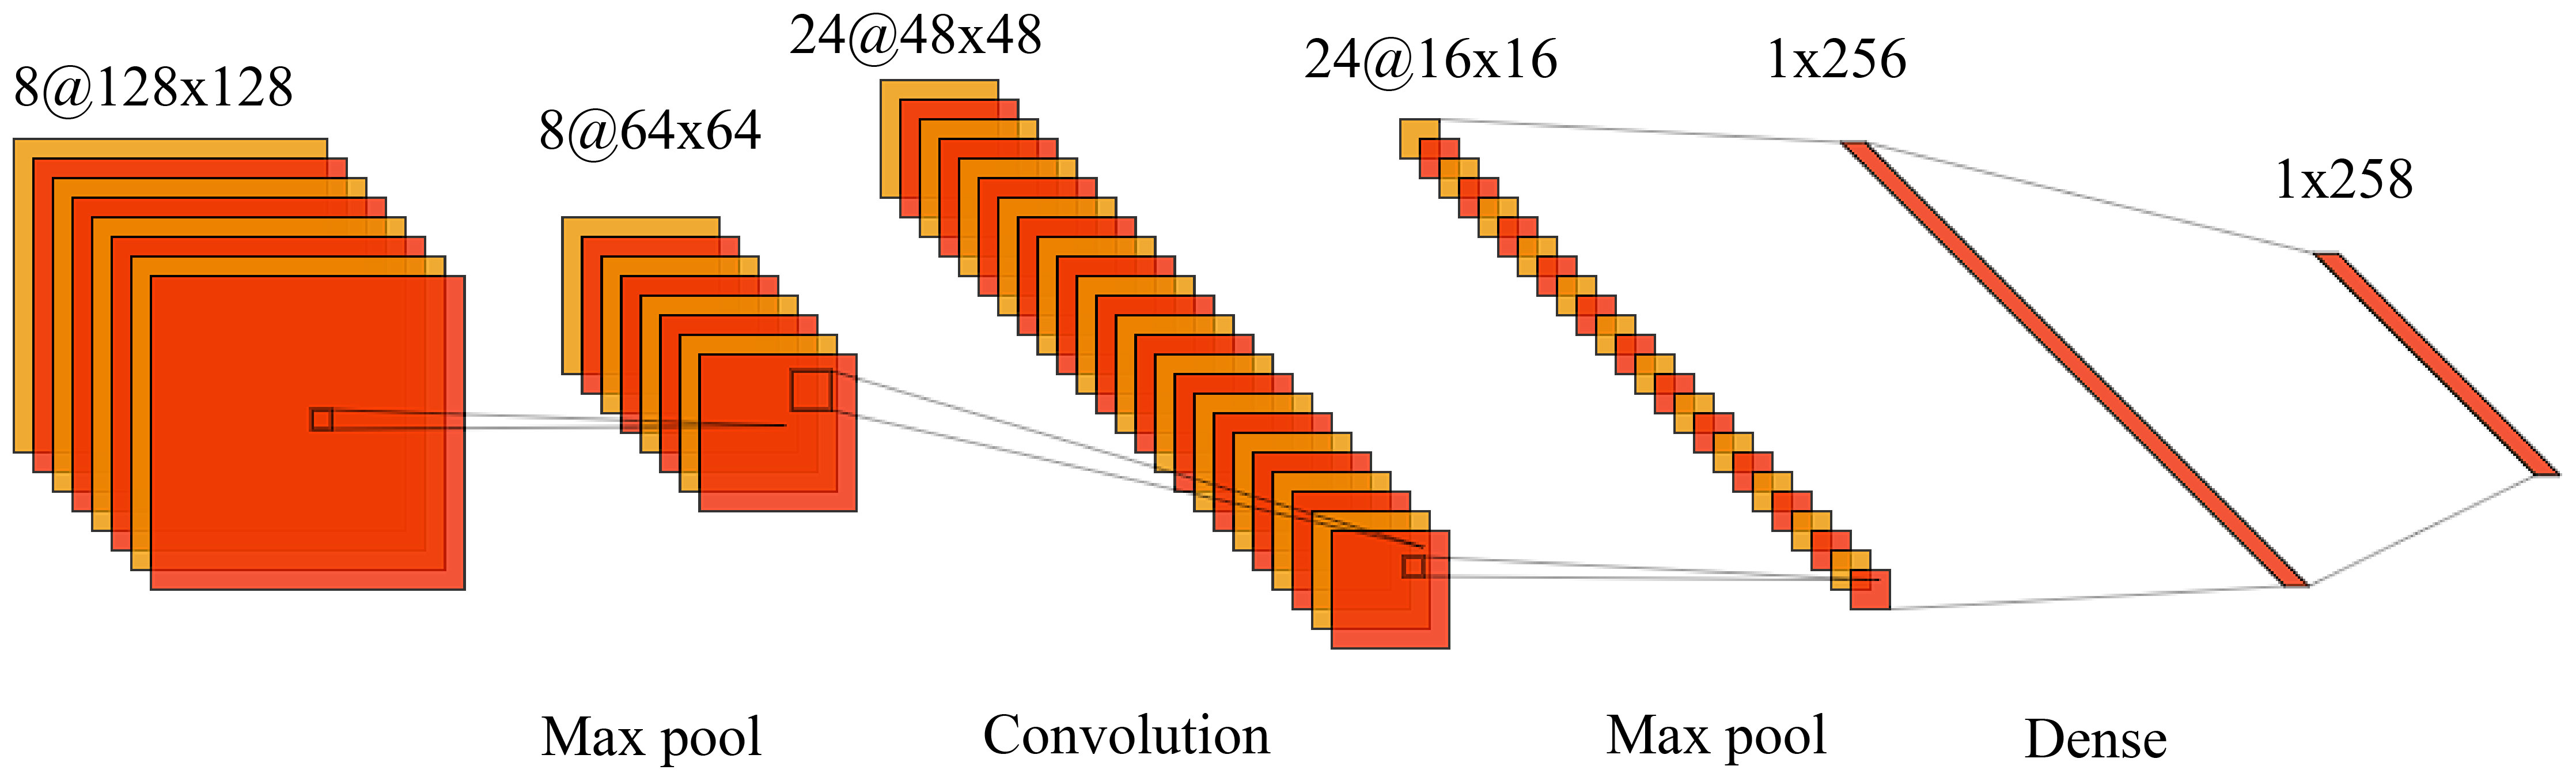
Figure 2 Multidimensional CNN network structure.
Since the CNN convolutional layer is the core layer of the convolutional neural network, and the convolutional layer is mainly composed of some convolutional kernels, we introduce the formula of convolutional kernels and the formula of convolutional kernels as follows:
In Equation (1), are the kth weight of the i-th convolution kernel in the l-th layer; are the k-th local region to be convolved in the lth layer; n are the width of the convolution kernel; yl(i,k) are the corresponding output. A pooling layer is inserted periodically between successive convolutional layers, and its function is to gradually reduce the spatial size of the data set to reduce the number of parameters in the network, save computational resources, and effectively control overfitting. After performing convolution and pooling operations on the input data, the extracted features are compressed into a one-dimensional feature vector and fed into the fully connected layer for classification.
3.3 GRU model
GRU model is a commonly used recurrent neural network model (Yang et al., 2022). Compared with the traditional recurrent neural network, the GRU model introduces a gating mechanism with the main structure of the input gate-update gate-reset gate, which can better capture the long-range dependencies in the time series while reducing the gradient disappearance and gradient explosion problems in the model. In studying energy saving and emission reduction scenarios for sports competitions under the carbon neutrality goal, we use the GRU model to model and predict the energy consumption data in sports competitions processed by CNN (Wan et al., 2022). Through the historical analysis of the energy consumption data during sports competitions under different energy saving and emission reduction schemes, it can be found that additional energy saving and emission reduction schemes have a large impact on energy consumption, and energy consumption varies greatly in different periods. Therefore, the GRU model is used to model the energy consumption data during sports competitions with other energy saving and emission reduction schemes to better understand the data characteristics of the impact of different schemes on achieving carbon neutrality in sports competitions and to predict the optimal energy saving and emission reduction scheme, which provides a reference basis for energy saving and emission reduction schemes in sports competitions under the carbon neutrality target. It is shown in Figure 3.
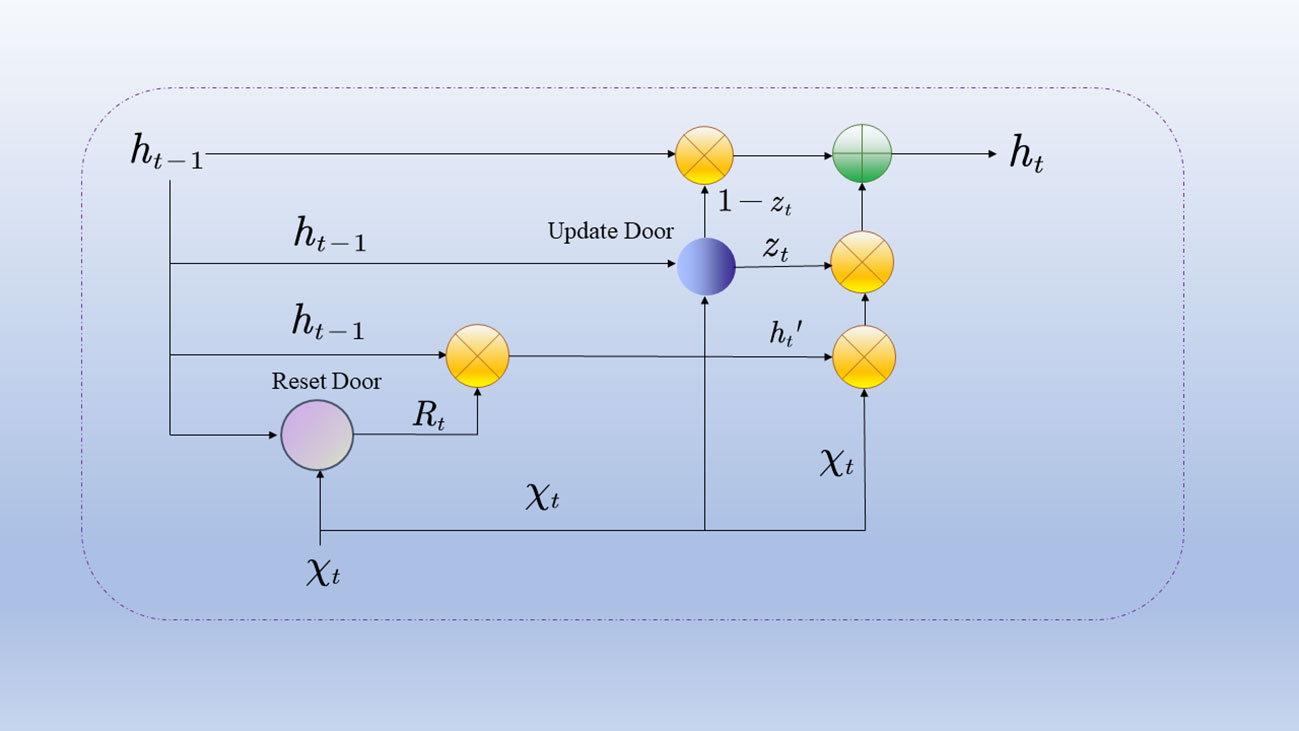
Figure 3 GRU model flow chart.
GRU processes the hidden state ht–1 at the last moment and the external input information xt at the current moment through two multiplication gates, the reset gate and the update gate, to update the hidden state ht at the current moment for model training, which is calculated as follows:
In (2)–(5), W(z),W(r),W,U(z),U(r),U are the corresponding input weight matrix. is the current memory content. ⊙ is a Hadamard operation. σ is the Sigmoid activation function in 1 (Table 1).
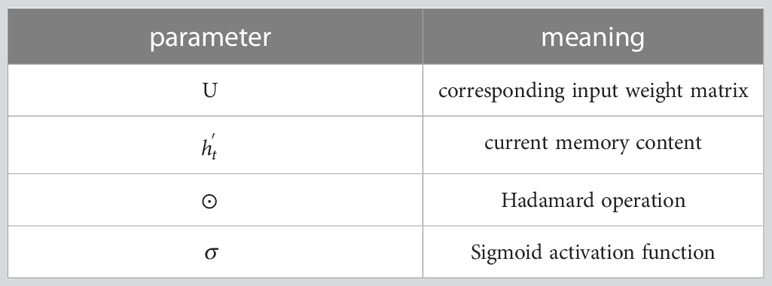
Table 1 The meanings represented by each parameter.
3.4 Attention mechanism
Attention Mechanism (AM) is a technique commonly used in machine learning to focus the model’s attention on certain parts of the input data to process complex sequential data better (Osorio et al., 2022). In our CNN-GRU model, introducing the Attention Mechanism can help the model better process the data for achieving the carbon neutrality goal of the sports competitions game under different energy-saving and emission-reduction schemes.
Our CNN-GRU model combines a convolutional neural network and a gated recurrent unit network for processing data on achieving carbon neutrality goals for sports competitions under different energy-saving and emission-reduction schemes. In this model, the convolutional neural network extracts feature from the data and the gated recurrent unit network is used to model the features. However, the model has some minor problems, such as gradient disappearance or gradient explosion, easily when dealing with long sequence data. To solve these problems, we introduce an attention mechanism – an attention layer is added to the GRU network, which can dynamically calculate the attention weights for each time step based on the input time series data. In this way, the model can pay more attention to the important time steps, thus better capturing the important features in the time series data and improving the model’s prediction performance to derive our desired energy-saving and emission-reduction solutions more accurately. The structure diagram is shown in Figure 4.
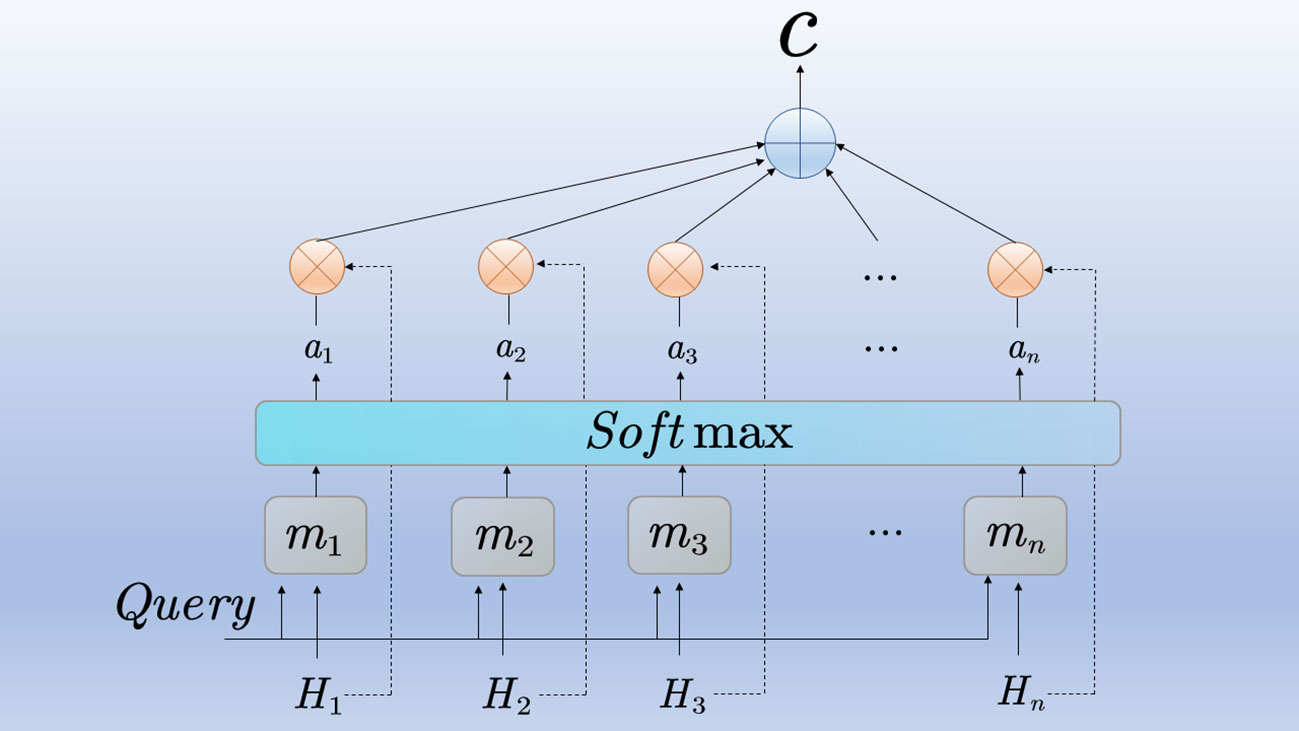
Figure 4 Attention mechanism flow chart.
When current deep learning models process sequence features, they tend to treat the information in each step of the sequence as equivalent and are unable to focus selectively on certain information, thus ignoring the correlation between features and the temporal differences between input information, which affects the model’s effectiveness. The core idea of the attention mechanism is to introduce attention weights on the input sequences to evaluate the importance of different input information. This can help the model focus more directly on the input information with a higher correlation to the desired output and enhance the model’s accuracy.
Using a time series [x1, x2,…, xn] with span n as an example, the attention weight vector αt and the weighting vector xt are calculated by the below rules.
In (6)–(8), W(α) is the weight matrix. ⊙ is a Hadamard operation. σ is the Sigmoid activation function.
This is the algorithm flow of the model in Algorithm 1; firstly, the data input of additional energy saving and emission reduction programs to achieve carbon neutrality for sports competitions, preprocess and normalize the data in the data input layer, then put the data set into a multi-dimensional CNN unit for feature extraction, reduce the dimensionality of the data set, and finally output the feature sequence after pooling sampling and merging and reorganization in the fully connected layer, then put the feature data into the GRU module with the attention layer for carbon neutral feature learning, get the optimal model parameters, improve the accuracy of prediction, and finally output the predicted results.
Algorithm 1 Training Process for CNN-GRU-A.
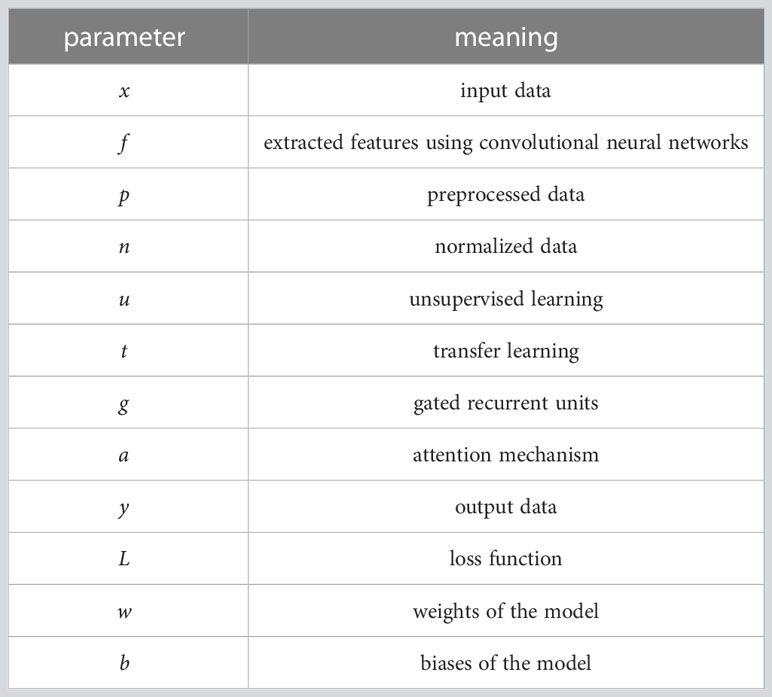
Table 2 The meanings represented by each parameter.
The variables used in the training process are in label2:
The formulas used in the training process are:
The loss function used in the training process is a combination of cross-entropy loss and L2 regularization:
where m is the number of samples, y is the ground truth, is the predicted output, λ is the regularization parameter, L is the number of layers, and wl is the weight matrix of layer l.
The parameter updating step uses the Adam optimizer with a learning rate of α:
where is the gradient of the loss function with respect to the weights, β1 and β2 are the exponential decay rates for the first and second moment estimates, and ϵ is a small constant to avoid division by zero.
The adversarial training step uses the Fast Gradient Sign Method (FGSM) to generate adversarial examples:
where ϵ is the perturbation magnitude, is the gradient of the loss function with respect to the input, and sign(·) returns the sign of its argument (Table 2).
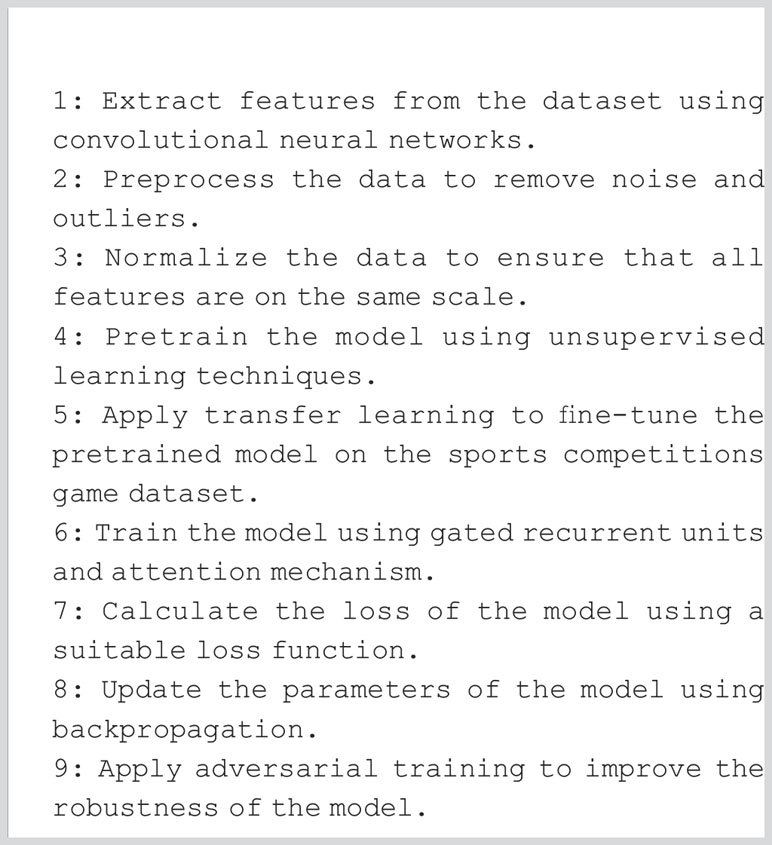
The complete training process for CNN-GRU-AM is as fllows3.4.
1: Initialize the weights and biases of the model.
2: while not converged do
3: Randomly sample a batch of data from the dataset.
4: Extract features from the data using convolutional neural networks.
5: Preprocess the data to remove noise and outliers.
6: Normalize the data to ensure that all features are on the same scale.
7: Apply dropout regularization to the data.
8: Feed the data into the model and obtain the predicted output.
9: Calculate the loss of the model using cross-entropy loss and L2 regularization.
10: Calculate the gradients of the loss with respect to the weights using backpropagation.
11: Update the weights and biases of the model using the Adam optimizer
12: Apply adversarial training to the model to improve its robustness.
13: end while
4 Experiment
4.1 Datasets
This paper uses raw data from the Qatar World Cup Greenhouse Gas Accounting Report, CEADs, UNFCCC, and Climate Watch databases.
Qatar World Cup Greenhouse Gas Accounting Report: The Qatar World Cup Greenhouse Gas Accounting Report is the official report of Qatar hosting the 2022 FIFA World Cup, which aims to account for and assess greenhouse gas emissions during the tournament and recommend measures to reduce carbon emissions.
The report provides a detailed investigation and analysis of greenhouse gas emissions during the World Cup tournament, including data on energy consumption in the tournament venues and surrounding facilities, carbon emissions from transportation, waste disposal, and water management (Al Sholi et al., 2023). The total GHG emissions during the tournament were calculated, analyzed, and compared based on these data. Among the analysis results, the report identifies the areas with the highest carbon emissions during the competition, including transportation, energy consumption, and waste disposal. The report also explores how to reduce carbon emissions during the tournament, offering a series of feasible recommendations and measures, including measures to adopt renewable energy, improve transportation, and optimize waste disposal.
In addition, the report describes Qatar’s efforts and achievements in reducing greenhouse gas emissions, including measures in renewable energy development, building low-carbon cities, and promoting public transportation (Habib and Al-Ghamdi, 2021). Finally, the report calls for greater cooperation among countries and regions worldwide in reducing carbon emissions and jointly addressing the challenge of climate change. The Qatar World Cup greenhouse gas accounting report thus provides a useful reference and reference for the sustainable development of global sports competitions events, as well as guidance and support for the future environmental protection and sustainable development of Qatar.
CEADs: China Carbon Accounting Database is a national carbon accounting database established by the Chinese Academy of Environmental Sciences, the Institute of Geographical Sciences and Resources of the Chinese Academy of Sciences, and other institutions (Liu et al., 2022b). By collecting and organizing carbon emission data from various industries and fields, this database provides important support and data support for carbon emission monitoring, management, and emission reduction in China. The China Carbon Accounting Database includes carbon emission data from various sectors and industries, including energy, transportation, industry, construction, agriculture, forestry, waste disposal, etc. The database adopts the international standard carbon emission measurement method and data processing method to ensure the accuracy and comparability of data. At the same time, the database is constantly updated and improved to adapt to the changing carbon emission environment and needs.
Through the China Carbon Accounting Database, government departments, enterprises, and research institutions can access carbon emission data from various fields and industries, conduct carbon emission assessment and accounting, and formulate and implement carbon emission reduction plans and policies (Zhang et al., 2022). The database can also provide data support and reference for enterprises’ environmental protection and sustainable development, promoting China’s low-carbon economic development and efforts to combat climate change. The China Carbon Accounting Database is an important data support and infrastructure for China in addressing climate change and promoting sustainable development, providing important support and guarantee for China to achieve carbon neutrality and low-carbon economic development.
UNFCCC: The United Nations Framework Convention on Climate Change (UNFCCC) is an international treaty addressing global climate change (Wang et al., 2021). It was adopted in 1992 at the Earth Summit in Rio de Janeiro and currently has 197 parties, including 196 countries and the European Union. UNFCCC aims to mitigate greenhouse gas emissions and address the impacts of climate change on human and natural systems through international cooperation. The main goal of the UNFCCC is to promote global emissions reduction and climate change response through international cooperation efforts. To achieve this goal, the UNFCCC has established an annual Conference of the Parties (COP) and various institutions and mechanisms, such as the Technical Executive Board (TEC), the Intergovernmental Panel on Climate Change (IPCC), and the International Panel on Climate Change (IPCC). The UNFCCC has established various bodies and mechanisms, such as the Technical Executive Board (TEB) and the Intergovernmental Panel on Climate Change (IPCC), to facilitate cooperation and communication among countries in reducing emissions and addressing climate change (Dong et al., 2022). In addition, UNFCCC has established a series of regulations and guidelines, such as the Paris Agreement, to regulate countries’ actions to reduce emissions and respond to climate change and to promote the achievement of global emission reduction targets. The UNFCCC is an important international legal framework for the global response to climate change, providing an important program for countries to coordinate and launch actions to reduce emissions and respond to climate change.
Climate Watch: Climate Watch is a global online platform developed and maintained by the World Resources Institute (WRI) to provide policymakers, researchers, businesses, and the public with the latest data and information on global climate change (Ibrahim et al., 2022). Climate Watch brings together data on greenhouse gas emissions, energy consumption, renewable energy, and climate policy on a global scale, presented in a visual format that allows users to better understand the trends and impacts of global climate change. At the same time, Climate Watch provides various tools and analyses to help users assess and compare actions to reduce emissions and address climate change in different countries and regions.
Here we use the four selected databases as the initial data set sources and filter the experimental data through different energy-saving and emission reduction measures to achieve the carbon neutral goal. Here we select the energy-saving and emission-reduction measures in sports competitions that can affect the carbon neutral goal, such as environmental protection materials, transportation, the energy efficiency of stadiums, and air conditioning emissions3, which have a greater impact on achieving the carbon neutral goal, to study better the impact of different energy saving and emission reduction measures on achieving carbon neutrality in sports competitions, and to more easily find out the energy saving and emission reduction measures solutions for sports competitions that can efficiently achieve the carbon neutral goal.
We use the first 90% of the selected database as the training set and the last 10% of the data as the test set. Giving the model more training data can make our model’s prediction results more accurate and convincing (Table 3).
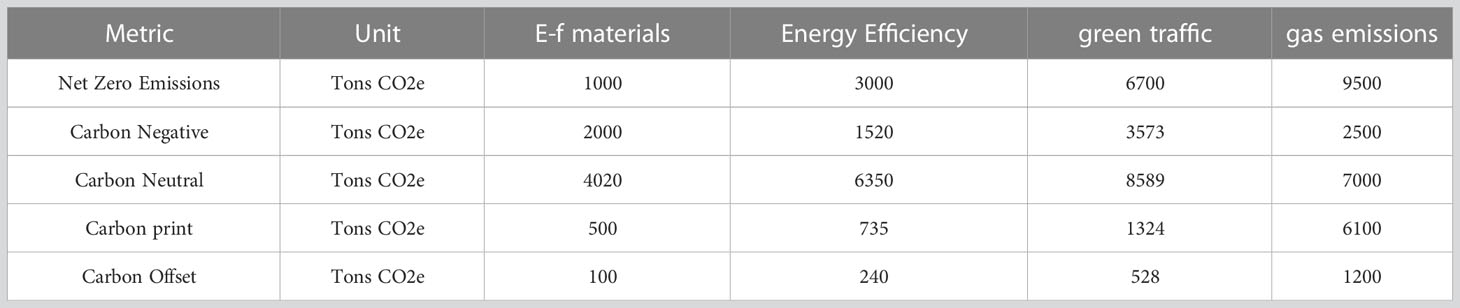
Table 3 Carbon neutral metrics.
4.2 Experimental setup and details
We designed several experiments to demonstrate that our model can achieve the carbon-neutral target prediction for sports competitions with other energy-saving and emission-reduction measures to demonstrate its performance. First, we compared our model with the training time of our selected dataset with the total selected models. We also compared the data inference time of this model with all other models and the performance of different models. We then tested its AUC and accuracy, which outperformed all the other models, proving that the model outperforms the unoptimized model under the attention mechanism; finally, we conducted a comparison experiment between its MAP and other selected models to more comprehensively verify the performance of our model. By comparing the comprehensive performance of the four selected datasets under different models, we can see that the CNN-GRU-AM model outperforms the other models in terms of computational rate, MAP, number of required parameters, and the accuracy and reliability of the experimental results, so that our model can better predict the carbon neutrality target of sports competitions by other energy saving and emission reduction measures.
4.3 Experimental results and analysis
In Figure 5, we first conducted experiments on the inference time of our model for four data sets, recorded the inference time of our model for the four selected data sets, and compared it with other models. However, our model is less affected by the amount of data and has the optimal inference speed with the same data. Hence, the sports competitions game under different energy saving and emission reduction schemes has a brighter performance for predicting the larger data set involved in achieving the carbon neutrality goal.
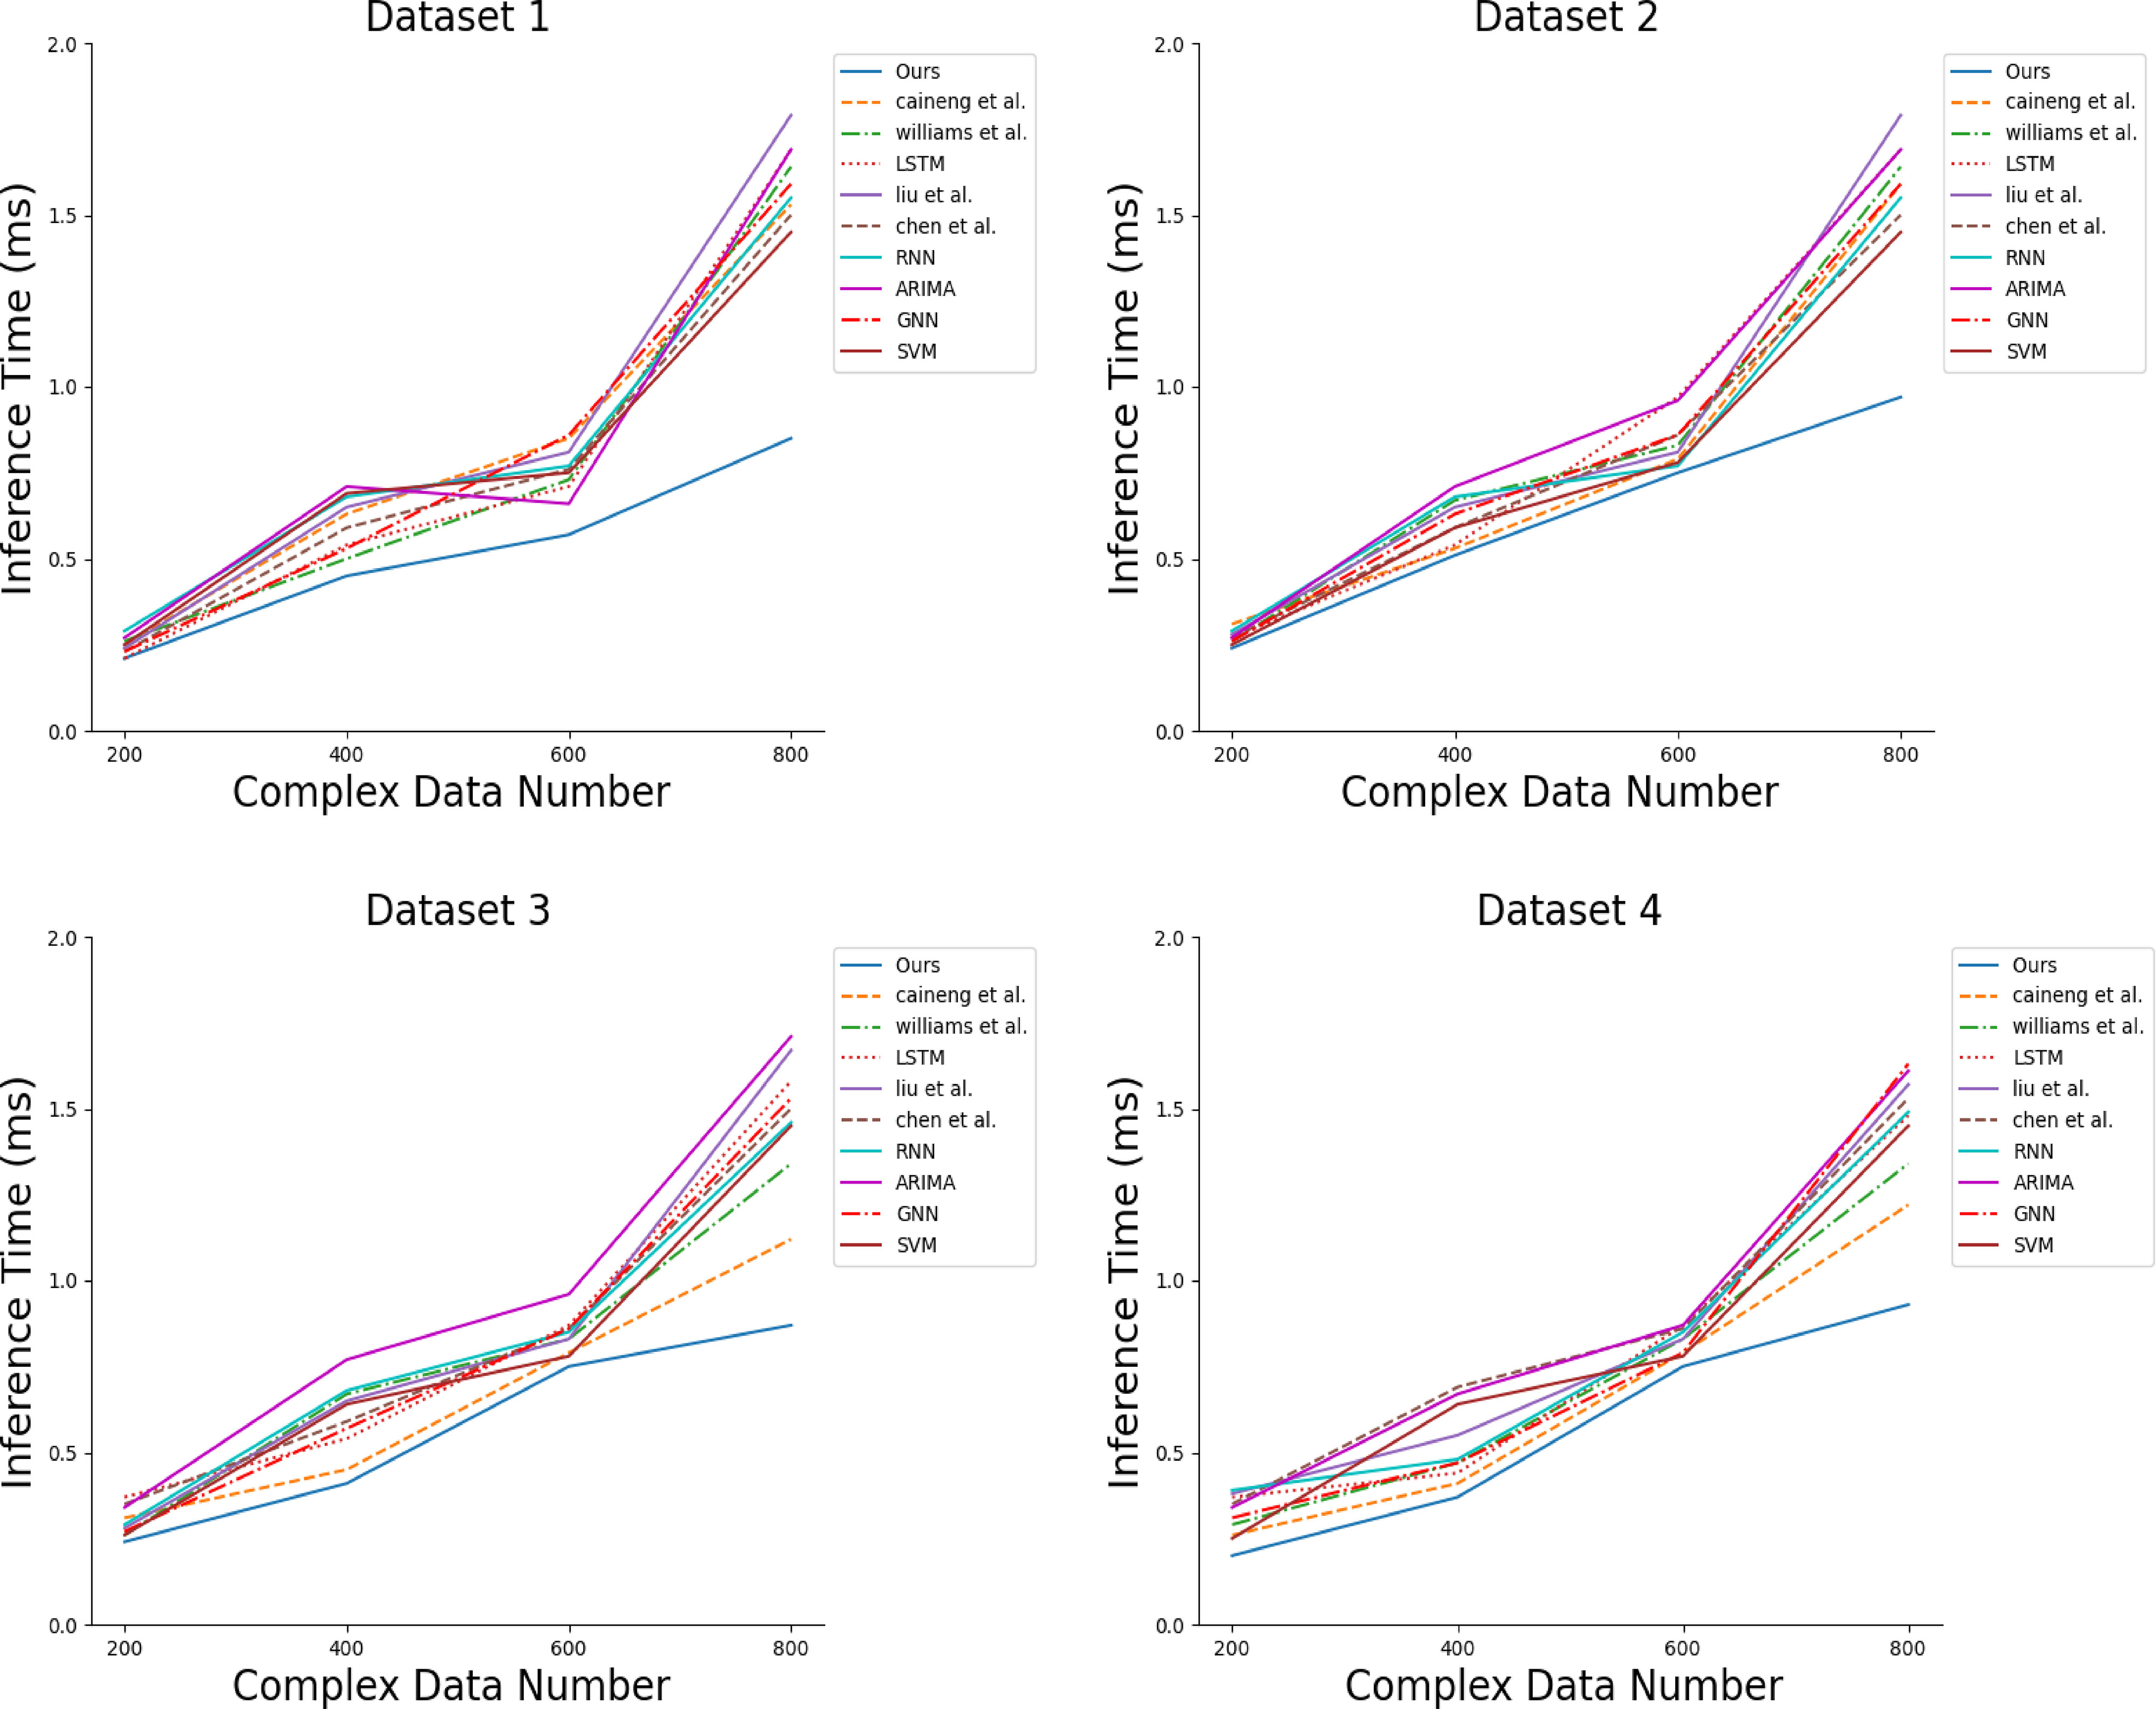
Figure 5 Comparison of different models for complex data inference time.
In this set of experiments, we compared the required training time of our model with the rest of the models for all datasets (Figure 6). The performance of the same model varies in the face of different datasets, but the variation of the model is more stable, but with the increase of training data, the training time of the model increases with the increase of data, and the larger the training data, the longer the training time of the rest of the models, but the performance of the CNN-GRU model optimized by the attention mechanism is always more stable and can better adapt to the requirements of our experiments.
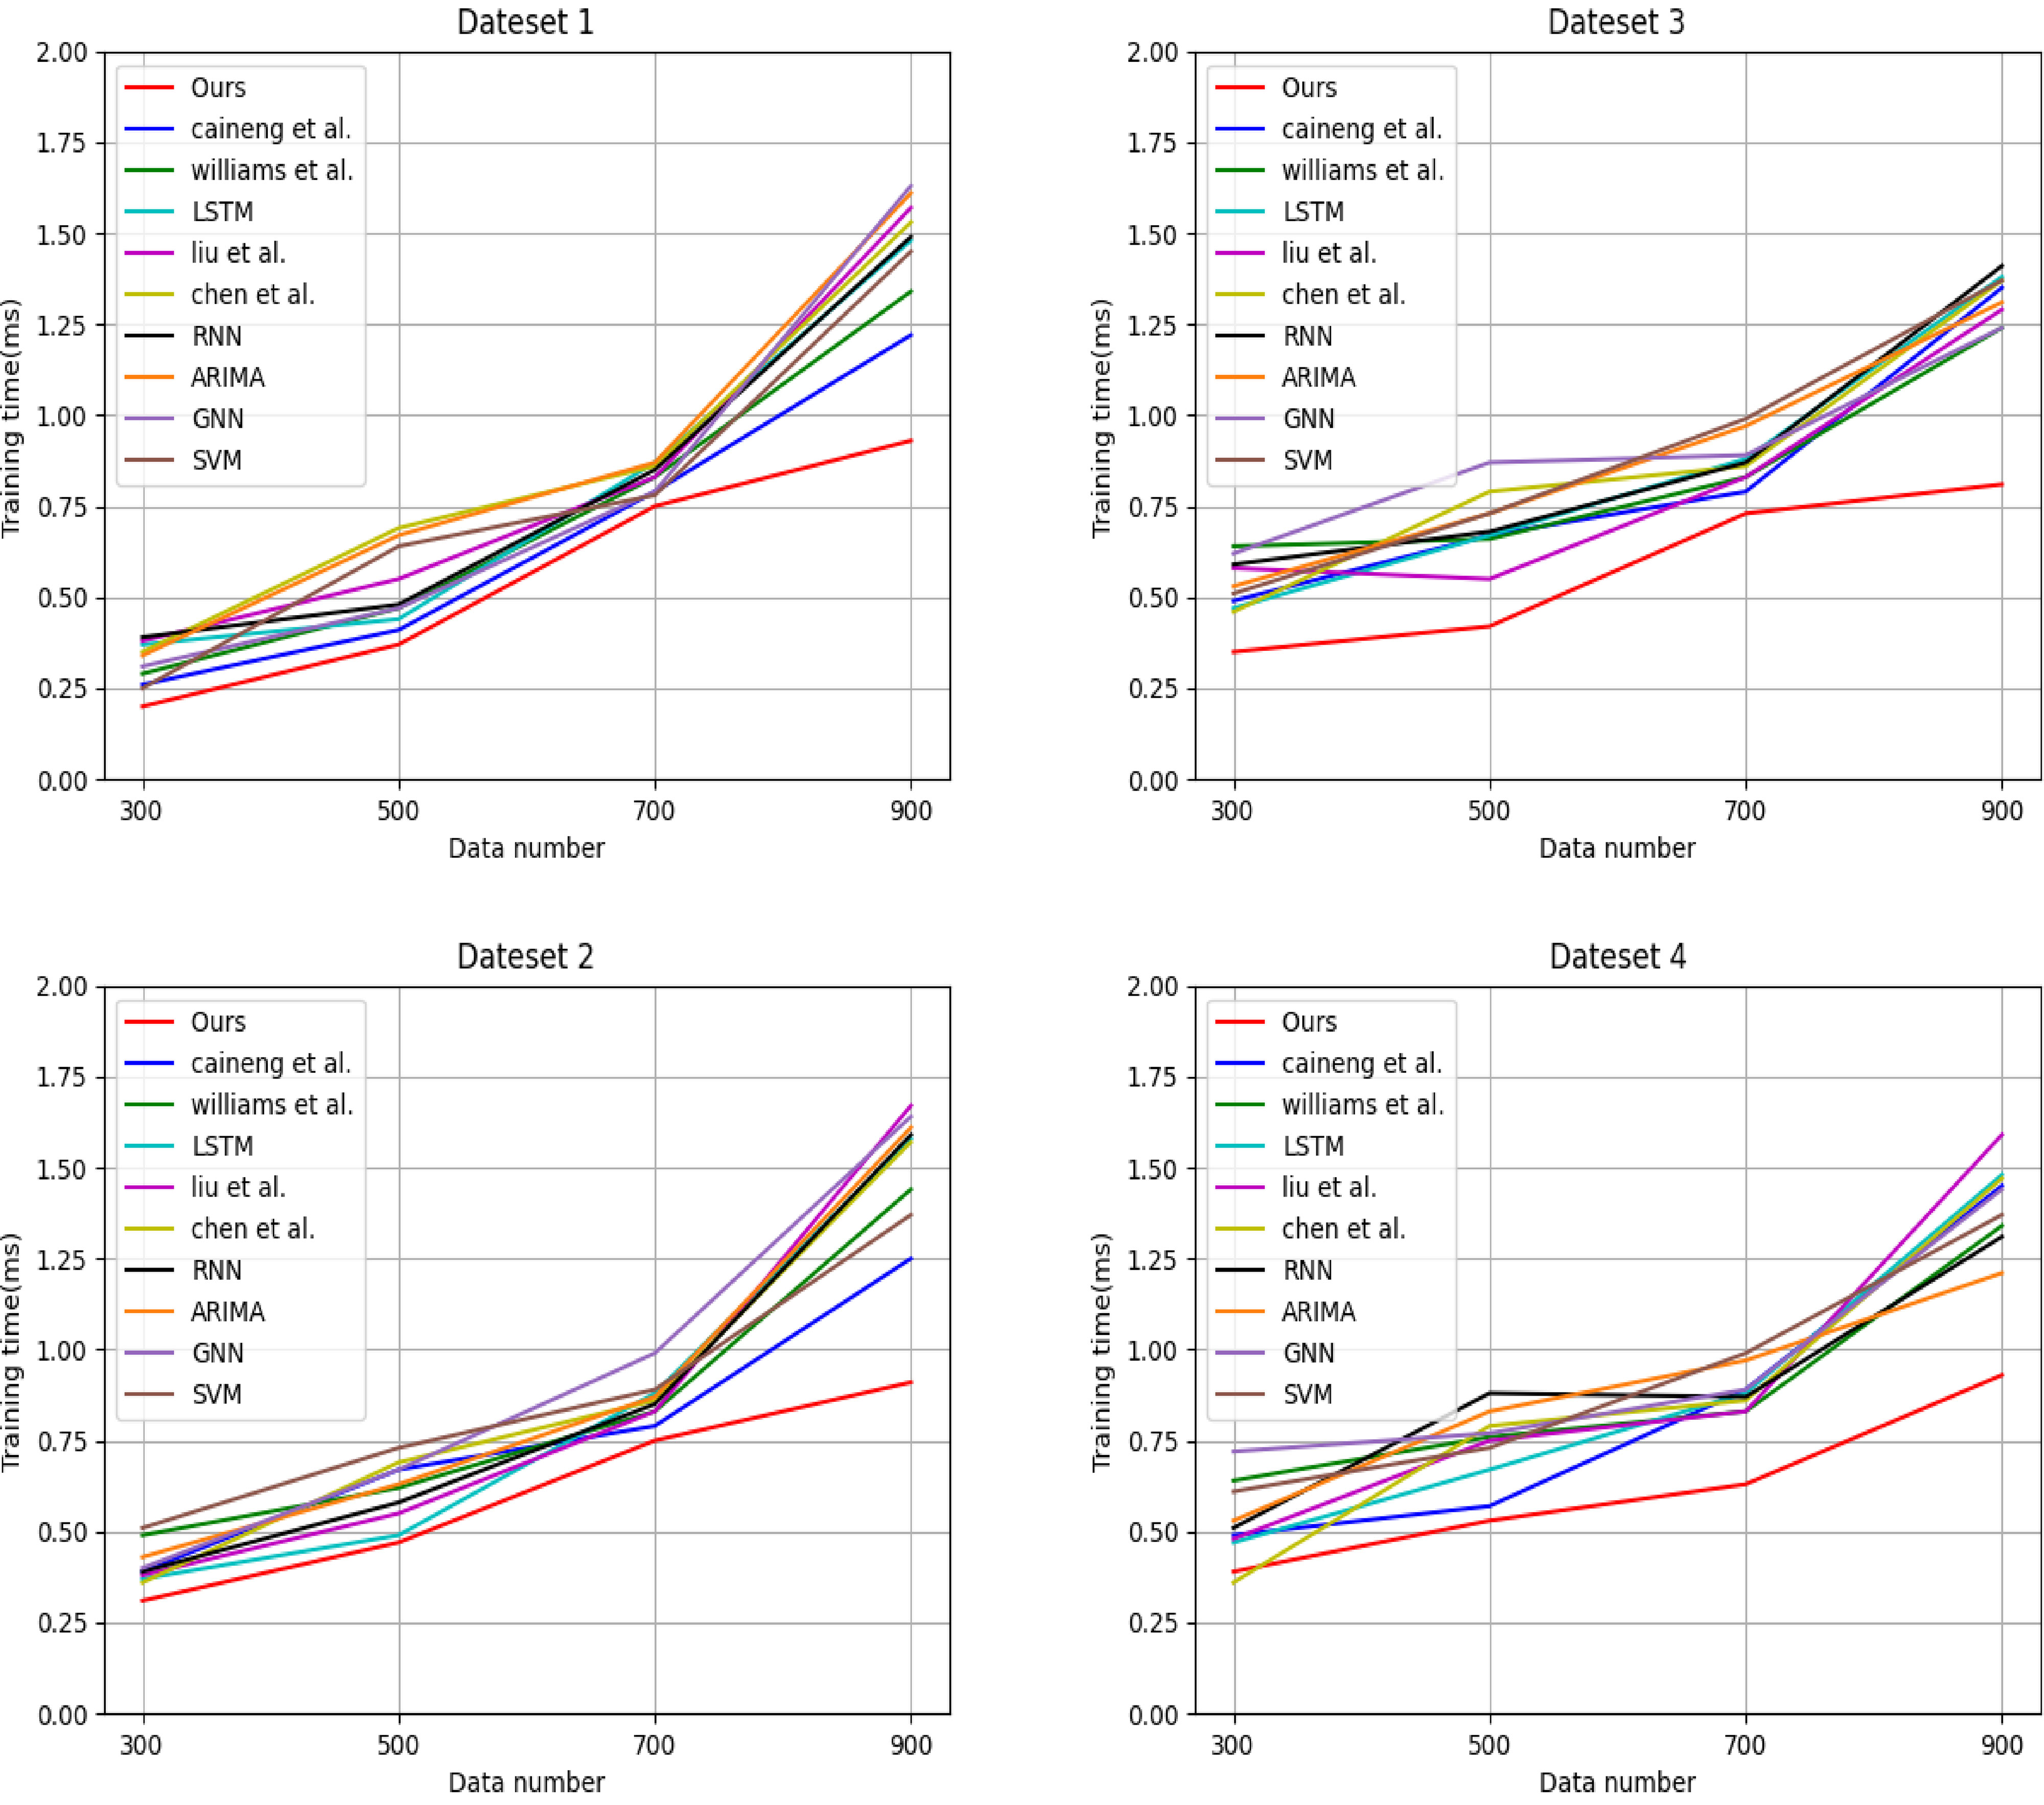
Figure 6 Training time data plots for all models under different data sets.
Then we conducted the experimental comparison of Flops. We compared all the datasets among all the selected models (Figure 7). We found that each model performed differently for different datasets, but comparing all the models, our selected model performed the best in Flops and required fewer Flops than other models for different datasets, so it was more suitable for our scenario study.
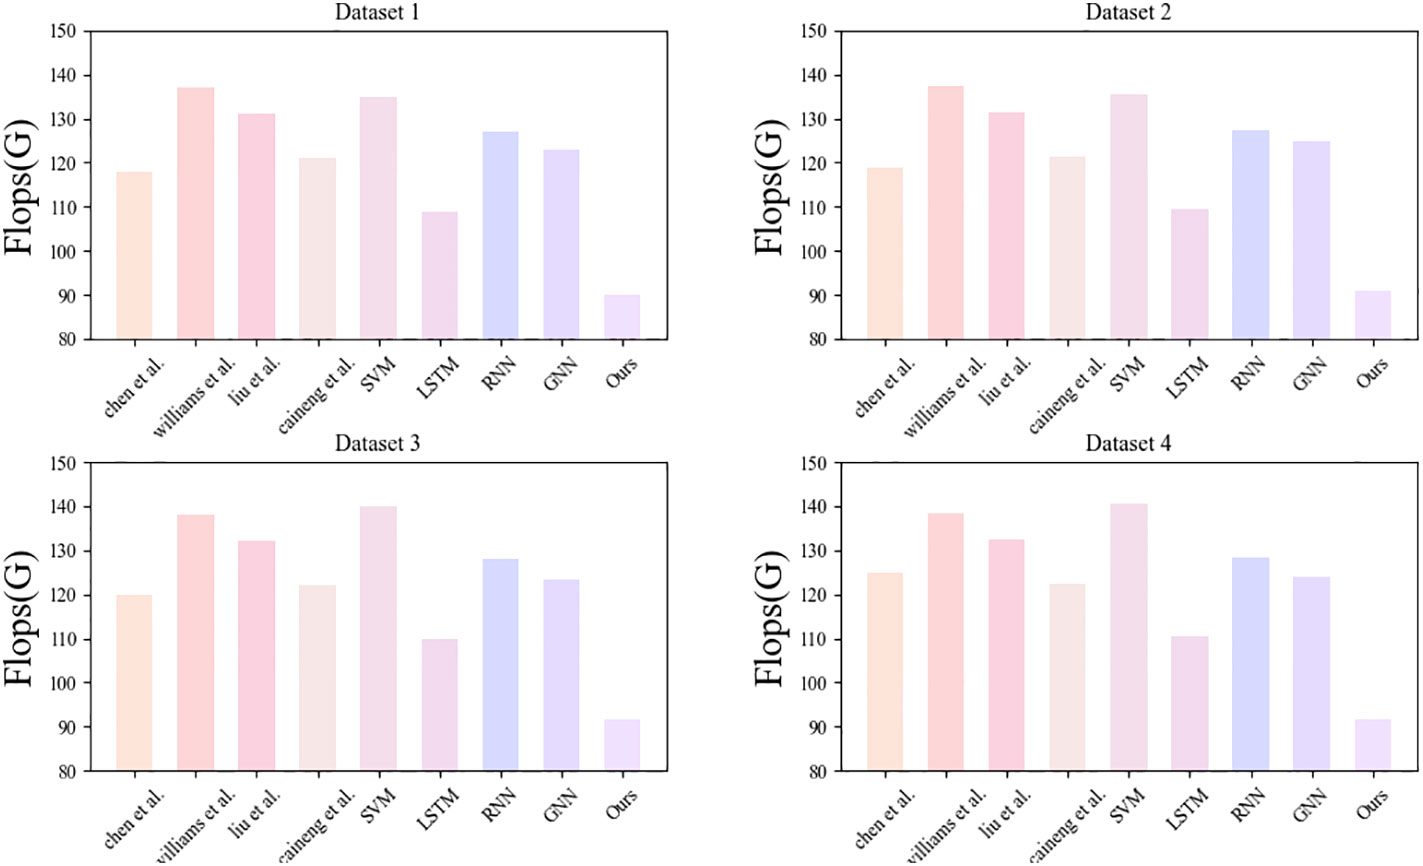
Figure 7 Flops required for all models facing different datasets.
Immediately after we compared the number of parameters required for our model at different levels of difficulty (Figure 8), it was easy to find that the number of parameters required for the experimental model increased with the difficulty of the data, but the number of parameters required for our model were all smaller than the other models, and the difficulty and relevance of the data must be complex in the face of the study of energy saving and emission reduction programs for sports competitions under different energy saving and emission reduction measures, so the model we selected is a good fit for the study we need.
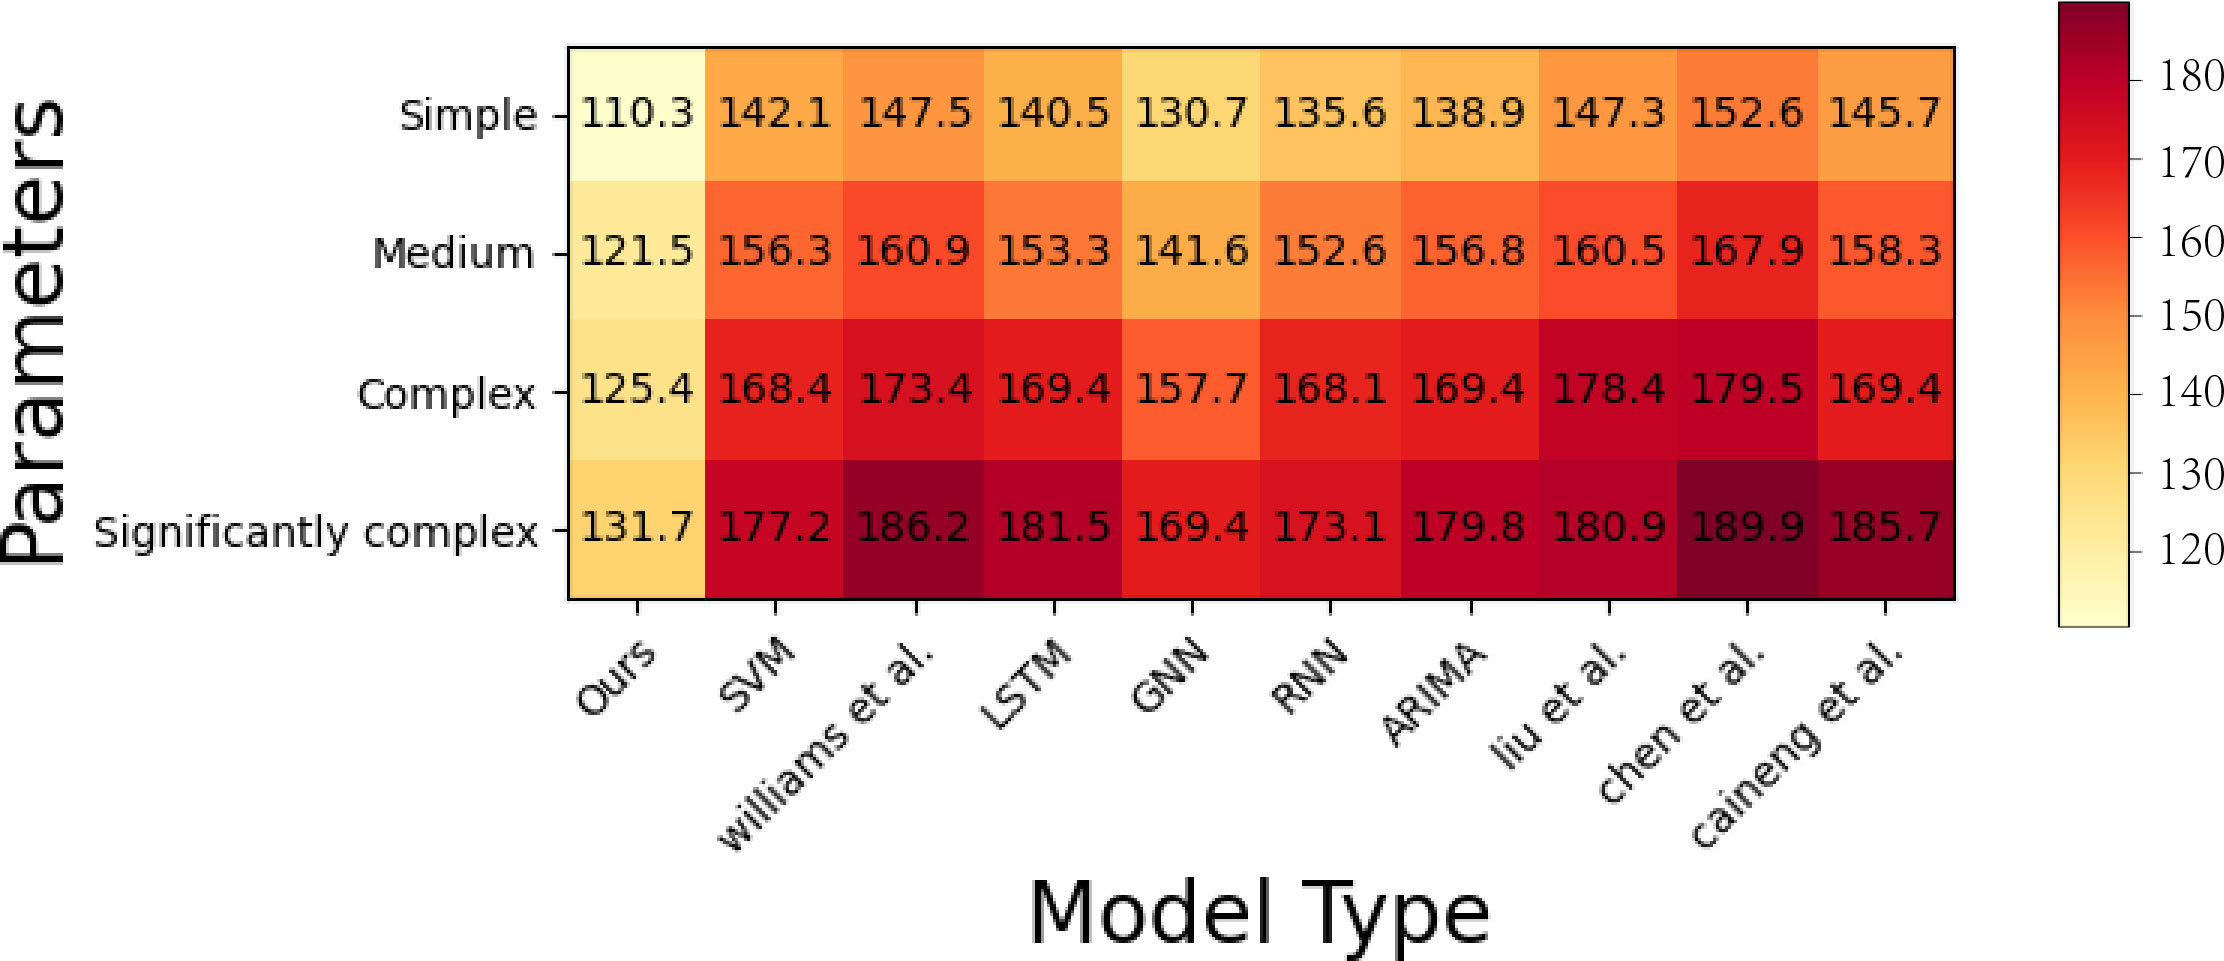
Figure 8 Experimental plot of the number of parameters required for all models for different difficulty data sets.
In that set of experiments (Figures 9, 10), we compared the MAP performance of all datasets under all models, and it can be seen that the MAP of all but four groups of models is greater than ninety percent for the remaining six groups, and although the difference is not significant, our model wins through a slight difference of one percent, and although it is only one percent, the impact of one percent is not to be underestimated when facing a huge dataset.
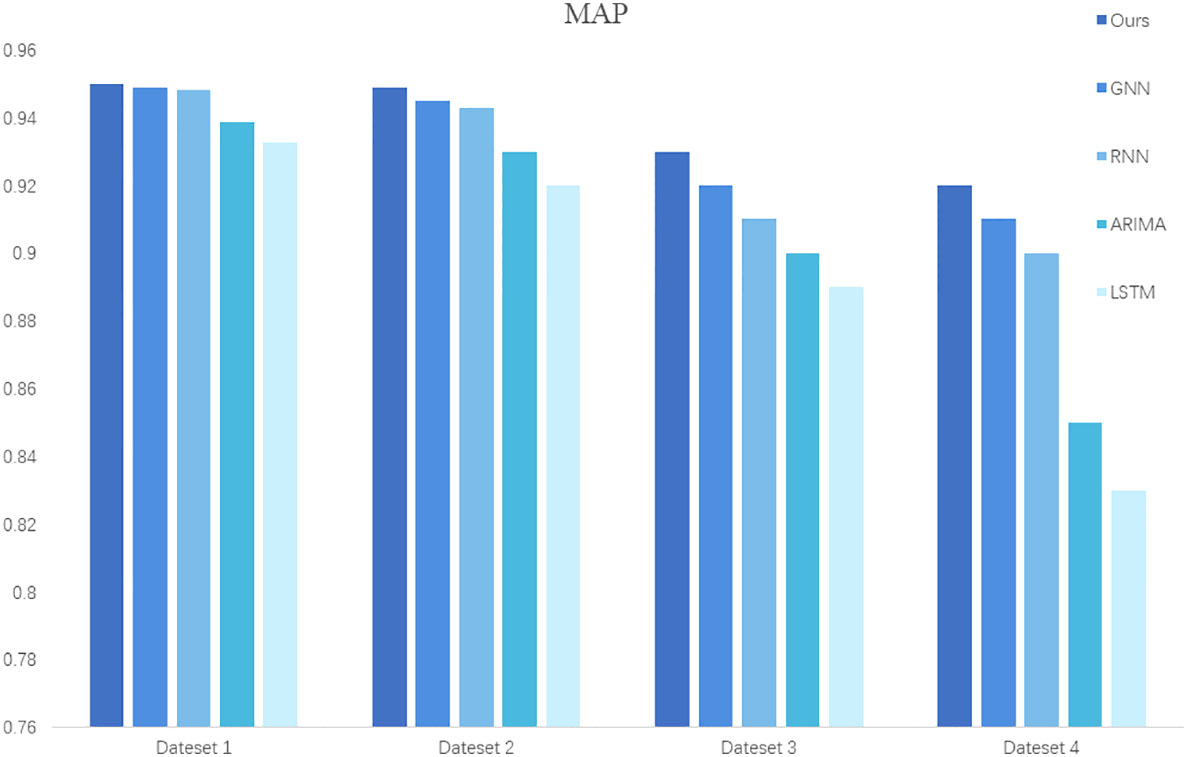
Figure 9 The MAP presented by all models facing different datasets.
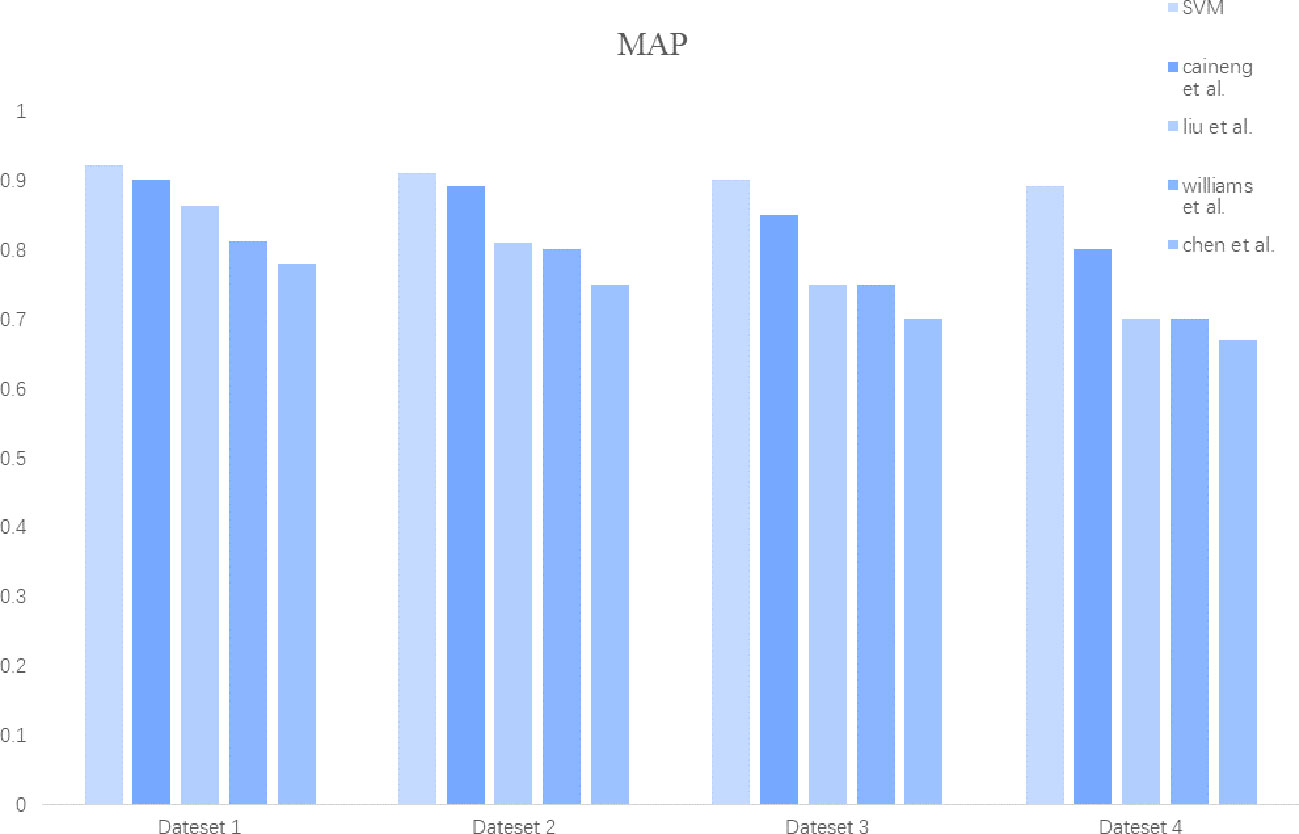
Figure 10 The MAP presented by all models facing different datasets.
In the last two sets of experiments (Figure 11), we designed comparison experiments on the AUC and the Accuracy of the models. Here we only selected two datasets because, through the previous experiments, we found that the two datasets other than the selected ones have negligible effects on the experiments, so we selected two datasets for the convenience of the experiments without losing the scientific nature of the experiments In terms of Accuracy, SVM, LSTM, and GNN all perform well. In terms of AUC and Accuracy, LSTM and GNN perform similarly. Still, through the experimental data plots, we can see at a glance the superiority of our model compared to other models. The higher AUC and higher Accuracy are very helpful for our research on energy saving and emission reduction measures for sports competitions games to achieve carbon neutrality goals.
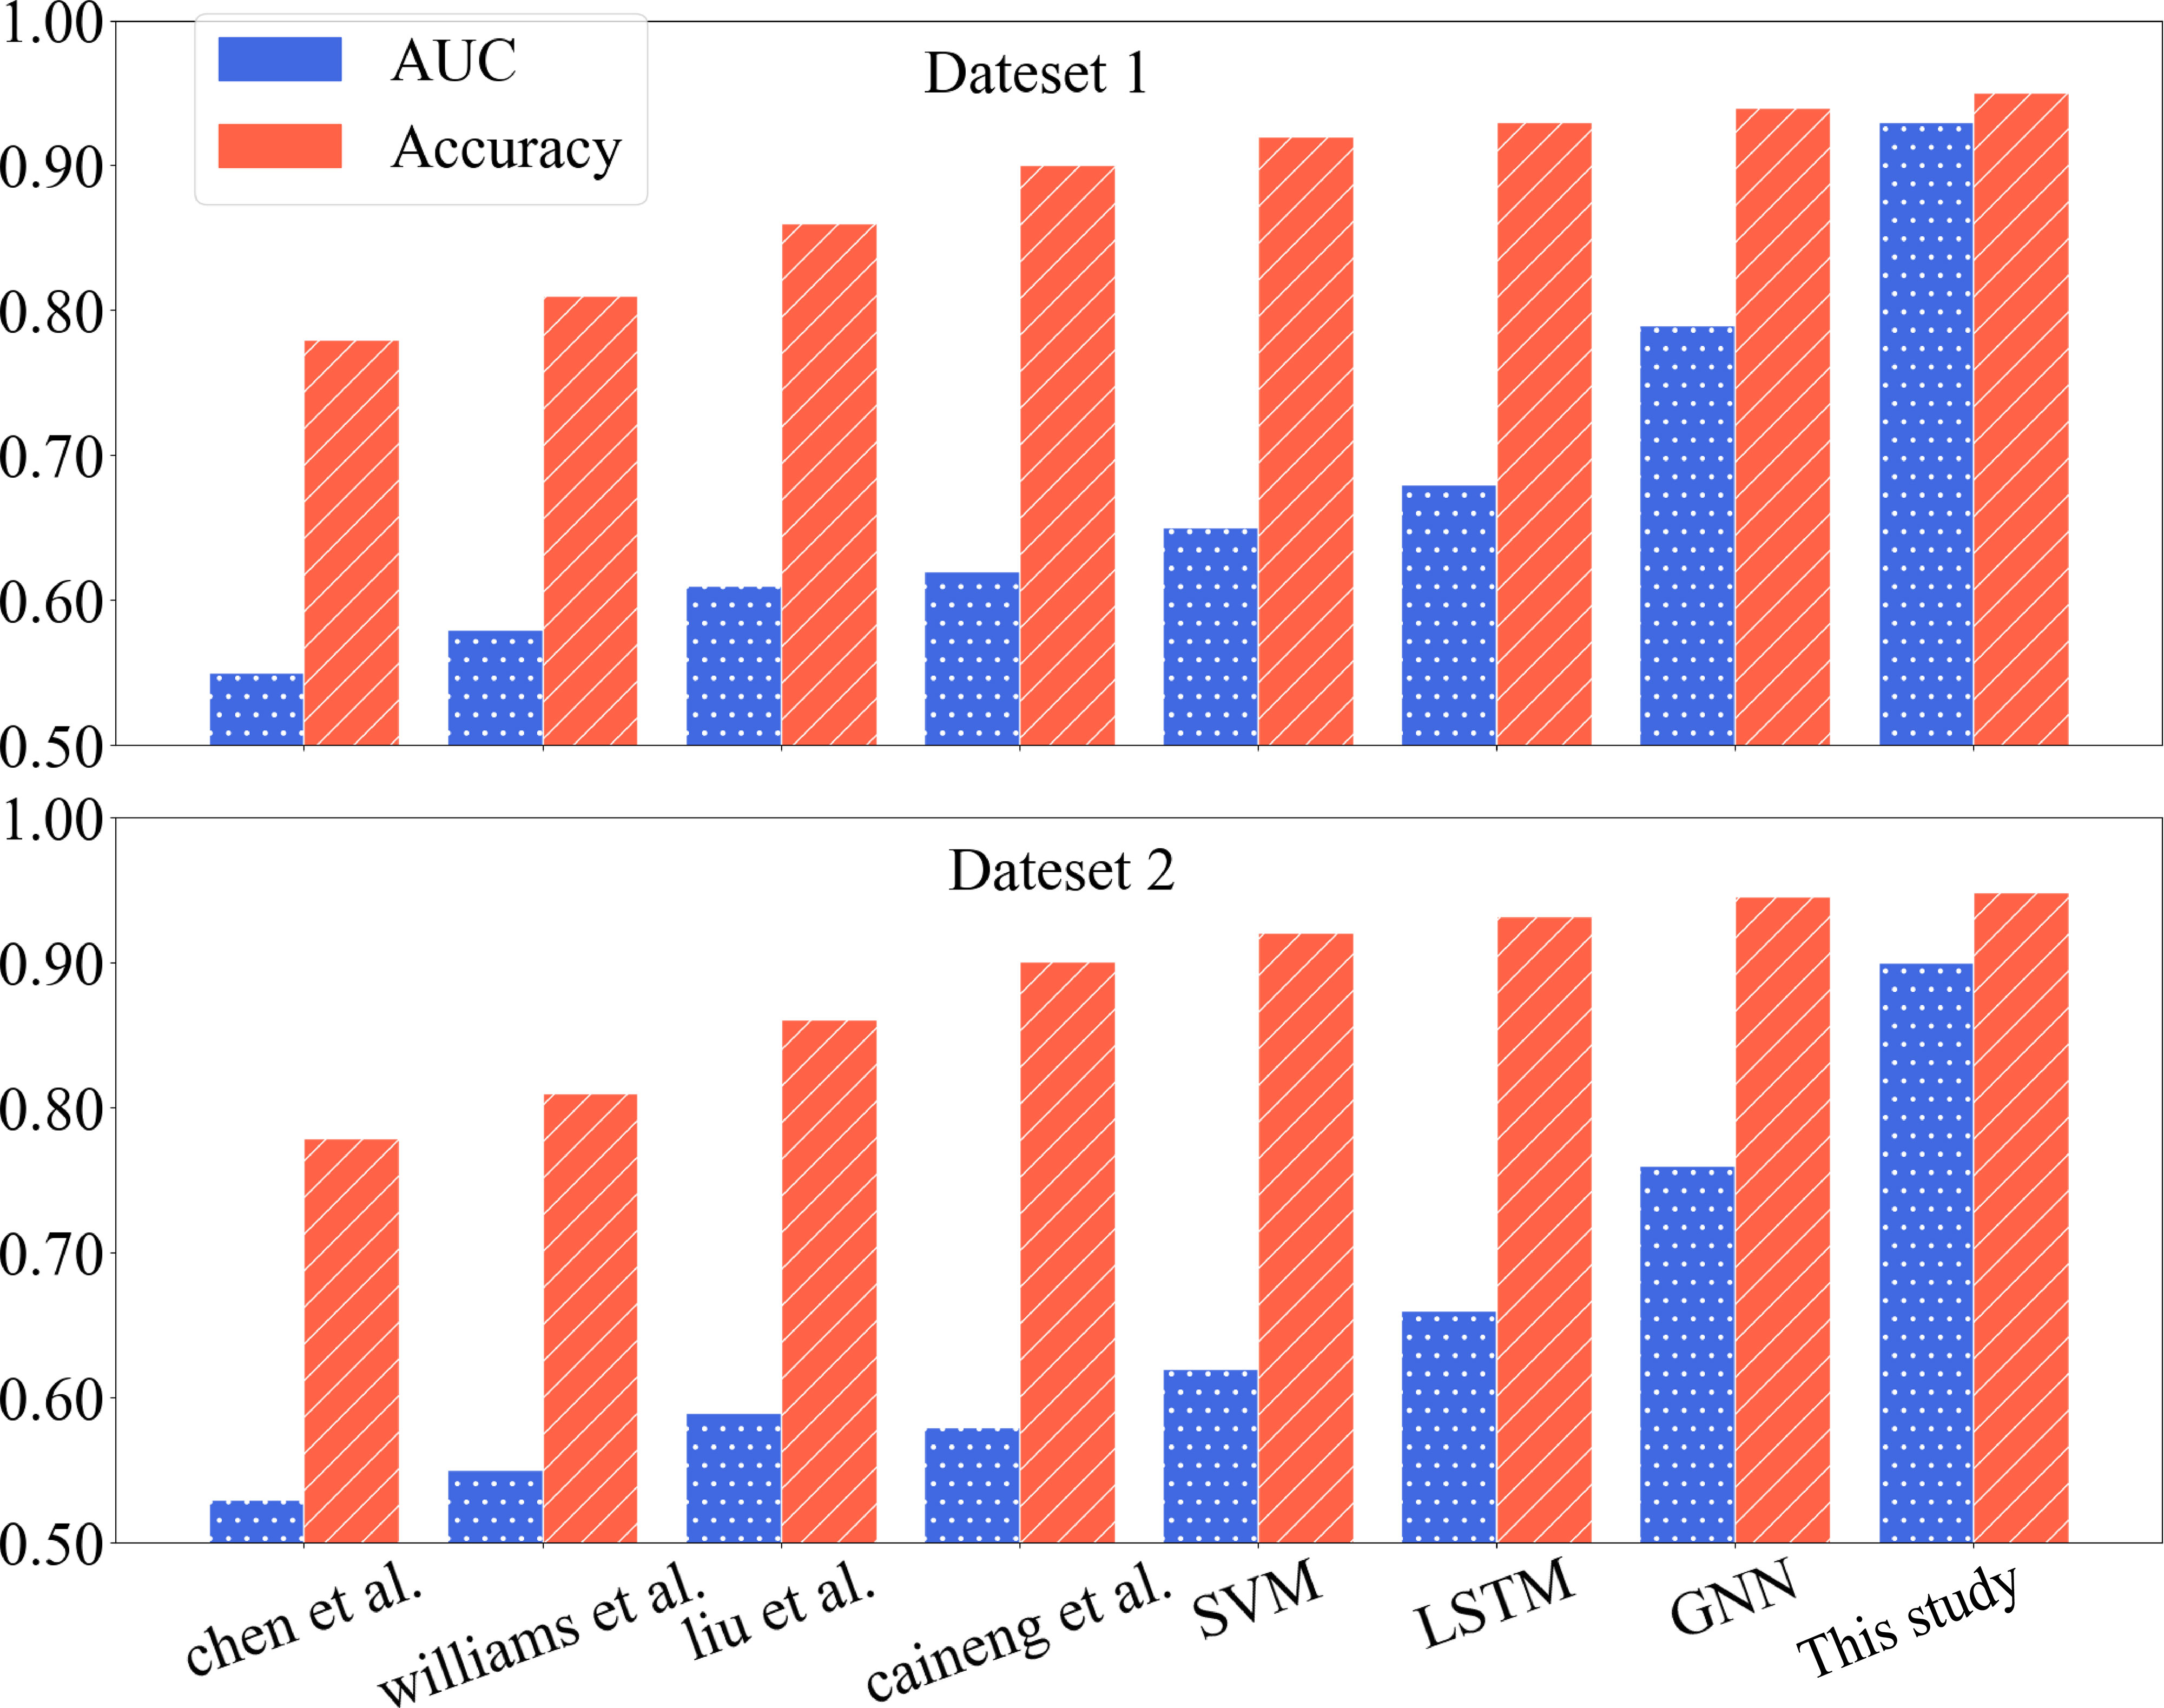
Figure 11 Experimental plots of AUC and accuracy of all models against different data sets.
This is the total data table of our experiments in Table 4, where we have selected several important metrics and the optimal data values for each group of models, with their error margins indicated, to be able to visualize the results of our experiments.
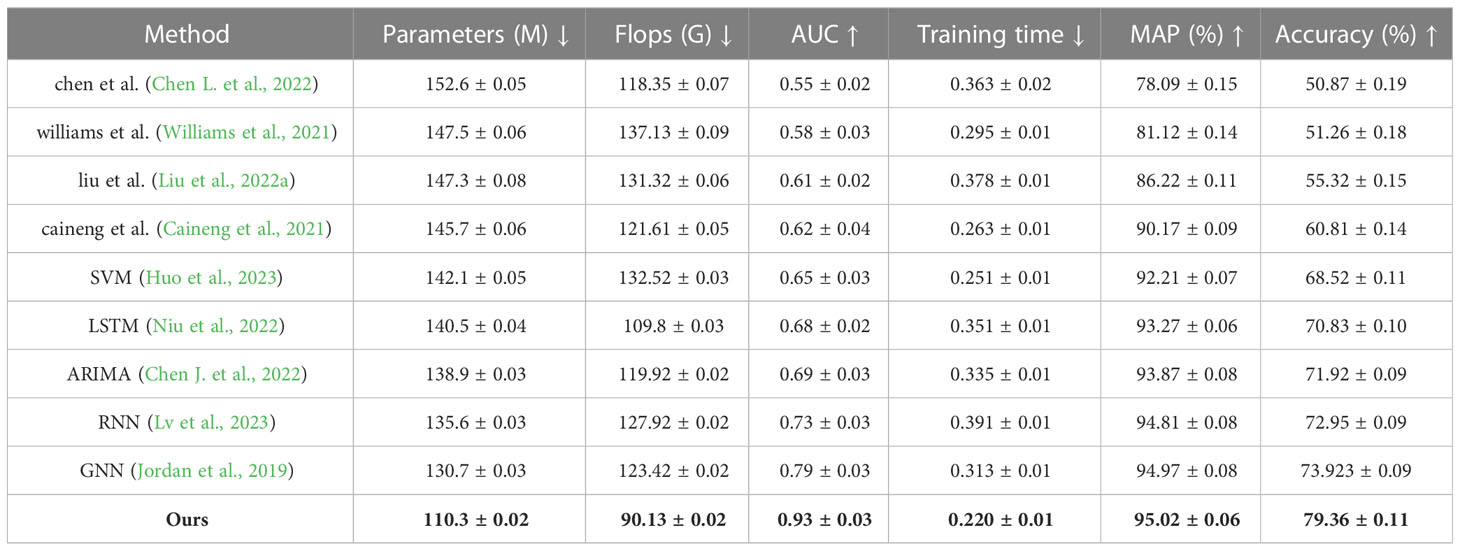
Table 4 Comparison of different control methods.
5 Discussion
Although our CNN-GRU-AM model achieves good results in sequence data processing, our model still has some shortcomings; as it uses the GRU network instead of the LSTM network, it is more computationally intensive in processing longer sequences, which can easily lead to an increase in the time cost of model training and prediction and may result in a compromised computing rate. Because of the deep learning complexity and the degree of model combination, the number of required parameters will also increase year-on-year.
The significance of studying other energy-saving and emission-reduction measures to achieve carbon neutrality in sports competitions is to promote the development of sports competitions in a more sustainable direction and reduce their negative impact on climate change, as well as to provide reference and reference for other large-scale activities and events. The implications include the following: 1. Promoting the sports competitions game in a more sustainable direction: It is a global mega-event, such as the World Cup, which attracts millions of spectators every year and therefore has a great potential to reduce its negative impact on climate change. Studying other energy-saving and emission-reduction measures can provide important technical and practical support for the sustainable development of the tournament. 2. Provide references and lessons for other large-scale activities and events: A tournament is a large-scale event, and its energy-saving and emission-reduction measures and practical experiencescan provide references and lessons for other large-scale activities and events. This is important for promoting various large-scale events worldwide to develop in a more sustainable direction. 3. Strengthen cooperation and communication on global climate change response: Studying different energy-saving and emission reduction measures can promote international cooperation and communication and strengthen cooperation and consensus among countries in addressing climate change. This can help promote the process of the global response to climate change and improve the efficiency and effectiveness of the global response to climate change.
Therefore our research is unique in promoting the game in a more sustainable direction, providing references and lessons for other large-scale activities and events, and strengthening cooperation and communication in the global response to climate change.
6 Conclusion
In this paper, we propose a CNN-GRU based on an attention mechanism for a prediction model of energy saving and emission reduction scheme for sports competitions under carbon neutral target, which effectively solves the problem of gradient disappearance and gradient explosion, and at the same time improves the accuracy and practicality of the model. Multidimensional CNN has strong multi-channel input data processing capability. First, there are different energy-saving and emission-reduction schemes for a sports competitions match to achieve carbon-neutral targets. First, the data of other energy-saving and emission-reduction schemes for achieving the carbon-neutral goal of the sports competitions match is input into the multidimensional CNN network. After convolution for feature extraction, it enters the pooled simplified feature data. Then the simplified feature data is input into the GRU network with the attention layer based on one of the LSTM extensions. The GRU model introduces the gating mechanism to better capture the long-range dependencies in the time series. sports competitions with more efficient efficiency in predicting other energy-saving and emission-reduction options.
Data availability statement
Publicly available datasets were analyzed in this study. We used raw data from the Qatar World Cup Greenhouse Gas Accounting Report, CEADs, UNFCCC, and Climate Watch databases.
Author contributions
JZ and XZ contributed to conception and design of the study. XZ organized the database. JZ performed the statistical analysis. JZ wrote the first draft of the manuscript. JZ and XZ wrote sections of the manuscript. All authors contributed to the article and approved the submitted version.
Funding
The study was supported by National Social Science Fund of China: Practical mechanism of creative evolution of traditional Chinese health preservation (Grant No. 19BTY114).
Conflict of interest
The authors declare that the research was conducted in the absence of any commercial or financial relationships that could be construed as a potential conflict of interest.
Publisher’s note
All claims expressed in this article are solely those of the authors and do not necessarily represent those of their affiliated organizations, or those of the publisher, the editors and the reviewers. Any product that may be evaluated in this article, or claim that may be made by its manufacturer, is not guaranteed or endorsed by the publisher.
References
Al Sholi H. Y., Wakjira T., Kutty A. A., Habib S., Alfadhli M., Aejas B., et al. (2023). How circular economy can reduce scope 3 carbon footprints: lessons learned from fifa world cup qatar 2022. Circ Economy 2, 100026. doi: 10.1016/j.cec.2023.100026
Caineng Z., Xiong B., Huaqing X., Zheng D., Zhixin G., Ying W., et al. (2021). The role of new energy in carbon neutral. Pet. Explor. Dev. 48, 480–491. doi: 10.1016/S1876-3804(21)60039-3
Chen J., Chen Y., Mao B., Wang X., Peng L. (2022). Key mitigation regions and strategies for co2 emission reduction in china based on stirpat and arima models. Environ. Sci. pollut. Res. 29, 51537–51553. doi: 10.1007/s11356-022-19126-w
Chen L., Msigwa G., Yang M., Osman A. I., Fawzy S., Rooney D. W., et al. (2022). Strategies to achieve a carbon neutral society: a review. Environ. Chem. Lett. 20, 2277–2310. doi: 10.1007/s10311-022-01435-8
Dong F., Zhu J., Li Y., Chen Y., Gao Y., Hu M., et al. (2022). How green technology innovation affects carbon emission efficiency: evidence from developed countries proposing carbon neutrality targets. Environ. Sci. pollut. Res. 29, 35780–35799. doi: 10.1007/s11356-022-18581-9
Gui-xiang S., Xian-zhuo Z., Zhang Y.-z., Chen-yu H. (2018). “Research on criticality analysis method of cnc machine tools components under fault rate correlation,” in IOP Conference Series: Materials Science and Engineering, 307, 012023 (IOP Publishing). doi: 10.1088/1757-899X/307/1/012023
Habib S., Al-Ghamdi S. G. (2021). Estimation of above-ground carbon-stocks for urban greeneries in arid areas: case study for doha and fifa world cup qatar 2022. Front. Environ. Sci. 9, 635365. doi: 10.3389/fenvs.2021.635365
Han C., Fu X. (2023). Challenge and opportunity: deep learning-based stock price prediction by using bi-directional lstm model. Front. Bus. Econ. Manage. 8, 51–54. doi: 10.54097/fbem.v8i2.6616
He F., Ye Q. (2022). A bearing fault diagnosis method based on wavelet packet transform and convolutional neural network optimized by simulated annealing algorithm. Sensors 22, 1410. doi: 10.3390/s22041410
Huo Z., Zha X., Lu M., Ma T., Lu Z. (2023). Prediction of carbon emission of the transportation sector in jiangsu province-regression prediction model based on ga-svm. Sustainability 15, 3631. doi: 10.3390/su15043631
Hussain J., Lee C.-C. (2022). A green path towards sustainable development: optimal behavior of the duopoly game model with carbon neutrality instruments. Sustain. Dev. 30 (6), 1523–1541. doi: 10.1002/sd.2325
Ibrahim R. L., Adebayo T. S., Awosusi A. A., Ajide K. B., Adewuyi A. O., Bolarinwa F. O. (2022). Investigating the asymmetric effects of renewable energy-carbon neutrality nexus: can technological innovation, trade openness, and transport services deliver the target for germany? Energy Environ. doi: 10.1177/0958305X221127020
Jordan J. W., Lowe G. A., McSweeney R. L., Stoppiello C. T., Lodge R. W., Skowron S. T., et al. (2019). Host–guest hybrid redox materials self-assembled from polyoxometalates and single-walled carbon nanotubes. Adv. Mater. 31, 1904182. doi: 10.1002/adma.201904182
Li C., Chen Z., Jiao Y. (2023). Vibration and bandgap behavior of sandwich pyramid lattice core plate with resonant rings. Materials 16, 2730. doi: 10.3390/ma16072730
Liu Z., Deng Z., He G., Wang H., Zhang X., Lin J., et al. (2022a). Challenges and opportunities for carbon neutrality in china. Nat. Rev. Earth Environ. 3, 141–155. doi: 10.1038/s43017-021-00244-x
Liu Z., Sun T., Yu Y., Ke P., Deng Z., Lu C., et al. (2022b). Real-time carbon emission accounting technology toward carbon neutrality. Engineering 14, 44–51. doi: 10.1016/j.eng.2021.12.019
Lv Z., Wang N., Lou R., Tian Y., Guizani M. (2023). Towards carbon neutrality: prediction of wave energy based on improved gru in maritime transportation. Appl. Energy 331, 120394. doi: 10.1016/j.apenergy.2022.120394
Ning X., Duan P., Li W., Zhang S. (2020). Real-time 3d face alignment using an encoder-decoder network with an efficient deconvolution layer. IEEE Signal Process. Lett. 27, 1944–1948. doi: 10.1109/LSP.2020.3032277
Ning X., Tian W., He F., Bai X., Sun L., Li W. (2023). Hyper-sausage coverage function neuron model and learning algorithm for image classification. Pattern Recognition 136, 109216. doi: 10.1016/j.patcog.2022.109216
Niu H., Zhang Z., Xiao Y., Luo M., Chen Y. (2022). A study of carbon emission efficiency in chinese provinces based on a three-stage sbm-undesirable model and an lstm model. Int. J. Environ. Res. Public Health 19, 5395. doi: 10.3390/ijerph19095395
Osorio A. M., Úsuga L. F., Vásquez R. E., Nieto-Londoño C., Rinaudo M. E., Martínez J. A., et al. (2022). Towards carbon neutrality in higher education institutions: case of two private universities in colombia. Sustainability 14, 1774. doi: 10.3390/su14031774
Ran H., Ning X., Li W., Hao M., Tiwari P. (2023). 3d human pose and shape estimation via de-occlusion multi-task learning. Neurocomputing 548, 126284. doi: 10.1016/j.neucom.2023.126284
Shen G., Han C., Chen B., Dong L., Cao P. (2018). Fault analysis of machine tools based on grey relational analysis and main factor analysis. J. Physics: Conf. Ser. (IOP Publishing) 1069, 012112. doi: 10.1088/1742-6596/1069/1/012112
Shen G., Zeng W., Han C., Liu P., Zhang Y. (2017). Determination of the average maintenance time of cnc machine tools based on type ii failure correlation. Eksploatacja i Niezawodność 19 (4), 604–614. doi: 10.17531/ein.2017.4.15
Song Z., Johnston R. M., Ng C. P. (2021). Equitable healthcare access during the pandemic: the impact of digital divide and other sociodemographic and systemic factors. Appl. Res. Artif. Intell. Cloud Comput. 4, 19–33.
Song Z., Mellon G., Shen Z. (2020). Relationship between racial bias exposure, financial literacy, and entrepreneurial intention: an empirical investigation. J. Artif. Intell. Mach. Learn. Manage. 4, 42–55.
Wan X., Li X., Wang X., Yi X., Zhao Y., He X., et al. (2022). Water quality prediction model using gaussian process regression based on deep learning for carbon neutrality in papermaking wastewater treatment system. Environ. Res. 211, 112942. doi: 10.1016/j.envres.2022.112942
Wang J., Yu C. W., Cao S.-J. (2021). Technology pathway of efficient and climate-friendly cooling in buildings: towards carbon neutrality. Indoor Built Environ. 30 (9), 1307–1311. doi: 10.1177/1420326X211027365
Wenya L. (2021). “Cooling, heating and electric load forecasting for integrated energy systems based on cnn-lstm,” in 2021 6th International Conference on Power and Renewable Energy (ICPRE) (IEEE). 808–812. Available at: https://ieeexplore.ieee.org/abstract/document/9635244.
Williams J. H., Jones R. A., Haley B., Kwok G., Hargreaves J., Farbes J., et al. (2021). Carbon-neutral pathways for the united states. AGU Adv. 2, e2020AV000284. doi: 10.1029/2020AV000284
Yang F., Liu D., Zeng Q., Chen Z., Ye Y., Yang T., et al. (2022). “Prediction of mianyang carbon emission trend based on adaptive gru neural network,” in 2022 4th International Conference on Frontiers Technology of Information and Computer (ICFTIC) (IEEE). 747–750.
Yang Z., Sun L., Sun Y., Dong Y., Wang A. (2023). A conceptual model of home-based cardiac rehabilitation exercise adherence in patients with chronic heart failure: a constructivist grounded theory study. Patient Preference Adherence 17, 851. doi: 10.2147/PPA.S404287
Zhang S., Bai X., Zhao C., Tan Q., Luo G., Wu L., et al. (2022). China’s carbon budget inventory from 1997 to 2017 and its challenges to achieving carbon neutral strategies. J. Clean. Product. 347, 130966. doi: 10.1016/j.jclepro.2022.130966
Zhang Y., Mu L., Shen G., Yu Y., Han C. (2019). Fault diagnosis strategy of cnc machine tools based on cascading failure. J. Intell. Manuf. 30, 2193–2202. doi: 10.1007/s10845-017-1382-7
Zhang H., Zhang F., Gong B., Zhang X., Zhu Y. (2023). The optimization of supply chain financing for bank green credit using stackelberg game theory in digital economy under internet of things. J. Organizational End User Comput. (JOEUC) 35, 1–16.
Keywords: CNN, GRU, attention mechanism, carbon neutral, sports competitions game, energy saving and emission reduction
Citation: Zhang J and Zhang X (2023) Fusion model with attention mechanism for carbon-neutral sports competitions. Front. Ecol. Evol. 11:1212732. doi: 10.3389/fevo.2023.1212732
Received: 26 April 2023; Accepted: 01 June 2023;
Published: 03 July 2023.
Edited by:
Praveen Kumar Donta, Vienna University of Technology, AustriaCopyright © 2023 Zhang and Zhang. This is an open-access article distributed under the terms of the Creative Commons Attribution License (CC BY). The use, distribution or reproduction in other forums is permitted, provided the original author(s) and the copyright owner(s) are credited and that the original publication in this journal is cited, in accordance with accepted academic practice. No use, distribution or reproduction is permitted which does not comply with these terms.
*Correspondence: Jun Zhang, emhhbmdqdW4yQHNkcGVpLmVkdQ==