 Wenxin Li
 Xiao Wang
 Lianjun Chen3
- 1College of Energy and Mining Engineering, Shandong University of Science and Technology, Qingdao, China
- 2Mine Disaster Prevention and Control-Ministry of State Key Laboratory Breeding Base, Shandong University of Science and Technology, Qingdao, China
- 3College of Safety and Environment Engineering, Shandong University of Science and Technology, Qingdao, China
The blast-induced vibration during excavation by the drilling and blasting method has an important impact on the surrounding buildings/structures and auxiliary equipment. In particular, with the development of tunnel engineering, the impact of blasting vibration on tunnel construction has attracted extensive attention. Based on literature data statistics, this paper first explored the performance of several commonly used empirical equations in predicting the propagation and attenuation characteristics of blasting vibration on adjacent tunnels. Secondly, the relationships between the empirical parameters of the blasting vibration prediction equation and the geological strength index (GSI) of tunnel surrounding rock were discussed, and two new blasting vibration prediction equations based on site rock GSI were established to approximately predict blast-induced vibration on adjacent tunnels. Finally, the application feasibility of the established prediction equation in practical engineering was discussed based on field test data. The research results show that under the condition of multiple groups of data, the prediction performance of various prediction models does not differ significantly. With the increase of the GSI of the surrounding rock mass of the adjacent tunnel, the site coefficients β and k of the blasting vibration prediction equation in predicting PPV (peak particle velocity, resultant velocity) both show a decreasing trend as a whole. The site coefficient k is generally within 3,000. Two new empirical prediction equations of blasting vibration propagation and attenuation on adjacent tunnels under different site conditions were established: Eq. (14) for PPV and Eq. (15) for PPVi (max) (maximum value of the three component velocities; i = x, y, z represent peak component particle velocity). The verification analysis of five sites shows that these two equations have a certain practical application value. Compared with other empirical equations, these two equations do not need regression fitting blasting vibration data, they only used the GSI of the site rock mass, and they are more easy to use in the field when there is a lack of monitoring data.
1 Introduction
The drilling and blasting method is a widely used method for tunnel construction, resource mining, and other rock engineering aspects since it has the advantages of simple construction, strong adaptability to geological conditions, and low cost (Ocak and Bilgin, 2010; Wang et al., 2022). However, it also brings many negative effects such as blasting vibration, air shock wave, flying rock, noise, and toxic gas and dust (Murmu et al., 2018). Among these negative effects, blasting vibration can very easily cause damage to nearby buildings/structures or related facilities (Zhou and Jenssen, 2009; Li et al., 2013).
PPV/PPVi and frequency are common parameters for evaluating blasting vibration hazards (Lu, 2005; Wu and Hao, 2005). Both of them are necessary to determine the response of neighboring buildings/structures in different geological formations. In particular, when the frequency of blasting vibration is close to the natural vibration frequency of surrounding buildings/structures or related facilities, the blasting vibration may be amplified several times due to resonance, and the harm to surrounding buildings/structures or related facilities will also increase (Sisikind et al., 1980). For this reason, most blasting vibration safety standards take into account the frequency dependence of the vibration damage potential (BS3785-2, 1993; Lu et al., 2012; Yilmaz, 2016).
However, PPV/PPVi is still the basis of many blasting vibration safety standards and is also considered to be the most important parameter for evaluating blasting vibration hazards (Nateghi et al., 2009; Yilmaz, 2016). A large number of monitoring, tests, and theoretical studies show that the PPV is mainly related to the explosive charge, distance between blasting source and monitoring points, and site conditions, and the widely used blasting vibration prediction equation was established (Murmu et al., 2018) as:
where k and β are site-specific constants that describe the characteristic of propagating media, blasting design, and geology; scaled distance, SD = R/Qa, is the ratio of distance of monitoring point from the geometric center of the blasting area, R (m), to the maximum charge per delay, Qa (kg); a is the scaled distance relationship constant. Table 1 summarizes the common forms and extended forms of Eq. (1).
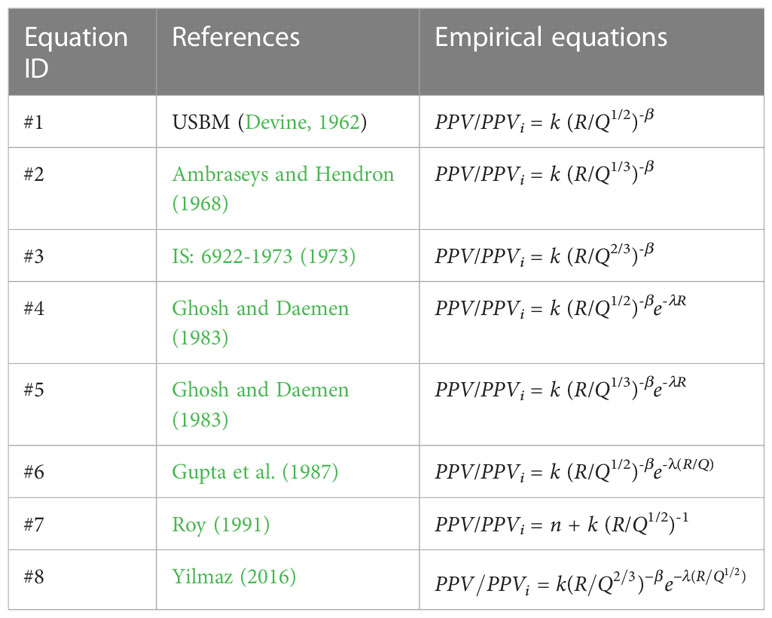
Table 1 Summary of commonly used PPV prediction equations.
Note: R is the distance of monitoring point from the geometric center of the blasting area; Q is the maximum charge per delay; k and β are site-specific constants that describe the characteristic of propagating media, >0; λ represents the inelastic attenuation factor of site, >0; n represents the energy diminishing influenced by rock properties and geological discontinuities (e.g., faults, fractures, joints, fissures, and bedding planes), and is a decay constant,<0.
Generally, the prediction equations shown in Table 1 are often used to predict PPV/PPVi on the ground surface and strata (Zhou and Jenssen, 2009; Jayasinghe et al., 2019; Li et al., 2021). In recent years, with the continuous development of underground tunnel engineering, some equations in Table 1 are also used to predict PPV/PPVi on tunnel structures. For example, based on empirical equations provided by USBM (Devine, 1962) or Ambraseys and Hendron (1968); Singh (2002) and Abolghasemifar et al. (2018) investigated the response and attention characteristics of blasting vibration on the roof, pillar/sidewall, and/or floor of underground coal mines from adjacent open-pit blasting/underground tunneling; Zhao et al. (2016); Sharafat et al. (2019), and Zhang et al. (2021) analyzed the attention characteristics on underground rock tunnel floor from adjacent tunnel blasting; and Zhou et al. (2018); Wang et al. (2019), and Zhu et al. (2021) discussed the attention characteristics on underground rock tunnel sidewall from adjacent tunnel blasting. These studies show that it is feasible to use empirical equation to predict blasting vibration on adjacent tunnel structures. However, there are few literature that explored and compared the prediction performance of different empirical equations shown in Table 1 for predicting PPV/PPVi on adjacent tunnels. In addition, there are few studies on the relationship between the parameters of prediction equations and the geological parameters of tunnel surrounding rock. When there are no blasting vibration data, the application of blasting vibration prediction equation is usually limited.
In this paper, first, based on the collected data of blasting vibration response on the adjacent tunnel structures, the prediction performance of various empirical equations shown in Table 1 in predicting PPV/PPVi was investigated, and some of the empirical equations were recommended to predict PPV/PPVi on the adjacent tunnels. Secondly, the relationships between the empirical parameters of blasting vibration prediction equation and the mechanical properties of tunnel surrounding rock were analyzed. Finally, the application feasibility of the established prediction equation in practical engineering was discussed based on field data. This study has some practical value for the safety control of blast-induced tunnel disasters, especially in the case of lack of on-site blasting vibration data.
2 Performance of different empirical equations in predicting PPV/PPVi on adjacent tunnels
2.1 Data collection
Within the scope of this study, to compare the prediction performance of different empirical equations in predicting PPV/PPVi on adjacent tunnels, the results of the vibration measurements on adjacent tunnels from previous studies were analyzed carefully. A total of 21 sets of data were collected from eight references, as shown in Table 2. Among these data, three sets of data are about PPV, four sets of data are about PPVx, six sets of data are about PPVy, and eight sets of data are about PPVz.
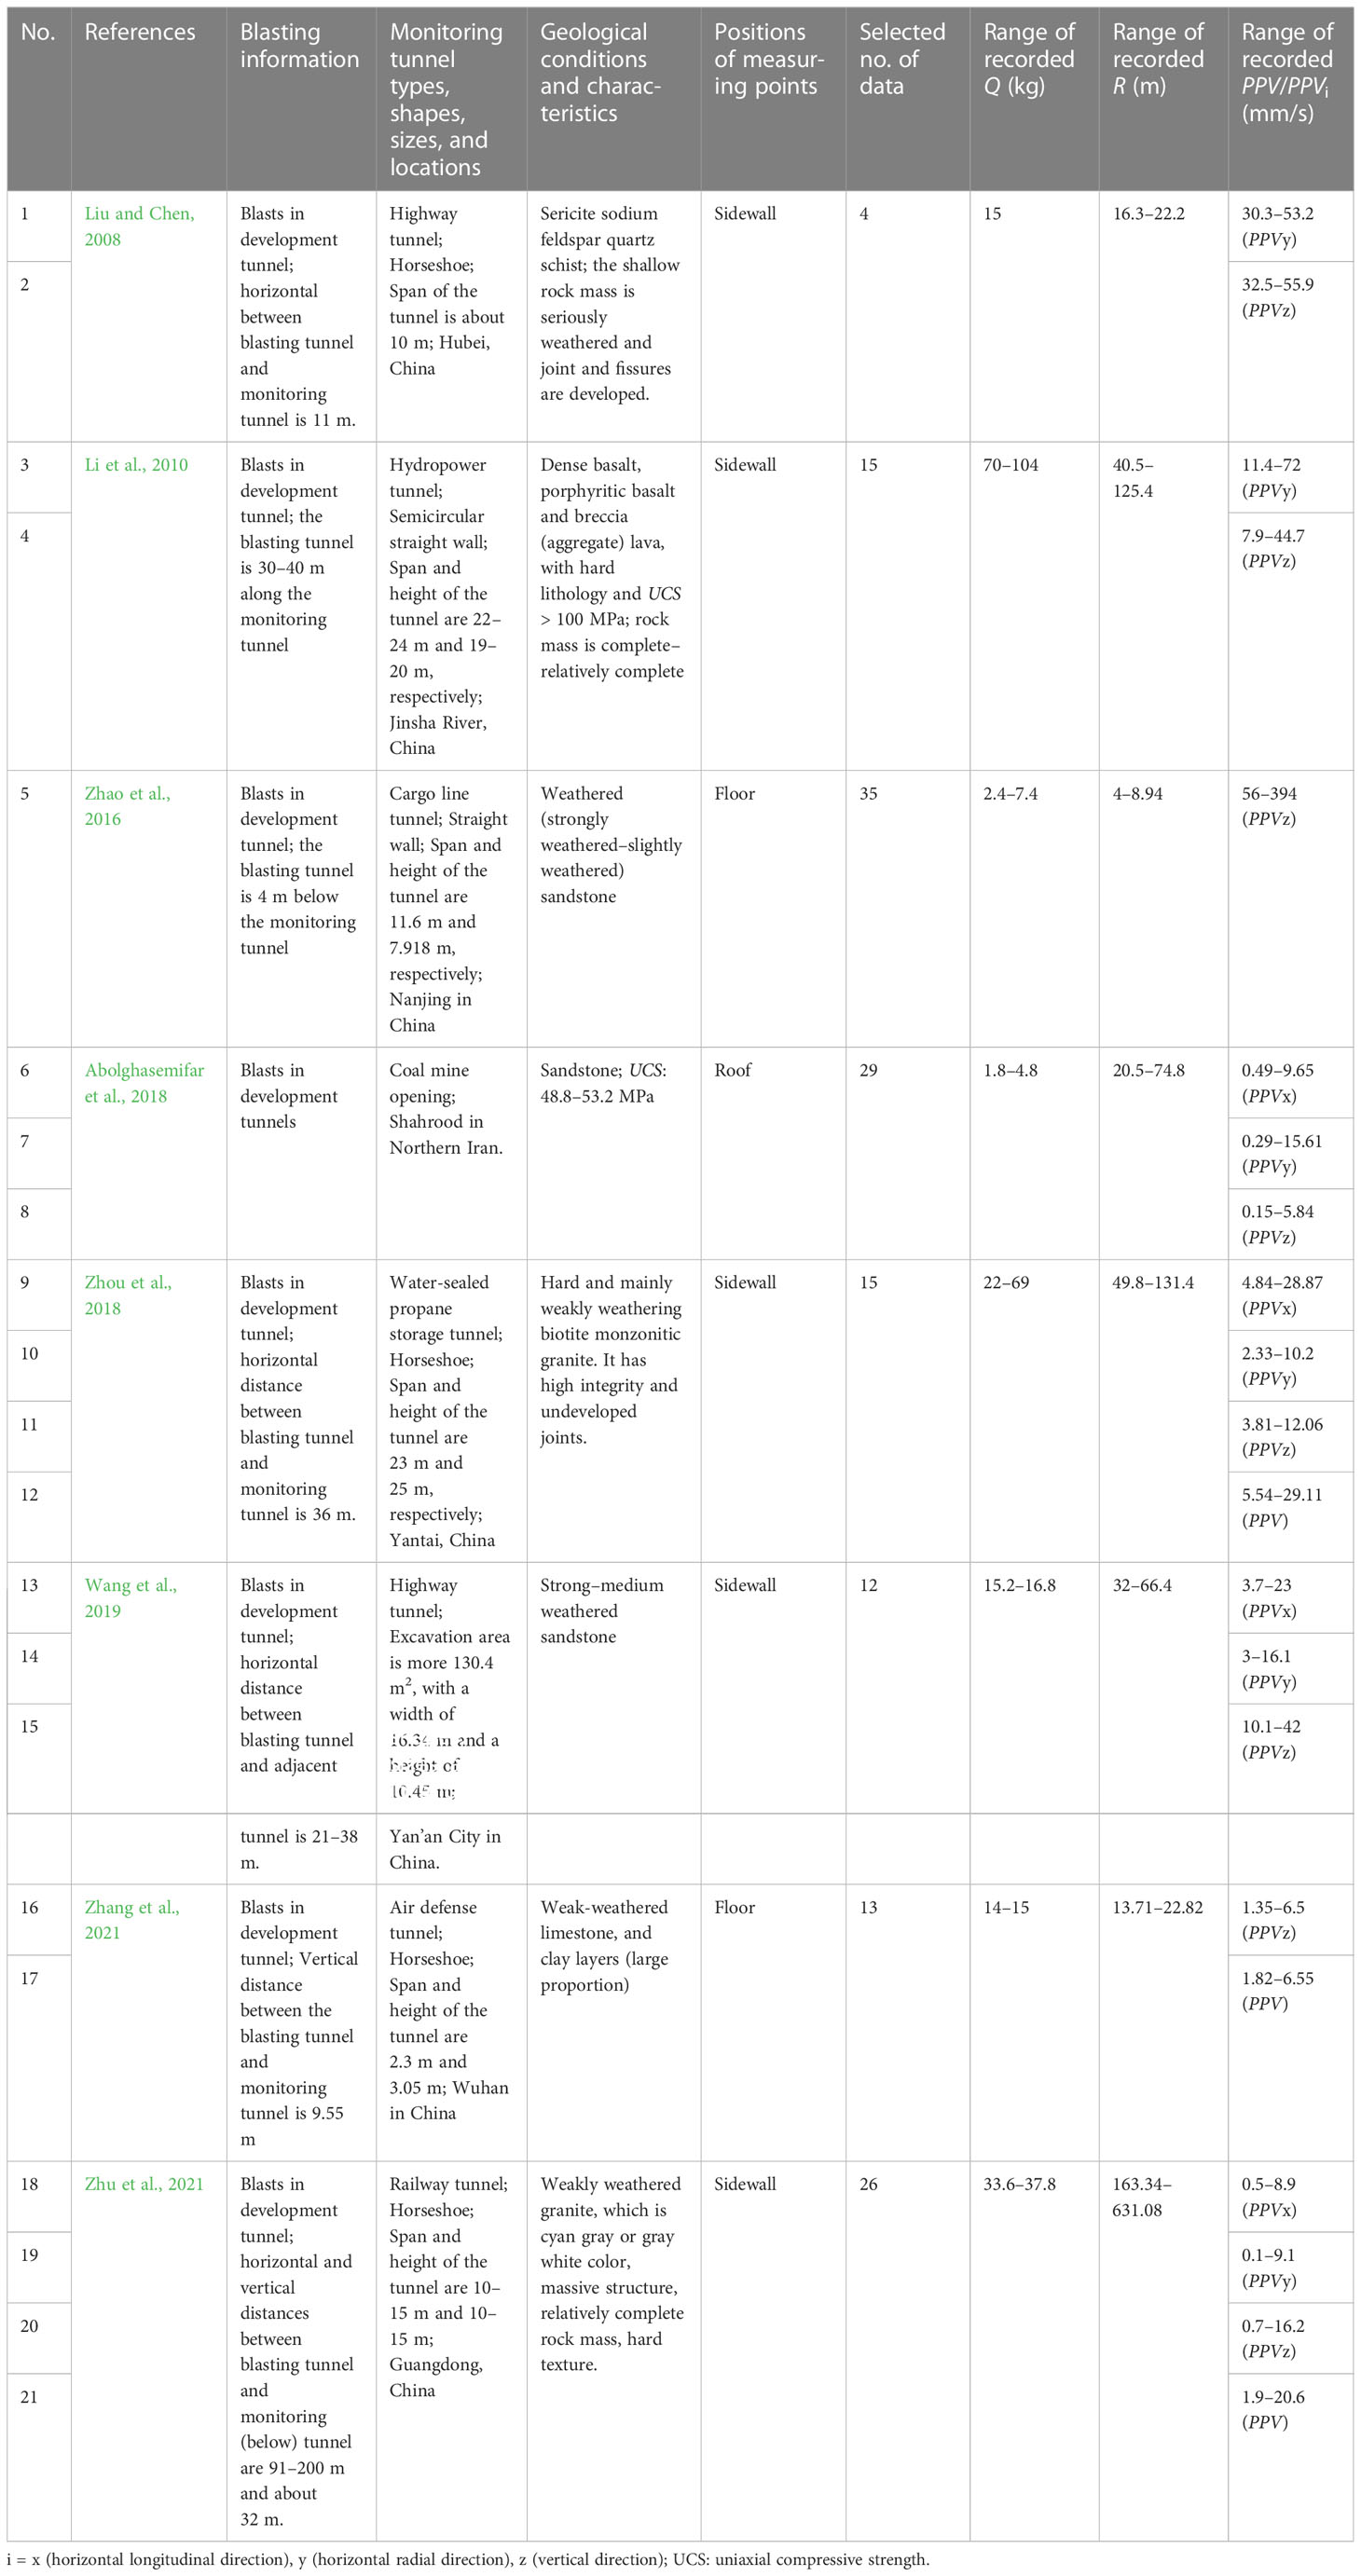
Table 2 Collected data about blast-induced vibration propagation and attention on adjacent tunnels.
The blasting conditions, geological conditions, and tunnel characteristics of the data acquisition site are different. As far as the sources of blasting vibration are concerned, most of them come from the blasting of adjacent excavated tunnels. The geological conditions of blasting vibration site vary widely, including not only slightly weathered rock mass with high compressive strength, but also strongly weathered, cataclastic rock mass with low compressive strength. The shape and scale of the monitoring tunnel are also different. Generally, the span of the monitoring tunnels are between 10 and 30 m. The relationship between monitoring tunnel and adjacent blasting tunnel mainly includes horizontal parallel, vertical parallel, and intersection. The distance between monitoring tunnel and blasting tunnel is generally between 4 and 50 m. The monitoring points are mainly on the side wall, floor, and roof the adjacent tunnels.
The details of the data sets used in this work including PPV/PPVi, maximum charge per delay, and distances are evaluated by using different empirical equations shown in Table 1. The performance assessment method will be explained in the following section.
2.2 Performance assessment method
Regression analysis technique was used to analyze the relationships between PPV/PPVi and the maximum charge per delay, the distance between blasting source, and monitoring points. In order to establish a relationship among those parameters, simple and multiple linear regression analyses were performed using the data given in Table 2.
If the dependent variable is a linear combination of the one independent variable, it is called simple linear regression. Similarly, if the dependent variable is a linear combination of the several independent variables, it is called multiple linear regression. The basic simple and multiple linear regression models for one and two independent variables are given below:
where Y is the dependent variable, X1 and X2 are the independent variables, and A, B, and C are the constants.
As shown in Table 1, for equation ID = 1–4, the PPV/PPVi is the dependent variable, SD = R/Qa is the independent variable, and k and β are the constants greater than 0. Therefore, these types of equations are suitable for simple regression analysis. Basic equations are linearized by taking the natural logarithm of both sides, and we get
Equation ID = 7 is also a simple regression analysis, as PPV/PPVi is the dependent variable, SD = R/Q1/2 is the independent variable, and n is the constant less than 0. The basic equation for a simple regression analysis is:
Equation ID = 5–6 and 8 are suitable for multiple linear regression. In these types of equations, PPV/PPVi is the dependent variable; SD, R, R/Q, and R/Q0.5 are the independent variables; and, k, β, and λ are the constants greater than 0. Basic equations are linearized by taking the natural logarithm of both sides, and we get
Two statistical criteria, namely, determination coefficient (R2) and root-mean-square error (RMSE), were used to evaluate the performance of the empirical equations shown in Table 1 in predicting PPV/PPVi on adjacent tunnels. The expressions of the R2 and RMSE are as follows (Yan et al., 2020a):
where N is the number of data sets, and yi, yp, and ymean are the measured, predicted, and mean of values, respectively. Theoretically, if R2 approaches 1, and RMSE approaches 0, the predicted equation is optimal.
2.3 Result analysis
Figure 1 shows the performance of different empirical equations in predicting PPV/PPVi on different adjacent tunnel structures (roof, sidewall, or floor). It can be seen from the figure that the prediction performance of various empirical equations in predicting PPV/PPVi at different sites is different. Under different site conditions, various equations may become the best prediction equation; that is, under each site condition, the best prediction equation is uncertain.
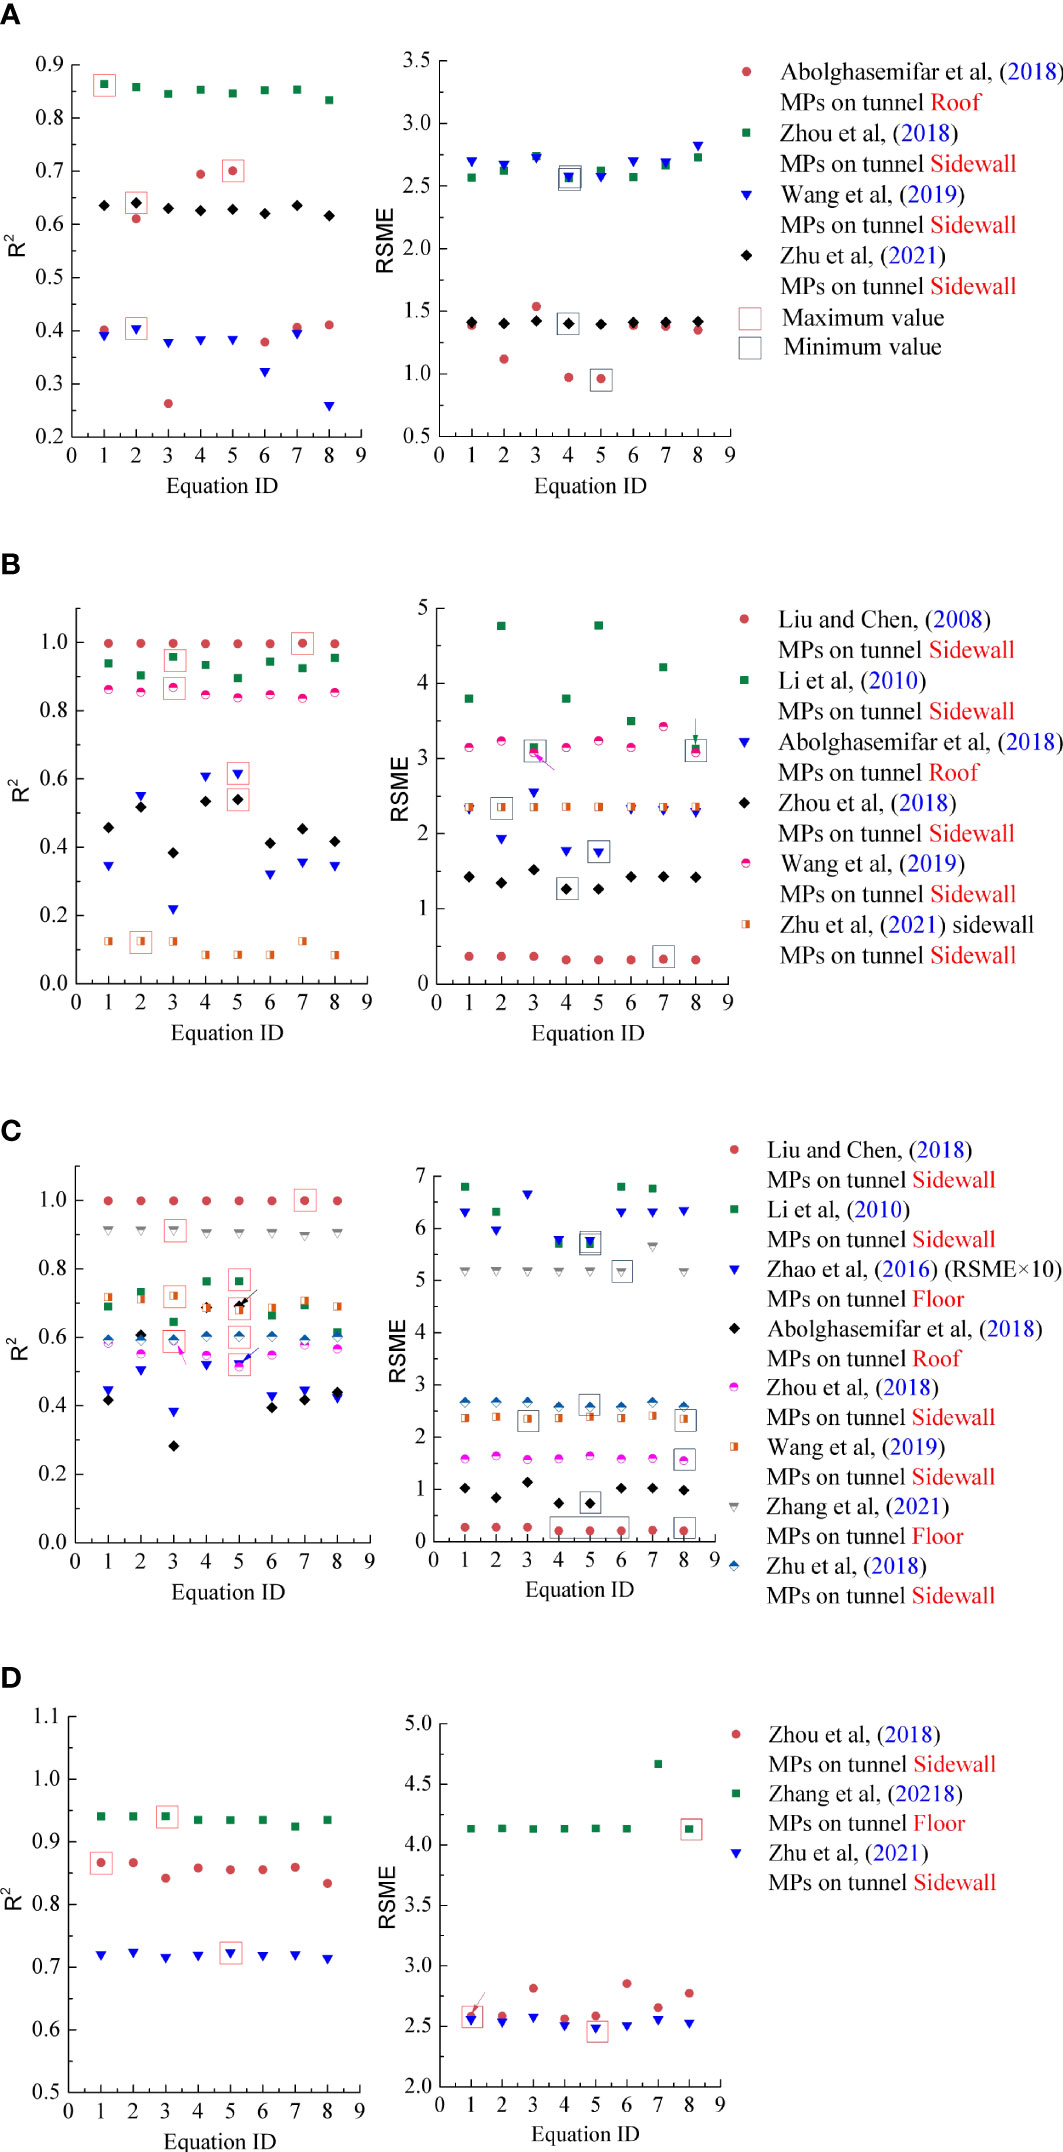
Figure 1 Performance of different empirical equations in predicting (A) PPVx, (B) PPVy, (C) PPVz, and (D) PPV on adjacent tunnels; MPs: measuring points; RSME×10: the value of RSME in the figure should enlarge 10 times.
For some site data, the prediction accuracy of empirical equations is high, R2 can reach more than 0.9, and RMSE is small. However, the prediction accuracy of empirical equations is relatively low in predicting PPV/PPVi in some site data, R2 is lower than 0.4, and the value of RSME is relatively large. This shows that it is feasible to use empirical equation to predict the propagation of blasting vibration in adjacent tunnels, but there is also the risk of insufficient prediction.
For the same set of data of most sites, whether the data are monitored on the tunnel roof, floor, or sidewall, the prediction accuracy of various prediction equations is not very different (the difference of R2 is less than 0.2). However, for the data from mining tunnels (Abolghasemifar et al., 2018), the prediction accuracy of each prediction model varies greatly, and the prediction accuracy is not particularly high. The main reasons may be the complexity of mining tunnel, the obvious effect of various roadway cavity effects (Singh, 2002), and the applicability of most prediction equations is not good.
In order to comprehensively evaluate which empirical equations can be better applied to the prediction of blasting vibration propagation on adjacent tunnels, we analyze the average value of the prediction performance of empirical equations under various site conditions. The average values of R2 and RSME are calculated as follows:
where represents the average value of the R2 or RSME in all the data sets, n represents the number of data sets, and represents the value of the R2 or RSME in one data set.
Figure 2 shows the comprehensive performance of different empirical equations in predicting PPV/PPVi on adjacent tunnels. It can be seen from the figure that under the condition of multiple groups of data, the prediction difference of various prediction models is not very large. In terms of the data collected in this paper, the maximum differences of R2 and RSME between various prediction equations are 0.071 and 0.091. Therefore, it can be concluded that any equation in Table 1 can be used to predict the propagation and attenuation characteristics of blasting vibration on adjacent tunnels. However, considering the simplicity of application, that is, the fewer the parameters of the equation, the better, it is suggested that the first three equations are used [especially the equation provided by Ambraseys and Hendron (1968) since it has the best prediction performance among the three equations] to predict the propagation and attenuation characteristics of blasting vibration on adjacent tunnels.
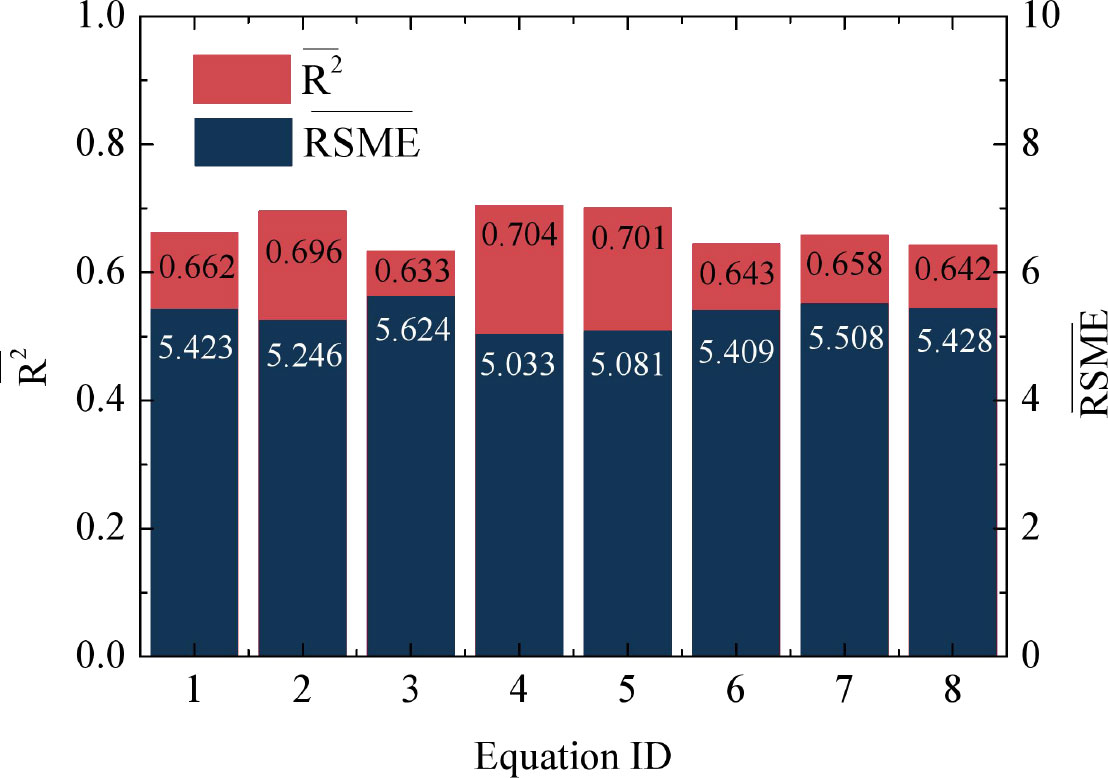
Figure 2 Comprehensive performance of different empirical equations in predicting PPV/PPVi on adjacent tunnels.
3 Relationships between PPV/PPVi prediction equation coefficients and tunnel geology
It is very important to study the relationship between the relevant parameters of empirical equations and tunnel geological characteristics for the prediction of blasting vibration on adjacent tunnels, especially when there is no blasting vibration data. In this section, the relationships between them were studied.
According to Figure 3, the site coefficients k and β (attenuation index, which can be used to represent the attenuation characteristics of blasting vibration on tunnels) are not consistent in different empirical equations for prediction PPV/PPVi in the same site. In this study, the site coefficients k and β in the empirical equation provided by Ambraseys and Hendron (1968) were adopted to analyze the relationships with tunnel geological conditions since it has the best prediction performance of the first three equations.
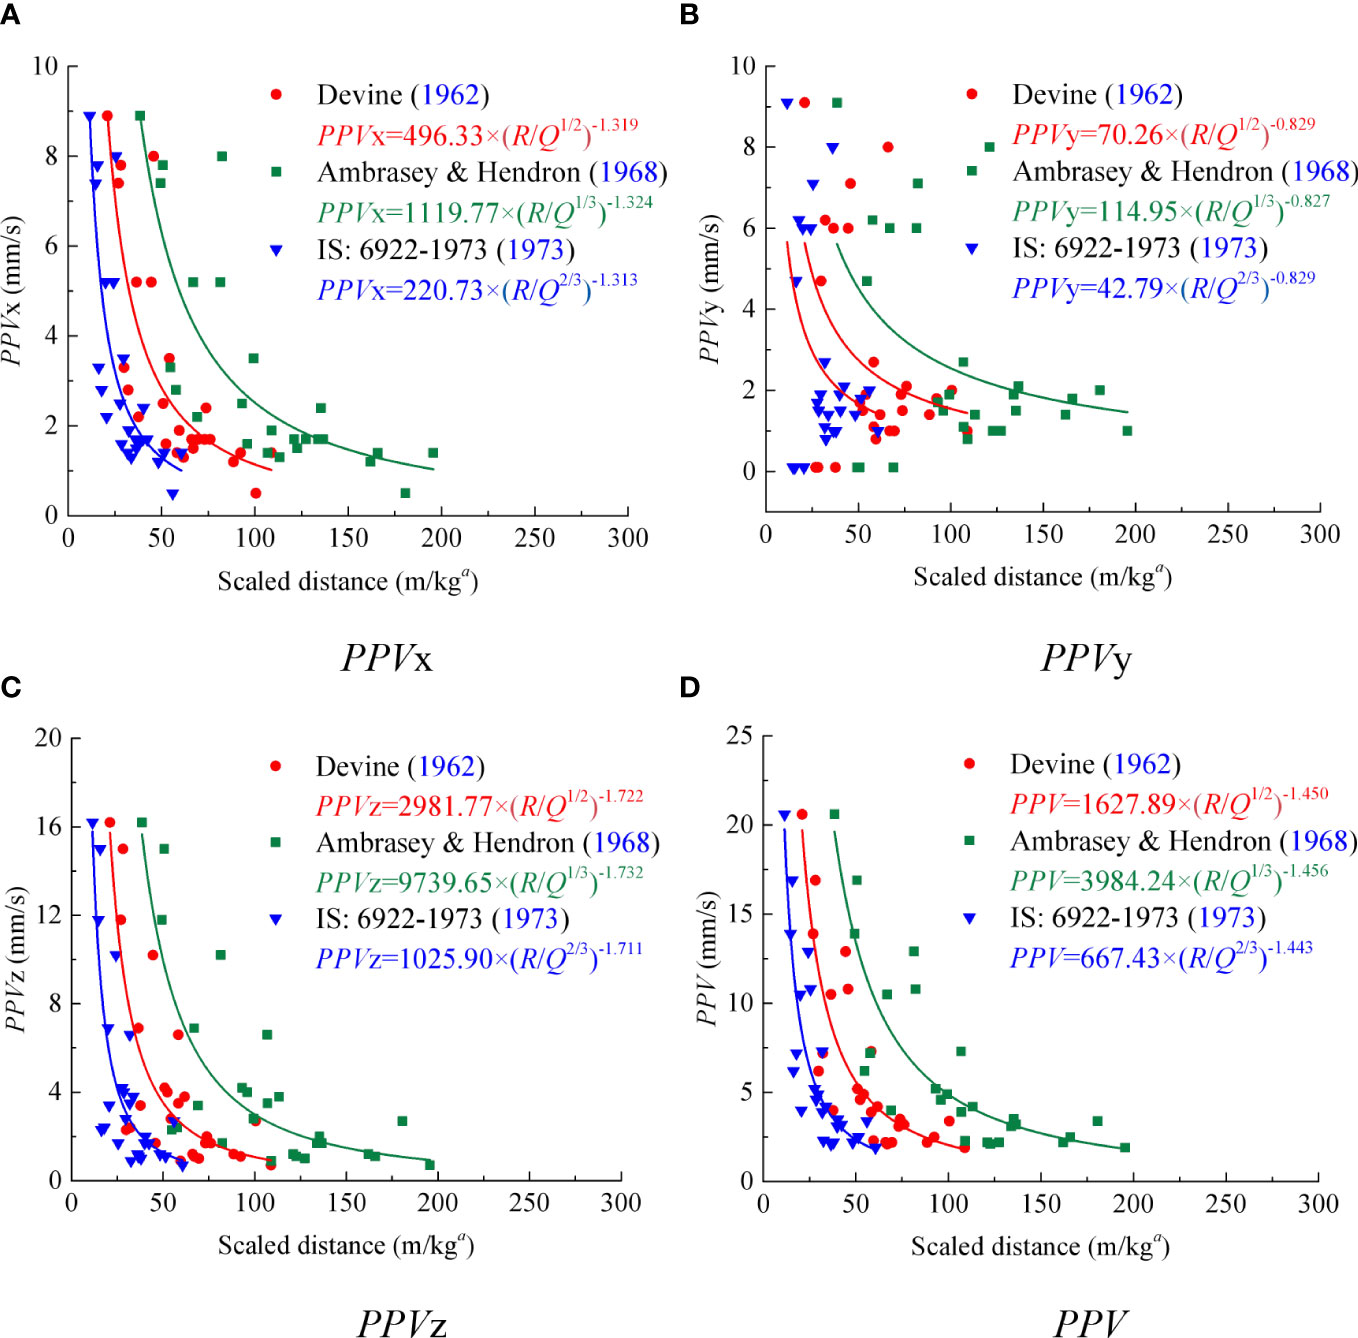
Figure 3 Prediction PPV/PPVi using different empirical equations. (A) PPVx; (B) PPVy; (C) PPVz; (D) PPV. Data from Zhu et al. (2021).
Here, the data for studying the relationship between the relevant parameters of empirical Eq. (2) in predicting PPV/PPVi on adjacent tunnels and tunnel geological conditions were still from the literature review. Because the vibration response on adjacent tunnel structures near the blasting source is the largest and is also the vibration response area that is most concerning for engineers, we mainly consider the data of the blasting vibration on the adjacent tunnel structures near the blasting source in the process of literature collection. Moreover, since the analysis of this section is focused on the relationship between the relevant parameters of empirical Eq. (2) and tunnel geological conditions, the influence of tunnel shape and scale on the response of PPV/PPVi was neglected during data summary.
There are many indicators to describe site characteristics, such as rock quality designation (RQD), rock mass rating (RMR), geological strength index (GSI), and Q-system (Q) (Zhang, 2016). Here, the GSI was adopted to describe the site geological information because it is easier to obtain according to the description of the site presented in the literature. GSI, which was introduced by Hoek (1994), is a system of rock mass characterization used to estimate rock mass strength for different geological conditions as identified by field observations. The GSI classification was set up to address the two principal factors considered to have an important influence on the mechanical properties of a rock mass, i.e., the structure (or blockiness) and the condition of the joints. The basic version of the GSI chart, for use with jointed rocks, is reproduced in Figure 4, from Hoek and Marinos (2000).
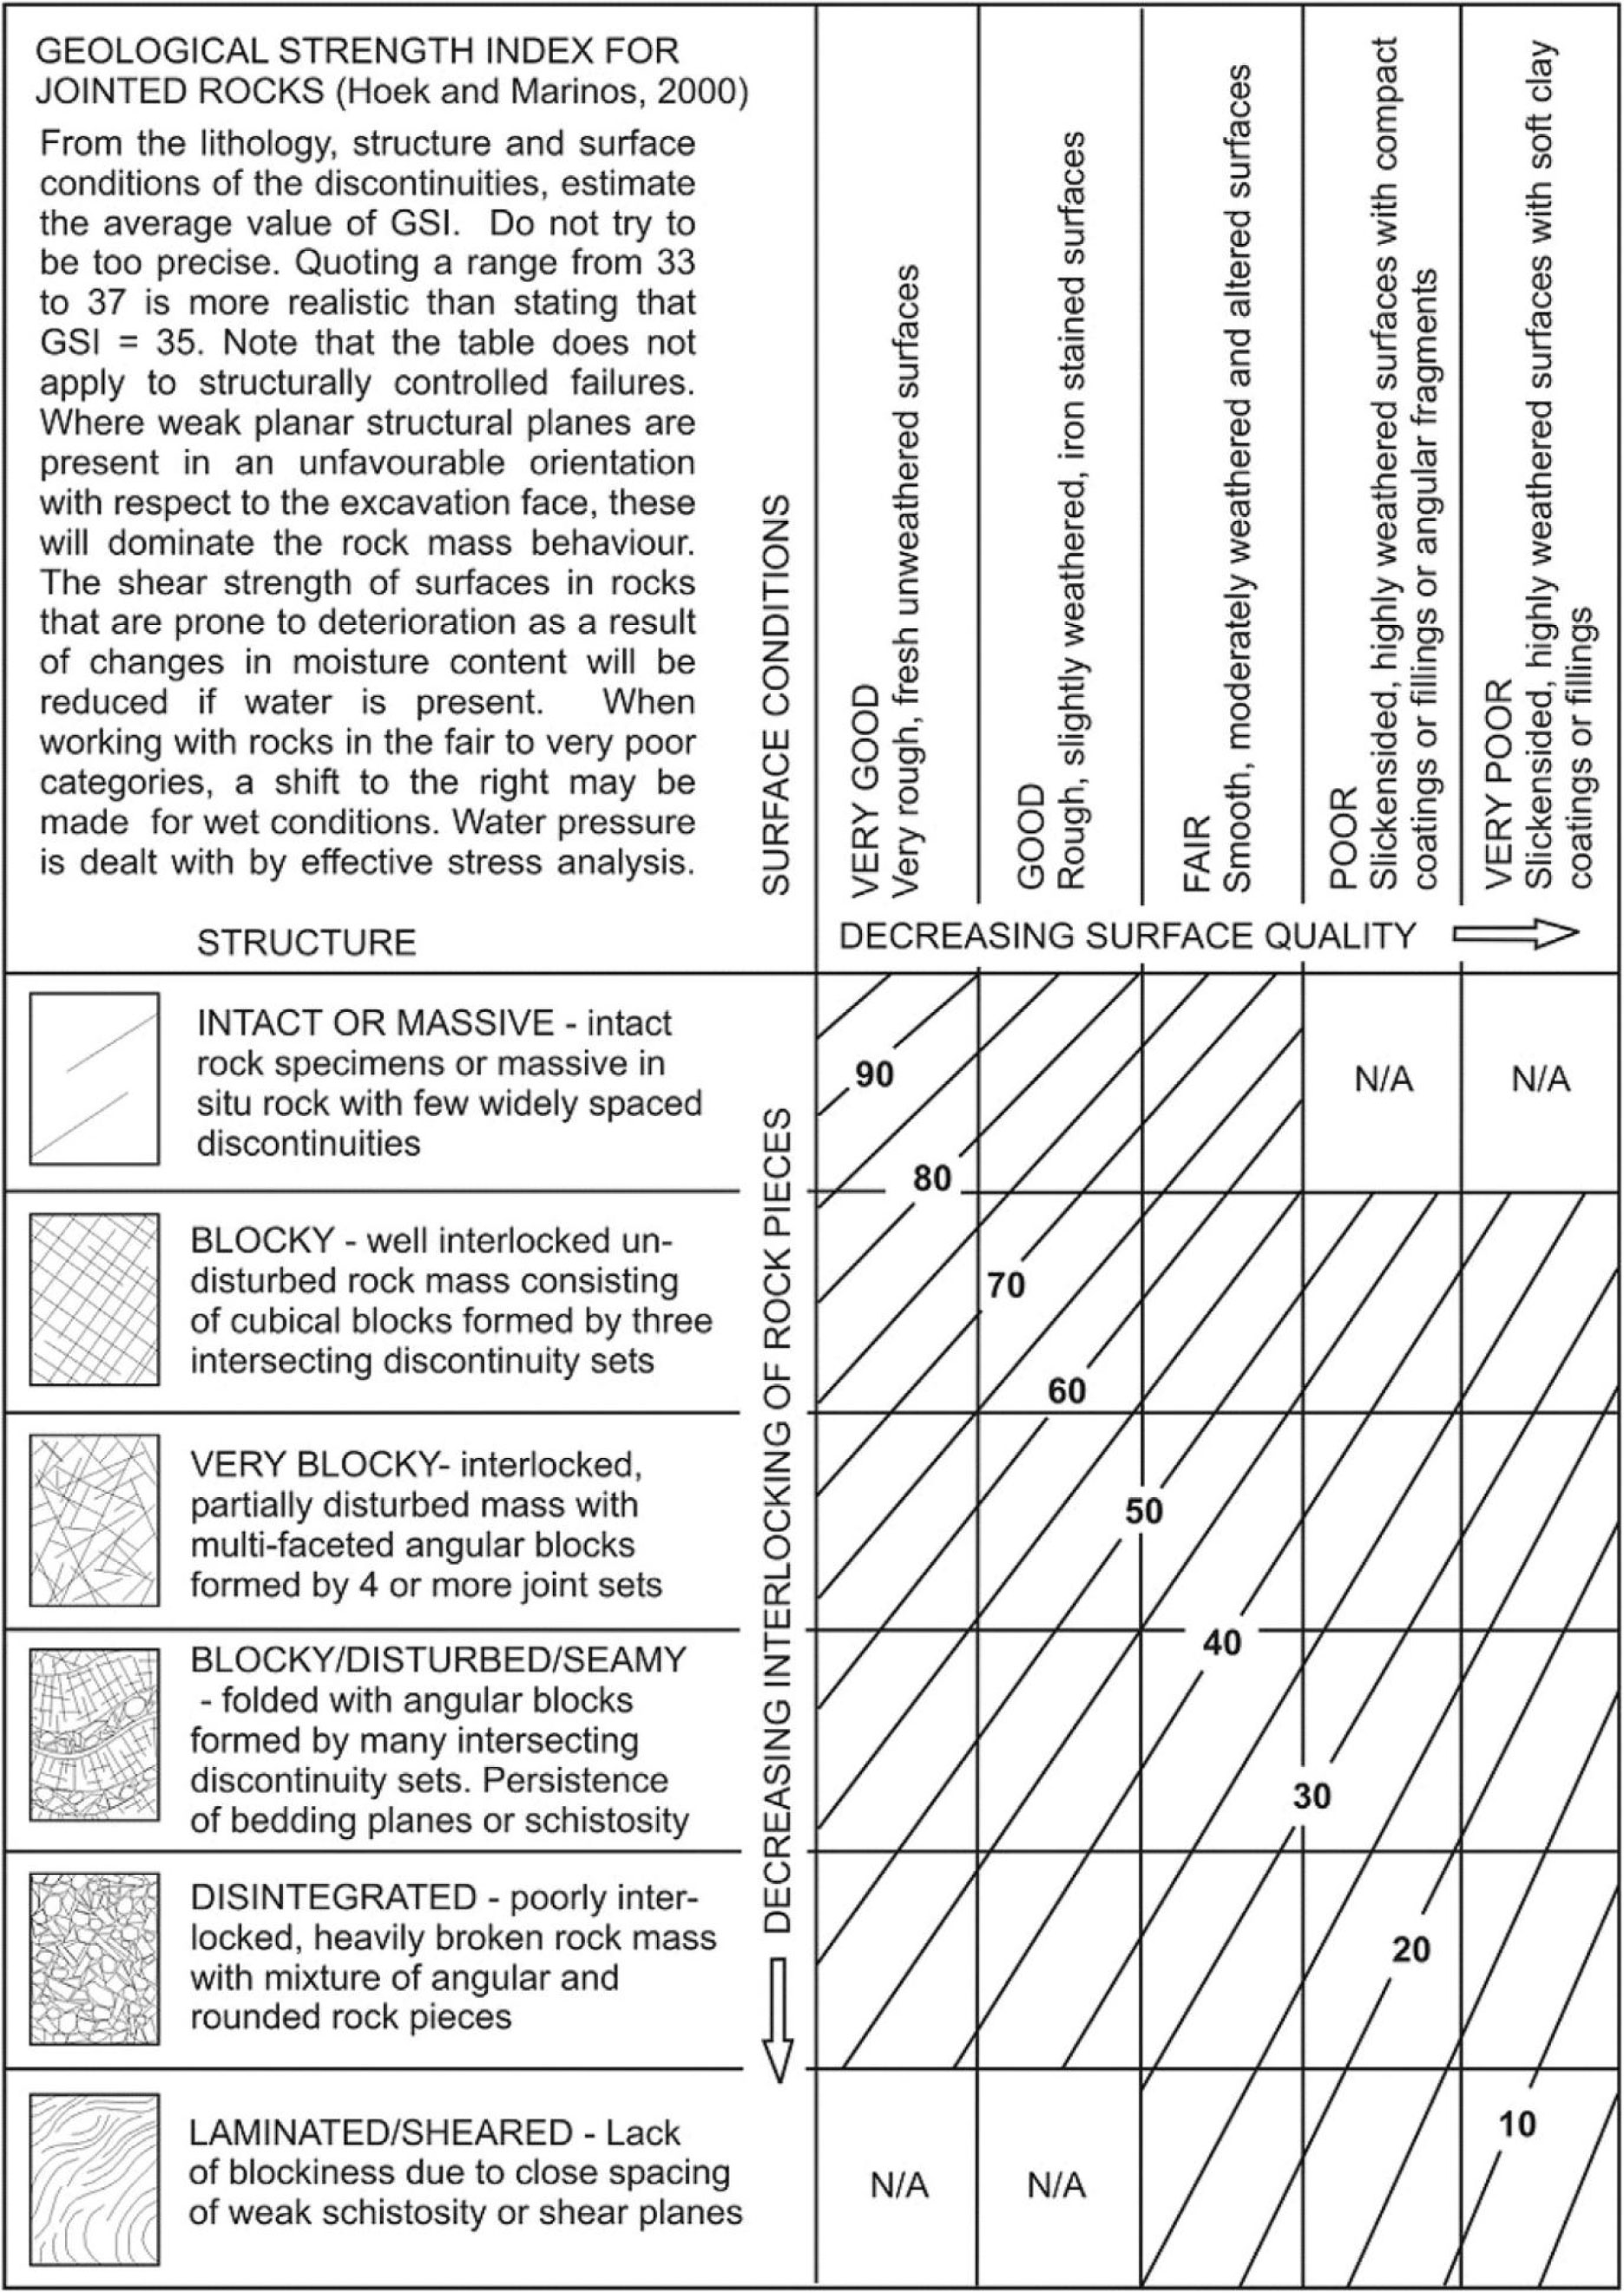
Figure 4 Basic GSI chart (Hoek and Marinos, 2000).
Table 3 shows the collected data about surrounding rock mass information of adjacent tunnels and the corresponding site coefficients obtained based on regression analysis using empirical Eq. (2). It can be seen from the table that the site coefficients k and β of empirical Eq. (2) in predicting PPV/PPVi on the adjacent tunnels are different under different site conditions.
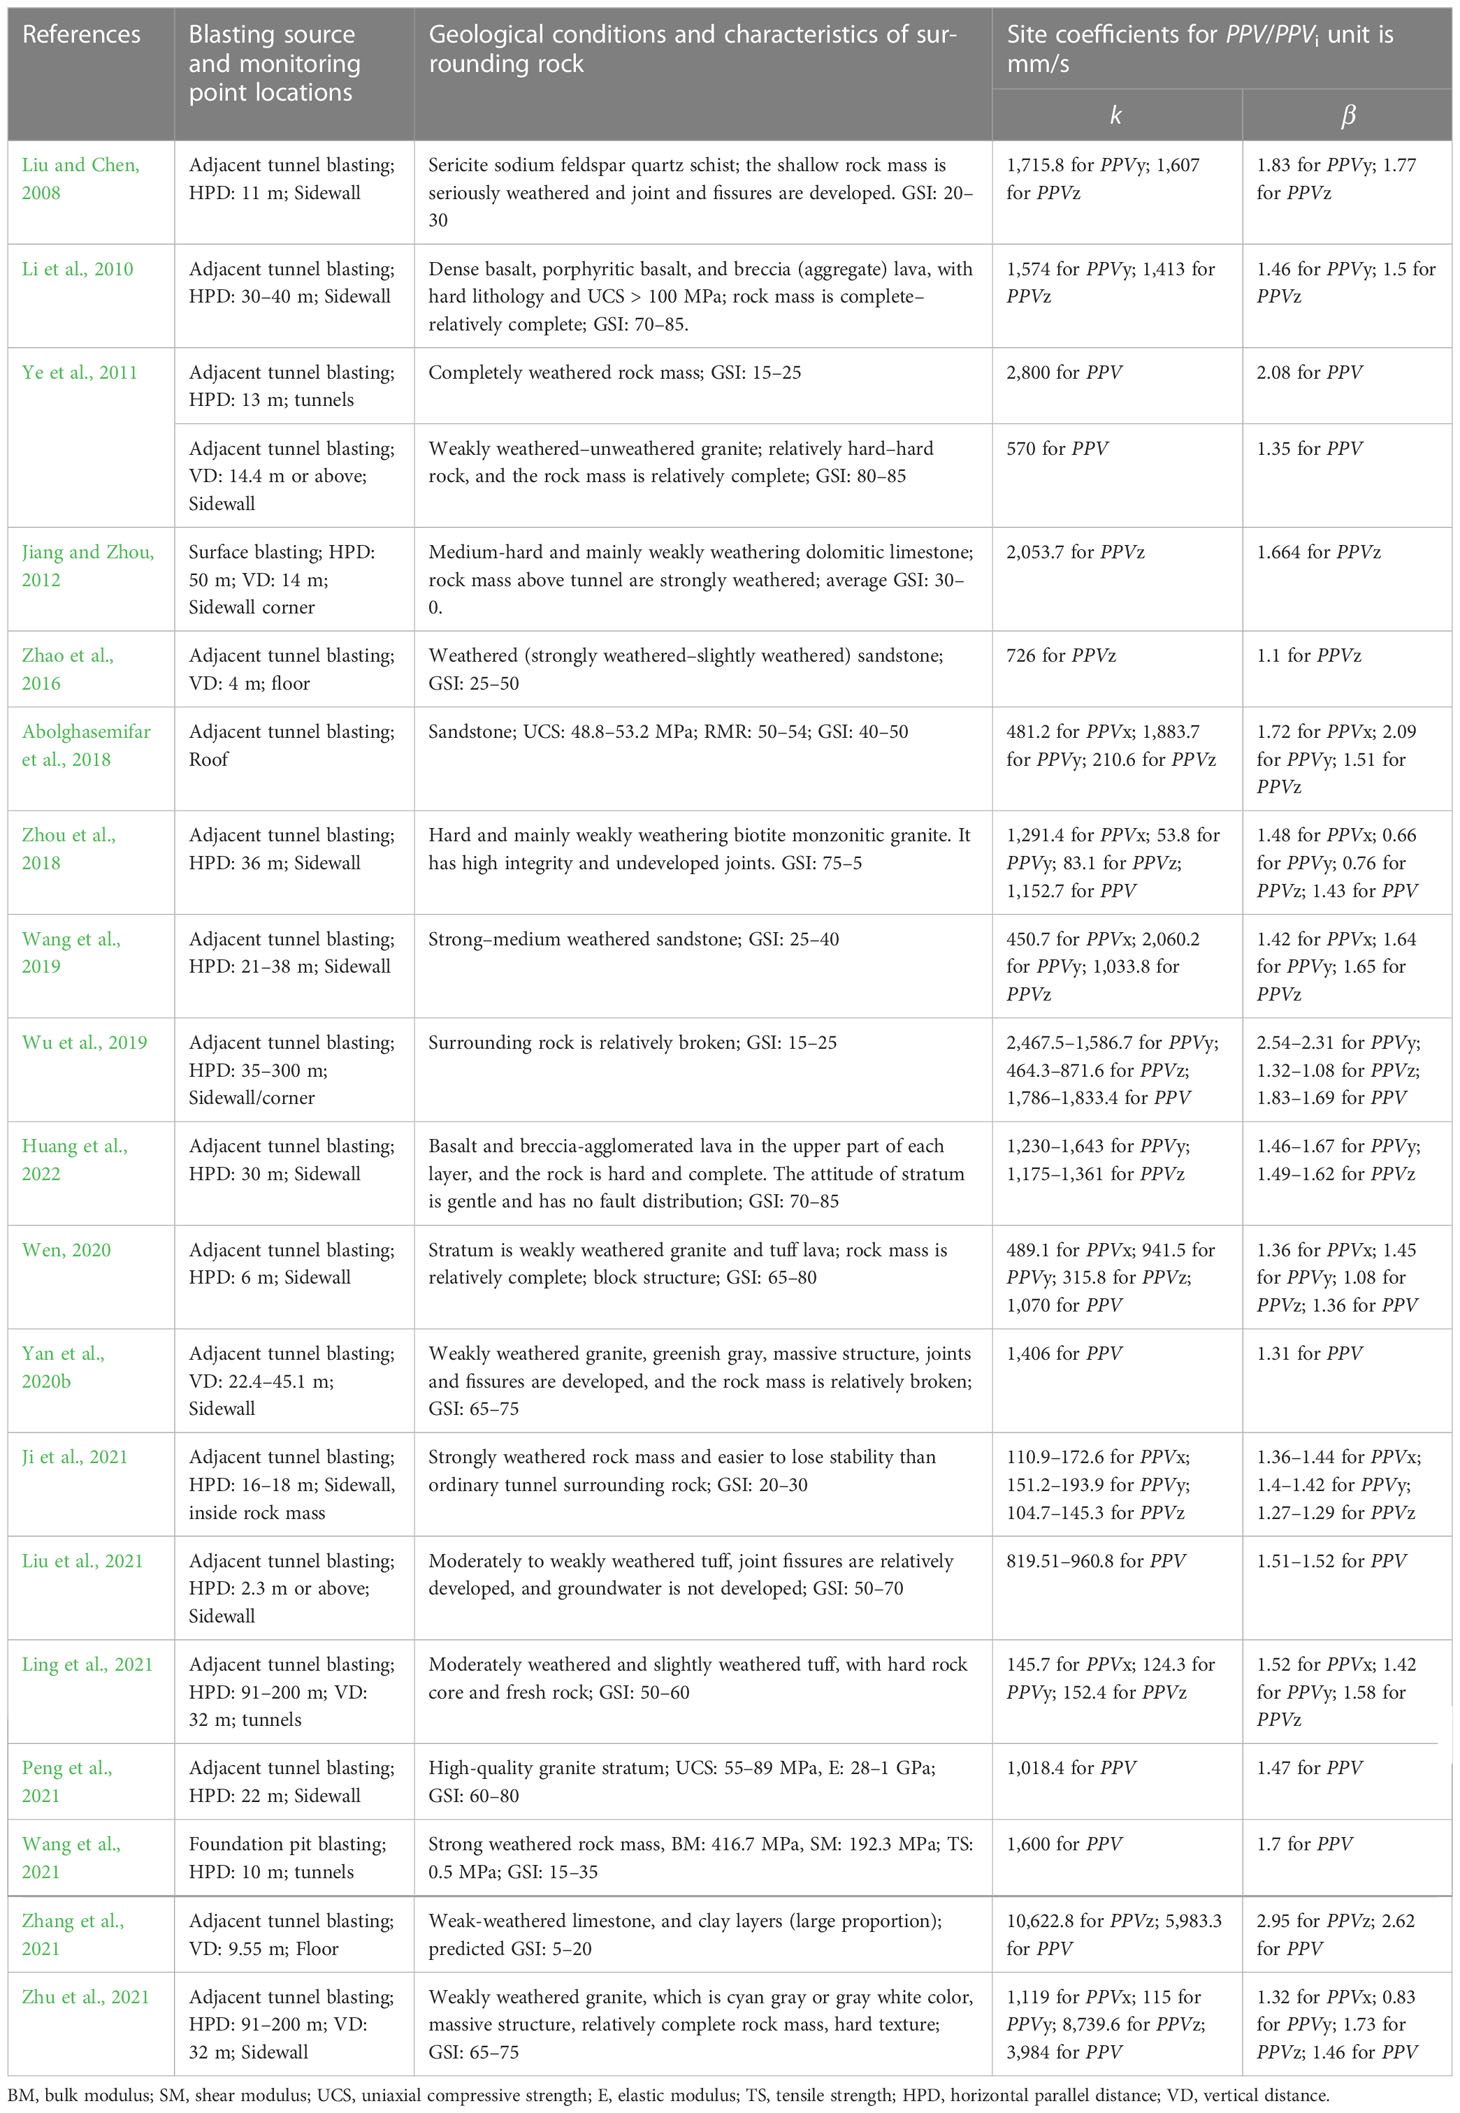
Table 3 Collected data about surrounding rock mass information of adjacent tunnels and the corresponding site coefficients.
Figure 5 shows the relationships between the site coefficient β and rock mass GSI. It can be seen from the figure that with the increase of the GSI of the surrounding rock mass, the site attenuation coefficient β of empirical Eq. (2) in predicting PPV/PPVi on the adjacent tunnels shows a gradual decreasing trend as a whole; that is, the blasting vibration attenuation on adjacent tunnels will decrease as the GSI of the surrounding rock mass increases. By contrast, it was found that the fluctuation of β of empirical Eq. (2) in predicting PPVi (β(PPVi)) is much higher than in predicting PPV (β(PPV)), especially when the GSI of rock mass is lower than 30. In general, the fluctuation center of β(PPVi) is located in the fluctuation center of β(PPV). Based on this law, if the relationship between the site attenuation coefficient β(PPV) and the GSI was obtained, the site attenuation coefficient β of empirical Eq. (2) in predicting PPV/PPVi on the adjacent tunnels under different surrounding rock geological conditions can be evaluated approximately. Through fitting analysis, the following characteristic relationship between β (PPV) and GSI of surrounding rock mass was obtained as:
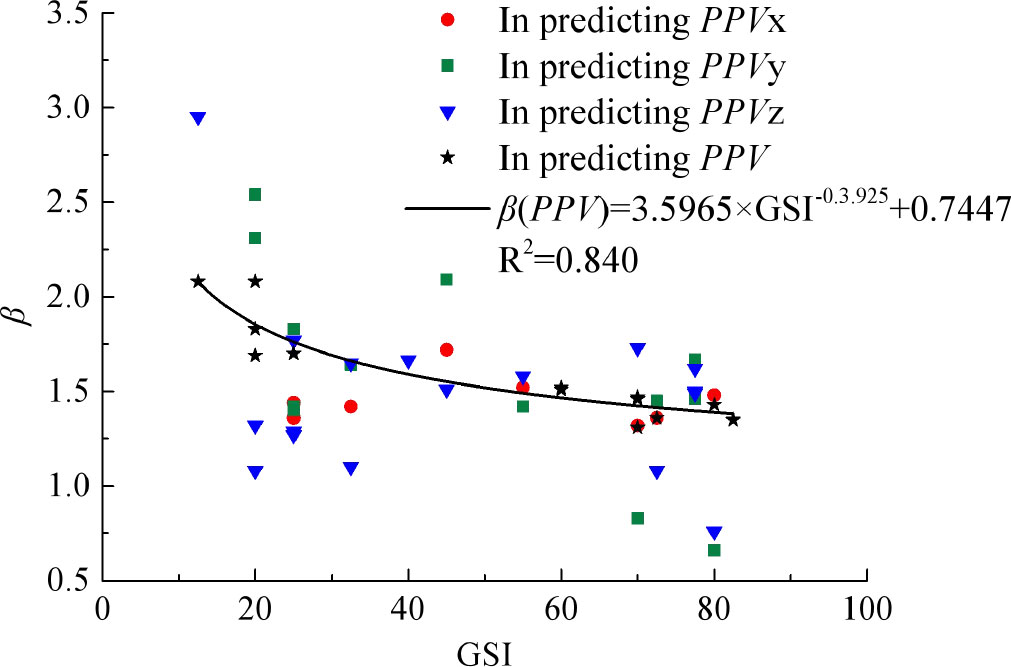
Figure 5 Relationship between GSI and site coefficients β.
Figure 6 shows the relationship between site coefficient k of empirical Eq. (2) in predicting PPV/PPVi and GSI of tunnel surrounding rock. With the increase in GSI of tunnel surrounding rock, the change law of site coefficient k of empirical Eq. (2) in predicting PPV/PPVi also shows a decreasing trend as a whole. Except for some discrete points (data surrounded by circles), the value of k of most cases is generally within 3,000, whether in predicting PPV (k(PPV)) or PPVi (k(PPVi)). Furthermore, the value of k(PPVi) is generally less than k(PPV) at the same level of GSI.
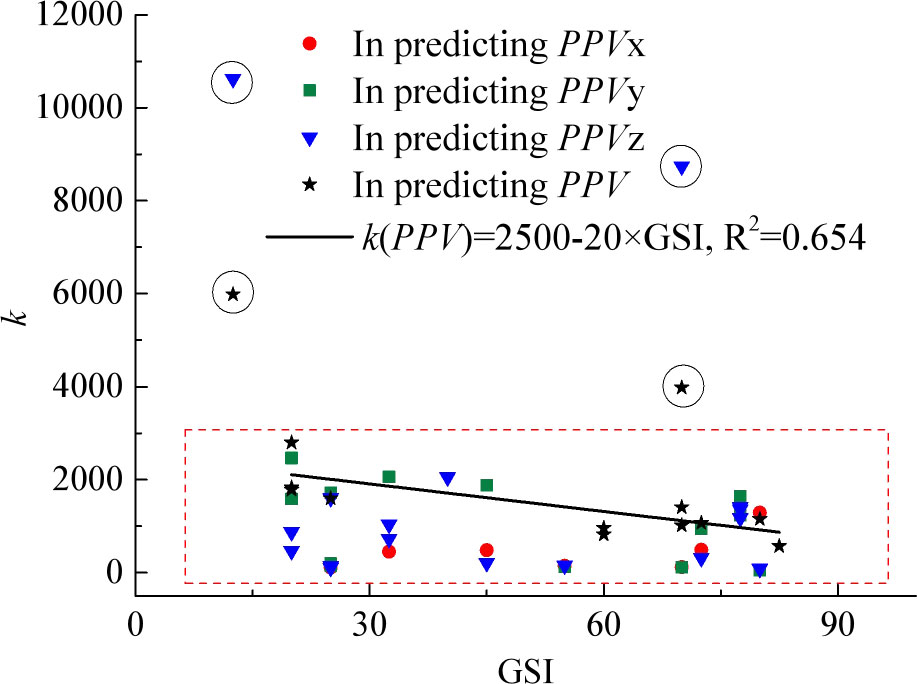
Figure 6 Relationship between GSI and site coefficient k.
Through fitting analysis, the following characteristic relationship between k(PPV) and GSI of surrounding rock mass was obtained as:
Based on these relationships, the blasting vibration prediction equation on adjacent tunnels can be approximately rewritten as:
It is worth noting that the equation is an approximate prediction and is suitable for use without regression analysis of blasting vibration data. The unit of the PPV/PPVi is mm/s. As for PPVi, due to the direct relationship between site coefficient (k and β) and geological structure, it is not suitable to establish a relatively effective equation based on GSI. However, considering that the maximum value of the three component velocities (PPVi (max)) is generally slightly or moderately less than the PPV, the PPVi (max) can be calculated by multiplying a reduction coefficient ζ on the basis of Eq. (14), as:
Usually, the range of ζ is 0.7–1 according to the actual investigation and literature review.
4 Engineering applicability analysis
In Section 3, the relationships between parameters k and β of Eq. (2) in predicting the propagation of blasting vibration on the adjacent tunnel and tunnel geology were discussed, and a PPV/PPVi prediction equation considering GSI information is preliminarily formed. In order to explore whether these parameters have engineering practicability, this section carried out checking calculation based on several site vibration data.
4.1 Data from literature
In this section, the field test data from Wang and Liu (2009); Zhao et al. (2016); Zhou et al. (2018), and Peng et al. (2021) were used to verify the validity of the equation. In the research of Wang and Liu (2009), the blasting source is from tunnel excavation and the parallel distance between the excavated tunnel and the monitoring tunnel is 17.5–23 m. The rock mass in the tunnel passing area is hard and the rock mass integrity is good. The surrounding rock mass of the tunnel is mainly slightly weathered, and the GSI of the rock mass is 70–80. The monitoring points is on the floor (corner) of the adjacent tunnel near the blasting sources. The site characteristics of the studies by Zhao et al. (2016); Zhou et al. (2018), and Peng et al. (2021) are shown in Table 2.
Figure 7 shows the comparison of the PPV/PPVi between the field tests and the ones predicted by Eqs. (14) and (15) based on GSI. It can be seen from the figure that the statistical Eq. (14)/(15) can approximately predict the propagation and attenuation of blasting vibration on adjacent tunnels. Of course, the prediction accuracy here may not be the best. In particular, sometimes the prediction accuracy of PPVi (max) is very low, as shown in panel (a) with ζ = 0.7 and panel (b) with ζ = 1. However, the range of PPVi (max) estimated based on Eq. (15) is still acceptable, which is also very helpful for empirical estimation without blasting vibration data.
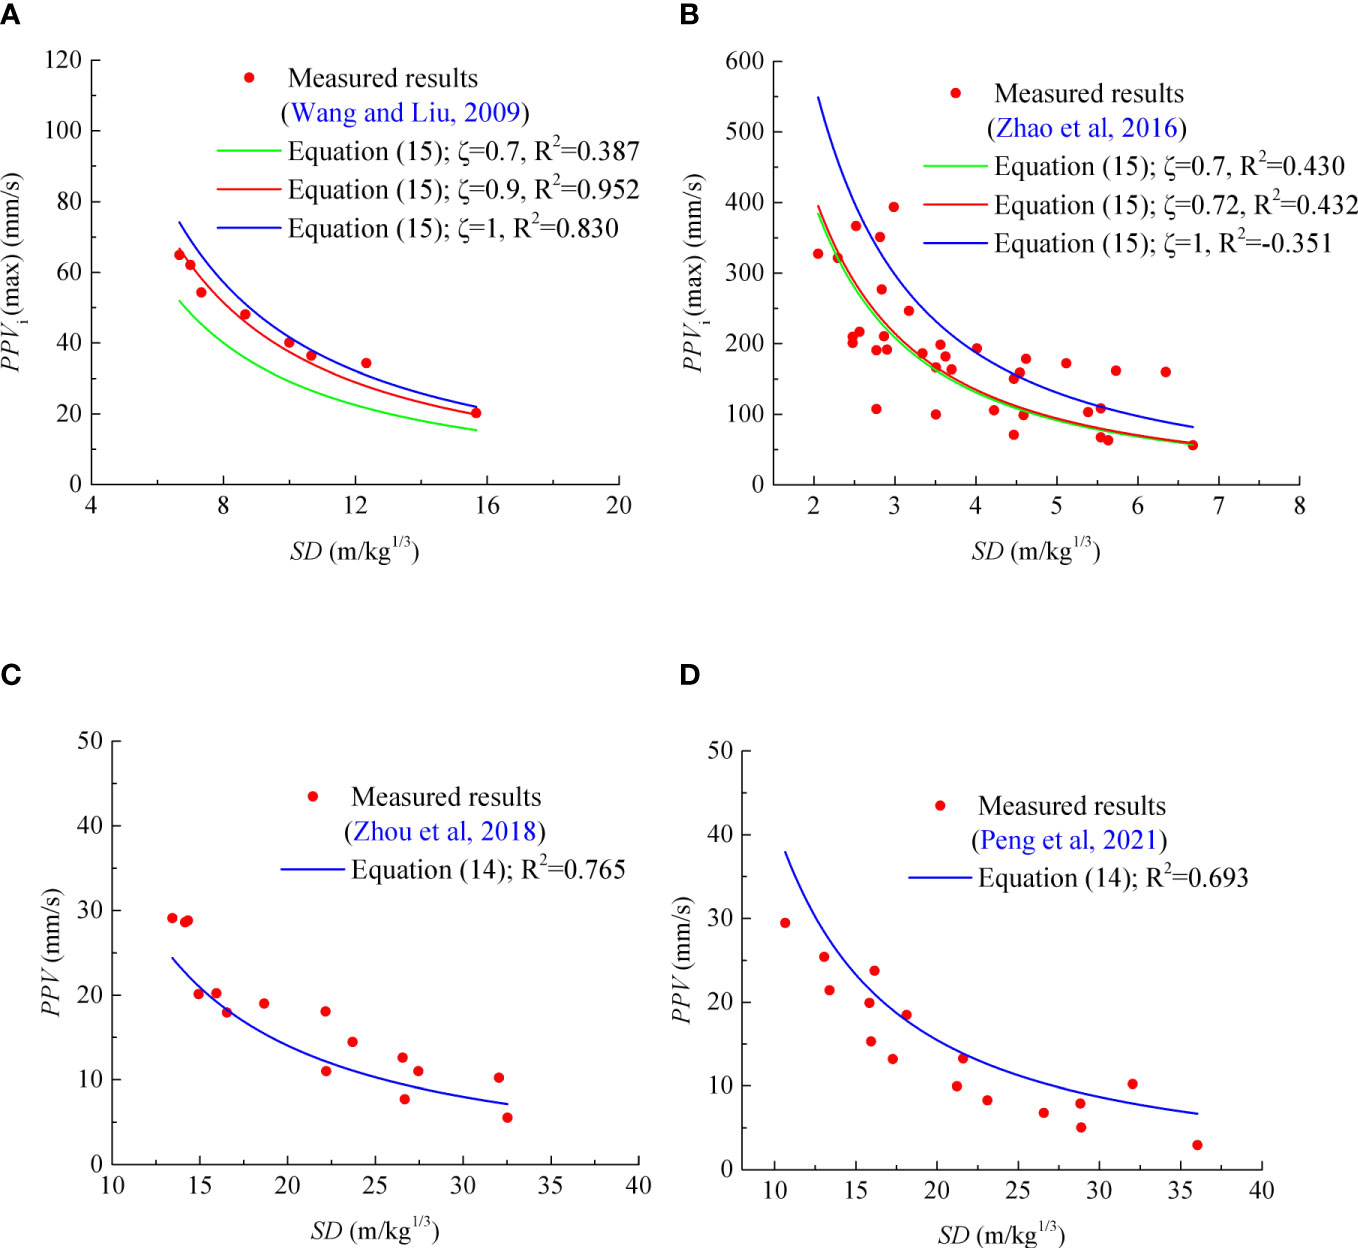
Figure 7 Comparison of the PPV/PPVi between the field tests and the approximation predicted by Eqs. (14) and (15). (A) Data from Wang and Liu (2009); (B) data from Zhao et al. (2016); (C) data from Zhou et al. (2018); (D) data from Peng et al. (2021).
4.2 Data from project test
Since the analyzed data in Figure 7 is from literature, this may be the reason for obtaining favorable results. More field data from another site to analyze the feasibility of field use of Eqs. (14) and (15) are needed.
In this section, the analysis is carried out according to the monitoring data of the blasting excavation project of a double line subway tunnel in Guangzhou, China. The clear distance between the two excavated tunnels is 5.5 m, which is a typical small spacing tunnel project. The radius of the tunnel is about 5 m and the buried depth is about 45 m. According to the geological report and field observation, the tunnels pass through the slightly weathered granite and the rock mass is relatively complete, with few fractures. The GSI range is 70–85. Above the slightly weathered granite, there are mainly moderately weathered granite and soil layers. The tunnel section and geological information are summarized in Figure 8.
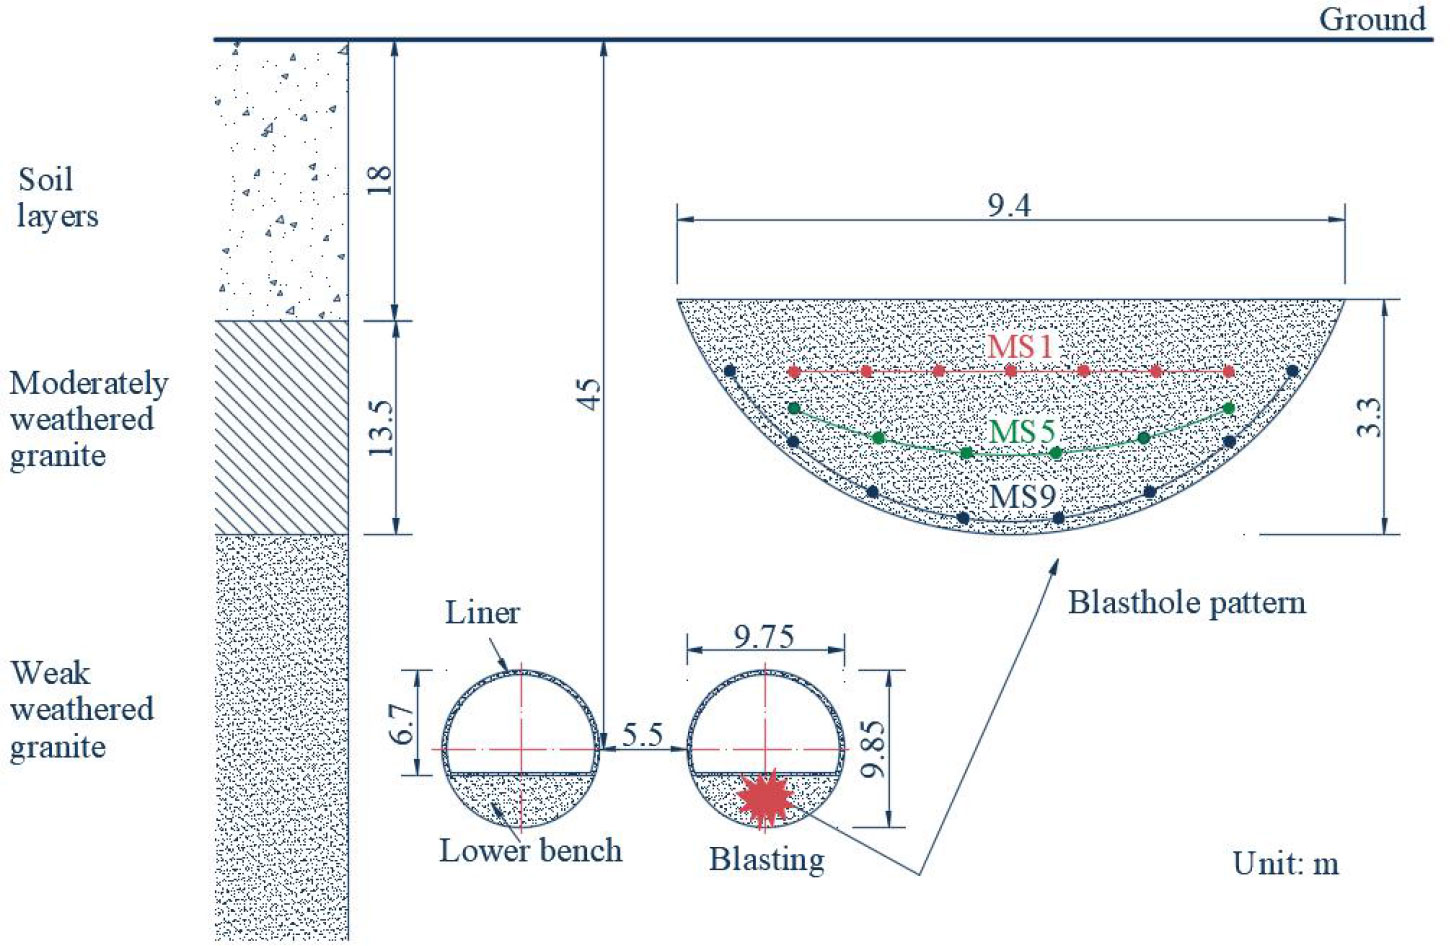
Figure 8 Site geological profile and blast-hole layout.
The bench blasting method was utilized during the process of tunnel excavation, and the area of the upper bench is approximately 70% of the tunnel section. Before the field tests, the upper bench of the tunnels has been excavated, and the initial lining support was achieved by a concrete structure (C25) with a thickness of 300 mm. The purpose of our test is to analyze the attenuation characteristics of blasting vibration on the adjacent tunnel side wall (near the excavated tunnel) under the lower bench blasting of the excavated tunnel. The blast-hole layout of the lower bench blasting is shown in Figure 8. A millisecond electric detonator was used for initiation, and the detonator section included one section (MS1), five sections (MS5), and nine sections (MS9). The corresponding delay times of MS1, MS5, and MS9 were 0 ms, 110 ms, and 310 ms, respectively (Wang et al., 2022).
The layout of on-site measuring points (on the adjacent tunnel sidewall) is shown in Figure 9. Li is the horizontal distance between monitoring point M1 and the blasting plane. Two monitoring times were carried out; Li for the first time and the second time tests are 0 m and 5 m. The TC-4850 vibrometer was employed in the monitoring of blasting vibration. The vibration sensor is a three-way vibration velocity sensor that can simultaneously monitor the vibration velocity in horizontal longitudinal (X), horizontal radial (Y), and vertical (Z) directions of the measurement points. The maximum charge per delay of the two tested blasting are 16.8 kg and 21 kg.
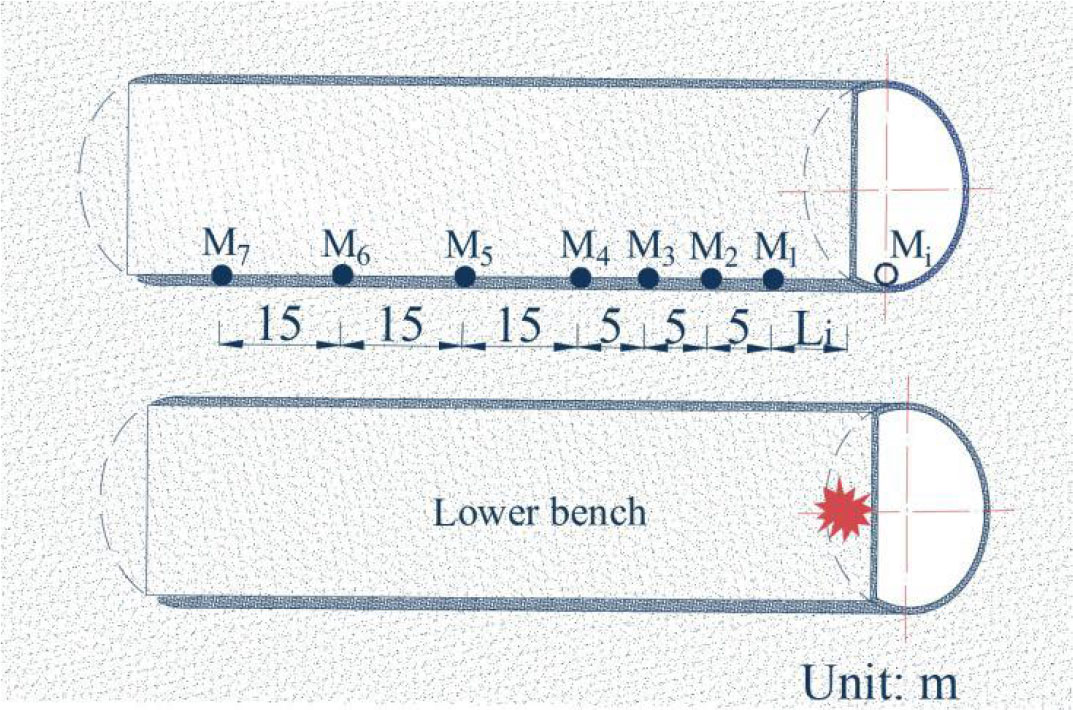
Figure 9 Monitoring points layout.
Figure 10 shows the PPV/PPVi obtained from field tests and approximately predicted by Eqs. (14) and (15). The comparison results further show that Eqs. (14) and (15) can approximately predict the propagation and attenuation law of PPV/PPVi on the adjacent tunnels. However, since Eqs. (14) and (15) cannot 100% accurately predict PPV/PPVi, it is still recommended to monitor blasting vibration anytime and anywhere in practical projects, especially important large-scale projects, so as to effectively control blasting vibration disasters. When there is a lack of effective field test data, Eqs. (14) and (15) are recommended to predict the blasting vibration on adjacent tunnels.
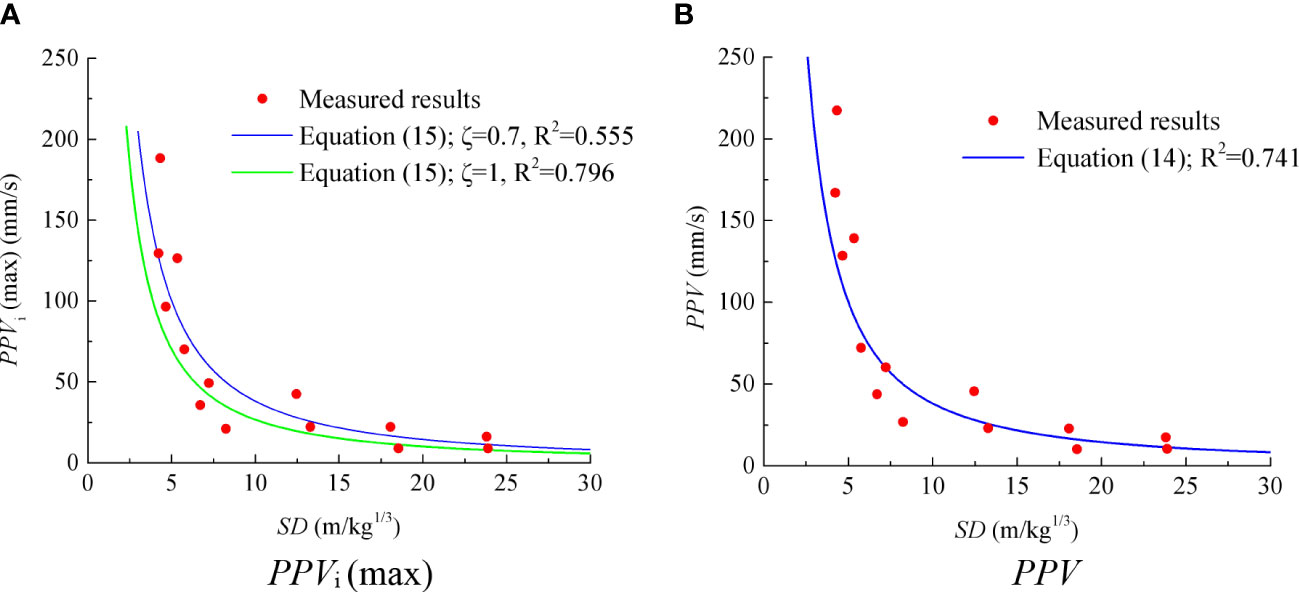
Figure 10 PPV/PPVi (max) obtained from field monitoring tests and the approximation predicted based on (A) Eq. (14), (B) Eq. (15).
5 Conclusions
Based on literature data statistics, this paper first explored the performance of several commonly used empirical equations in predicting the propagation and attenuation characteristics of blasting vibration on adjacent tunnels. Secondly, the relationships between the empirical parameters of blasting vibration prediction equation provided by Ambraseys and Hendron (1968) and the geological strength index (GSI) of tunnel surrounding rock were discussed, and two new blasting vibration prediction equations based on site rock GSI were established to approximately predict PPV/PPVi (max) on adjacent tunnels. Finally, the application feasibility of the two prediction equations in practical engineering was discussed based on field project tests. Some meaningful conclusions were obtained as follows.
It is feasible to use empirical equation to predict the propagation of blasting vibration on adjacent tunnels, but there is also the risk of insufficient prediction since the empirical equation does not have high prediction ability for all sites. The prediction performance of various empirical equations in predicting PPV/PPVi at different sites is different. Under the condition of multiple groups of data, the prediction difference of various prediction models is not very large. Considering the simplicity of application, that is, the fewer the parameters of the equation, the better, it is suggested that the equations provided by USBM (Devine, 1962), Ambraseys and Hendron (1968), and Bureau of Indian Standards (IS: 6922-1973, 1973) are used [especially the equation provided by Ambraseys and Hendron (1968) since it has the best prediction performance among the three equations] to predict the propagation and attenuation characteristics of blasting vibration on adjacent tunnels.
With the increase in GSI of the surrounding rock mass of the adjacent tunnel, the propagation attenuation rate (site attenuation coefficient β) of blasting vibration on the tunnel structure shows a decreasing trend as a whole. The following characteristic relationship between site attenuation coefficient β of the empirical equation provided by Ambraseys and Hendron (1968) in predicting PPV and GSI was obtained as Eq. (12). With the increase in GSI of tunnel surrounding rock, the site coefficient k of the empirical equation in predicting PPV/PPVi also shows a decreasing trend as a whole and the k generally within 3,000. The relationship between site coefficient k of the empirical equation in predicting PPV and GSI was obtained as Eq. (13) according to statistical analysis.
Two new empirical prediction equations of blasting vibration propagation and attenuation on adjacent tunnels under different site conditions were established to approximately predict PPV/PPVi (max) on adjacent tunnels, e.g., Eq. (14) for PPV and Eq. (15) for PPVi (max). The verification analysis of five sites shows that these two equations have a certain practical application value. Compared with other empirical equations, these two equations do not need regression fitting blasting vibration data, they only used the GSI of the site rock mass, and they are more easy to use in the field when there is a lack of monitoring data.
Data availability statement
The original contributions presented in the study are included in the article/supplementary material. Further inquiries can be directed to the corresponding authors.
Author contributions
All authors listed have made a substantial, direct, and intellectual contribution to the work and approved it for publication.
Funding
This work was supported by the Elite Program of Shandong University of Science and Technology (No.0104060540171).
Conflict of interest
The authors declare that the research was conducted in the absence of any commercial or financial relationships that could be construed as a potential conflict of interest.
Publisher’s note
All claims expressed in this article are solely those of the authors and do not necessarily represent those of their affiliated organizations, or those of the publisher, the editors and the reviewers. Any product that may be evaluated in this article, or claim that may be made by its manufacturer, is not guaranteed or endorsed by the publisher.
References
Abolghasemifar A., Ataei M., Torabi S. R., Nikkhah M. (2018). Studying peak particle velocity due to blast in development tunnels’ face in coal stoping. Int. J. Min. Geo-Engineering 52 (1), 69–74. doi: 10.22059/IJMGE.2017.241867.594698
Ambraseys N. R., Hendron A. J. (1968). “Dynamic behaviour of rock masses,” in Rock mechanics in rock mechanics in engineering practice. Eds. Stagg K. G., Zienkiewicz O. C. (London: Hohn Wiley and Sons).
BS3785-2. (1993). Evaluation and measurement for vibration in buildings (London: British Standards Institution).
Devine J. F. (1962). Vibration levels from multiple holes per delay quarry blasts. Earthquake Notes. 33 (3), 32–39. doi: 10.1785/gssrl.33.3.32
Ghosh A., Daemen J. K. (1983). A simple new blast vibration predictor of ground vibrations induced predictor. Proc. 24th US symposium rock mechanics. 151–162.
Gupta R. N., Pal Roy P., Bagchi A., Singh B. (1987). Dynamic effects in various rock mass and their prediction. J. Mines Metals Fuels. 35 (11), 455–462.
Hoek E. (1994). Strength of rock and rock masses. News J. Int. Soc. ofRock Mechanics (ISRM) 2 (2), 4–16.
Hoek E., Marinos P. G. (2000). Predicting tunnel squeezing problems in weak heterogene rock masses. Tunnels Tunnelling Int. 132 (11), 45–51.
Huang J., Luo Y., Zhang G., Zheng B., Li X., Xu M., et al. (2022). Numerical analysis on rock blasting damage in xiluodu underground powerhouse using an improved constitutive model. Eur. J. Environ. Civil Eng. 26 (7), 3009–3026.
IS: 6922-1973. (1973). Criteria for safety and design of structures subjected to underground blast (New Delhi, India: Bureau of Indian Standards). doi: 10.1080/19648189.2020.1780475
Jayasinghe B., Zhao Z., Chee A. G. T., Zhou H., Gui Y. (2019). Attenuation of rock blasting induced ground vibration in rock-soil interface. J. Rock Mechanics Geotechnical Eng. 11 (4), 770–778. doi: 10.1016/j.jrmge.2018.12.009
Ji X. C., Fu H. X., Kong H., Gao Y. F. (2021). Study on micro-vibration drilling and blasting of Large span tunnel using small spacing and vibration characteristics of intermediate rock wall. China J. Highway Transport 34 (4), 220–230. doi: 10.19721/j.cnki.1001-7372.2021.04.019
Jiang N., Zhou C. (2012). Blasting vibration safety criterion for a tunnel liner structure. Tunnelling Underground Space Technol. 32, 52–57. doi: 10.1016/j.tust.2012.04.016
Li X. P., Chen J. H., Li Y. H., Dai Y. (2010). Study of blasting seismic effects of underground chamber group in xiluodu hydropower station. Chin. J. Rock Mechanics Eng. 29 (3), 493–501.
Li Z., Li J., Li H., Zhao J. (2021). Effects of a set of parallel joints with unequal close-open behavior on stress wave energy attenuation. Waves Random Complex Media 31 (6), 2427–2451. doi: 10.1080/17455030.2020.1748754
Li J. C., Li H. B., Ma G. W., Zhou Y. X. (2013). Assessment of underground tunnel stability to adjacent tunnel explosion. Tunnelling Underground Space Technology. 35, 227–234. doi: 10.1016/j.tust.2012.07.005
Ling T. H., Ouyang X. Z., Liu J. W., Zhang S. (2021). Dynamic response analysis of double tunnel lining under blasting vibration. J. Transport Sci. Eng. 37 (2), 20–27. doi: 10.16544/j.cnki.cn43-1494/u.2021.02.004
Liu Y. S., Chen J. P. (2008). Monitoring and analysis of blasting vibration in daxuanling tunnel with small clear space. Blasting 25 (2), 92–94.
Liu C. Y., Yang N. H., Zhang L. B., Huang S. K. (2021). Characteristics of vibration attenuation in wall rock by tunnel blasting at the fork section of super-close-spacing. Eng. Blasting 27 (4), 124–129. doi: 10.19931/j.EB.20210054
Lu Y. (2005). Underground blast induced ground shock and its modelling using artificial neural network. Comput. Geotechnics 32 (3), 164–178. doi: 10.1016/j.compgeo.2005.01.007
Lu W. B., Luo Y., Chen M., Shu D. Q. (2012). An introduction to Chinese safety regulations for blasting vibration. Environ. Earth Sci. 67 (7), 1951–1959. doi: 10.1007/s12665-012-1636-9
Murmu S., Maheshwari P., Verma H. K. (2018). Empirical and probabilistic analysis of blast-induced ground vibrations. Int. J. Rock Mechanics Min. Sci. 103, 267–274. doi: 10.1016/j.ijrmms.2018.01.038
Nateghi R., Kiany M., Gholipouri O. (2009). Control negative effects of blasting waves on concrete of the structures by analyzing of parameters of ground vibration. Tunnelling Underground Space Technology. 24 (6), 608–616. doi: 10.1016/j.tust.2009.04.004
Ocak I., Bilgin N. (2010). Comparative studies on the performance of a roadheader, impact hammer and drilling and blasting method in the excavation of metro station tunnels in Istanbul. Tunnelling Underground Space Technology. 25 (2), 181–187. doi: 10.1016/j.tust.2009.11.002
Peng Y., Liu G., Wu L., Zuo Q., Liu Y., Zhang C. (2021). Comparative study on tunnel blast-induced vibration for the underground cavern group. Environ. Earth Sci. 80 (2), 1–13. doi: 10.1007/s12665-020-09362-z
Roy P. P. (1991). Prediction and control of ground vibration due to blasting. Colliery Guardian. 239 (7), 215–219.
Sharafat A., Tanoli W. A., Raptis G., Seo J. W. (2019). Controlled blasting in underground construction: a case study of a tunnel plug demolition in the neelum jhelum hydroelectric project. Tunnelling Underground Space Technology. 93, 103098. doi: 10.1016/j.tust.2019.103098
Singh P. K. (2002). Blast vibration damage to underground coal mines from adjacent open-pit blasting. Int. J. Rock Mechanics Min. Sci. 39 (8), 959–973. doi: 10.1016/S1365-1609(02)00098-9
Sisikind D. E., Stagg M. S., Kopp J. W., Dowding C. H. (1980). Structure response and damage produced by ground vibration from surface mine blasting (Washington, DC: Bureau of Mines, United States Department of Interior).
Wang X., Li J., Zhao X., Liang Y. (2022). Propagation characteristics and prediction of blast-induced vibration on closely spaced rock tunnels. Tunnelling Underground Space Technol. 123, 104416. doi: 10.1016/j.tust.2022.104416
Wang C., Liu L. B. (2009). Blasting vibration monitoring and analysis of tunnel with small clear space. J. Univ. South China. 23 (1), 24–26, 30. doi: 10.19431/j.cnki.1673-0062.2009.01.007
Wang H., Wang Y., Wang M., Zong Q. (2021). Numerical analysis of the influence of foundation pit blasting on a nearby metro tunnel. Shock Vibration 2021, 5585726. doi: 10.1155/2021/5585726
Wang W., Yuan Q., Jiang H., Chen P. S. (2019). Influence and safety control of blasting vibration on existing lining for closely tunnel expansion. In IOP Conf. Series: Earth Environ. Sci. 351 (1), 012043. doi: 10.1088/1755-1315/351/1/012043
Wen Z. S. (2020). Monitoring and analysis of blasting vibration in damaoshan tunnel. Fujian transportation technology. 2, 141–143.
Wu C., Hao H. (2005). Numerical study of characteristics of underground blast induced surface ground motion and their effect on above-ground structures. part I. Ground motion characteristics. Soil Dynamics Earthquake Engineering. 25 (1), 27–38. doi: 10.1016/j.soildyn.2004.08.001
Wu B., Lan Y., Yang J., Han Y. L., Zhuang X. Y. (2019). Influence of new tunnel blasting on vibration characteristics of adjacent existing tunnel. China Saf. Sci. J. 29 (11), 89–95. doi: 10.16265/j.cnki.issn1003-3033.2019.11.015
Yan Y., Hou X., Fei H. (2020a). Review of predicting the blast-induced ground vibrations to reduce impacts on ambient urban communities. J. Clean. Prod. 260, 121135. doi: 10.1016/j.jclepro.2020.121135
Yan T. C., Zhang Q. B., Liu G. J., Tang W. W., Li C. H., Zhu H. K. (2020b). Study on influence of tunnel blasting construction on short distance operation high speed railway tunnel below. Min. Technol. 20 (6), 125–130. doi: 10.13828/j.cnki.ckjs.2020.06.034
Ye P. X., Yang X. A., Ling B. L., Zhang Y. W. (2011). Vibration effects on existing tunnel induced by blasting of an adjacent cross tunnel. Rock Soil Mechanics 32 (2), 537–541. doi: 10.16285/j.rsm.2011.02.013
Yilmaz O. (2016). The comparison of most widely used ground vibration predictor equations and suggestions for the new attenuation formulas. Environ. Earth Sci. 75 (3), 269. doi: 10.1007/s12665-015-5011-5
Zhang L. (2016). Determination and applications of rock quality designation (RQD). J. Rock Mechanics Geotechnical Eng. 8 (3), 389–397. doi: 10.1016/j.jrmge.2015.11.008
Zhang Z., Zhou C., Remennikov A., Wu T., Lu S., Xia Y. (2021). Dynamic response and safety control of civil air defense tunnel under excavation blasting of subway tunnel. Tunnelling Underground Space Technology. 112, 103879. doi: 10.1016/j.tust.2021.103879
Zhao H. B., Long Y., Li X. H., Lu L. (2016). Experimental and numerical investigation of the effect of blast-induced vibration from adjacent tunnel on existing tunnel. KSCE J. Civil Eng. 20 (1), 431–439. doi: 10.1007/s12205-015-0130-9
Zhou Y., Jenssen A. (2009). Internal separation distances for underground explosives storage in hard rock. Tunnelling underground space technology. 24 (2), 119–125. doi: 10.1016/j.tust.2008.05.005
Zhou Y., Wu L., Li J., Yuan Q. (2018). The effect of blast-induced vibration on the stability of underground water-sealed gas storage caverns. Geosystem Eng. 21 (6), 326–334. doi: 10.1080/12269328.2018.1452052
Keywords: blast-induced vibration, tunnel, PPV/PPVi (max), empirical equations, prediction performance, geological strength index
Citation: Li W, Wang X, Chen L, Wang C and Liu J (2023) Empirical prediction of blast-induced vibration on adjacent tunnels. Front. Ecol. Evol. 11:1212654. doi: 10.3389/fevo.2023.1212654
Received: 26 April 2023; Accepted: 01 June 2023;
Published: 19 June 2023.
Edited by:
Shaobo Chai, Chang’an University, ChinaReviewed by:
Yonggang Gou, Hohai University, ChinaLonggang Tian, Southeast University, China
Jiacheng Song, The University of Tokyo, Japan, in collaboration with reviewer LT
Copyright © 2023 Li, Wang, Chen, Wang and Liu. This is an open-access article distributed under the terms of the Creative Commons Attribution License (CC BY). The use, distribution or reproduction in other forums is permitted, provided the original author(s) and the copyright owner(s) are credited and that the original publication in this journal is cited, in accordance with accepted academic practice. No use, distribution or reproduction is permitted which does not comply with these terms.
*Correspondence: Wenxin Li, bGkxNzc1MzI5OTMzN0AxNjMuY29t; Xiao Wang, eC53YW5nQHNkdXN0LmVkdS5jbg==