 Youyu Luo
 Huilin Xu
 Junjie Zhang
 Nan Chen
 Haiyan Ye
 Wenyan Lei
- 1School of Public Policy and Management, Guangxi University, Nanning, China
- 2School of Economics/China-ASEAN Institute of Financial Cooperation, Guangxi University, Nanning, China
Purpose/Significance: To a certain extent, geographical indication (GI) protects the ecosystem of product origin, but there is still a lack of quantitative evidence on its cultural spillover effect. The mechanism of the impact of geo-certified landscapes on people’s perceived value of cultural ecosystem services (CESs) should be explored.
Methods/Procedures: In this study, two urban forest parks, Changqing and Zhongshan, which differ mainly in terms of geo-certified landscapes, were selected in Beihai, Guangxi. Basically, homogeneous volunteers were recruited, and photos of value labels were collected from their independent visits to two parks. The SolVES model was used to explore the effect of the presence or absence of geo-certified landscapes in urban park ecosystems on people’s CESs needs and the relation to the spatial context of the landscape.
Results/Conclusions: The results show that GI significantly enhance people’s perception of human CESs value of landscape elements, and clarifies the correspondence perception relationship between CESs value types and each landscape element. In addition to the spillover effect on humanistic value perception, GI also attracts and transfers people’s esthetic attention to the natural landscape itself to a certain extent. And these two effects will also spread to the ecosystem that the landscape belongs to.
Highlights
• GI enhances humanistic CESs perception by an average of 10%.
• GI clarifies the correspondence between CESs and landscape elements.
• The above impacts will spread to a wider ecosystem.
• GI may cause unfair perception of CESs value.
• High-engagement approach has better accuracy.
1. Introduction
With the market-oriented development of ecosystem services and products, ecosystems in the world today are faced with problems such as loss of functionality, sustainability, and stunted development of local economies dependent on natural resources (Steffan-Dewenter et al., 2007; Costanza et al., 2017). The cause of the problem is not only that ecosystem services ecosystem services are regarded as inexhaustible free public services, which leads to scarcity of ecosystem service supply and the excessive consumption of ecosystem services (Daily et al., 2000; Egoh et al., 2007; Wainger et al., 2010; Lautenbach et al., 2011), more because of the lack of consideration of cultural factors (Steffan-Dewenter et al., 2007). According to the TRIPS Agreement, geographical indication (GI), as a new form of intellectual property, carries the natural and historical-human factors of the region where the product is located, combines the specific qualities, reputation and other characteristics of the product with its, and improves people’s cultural considerations when using ecosystem products or services (Hu, 2008; Zhang et al., 2023). GI is a special functional mark to indicate the geographical origin and guarantee the quality of goods, and it is also a very important institutional and policy tool for developing agriculture and local industrial economy, and its protective, value-added, and premium effects on ecosystems are becoming increasingly evident (Jena and Grote, 2012; Shang and Li, 2013), which strongly alleviates the above problems of ecosystem loss. This states that GI products essentially depend on the natural and human factors of that origin, with distinctive local characteristics and ecological protection attributes. This indicates that the GI process is naturally linked to cultural ecosystem services (CESs). However, there is a lack of quantitative evidence on the cultural spillover effects of GI, and the GI benefits are fragmented between the product itself and the product origin. This means that there are at least two pressing questions in GI research: Do regional cultural ecosystem services benefit from GI of their output products? What are the dimensions and extent of their effects?
From the perspective of producers, geographic indication information systems can better connect producers and consumers, and provide production information, so as to better calculate the real environmental and social costs of production (Marsden et al., 2000). The economic reasons for GI protection mainly come from the use of origin as product quality signal. For example, South Africa addresses issues such as information asymmetry and reputation, explores the economic principles of the protection value of geographical information indications, and achieves economic value-added and rural development (Bramley and Kirsten, 2007). Suh and MacPherson (2010) argued that GI enhance the image of products, thereby increasing production and stimulating related industries. Bowen and Zapata (2009) used tequila as an example to illustrate the contribution of GI to socio-economic and environmental sustainability. Shao (2009) found that products were protected by geographical indication, which is equivalent to tangible products added to tangible products on the basis of the original, which will bring substantial value added to the product.
From the perspective of consumers, the “sustainable certification” of commodities makes the natural social relations in commodity production replace the commodities themselves as the focus of consumers. For example, forest is the most important multifunctional ecosystem on the earth, which provides various benefits for human beings (Wang et al., 2023). The research on the value assessment of forest ecosystem services first attracted the attention of many scholars (Peters et al., 1989; Tobias and Mendeisohn, 1991; Hanley and Ruffeil, 1993; Maille and Mendelsohn, 1993; Lal, 2003). Forest certification helps forest managers manage forests responsibly (Ponte et al., 2011), which not only effectively reduces the unreasonable deforestation rate (Galati et al., 2017), but also serves as a strategic tool for enterprises to enter sensitive environmental markets to achieve economic benefits for enterprises (Suryani et al., 2011; Faggi et al., 2014). Forest certification is also a voluntary verification tool for the impact of sustainable forest management and wood processing industry on private and public procurement policies, and has become an integral part of the emerging timber harvesting and trade legality scheme (Paluš et al., 2017, 2018). GI (such as “sustainable certification” of commodity production) attracts consumers’ attention, and even guides consumers’ consumption choices to a certain extent, thus realizing its attribute of restricting and protecting the origin of products and providing conditions for the prosperity of the ecosystem to which products belong.
The maturation of participatory mapping methods, combined with the classic study area of urban forest parks, has made it possible to accurately measure the impact of GI certification on the value of cultural ecosystem services. CESs emphasize the intangible physical, emotional, social, and psychological benefits that natural capital provides to humans (MEA, 2003; Costanza et al., 2017). Parks provide rest, exercise, communication, esthetic, and recreational functions that help people relieve stress and promote subjective wellbeing (Dong and Bo, 2017). As an important part of urban ecosystems and landscape systems, they are one of the few places in cities that are connected to nature and are the focus of urban environmental policies. Current research mostly assesses cultural services in nature reserves, tourist scenic areas, parks and other recreational playgrounds through questionnaire methods, web data mining and qualitative evaluation of diversity and participatory surveys (Hermes et al., 2018; Petway et al., 2020). The monetary value of ecosystem services has been a hot topic. However, because of the intangibility and subjectivity of cultural ecosystem services (Adekola and Mitchell, 2011), it is difficult to accurately evaluate people’s subjective preference and spatial perception of these values by monetization. In addition, the spatial heterogeneity of ecosystems often leads to uneven distribution of services and values in space (Huang C. H. et al., 2013). Compared with other models that are suitable for various situations and evaluating the relationship between natural cover and ecosystem services, SolVES model realizes the calculation of non-monetary value index and spatial distribution evaluation of social value of ecosystem services, with higher quantitative evaluation, wider applicability, and higher degree of spatial visualization (Pan et al., 2022; Sherrouse et al., 2022). At present, the applicability of SolVES model in various types and scales of research areas has been widely verified, and the evaluation system is relatively comprehensive, which provides various possibilities and new scientific approaches for social value research (Yin and Zhong, 2011).
Beihai City is located in the southern end of Guangxi Zhuang Autonomous Region, the northeast coast of Beibu Gulf, located in 108°50′45″ to 109°47′28″ east longitude, 20°26′ to 21°55′34″ north latitude, surrounded by sea on three sides, which is rich in marine resources and suitable for Nanzhu (a kind of precious pearl) culture. Nanzhu is a specialty of Beihai, with a smooth, round and colorful jade that has high medicinal and esthetic value. Hepu Nanzhu has a long history and was awarded the title of National Geographic Indication Protection Product in October 2004. This research measures the cultural service value of the ecosystem in the Beibu Gulf region of Guangxi, which is now a national geographically certified product since the construction of the 21st Century Maritime Silk Road, and provides targeted policy suggestions to enhance the cultural ecosystem service value and strengthen ecological and environmental protection cooperation, so as to further promote the construction of biodiversity corridors and cross-border natural ecological protection.
2. Methods
2.1. Study area
The ultimate goal of ecosystem services research is to explore the relationship between humans and nature, and relationships research needs to be based on strict variable control. People are not only embedded in the environment, they also shape it and respond to changes in it (Zube, 1987), and their assessment should include social and biophysically derived information (Cowling et al., 2008). Our study focuses on the differences in GI among urban ecosystems (parks) and the impact of such differences on people’s perceptions of CESs, which means that the parks we selected should maintain a high degree of similarity beyond GI. The primary selection criteria for the study parks were that the two parks themselves be basically homogeneous, including but not limited to similar area consistent landscape type and similar park orientation. This significantly narrowed our options.
In contrast to purely biophysical assessments, human perceptions of the environment are subjective and vary from person to person (Alessa et al., 2008; Raymond et al., 2009), so intraindividual differences in intrinsic value systems may yield more meaningful insights into the assessment of ecosystem services (Martín-López et al., 2012). Of particular note is that individuals perceive cultural services differently depending on their context, albeit at the same geographic scale (Plieninger et al., 2013). Some scholars studying the evaluation of cultural ecosystem services in wetland parks have found that older, well-educated respondents with above-average household income may have relatively meaningful and reasonable criteria for assessing CESs values, as these respondents are able to understand the meaning of CESs values well (Zhou et al., 2020). That is, people act as processors and static receivers of landscape information, and personal characteristics and socioeconomic variables have a significant impact on the importance ratings of different CESs. Based on this, a number of scholars have conducted studies on subjective differences between individuals from different backgrounds, where gender (Schipperijn et al., 2010; Swapan et al., 2017), occupation (Zhang et al., 2020), frequency of visits (Wang et al., 2016), income (Semmens et al., 2019), length of residence (Shoyama and Yamagata, 2016), type of activity (van Riper et al., 2012), motivation to travel (Ma et al., 2018), and education level (Martín-López et al., 2012) greatly influence the subjective assessment and perceived outcomes of CESs. In order to attribute differences in the perceived value of CESs to differences in GI certification among park features, we need to control strictly for visitor characteristics. This further narrows our park selection set.
Further, some researchers have argued that ecosystem services exist as a bundle and combination of factors that are interdependent and inextricably linked (Bieling and Pleninger, 2013). Various objective, natural elements such as the date, moment and weather on which the study was conducted can also interfere with the causality of the experimental results. Ma and Hu’s research found that under the influence of tides, the flow of tourists will constantly change with the scope, content, and form of activities available (Ma and Hu, 2023). It is thus clear that factors such as time of the week, seasonality and weather influence the number of visitors, but also the mood of people when visiting a park, and the subjective nature of cultural service value generation and acquisition (Dong et al., 2014), also significantly affects people’s perception of the value of CESs. To this point, our choice of park is limited by the nature of the park (Fischer et al., 2018), visitor characteristics (Plummer, 2009), and other objective factors, in which case a feasible approach is to find two parks that are close in spatial proximity. This approach is consistent with the philosophy of Plummer to use areas with similar biophysical contexts for research whenever possible, which indirectly suggests the reliability of comparative observations in two spatially proximate parks (Troy and Wilson, 2006; Plummer, 2009).
It is necessary to maintain the basic homogeneity between the experimental park and the control park, but the GI characteristics of the experimental park must be prominent enough, and it cannot be a human theme park that is out of the ecosystem context. Because we consider that if we directly select a Maritime Silk Road theme park as an experimental group for comparison, the research area category will no longer be the ecosystem we are concerned about. Under the above constraints, we selected Changqing Urban Forest Park and Zhongshan Urban Forest Park in Haicheng District, Beihai City, Guangxi Zhuang Autonomous Region, China, as our experimental park and control park, respectively. The similarity between CUFP and ZUFP in all aspects ensures that our study explores the causal transmission mechanism of certification on the perceived value of CESs.
Beihai City is located on the southern coast of China, and as an important starting port of the “Ancient Maritime Silk Road,” the Nanzhu Stele Forest (Figure 1) perfectly fits the characteristics of the Maritime Silk Road and geographical indication, and is the only difference between CUFP and ZUFP, so CUFP was chosen as the main study area and contrasted with CUFP (see Supplementary Material for details). Figure 2 is the study area map.

Figure 1. Nanzhu Stele Forest.
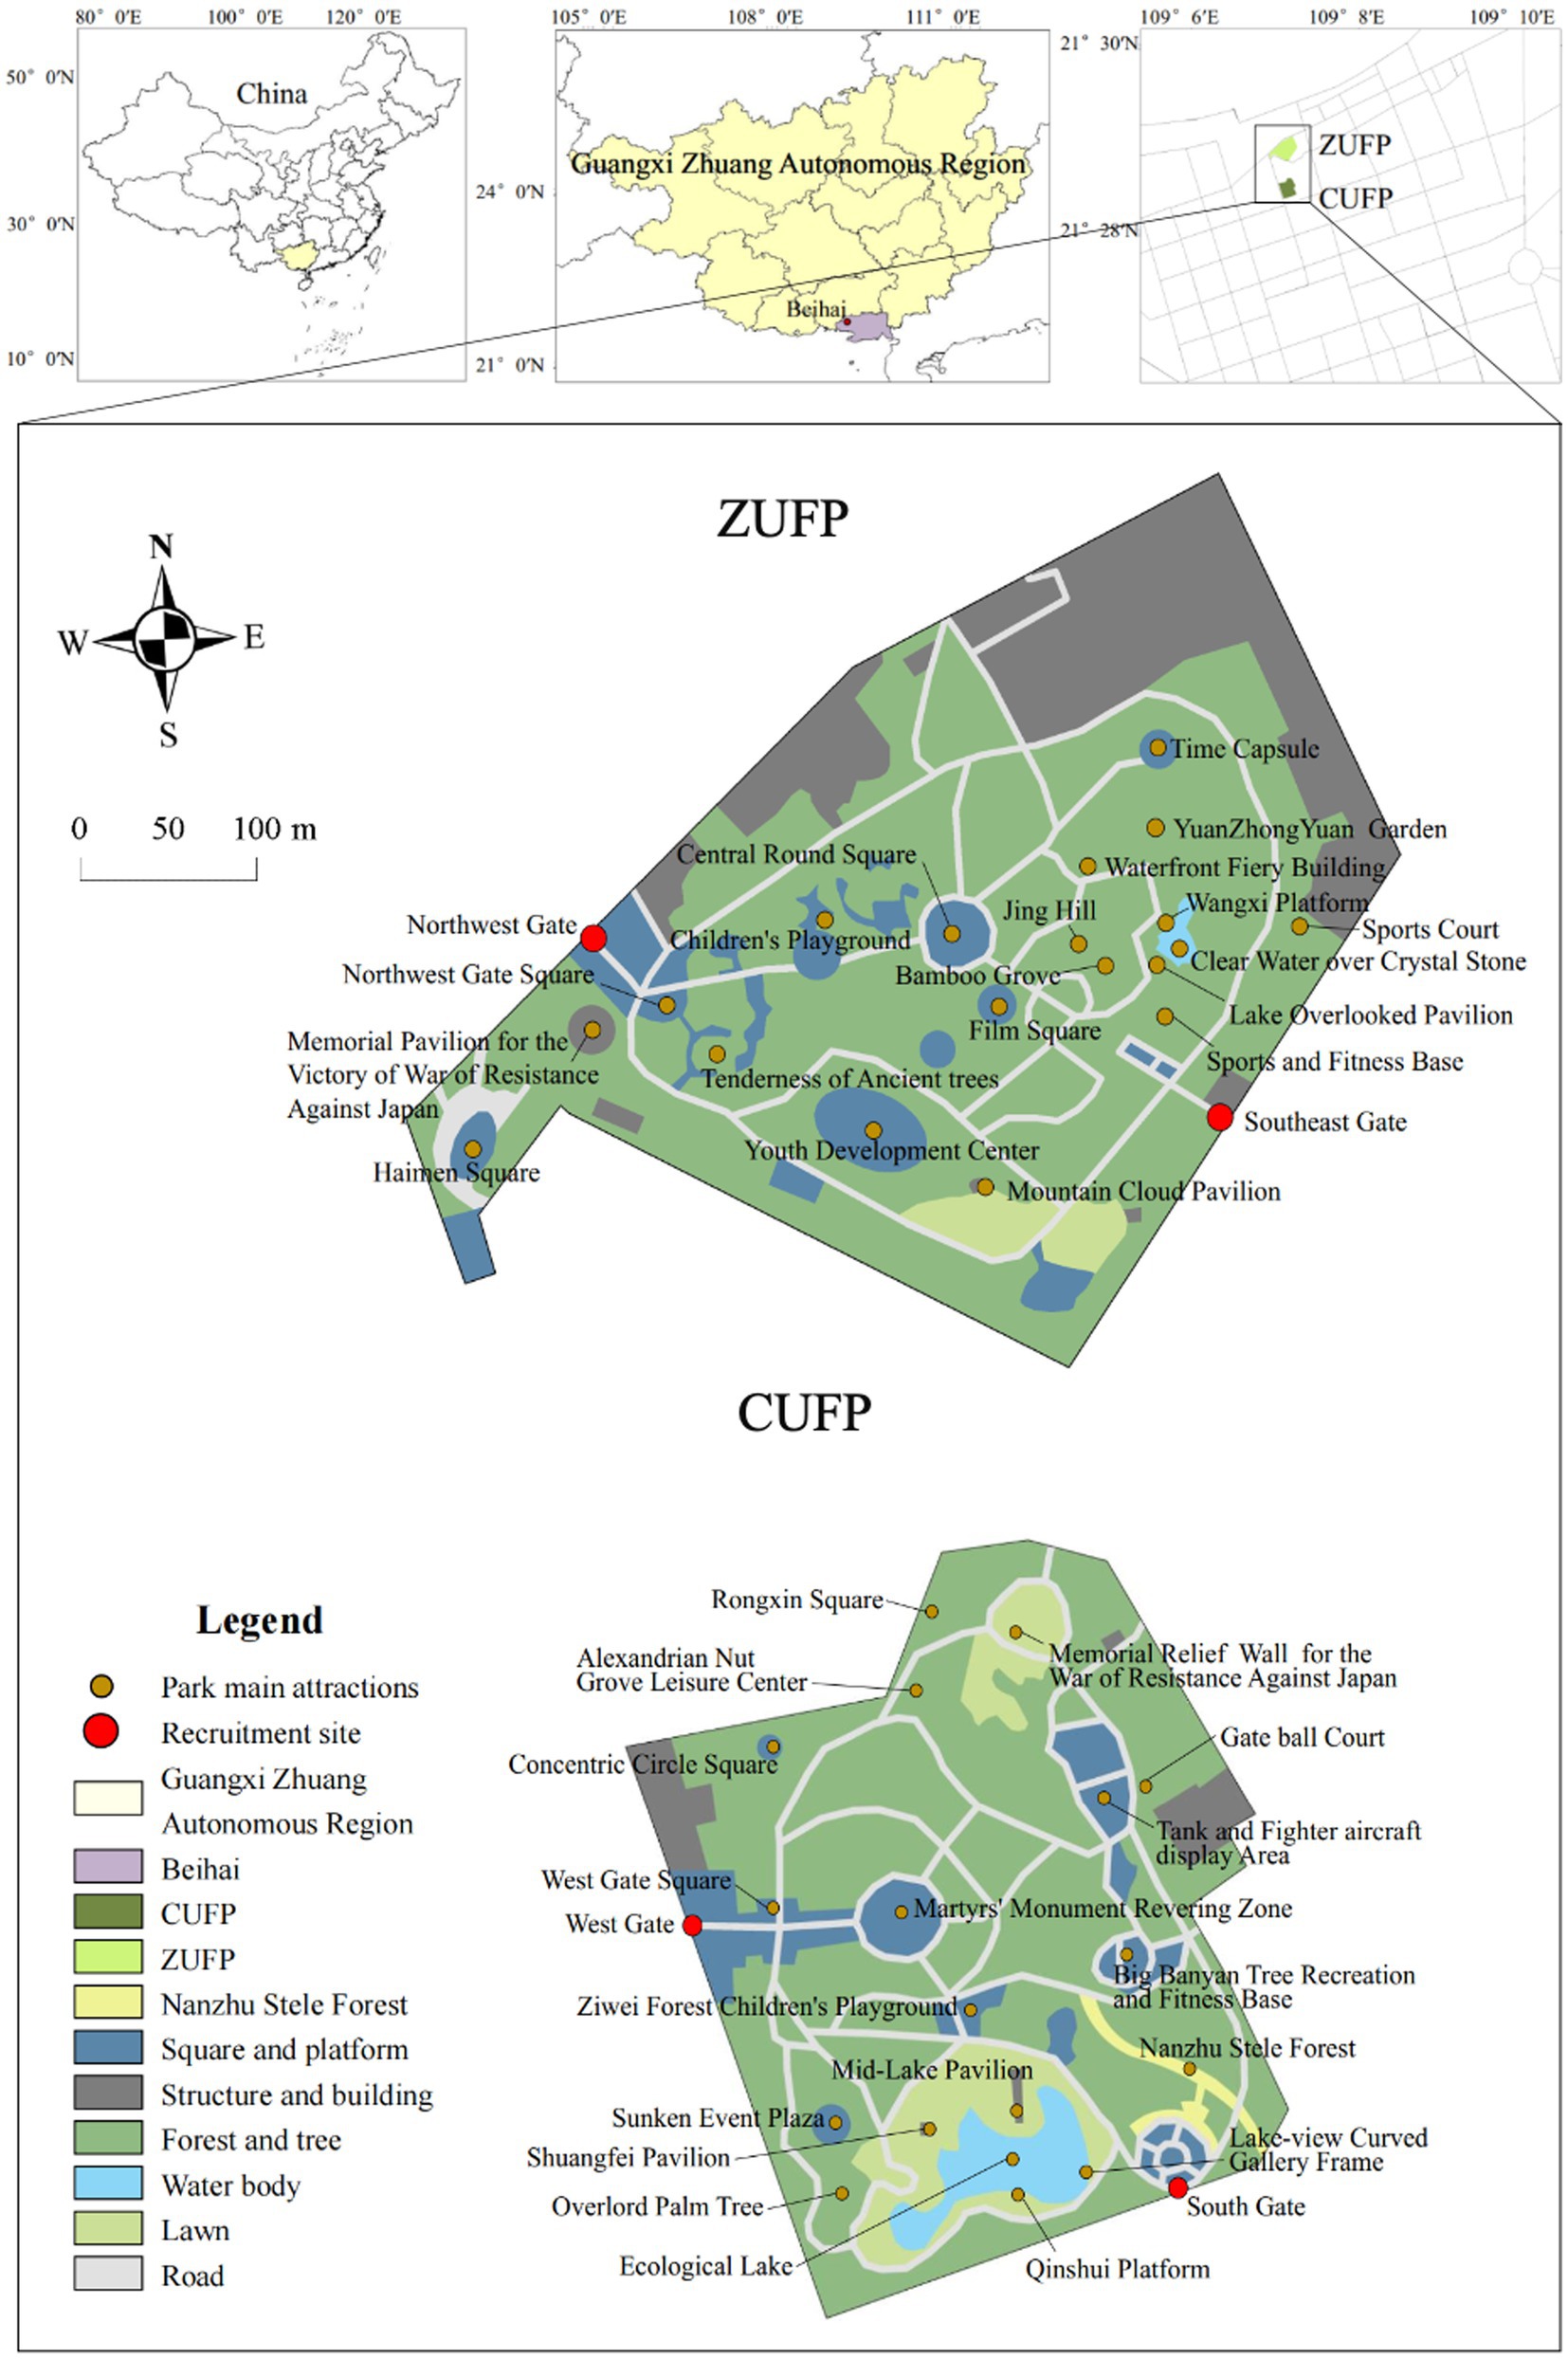
Figure 2. Location and main landscape composition of the CUFP and ZUFP. Two urban forest parks in Haicheng District, Beihai City, Guangxi Zhuang Autonomous Region, China: CUFP: Changqing Urban Forest Park, CUFP; ZUFP: Zhongshan Urban Forest Park, ZUFP.
2.2. Data acquisition
2.2.1. Experimental design
We designed a research framework that included autonomous photo-taking, questionnaires and semi-structured interviews (Balomenou and Garrod, 2014). When hiring volunteers to take photos (VEP), we limited the use of photography tools to all participants, which required the use of a mini program called the Yuandao Meridian Camera. Yuandao Meridian Camera is a professional on-site photography watermark camera independently developed by Shenzhen Yuandao Communication Technology Co., Ltd., which can display information such as photography time and location. After obtaining user authorization, this camera mini program can load watermark information such as longitude and latitude, time, address, weather, altitude, logo, etc. on the photo.
The questionnaire we designed was used to record sociodemographic information about the volunteers, such as gender, age, income, and frequency of park visits, to help us use quota sampling to obtain a survey sample of two parks. And the subsequent interviews helped us to understand the volunteers’ motivation for taking photos and various details, which laid the foundation for scientifically defining their perceived CESs.
We provided volunteers with prior detailed information about the 13 CESs categories involved in this study (Table 1).
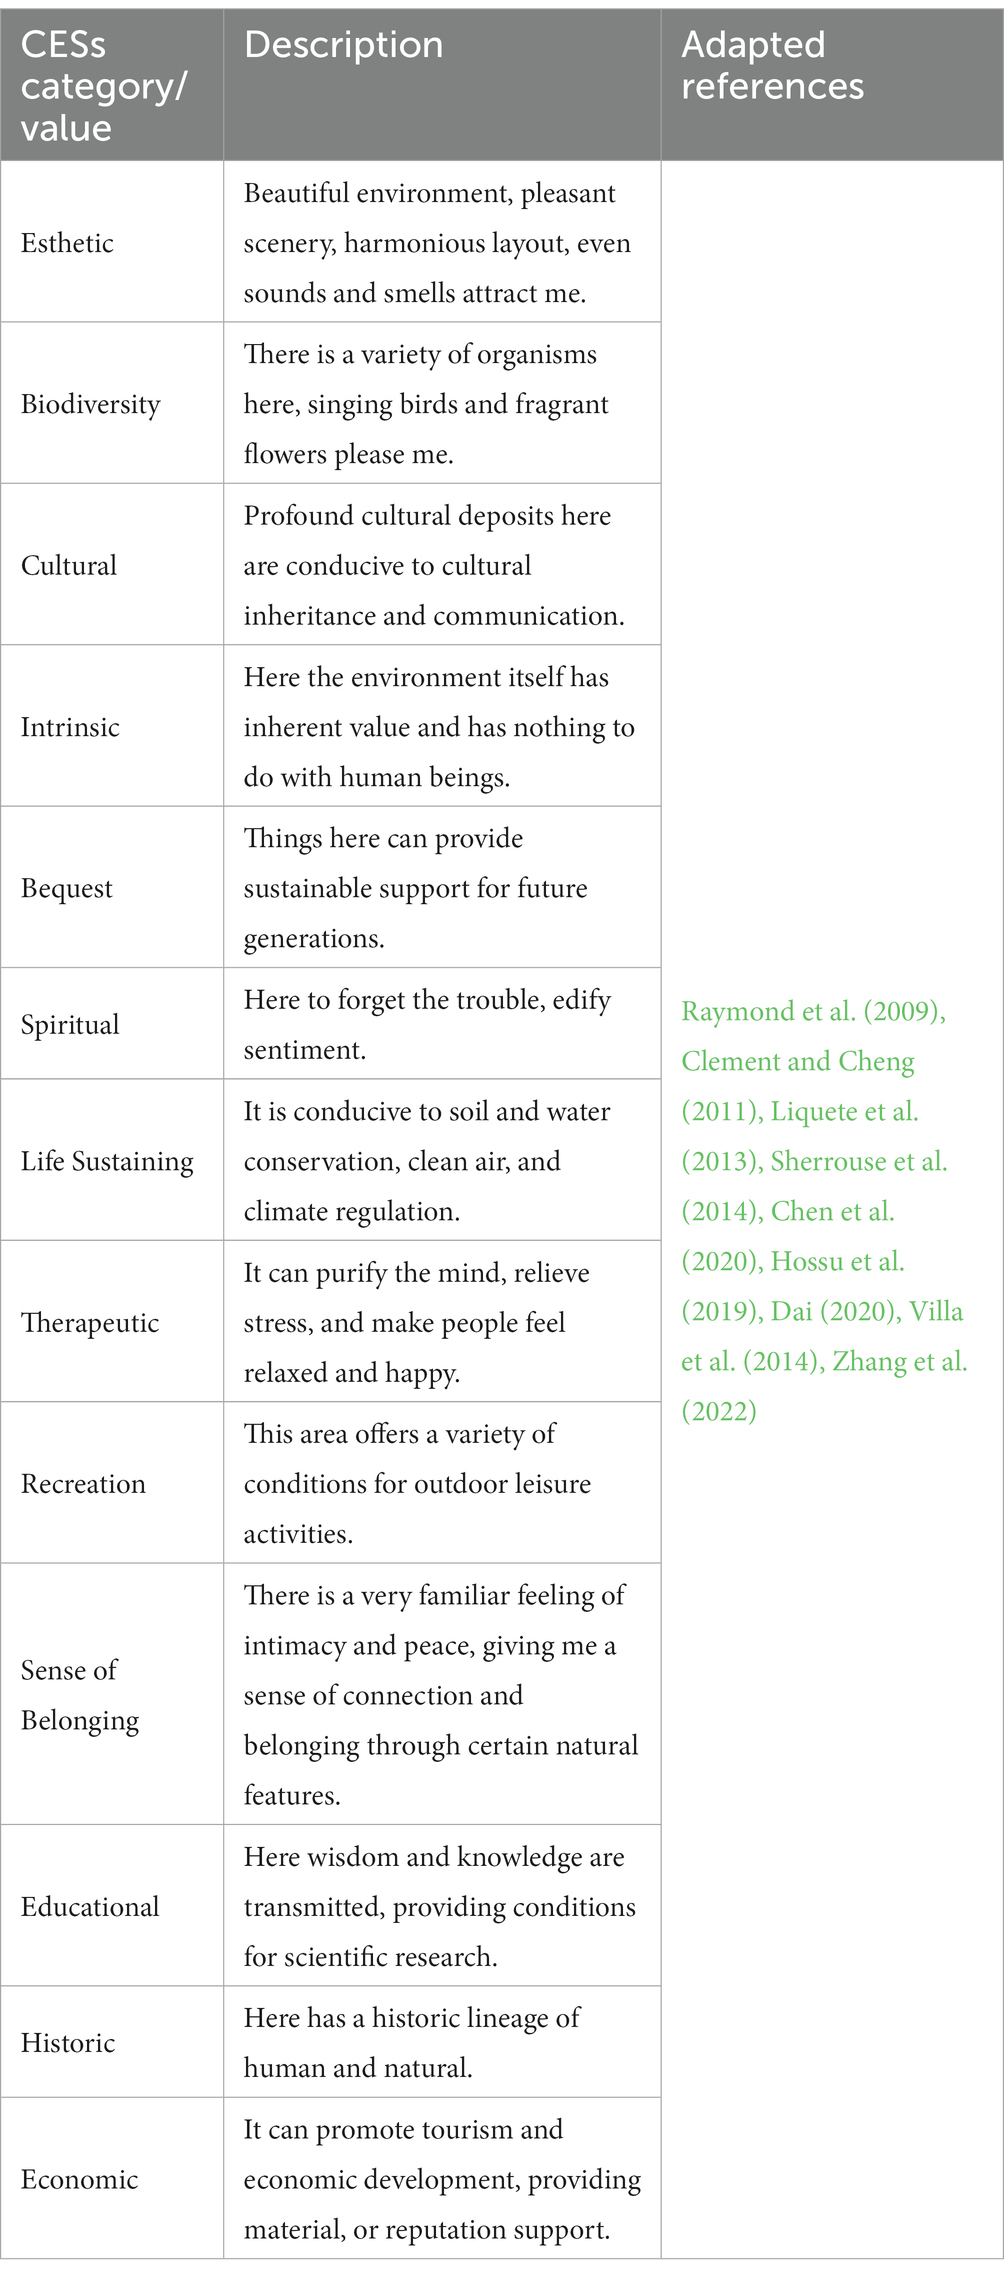
Table 1. The 13 categories of CESs that this research focuses on and their descriptions.
During the survey, volunteers were allowed to photograph any landscape scene they perceived as corresponding to each CESs at any location in the park. Volunteers were encouraged to fully express themselves during the tour (Sugimoto, 2013); if the volunteers perceived only one value in the same scene, then the default weight assigned to this value perception was 100, and if the volunteers perceived multiple values in the same scene, then they were asked to freely assign 100 units of weight among the perceived values according to how they actually felt. To avoid peer influence, volunteers were asked to visit alone as much as possible. In addition, each volunteer was asked to (i) familiarize himself/herself with the operation of the WeChat app Yuandao Meridian Camera in advance and make sure to use it to take pictures throughout the tour; (ii) visit as many parts of the park as possible from a predetermined starting point; (iii) take photos as close to the scenery itself as possible to ensure that the scenery was clear, and to ensure that the latitude and longitude recognized by the application were those of the scenery taken by the volunteers, reducing the latitude and longitude bias caused by volunteers taking photos too far away from the scenery; (iv) take more than 10 photos of the scenery they considered valuable (Sun, 2019). At the end of the tour, volunteers would carefully select the 10 most valuable photos among those they had taken themselves. At the same time, volunteers were invited to identify the CESs categories of each photo and to conduct semi-structured interviews about the details of their visit, which were structured around three core questions: (i) what CESs value you perceived from the landscape shown in the photos and for what reasons, (ii) what were your feelings at the time, and (iii) what factors influenced your judgment. Figure 3 shows the research process.
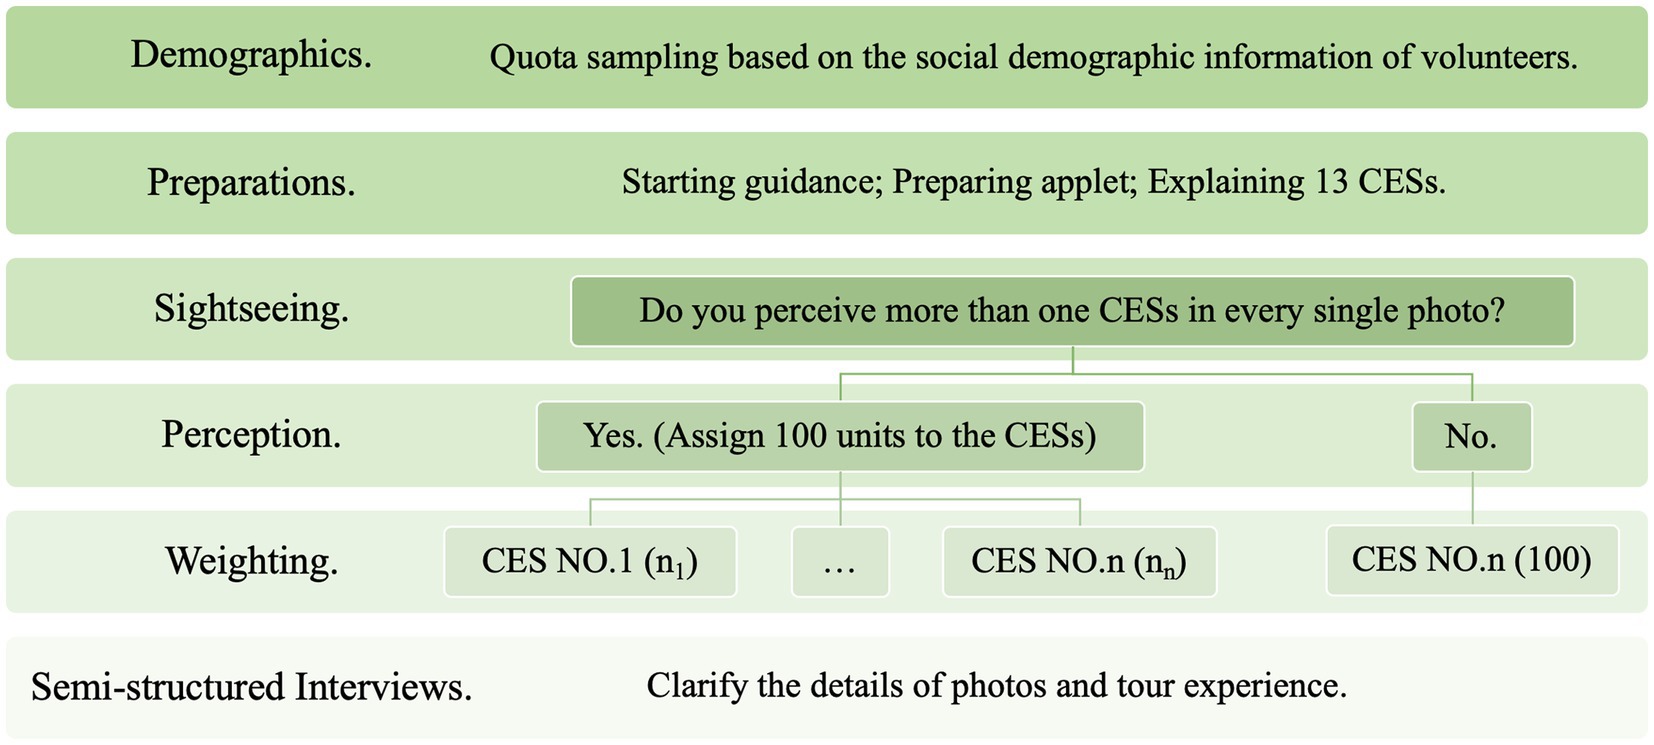
Figure 3. Flow chart of the study.
2.2.2. Pre-survey
From December 25–31, 2022, our research team (10 people) conducted a seven-day pre-survey to test the reliability of the software and the feasibility of the survey procedure. The pre-survey found that the order and temporal sequence of tourists visiting the landscape plays an important role in how tourists perceive the environment (Sugimoto, 2013). Visitors’ willingness to take photographs tends to be in the early part of the tour, while the number of perceived CESs decreases in the later part of the tour, as well as the interest in the tour (Markwell, 1997; Oku and Fukamachi, 2004). For this reason, we set up relatively distant departure points (Figure 2) in each of the two parks to balance the deviation caused by this phenomenon. We also found that date also significantly affected the number of visitors (Li, 2011), participation intention and CESs perception (Zhao et al., 2022). Based on this, we set the formal research date at January 26–31, 2023. The 6 days include the Chinese traditional festival of Spring Festival, weekdays and weekends, basically covering the common date types.
It should be noted that although tourist routes play a connecting role between the subject and object of the park, the tourist route grid frames the scenic spots in appropriate locations and organizes them into a certain landscape sequence (Li and Wang, 2014). Presetting tourist routes is beneficial for understanding tourists’ interest and changes in awareness of the environment (Sugimoto, 2013). However, human behavior in outdoor spaces is a process of constantly seeking goals (John and Motloch., 2000). The environment has suggestive features and connections. In outdoor environments, viewers with different attributes search, select, and organize the environment based on their preferences and purposes, and then give the things they see a certain meaning (Lynch, 1960; Zhang et al., 2019). The relationship between environmental stimuli and people’s feelings, perceptions, and judgments reflects the process of conveying landscape environmental information and the viewer’s perception of stimuli to make esthetic and value judgments (Xu et al., 2008). Based on previous research and the features of this study, we believe that as an open space with a wide view, the route choices of volunteers have to some extent reflected their perception and judgment of the value of the scenery within their field of view. Therefore, we only provided all volunteers with a list of 13 categories of CESs and did not provide them with pre designed tour routes to visualize the spatial distribution of specific data (Sugimoto, 2011).
2.2.3. Participant recruitment and experiment conduct
The participant screening mechanism for this study was as follows:
Inclusion criteria: (i) having autonomous mobility; (ii) being able to reasonably and fully understand the value of various cultural ecosystem services; (iii) being proficient in the use of smartphones and the phone can normally use the Yuandao Meridian Camera applet. Exclusion criteria: (i) abnormal color vision or blurred vision; (ii) language communication impairment; (iii) not accepting the experimental procedure.
Before the tour began, we explained the experimental procedures to volunteers in detail so that they were fully informed and sought their prior authorization to use their photographs for the study, while ensuring their anonymity. At the same time, all volunteers received the necessary guidance and training on the various details of the survey procedures to ensure that they understood as much as possible about the purpose and methods of the study.
In conjunction with the purpose of this study and the sample size, we used quota sampling to obtain the survey sample, considering that other demographic and socioeconomic factors may potentially influence the perceived outcomes. The sampling principles were as follows: (i) the number of CUFP and ZUFP volunteers remained approximate at 179 and 181, respectively (Qiu et al., 2013; Sun, 2019); (ii) the gender ratio of volunteers in both parks was balanced and similar; (iii) the population ratio of volunteers in each education level remained similar in both parks; (iv) the parks have balanced and similar volunteer employment structures and ratios; (v) the proportion of first-time and non-first-time visitor volunteers remains similar in both parks; (vi) the proportion of volunteers who are local remains similar in both parks; and (vii) the proportion of volunteers who visit alone remains similar in both parks.
The formal survey was conducted from January 26–31, 2023. Three hundred sixty volunteers were invited to this survey, including 179 CUFP volunteers and 181 ZUFP volunteers. We finally collected 3,600 photos and 360 questionnaires, of which, 179 questionnaires were for CUFP and 181 questionnaires were for ZUFP.
2.3. Data analysis and quantification
2.3.1. SolVES 3.0 model
In recent years, many researchers have been increasingly conducting valuation of cultural ecosystem services at the social and spatial levels, and the SolVES model has been more fully applied. The Social Value of Ecosystem Services 3.0 (SolVES 3.0) model aims to assess the mapping and quantification of the public’s perceived social value of ecosystem services. By combining spatial data with social survey data for quantitative spatial analysis and prediction of non-monetary values of ecosystem services, the model can provide an improved social value assessment tool for various stakeholder groups (Sherrouse et al., 2011; Brown and Brabyn, 2012a,b).
The SolVES model consists of 3 sub-models: Ecosystem Services Social-Values Model, Value Mapping Model and Value Transfer Mapping Model (Zhang et al., 2022), and this study used the Ecosystem Services Social-Values Model in combination with the Value Mapping Model, without involving Value Transfer Mapping Model. Esthetic, biodiversity, cultural, intrinsic, bequest, spiritual, life sustaining, therapeutic, recreation, sense of belonging, educational, historic, and economic, the 13 social value types were numbered and processed in VALUE_TYPE, combined with the value amount assigned to each social value type by the subjects (the total value of each landscape photo was 100, and the subjects assigned their own perceived value amount to the landscapes), and the kernel density analysis tool in SolVES was used to do a weighted kernel density of the social value points analysis to obtain the kernel density surfaces weighted by the total amount of value and identify the maximum kernel density value for each cell location. The SolVES model then divides the “kernel density surface” by the “maximum kernel density value” and normalizes the result to a value index surface (Alessa et al., 2008; Sherrouse et al., 2022). The results of the value index assessment are presented as a point value index (VI) from 1 to 10, and the magnitude of the VI reflects the public perception of various social values, and a social value map with a value index is derived (Sherrouse and Semmens, 2014). In this study, we set the image unit parameter to 1 m and the search radius to 10 m, and the environmental layer includes distance to road (DTR), distance to water body (DTW), elevation (ELEV), land use type (LULC), and slope (SLOPE).
2.3.2. Content analysis of the photo dataset
Photographic data can convey the relationship between humans and the landscape, the importance of human activities and natural processes in the landscape, as well as natural and human characteristics (Oteros-Rozas et al., 2018), and visually understand which landscape features attract visitors, tourists, and other users from a visual perspective (Huang H. et al., 2013). We performed content analysis on the datasets returned from the survey. Since the datasets were mainly provided in the form of images, we needed additional steps to extract relevant content and perform quantitative analysis (Scaini et al., 2022). Such image datasets can be used to examine the characteristics of the landscape in the survey, indirectly informing us of the iconic cultural services provided by the ecosystem (Alieva et al., 2021). Information about cultural ecosystem services can be extracted based on photographic data (Fernando et al., 2021), so as to make a more comprehensively analysis on broader ecosystem services (Sinclair et al., 2018).
Based on this, we need to extract three types of content information. (i) Information on the latitude and longitude of the photograph, i.e., the location where the photograph was taken. The focus of the spatial analysis is to understand the overall distribution of cultural ecosystem services at the location (Retka et al., 2019). During the analysis, not only the spatial location of the photographs was used, but also the actual content of the photographs was combined to obtain additional landscape information (Koen et al., 2018). (ii) The actual content of individual photographs is analyzed in order to classify them based on specific elements in the photographs (Ghermandi et al., 2020). The context and content of the photographs were classified into CESs categories based on the presence or absence of landscape elements in the photographs, such as flora and fauna landscapes, historical buildings or tourism infrastructure and facilities (de Juan et al., 2021). The categories of CESs of the photographs and the corresponding amount of value were annotated by the participants in the corresponding questionnaires. At the same time, we had to understand the activities that people were engaged in when taking the photographs and which features of the environment attracted their attention, which could be used to distinguish the different cultural uses of the landscape elements (Richards and Friess, 2015). (iii) Landscape elements that appearing in the photographs. The landscape elements of each photograph were determined according to the proportion of the area occupied by landscape elements in the photograph, and the elements with ≥50% of the area were extracted as the main elements of the photograph, thus analyzing the influence of different types of landscape elements on the public perception of CESs (Tan et al., 2021), which helped to understand the landscape values as a whole (Fagerholm et al., 2012), and it was also a mapping of landscape and scenic esthetics (van Zanten et al., 2016).
The extraction of landscape elements is crucial, as even small changes may significantly alter the content of the sample and thus influence the results of subsequent analyses (McKitrick et al., 2022). Our work on content analysis of photographs was done by six researchers in conjunction with the results of post-experimental interviews. Two individuals made decisions back-to-back. When there is any disagreement, all six would confer together to determine the final extraction result (Oteros-Rozas et al., 2018).
2.3.3. Statistical analysis
Correlation Analysis (CA) was used to reveal the relationships between CESs and landscape elements using R software with CESs, landscape elements, and the values of CESs perceived in photographs as three-column variables. CA maps allow multiple variables to be plotted simultaneously on the same map, visually showing the characteristics of the relationships between CESs and landscape elements. As an exploratory technique, the relationships between variables shown in CA maps may not be obvious (Doey and Kurta, 2011). Therefore, the frequency of occurrence of landscape elements in each category of CESs was also calculated. The interpretation of the relationships between variables in the CA plots was based on the relative distances and directions of distribution between the row and column points in the plots. In this study, categorical variables were analyzed using chi-square tests for quadruple tabulated data, including differences in socio-demographic variables and the frequency of perceived CESs between the two groups. In this study, a p value <0.05 was considered statistically significant. All statistical analyses were performed using stata 17.0.
3. Results
3.1. Photo dataset interpretation
The results of the four-fold chi-square test (see Supplementary Material) showed no significant differences between subjects in the CUFP and ZUFP subgroups in terms of gender, literacy, type of employment, number of indigenous people, number of visits, and composition ratio of travel companions. Duplicate or unidentifiable photos were screened out based on the aggregated photo dataset. Seven landscape categories and 17 subdivided landscape elements were summarized. The current counts for each category are shown in Table 2.
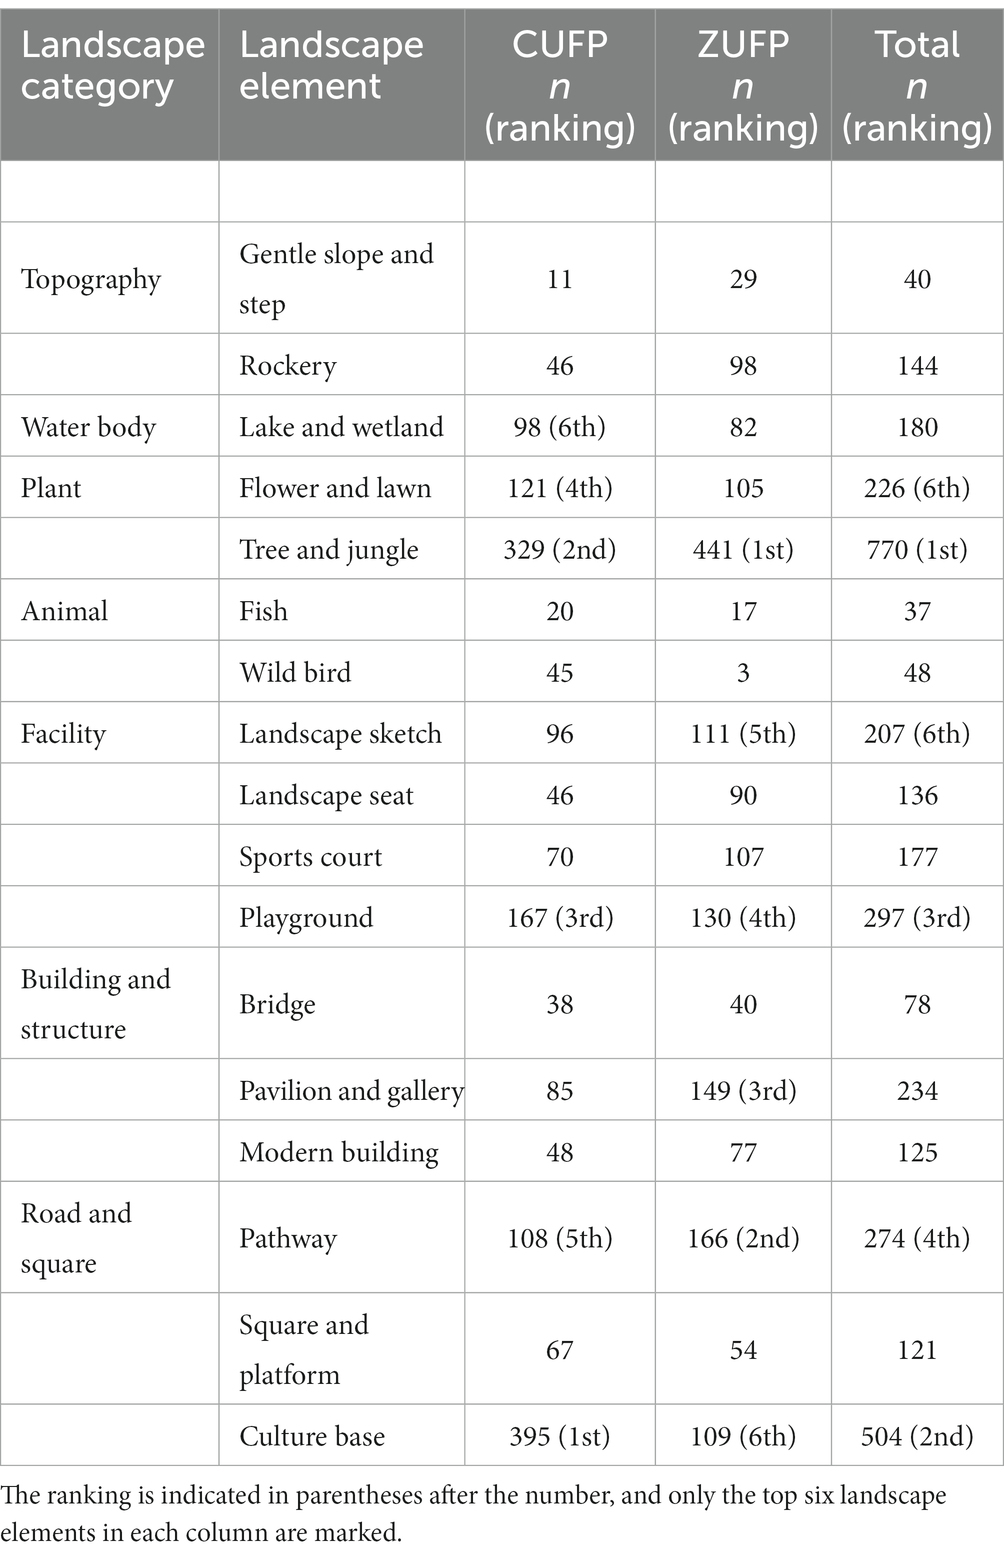
Table 2. Number of occurrences and ranking of the 17 landscape elements in the CUFP and ZUFP subgroups.
Three landscape types, Plant, Facility and Road and square, appear very frequently in both subgroups, while Fish and Wild bird appear a total of 85 times. In CUFP, landscape elements such as Culture base, Tree and jungle, and Playground appeared more frequently in the photos, which is the same as in ZUFP, but the specific frequency of occurrence and ranking of these three landscape types differed in the two parks.
Figure 4 shows the total number of values of various CESs perceived by the two subgroups (in k, 1,000), and the 13 CESs values were ranked from highest to lowest, using CUFP as the benchmark. We considered the case that volunteers perceived multiple CESs values for the same photo, and in order to avoid the problem of unreasonable weighting due to repeated counting, we followed the logic of “Experimental design” in this paper to conduct the data statistics, i.e., if volunteers perceived only one value in the same photo, then the default weight assigned to the perception of such value was 100, and if volunteers perceived If the volunteer perceives multiple values in the same scene, then the volunteer will be asked to freely assign the weight of 100 units among the perceived multiple values according to his or her actual perception. Thereafter, the perceived CESs amount is summed up to obtain more objective statistics.
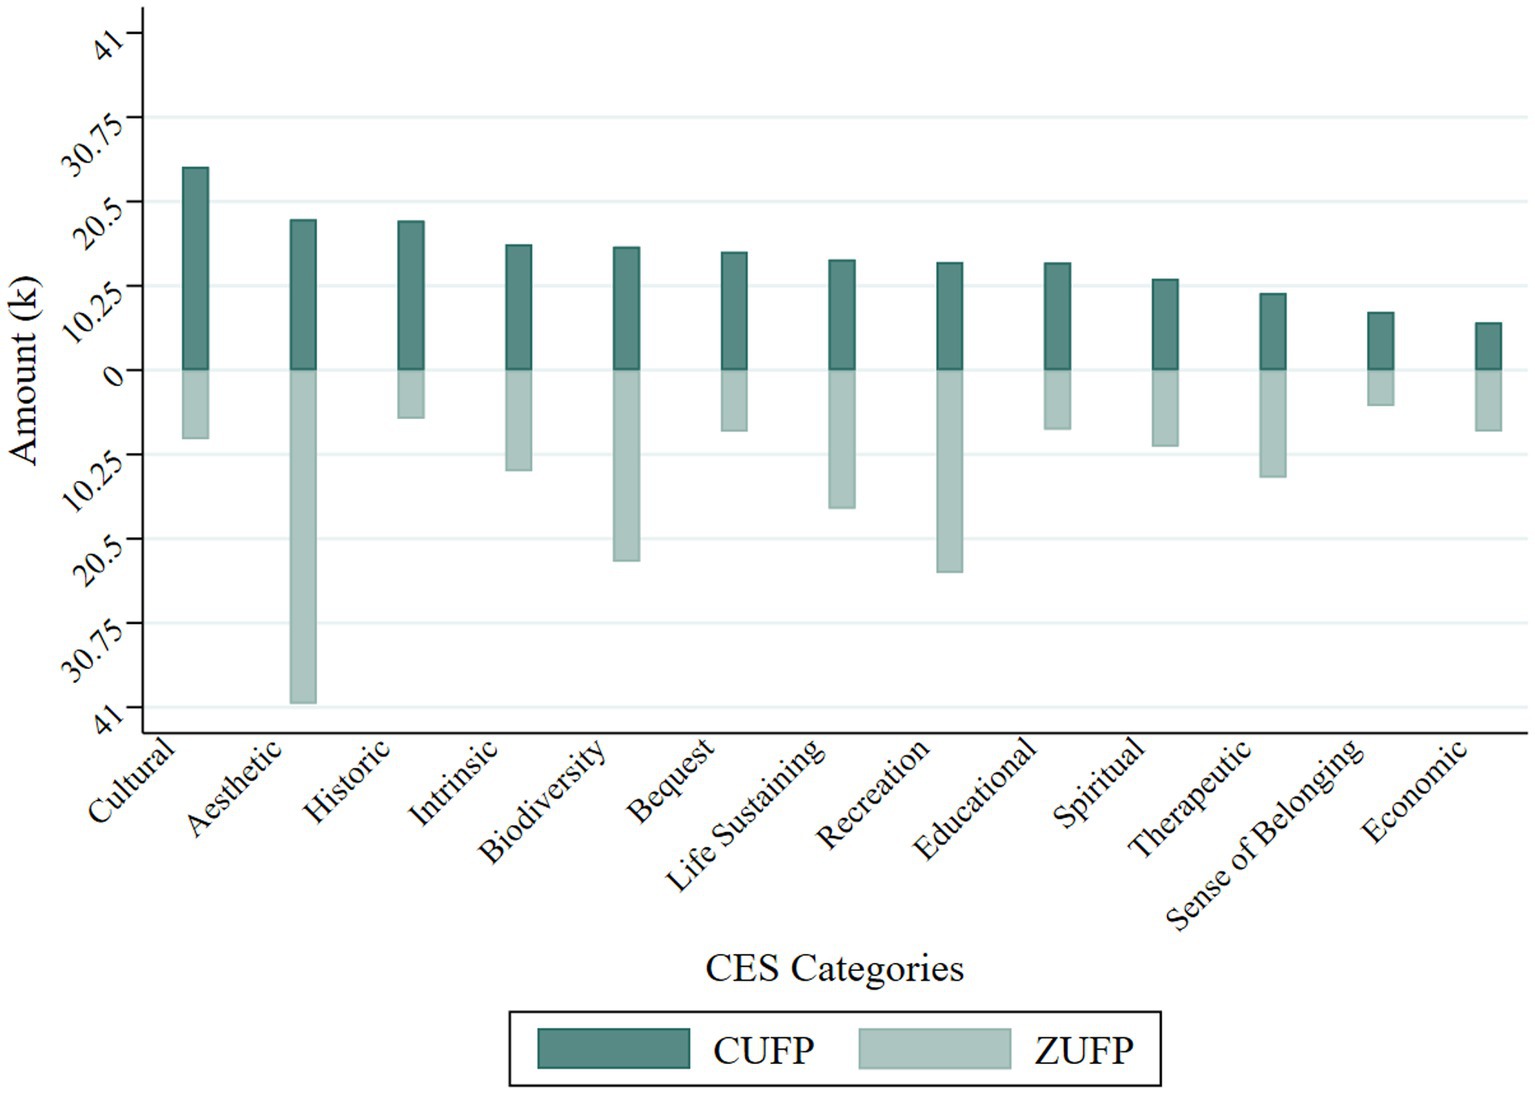
Figure 4. CESs value amount and total number of different categories of CESs perceived by volunteers in the CUFP and ZUFP subgroups.
Among the 13 CESs values, esthetic, biodiversity, and recreation value are the three most common values, while economic and sense of belonging value are the two least perceived CESs values. The differences in the perceived values of the two parks, CUFP and ZUFP, can already be seen initially in Figure 4. In addition, the total value of each CES is more than 7,000, indicating that many tourists have a unique perception of some CESs, and also proving the scientific validity and necessity of the 13 CESs.
3.2. Spatial distribution of CESs and differences between CUFP and ZUFP
Figure 5 shows the spatial distribution of the 13 types of CESs received by the two parks, where different colors represent different degrees, with the magnitude increasing from blue to red. In general, both parks’ CESs are distributed along the road network. The Nanzhu Stele Forest, the Tank and Fighter Display Area, the Martyrs’ Monument Revering Zone, the Rongxin Square, the West Gate Square, the Ziwei Forest Children’s Playground and the Ecological Lake perimeter in CUFP are relatively high-value areas of the park, while the lawn in the northwest side of the park and the grassy area in the central north are relatively low-value areas of the whole park. Surrounding the Time Capsule, the pavilions, the water system, the Central Round Square and the Memorial Pavilion for the Victory of War of Resistance Against Japan in ZUFP are the relatively high-value areas of the park, while surrounding the office building on the southwest side of the park, around the Northwest Gate Square and around the public toilets are the relatively low-value areas of the park.
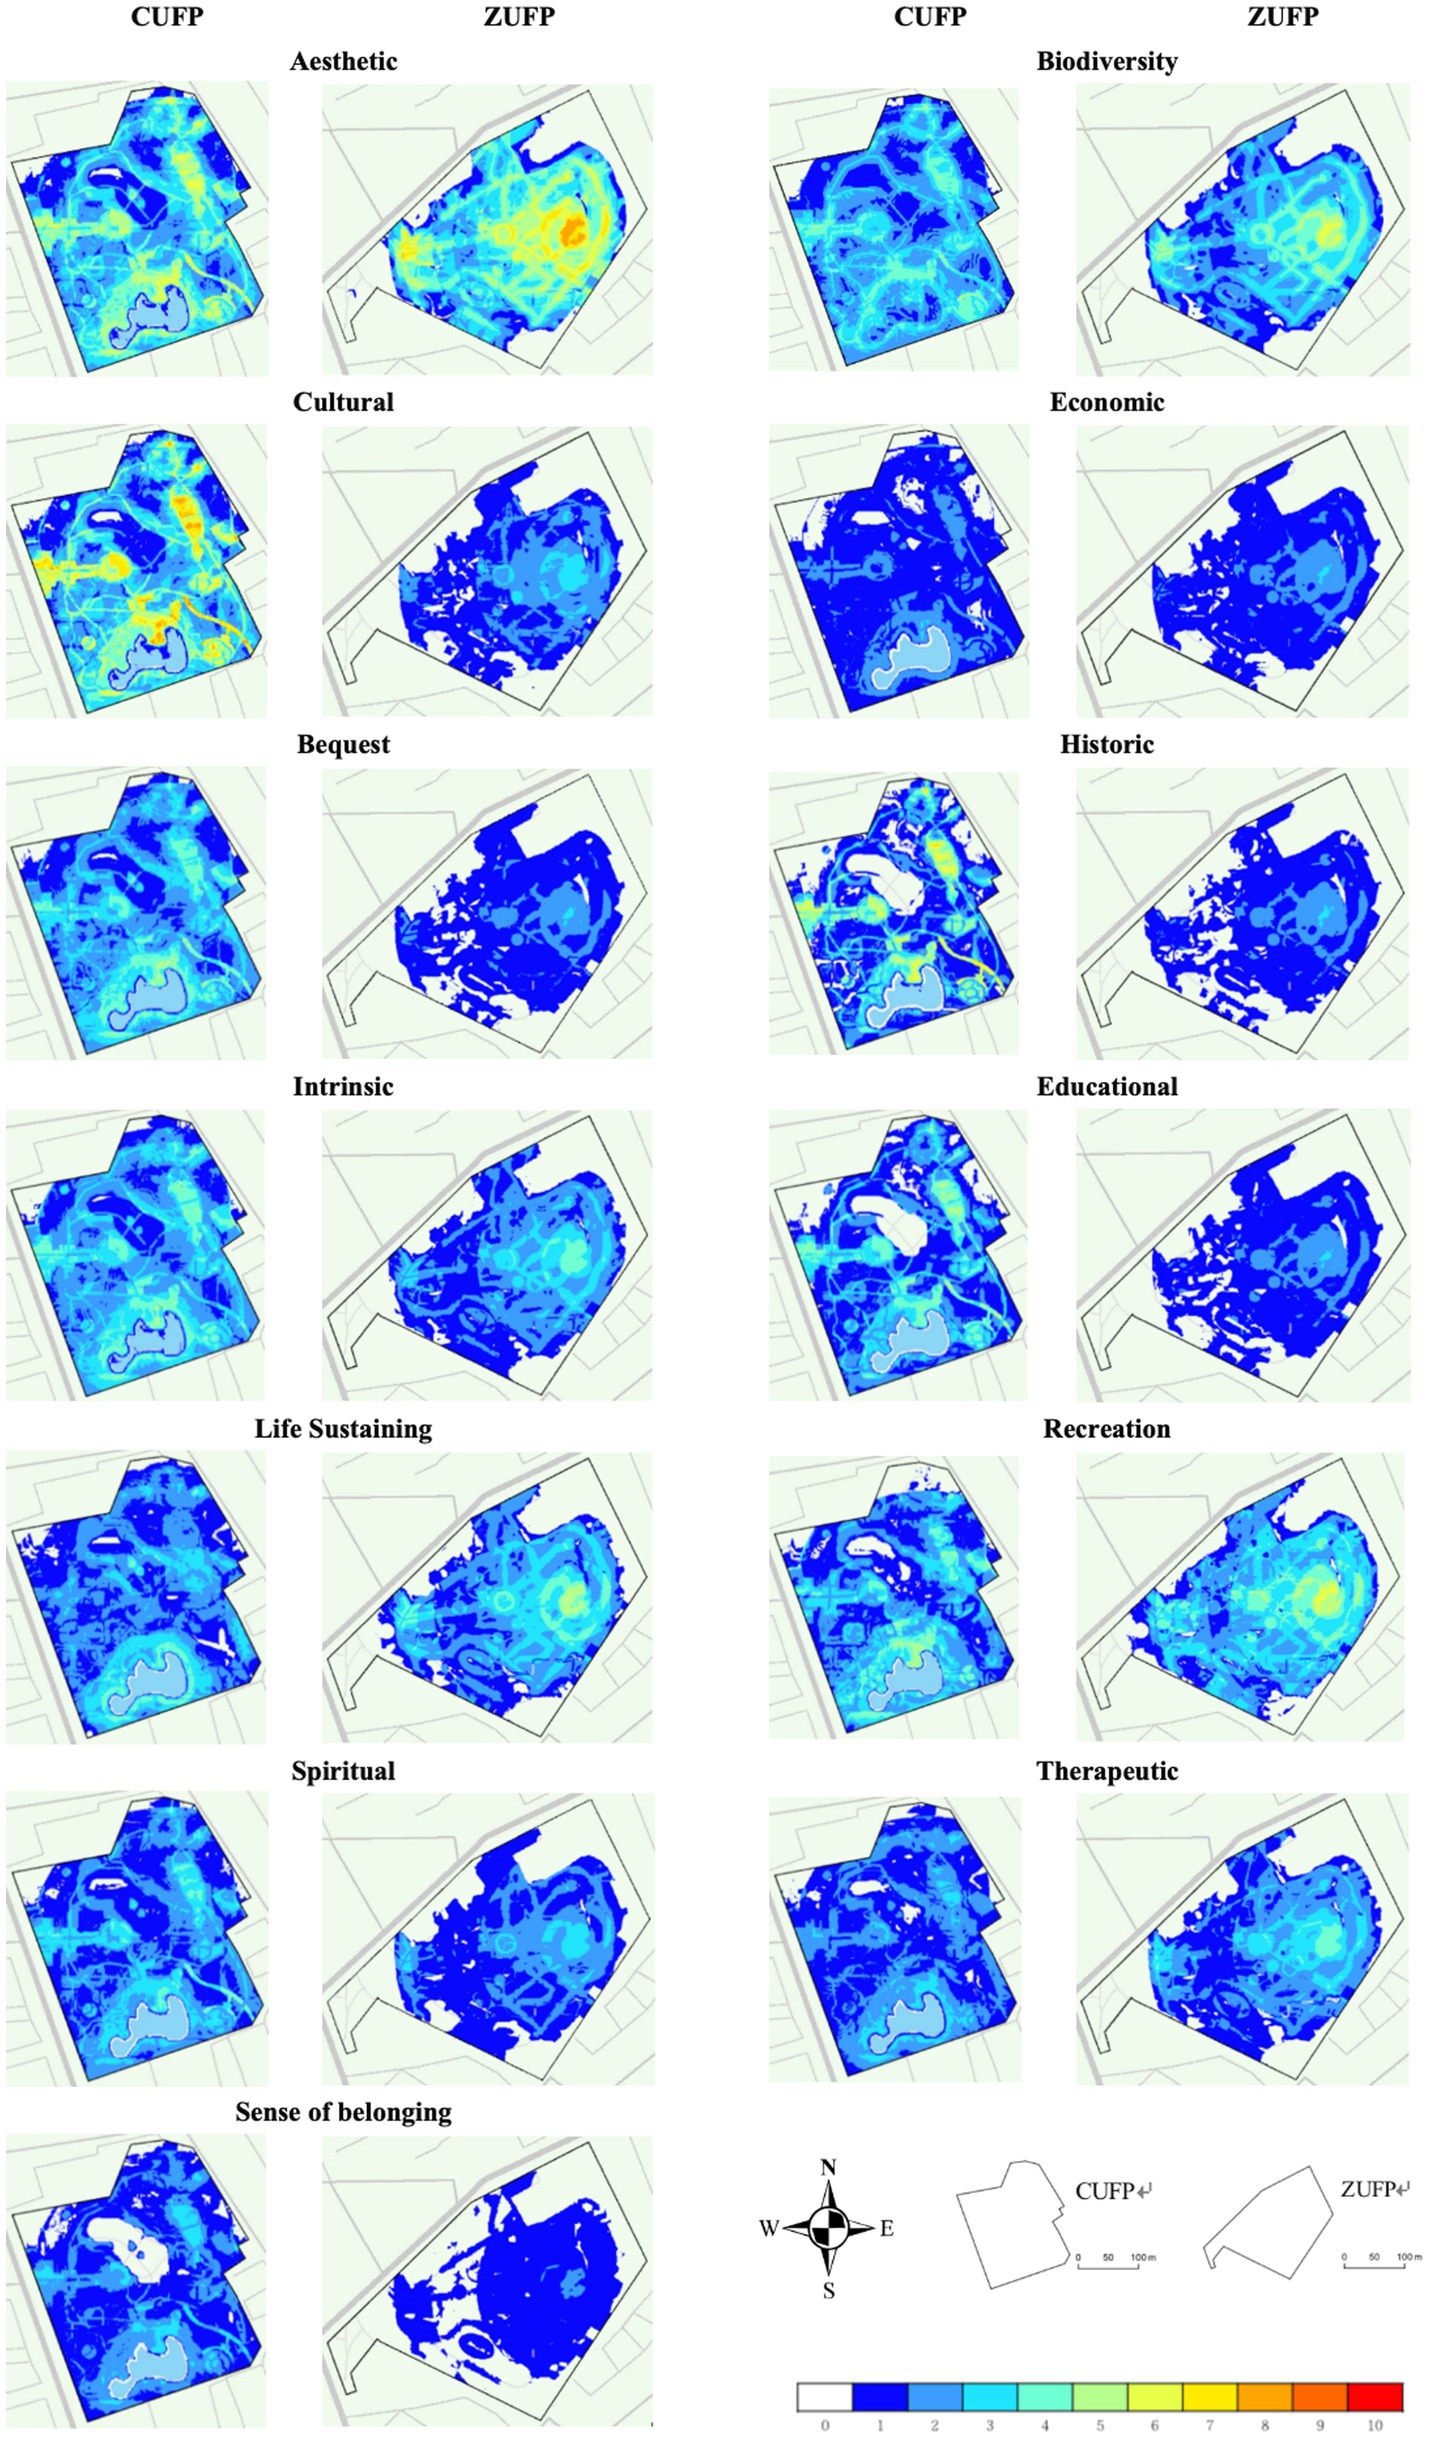
Figure 5. Spatial distribution of 13 categories of CESs between CUFP and ZUFP.
The cultural value index of CUFP is the highest. The cultural value index is mainly distributed in the Nanzhu Stele Forest, the Tank and Fighter aircraft display Area, the Martyrs’ Monument Revering Zone, the Rongxin Square. Both parks have high esthetic value, with high-value areas concentrated around the watershed. The aesthetic value of ZUFP is significantly higher than that of CUFP. The Memorial Pavilion for the Victory of War of Resistance Against Japan, the Central Round Square, and around the Mountain Cloud Pavilion in ZUFP are the areas that more visitors consider to have aesthetic value.
Compared to ZUFP, CUFP has higher and broader bequest value, historic value, and educational value, and their distribution are similar to that of cultural value. More tourists tend to recognize the biodiversity value, life sustaining value, and recreation value of ZUFP, especially around the water system, the Mountain Cloud Pavilion and Memorial Pavilion for the Victory of War of Resistance Against Japan.
The differences in the perceived values of economic, intrinsic, spiritual, therapeutic, and sense of belonging between the two parks are small and the degree of value is low. The differences in the perceived values of economic, intrinsic, spiritual, therapeutic, and sense of belonging between the two parks are small and the degree of value is low, without showing obvious hotspots, indicating that tourists’ perceptions of the above CESs are more dispersed in space.
3.3. Association of CESs with environmental variables and differences between CUFP and ZUFP
Different environmental variables had different effects on CESs (see Appendix Table 5). In CUFP, DTW had the most significant contribution to biodiversity value and life sustaining value, while LULC had the most significant contribution to cultural value, historic value and educational value, all exceeding 50%. In ZUFP, DTW had a great contribution to all CESs. On the whole, the value index of CESs was inversely related to DTR, DTW, ELEV, and SLOPE, especially in ZUFP. The high value index of CUFP was mostly distributed near water bodies, roads and Nanzhu Stele Forest. The high value index of ZUFP was mainly distributed in forest and road, which reflected the respondents’ preference for ZUFP forest landscape, but the tour route was still subject to roads.
3.4. Association of CESs with landscape elements and differences between CUFP and ZUFP
In the CUFP and ZUFP subgroups, the two sets of variables for this analysis, CESs and park landscape elements, were not completely independent but were correlated (p = 0.0432/p = 0.0215). The CA bilinear plot shows the pattern of association between the two (Figure 6).
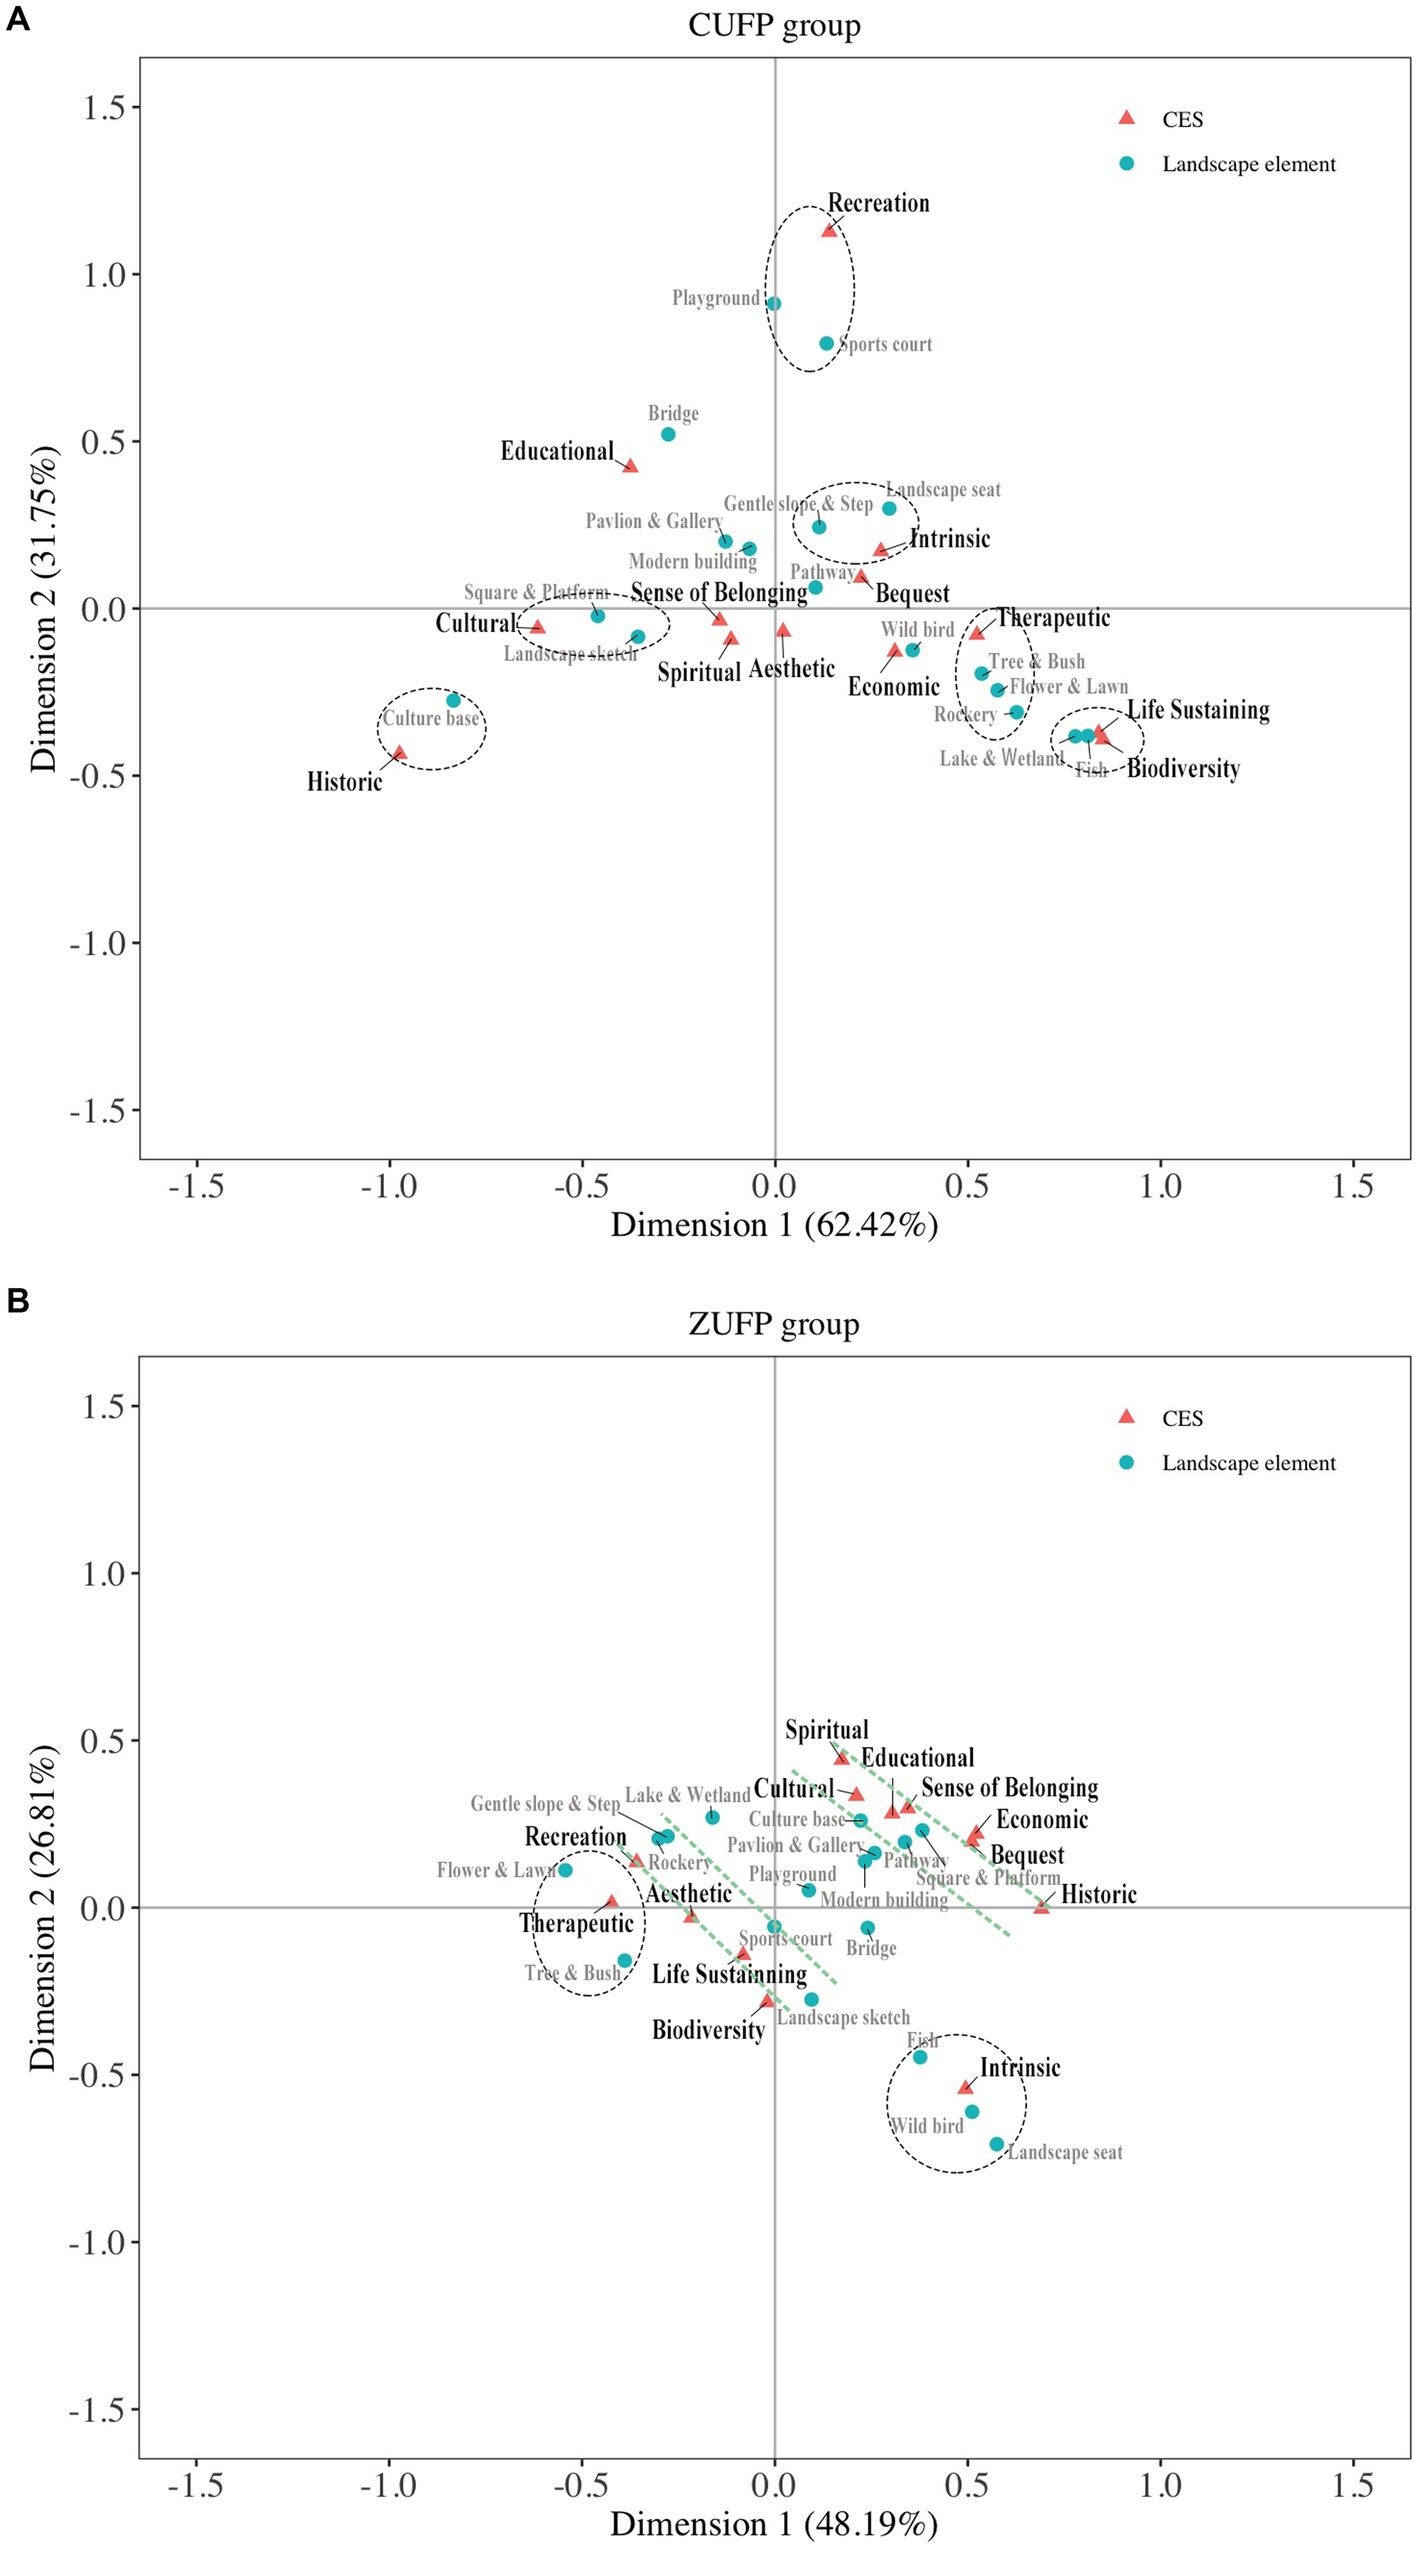
Figure 6. Biplot of correspondence between the 7 categories of CESs and the 17 landscape elements in the CUFP group (top) and the ZUFP group (bottom). Oval dotted lines represent landscape elements that tend to be associated with given CESs.
From the overall description of CESs and landscape elements, in the CUFP group, cultural value is closely related to the plazas and platforms represented by the Nanzhu Stele Forest. The landscape elements with historic value are mainly cultural bases. Recreation value embodied by playgrounds and courts is far from the origin and tends to present homogeneous attribution. Intrinsic value is related to landscape seating and gentle slopes and steps. Therapeutic value tends to be associated with trees and jungles, flourishing flowers and lawns, and artificial rockeries. Life sustaining valve and biodiversity value are associated with lakes and wetlands, and fish. Within the ZUFP group, therapeutic value also tends to be associated with trees and jungles, flowers and lawns, and intrinsic value is associated with fish, wild birds, and landscape seating, but cultural value is not strongly associated with plazas and terraces, which confirms that the geographically certified Nanzhu Stele Forest is effective in increasing people’s perceived cultural sensitivity.
From the distribution of CESs and landscape element points, the distribution of CESs and landscape element points of CUFP is more dispersed, but their corresponding correlations are clear and well-integrated. Most of the landscape element points of ZUFP are clustered around the origin, similar to the points of various CESs, and tend to be distributed around two groups of parallel lines (Figure 6 ZUFP group). This indicates that people have a variety of CESs value perceptions for various landscape elements in ZUFP, and the same CESs value perceptions can also originate from different landscape elements, and the relationship between them is not one-to-one correspondence, but mutual mapping. The large differences in the distribution of CA biplot points between the two parks may be due to differences between the two groups of parks themselves, the subjects themselves, etc., but when these variables are strictly controlled (see paper 2.1.1), the empirical evidence points to the effect of GI on the landscape, i.e., GI brings a clearer perception of the value of CESs and correspondence to the CUFP landscape.
From the distance of the landscape element points from the origin, most of the landscape elements in the CUFP group are far from the origin, and their explanatory power is better for their respective corresponding CESs, while the landscape elements in the ZUFP group are concentrated near the origin, indicating that these landscape elements are relatively less closely related to the CESs.
We followed the weighting method in “Experimental design” of this paper to assign weights to all photos of the two parks based on the type of CESs, and counted the extent to which the park landscapes provided specific CESs and the proportion of the frequency of landscape elements appearing in the photos for further comparative analysis of the differences between CUFP and ZUFP (Figure 7).
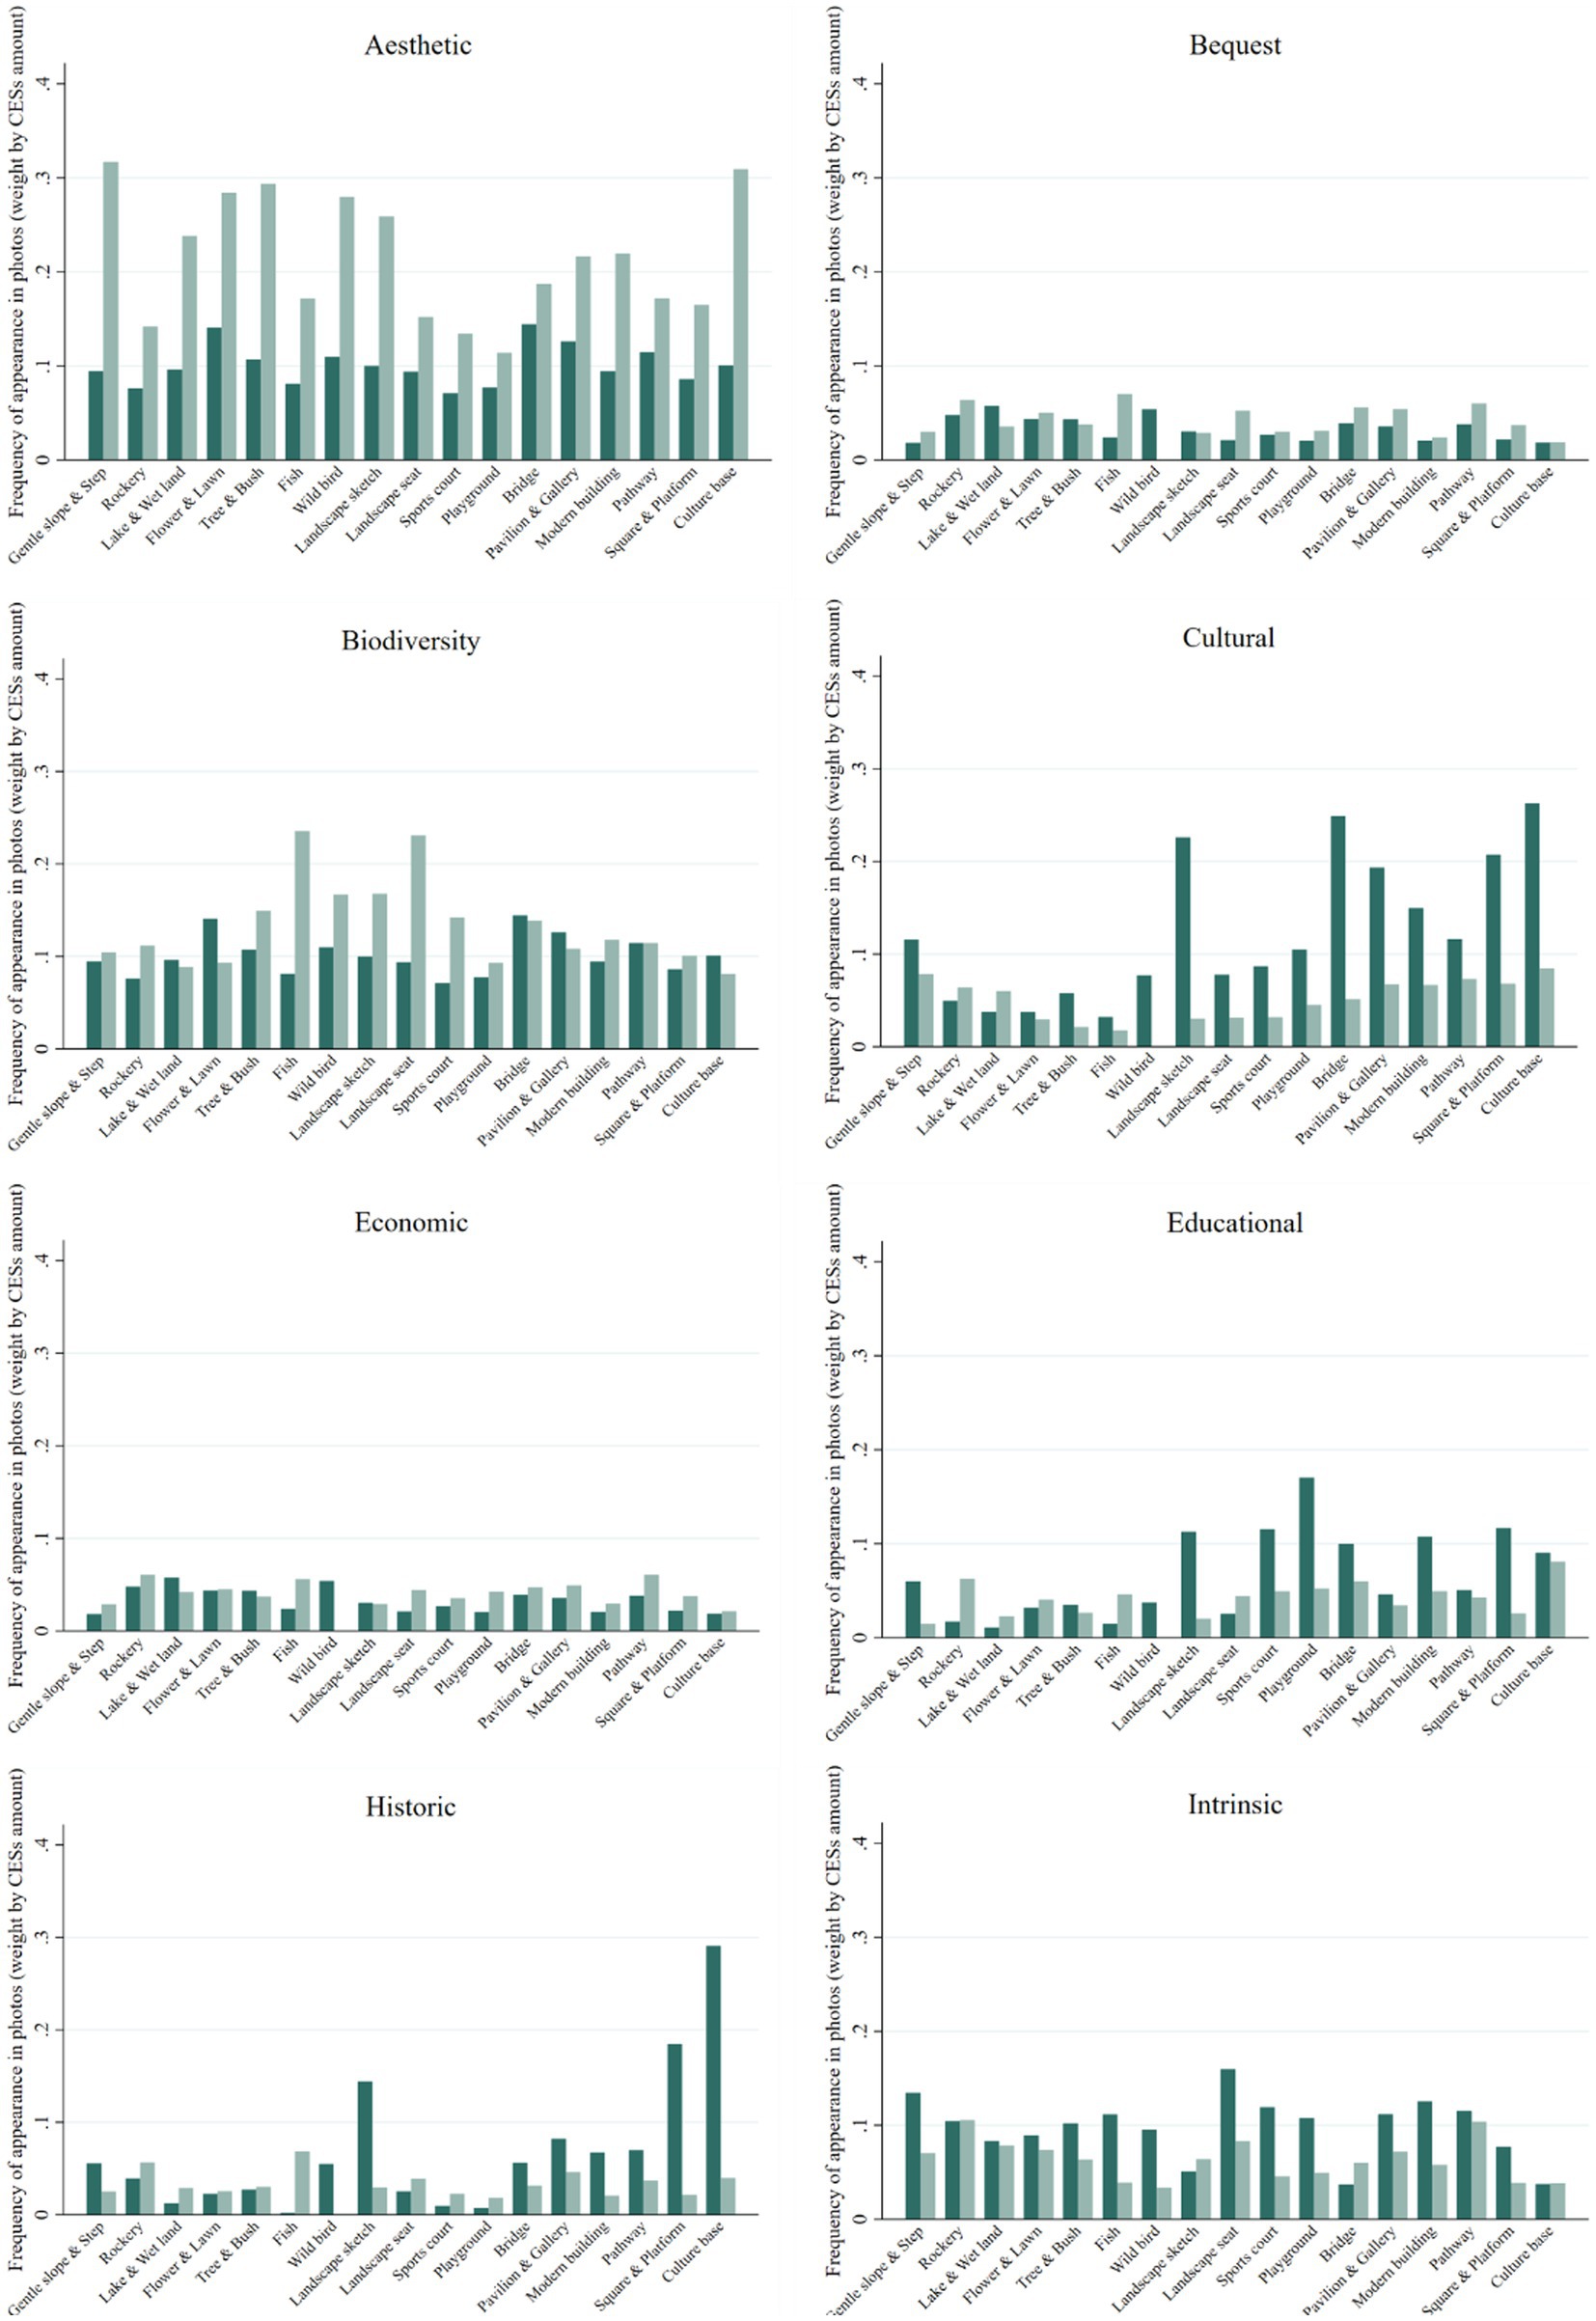
Figure 7.
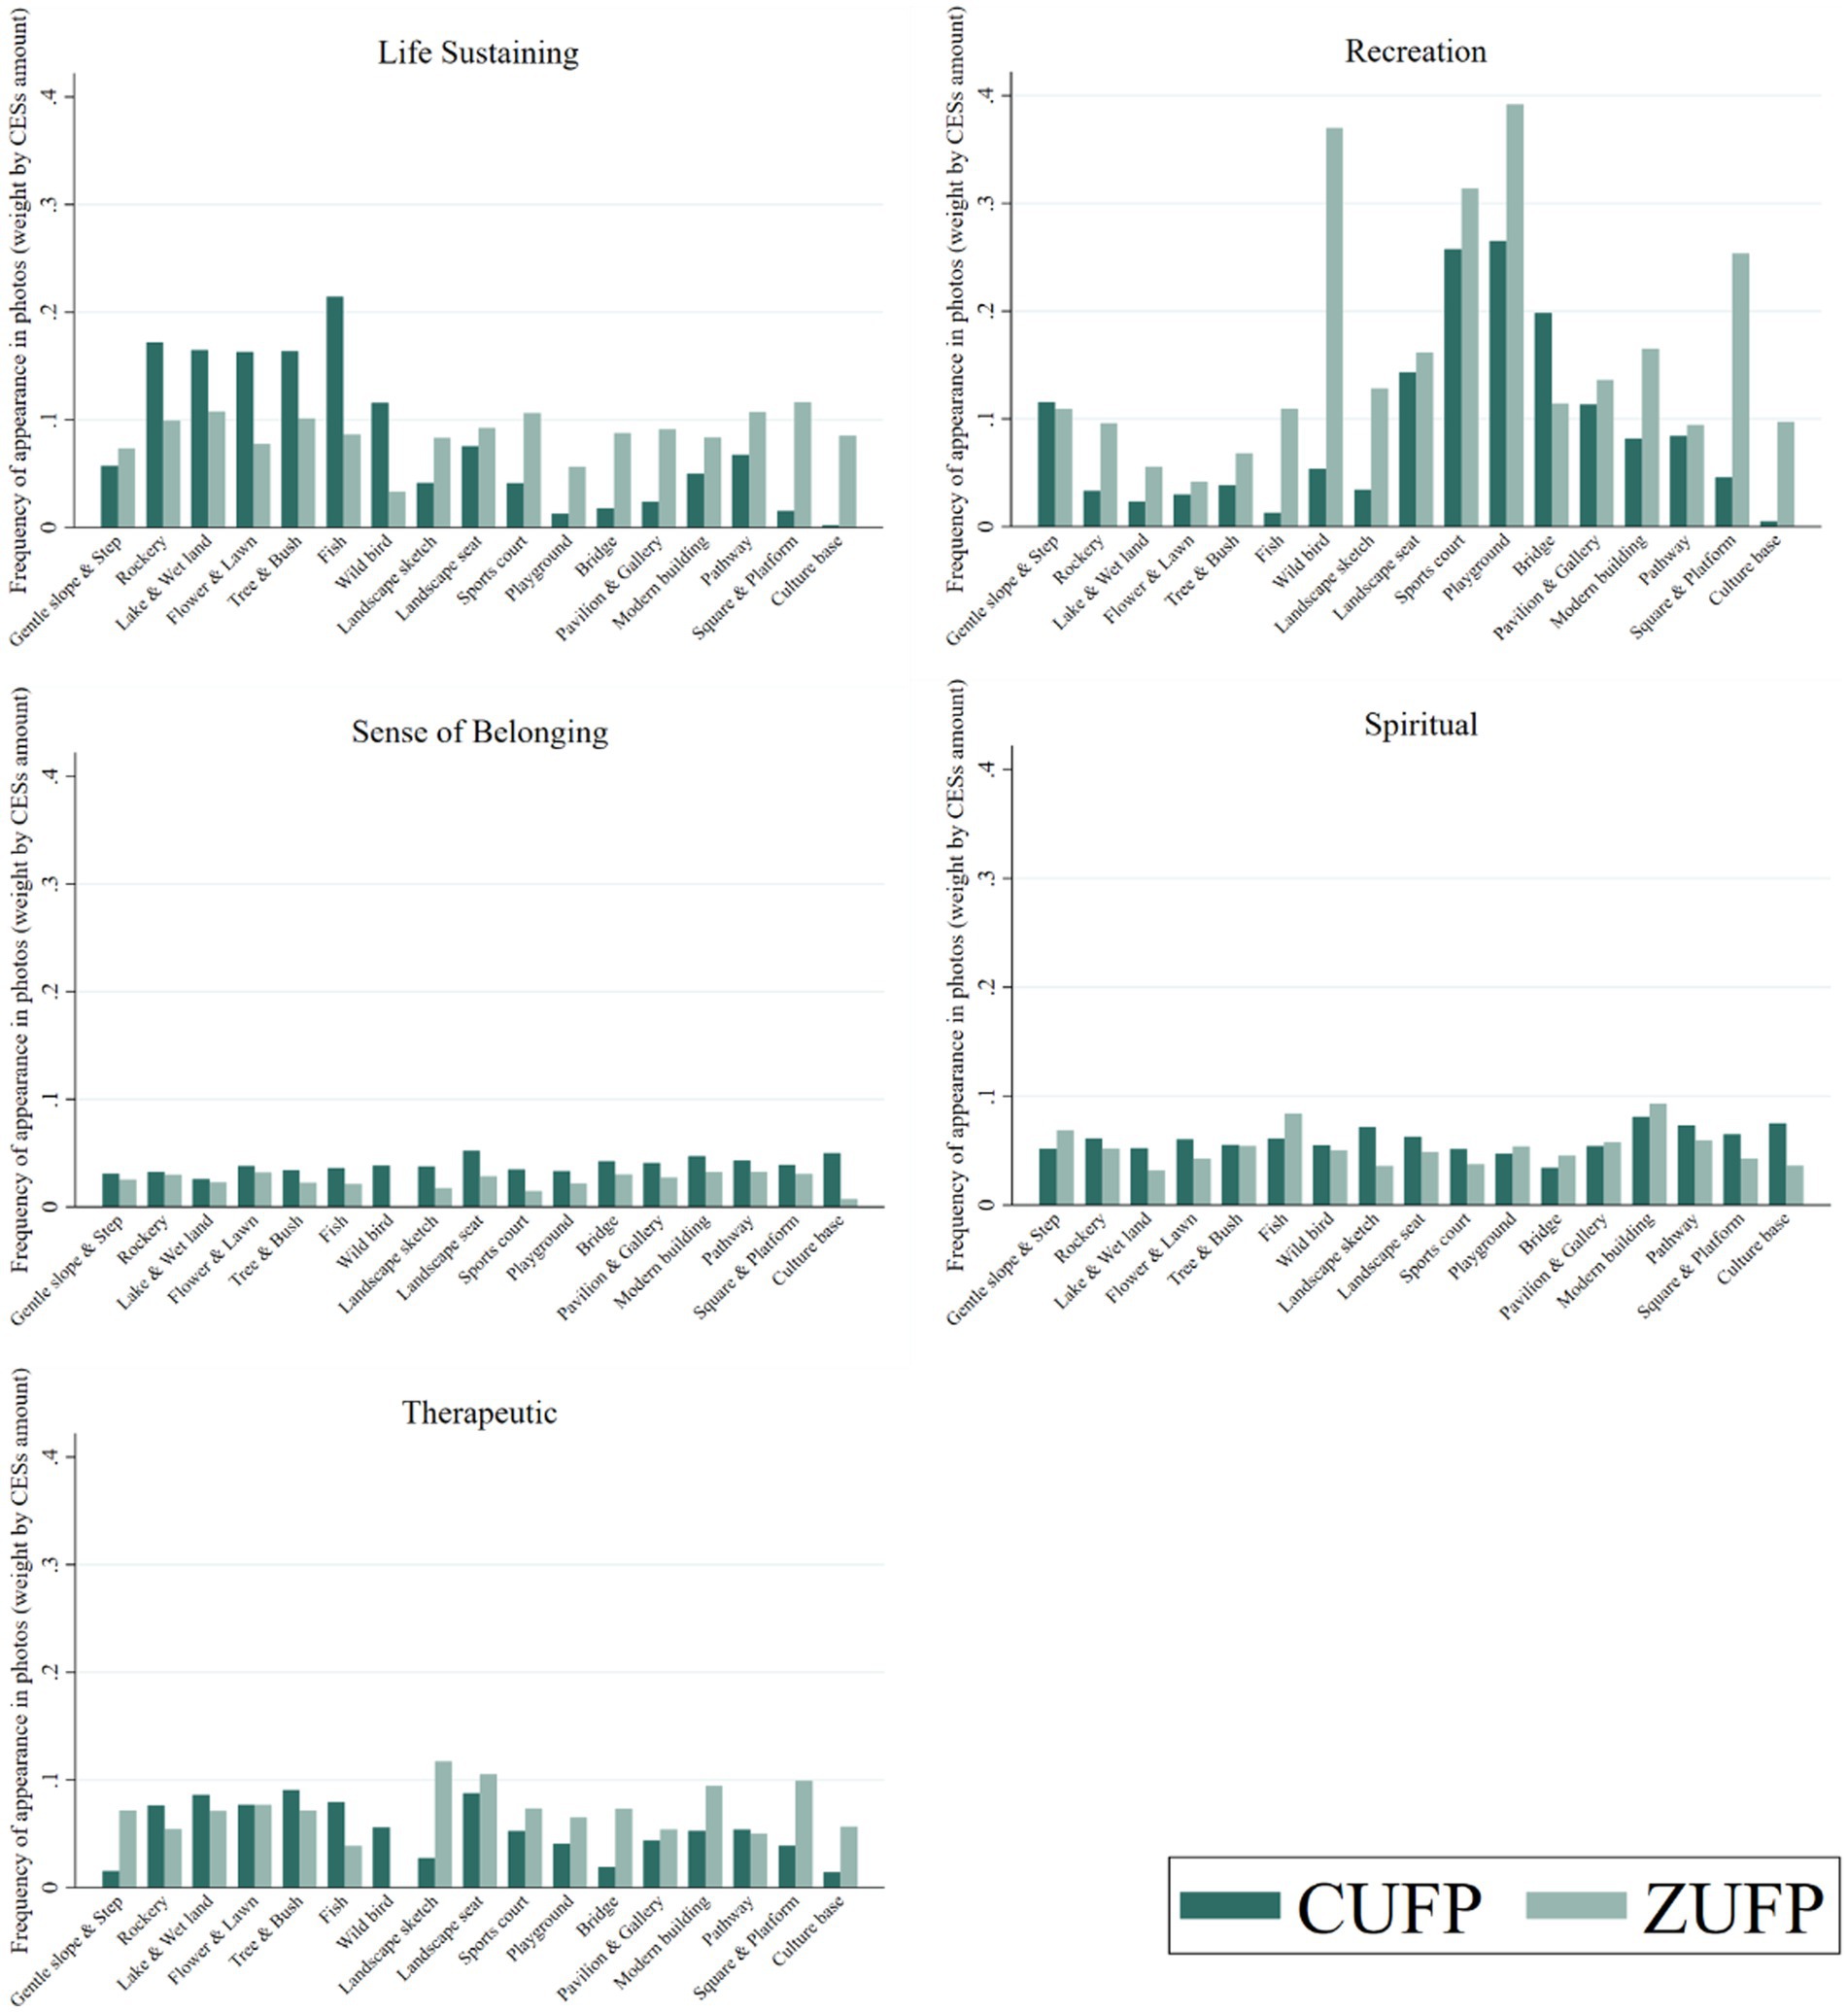
Figure 7. Frequency proportion of 17 landscape elements appearing in specific CESs photographs.
CUFP and ZUFP had significant consistency in some of the CESs value perceptions. Volunteers had relatively similar perceptions of each landscape element in the two parks in the CESs of sense of belonging, economic, bequest, spiritual, and therapeutic, and it is worth noting that the five CESs mentioned above, the frequency and perceived intensity of being perceived are low, maintaining an average of less than 10%, and belong to the CESs categories that people do not perceive significantly. Among the remaining value categories of CESs, CUFP, and ZUFP have more obvious differences and each has a different peak.
For CUFP, people’s value perceptions in cultural, educational, historic, and life sustaining are significantly higher than those in the same category of landscape elements in ZUFP. Among them, people’s perceptions of cultural, economic and historic value in CUFP are mostly concentrated in natural and humanistic landscapes with rich cultural heritage such as Landscape sketch, Bridge, Square and platform, and Culture base. It should be noted that ZUFP also possesses these landscape elements, with the only difference being that CUFP has a “Nanzhu Stele Forest” landscape that directly depicts the national geographical indication protection products. The life sustaining value perceived in CUFP are mostly focused on natural landscape elements such as Rockery, Lake and wetland, Flower and lawn, Tree and jungle, and fish, and we believe that this result suggests that the ecosystem of the Nanzhu production area has a special cultural value for people. We believe that such results suggest that the ecosystem of the Nanzhu production area has a special cultural ecosystem service value for people, and this value can be clearly perceived.
For ZUFP, people’s perception of value in esthetic, biodiversity, and recreation is significantly higher than that of similar landscape elements in CUFP. Among them, people have a very distinct esthetic value perception of various landscape elements of ZUFP, while their perception of values such as biodiversity and recreation is concentrated in landscape elements such as Fish, Wild bird, and Sports court. This means that people are more inclined to perceive the corresponding CESs value in these landscape elements without being affected by GI landscapes.
4. Discussion
4.1. GI strengthens people’s perception of the human CESs value of landscape elements
Products spanning time and space in different periods (Boggs, 2010) contain rich cultural value and are considered an effective way to share local knowledge and experiences through different perspectives (Sieber, 2006). In our study area, people have high perceptions of the value of humanistic CESs for landscapes directly related to national geo-certified protected products (Figures 5, 7). In CUFP, which has the characteristic geographically certified landscape of Nanzhu Stele Forest, people have high sensitivity to the natural and humanistic landscapes with rich cultural heritage, which was about 10% higher than that of the control group ZUFP on average. This is consistent with Ridding, who assessed the CESs function of nature reserves in southern Wiltshire and concluded that protected areas have more human value benefits (Daniel et al., 2012; Ridding et al., 2018).
More importantly, GI plays an essential role in the correspondence between CESs value types and each landscape element, which makes people’s perception of the value of landscape elements in CUFP more concentrated and clearer (Figure 6) This is a deeper mechanism of the impact of GI on people’s perception of the value of CESs. However, in the control group ZUFP, each landscape element does not present a very clear one-to-one correspondence with the value type of CESs, which makes people’s perception of the value of CESs more average, extensive and dispersed, and relatively lack of representative and prominent perceptual correspondence.
Although the CESs provided by the landscape are difficult to assess (Bateman et al., 2011), their importance to people is more clearly perceived through GI (Hirons et al., 2016), which plays an important role in the formation and support of the value of CESs. GI clearly reinforces people’s perceptions of the value of humanistic CESs for landscape elements, and this reinforcement has a relatively distinct anthropogenic character and policy context, and extensive publicity and policy education have a strong guiding effect on people’s perceptions of the value of CESs.
4.2. GI attracts and diverts people’s esthetic attention from the natural landscape itself
In CUFP where the value perception of humanistic CESs is prominent, people’s value perceptions of esthetic, biodiversity and recreation are substantially weaker than those of ZUFP without geo-certified landscapes (Figure 7), and the magnitude of this weakening is even close to 20% in esthetic value perceptions, which means that GI has attracted and diverted people’s esthetic attention to the natural landscape itself to a certain extent, and may even change the natural attributes of the ecosystem and landscape elements, thus changing to the category of human landscape.
This may be a worrying finding. The control group designed for our study, ZUFP, which represents urban forest parks in general, people’s value perceptions of esthetic, biodiversity and recreation were all reported very significantly in ZUFP, which made us think about the necessity of maintaining the natural attributes of urban forest parks as ecosystems and maintaining their esthetic value. Since there is no significant difference in the various values of CESs themselves, it is still worth further research whether the protection of GI with esthetic attention transfer effect is a measure worth promoting.
This conclusion confirms previous arguments that land use is an important form of human activity, which has a strong impact on ecosystem services (Li et al., 2015). Land use often requires trade-offs. Maximizing one benefit of land almost always reduces other benefits for some people, and achieving trade-offs or even win–win outcomes in CESs still requires multi-faceted coordination, or consideration of the need to reduce human intervention. However, as far as “Hepu Nanzhu,” a geographical certification product of 21st Century Maritime Silk Road Initiative concerned by this study, such certification is helpful to protect and inherit cultural traditions related to specific regions, such as traditional handicrafts (Nanzhu production), agricultural production technology, food culture and so on. These cultural traditions are closely related to the local ecological environment to a great extent, and 21st Century Maritime Silk Road Initiative certification helps to protect these cultural traditions and enable them to be inherited and carried forward.
4.3. The role of GI is not limited to the certified landscape itself
GI strengthens people’s perception of the value of human CESs, and to some extent also attracts and transfers esthetic attention to the natural landscape itself, and has a certain impact on the natural landscape (Marie-Vivien et al., 2009). Our study shows that these two effects are not limited to the landscape itself with geo-certified protection, but spread to the ecosystem to which the landscape belongs (Figures 5, 7).
GI has a diffusion-driven effect on cultural perceptions. By integrating geographical information with cultural carriers, a special GI can be formed to promote the spread of its cultural connotations (Kireeva and O'Connor, 2010), which is particularly evident in the CUFP. Cultural, historic and educational perceptions of Nanzhu Stele Forest in CUFP have been widely reported. At the same time, the surrounding areas of the Nanzhu Stele Forest, Martyrs’ Monument Revering Area and some squares which are not directly related to GI also belong to the hot perception areas of humanistic CESs value (Figure 5), which means that GI not only affects the certified landscape, but also improves people’s sensitivity to humanistic value perception as a whole. It makes people more willing and patient to understand the humanistic CESs value for the same landscape elements. Similar to GI product, certification of specific things is beneficial for people to associate GI with specific geographical locations in order to achieve the purpose of improving economic benefits and enriching culture (Sun et al., 2012). This is particularly evident in the comparison with ZUFP with the same landscape type and landscape elements.
The attraction and transfer effect of GI on people’s esthetic perceptions is also extensive, and the degree of transfer is greater than the degree of strengthening of the value perception of humanistic CESs (Figure 7). For the same landscape types and landscape elements, people’s esthetic perceptions were lower across the board in CUFP than in ZUFP without geo-certified landscapes, which indicates GI has an important impact on the display of the natural landscape itself (Dagne, 2012). The most obvious contrast is people’s perceptions of Gentle slope & step and Culture base, with a difference of more than 20% between the perceived degree and response frequency. This means that people have completely different value perceptions for the same landscape in the two parks. In ZUFP, there is a significant esthetic culture base, while in CUFP, there is a lack of esthetic feeling.
We try to explain this finding from the perspective of China’s national geographical indication protection policy. China’s GI protection for specific agricultural products has a more prominent spillover effect, and GI agricultural products have a clustering effect on regional economic resources, an effect that can improve production efficiency, reduce production costs, and increase benefits for agricultural products (Han et al., 2022), which is similar to how the broad impacts of land uses are much larger than their own relatively small land footprints (these small footprint, high-spillover land uses can drive broad impacts by influencing the spatial structure of the landscape and catalyzing the cascading effects of other land uses around or far away) (Meyfroidt et al., 2022). Protecting GIs can support not only economic development, but also social and environmental development sustainability (Belletti et al., 2015), which is reflected in the certification standards and nomenclature of GI-protected products. China’s “Regulations on the Protection of Geographical Indication Products” stipulate that “geographical indication products essentially depend on the natural and human factors of the place of origin,” and that the protection of agricultural GI is important for inheriting regional folklore and historical culture and promoting modern industrial development (Ye, 2019). Once the products are GI-protected, the products will be named in the way of “origin + product name,” which further enhances the added value of the products (Huang, 2022), and increases the income of local residents (Shang and Li, 2011). For example, the typical GI-protected product in our study area, Beihai, is named Hepu Nanzhu, which greatly strengthens the connection between the GI-protected product and its origin. The overall study of GI products should focus not only on economic factors, but also on social and environmental factors (Gocci et al., 2020). The certification of GI-protected products covers a relatively wide ecosystem of origin, and local residents also benefit profoundly from this certification both economically and culturally (Yang, 2022). CUFP and ZUFP, as parks in Beihai, have a natural diffusion effect on people’s perception of the value of their CESs. At the same time, the scope of this diffusion effect and its attenuation mechanism can be studied in detail.
Being along the 21st Century Maritime Silk Road Initiative, which is deeply integrated with other countries in the world, related geographical certification is helpful to build regional competitive advantages. The products certified by The Maritime Silk Road Initiative often have unique regional characteristics and highly differentiated competitive advantages. Participating areas can take advantage of GI to develop more products with certification, further expand regional competitive advantages and promote the development of economic, cultural and ecological services.
4.4. Use of the SolVES model
In the use of the SolVES model, it is important to select the appropriate environmental variables for the study area (Brown and Lyon, 2012). In this study, we selected a more complete set of environmental variables. After the distribution of CESs value is obtained, the relationship graph between the value index and various environmental variables is combined to further analyze the consistency between the relationship and the value agglomeration of CESs. Using elevation, roads, and water bodies as the base data, slope, distance from roads, and distance from water bodies were produced, and LULC was added (Brown, 2013), resulting in a total of five environmental variables, DTR, DTW, ELEV, LULC, and SLOPE. These variables will provide a more precise description of the type and location of specific ecosystem services (Sherrouse et al., 2011), offering us a more detailed analysis of the relationship between respondents’ value perception and the environment itself (Raymond et al., 2009). In addition, delineating the landscape in as much detail as possible would make the relationship between value attributes and the landscape clearer (Bagstad et al., 2016). For example, in the LULC variable, we separated buildings from plazas and activity areas, successfully reduced consistency errors (Brown et al., 2016). Moreover, in the analysis of respondents’ perception of landscape value, it is possible to determine the landscapes that are directly related to that value within the same distance range more clearly and accurately. In particular, in the environmental layer of CUFP, the landscape Nanzhu Stele Forest, the Martyrs’ Monument Revering Area, the squares, and the housing buildings are equal to the human buildings, but we specifically extracted the characteristic landscape of Nanzhu Stele Forest to help the SolVES model quantify the results more accurately. This view is supported by Brown’s concept of place, in which people distinguish space from place by give it meaning and value (Brown and Lyon, 2012).
4.5. Limitations and future research
Our research focuses on the differences in GI between urban ecosystem (parks) and the impact of such differences on people’s perception of CESs, which means the parks that we selected should maintain a high similarity beyond GI. We strictly controlled the site selection of the study area (2.1), but such stringent site selection criteria may not be applicable to other study topics or to larger studies. In addition, this study inevitably involves identifying and counting the landscape photos obtained from VEP. Unlike previous research that only counts the frequency of landscape occurrences (Zhang et al., 2022), we weighted the photos based on the perceived amount of CESs, and this weighting treatment may weaken the concentration of photo occurrences.
GI is a long-term research topic (Morgans et al., 2018). Future studies should try to follow the analysis in a time series to obtain more informative panel data and provide more detailed empirical evidence on the impact mechanisms of GI. At the same time, the trade-offs and exploration of the pros and cons of GI may be a good choice to be placed in the context of cultural ecosystem service values. In the context of CESs, there is a clear need to go beyond “use values” and analyze social value from perspective of different stakeholder (Csurgo and Smith, 2021). Future research can provide a more specific analysis of the pros and cons of geographical certification policies from this perspective. We focused more on the impact of GI on people’s perception of CESs. Our method of perception collection, based on existing uses, can better highlight participants’ sincere feelings and arouse scientific understanding of familiar landscapes. However, this means exploring more USE _ TYPEs in the context of park planning and construction can be a good perspective for future studies.
5. Conclusion
GI is being carried out widely around the world, but its impact on people’s perception of the value of CESs has not been fully considered in its impact exploration. Such systematic neglect may, to some extent, lead to difference and even unfairness of people’s perceptions of the value of CESs in various landscapes, which further affects the quality of ecological well-being they obtain. In this study, we focused on the differences in GI between urban ecosystems (parks) and the impact this has on people’s perception of CESs. Based on findings from two subgroups, we mapped the spatial distribution of CESs and revealed potential landscape linkages.
It is found that GI significantly strengthens people’s perception of humanistic CESs value of landscape elements, and plays an important role in the correspondence perception relationship between CESs value types and various landscape element, making people’s perception of landscape elements value more concentrated and clearer. In addition to the spillover effect on humanistic value perception, GI also attracts and diverts people’s esthetic attention. More importantly, the study shows that these two effects are not limited to the landscapes itself, but will spread to the ecosystems to which the landscape belongs. The cultural connotation of “friendliness, tolerance, reciprocity, symbiosis and tenacity” of the Maritime Silk Road is of great enlightenment to China’s deeper interaction with the world. After obtaining the Maritime Silk Road geographical certification, the products that are combined with the place of origin will greatly increase the intangible assets, thus bringing about a substantial increase in the value of the products. For other products certified by Maritime Silk Road, the income level of producers can be improved by the added value of products, so that producers can get more benefits from them, which will help improve the living conditions in the participating areas of Maritime Silk Road and provide better living security for local residents. When Maritime Silk Road is combined with regional characteristics and acts on ecosystem cultural services, exclusiveness will become an important force for regional ecosystem cultural protection, for the scope of action of cultural services in specific ecosystems is limited and fixed. At the same time, the unique culture will make people have a strong sense of pride and identity with the local culture, forming a positive role in ecological harmony and cultural development.
This study highlights the mechanisms by which GI affects people’s perception of CESs value, which will contribute to the scientific development of future GI policies. Our findings are important for more targeted environmental measures such as GI promotion strategies and urban park landscape planning. This case also warmly reminds the public who enjoy cultural ecosystem services all the time that our access to and perception of ecosystem services may have been subconsciously guided, or even disturbed. We appreciate the remarkable contribution of GI to the protection of ecosystems, but we also urge practitioners to pay attention to the differences in the perceived value of CESs that may result from such protection.
Data availability statement
The original contributions presented in the study are included in the article/supplementary material, further inquiries can be directed to the corresponding author.
Ethics statement
The studies involving human participants were reviewed and approved by Guangxi University Medical Ethics Committee. The patients/participants provided their written informed consent to participate in this study.
Author contributions
YL: conceptualization, methodology, data curation, formal analysis, visualization, validation, project administration, writing–original draft, and funding acquisition. HX, NC, and JZ: methodology, data curation, formal analysis, visualization, and validation. HY: investigation, data curation, and formal analysis. WL: supervision, and writing–review and editing. All authors contributed to manuscript revision, read, and approved the submitted version.
Conflict of interest
The authors declare that the research was conducted in the absence of any commercial or financial relationships that could be construed as a potential conflict of interest.
Publisher’s note
All claims expressed in this article are solely those of the authors and do not necessarily represent those of their affiliated organizations, or those of the publisher, the editors and the reviewers. Any product that may be evaluated in this article, or claim that may be made by its manufacturer, is not guaranteed or endorsed by the publisher.
Supplementary material
The Supplementary material for this article can be found online at: https://www.frontiersin.org/articles/10.3389/fevo.2023.1208169/full#supplementary-material
References
Adekola, O., and Mitchell, G. (2011). The Niger Delta wetlands: threats to ecosystem services, their importance to dependent communities and possible management measures. Int. J. Biodiver. Sci. Ecosyst. Serv. Manage. 7, 50–68. doi: 10.1080/21513732.2011.603138
Alessa, L., Kliskey, A., and Brown, G. (2008). Social-ecological hotspots mapping: a spatial approach for identifying coupled social-ecological space. Landsc. Urban Plan. 85, 27–39. doi: 10.1016/j.landurbplan.2007.09.007
Alieva, D., Holgado, D., de Juan, S., Ruiz, F. A., Villasante, S., and Maya, J. I. (2021). Assessing landscape features and ecosystem services of marine protected areas through photographs on social media: comparison of two archipelagos in Spain. Environ. Dev. Sustain. 24, 9623–9641. doi: 10.1007/s10668-021-01841-y
Bagstad, K. J., Reed, J. M., Semmens, D. J., Sherrouse, B. C., and Troy, A. (2016). Linking biophysical models and public preferences for ecosystem service assessments: a case study for the southern Rocky Mountains. Reg. Environ. Chang. 16, 2005–2018. doi: 10.1007/s10113-015-0756-7
Balomenou, N., and Garrod, B. (2014). Using volunteer-employed photography to inform tourism planning decisions: a study of St David's peninsula. Wales. Tour. Manag. 44, 126–139. doi: 10.1016/j.tourman.2014.02.015
Bateman, I., Abson, D., Beaumont, N., Darnell, A., Fezzi, C., Hanley, N., et al. (2011). Economic values from ecosystems. The UK National Ecosystem Assessment Technical Report. UK National Ecosystem Assessment.
Belletti, G., Marescotti, A., Sanz-Cañada, J., and Vakoufaris, H. (2015). Linking protection of geographical indications to the environment: evidence from the European Union olive-oil sector. Land Use Policy 48, 94–106. doi: 10.1016/j.landusepol.2015.05.003
Bieling, C., and Pleninger, T. (2013). Recording manifestations of cultural ecosystem services in the landscape. Landsc. Res. 38, 649–667. doi: 10.1080/01426397.2012.691469
Boggs, C. L. (2010). Local products and geographical indications: taking account of local knowledge and biodiversity. Int. Soc. Sci. J. 58, 109–116. doi: 10.1111/j.1468-2451.2006.00592.x
Bowen, S., and Zapata, A. V. (2009). Geographical indications, terroir, and socioeconomic and ecological sustainability: the case of tequila. J. Rural. Stud. 25, 108–119. doi: 10.1016/j.jrurstud.2008.07.003
Bramley, C., and Kirsten, J. F. (2007). Exploring the economic rationale for protecting geographical indicators in agriculture. Agrekon 46, 47–71. doi: 10.1080/03031853.2007.9523761
Brown, G. (2013). The relationship between social values for ecosystem services and global land cover: an empirical analysis. Ecosyst. Serv. 5, 58–68. doi: 10.1016/j.ecoser.2013.06.004
Brown, G., and Brabyn, L. (2012a). The extrapolation of social landscape values to a national level in New Zealand using landscape character classification. Appl. Geogr. 35, 84–94. doi: 10.1016/j.apgeog.2012.06.002
Brown, G., and Brabyn, L. (2012b). An analysis of the relationships between multiple values and physical landscapes at a regional scale using public participation GIS and landscape character classification. Landsc. Urban Plan. 107, 317–331. doi: 10.1016/j.landurbplan.2012.06.007
Brown, G., and Lyon, K. (2012). Public participation GIS: a method for identifying ecosystem services. Soc. Nat. Resour. 25, 633–651. doi: 10.1080/08941920.2011.621511
Brown, G., Pullar, D., and Hausner, V. H. (2016). An empirical evaluation of spatial value transfer methods for identifying cultural ecosystem services. Ecol. Indic. 69, 1–11. doi: 10.1016/j.ecolind.2016.03.053
Chen, Y. Y., Ke, X. L., Min, M., and Cheng, P. (2020). Disparity in perceptions of social values for ecosystem Services of Urban Green Space: a case study in the East Lake scenic area, Wuhan. Front. Public Health 8:e00370. doi: 10.3389/fpubh.2020.00370
Clement, M. J., and Cheng, S. A. (2011). Using analyses of public value orientations, attitudes and preferences to inform national forest planning in Colorado and Wyoming. Appl. Geogr. 31, 393–400. doi: 10.1016/j.apgeog.2010.10.001
Costanza, R., Groot, R. D, Braat, L., Kubiszewski, I., Fioramonti, L., Sutton, P., et al. (2017). Twenty years of ecosystem services: how far have we come and how far do we still need to go? Ecosystem Services. 28, 1–16. doi: 10.1016/j.ecoser.2017.09.008
Cowling, R. M., Egoh, B., Knight, A. T., O’Farrell, P. J., Reyers, B., Rouget, M., et al. (2008). An operational model for mainstreaming ecosystem services for implementation. Proc. Nat. Acad. Sci. U. S. A. 105, 9483–9488. doi: 10.1073/pnas.0706559105
Csurgo, B., and Smith, M. K. (2021). The value of cultural ecosystem services in a rural landscape context. J. Rural. Stud. 86, 76–86. doi: 10.1016/j.jrurstud.2021.05.030
Dagne, T. W. (2012). Intellectual property, traditional knowledge and biodiversity in the global economy: the potential of geographical indications for protecting traditional knowledge-based agricultural products. Crime Media Cult. Int. J. 8, 185–195. doi: 10.1177/1741659012444430
Dai, P. C. (2020). Study on the appraisal of cultural ecosystem services of urban park green space. doi: 10.27623/d.cnki.gzkyu.2020.000535,
Daily, G. C., Söderqvist, T., Aniyar, S., Arrow, K., Dasgupta, P., Ehrlich, P. R., et al. (2000). Ecology-the value of nature and the nature of value. Science 289, 395–396. doi: 10.1126/science.289.5478.395
Daniel, T. C., Muhar, A., Arnberger, A., Aznar, O., Boyd, J. W., Chan, K. M. A., et al. (2012). Contributions of cultural services to the ecosystem services agenda. Proc. Natl. Acad. Sci. U. S. A. 109, 8812–8819. doi: 10.1073/pnas.1114773109
de Juan, S., Ospina-Alvarez, A., Villasante, S., and Ruiz-Frau, A. (2021). A graph theory approach to assess nature’s contribution to people at a global scale. Sci. Rep. 11:9118. doi: 10.1038/s41598-021-88745-z
Doey, L., and Kurta, J. (2011). Correspondence analysis applied to psychological research. Tutor. Quant. Methods Psychol. 7, 5–14. doi: 10.20982/tqmp.07.1.p005
Dong, H., and Bo, Q. (2017). Exploring the link between neighborhood environment and mental wellbeing: a case study in Beijing, China. Landsc. Urban Plan. 164, 71–80. doi: 10.1016/j.landurbplan.2017.04.005
Dong, L. G., Zhu, W. B., Levin, L., and S. C., (2014). Research progress of ecosystem cultural services. J. Peking Univ. Nat. Sci. 0, 1155–1162. doi: 10.13209/j.0479-8023.2014.164
Egoh, B., Rouget, M., Reyers, B., Knight, A. T., Cowling, R. M., van Jaarsveld, A. S., et al. (2007). Integrating ecosystem services into conservation assessment: a review. Ecol. Econ. 63, 714–721. doi: 10.1016/j.ecolecon.2007.04.007
Fagerholm, N., Kayhk, N., Ndumbaro, F., and Khamis, M. (2012). Community stakeholders knowledge in landscape assessments—mapping indicators for landscape services. Ecol. Indic. 18, 421–433. doi: 10.1016/j.ecolind.2011.12.004
Faggi, A. M., Zuleta, G. A., and Homberg, M. (2014). Motivations for implementing voluntary environmental actions in Argentine forest companies. Land Use Policy 41, 541–549. doi: 10.1016/j.landusepol.2014.04.011
Fernando, B., Ignacio, P. P., and Agustín, L. S. (2021). Framing of visual content shown on popular social media may affect viewers' attitudes to threatened species. Sci. Rep. 11, 1–10. doi: 10.1038/S41598-021-92815-7
Fischer, L. K., Honold, J., Botzat, A., Brinkmeyer, D., Cvejić, R., Delshammar, T., et al. (2018). Recreational ecosystem services in European cities: Sociocultural and geographical contexts matter for park use. Ecosyst. Serv. doi: 10.1016/j.ecoser.2018.01.015
Galati, A., Crescimanno, M., Tinervia, S., Iliopoulos, C., and Theodorakopoulou, I. (2017). Internal resources as tools to increase the global competition: the Italian wine industry case. Br. Food J. 119, 2406–2420. doi: 10.1108/BFJ-02-2017-0092
Ghermandi, A., Camacho-Valdez, V., and Trejo-Espinosa, H. D. (2020). Social media-based analysis of cultural ecosystem services and heritage tourism in a coastal region of Mexico. Tour. Manag. 77:104002. doi: 10.1016/j.tourman.2019.104002
Gocci, A., Luetge, C., and Vakoufaris, H. (2020). Between tradition and sustainable innovation empirical evidence for the role of geographical indications. Int. Bus. Res. 13:101. doi: 10.5539/ibr.v13n9p101
Han, Y. L., Yao, Y., Shi, Y. T., Ji, G. J., and Zhang, Y. (2022). Current status and prospects of research on geographical indications of agricultural products in China. Jiangsu Agric. Sci. 50, 232–239. doi: 10.15889/j.issn.1002-1302.2022.15.035
Hanley, N., and Ruffeil, R. (1993). The contingent valuation of forest haracteristics: two experiments. J. Agric. 44, 218–229. doi: 10.1111/j.1477-9552.1993.tb00267.x
Hermes, J., Berkel, D. V., Burkhard, B., Plieninger, T., Fagerholm, N., Haaren, C. V., et al. (2018). Assessment and valuation of recreational ecosystem services of landscapes. Ecosyst. Serv. 31, 289–295. doi: 10.1016/j.ecoser.2018.04.011
Hirons, M., Comberti, C., and Dunford, R. (2016). Valuing cultural ecosystem services. Annu. Rev. Energy Environ. 41, 545–574. doi: 10.1146/annurev-environ-110615-085831
Hossu, C. A., Ioj, I. C., Onose, D. A., Ni, M. R., Popa, A. M., Talab, O., et al. (2019). Ecosystem services appreciation of urban lakes in Romania. Synergies and trade-offs between multiple users. Ecosyst. Serv. 37:100937. doi: 10.1016/j.ecoser.2019.100937
Hu, M. (2008). Protection and development of agricultural geographical indications based on industrial cluster theory. Agric. Econ. Issues 5, 26–31. doi: 10.00-6389(2008)29:5<26:JYCYJQ>2.0.TX;2-5>2.0.TX;2-H
Huang, J. K. (2022). China’s rural transformation and policies: past experience and future directions, engineering. ISSN 18, 21–26. doi: 10.1016/j.eng.2022.03.011
Huang, H., Gartner, G., and Turdean, T. (2013). Social media data as a source for studying people’s perception and knowledge of environments. Mitteilungen der Österreichischen Geographischen Gesellschaft 155, 291–302.
Huang, C. H., Yang, J., and Zhang, W. J. (2013). Research progress on ecosystem service function evaluation models. J. Ecol. 32, 3360–3367. doi: 10.13292/j.1000-4890.2013.0513
Jena, P. R., and Grote, U. (2012). Impact evaluation of traditional basmati rice cultivation in Uttarakhand state of northern India: what implications does it hold for geographical indications? World Dev. 40, 1895–1907. doi: 10.1016/j.worlddev.2012.04.004
Kireeva, I., and O'Connor, B. (2010). Geographical indications and the TRIPS agreement: what protection is provided to geographical indications in WTO members? J. World Intellect. Proper. 13, 275–303. doi: 10.1111/j.1747-1796.2009.00374.x
Koen, F., Tieskens, B. T., Zanten, V., Catharina, J. E., Schulp, P., and H., Verburg., (2018). Aesthetic appreciation of the cultural landscape through social media: an analysis of revealed preference in the Dutch river landscape. Landsc. Urban Plan. 177, 128–137. doi: 10.1016/j.landurbplan.2018.05.002
Lal, P. (2003). Economic valuation of mangroves and decision making in the Pacific. Ocean Coast. Manag. 46, 823–844. doi: 10.1016/S0964-5691(03)00062-0
Lautenbach, S., Kugel, C., Lausch, A., and Seppelt, R. (2011). Analysis of historicchanges in regional ecosystem service provisioning using land use data. Ecol. Indic. 11, 676–687. doi: 10.1016/j.ecolind.2010.09.007
Li, H. (2011). A study on the influencing factors of crowding perception among tourists in Tianjiling national forest Hunan: Park Central South University of Forestry and Technology.
Li, H. J., Li, Z. H., Li, Z. H., Yu, J., and Liu, B. (2015). Evaluation of ecosystem services: a case study in the middle reach of the Heihe River basin, Northwest China. Phys. Chemis. Earth. doi: 10.1016/j.pce.2015.07.003
Li, Z. M., and Wang, Y. T. (2014). Tour route organization and garden space appreciation in the middle of humble Administrator's garden based on spatial syntax analysis//China landscape architecture society, Proceedings of 2014 Annual Conference of China Landscape Architecture Society China Architecture and Building Press.
Liquete, C., Piroddi, C., Evangelia, G., Drakou, G. L., Katsanevakis, S., Charef, A., et al. (2013). Current status and future prospects for the assessment of marine and coastal ecosystem services: a systematic review Camino Liquete. PLoS One 8:e67737. doi: 10.1371/journal.pone.0067737
Ma, X. T., and Hu, Y. N. (2023). Research on the behavior characteristics and influencing factors of island tourists based on dynamic space-taking Yangma Island in Shandong Province as an example. Marine Dev. Manag. 40, 29–38. doi: 10.20016/j.cnki.hykfygl.2023.02.013
Ma, Q., Liu, K., Gao, Y., Li, Y., Fan, Y., and Chao, G. (2018). Assessment on social values of ecosystem services in Xi'an Chanba National Wetland Park based on SolVES model. Chin. Wetl. Sci. 16, 51–58.
Maille, P., and Mendelsohn, R. (1993). Valuing eco-tourism in Madagascar. J. Environ. 38, 213–218. doi: 10.1006/jema.1993.1040
Marie-Vivien, D., Garcia, C. A., Moppert, B., Kushalappa, C. G., and Vaast, P. (2009). Brands, GI and certification: How to add value to biodiversity in the Western Ghats India: Cairn Info International.
Markwell, K. W. (1997). Dimensions of photography in a nature-based tour. Ann. Tour. Res. 24, 131–155. doi: 10.1016/S0160-7383(96)00053-9
Marsden, T., Banks, J., and Bristow, G. (2000). Food supply chain approaches: exploring their role in rural development. Sociol. Rural. 40, 424–438. doi: 10.1111/1467-9523.00158
Martín-López, B., Iniesta-Arandia, I., García-Llorente, M., Palomo, I., Casado-Arzuaga, I., Del Amo, D. G., et al. (2012). Uncovering ecosystem service bundles through social preferences. PLoS One 7:e38970. doi: 10.1371/journal.pone.0038970
McKitrick, M. K., Schuurman, N., and Crooks, V. A. (2022). Collecting, analyzing, and visualizing location-based social media data: Review of methods in GIS-social media analysis. GeoJournal 88, 1035–1057. doi: 10.1007/s10708-022-10584-w
MEA (2003). Ecosystems and human well-being: a framework for assessment. Washington DC: Island Press.
Meyfroidt, P., de Bremond, A., Ryan, C. M., Archer, E., Aspinall, R., Chhabra, A., et al. (2022). Ten facts about land systems for sustainability. Proc. Natl. Acad. Sci. U. S. A. 119:e2109217118. doi: 10.1073/pnas.2109217118
Morgans, C. L., Meijaard, E., Santika, T., Law, E., Budiharta, S., Ancrenaz, M., et al. (2018). Evaluating the effectiveness of palm oil certification in delivering multiple sustainability objectives. Environ. Res. Lett. 13:064032. doi: 10.1088/1748-9326/aac6f4
Oku, H., and Fukamachi, K. (2004). The differences in scenic perception of forest visitors through their attributes and recreational activity. Landsc. Urban Plan. 75, 34–42. doi: 10.1016/j.landurbplan.2004.10.008
Oteros-Rozas, E., Martín-López, B., Fagerholm, N., Bieling, C., and Plieninger, T. (2018). Using social media photos to explore the relation between cultural ecosystem services and landscape features across five European sites. Ecol. Indic. 94, 74–86. doi: 10.1016/j.ecolind.2017.02.009
Paluš, H., Parobek, J., Dudík, R., and Šupín, M. (2017). Assessment of chain-of-custody certification in the Czech and Slovak Republic. Sustainability 9:1898. doi: 10.3390/su9101898
Paluš, H., Parobek, J., Vlosky, R. P., Motik, D., Oblak, L., Jošt, M., et al. (2018). The status of chain-of-custody certification in the countries of central and South Europe. Euro. J. Wood Wood Product. 76, 699–710. doi: 10.1007/s00107-017-1261-0
Pan, J. F., Ma, Y. W., Cai, S. Q., Chen, Y., and Chen, Y. M. (2022). Application of SolVES model in the social value evaluation of ecosystem service functions. World Forest. Res. 36, 1–7. doi: 10.13348/j.cnki.sjlyyj.2022.0096.y
Peters, C., Gentry, A., and Mendelsohn, R. (1989). Valuation of an Amanzonian rain forest. Nature 339, 655–656. doi: 10.1038/339655a0
Petway, J. R., Lin, Y. P., and Wunderlich, R. F. (2020). A place-based approach to agricultural nonmaterial intangible cultural ecosystem service values. Sustainability 12:699. doi: 10.3390/su12020699
Plieninger, T., Dijks, S., Oteros-Rozas, E., and Bieling, C. (2013). Assessing, mapping, and quantifying cultural ecosystem services at community level. Land Use Policy 33, 118–129. doi: 10.1016/j.landusepol.2012.12.013
Plummer, M. L. (2009). Assessing benefit transfer for the valuation of ecosystem services. Front. Ecol. Environ. 7, 38–45. doi: 10.1890/080091
Ponte, S., Gibbon, P., and Vestergaard, J. (2011). Governing through standards: Origins, drivers and limitations, Palgrave Macmillan. New York: Palgrave Macmillan.
Qiu, L., Lindberg, S., and Nielsen, A. B. (2013). Is biodiversity attractive?—on-site perception of recreational and biodiversity values in urban green space. Landsc. Urban Plan. 119, 136–146. doi: 10.1016/j.landurbplan.2013.07.007
Raymond, C. M., Bryan, B. A., Macdonald, D. H., Cast, A., Strathearn, S., Grandgirard, A., et al. (2009). Mapping community values for natural capital and ecosystem services. Ecol. Econ. 68, 1301–1315. doi: 10.1016/j.ecolecon.2008.12.006
Retka, J., Jepson, P., Ladle, J. R., Malhado, M. C. A., Vieira, S. A. F., Normande, C. I., et al. (2019). Assessing cultural ecosystem services of a large marine protected area through social media photographs. Ocean Coast. Manag. 176, 40–48. doi: 10.1016/j.ocecoaman.2019.04.018
Richards, D. R., and Friess, D. A. (2015). A rapid indicator of cultural ecosystem service usage at a fine spatial scale: content analysis of social media photographs. Ecol. Indic. 53, 187–195. doi: 10.1016/j.ecolind.2015.01.034
Ridding, L. E., Redhead, J. W., Oliver, T. H., Schmucki, R., McGinlay, J., Graves, A. R., et al. (2018). The importance of landscape characteristics for the delivery of cultural ecosystem services. J. Environ. Manag. 206, 1145–1154. doi: 10.1016/j.jenvman.2017.11.066
Scaini, A., Stritih, A., Constance, B., and Chiara, S. (2022). What locals want: citizen preferences and priorities for the Tagliamento River. Environ. Res. Lett. 17:025008. doi: 10.1088/1748-9326/ac4d50
Schipperijn, J., Ekholm, O., Stigsdotter, U. K., Toftager, M., Bentsen, P., Kamper-Jørgensen, F., et al. (2010). Factors influencing the use of green space: results from a Danish national representative survey. Landsc. Urban Plan. 95, 130–137. doi: 10.1016/j.landurbplan.2009.12.010
Semmens, D. J., Sherrouse, B. C., and Ancona, Z. H. (2019). Using social-context matching to improve spatial function-transfer performance for cultural ecosystem service models. Ecosyst. Serv. 38:100945. doi: 10.1016/j.ecoser.2019.100945
Shang, X. D., and Li, B. L. (2011). Protection and development of geographical indication agricultural products in China: issues and countermeasures. Price Theory Practice 11, 72–73. doi: 10.19851/j.cnki.cn11-1010/f.2011.11.041
Shang, X. D., and Li, B. L. (2013). Characteristics, trends, and issues of the development and operation of geographical indications for agricultural products in China: based on the analysis of the Ministry of Agriculture, general Administration of Quality Inspection, and general Administration for Industry and Commerce. Ecol. Econ. 265:92-97+120.
Shao, W. J. (2009). The significance and path of protecting geographical indications of agricultural products. Qilu Acad. J. 1, 105–110.
Sherrouse, B. C., Clement, J. M., and Semmens, D. J. (2011). A GIS application for assessing, mapping, and quantifying the social values of ecosystem services. Appl. Geogr. 31, 748–760. doi: 10.1016/j.apgeog.2010.08.002
Sherrouse, B. C., and Semmens, D. J. (2014). Validating a method for transferring social values of ecosystem services between public lands in the Rocky Mountain region. Ecosyst. Serv. 8, 166–177. doi: 10.1016/j.ecoser.2014.03.008
Sherrouse, B. C., Semmens, D. J., and Ancona, Z. H. (2022). A GISapplication for assessing, mapping, and quantifying the social values of ecosystem services. Environ. Model Softw. 148:105259. doi: 10.1016/j.envsoft.2021.105259
Sherrouse, B. C., Semmens, D. J., and Clement, J. M. (2014). An application of social values for ecosystem services (SolVES) to three national forests in Colorado and Wyoming. Ecol. Indic. 36, 68–79. doi: 10.1016/j.ecolind.2013.07.008
Shoyama, K., and Yamagata, Y. (2016). Local perception of ecosystem service bundles in the Kushiro watershed, northern Japan – application of a public participation GIS tool. Ecosyst. Serv. 22, 139–149. doi: 10.1016/j.ecoser.2016.10.009
Sieber, R. (2006). Public participation geographic information systems: a literature review and framework. Ann. Assoc. Am. Geogr. 96, 491–507. doi: 10.1111/j.1467-8306.2006.00702.x
Sinclair, M., Ghermandi, A., and Sheela, M. A. (2018). A crowdsourced valuation of recreational ecosystem services using social media data: an application to a tropical wetland in India. Sci. Total Environ. 642:356. doi: 10.1016/j.scitotenv.2018.06.056
Steffan-Dewenter, I., Kessler, M., Barkmann, J., Bos, M. M., Buchori, D., Erasmi, S., et al. (2007). Tradeoffs between income, biodiversity, and ecosystem functioning during tropical rainforest conversion and agroforestry intensification. Proc. Natl. Acad. Sci. U. S. A. 104, 4973–4978. doi: 10.1073/pnas.0608409104
Sugimoto, K. (2011). Analysis of scenic perception and its spatial tendency: using digital cameras, GPS loggers, and GIS. Procedia Soc. Behav. Sci. 21, 43–52. doi: 10.1016/j.sbspro.2011.07.010
Sugimoto, K. (2013). Quantitative measurement of visitors' reactions to the settings in urban parks: spatial and temporal analysis of photographs. Landsc. Urban Plan. 110, 59–63. doi: 10.1016/j.landurbplan.2012.10.004
Suh, J., and MacPherson, A. (2010). The impact of geographical indication on the revitalisation of a regional economy: a case study of 'Boseong' green tea. Area 39, 518–527. doi: 10.1111/j.1475-4762.2007.00765.x
Sun, Z. (2019). Divergence in the new development path of international protection of geographical indications and China's choice. Intellectual Property 215, 88–96.
Sun, Z. G., Huang, L. M., Xiong, W. Z., Wang, S. T., and Zhong, X. B. (2012). Research on the geographical indications and cultural heritage of famous tea in Hubei Province. Agric. Sci. Technol. 13:502-506+536. doi: 10.16175/j.cnki.1009-4229.2012.03.011
Suryani, A. N. G., Mohd Shahwahid, H. O., Ahmad, F. P., Alias, R., and Vlosky, R. P. (2011). Assessment of chain–of–custody certification costs for Sawnwood manufacturers in peninsular Malaysia. J. Trop. For. Sci. 68, 657–665. doi: 10.1007/s13595-011-0049-3
Swapan, M. S. H., Iftekhar, M. S., and Li, X. (2017). Contextual variations in perceived social values of ecosystem services of urban parks: a comparative study of China and Australia. Cities 61, 17–26. doi: 10.1016/j.cities.2016.11.003
Tan, Q. Y., Gong, C., Li, S. J., Ma, N., Ge, F. C., and Xu, M. X. (2021). Impacts of ecological restoration on public perceptions of cultural ecosystem services. Environ. Sci. Pollut. Res. Int. 28, 60182–60194. doi: 10.1007/s11356-021-14793-7
Tobias, D., and Mendeisohn, R. (1991). Valuing eco-tourism in a tropical rain forest reserve. Ambio 25, 617–620. doi: 10.1016/0043-1354(91)90135-D
Troy, A., and Wilson, M. A. (2006). Mapping ecosystem services: practical challenges and opportunities in linking GIS and value transfer. Ecol. Econ. 60, 435–449. doi: 10.1016/j.ecolecon.2006.04.007
van Riper, C. J., Kyle, G. T., Sutton, S. G., Barnes, M., and Sherrouse, B. C. (2012). Mapping outdoor recreationists' perceived social values for ecosystem services at Hinchinbrook Island National Park. Aust. Appl. Geogr. 35, 164–173. doi: 10.1016/j.apgeog.2012.06.008
van Zanten, B. T., Van Berkel, D. B., Meentemeyer, R. K., Smith, J. W., Tieskens, K. F., and Verburg, P. H. (2016). Continental-scale quantification of landscape values using social media data. Proc. Natl. Acad. Sci. U. S. A. 113, 12974–12979. doi: 10.1073/pnas.1614158113
Villa, F., Bagstad, K. J., Voigt, B., Johnson, G. W., Portela, R., Honzák, M., et al. (2014). A methodology for adaptable and robust ecosystem services assessment. PLoS One 9:e91001. doi: 10.1371/journal.pone.0091001
Wainger, L. A., King, D. M., Mack, R. N., Price, E. W., and Maslin, T. (2010). Can the concept ofecosystem servicesbe practically applied to improve naturalresource management decisions? Ecol. Econ. 69, 978–987. doi: 10.1016/j.ecolecon.2009.12.011
Wang, Y., Fu, B. T., Lyu, Y. P., Yang, K., and Che, Y. (2016). Che. Assessment of the social values of ecosystem services based on SolVES model: a case study of Wusong Paotaiwan wetland Forest Park, Shanghai, China. Chin. Appl. Ecol. 27, 1767–1774. doi: 10.13287/j.1001-9332.201606.011
Wang, H., Tian, F. J., Wu, J. X., and Nie, X. (2023). Is China forest landscape restoration (FLR) worth it? A cost-benefit analysis and non-equilibrium ecological view. World Dev. 161:106126. doi: 10.1016/j.worlddev.2022.106126
Xu, G. D., Xu, D. W., Wang, J. H., and Li, H. (2008). Using the SBE method as a basis to determine the best viewing points and tourist routes for forest landscapes. Forest. Res. 36, 1145–1151. doi: 10.1016/S1872-2040(08)60061-4
Yang, Y. (2022). Research on the integration of geographical indications of agricultural products into the development of Yellow River cultural tourism. Guangxi Soc. Sci. 10, 124–133.
Ye, Y. H. (2019). Research on the protection of geographical indications of agricultural products in China-review of the "report on the development of geographical indications Brands in China (2019)". J. Guangdong Univ. Financ. Econ. 36:120.
Yin, X. J., and Zhong, F. L. (2011). Research progress of ecosystem service classification. J. Anhui Agric. Sci. 39, 7994–7999. doi: 10.13989/j.cnki.0517-6611.2011.13.059
Zhang, M. E., Ren, T. F., and Bao, L. C. (2023). Research on the new forms and interactions of intellectual property rights: taking geographical indications and ecological labels as an example. Sci. Res., 1–16.
Zhang, K. L., Tang, X., Zhao, Y., Huang, B., Huang, L., Liu, M., et al. (2022). Differing perceptions of the youth and the elderly regarding cultural ecosystem services in urban parks: an exploration of the tour experience. Sci. Total Environ. 821:153388. doi: 10.1016/j.scitotenv.2022.153388
Zhang, W., Yu, Y., Wu, X., Pereira, P., and Lucas Borja, M. E. (2020). Integrating preferences and social values for ecosystem services in local ecological management: a framework applied in Xiaojiang Basin Yunnan province, China. Land Use Policy 91:104339. doi: 10.1016/j.landusepol.2019.104339
Zhang, T., Zhang, W., Meng, H., and Zhang, Z. (2019). Analyzing visitors’ preferences and evaluation of satisfaction based on different attributes, with Forest trails in the Akasawa National Recreational Forest. Central Japan. Forests 10:431. doi: 10.3390/f10050431
Zhao, Y. Q., You, W. B., Lin, X. E., He, D. J., and Wen, H. (2022). Comparative study on cultural service perception of mount Wuyi's ecosystem from the perspective of tourists and residents. J. Ecol. 42, 4011–4022.
Zhou, L., Guan, D., Huang, X., Yuan, X., and Zhang, M. (2020). Evaluation of the cultural ecosystem services of wetland park. Ecol. Indic. 114:106286. doi: 10.1016/j.ecolind.2020.106286
Keywords: GI certification, ecosystem service quantification, visitor-employed photography, landscape perception, social valve
Citation: Luo Y, Xu H, Zhang J, Chen N, Ye H and Lei W (2023) Magnifier or refractor? Exploring the impact of geographical indication on people’s perception of the value of cultural ecosystem services based on the SolVES model. Front. Ecol. Evol. 11:1208169. doi: 10.3389/fevo.2023.1208169
Edited by:
Lanjiao Wen, Huazhong Agricultural University, ChinaReviewed by:
Qingsong He, Huazhong University of Science and Technology, ChinaXin Yang, Huazhong Agricultural University, China
Copyright © 2023 Luo, Xu, Zhang, Chen, Ye and Lei. This is an open-access article distributed under the terms of the Creative Commons Attribution License (CC BY). The use, distribution or reproduction in other forums is permitted, provided the original author(s) and the copyright owner(s) are credited and that the original publication in this journal is cited, in accordance with accepted academic practice. No use, distribution or reproduction is permitted which does not comply with these terms.
*Correspondence: Wenyan Lei, d2VueWFuQGd4dS5lZHUuY24=
†These authors have contributed equally to this work