 Hui Liu1
 Yang Shen
- 1School of Economics and Management, Qilu Normal University, Jinan, China
- 2School of Mathematics and Statistics, Fujian Normal University, Fuzhou, China
- 3Institute of Quantitative Economics, Huaqiao University, Xiamen, China
Introduction: Global warming presents significant challenges to the sustainable development of human society. Accelerating the achievement of carbon peak and neutrality is the vision for creating a global ecological community with a shared future. The development of digital technology provides us with the direction of action.
Methods: Based on panel data from 276 cities in China from 2011 to 2020, principal component analysis was used to measure the basic state of digital technology at the city level, and the twoway fixed effects model and instrumental variable method to verify the impact of digital technology on carbon emissions from the perspective of technology diffusion.
Results: The results show that the deep diffusion of digital technology in the real economy sector is helpful to improve productivity and carbon efficiency, thus significantly reducing carbon emissions. The role of digital technologies in reducing carbon emissions is heterogeneous. The results of the sub-sample test show that digital technology has a stronger emission reduction effect in large-scale cities, resource-based cities, smart cities and emission trading policy pilot areas. Digital technology can reduce carbon emissions by improving energy efficiency, promoting green technology innovation, and promoting virtual agglomeration.
Discussions: The contribution of this paper is that it not only reveals that digital technology can reduce carbon emissions but also analyzes the emission reduction path of digital technology from a new perspective. The conclusion of this paper has implications for accelerating the diffusion of digital technology in the real economy sector to accelerate the realization of green production and cope with climate change.
1 Introduction
The problem of climate warming caused by greenhouse gas emissions has become increasingly prominent. Dealing with climate change and controlling greenhouse gas emissions has become a common global challenge. According to World Bank data, global carbon emissions (CE) have increased 1.67 times in the past 30 years, from 20,625 (ten million tons) in 1990 to 34,344 (ten million tons) in 2019; At the same time, the global per capita GDP has increased by 2.63 times. As can be seen from Figure 1, there is a high correlation between economic development and CE.
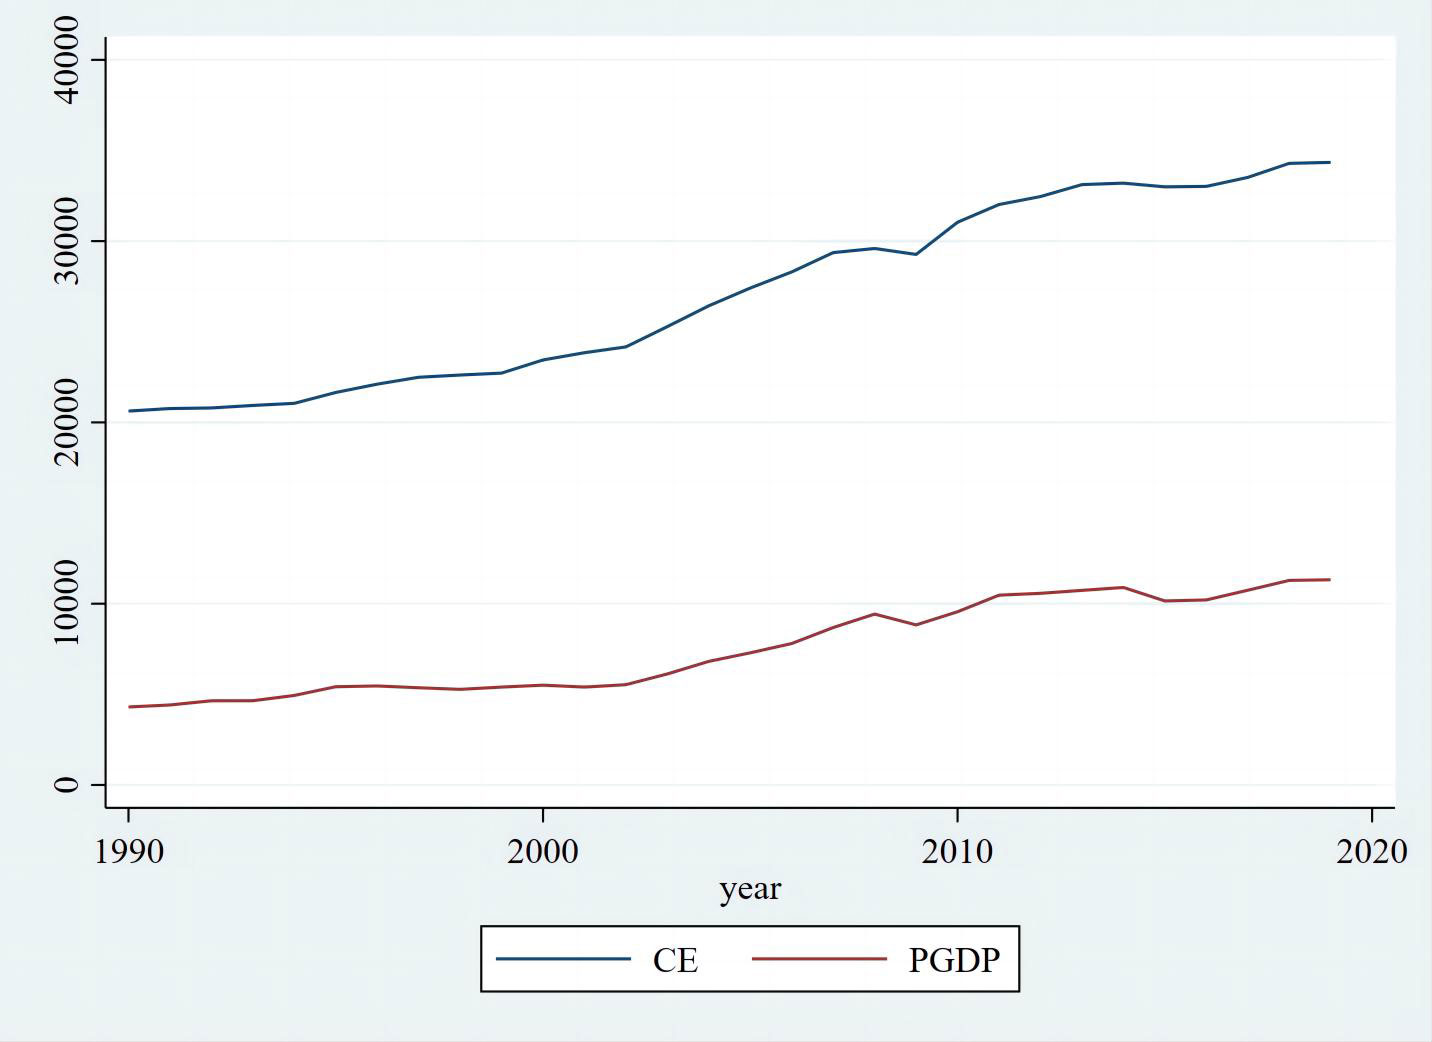
Figure 1 Global per capita GDP and carbon emission concentration from 1990 to 2019. Data Source: compiled by the author based on the open data of the World Bank. https://data.worldbank.org.cn/indicator?tab=all.
According to the AR6 Synthesis Report: Climate Change 2023 (IPCC, 2023), the global surface temperature in 2011–2020 is 1.1°C higher than in 1850–1900. Continued greenhouse gas emissions will further increase the global temperature rise. In the scenarios and model paths considered, the best estimated global temperature rise will reach 1.5°C in the near future (2021–2040) (IPCC, 2023). With the increase of global warming, the current feasible and effective adaptation measures will be limited, and the effect will be reduced. According to the World Bank, China’s carbon emissions (CE) reached 9.899 billion tons in 2020, making it one of the world’s highest carbon emitters. In 2020 alone, China’s CO2 emission reached 9.8 billion tons, accounting for about 31% of the global total (World Bank, 2022). As a result, China has become the focus of global efforts to reduce carbon emissions. In response to the deteriorating ecological environment, the Chinese government put forward the “dual-carbon” goal of peaking carbon neutrality at the 75th session of the United Nations General Assembly and incorporated “a steady decline in carbon emissions after peaking” into the 2035 vision goal. The 14th Five-Year Plan further defines an action plan to reach the carbon peak by 2030 while committing to reduce CO2 intensity by 60% to 65% compared with 2005 and striving to achieve carbon neutrality by 2060.
Digital technology (DT), a general term for emerging general technologies, including the Internet of Things (IoT), big data, cloud computing, and artificial intelligence, has been regarded as essential to promoting the “fourth industrial revolution.” The steady advancement of DT in various fields has become an essential means to promote economic growth and a new way to promote industrial transformation. In the “digital” era, most cities face new opportunities for low-carbon development. According to The Enablement Effect: The impact of mobile communications technologies on carbon emission reductions jointly released by the Global System for Mobile Communications Association (GSMA) and the Carbon Trust, the application of mobile Internet technology in intelligent energy, smart agriculture, smart manufacturing, and smart cities has reduced global greenhouse gas emissions by about 21.35 tons in 2018 (GSMA and the Carbon Trust, 2019). Moreover, according to the SMARTer2030 report released by the Global E-Sustainability Initiative (GeSI), DT could reduce global carbon emissions by 20% over the next ten years by integrating with the enterprise and industry (GeSI, 2015).
As a representative of universal technology, the impact of DT on carbon emissions has attracted worldwide attention, but existing studies have yet to reach a consistent conclusion. Some studies believe that DT, as a force of creative destruction, can promote green technological innovation (GTI) and production process innovation and restrain CO2 emissions (Aghion et al., 2021; Zhang Q. et al., 2022; Hu, 2023). Some other studies believe that DT is built based on electricity, and the development and operation of cloud, blockchain, data center, and other infrastructure require more and more energy-intensive infrastructure, which will cause more carbon emissions to some extent (Dhar, 2020; Noussan and Tagliapietra, 2020). Some other studies believe there may be a nonlinear relationship between DT and carbon emissions, which is affected by technology scale and diffusion speed. As one of the general-purpose technology (GPT), compared with the direct application of technology, the diffusion effect of DT in other fields deserves more attention. Different from the existing research, we not only discuss the direct technical effect of DT, but also pay attention to the carbon reduction effect produced by the technology diffusion process. On the basis of defining the concept of DT, an index system for measuring DT is constructed, and the panel data of 276 cities in China from 2011 to 2020 are used to further explore the impact of DT on carbon emissions and its mechanism from the perspective of technology diffusion, which can provide theoretical support and a practical basis for China to achieve the goal of carbon peaking and carbon neutrality.
This paper has the following research objectives:
(i) Establishing an evaluation index system for DT;
(ii) Estimating the impact of DT on CE based on measuring the level of carbon emissions at the city level;
(iii) Based on technology diffusion theory, to identify the mechanisms by which DT affect urban CE, which include potential direct and indirect mechanisms, among which, identify the important mechanisms of virtual agglomeration.
2 Literature review
2.1 Estimation study of CE
Since no exact data on carbon emissions are published, many scholars have done a lot of research on carbon emission measurement, and various measurement methods have been derived for different research objects and data. Currently, the three mainstream methods are the input–output method, which is applicable to calculate CE from single products or projects, the life-cycle evaluation method, which calculates CE from different industries, and the CO2 emission factor method, which calculates CE at national, provincial and regional levels.
The input–output approach is to develop input–output tables to reflect the relationship between various sectors of the economic system, which can track direct and indirect energy use and CE of product production. For example, Zhang et al. (2021) combined the input–output method with the carbon emission factor method to measure the CE of 30 provinces and eight industries in China in 2018, and found that the thermal power generation and industrial emissions far exceeded the remaining six industries. The input–output method is comprehensive, but the method is less time-sensitive because input–output tables are compiled every five years in China. The carbon emission factor method involves summing the carbon emission factors of each energy source based on the product of the corresponding energy consumption to obtain the CE (Yang et al., 2021; Li and Wang, 2022). Alam et al. (2012) based on the IPCC method, calculated the relationship between energy consumption, electricity consumption, carbon emissions and economic growth; Chang et al. (2022) studied the changes in carbon emissions from 2003 to 2017 through the consumption side in China’s national and regional power sectors using the log-average index (LMDI) model and estimated the carbon emissions from the power sector in each region through the production and consumption accounting principles, using two-factor ANOVA and one-factor ANOVA. The differences in regional power sector carbon emissions were compared by two principles; Feng et al. (2022) used the annual panel data of China from 1997 to 2017 to first analyze the spatial and temporal evolution process of CE, and then developed a spatial Durbin model and partial derivative method based on direct, indirect and total EKC, which yielded a positive spatial autocorrelation of CE with the center of gravity shifting westward. However, this method is difficult to calculate CE in the absence of carbon emission factor data, and the carbon emission factors may be affected by the level of technology, production status, energy use and process with large uncertainties. The life cycle approach is used to evaluate carbon emissions over the product life cycle, measuring the CE of a product from the time of resource extraction until the end of product disposal (Luo et al., 2022). This method can account for the direct or implied CE of a product, process, or production activity, but accounting is costly and time-consuming. Gustavsson et al. (2010) analyzed the carbon emissions of an eight-story wood-frame apartment building using the life cycle evaluation method and found that building operations used the largest share of life cycle energy use, and this share increased as the life of the building increasingly.
2.2 Study on the influencing factors of CE
Regarding the factors influencing CE, in terms of economic growth, Grossman and Krueger (1991) put forward the Environmental Kuznets Curve (EKC), which shows an inverted U-shaped relationship between economic growth and environmental pollution. However, Dogan and Turkekul (2016) showed that the increase in real output in the United States improved the ecological environment, and this finding does not support the EKC hypothesis. Wang et al. (2013) used the extended STIRPAT model to show that factors such as population, level of urbanization, level of industrialization, and level of services lead to an increase in CE, while technological progress, energy consumption structure, and degree of foreign trade leads to a decrease in CE. Recent studies suggest that the digital economy is also an important factor influencing CE (Liao et al., 2023). Kong et al. (2022) used the logarithmic mean divisia index model (LMDI) to analyze the influencing factors of China’s carbon emissions. According to the empirical results, in the long run, technological innovation is essential for China to meet its carbon reduction commitments. Slower economic growth will delay the peak in carbon emissions and increase carbon intensity. Optimizing the industrial structure, reducing the size of the population, and adjusting the energy structure can reduce China’s peak and carbon emissions, but the effect is negligible. Inah et al. (2022) studied the trend of CE and its reduction potential in the manufacturing sector in Nigeria from 2010 to 2020. They decomposed the changes in CE into pre-determined factors using the LMDI approach and concluded that energy intensity and equity-funded production were the main drivers of increased emissions, while productive capacity utilization reduced emissions; Yılmaz (2023) applied Granger causality tests and cointegration methods to explore the role of trade openness and energy use on CE in 30 countries in sub-Saharan Africa, showing that energy use has a significant long-term effect on the increase of CE while there is a positive bivariate causality between trade openness and CE.
2.3 Study on the impact of digital technology on CE
With the disruptive changes brought by DT and the rise of digital economy, more and more scholars have paid attention to the environmental effects brought by DT, and most of the studies have pointed out that DT plays a pivotal role in the environment, but there are different findings on the specific effects.
The positive effects are reflected in the following: At the macro level, Lahouel et al. (2021) based on Tunisia 1970–2018, pointed out that ICT technology is a key factor in mitigating climate change by reducing CE while promoting economic growth. Shahnazi and Shabani (2019) studied further stated that ICT technologies also have spillover effects, as local ICT technologies can effectively boost the demand for ICT products and services in neighboring regions while reducing the demand for traditional products, thus contributing to the reduction of CO2 emission levels in neighboring regions. At the industry level, the development of DT promotes digital industrialization, and digital technological innovation also promotes the continued emergence of green recycling and recovery models such as idle exchange, shared transportation, and waste recycling, as well as accelerates the breakthrough and application of renewable energy technologies, thereby reducing CE (Wang et al., 2021). At the micro level, Zhang (2023) pointed out that DT can facilitate the development of enterprise information and the application of new technologies to improve resource utilization, reduce environmental pollution, and improve the environment to some extent; DT also contribute to low-carbon formation through system integration, demand substitution for high-emitting products such as coal, and optimization of resource management and decision-making processes (Zhu et al., 2022).
The opposite opinion is that although DT advances are closely related to the solution of environmental pollution, the widespread use of DT inevitably leads to corresponding negative impacts. For example, Al-Mulali and Sab (2012) conducted an empirical analysis with data from 30 sub-Saharan African countries and found that under the influence of DT, energy consumption played an important role in the economic growth and financial development of the economies investigated, but the increased energy consumption also had high pollution consequences. Noussan and Tagliapietra (2020) assessed the impact of transportation digitization on energy consumption and found that the application of DT to transportation will increase the demand for transportation and expand the scale of transportation trips, resulting in more energy consumption. Dong et al. (2022) used data on the change and intensity of CE for 15 countries worldwide from 2000 to 2014 and found that the ICT industry is an important industry contributing to carbon emissions, where the manufacturing of computer, electronic and optical products accounted for 82.83% of global ICT implied CE.
There are also studies found a non-linear relationship between DT and CE. Li et al. (2021) introduced DT as a technological advancement into the Solow growth model and use fixed effects model to test empirically based on global panel data for 190 countries from 2005 to 2016, and the study found that there is an inverse relationship between CE and DT have an inverted U-shaped relationship, and argued that this inverted U-shaped relationship validates the EKC hypothesis. Li and Wang8 introduced digital factors as endogenous factors promoting technological progress into the production function, and study shows an inverted U-shaped relationship between DT and carbon dioxide emissions.
2.4 Research gap
In conclusion, there is no consistent answer regarding the specific impact of DT on CE, which may stem from differences in the selection of proxy variables for DT on the one hand, which are multidimensional and a combination of information, computing, communication, and connectivity technologies (Bharadwaj et al., 2013) and differences in carbon emission measurement methods on the other hand. In addition, the results of the study may have been influenced by regional heterogeneity. For example, estimates based on developed countries may differ from those in emerging countries, where DT is still in a period of rapid development; estimates should also differ in regions where environmental incentives have been adopted, where DT is more likely to promote (Akcigit et al., 2018).
At the same time, the discussion of the mechanisms by which DT affect CE is very inadequate. Existing studies are mainly based on the EKC hypothesis proposed by Grossman and Krueger (1991), which summarizes the mechanism of DT to reduce carbon emissions as technology effect and structural effect, such as Chen et al. (2023) and Wang H. et al., (2023), which identify the mechanism of green technological innovation or industrial structure upgrading; or summarizes the mechanism of DT to increase CE is summarized as the scale effect, i.e., DT makes enterprises improve production efficiency and expand production scale, which in turn increases carbon emissions, such as Zhang J. et al. (2022) and Li and Wang (2022). However, in fact, there are other mechanisms worth discussing for the effect of DT on CE, which is important for enriching the study of DT effects on CE and proposing the optimization path of CE in the digital economy era.
However, these discussions are all based on the impact of the development of DT itself on carbon emission reduction, and pay little attention to the diffusion of DT. In fact, the diffusion process of DT also has an important impact on carbon emission reduction, especially in the spatial change of industrial characteristics, which is very important for us to identify the mechanism of DT affecting carbon emission reduction. Based on the multidimensional definition of spatial agglomeration, this study is of great value in constructing the measurement index system of spatial agglomeration, discussing the impact of spatial agglomeration on urban carbon emission, and innovatively identifying the virtual agglomeration mechanism from the process of technology diffusion.
3 Theoretical mechanism and research hypothesis
Technology diffusion refers to the widespread and large-scale imitation and adoption of innovative outcomes after technological innovation (Tirole, 1988). The theory of technology diffusion was first proposed by American sociologist Everett M. Rogers in 1962 and was elaborated in his classic work, Diffusion of Innovations. Rogers (1962) discussed the behavioral patterns and characteristics of different types of individuals, such as innovators, early adopters, early majority, late majority, and laggards, in accepting and adopting new technologies. He also explored the factors and mechanisms that influence technology diffusion, providing an important intellectual foundation for subsequent research and practice. Subsequently, the theory of technology diffusion has been widely applied and developed, becoming an important tool and theoretical framework for studying social transformation, technological innovation, and market promotion.
As a new technology, DT can change existing high-energy production methods and factor structures in multiple aspects, achieving decarbonization effects, which is one of the direct impacts of technology. On the other hand, DT is a typical general-purpose technology, which can also trigger imitation and innovation in other fields during the diffusion process: from the perspective of enterprises, it can stimulate them to improve energy efficiency and conduct environmentally-friendly green innovation based on digital technology innovation, thereby reducing urban carbon emissions; from an external perspective, knowledge spillovers brought about by the diffusion of DT will promote the optimization of factor allocation within a spatial range, thereby having a significant impact on urban carbon emissions reduction. Based on this framework, the theoretical logic of this paper is illustrated in Figure 2.
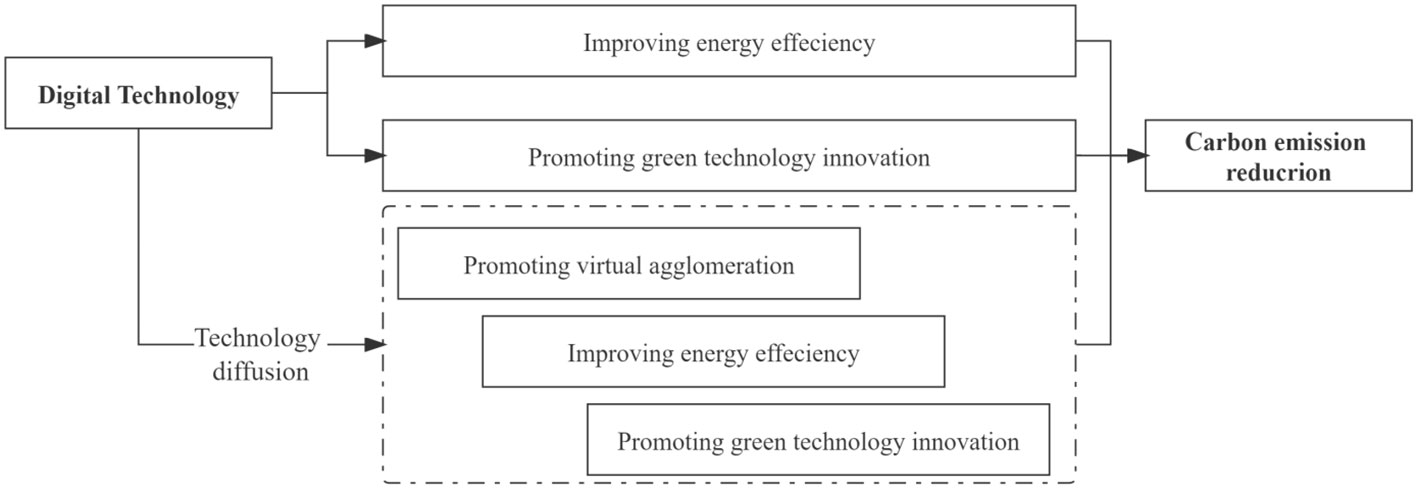
Figure 2 The theoretical framework of the paper.
3.1 Direct impact of digital technology on CE
The main material carriers of DT are the Internet, AI and Quantum Computing and other high-tech services, which can facilitate faster information transfer and break the “data islands” formed by information asymmetry, therefore promoting the rational distribution of resources and energy, improving total factor productivity and helping to reduce CE. The purpose of promoting the construction of new digital infrastructure is to open the era of industry Internet, drive the digital transformation of transportation, industry and energy, and empower the green digital economy. DT can promote energy optimization, cost optimization, risk foresight and decision control in traditional industries, and overall realize energy saving and cost reduction as well as efficiency and quality improvement (Shen and Zhang, 2023).
Firstly, the new generation of DT provides new solutions for industrial green transformation and helps traditional manufacturing industries to “jump out of the factory” to develop green production. DT can be widely used in the industrial field of energy-saving transformation, material saving, accurate matching of supply and demand, logistics line optimization, material recycling and other production and circulation links. More and more industrial enterprises are using internet of things (IoT) to integrate sensors and devices into various environmental monitoring systems, and using DT such as supercomputers and cloud computing to integrate IoT in the environmental field to achieve environmental management and decision-making in a more refined and dynamic way. This not only helps to optimize the ultimate carbon handling technology for enterprises, but also helps to accurately measure the carbon footprint and thus track and monitor CE. For example, the Industrial Internet Identifier resolves the key issues of data reliability and data traceability in the field of carbon management, helping enterprises to set, adjust and achieve carbon emission targets more accurately. In addition to promoting the greening of industrial production, DT will also empower carbon management in the industrial sector. The integration of DT innovation management system through data resources provides strong support for building a powerful, extensive and accurate carbon data service platform and digital network system, which greatly reduces the cost of carbon information retrieval, classification and calculation, and improves the government’s information sharing and intelligent management of carbon emissions, carbon sinks and other data resources. Improving the carbon trading market through DT helps eliminate the discrepancies between verified data and carbon emissions reported by enterprises on their own, enabling ecological and environmental departments to accurately and efficiently make carbon emission quotas among enterprises, while allowing enterprises with higher energy use efficiency to sell their excess emission rights to other enterprises, and it is DT that has developed carbon trading to encourage enterprises to take the initiative in energy saving and emission reduction.
Secondly, the carbon reduction effect of DT is reflected as a form of creative destruction, which can stimulate enterprises to GTI. DT can effectively break the path dependence of enterprise technological innovation, promote technological innovation in the direction of green, low-carbon, energy-saving and emission-reducing development and progress, which helps to enhance the level of GTI and promote the transformation of low-carbon economy. DT can reduce the transaction cost and information retrieval, effectively break the barriers to the flow of production factors between regions, therefore accelerating the flow of factors and providing multi-source knowledge for GTI. It can provide financial support for enterprise R&D by improving the availability of innovation and financial resources; the use of DT in the financial sector can also reduce the cost and threshold of financial services and ease the financing cost of enterprise innovation in many ways (Aghion et al., 2021). On the other hand, DT is conducive to reducing search and transaction costs and therefore breaking the boundaries of enterprises, promoting frequent learning exchanges and knowledge sharing among R&D workers (Akcigit et al., 2018), and facilitating enterprises to accelerate the pace by improving the level of innovation cooperation. The carbon reduction effect brought about by GTI is reflected in the fact that innovative technologies such as clean production technologies and pollutant control technologies in GTI will help governments, enterprises, and residents to achieve efficient use of energy, therefore reducing the CE generated per unit of energy demand or increasing the economic benefits generated per unit of energy demand. For example, the development of new energy public transportation systems will improve the energy efficiency of public transportation by using cleaner fuels, especially in congested urban areas. On the other hand, the economic effects of GTI, while not having a direct impact on CE, can help maintain a steady growth in regional GDP by strengthening the technological frontier of society as a whole.
Thirdly, the carbon reduction effect of DT is also reflected in its ability to improve energy efficiency as a technological innovation. The application of DT can promote further integration of ICT into the real economy, accelerate R&D, optimize resource allocation, and improve energy efficiency. Data as a new factor can reduce the use of other factors, such as developing the value of data elements and optimizing the efficiency of factor allocation both to improve energy efficiency. A sharing economy based on DT can also improve energy trade and resource allocation efficiency by facilitating specific trade among energy market participants through multilateral platforms. Sharing platforms can match supply and demand data through big data, cloud computing and other technologies, optimize resource allocation through scale operations, reduce vehicle idling rates, reduce fuel consumption and lower CE. DT is also a reliable backing for renewable energy. At this stage, China’s economic development process of energy demand is still increasing, subject to the influence of resource endowment characteristics, China’s energy consumption products for a long time to coal-based. New energy applications face problems such as high operation and maintenance costs, difficulties in solving them, and unstable production, while DT can help the innovative development of new energy technologies, i.e. DT can help the change of new energy production management and marketing model, change the production chain and supply chain of new energy, and reduce the cost of operation and maintenance of new energy enterprises. In addition, the use of DT can also reduce the loss of new energy in the process of transmission, conversion and storage, achieve efficient allocation of energy through intelligent scheduling, and maximize energy efficiency. The application of DT reduces the cost of developing and using renewable energy and provides technical support for the large-scale use of renewable energy. In addition, through the control and restraint of DT informatization and intelligence, it can significantly reduce unnecessary energy consumption in economic activities and help solve the problems of energy crisis and environmental pollution. DT such as AI and deep learning can help energy producers achieve real-time monitoring and parameter control of the production process, thus improving the efficiency of energy production, energy transportation, energy distribution and energy storage, reducing the energy consumption of the production process and improving total factor energy efficiency. At the energy trading end, the platform economy based on DT can effectively solve the problem of information asymmetry between supply and demand, reduce the time inequality between supply and demand, and new generation DT such as LoT, 5G, and big data optimize the signal transmission process between energy supply and demand, reducing avoidable energy losses in the energy trade process. Moreover, higher energy efficiency means accomplishing the same tasks or production activities with less energy consumption. A considerable number of study has proven that when energy efficiency improves, the energy consumption required for the same amount of economic output decreases, leading to a reduction in carbon emissions (Hens et al., 2001; Hasanbeigi et al., 2013; Tajudeen et al., 2018; Na et al., 2022). The improvement of energy efficiency also implies the optimization of the factor structure within enterprises. As intermediate producers, these enterprises will reduce the procurement of high-emission energy and shift towards cleaner and lower-carbon renewable energy sources (Özbuğday and Erbas, 2015). This transition will transmit through the supply chain to other businesses, thereby driving the entire industry towards a green transformation and promoting carbon emissions reduction. Therefore, there exists a theoretical logic that digital technologies can exert a decarbonization effect by enhancing energy efficiency.
Based on the above analysis, this paper proposes the following research hypothesis:
H1: DT can reduce CE emissions.
H2: DT can reduce CE through mechanisms of improving EE and promoting GTI.
3.2 The mechanism of virtual agglomeration of industries
As Chandler (1962) points out, “The industrial revolution is inevitably accompanied by organizational change.” The history of industry and technology also shows that every major technological change leads to a major change in the organization of production. The revolution in information technology has led to a spatial extension of the production and value chains of enterprises. Virtual agglomeration is based on the integration of DT domains, and production factors are clustered in virtual space with resource allocation optimization, empowering traditional cluster networks and eventually forming a borderless production network (Wang and Liang, 2022). It not only has the function of geographic agglomeration, but also has unique advantages in optimizing resource allocation and sharing knowledge and information interaction. The impact of industrial agglomeration on technology diffusion can be described by the “borehole model”, which means that the process of industrial agglomeration accelerates the spontaneous flow of technology and other resources and promotes industrial technology diffusion.
According to Schumpeter’s (1912) innovation theory, the innovation activity of enterprises is an important driving force for economic restructuring and transformation of development mode. The mechanism of “creative destruction” caused by technological progress can help improve production efficiency and optimize industrial structure, laying a solid industrial and technological foundation for energy saving and emission reduction. Generally speaking, the labor pool, intermediate input sharing and knowledge spillover in industrial agglomeration are indispensable drivers of scale and technology effects (Hou and Zhou, 2023). For example, shared labor pools can deepen the division of labor specialization and improve the fit between the agglomeration and the labor force to improve production efficiency and resource utilization, and reduce energy consumption and carbon emissions. Upstream and downstream industry chain integration is conducive to saving production costs for agglomeration enterprises, promoting circular economy and achieving green economic growth.
With the development of a new generation of ICT, new infrastructures, as physical support for industrial digitization record the traces of economic activities such as production, exchange as well as flow of various resources in the physical space inside the cyberspace, break through the dependence of traditional industrial geographic agglomeration on spatial location, and promote the formation of a new organizational form of industrial virtual agglomeration based on close coupling between the real and the virtual. On the one hand, DT breaks the time and space constraints (Goldfarb and Tucker, 2019), reduces transaction costs, promotes the circulation of factors and resources, and provides a platform for clean industries to agglomerate in virtual space. The development of DT significantly reduces transaction costs and improves information asymmetry, builds a platform for energy trading and the interconnection of factors between regions and enterprises, and promotes the effective flow and rational allocation of various factors of production, such as knowledge, labor, and energy, in the virtual space. A typical example is the one-way bidding (online trading) in the carbon trading market, which promotes the clustering of emission reduction enterprises in the virtual space to sell excess allowances or produce CERs with higher efficiency, and emission control enterprises can also find more suitable trading partners on the virtual platform, which is supported by the development of DT such as Blockchain. DT also builds a platform for knowledge spillovers. DT promotes the rapid flow of data and knowledge, which can facilitate the subjects to break the boundaries of enterprises and form clusters in the virtual space; through the interaction with the star enterprises in the virtual space, it accelerates the knowledge dissemination and enhances the scale of virtual clustering and knowledge spillover (Chen et al., 2023).
The green transformation of a certain enterprise in the virtual space will form a knowledge spillover effect on other enterprises, therefore promoting the green transformation and industrial structure upgrading. For example, the China Industrial Enterprise Energy Control Center, by establishing a data exchange and fusion interface, realizes the sharing of enterprise data resources and information fusion, helps the efficient use of energy big data, promotes the virtual agglomeration of using energy enterprises, and also promotes the development of carbon trading, carbon finance and other industries. DT will also promote further specialization division of labor and advance the ICT industry in virtual space clustering, forming the so-called specialization clustering. As DT is a modular hierarchical architecture, the development of a certain module requires the cooperation of other modules. In order to reduce the cost of communication and cooperation between modules, each module can form a virtual agglomeration effect in the form of interface. virtual agglomeration of ICT industry can bring into play the scale effect of digital industry, so that industrial enterprises can obtain the DT they need to introduce at a lower search cost and reduce the fixed capital investment of using DT for green transformation. When virtual agglomeration reduces the technology investment cost for green transformation of industrial enterprises, it can further expand the scale of agglomeration by exerting Metcalfe effect, and even promote the transformation of virtual agglomeration to physical agglomeration. At the same time, according to Krugman’s (1991) opinion, industrial agglomeration has technology diffusion effect, and there is a self-reinforcing relationship between the two that is interlinked and mutually reinforcing. Virtual agglomeration also has the same effect, that is, DT on the one hand enhances the level of virtual agglomeration; on the other hand, the development of virtual agglomeration can accelerate the speed of technology diffusion, promote the application and dissemination of DT in industrial enterprises, break the path dependence of enterprise green innovation, and thus enhance the enthusiasm of enterprise green innovation and promote energy conservation and emission reduction. Accordingly, this paper proposes research hypothesis 3:
H3: DT can reduce CE by increasing the virtual agglomeration of industries.
4 Research design and data sources
4.1 Variable setting
4.1.1 Explained variable
Carbon emission (CE). CE is measured using carbon emission intensity per unit of GDP. Given the availability of data related to CE at the city level, this paper uses the apparent emission accounting method to measure carbon dioxide emissions. In general, urban CE include both CE from direct energy consumption, such as gas and LPG, and CE from electrical and thermal energy consumption. Therefore, the carbon sources for measuring carbon emissions at the city level in this paper are mainly four types of energy consumption: natural gas, lp-gas (LPG), coal electricity and thermal energy. Drawing on the approaches of existing studies (Shan et al., 2022; Jing et al., 2023), the basic equation for carbon accounting provided by the IPCC 2006 Guidelines for National Greenhouse Gas Inventories is used to obtain the total CE of cities by multiplying the amount of activities that result in carbon emissions from production or consumption with the CO2 emission conversion factor (IPCC, 2006).
The direct energy types include LPG and natural gas. The measurement process is to calculate the CE from direct energy consumption of the city with the carbon conversion factors published by the IPCC (2006). Indirect energy consumption is electrical energy and thermal energy, where the CE from electrical energy consumption are directly calculated using the corresponding carbon conversion factors, while thermal energy is supplied in different ways and most of them use raw coal for heating. In this paper, according to Wu and Guo (2016), the thermal efficiency value is chosen as 70% and the average low level heat of raw coal is chosen as 20908 kJ/kg, and then the CE from heat supply are first converted into the required amount of raw coal according to the total amount of heat supply, and then calculated according to the carbon conversion factor of raw coal published by the IPCC (2006). Finally, CE from direct energy consumption and indirect energy consumption were summed up to get the total CE of each city.
4.1.2 Core explanatory variable
Digital technology (DT). Cloud computing, artificial intelligence, big data, the Internet of Things, and blockchain technology form the fundamental support of digital technology and provide solid technical support for various digital application scenarios. Digital application is a specific item of technology in the economy and society, which can effectively reflect the integration degree of digital technology with physical enterprises and daily life (Liu et al., 2022). Digital activities represented by digital industry sector, digital service application and e-commerce are different stages in the era of digital economy (Bukht and Heeks, 2018). The digital industry represents the development direction and latest achievements of the new generation of digital industry sectors, reflecting the industrialization characteristics of the digital economy, including the proportion of computer services and software employees and the level of digitalization of enterprises. Similar to the telephone penetration rate symbolizing the service subject of digital applications, digital finance is the concrete manifestation of digital platforms and digital services. The methods used in existing studies to measure the degree of digital technology are mainly the compilation of relevant indices, the construction of satellite accounts, and the accounting of value added. The compilation of relevant indices compilation is widely used in studying the social effects of digital economy by virtue of its high data availability, breadth of content coverage, and accounting treatment of indicators, which is more advantageous (Zhao et al., 2020; Ma et al., 2022; Zhang K. et al., 2022; Zhao et al., 2023). According to the published articles, we use the comprehensive index evaluation method to measure the level of digital technology development at the city level (Chen et al., 2022; Wang J. et al., 2023; Liu et al., 2022; Vărzaru, 2022; Chen Y. et al., 2023; Wang H. et al., 2023). Combining the availability of city-level data, this paper measures the comprehensive development level of digital technology in each city from five aspects: broadband Internet foundation, mobile Internet foundation, information industry factor inputs, telecommunication industry output, and digital inclusive finance. To achieve comparability of the comprehensive index across periods, this paper uses the global factor analysis method to calculate the DT development level. This method can well cover all characteristics of the original data, avoiding the subjectivity caused by artificially determined weights, and eliminating the bias of results caused by overlapping information of indicators. The evaluation index system of DT and its description are shown in Table 1.
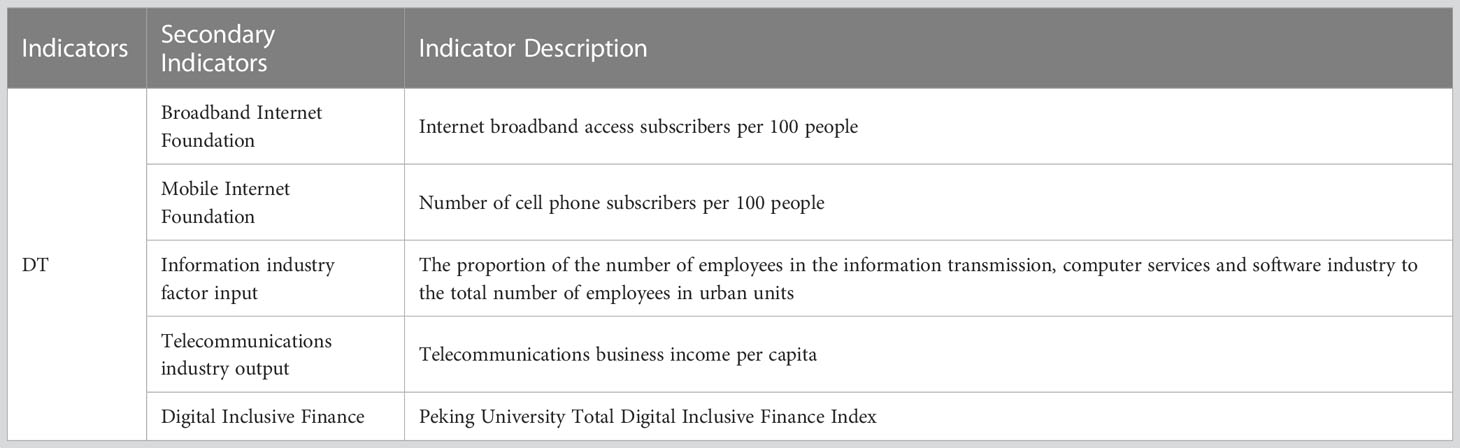
Table 1 Digital technology evaluation index system.
4.1.3 Mediating variables
Energy efficiency (EE). Influenced by the characteristics of resource endowment, most of China’s urban energy consumption products are mainly coal for a long time, and a large amount of energy consumption will inevitably be accompanied by the generation of a large amount of carbon emissions. Improving the EE use is one of the important ways to achieve carbon emission reduction. If we can reduce energy consumption and improve energy efficiency and utilization rate of renewable energy with the same output, we will be able to effectively mitigate the rising trend of carbon emission intensity. In this paper, the energy intensity of each prefecture-level city is used to measure its energy efficiency, which is the energy consumption per unit of GDP. Lower values of this variable indicate higher energy efficiency.
Green technological innovation (GTI). GTI is the general term for low or even zero pollution technologies, processes and products that follow ecological principles and ecological economic laws, save resources and energy, avoid, eliminate or mitigate ecological pollution and damage, and minimize negative ecological effects, and are innovative technologies that help save resources, improve energy efficiency, prevent and control pollution, and achieve sustainable development, mainly including innovative technologies in alternative energy, environmental materials, energy conservation and emission reduction, pollution. It mainly includes innovative technologies in alternative energy, environmental materials, energy conservation and emission reduction, pollution control and management, recycling, etc. R&D investment as a sunk cost is not an output efficiency, and the use of this indicator to measure the potential innovation capability of enterprises lacks relevance and precision, while the number of patents can visually reflect the technological innovation capability of enterprises (Fang and Na, 2020). Green invention patents are breakthrough innovations in products or processes that help enterprises achieve energy saving and carbon reduction goals. In this paper, the number of invention patents and utility patents related to environmental protection applied by enterprises in each prefecture-level city is selected to measure GTI.
Virtual agglomeration (VA). VA among enterprises is the process of system coordination. The geographical agglomeration and virtual agglomeration of upstream and downstream associated enterprises in the industrial chain have intertwined coupling relationship, which is a cyclic mechanism of mutual promotion and symbiosis. The important realization carrier of virtual agglomeration is Internet and information technology. Although the digital content and network services of enterprises are themselves realized through the cloud, the digital content and services formed by virtual agglomeration are essentially the concrete results of resource input and output, not virtual. The digital services are realized through the medium of products such as big data, expertise, creative design, and blockchain. In this paper, we use the locational entropy method to calculate the virtual agglomeration of industries in each city based on the idea of existing literature (Zhang and Ru, 2021). In general, the more people employed in a particular industry in a region means the more developed the industry is. Therefore, this paper uses information transmission, computer service and software employees as important indicators of virtual agglomeration and uses the locational entropy method to measure them. Because virtual agglomeration is less restricted by geographic space, it will often have spillover effects on surrounding cities through virtual network space. However, the traditional industries integrated into the virtual agglomeration platform are the foundation of the cluster, so the spillover effects also have spatial “distance attenuation.” By using the potential market model and adding inverse geographical distance weight to the location entropy method, virtual agglomeration can be better distinguished from traditional agglomeration (Liu et al., 2023). The calculation method of VA is as follows:
In Eq. (1), is the weight of the spherical geographical distance between city i and city j, calculated by GIS software. is the number of people employed in the information transmission, computer services and software industries of City i in year t; is the total number of jobs in city i in year t; is the total number of people employed nationwide in the information transmission, computer services and software industries; is the total number of jobs in all industries nationwide. Finally, in order to eliminate the causal relationship between industries and the development of science and technology, this study calculated the direct consumption coefficient of digital factors of each industry at the national level based on the data of the OECD input–output table and used the direct consumption coefficient of digital factors at the industry level to match with the micro-data of the first national economic census at the industry level. Then, the proportion of industry output in each city during the initial period of the study sample is taken as the weight, and the digital service input at the industry level is weighted at the city level.
4.1.4 Control variables
Since there are many external factors affecting CE, according to published articles on the impact of carbon reduction (Chen et al., 2016; Han et al., 2017; Guo et al., 2022; Xu et al., 2022; Luo et al., 2023; Shen and Yang, 2023), six control variables were selected to minimize the problem of bias in the model fitting results.
Population density. Energy consumption increases as population increases, which brings about an increase in overall carbon emissions. In this paper, the population density is measured by dividing the year-end population of each prefecture-level city by the year-end administrative area of that prefecture-level city.
Level of financial development. Credit supply can exacerbate energy consumption by stimulating consumption and industrial investment, which in turn increases CE. But at the same time, finance can reduce CE by supporting technological innovation and promoting the transformation of traditional industries into cleaner ones. In this paper, the total financial deposits and loans of each prefecture-level city in the past years are used to measure the level of financial development of a city.
Foreign direct investment (FDI). FDI is beneficial to both economic growth and the introduction of carbon-reducing technologies and equipment to drive local enterprises to innovate on their own and improve energy efficiency, thereby reducing carbon emissions. However, the purpose of FDI into the host country may be to transfer the high energy consumption and pollution-intensive industrial enterprises in the home country, and there is a “pollution sanctuary” effect, which aggravates carbon emissions. In this paper, the total amount of actual FDI utilized by each prefecture-level city is used to measure the openness of a city.
Government spending. The tangible hand of the government is an important channel to influence economic development and ecological environment. Local governments will make economic construction a key point of fiscal spending to attract enterprises to invest and set up factories locally by vigorously building infrastructure, lowering or exempting taxes and fees, and reducing environmental regulation. Local governments’ eagerness to attract investment may weaken regional environmental quality standards and indirectly connive at enterprises’ CE. In this paper, we measure the level of regional government spending by the share of local fiscal spending in urban GDP.
Infrastructure. Driven by the demand for infrastructure development, emerging economies have played an important role in increasing global production capacity in recent years, and their carbon emissions have increased rapidly, becoming the main driver of the increase in CE from major energy infrastructure. Infrastructure development in cities will play an important role in promoting zero-carbon energy development as a key technology vehicle for achieving carbon neutrality goals. This paper uses road area per capita to measure the level of infrastructure in cities.
Industrial structure. According to the new structuralist economic theory, the industrial structure is both a “resource converter” of various factor inputs and outputs and an “environmental controller” of various pollutant types and quantities (Yu, 2017). The type of combination and intensity of adjustment of factors in different sectors within an industry determine the economic efficiency and energy use efficiency of the industry, which has an indirect impact on resource consumption and environmental pollution. In this paper, the ratio of regional tertiary industry output value to secondary industry output value is used to measure the industrial structure of cities.
4.2 Econometric model
Based on the aforementioned theoretical assumptions, the following econometric model is constructed to test the direct impact of DT on carbon emissions:
In Eq. (2), the subscripts i and t are city individuals and time, respectively, and X denotes the set of information on a series of control variables. denotes individual fixed effects, denotes the time fixed effects, denotes the error term that obeys the white noise process, a0 denotes the constant term, and a1 and a2 are the regression coefficients of digital technology and control variables, respectively, where the coefficients of significance and sign direction are the focus of this paper. If the sign is negative and passes the significance test at least at the 10% level, it indicates that hypothesis H1 is valid and DT can reduce CE. On the basis of Eq. (2), combined with the method and operation process of the mediating effect test recommended by Jiang (2022), the article constructs the following three models to test whether research hypotheses H2 and H3 are valid:
In Eq. (3) to (5), the , , are the constant terms, , , denote the numerical technical regression coefficients, and , , denote the regression coefficients of the control variables, and the meanings of the remaining symbols and letters remain the same as in Eq. (2).
4.3 Data sources
Following the principles of data availability and comparability, the article eliminates the sample of cities with more changes in city level and missing values, such as Bijie, Tongren, Laiwu, and Chaohu, which are affected by the policy of “abolishing counties and establishing districts”, and the cities of Altay, Riqaze, and Linzhi, which have serious missing data, and finally selects the panel data of 276 cities in China from 2011 to 2020 as the statistical sample. The panel data of 276 cities in China from 2011 to 2020 were selected as the statistical sample. The original source of each data item is various statistical yearbooks published by the National Bureau of Statistics. The data on energy consumption, electricity consumption and transportation for calculating carbon emissions and their conversion factors are mainly derived from the China Urban Statistical Yearbook, China Statistical Yearbook, China Urban Construction Statistical Yearbook, IPCC 2006 Guidelines for National Greenhouse Gas Inventories, and China Regional Grid Baseline Emission Factor Report. The data for measuring DT-related indicators are derived from the Digital Inclusive Finance Index of Peking University and the China Urban Statistical Yearbook. The data for the remaining indicators are mainly derived from the China City Statistical Yearbook, the China Regional Economic Statistical Yearbook, the National Economic and Social Development Statistical Bulletin of each city, and the Bureau of Statistics, the China Academy of Information and Communication Research, and the China National Intellectual Property Administration (CNIPA). Very few missing values are filled in using the linear interpolation method of yes. In addition, to reduce sample fluctuations, all variables are logarithmized in this paper. The descriptive statistical analysis of each variable is shown in Table 2.
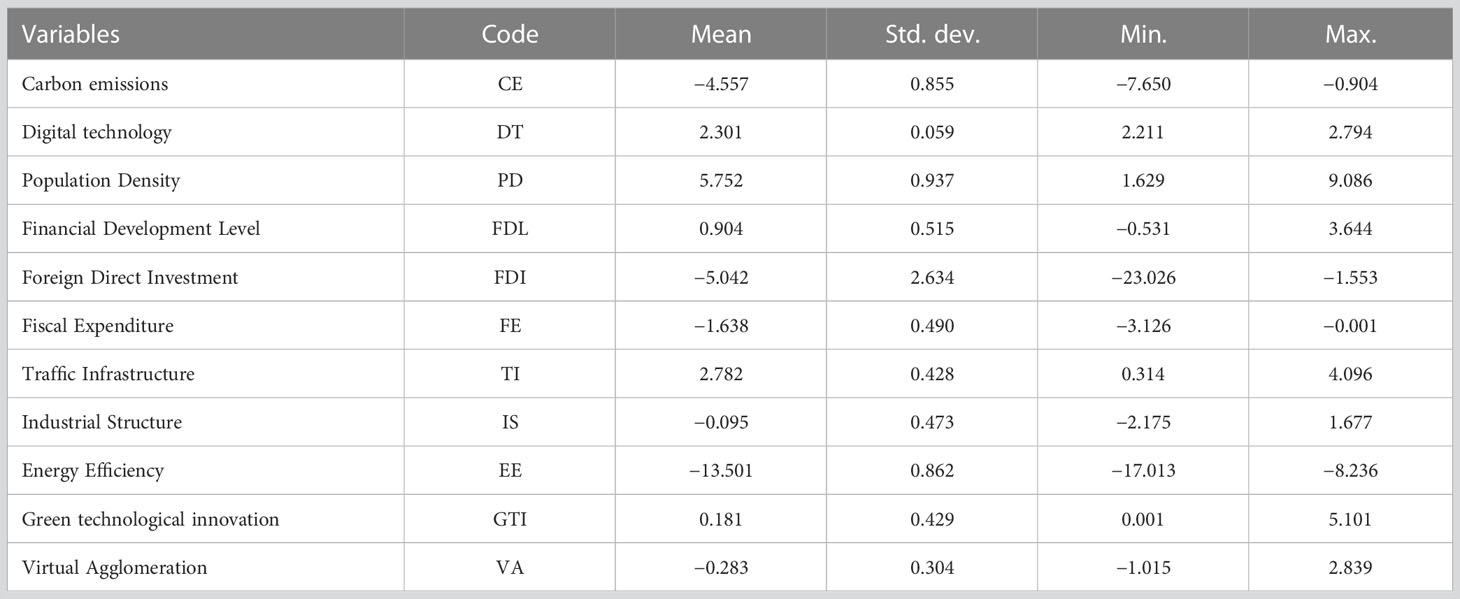
Table 2 The descriptive statistics of the variables.
5 Empirical analysis
5.1 Baseline regression
Due to the acceleration of global digital transformation and the growth of demand for computing power, as well as the broader application of 5G, the vigorous development of information infrastructure, and the growth of energy demand and carbon emissions, the energy consumption of information and communication industry cannot be ignored. It is urgent to take the road of green and low-carbon development. To verify whether DT can reduce CE, the impact of DT on city-level CE is estimated based on 2,760 observations, combining research hypothesis H1 and Eq. (2). According to the results of the F-tests and Hausman tests, the p-values of both significantly reject the original hypothesis, indicating that the fixed effects model is most suitable for the sample data in this paper. In order to eliminate possible estimation bias caused by time and region differences, the two-way fixed effects model is used as the baseline regression. In addition, the article uses the Driscoll-Kraay method to adjust the standard errors to alleviate the heteroskedasticity, cross-sectional correlation, and autocorrelation. The results are shown in Table 3. Among them, columns (1) and (3) are estimated from the model without control variables; columns (2) and (4) are estimated from the model with control variables.
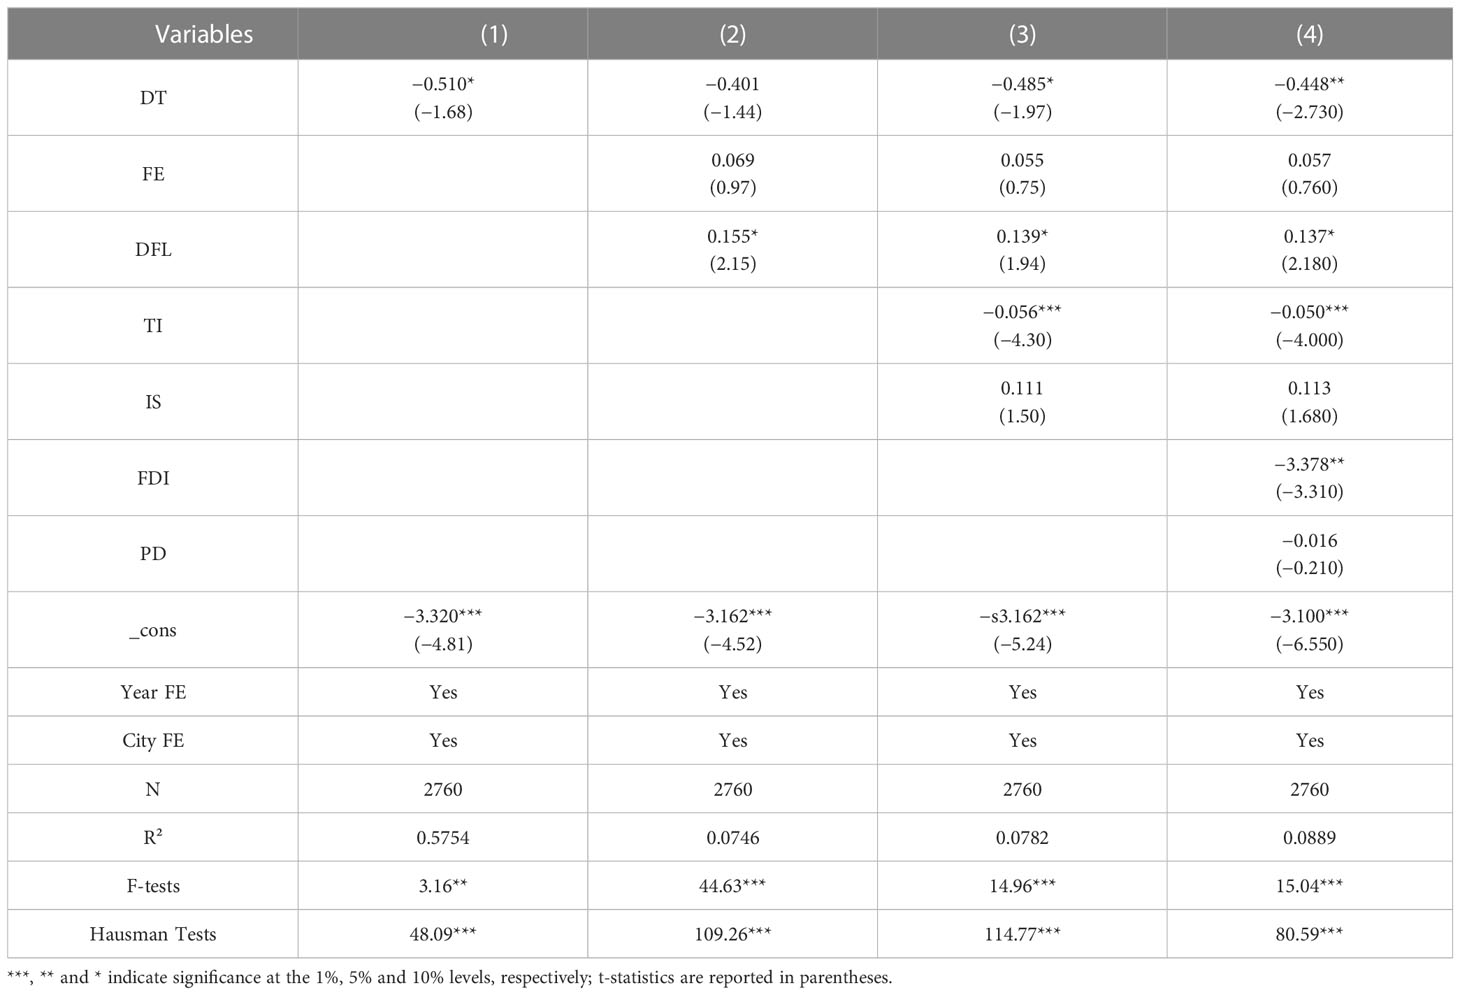
Table 3 Baseline regression results.
As can be seen from Table 3, the results of column (1) without any control variables show that the regression coefficient of DT on CE is -0.510 and significant at the 10% level, indicating that DT can reduce CE. The results of column (4) with control variables, time fixed effects and individual fixed effects show that the regression coefficient of DT on CE is −0.44 and significant at the 5% level. The result is similar to that of published research (Lee et al., 2022; Bai et al., 2023; Hu et al., 2023), the result of this paper also indicates that DT can reduce CE and the findings are robust. Research hypothesis H1 was verified. At this stage, insufficient technological innovation, information asymmetry and external diseconomies of CE are the main blockages in the process of achieving the dual carbon goal. With the rapid development of new-generation information technology and Internet technology, DT evolved from automation can provide information technology support for the environmental management work of city managers and corporate subjects to enhance economic efficiency while taking into account the ecological environment. Through the digital platform, enterprises can plan the production process accurately and control the production process intelligently, optimize the end of carbon emission management and energy-saving control measures in real time, which will lead to a significant increase in green total factor productivity and ultimately realize lean production and cost reduction. DT, with its timely and convenient data sharing and information dissemination functions, can effectively eliminate the problem of incomplete information among enterprises in various parts of the industry chain, help to weaken or even eliminate the technical barriers among innovation subjects, and promote the participation of multiple parties to the research and development of common technologies and cooperation to achieve GTI and clean production. Through DT, the enterprise’s capital flow, goods flow, commercial flow, logistics and other flow space elements are integrated and summarized in order to guide the flow of limited green financial resources to the environmentally-friendly high-tech industries. Most importantly, DT such as artificial intelligence, big data analysis and digital twin provide arithmetic support and data foundation for carbon trading cities, enabling accurate measurement, monitoring, reporting and verification of CE, and empowering efficient operation of carbon markets and carbon finance as well as scientific decision-making in urban ecological sectors.
5.2 Robustness test
To verify the robustness of the baseline regression results, the article uses four methods.
The first is to replace the core explanatory variable. The study used two methods to substitute proxy variables for digital technologies. First is to use the lagged term of CE as explanatory variable to test the time-lagged effect of DT. The second method uses the number of digital technology patents filed by listed companies. Since the IPC information of patents can accurately depict the technical field characteristics of innovation activities, this paper combined the Statistical Classification of Digital Economy and its Core Industries (2021) and the Reference Relation Table of International Patent Classification and Industry Classification of National Economy (2018) issued by the National Bureau of Statistics. To construct the corresponding relationship of “core industry classification code of digital economy – four-digit code of national economy industry classification (SIC4) – IPC Subgroup”, identify the technical field of digital technology innovation and its corresponding IPC code to identify the digital technology innovation patents applied by enterprises at the level of IPC group. Further, from the three dimensions of “enterprise – year – city,” the digital technology invention patents were summed up to construct the digital technology innovation measurement index at the city level. Since Chinese listed companies gradually paid more attention to the patents on digital technology after 2013, the number of applications before 2013 was relatively small (Tao et al., 2023). Therefore, the time window used in this method is 2013–2020.
The second is to add omitted variables. Rapidly advancing urbanization objectively requires better municipal infrastructure and basic public services such as transportation, electricity, and medical care, which brings about rapid economic development while also causing an increase in greenhouse gas emissions. Cities contribute about 75% of CE (Zhang et al., 2023). However, the high concentration of population and economic activities in urban areas also gives rise to economies of scale and process-oriented production patterns, which help to improve resource allocation efficiency and achieve optimal dispatch of materials, reducing CE. The business credit environment in a given region is an important factor affecting sustainable economic development (Shen et al., 2022). Under the joint incentive mechanism of trustworthiness, by focusing on improving the business credit environment and the red list system will motivate enterprises to focus on environmental protection and inspire green transformation. At the same time, the “reputation effect” generated by the strengthened business credit environment makes enterprises more actively take social responsibility to build a good image and reduce the emission of environmental pollution. Based on this, this paper adds two control variables, urbanization and business credit environment, to Eq. (2). Green finance is emerging with the primary purpose of coping with climate change, improving environmental quality, and saving and efficient use of resources. It can inject more capital into the green and environmental protection field through green credit, bonds, and other policy tools, which will substantially impact “carbon reduction” activities. Different from command-based or market-based regulatory policies, the establishment of green finance reform and innovation pilot zones will promote the pilot areas to accelerate the improvement of green development policies and green finance top-level design, including environmental policies, green finance systems, organizational systems, market operation mechanisms, product service systems, support, and safeguard measures. Green finance, for example, has significant signaling effects. Through leverage and credit support, limited green financial capital can quickly attract more social capital “green” and highly implement carbon reduction activities. At this time, green finance has a pronounced inhibition effect on high-carbon investment, which weakens investment in energy-intensive industries and limits interest-bearing debt financing and new investment in heavily polluting enterprises. Based on the research direction of the existing literature (Shi et al., 2022), we take the green finance policy implemented in 2017 as a new control variable.
Thirdly, the econometric model is replaced. In addition to using robust standard errors to control for the heteroskedasticity, within-group autocorrelation and between-group contemporaneous correlation present in the nuisance terms, feasible generalized least squares estimation (FGLS) can be used to eliminate them. Given the large regional variability in resource endowment, industrial structure and data characteristics of cities, in order to ensure the accuracy of the regression results, this paper selects comprehensive FGLS estimation with different autoregressive coefficients for each individual to corroborate the robustness of the benchmark regression results.
Finally, the potential two-way causality endogeneity problem is addressed. In the context of the “double carbon” target-oriented policy, the city administrations will implement more stringent carbon emission control mechanisms to force enterprises to implement GTI and cleaner production. Technological advances with a green bias will influence the development of DT through spillover effects and knowledge spillover, i.e., DT is more advanced in cities with lower carbon emissions and advanced economies. In order to avoid the interference of endogeneity issues on the model regression calculation, this paper draws on the research ideas from the existing literature (Yi and Zhou, 2018; An et al., 2023) and conducts the estimation of instrumental variables by constructing Bartik instrumental variables with some exogeneity (the product of the lagged and differential terms of DT). Because strictly exclusive instrumental variables are rare, digital technology, in particular, has some correlation with many aspects of socioeconomic affairs. Under the premise of the “unclean” instrumental variable assumption, the estimation results of the traditional instrumental variable method become unreliable. Therefore, we draw on the idea of Conley et al. (2012) to relax the exclusion constraint and use a Plausibly exogenous instrumental variable estimation method for robust inference, assuming that the estimated coefficients of instrumental variables affecting the explanatory variables through other channels are approximately zero, in order to estimate the regression coefficients of the core explanatory variables assuming the strict exclusion constraint of the relaxed instrumental variables. This method is also widely used to analyze the relationship between industrial robots and carbon emissions (Yu et al., 2023). To enhance the rigor of such research in causal inference, this study also uses the time-varying DID method to calculate the potential of digital technology in carbon emission reduction. Specifically, the “Broadband China” strategy, implemented in three batches from 2014–2016, provides a good quasi-natural experiment for this research (Wen et al., 2022). In the process of new infrastructure construction, the General Purpose Technology (GPT) of broadband networks has been applied in a large area and may stimulate the development of a digital economy and industrial structure optimization, thereby reducing urban carbon emissions.
As can be seen from Table 4, the results of all four methods show that the regression coefficients of DT are significantly negative and the significance only changes slightly, indicating that the conclusion that DT can reduce CE obtained from the baseline regression part is robust and reliable. In addition, the results of Method 4 based on the causal inference perspective show that the regression coefficient of DT on CE is −5.250 and passes the 5% significance test. This result shows that the conclusion that DT reduces CE still holds after eliminating the endogeneity problem. The conclusion that DT reduce CE is not a simple statistical relationship, but more in line with the causal logic between economic facts. H1 is strongly validated.
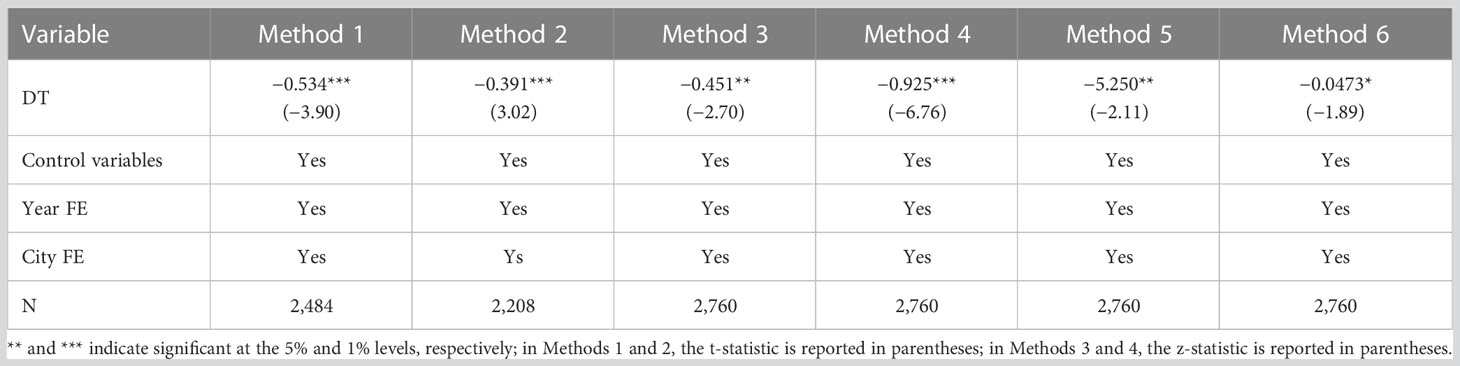
Table 4 Results of robustness tests.
6 Mechanism test
The above results showed that the development of DT does significantly curb the CO2 emission intensity of cities. However, it would be more revealing to reveal the mechanisms through which DT reduces CE. According to the research hypothesis and mechanism test equation above, this paper still uses the two-way fixed effects model to do the regression analysis, and the results are shown in Table 5.
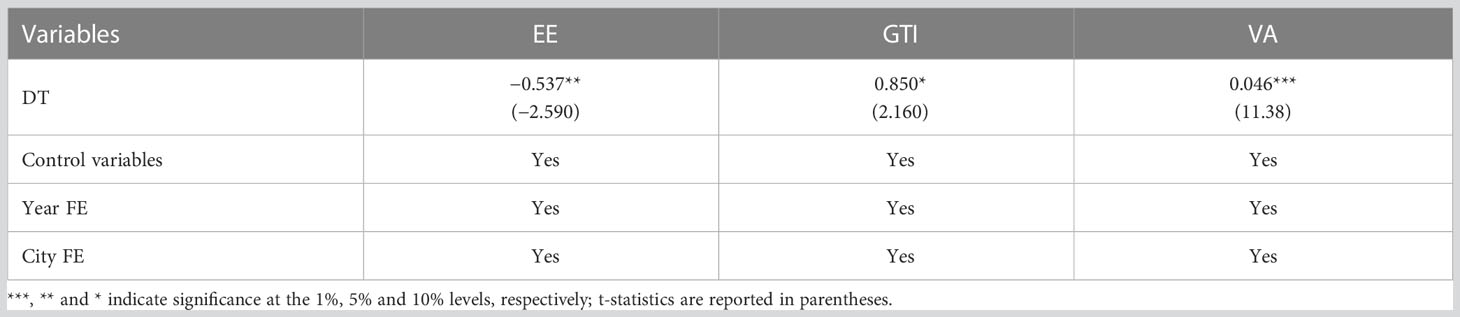
Table 5 Results of mechanism tests.
As shown in Table 5, the regression coefficients of DT on EE and GTI are −0.537 and 0.850, respectively, and significant at the 5% and 10% levels, respectively, showing that DT can reduce CE through mechanisms of improving enterprises’ GTI capacity and reducing energy consumption intensity. H2 is verified. DT is a specific practice of advanced productivity, which itself has the role of technological progress and green attributes. The ever-changing technology carriers and rapidly evolving ICTs bring about iterative renewal of production equipment. For example, the digital transformation of enterprises makes online meetings and cloud offices possible, indirectly promoting the optimization of production operations, organizational coordination and management control, and improving the production lines and processes of enterprises. DT highlights the universality of “Davidson’s Law”, which is constantly replacing low-energy-consuming equipment with high-energy-consuming equipment, forcing the elimination of outdated production capacity and transformation and upgrading, therefore reducing energy consumption per unit of GDP. At the same time, under the influence of Metcalfe’s law, DT improves the efficiency of information search, expands the channels and scope of information dissemination, and accelerates the association of production factors at the spatial level and network externality spillover, which improves the technological innovation capacity and output efficiency of each production node (Zhang and Wei, 2019). In addition, the open and inclusive characteristics of DT can promote the sharing of enterprise innovation knowledge, provide a sharing platform and channel to alleviate resource mismatch and inefficient operation, and enable the flow of innovation factors and high-quality resources to high-efficiency industries, which can reduce CE.
The regression coefficient of DT on virtual agglomeration (VA) is 0.046 and passed the 1% significance test, indicating that DT can reduce CE through the mechanism of promoting industrial virtual agglomeration. H3 was verified. The new technological paradigm reduces the original production and transaction costs, which inevitably leads to a change in the shape and structure of production organization. With the deep development of DT, especially the popularity and application of machine learning, big data technology, digital twin and smart manufacturing, the evolution of organizational form has been given new dynamics and paths (Feng, 2018). Based on the new technology network, more and more industries break through the barriers of physical space, and the associated collaboration among enterprises is less dependent on geographic space, and various subjects in the value. The externalities of agglomeration are multiplied by the increase of participating subjects. First of all, DT represented by cloud computing and industrial Internet provide virtual space and technical carriers for the circulation and aggregation of data elements, which help big data realize low-cost and high-efficiency real-time exchange through the network platform. Data elements are stored in a distributed manner in the virtual network space and linked by the network, and data demanders implement extraction and analysis of data resources through the massive storage network. This can optimize the spatial layout of data elements, promote the modularization and standardization of service elements, and enhance the transparency of element circulation and the coupling and coordination of production demands. Furthermore, through the virtual space aggregation platform of technical resources, tacit knowledge, which was difficult to be copied and disseminated in the past, can be realized through the network platform to achieve knowledge overflow in multiple points in time and multiple dimensions. The virtual cyberspace turns the tacit knowledge that cannot be digitized into explicit, stable knowledge that can be coded and disseminated over long distances, and reduces the spatial stickiness of knowledge, effectively shortens the time lag of technology diffusion, and bursts the technology welfare effects (Zhang and Ru, 2021). Finally, DT enables the subjects clustered in cyberspace to quickly disseminate information on the output of final goods while also obtaining more efficiently any number of intermediate goods inputs that exist in the market. The output and services of each node of the industry chain will face a wide market demand, and the market effect of intermediate inputs will be infinitely enlarged at this time. At the same time, DT weakens the specialization of productive service inputs in the traditional geographical agglomeration. The non-tradable productive services in traditional industrial agglomeration will become tradable under the role of virtual agglomeration, and the convenience of obtaining intangible intermediate inputs in virtual agglomeration is much greater than that in traditional industrial agglomeration. The DT has reduced the possibility of technology dormancy by promoting the characteristics of knowledge diffusion in a network. It breaks the linear closed technology transfer mode of traditional upstream and downstream industries, converts the “point-to-point” technology diffusion into a “one-to-many” network structure, and shrinks or blurs the industrial boundary line. Therefore, DT helps to improve the fineness of professional division of labor and the concentration of different industries or similar industries in virtual space. chain achieve agglomeration and division of labor in the virtual space of infinity (cloud) (Chen et al., 2021).
7 Heterogeneity analysis
7.1 Heterogeneity test of urban resource endowment
Considering the unbalanced regional economic development in China, this paper divides the sample according to city scale and whether it is a resource-based city to assess whether the carbon emission reduction effect of DT is heterogeneous depending on the resource endowment. For the sample division of city scale, this paper divides the new first-tier and first-tier cities into large cities and the second-tier, third-tier, fourth-tier and fifth-tier into middle-sized and small cities based on the New Grading List of Chinese Cities published by the New First-Tier Cities Institute in 2020 (The Rising Lab, 2020). For the sample classification of resource-based cities, this paper mainly refers to the classification criteria of the National Sustainable Development Plan for Resource-based Cities issued by the State Council in 2007 (The State Council of the People's Republic of China, 2008). As shown in Table 6, the regression coefficients of DT in large cities and middle-sized and small cities are −1.289 and −0.552, respectively, and both pass the significance test at the 5% level. Comparing the two coefficients, we can find that the regression coefficients of DT are significantly larger in large cities than in middle-sized and small cities, indicating that DT plays a more significant role in CO2 emission reduction in areas with high economic density and good business conditions. The potential reasons are that large cities have more complete Internet infrastructure and policy measures, the application scenarios and usage frequency of DT is broader, and the coupling and integration of advanced technologies with the traditional real economy is higher. At the same time, compared with middle-sized and small cities, large-scale cities have more sufficient funds, more advanced DT and better talents, and the scale of digital economy is also larger, with a higher level of agglomeration conditions and resource allocation, and the investment and pace of digital transformation is larger, which can more effectively enhance urban productivity and thus suppress more CE, and the effect of reducing carbon emission intensity will be more obvious.
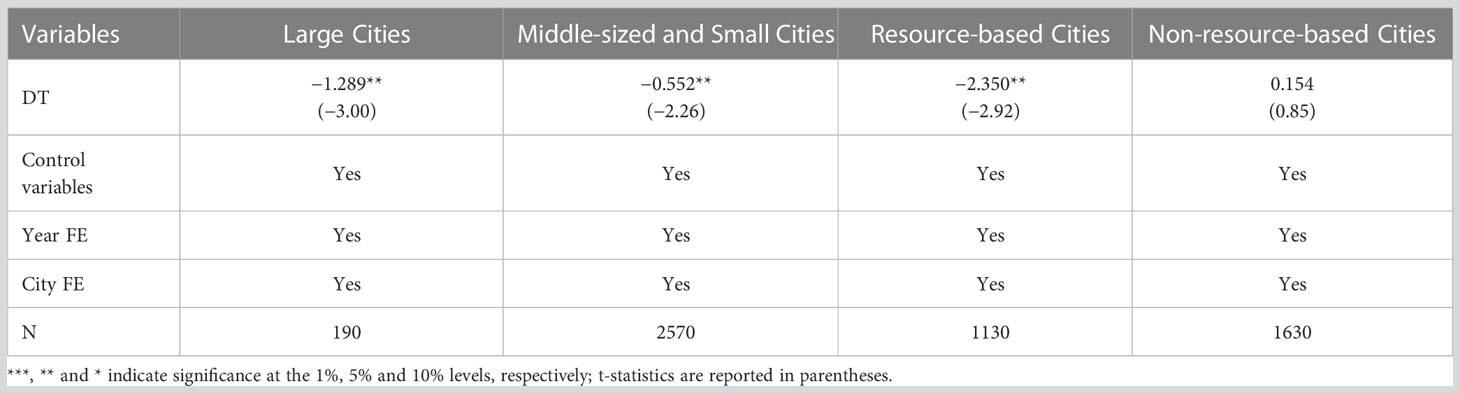
Table 6 Heterogeneity test of urban resource endowment.
What can also be found from Table 6 is that the regression coefficient of DT in resource-based cities is −2.350 and passes the significance test at the 5% level; in non-resource-based cities, the regression coefficient of DT is 0.154 and does not pass the significance test. The potential reason for this result is that the economic development pattern of resource-based cities is mainly characterized by factor inputs and primary processing of products, and the industrial structure is dominated by heavy industry. Compared with agriculture and service industries, heavy industries are characterized by high consumption and high pollution, and the crude economic development mode results in high CE. The popular application of DT can accelerate the transformation, upgrading and clean development of traditional industries such as coal, iron and steel, cement and chemical industry, dissolve the excess capacity of coal, and boost the low-carbon transformation and circular development of industries in old industrial base cities (Zhang J. et al., 2022). Industrial digital transformation can significantly improve enterprise production efficiency and improve production processes, optimize the combination of factor allocation, and the marginal effect of carbon emission reduction by DT is more significant. Meanwhile, in the Opinions on Promoting the Sustainable Development of Resource-based Cities issued by the State Council in 2007 (The State Council of the People's Republic of China, 2008), governments at all levels are required to increase support for the sustainable development of resource-based cities and establish institutional mechanisms conducive to the sustainable development of resource-based cities as soon as possible. Aided by strict environmental regulations to improve the ecological environment for the comprehensive, coordinated and sustainable economic and social development of resource-based cities, resource-based cities are in a better position to give full play to the role of DT in leading demonstrations. Local governments can build an intelligent, precise and comprehensive management system to shape a favorable development environment for the green transformation of urban industries, help the regional economy develop in a green and high-quality way, and reduce carbon emission intensity. In addition, resource-based cities have more room for progress in DT development and develop more rapidly, which can accelerate the rational allocation of resource factors and the synergistic division of labor among industries, and more easily promote the coordinated and rational industrial structure and green transformation of cities, improve energy efficiency and reduce carbon emissions. The economic development of non-resource-based cities does not depend on resource processing and energy consumption, and the industrial structure is more inclined to agriculture or service industry. DT has been deeply integrated with other industries by virtue of the network incremental effect of Merkauf’s law, and thus the marginal effect of carbon emission reduction decays. At the same time, DT is dependent on electricity consumption. The large-scale application of machines and network facilities will increase the CE of the power sector.
7.2 Heterogeneity test of urban policy
Existing literatures have divided cities into different types according to China’s geographical location to conduct heterogeneity test. However, this method only considers physical geography and resource endowment, and the conclusions obtained are not targeted enough for administrative departments or enterprise managers to formulate management strategies, nor can they stimulate the subjective initiative of market subjects (Yang et al., 2022; Yi et al., 2022; Sun and Wu, 2023). The Chinese government is firmly committed to promoting ecological environmental protection and green development. The carbon emission reduction role of DT may be influenced by macro-level policy regulation, and ignoring regulatory policies for environmental governance in China may lead to biased empirical estimates. Therefore, this paper selects two policy regimes related to digital infrastructure and environmental regulation, respectively, to test the heterogeneity of DT in carbon emission reduction.
A smart city is an intelligent management and operation and maintenance path that can be sensed, seen, measured, analyzed and controlled based on the overall digitalization of the city, which includes digital infrastructure such as urban networks, sensors, and computing resources. This paper divides the 276 samples into two samples based on the Assessment Report on the Development Level of China’s Smart Cities published by the State, with a view to assessing the heterogeneous impact of DT on CE in cities with different degrees of development of DT facilities. As shown in Table 7, the regression coefficient of DT in the pilot cities is −0.579 and significant at the 5% level, while in the non-pilot cities, although DT can still reduce CE but the reduction effect is not significant. The potential reason is that in the pilot cities of smart cities, new DT such as big data, IoT, cloud computing, next-generation Internet, and AI can be widely used in various digital infrastructures to achieve cross-sectoral, cross-level, cross-regional, cross-institutional, and cross-path network collaboration, and better play their own impact role. It can be seen that DT development significantly contributes to the reduction of carbon emission intensity in smart cities, but does not effectively curb the carbon emission intensity in non-smart cities.
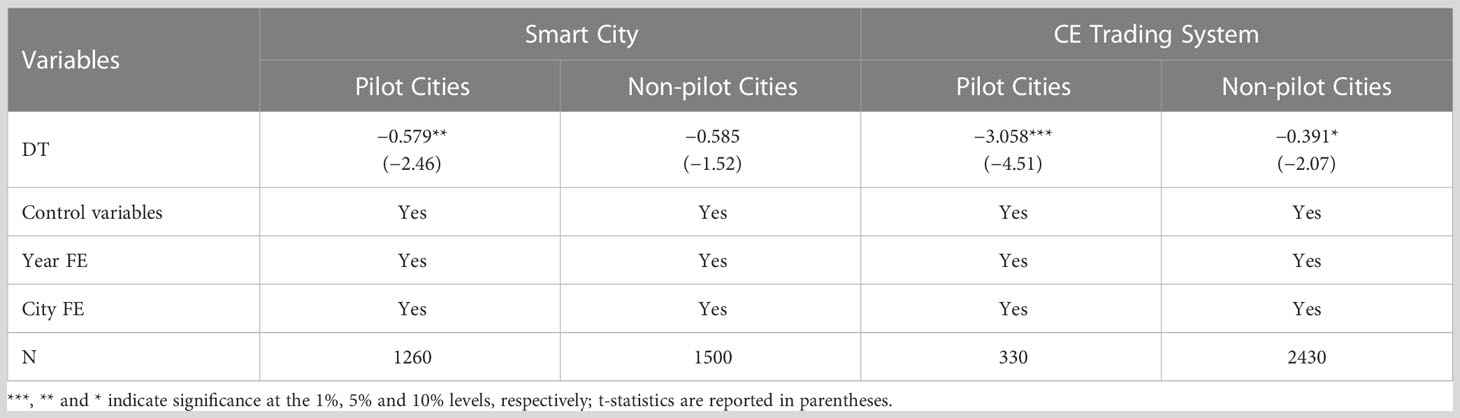
Table 7 Heterogeneity test of urban policy.
The carbon pilot policy requires cities to adopt low-carbon economy as the development model and direction, citizens to adopt green and low-carbon living as the concept and action mode, and government management to adopt low-carbon society as the governance model and construction blueprint. Therefore, this paper uses the low-carbon city pilot policy to divide the sample in order to verify the heterogeneous effects of DT in regions with different strengths of environmental regulation. As shown in Table 7, the regression coefficients of DT in pilot and non-pilot areas of low-carbon city policy are −3.058 and −0.391, respectively, and they pass the significance tests of 1% and 10%, respectively. Comparing the magnitudes of the two coefficients, it can be found that the coefficients of DT in the pilot low-carbon city areas are significantly larger than those in the non-pilot areas, even by several times, indicating that the carbon reduction effect played by DT is more obvious and prominent in areas with stronger environmental regulation, verified the Potter Hypothesis. The potential reason is that environmental regulation through digital media is more capable of guiding the public to form a green concept, leading a green life and mitigating urban CE. In addition, a strong external regulatory force can apply the law of “survival of the fittest” to enterprises. Some resource-intensive and labor-intensive enterprises cannot afford the cost of green innovation and process transformation in a short period of time, so they will move to other regions or temporarily reduce their production capacity to control CE. Based on the pollution data provided by DT, government departments will also discipline highly polluting enterprises by “shutting down and closing down”. As a result, the cleanliness of the industrial structure of the whole region will be significantly improved with the support of DT and environmental regulations to achieve carbon emission reduction.
8 Conclusions and policy implications
8.1 Conclusions
Peak carbon dioxide emissions and carbon neutrality an urgent need to solve the significant problems of resource and environmental constraints and realize sustainable development, conform to the trend of technological progress and promote the transformation and upgrading of economic structure, and meet the people’s growing demand for the beautiful ecological environment and promote the harmonious coexistence between man and nature. DT is used in all sectors of economic and social development, and the application and support of DT is indispensable to achieve carbon peaking and carbon neutrality goals. In the new form of digital economy, the green transformation of industries empowered by DT has become the key to efficiently promote and achieve the low-carbon emission reduction milestones (Shen and Yang, 2023).
Based on the technology diffusion theory, the article first systematically compares the theories and mechanisms of carbon emission reduction by DT, and then empirically tests the impact of DT on carbon emission based on panel data of 276 cities in China from 2011 to 2020, using a two-way fixed effects model and instrumental variables method. Consistent with the findings of published papers (Liu et al., 2022; Shen et al., 2023; Xu et al., 2023), this paper found that DT significantly reduces CE in cities. This conclusion still holds after robustness tests by replacing the explanatory variables, eliminating endogeneity and adding omitted variables. In the post-pandemic era, “digitalization” and “greening” have become the main themes of global economic recovery. Digital technology is essential in helping the global response to climate change. Digital technology can deeply integrate with energy, power, industry, transportation, buildings, and other key carbon emission fields, effectively improve the use efficiency of energy and resources, and realize the double improvement of production efficiency and carbon efficiency. Digital is becoming an essential technological path for China to achieve carbon neutrality. DT has highly convergent, permeable and synergistic characteristics, and its deep integration with the real sector can bring into play the positive externalities of technology in reducing carbon emissions. It’s different from published research (Yang et al., 2022; Wang and Chen, 2023), the contribution of this study, of course, is to reveal new paths for DT to reduce carbon emissions, especially the role of VA. In addition, the heterogeneity of carbon emission reduction by digital technologies revealed in this study is also helpful in ecology because it considers the resource endowment of cities themselves rather than simply classifying them according to geographical location. Mechanism tests show that DT can reduce CE through mechanisms of improving energy efficiency, promoting virtual agglomeration of industries, and stimulating GTI of enterprises. DT is more effective in promoting carbon emission reduction in large cities and resource-based cities, that is, there is heterogeneity in the role of DTs in reducing CE. In addition, the policy system is also an important factor influencing the reduction of CE by DT. Specifically, the carbon emission reduction role played by DT is more evident in smart cities and pilot areas of carbon emission trading policies. Developing advanced industrial structure is an important way to reduce environmental pollutants (Kong et al., 2023). Specialized agglomeration and diversified agglomeration of different industries on the Internet information platform are conducive to giving play to the advantages of advanced industrial structure. The unique theoretical contribution of this paper lies in that it not only reveals that digital technology has great potential in reducing carbon emissions and promoting sustainable development but also innovatively brings virtual industrial agglomeration into the path mechanism of digital technology to reduce carbon emissions, which is helpful to enrich the theoretical research perspective. In addition, the paper verifies the heterogeneity of digital technology emission reduction from the perspective of environmental regulation policy and digital infrastructure policy, which is helpful for relevant subjects to take corresponding actions in time to achieve carbon emission reduction. Therefore, this study is a useful exploration under the background of a new round of technological revolution and carbon neutrality. On the one hand, the research conclusion of this paper expands the channels of reducing carbon emissions by digital technology in theory, and on the other hand, it also helps policymakers to take corresponding actions in practice to conform to the laws of global economic development.
8.2 Policy recommendations
(1) Improve resource allocation and seize the digital economy dividend. Digital infrastructure has the role of early capital, and upgrading the investment in digital infrastructure construction, especially new infrastructure such as 5G and 6G, as well as accelerating the improvement of digital industry-related infrastructure, can also create a favorable environmental atmosphere for the development of DT. Local governments should improve Internet data exchange platforms, Internet of Things and other network infrastructures, strengthen the comprehensive integration of big data mechanisms, cloud computing and artificial intelligence, etc., deeply tap into the Internet development space and release digital dividends.
(2) Focus on the development differences between regions and promote the progress of lagging regions. Compared with the “advanced” regions, some of the “backward” regions are still relatively underdeveloped in DT and have developed relatively late. Therefore, local communities need to learn from the experience of DT development in “advanced regions”, strengthen the exchange of experience, and seize the development opportunities brought by DT in a timely and proactive manner. The government should build a platform for inter-regional knowledge and technology communication, strengthen inter-regional digital innovation exchange and cooperation, enhance digital scale, promote green, intelligent, coordinated and sustainable development of regional transportation, and coordinate regional differences in DT. While learning from the experience of DT development in “advanced zones”, local communities should also pay close attention to the characteristics of local development, so that DT can be better applied to the local market and truly contribute to the economic development of the area. Combining the regional industrial structure and resource endowment, using DT to transform traditional industries in an all-round and whole-chain manner, enhancing the adaptability of the digital economy to the industrial restructuring of cities with different industrial attributes and resource endowment, accelerating the cultivation of new industries and new models based on new DT, accelerating technological progress and GTI, promoting low-carbon technological innovation and digital transformation of resource-based industries, and breaking the structural energy and resource “curse”, and continuously release the vitality of digital construction to empower urban low-carbon transformation, so as to realize the coordinated symbiosis of digital transformation and green development of old industrial bases and resource-based cities.
(3) We should create a good policy environment, introduce policies and regulations related to GTI, improve the legal and regulatory system of green innovation technology and intellectual property rights system, solidify the guarantee of green development system, establish an all-round and multi-dimensional fair competition environment and policy system, and encourage enterprises to actively carry out GTI; meanwhile, we can also encourage enterprises to reduce carbon tax by introducing advanced DT and equipment. Encourage the research and development of green, clean and low-carbon technologies, accelerate the transformation and application of advanced technological achievements, and cultivate new momentum for the green and low-carbon transformation of China’s cities In addition, talents are also the key to strengthening GTI, and it is necessary to cultivate a team of green and low-carbon talents, and the construction of GTI platforms should be encouraged, while the government should increase the procurement of GTI products, and strengthen the GTI achievements in industry, agriculture. At the same time, the government should increase the procurement of GTI products and strengthen the wide application of GTI results in various fields such as industry, agriculture, construction and transportation, so as to effectively promote the development of energy saving and emission reduction and ultimately help the low carbon transformation of the city.
8.3 Research limitations
This study evaluated whether DT can reduce carbon emissions. The methods used were more focused on statistical inference of statistical models. However, economic research focuses more on the causal relationships between economic variables. In future research, it will be beneficial to use the list of intelligent manufacturing demonstration enterprises and the policy of industrial intelligent demonstration parks and use the double-difference method and breakpoint regression to make the research conclusions more consistent with causality. Measuring the efficiency of resource utilization can better reflect the ecological and social values of various essential resources (Yuan et al., 2023). In future research, researchers should pay attention to the path mechanism of digital technology to reduce carbon emissions and the role of digital technology in improving carbon efficiency because it will directly affect ecological accounts and resource liabilities. In future research, it will be beneficial to combine econometrics with natural science methods such as game theory, operational research, and management science to evaluate the impacts of DT on CE from an interdisciplinary perspective.
Data availability statement
Publicly available datasets were analyzed in this study. Proper sources are cited in the text. The data used to support the findings of this study are available from the corresponding author upon request.
Author contributions
YS and HL, conceptualization, formal analysis, and writing–original draft. YS, funding acquisition, resources, and supervision. LW and HL, investigation, data curation and methodology. YS, project administration, software, and visualization. HL and LW, validation and writing–review and editing. All authors contributed to the article and approved the submitted version.
Funding
This work was funded by the Social Science Planning Project of Shandong Province (Grant number: 17BJJJ07).
Conflict of interest
The authors declare that the research was conducted in the absence of any commercial or financial relationships that could be construed as a potential conflict of interest.
Publisher’s note
All claims expressed in this article are solely those of the authors and do not necessarily represent those of their affiliated organizations, or those of the publisher, the editors and the reviewers. Any product that may be evaluated in this article, or claim that may be made by its manufacturer, is not guaranteed or endorsed by the publisher.
References
Aghion P., Antonin C., Bunel S. (2021). The power of creative destruction: Economic upheaval and the wealth of nations. 1th ed (Cambridge, Massachusetts: Harvard University Press).
Akcigit U., Caicedo S., Miguelez E., Stantcheva S., Sterzi V. (2018). Dancing with the stars: Innovation through interactions. Natl. Bureau. Econ. Res., w24466. doi: 10.3386/w24466
Alam M. J., Begum I. A., Buysse J., Van Huylenbroeck G. (2012). Energy consumption, carbon emissions and economic growth nexus in Bangladesh: Cointegration and dynamic causality analysis. Energy Policy 45, 217–225. doi: 10.1016/j.enpol.2012.02.022
Al-Mulali U., Sab C. N. B. C. (2012). The impact of energy consumption and CO2 emission on the economic growth and financial development in the Sub-Saharan African countries. Energy 39 (1), 180–186. doi: 10.1016/j.energy.2012.01.032
An Q., Liu J., Li W. (2023). Digital inclusive finance and the upgrading of household consumption structure: Mechanism and empirical evidence. J. Yunnan. Univ. Finance. Econ. 39 (3), 1–23. doi: 10.16537/j.cnki.jynufe.000851
Bai T., Qi Y., Li Z., Xu D. (2023). Digital economy, industrial transformation and upgrading, and spatial transfer of carbon emissions: The paths for low-carbon transformation of Chinese cities. J. Environ. Manage. 344, 118528. doi: 10.1016/j.jenvman.2023.118528
Bharadwaj A., El Sawy O. A., Pavlou P. A., Venkatraman N. V. (2013). Digital business strategy: Toward a next generation of in-sights. MIS. Q. 37 (2), 471–482. doi: 10.25300/MISQ/2013/37:2.3
Bukht R., Heeks R. (2018). Defining, conceptualising and measuring the digital economy. Int. Organisations. Res. J. 13 (2), 143–172. doi: 10.17323/1996-7845-2018-02-07
Chandler A. D. (1962). Strategy and structure: chapters in the history of the American industrial enterprise. (Cambridge, MA: MIT Press).
Chang K., Chen G., Du Z., Hou F., Li J., Chen F. (2022). Decomposition and decoupling research of Chinese power sector carbon emissions through the consumption accounting principle. Environ. Sci. Pollut. Res. 29, 9080–9096. doi: 10.1007/s11356-021-14278-7
Chen J., Cheng S., Song S., Wu Y. (2016). A carbon emissions reduction index: Integrating the volume and allocation of regional emissions. Appl. Energy 184, 1154–1164. doi: 10.1016/j.apenergy.2016.03.032
Chen X., Liu C., Jiang Y., Gao C. (2021). What causes the virtual agglomeration of creative industries? Sustainability 13, 9232. doi: 10.3390/su13169232
Chen X., Mao S., Lv S., Fang Z. (2022). A study on the non-linear impact of digital technology innovation on carbon emissions in the transportation industry. Int. J. Environ. Res. Public Health 19 (19), 12432. doi: 10.3390/ijerph191912432
Chen H., Yi J., Chen A., Peng D., Yang J. (2023). Green technology innovation and CO2 emission in China: Evidence from a spatial-temporal analysis and a nonlinear spatial Durbin model. Energy Policy 172, 113338. doi: 10.1016/j.enpol.2022.113338
Chen Y., Zhang Y., Wang J., Jiang J. (2023). The impact of the urban digital economy on China's carbon intensity: Spatial spillover and mediating effect. Resour. Conserv. Recycling. 189, 106762. doi: 10.1016/j.resconrec.2022.106762
Conley T. G., Hansen C. B., Rossi P. E. (2012). Plausibly exogenous. Rev. Econ. Stat 94 (1), 260–272. doi: 10.1162/REST_a_00139
Dhar P. (2020). The carbon impact of artificial intelligence. Nat. Mach. Intell. 2 (8), 423–425. doi: 10.1038/s42256-020-0219-9
Dogan E., Turkekul B. (2016). CO2 emissions, real output, energy consumption, trade, urbanization and financial development: Testing the EKC hypothesis for the USA. Environ. Sci. Pollut. Res. 23, 1203–1213. doi: 10.1007/s11356-015-5323-8
Dong K., Wang J., Taghizadeh-Hesary F. (2022). Assessing the embodied CO2 emissions of ICT industry and its mitigation pathways under sustainable development: A global case. Appl. Soft. Computing. 131, 109760. doi: 10.1016/j.asoc.2022.109760
Fang X., Na J. (2020). Stock market reaction to green innovation: Evidence from GEM firms. Econ. Res. J. 55 (10), 106–123.
Feng P. (2018). Research on organizational evolution in the era of big data. Economist 231 (3), 57–62. doi: 10.16158/j.cnki.51-1312/f.2018.03.009
Feng L., Shang S., Gao X. (2022). CO2 emissions are first aggravated and then alleviated with economic growth in China: a new multidimensional EKC analysis. Environ. Sci. Pollut. Res. 30, 37516–37534. doi: 10.1007/s11356-022-24816-6
GeSI. (2015). SMARTer 2030: ICT Solutions for 21st Century Challenges. Available at: https://smarter2030.gesi.org/downloads/Executive_summary2.pdf.
Goldfarb A., Tucker C. (2019). Digital economics. J. Econ. Literature. 57 (1), 3–43. doi: 10.1257/jel.20171452
Grossman G. M., Krueger A. B. (1991). Environmental impacts of a North American free trade agreement. Natl. Bureau. Econ. Res. Working Paper, w3914. doi: 10.3386/w3914
GSMA and the Carbon Trust. (2019). The Enablement Effect: The impact of mobile communications technologies on carbon emission reductions. Available at: https://www.gsma.com/betterfuture/wp-content/uploads/2019/12/GSMA_Enablement_Effect.pdf.
Guo Q., Su Z., Chiao C. (2022). Carbon emissions trading policy, carbon finance, and carbon emissions reduction: evidence from a quasi-natural experiment in China. Econ. Change Restructuring. 55, 1445–1480. doi: 10.1007/s10644-021-09353-5
Gustavsson L., Joelsson A., Sathre R. (2010). Life cycle primary energy use and carbon emission of an eight-storey wood-framed apartment building. Energy Buildings. 42 (2), 230–242. doi: 10.1016/j.enbuild.2009.08.018
Han X., Jiao J., Liu L., Li L. (2017). China’s energy demand and carbon dioxide emissions: do carbon emission reduction paths matter? Natural Hazards. 86, 1333–1345. doi: 10.1007/s11069-017-2747-0
Hasanbeigi A., Morrow W., Masanet E., Sathaye J., Xu T. (2013). Energy efficiency improvement and CO2 emission reduction opportunities in the cement industry in China. Energy Policy 57, 287–297. doi: 10.1016/j.enpol.2013.01.053
Hens H., Verbeeck G., Verdonck B. (2001). Impact of energy efficiency measures on the CO2 emissions in the residential sector, a large scale analysis. Energy Build. 33 (3), 275–281. doi: 10.1016/S0378-7788(00)00092-X
Hou S., Zhou S. (2023). Research on dynamic effect and influence mechanism of industrial co-agglomeration on carbon intensity. Resour. Environ. Yangtze. Basin. 32 (2), 273–283. doi: 10.11870/cjlyzyyhj202302004
Hu J. (2023). Synergistic effect of pollution reduction and carbon emission mitigation in the digital economy. J. Environ. Manage. 337, 117755–56. doi: 10.1016/j.jenvman.2023.117755
Hu J., Zhang H., Irfan M. (2023). How does digital infrastructure construction affect low-carbon development? A multidimensional interpretation of evidence from China. J. Cleaner. Prod. 396, 136467. doi: 10.1016/j.jclepro.2023.136467
Inah O. I., Abam F. I., Nwankwojike B. N. (2022). Exploring the CO2 emissions drivers in the Nigerian manufacturing sector through decomposition analysis and the potential of carbon tax (CAT) policy on CO2 mitigation. Future Business. J. 8 (1), 1–22. doi: 10.1186/s43093-022-00176-y
IPCC. (2006). 2006 IPCC Guidelines for National Greenhouse Gas Inventories. Available at: https://www.ipcc-nggip.iges.or.jp/public/2006gl/index.html.
IPCC. (2023). AR6 Synthesis Report Climate Change 2023. Available at: https://www.ipcc.ch/report/ar6/syr/.
Jiang T. (2022). Mediating effects and moderating effects in causal inference. China Ind. Econ. 410 (5), 100–120. doi: 10.19581/j.cnki.ciejournal.2022.05.005
Jing S., Wu F., Shi E., Wu X., Du M. (2023). Does the digital economy promote the reduction of urban carbon emission intensity? Int. J. Environ. Res. Public Health 20 (4), 3680. doi: 10.3390/ijerph20043680
Kong Y., He W., Shen J., Yuan L., Gao X., Ramsey T. S., et al. (2023). Adaptability analysis of water pollution and advanced industrial structure in Jiangsu Province, China. Ecol. Model. 481, 110365. doi: 10.1016/j.ecolmodel.2023.110365
Kong H., Shi L., Da D., Li Z., Tang D., Xing W. (2022). Simulation of China's carbon emission based on influencing factors. Energies 15 (9), 3272. doi: 10.3390/en15093272
Krugman P. (1991). Increasing returns and economic geography. J. Polit. Econ. 99 (3), 483–499. doi: 10.1086/261763
Lahouel B. ,. B., Taleb L., Zaied Y. B., Managi S. (2021). Does ICT change the relationship between total factor productivity and CO2 emissions? Evidence based on a nonlinear model. Energy Econ. 101, 105406. doi: 10.1016/j.eneco.2021.105406
Lee, Yuan Y., Wen H. (2022). Can digital economy alleviate CO2 emissions in the transport sector? Evidence from provincial panel data in China. Natural Resour. Forum 46 (3), 289–310. doi: 10.1111/1477-8947.12258
Li X., Liu J., Ni P. (2021). The Impact of the digital economy on CO2 emissions: A theoretical and empirical analysis. Sustainability 13 (13), 7267. doi: 10.3390/su13137267
Li Z., Wang J. (2022). The dynamic impact of digital economy on carbon emission reduction: Evidence city-level empirical data in China. J. Cleaner. Prod. 351, 131570. doi: 10.1016/j.jclepro.2022.131570
Liao Z., Ru S., Cheng Y. (2023). A Simulation Study on the impact of the digital economy on CO2 emission based on the system dynamics model. Sustainability 15 (4), 3368. doi: 10.3390/su15043368
Liu Y., Wang Q., Ban Y. (2023). Virtual agglomeration, konwledge structure and urban innovation. Finance. Trade. Econ. 44 (4), 89–105. doi: 10.19795/j.cnki.cn11-1166/f.2023.04.005
Liu J., Yu Q., Chen Y., Liu G. (2022). The impact of digital technology development on carbon emissions: A spatial effect analysis for China. Resour. Conserv. Recycling. 185, 106445. doi: 10.1016/j.resconrec.2022.106445
Luo X., Ren M., Zhao J., Wang Z., Ge J., Gao W. (2022). Life cycle assessment for carbon emission impact analysis for the ren-ovation of old residential areas. J. Cleaner. Prod. 367, 132930. doi: 10.1016/j.jclepro.2022.132930
Luo J., Yang J., Wan S., Zhao J., Liang J. (2023). Can energy conservation and emission reduction policies affect household carbon emissions? Evidence from China. Front. Energy Res. 11. doi: 10.3389/fenrg.2023.1138467
Ma Q., Tariq M., Mahmood H., Khan Z. (2022). The nexus between digital economy and carbon dioxide emissions in China: The moderating role of investments in research and development. Technol. Soc. 68, 101910. doi: 10.1016/j.techsoc.2022.101910
Na H., Sun J., Qiu Z., Yuan Y., Du T. (2022). Optimization of energy efficiency, energy consumption and CO2 emission in typical iron and steel manufacturing process. Energy 257, 124822. doi: 10.1016/j.energy.2022.124822
Noussan M., Tagliapietra S. (2020). The effect of digitalization in the energy consumption of passenger transport: An analysis of future scenarios for Europe. J. Cleaner. Prod. 258, 120926. doi: 10.1016/j.jclepro.2020.120926
Özbuğday F. C., Erbas B. C. (2015). How effective are energy efficiency and renewable energy in curbing CO2 emissions in the long run? A heterogeneous panel data analysis. Energy 82, 734–745. doi: 10.1016/j.energy.2015.01.084
Rising Lab, The. (2020). Ranking of cites’ business attractiveness in China 2020. Available at: https://www.datayicai.com/report/detail/213.
Schumpeter J. A. (1912). The theory of economic development. (Cambridge, MA: Harvard University Press).
Shahnazi R., Shabani Z. D. (2019). The effects of spatial spillover information and communications technology on carbon dioxide emissions in Iran. Environ. Sci. Pollut. Res. 26, 24198–24212. doi: 10.1007/s11356-019-05636-7
Shan Y., Guan Y., Hang Y., Zheng H., Li Y. (2022). City-level emission peak and drivers in China. Sci. Bull. 67 (18), 1910–1920. doi: 10.1016/j.scib.2022.08.024
Shen M., Chen H., Ying Y. (2022). Does business credit environment affect green total factor productivity? Zhejiang. Acad. J. 252 (1), 113–122. doi: 10.16235/j.cnki.33-1005/c.2022.01.014
Shen Y., Yang Z. (2023). Chasing green: The synergistic effect of industrial intelligence on pollution control and carbon reduction and its mechanisms. Sustainability 15 (8), 6401. doi: 10.3390/su15086401
Shen Y., Yang Z., Zhang X. (2023). Impact of digital technology on carbon emissions: Evidence from Chinese cities. Front. Ecol. Evol. 11. doi: 10.3389/fevo.2023.1166376
Shen Y., Zhang X. (2023). Intelligent manufacturing, green technological innovation and environmental pollution. J. Innovation Knowledge 8 (3), 100384. doi: 10.1016/j.jik.2023.100384
Shi J., Yu C., Wang T. (2022). Does green financial policy affect debt-financing cost of heavy-polluting enterprises? An empirical evidence based on Chinese pilot zones for green finance reform and innovations. Technol. Forecasting. Soc. Change 179, 121678. doi: 10.1016/j.techfore.2022.121678
State Council of the People's Republic of China, The. (2008). Several opinions of The State Council on promoting the sustainable development of resource-based cities. Available at: https://www.gov.cn/zhengce/content/2008-03/28/content_4941.htm.
Sun J., Wu X. (2023). Research on the mechanism and countermeasures of digital economy development promoting carbon emission reduction in jiangxi province. Environ. Res. Commun. 5 (3), 035002. doi: 10.1088/2515-7620/acbd8b
Tajudeen I. A., Wossink A., Banerjee P. (2018). How significant is energy efficiency to mitigate CO2 emissions? Evidence from OECD countries. Energy Econ. 72, 200–221. doi: 10.1016/j.eneco.2018.04.010
Tao F., Zhu P., Qiu C., Wang X. (2023). The impact of digital technology innovation on enterprise market value. J. Quantitative. Technol. Econ. 40 (5), 40(5):68–91. doi: 10.13653/j.cnki.jqte.20230310.010
Vărzaru A. A. (2022). An empirical framework for assessment of the effects of digital technologies on sustainability accounting and reporting in the European Union. Electronics 11 (22), 3812. doi: 10.3390/electronics11223812
Wang L., Chen L. (2023). Impacts of digital economy agglomeration on carbon emission: A two-tier stochastic frontier and spatial decomposition analysis of China. Sustain. Cities. Soc. 95, 104624. doi: 10.1016/j.scs.2023.104624
Wang L., Chen Y., Ramsey T. S., Hewings G. J. (2021). Will researching digital technology really empower green development? Technol. Soc. 66, 101638. doi: 10.1016/j.techsoc.2021.101638
Wang H., Li Y., Lin W., Wei W. (2023). How does digital technology promote carbon emission reduction? Empirical evidence based on e-commerce pilot city policy in China. J. Environ. Manage. 325, 116524. doi: 10.1016/j.jenvman.2022.116524
Wang R., Liang Q. (2022). Realistic foundation and application of virtual agglomeration in digital economy. J. Chang'an. Univ. (Social. Sci. Edition). 24 (4), 34–52. doi: 10.3969/j.issn.1671-6248.2022.04.004
Wang J., Ma W., Zhang J., Zhao X. (2023). Impacts of digital technology on energy sustainability: China case study. Appl. Energy 323, 119329. doi: 10.1016/j.apenergy.2022.119329
Wang P., Wu W., Zhu B., Wei Y. (2013). Examining the impact factors of energy-related CO2 emissions using the STIRPAT model in Guangdong Province, China. Appl. Energy 106, 65–71. doi: 10.1016/j.apenergy.2013.01.036
Wen H., Liang W., Lee C. (2022). Urban broadband infrastructure and green total-factor energy efficiency in China. Utilities. Policy 79, 101414. doi: 10.1016/j.jup.2022.101414
World Bank. (2022). World Bank Open Data. Available at: https://data.worldbank.org.cn/indicator?tab=all.
Wu J., Guo Z. (2016). Research on the convergence of carbon dioxide emissions in China: A continuous dynamic distribution approach. Stat. Res. 33 (1), 54–60. doi: 10.19343/j.cnki.11-1302/c.2016.01.008
Xu T., Kang C., Zhang H. (2022). China's efforts towards carbon neutrality: Does energy-saving and emission-reduction policy mitigate carbon emissions? J. Environ. Manage. 316, 115286. doi: 10.1016/j.jenvman.2022.115286
Xu A., Wang W., Zhu Y. (2023). Does smart city pilot policy reduce CO2 emissions from industrial firms? Insights from China. J. Innovation Knowledge 8 (3), 100367. doi: 10.1016/j.jik.2023.100367
Yang Z., Gao W., Han Q., Qi L., Cui Y., Chen Y. (2022). Digitalization and carbon emissions: How does digital city construction affect China's carbon emission reduction? Sustain. Cities. Soc. 87, 104201. doi: 10.1016/j.scs.2022.104201
Yang H., Li X., Ma L., Li Z. (2021). Using system dynamics to analyse key factors influencing China's energy-related CO2 emissions and emission reduction scenarios. J. Cleaner. Prod. 320, 128811. doi: 10.1016/j.jclepro.2021.128811
Yi M., Liu Y., Sheng M., Wen L. (2022). Effects of digital economy on carbon emission reduction: New evidence from China. Energy Policy 171, 113271. doi: 10.1016/j.enpol.2022.113271
Yi X., Zhou L. (2018). Does digital financial inclusion significantly influence household consumption? Evidence from household survey data in China. J. Financial. Res. 461 (11), 47–67.
Yılmaz A. (2023). Carbon emissions effect of trade openness and energy consumption in Sub-Saharan Africa. SN. Business. Econ. 3 (2), 41. doi: 10.1007/s43546-022-00380-6
Yu B. (2017). How does industrial restructuring improve regional energy efficiency? An empirical study based on two dimensions of magnitude and quality. J. Finance. Econ. 43 (1), 86–97. doi: 10.16538/j.cnki.jfe.2017.01.008
Yu L., Wang Y., Wei X., Zeng C. (2023). Towards low-carbon development: The role of industrial robots in decarbonization in Chinese cities. J. Environ. Manage. 330, 117216. doi: 10.1016/j.jenvman.2023.117216
Yuan L., Ding L., He W., Kong Y., Ramsey T. S., Degefu D. M., et al. (2023). Compilation of water resource balance sheets under unified accounting of water quantity and quality, a case study of Hubei province. Water 15 (7), 1383. doi: 10.3390/w15071383
Zhang H. (2023). Pathways to carbon neutrality in major exporting countries: the threshold effect of digital transition. Environ. Sci. Pollut. Res. 30, 7522–7542. doi: 10.1007/s11356-022-22592-x
Zhang J., Fu K., Liu B. (2022). Can digital economy promote low-carbon transformation of cities from the perspective of dual objective constraint. Modern. Finance. Economics-J. Tianjin. Univ. Finance. Econ. 42 (8), 3–23. doi: 10.19559/j.cnki.12-1387.2022.08.002
Zhang K., Li S., Qin P., Wang B. (2022). Spatial and temporal effects of digital technology development on carbon emissions: Evidence from China. Sustainability 15 (1), 485. doi: 10.3390/su15010485
Zhang Q., Ru S. (2021). Research on the path of new digital infrastructure to promote virtual agglomeration of modern service industry. Inq. into Econ. Issues 468 (7), 123–135.
Zhang J., Song M., Liu B. (2021). Current situation of carbon dioxide emission and suggestions for emission reduction in China. Natural Resource. Econ. China 4, 38–44. doi: 10.19676/j.cnki.1672-6995.000685
Zhang S., Wei X. (2019). Does information and communication technology reduce enterprise’s energy consumption—Evidence from Chinese manufacturing enterprises survey. China Ind. Econ. 371 (2), 155–173. doi: 10.19581/j.cnki.ciejournal.2019.02.013
Zhang W., Xu Y., Jiang L., Streets D. G., Wang C. (2023). Direct and spillover effects of new-type urbanization on CO2 emissions from central heating sector and EKC analyses: Evidence from 144 cities in China. Resour. Conserv. Recycling. 192, 106913. doi: 10.1016/j.resconrec
Zhang Q., Zhang F., Mai Q. (2022). Robot adoption and green productivity: Curse or boon. Sustain. Prod. Consumption. 34, 1–11. doi: 10.1016/j.spc.2022.08.025
Zhao C., Liu Z., Yan X. (2023). Does the digital economy increase green TFP in cities? Int. J. Environ. Res. Public Health 20, 1442. doi: 10.3390/ijerph20021442
Zhao T., Zhang Z., Liang S. (2020). Digital economy, entrepreneurship, and high-quality economic development: Empirical evidence from urban China. J. Manage. World 36 (10), 65–76. doi: 10.19744/j.cnki.11-1235/f.2020.0154
Keywords: digital technology, carbon neutrality, energy efficiency, green technology innovation, virtual agglomeration, technology diffusion
Citation: Liu H, Wang L and Shen Y (2023) Can digital technology reduce carbon emissions? Evidence from Chinese cities. Front. Ecol. Evol. 11:1205634. doi: 10.3389/fevo.2023.1205634
Received: 14 April 2023; Accepted: 28 July 2023;
Published: 28 August 2023.
Edited by:
Jian Yu, Central University of Finance and Economics, ChinaReviewed by:
Liang Yuan, China Three Gorges University, ChinaHuwei Wen, Nanchang University, China
Xiaodong Yang, Xinjiang University, China
Copyright © 2023 Liu, Wang and Shen. This is an open-access article distributed under the terms of the Creative Commons Attribution License (CC BY). The use, distribution or reproduction in other forums is permitted, provided the original author(s) and the copyright owner(s) are credited and that the original publication in this journal is cited, in accordance with accepted academic practice. No use, distribution or reproduction is permitted which does not comply with these terms.
*Correspondence: Yang Shen, eWFuZ3M5OTZAZm94bWFpbC5jb20=