 Chiqun Hu1
 Lan Yang
 Qiangyi Li
94% of researchers rate our articles as excellent or good
Learn more about the work of our research integrity team to safeguard the quality of each article we publish.
Find out more
ORIGINAL RESEARCH article
Front. Ecol. Evol. , 28 July 2023
Sec. Urban Ecology
Volume 11 - 2023 | https://doi.org/10.3389/fevo.2023.1202898
This article is part of the Research Topic Evaluation of Urban Ecological Security and Measurement of Urban Ecological Resilience View all 18 articles
Introduction: Pollution reduction, carbon reduction, green expansion and economic growth—the synergistic effects of the four—have become essential in maintaining urban ecological security and promoting a green and low-carbon transition. And it is inherently consistent with the globally accepted concept of sustainable development.
Methods: Based on the evaluation index system and the coupling mechanism of the four, we adopt the entropy method and the coupling coordination model to measure the synergistic level of “pollution reduction, carbon reduction, green expansion and economic growth” in 243 cities above prefecture level in China from 2005 to 2020. Furthermore, the study examined the temporal and spatial evolution and regional differences by utilizing the center of gravity-standard deviation ellipse, Dagum Gini coefficient method, Kernel density estimation, and Markov chain. In addition, the spatial econometric model was used to analyze the driving factors affecting the synergistic development.
Results: The results show that the overall synergistic level is rising, the spatial distribution characteristics of “high in the east and low in the west.” The standard deviation ellipse shows a “northeast–southwest” pattern, and the center of gravity moves in a “southeast–northwest–southwest” migration trend. Regional differences are mainly rooted in inter-regional differences. The intra-regional differences are East > West > Central, with the most prominent East–West inter-regional differences. Without considering the spatial factor, the synergistic level shows a steady increase and has continuity. Under the spatial condition, the synergistic level has a positive spatial correlation. However, the positive spatial correlation decreases significantly as the years go by. Also, the probability of “rank locking” of synergistic development has been reduced, and there is a leapfrog shift. In terms of driving factors, the innovation level, level of external openness, population size, and industrial structure positively drive synergistic development. While government intervention negatively affects synergistic development.
Discussions: Based on the above findings,policy recommendations are proposed to strengthen the top-level design and build a policy system, play the radiation linkage, apply precise policies according to local conditions, and optimize the industrial structure fully. Which is of great significance for improving the urban ecological resilience and helping to achieve the “double carbon” target.
Protecting the environment and developing the economy are two important issues in UN Sustainable Development Goals (SDGs), and they have become a severe challenge that all countries in the world must face together (Xie et al., 2021; Zou, 2021; Li and Yanase, 2022). Since the second half of the twentieth century, continued population expansion and a crude economic development model have led to the over-consumption of natural resources and frequent global environmental events (Zahoor et al., 2022; Qi et al., 2023). Currently, the climate crisis (Klinenberg et al., 2020; Wang and Feng, 2023), energy shortage (Qureshi et al., 2016; Nepal and Paija, 2019), public health events (Bai et al., 2021; Dang and Trinh, 2021), environmental inequality (Boyce et al., 2016), and a range of ecological safety issues intersect with economic growth. In this context, it has already threatened human survival and development and puts the achievement of SDGs at risk (Mallucci, 2022). The core of sustainable development strategy is to promote human social development in harmony with protecting natural resources and the ecological environment, which is gradually reaching consensus in countries around the world (Holland et al., 2020; Cheng et al., 2022). But, the sudden decline in the carrying capacity of the resources and environment, coupled with the decline in ecological resilience and vulnerability, has led to a more prominent conflict between the resources and environment and economic development. China, the world’s largest developing country and the second-largest economy, has become essential in promoting sustainable and healthy global development (Qiao et al., 2019). The construction of China's ecological civilisation has entered a critical period in which economic and social, ecological and environmental benefits are being promoted in concert. The core task of urban ecological protection has gradually shifted to enhancing ecological resilience. And, improving the ecological resilience and environmental carrying capacity of cities has become an important element of sustainable urban development. China’s economy exceeded 110 trillion yuan, making it the number one driver of world economic growth in 2021. However, China still faces enormous socioeconomic and environmental pressures, such as regional and income inequality, resource shortages, and air pollution (Xu et al., 2020; Ren et al., 2021). China is also currently the world’s largest emitter of carbon dioxide (CO2) (Lin and Sun, 2010; Yang et al., 2020).
In the face of this serious situation, in order to solve the complex problems in the ecological environment and economic development, China has struggled to find pathways to achieve the SDGs that are appropriate to its specific conditions (Wang et al., 2018; Fan et al., 2021; Zhu et al., 2023). In 1994, China began the process of sustainable development in response to Agenda 21 for Action and the Rio Declaration (Bradbury and Kirkby, 1996). China has also incorporated “ecological civilization construction” into the “Five-Sphere Integrated Plan,” “green” into the new development concept, and “pollution prevention and control” into the three critical battles as a Chinese practice of sustainable development. In addition, China has also responded positively to the UN 2030 Agenda for Sustainable Development (UN, 2015; Zhang and Zhong, 2023). China has resolutely declared war on environmental pollution and has been hailed as the fastest country in the world to tackle air pollution. In 2020, in response to climate change, China proposed the strategic goal of “striving to peak CO2 emissions by 2030 and achieving carbon neutrality by 2060” (Sun et al., 2022; Zhuo et al., 2022). Environmental pollutants and greenhouse gas emissions have a high degree of homogeneity, process characteristics, and spatial and temporal emission consistency, which means that China faces the challenge of synergistic promotion of pollution reduction and carbon reduction. "Resilient Cities" has also been written into the 14th Five-Year Plan (2021–2025) National Economic and Social Development and the Long-Range Objectives Through the Year 2035. Ecological resilience is an important dimension of urban resilience, and it is vital to consolidate the ecological base of green development. With a further deepening the understanding of the high-quality development, the 20th National Congress of the Communist Party of China put forward the concept of “pollution reduction, carbon reduction, green expansion and economic growth.” It is an inevitable requirement for following the economic laws of development, showing the direction for better integration of ecological civilization construction and economic and social development, which is intrinsically consistent with the globally recognized concept of sustainable development (Xia and Xu, 2020; Wang et al., 2022). The construction of China’s ecological civilization has entered a critical period in which economic, social, ecological, and environmental benefits are being promoted in concert. The synergistic promotion of pollution reduction, carbon reduction, green expansion and economic growth is also a profound response to the widely recognized concept of sustainable development from China’s reality and further concretizes sustainable development. However, the synergistic development of pollution reduction, carbon reduction, green expansion and economic growth is still relatively abstract concepts at this stage. Also, there is an urgent need to establish an evaluation index system and propose metric indicators with a scientific basis so that the construction of pollution reduction, carbon reduction, green expansion and economic growth systems is operable and assessable.
In view of this, this study explores the temporal-spatial patterns and synergistic drivers of pollution reduction, carbon reduction, green expansion and economic growth. First, a comprehensive evaluation index system of pollution reduction, carbon reduction, green expansion and economic growth is constructed with 243 cities from 2005 to 2020 as the research sample. The indexes are objectively assigned weights by the entropy value method, and measuring the synergistic level of “pollution reduction, carbon reduction, greening and growth” using the coupling coordination degree model. The spatial and temporal distribution pattern of the the synergistic level is also depicted by applying the center of gravity-standard deviation ellipse. In addition, the Dagum Gini coefficient is used to reveal the regional differences and sources of the coordination degree. Furthermore, the Kernel density and spatial Markov chains are used to reveal the dynamic evolutionary trend of the level of synergistic development. Finally, a spatial econometric model is used to identify the driving forces of the synergistic level. The marginal contributions of this paper may be reflected in the following three aspects. Firstly, from the perspective of goal setting of synergistic management, pollution reduction, carbon reduction, green expansion and economic growth are integrated into the same analytical framework. And, this study analyzed synergistic development mechanism, which helps to provide a new entry point for the synergistic promotion between pollution prevention and control, greenhouse gas reduction, ecological protection and socio-economic construction. Secondly, it reveals the spatial-temporal patterns and regional differences in the synergistic promotion of pollution reduction, carbon reduction, green expansion and economic growth, and portrays their evolutionary trends from a more detailed dynamic perspective, thus contributing to the formulation of differentiated joint prevention and policies. Thirdly, it attempts to clarify the factors affecting the synergistic promotion of pollution reduction, carbon reduction, green expansion and economic growth, identify the spatial spillover effects of the influencing factors, and make a more scientific study of the driving mechanisms at the spatial level.
The remainder of this study is organized as follows: Section 2 is a literature review and synergistic mechanism analysis of pollution reduction, carbon reduction, green expansion and economic growth. Section 3 is the research design and data sources. Section 4 is the results of the empirical analysis. Section 5 presents the conclusions and discussions. The research framework is shown in Figure 1.
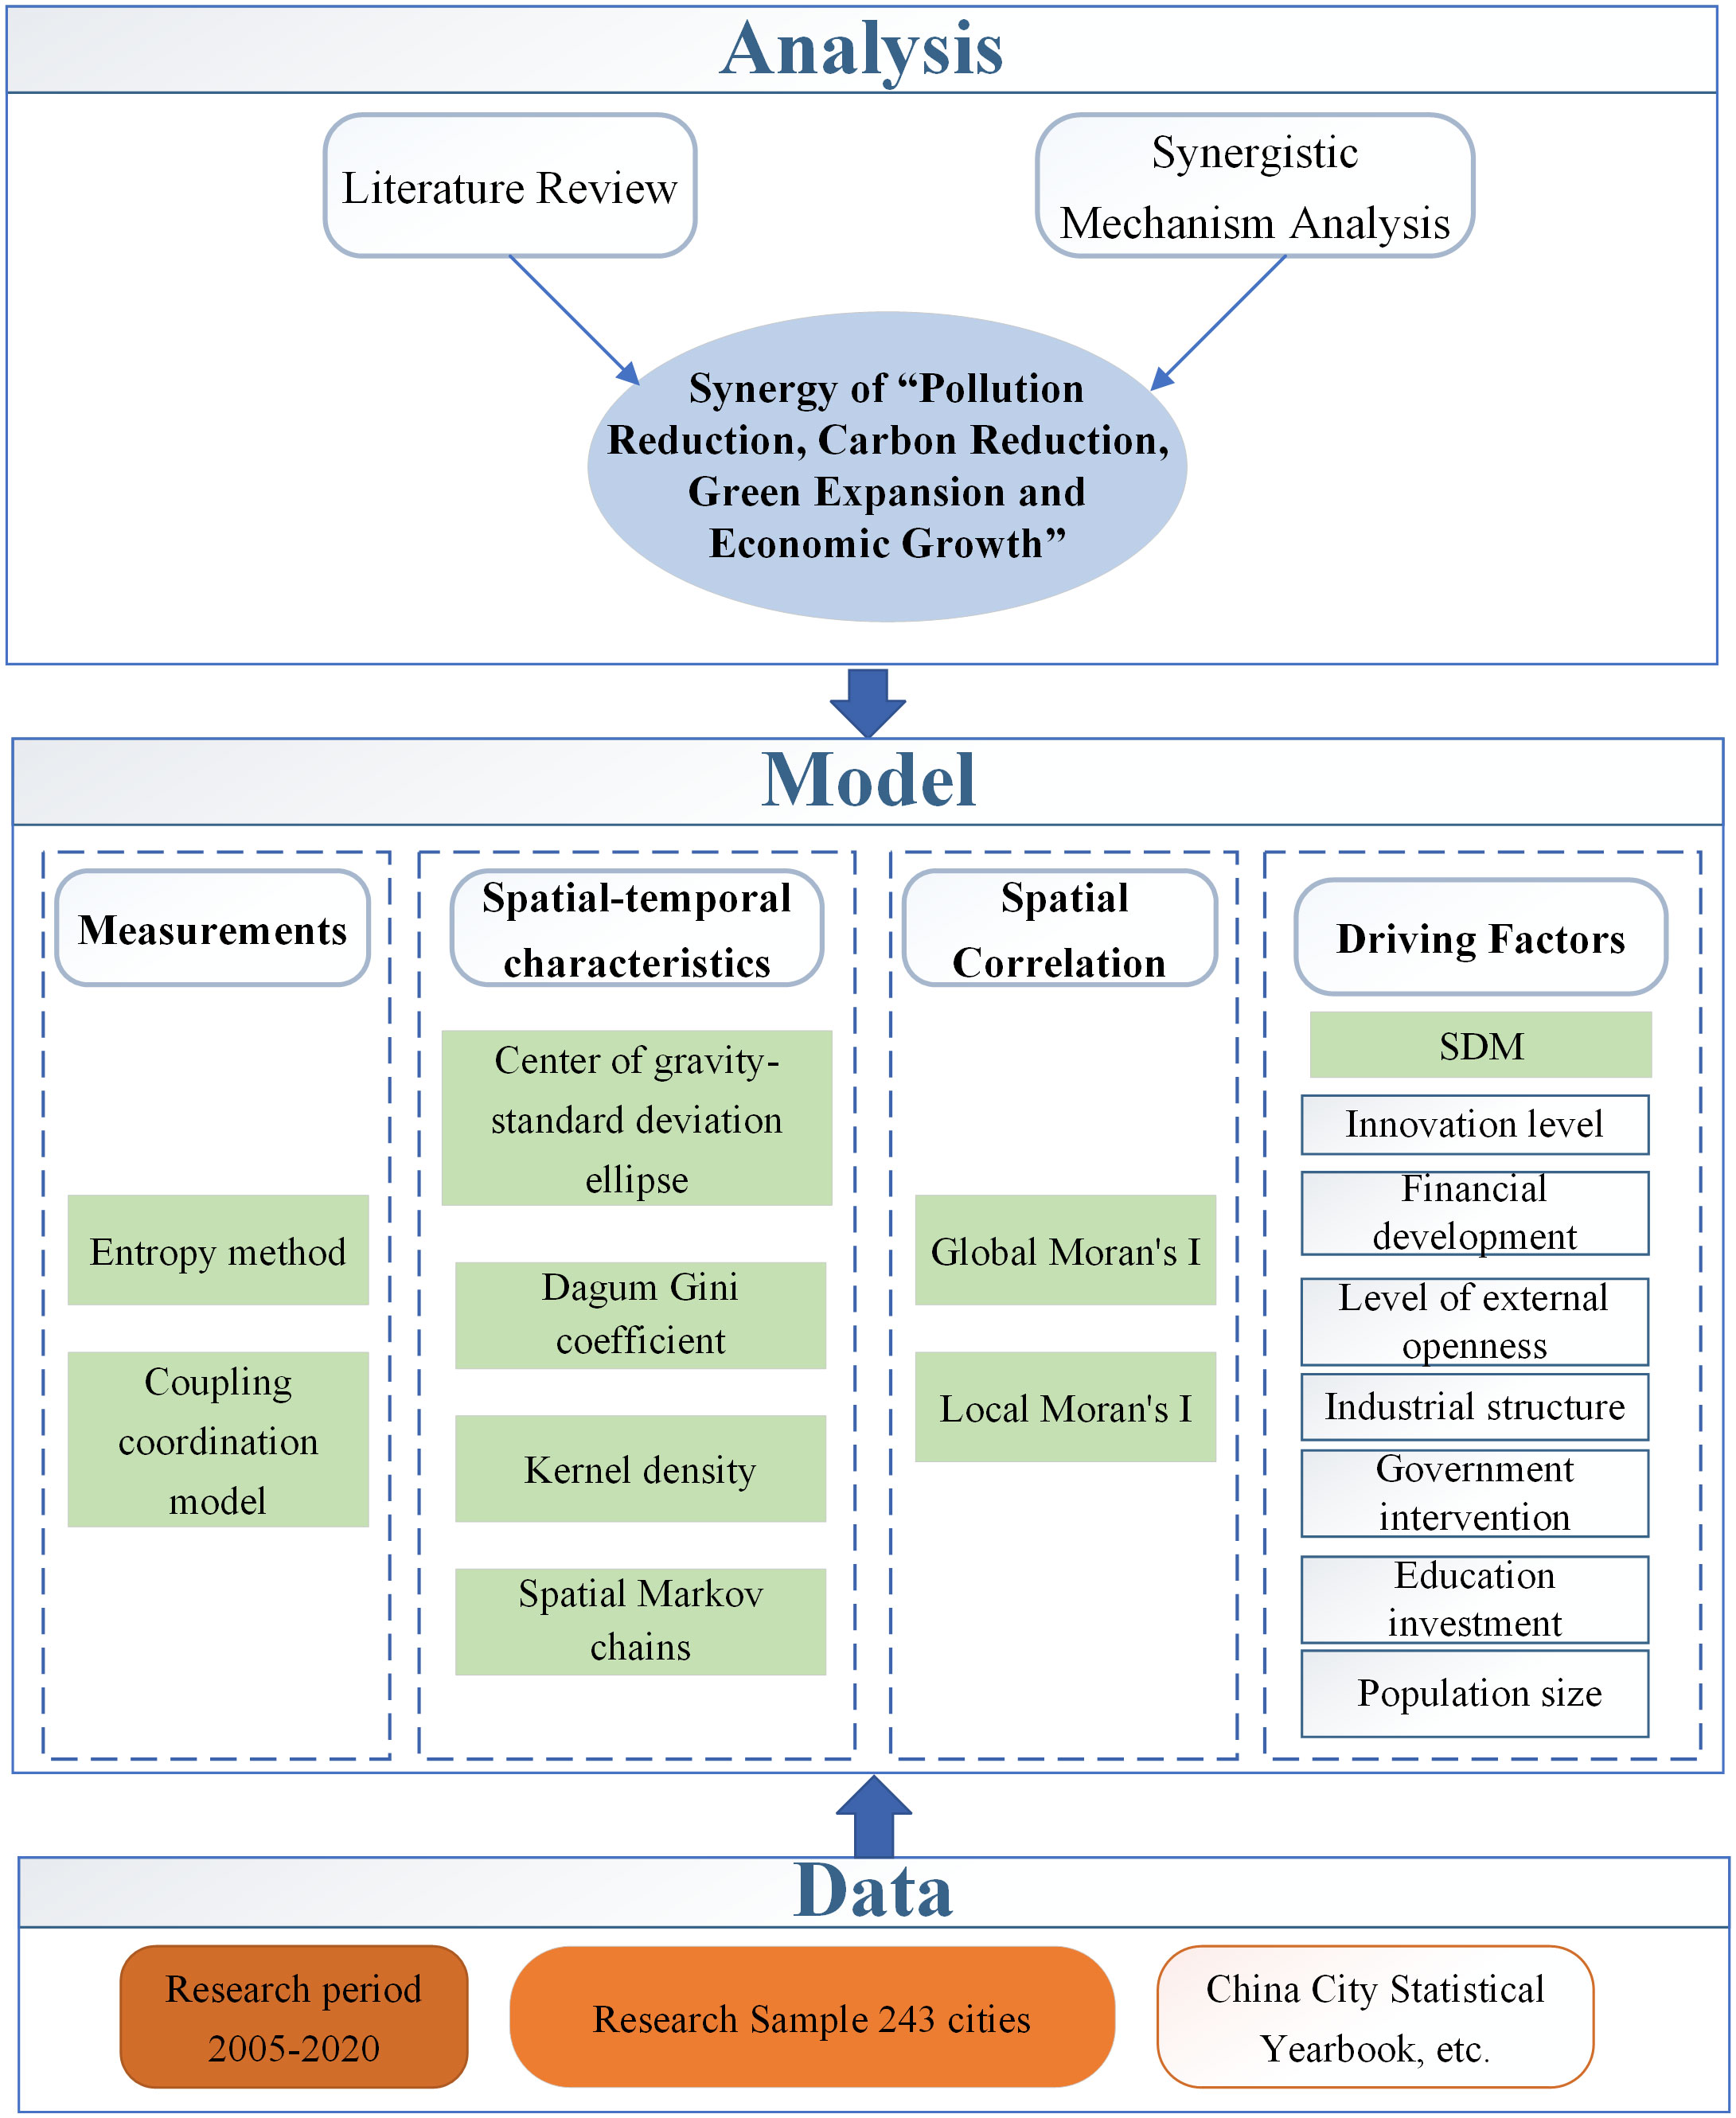
Figure 1 Research framework.
Studies on the synergistic promotion of pollution reduction, carbon reduction, green expansion and economic growth have received great academic attention. The literature related to this study can be divided into the following three categories for review.
The first category of literature concerns the relationship between the ecological environment and economic development. A large number of scholars have analyzed the effects of economic growth on air pollution emissions, or carbon emissions (Grossman and Krueger, 1995; Song et al., 2018; Rao and Yan, 2020), an issue on which there are two controversial academic views. One view claims that economic growth causes an increase in air pollution emissions, or carbon emissions (Mardani et al., 2019; Wang et al., 2021). Different curves or an inverted U-shaped relationship between economic development and environmental quality (Dinda, 2004; Orubu and Omotor, 2011; Ali et al., 2021), but it may not be a single inverted U-shaped curvilinear relationship either (Xu et al., 2022), maybe it could be an N or inverted N-shaped (Özokcu and Özdemir, 2017), and also vary by region and by stage of economic development (Almeida et al., 2017; Chen et al., 2018). The other view is that the level of economic development significantly contributes to environmental governance (Li and Gan, 2021). However, economic development and environmental governance are causally linked, especially, environmental governance also has an impact on economic development and the channels of impact are more diverse. They can be achieved through environmental regulatory policies (Liu et al., 2022a; Zhao et al., 2022), environmental tax rates (Abdullah and Morley, 2014; Fan et al., 2021), river chief and lake chief system (Liu et al., 2019; Tang et al., 2020), social capital mechanisms (Muringani et al., 2021), and synergistic mechanisms for green development (Deng et al., 2021), which affect economic growth. Another strand of literature focuses on the relationship between ecological construction and economic development, with most studies supporting the view that the two are mutually reinforcing. Economic agglomeration and eco-efficiency are positively correlated in terms of spatial distribution (Jin et al., 2020), and the spatial distribution pattern of urban greenery is influenced by economic development (Li et al., 2018). Meanwhile, ecological construction positively promotes economic development. The larger the area of public green space in the city, the more efficient the highly skilled employees are, which in turn increases the productivity of the enterprise (Yang et al., 2023). The most direct impact of green space is to increase the price of real estate (Du and Zhang, 2020).
The second category of literature focuses on the synergistic governance of pollution and carbon reduction. With the national arrangement and deployment of carbon peaking and carbon neutrality (“double carbon”), China’s ecological and environmental management has entered a new stage of comprehensive integration and synergistic management of pollution reduction and carbon reduction (Nam et al., 2014; Jiang et al., 2020). The theories and methods of system synergy have reached maturity, and synergy is the dynamic competition, cooperation, coordination, and synergy of internal components and subsystems, which in turn drives the transformation of a complex system from disorder to order (Haken et al., 1995). The synergistic effect refers to the phenomenon that implementing a pollutant reduction measure generates other environmental benefits. Accurate analysis of the synergistic benefits of pollution reduction and carbon reduction is a prerequisite for the study, and the main methods currently used are the system dynamics approach (Chen et al., 2023), scenario analysis (Liu et al., 2022b), cost-effective approaches (Jiang et al., 2020), panel regression models (Dong et al., 2022), and LMDI (Jia et al., 2023). Furthermore, exploratory spatial analysis (Xue et al., 2023) has been used to analyze the spatial correlation and regional differences between pollution reduction and carbon reduction. In contrast to the above literature, scholars have assessed the pollution reduction effect of carbon emission reduction policies on the one hand. Burtraw et al. (2003) found that initiatives in the power sector to mitigate the accumulation of greenhouse gases in the atmosphere also reduced traditional air pollutants. On the one hand, the effect of air control policies on carbon emission reduction is assessed, and Xu and Masui (2009) confirmed the carbon reduction benefits associated with relevant SO2 policies. Air pollution prevention and control measures such as the Blue-Sky Action Plan (Shu et al., 2022) contribute to the reduction of CO2 emissions while combating air pollutants, and the discounted benefits of reducing local air pollution far outweigh the benefits of mitigating global climate change (Bollen et al., 2009).
The third category of literature deals with studies on the factors influencing pollution reduction, carbon reduction, green expansion and economic growth. Reducing pollution and carbon emissions is often not determined by a single factor, so scholars have attempted to reveal the driving forces of the synergy of pollution reduction and carbon reduction at multiple scales (Gu et al., 2018; He et al., 2022; Hou et al., 2023) and found that the key factors influencing pollution reduction and carbon reduction differ across urban agglomerations. The narrowing of the urban–rural income gap significantly promotes pollution control and has carbon reduction benefits for the whole country and the central and western regions, but increases carbon emissions in the eastern region (Wang and Zhang, 2021). In addition, the digital economy has become an important component of regional economic growth; comprehensive experimental zones for big data can help achieve synergy in reducing pollution and carbon, especially in small and medium-sized cities and cities with old industrial bases (Hu, 2023). Existing studies generally agree that the main factors affecting the synergistic promotion of pollution and carbon reduction are energy mix, population, and technology (Yu et al., 2020). With the rapid development of society, the factors influencing the harmonious development of the economy and environment have gradually become the focus of close attention. Scholars have introduced green efficiency metric models and regression models to analyze the impact of financial development on economic growth and environmental protection in a unified framework (Yue et al., 2018). In addition, by developing an interaction model to analyze the interaction between economic growth and environmental pollution, Empirical Evidence shows that the main factors affecting economic growth are industrial wastewater emissions, industrial emissions, industrial smoke, and dust emissions, and the interaction between industrial emissions and industrial wastewater emissions inhibits economic growth (Rao and Yan, 2020). Currently, urbanization is a powerful driver to foster economic growth, and studies have shown the existence of an environmental Kuznets inverse U curve between urbanization, economic growth, and environmental pollution (Liang and Yang, 2019). Ongan et al. (2023) calculated the optimal level of government spending for the Mexican government from the perspective of public spending, therefore, the government should have coordinated and sustainable public spending policies to promote economic growth and a cleaner environment.
Through reviewing the literature, the research on the synergistic promotion of pollution reduction, carbon reduction, green expansion and economic growth has been fruitful. However, there is still room for improvement, as follows: Firstly, the existing literature mainly focuses on the synergistic development between the two systems, such as pollution reduction and carbon reduction. but there are few studies based on the synergy of pollution reduction, carbon reduction, green expansion and economic growth and incorporating them into the same analytical framework. Most of the relevant studies are at the stage of theoretical discussion and exposition. Secondly, there is a lack of analysis of the current status of the synergies between pollution reduction, carbon reduction, green expansion and economic growth at the city scale, especially from a dynamic perspective. Thirdly, there is a lack of research on the new initiative of exploring the driving force of the synergistic promotion of pollution reduction, carbon reduction, green expansion and economic growth, and the existing studies have neglected the spatial correlation. To this end, this paper constructs an evaluation index system for the synergistic promotion of pollution reduction, carbon reduction, green expansion and economic growth. And, this paper explores the spatial distribution pattern and evolutionary characteristics of the coupled coordination of pollution reduction, carbon reduction, green expansion and economic growth in Chinese cities, and further reveals its influencing factors.
Ecological and environmental protection is the foundation of economic and social development, planting green undertones for high-quality economic development. At the same time, stable economic growth is an inevitable requirement for ecological civilization construction, which also provides sufficient financial and technical support for green and low-carbon urban development. Generally, protecting the ecological environment and promoting economic development are essentially organic, unified, and mutually reinforcing. Synergistic promotion of pollution reduction, carbon reduction, green expansion and economic growth is the “Pareto optimum” to achieve multiple pollution control goals, climate change response, ecological protection, and economic growth. It is necessary to understand the synergy between pollution reduction, carbon reduction, green expansion and economic growth in terms of three dimensions: objectives, pathways, and subjective synergy. The theoretical framework is shown in Figure 2.
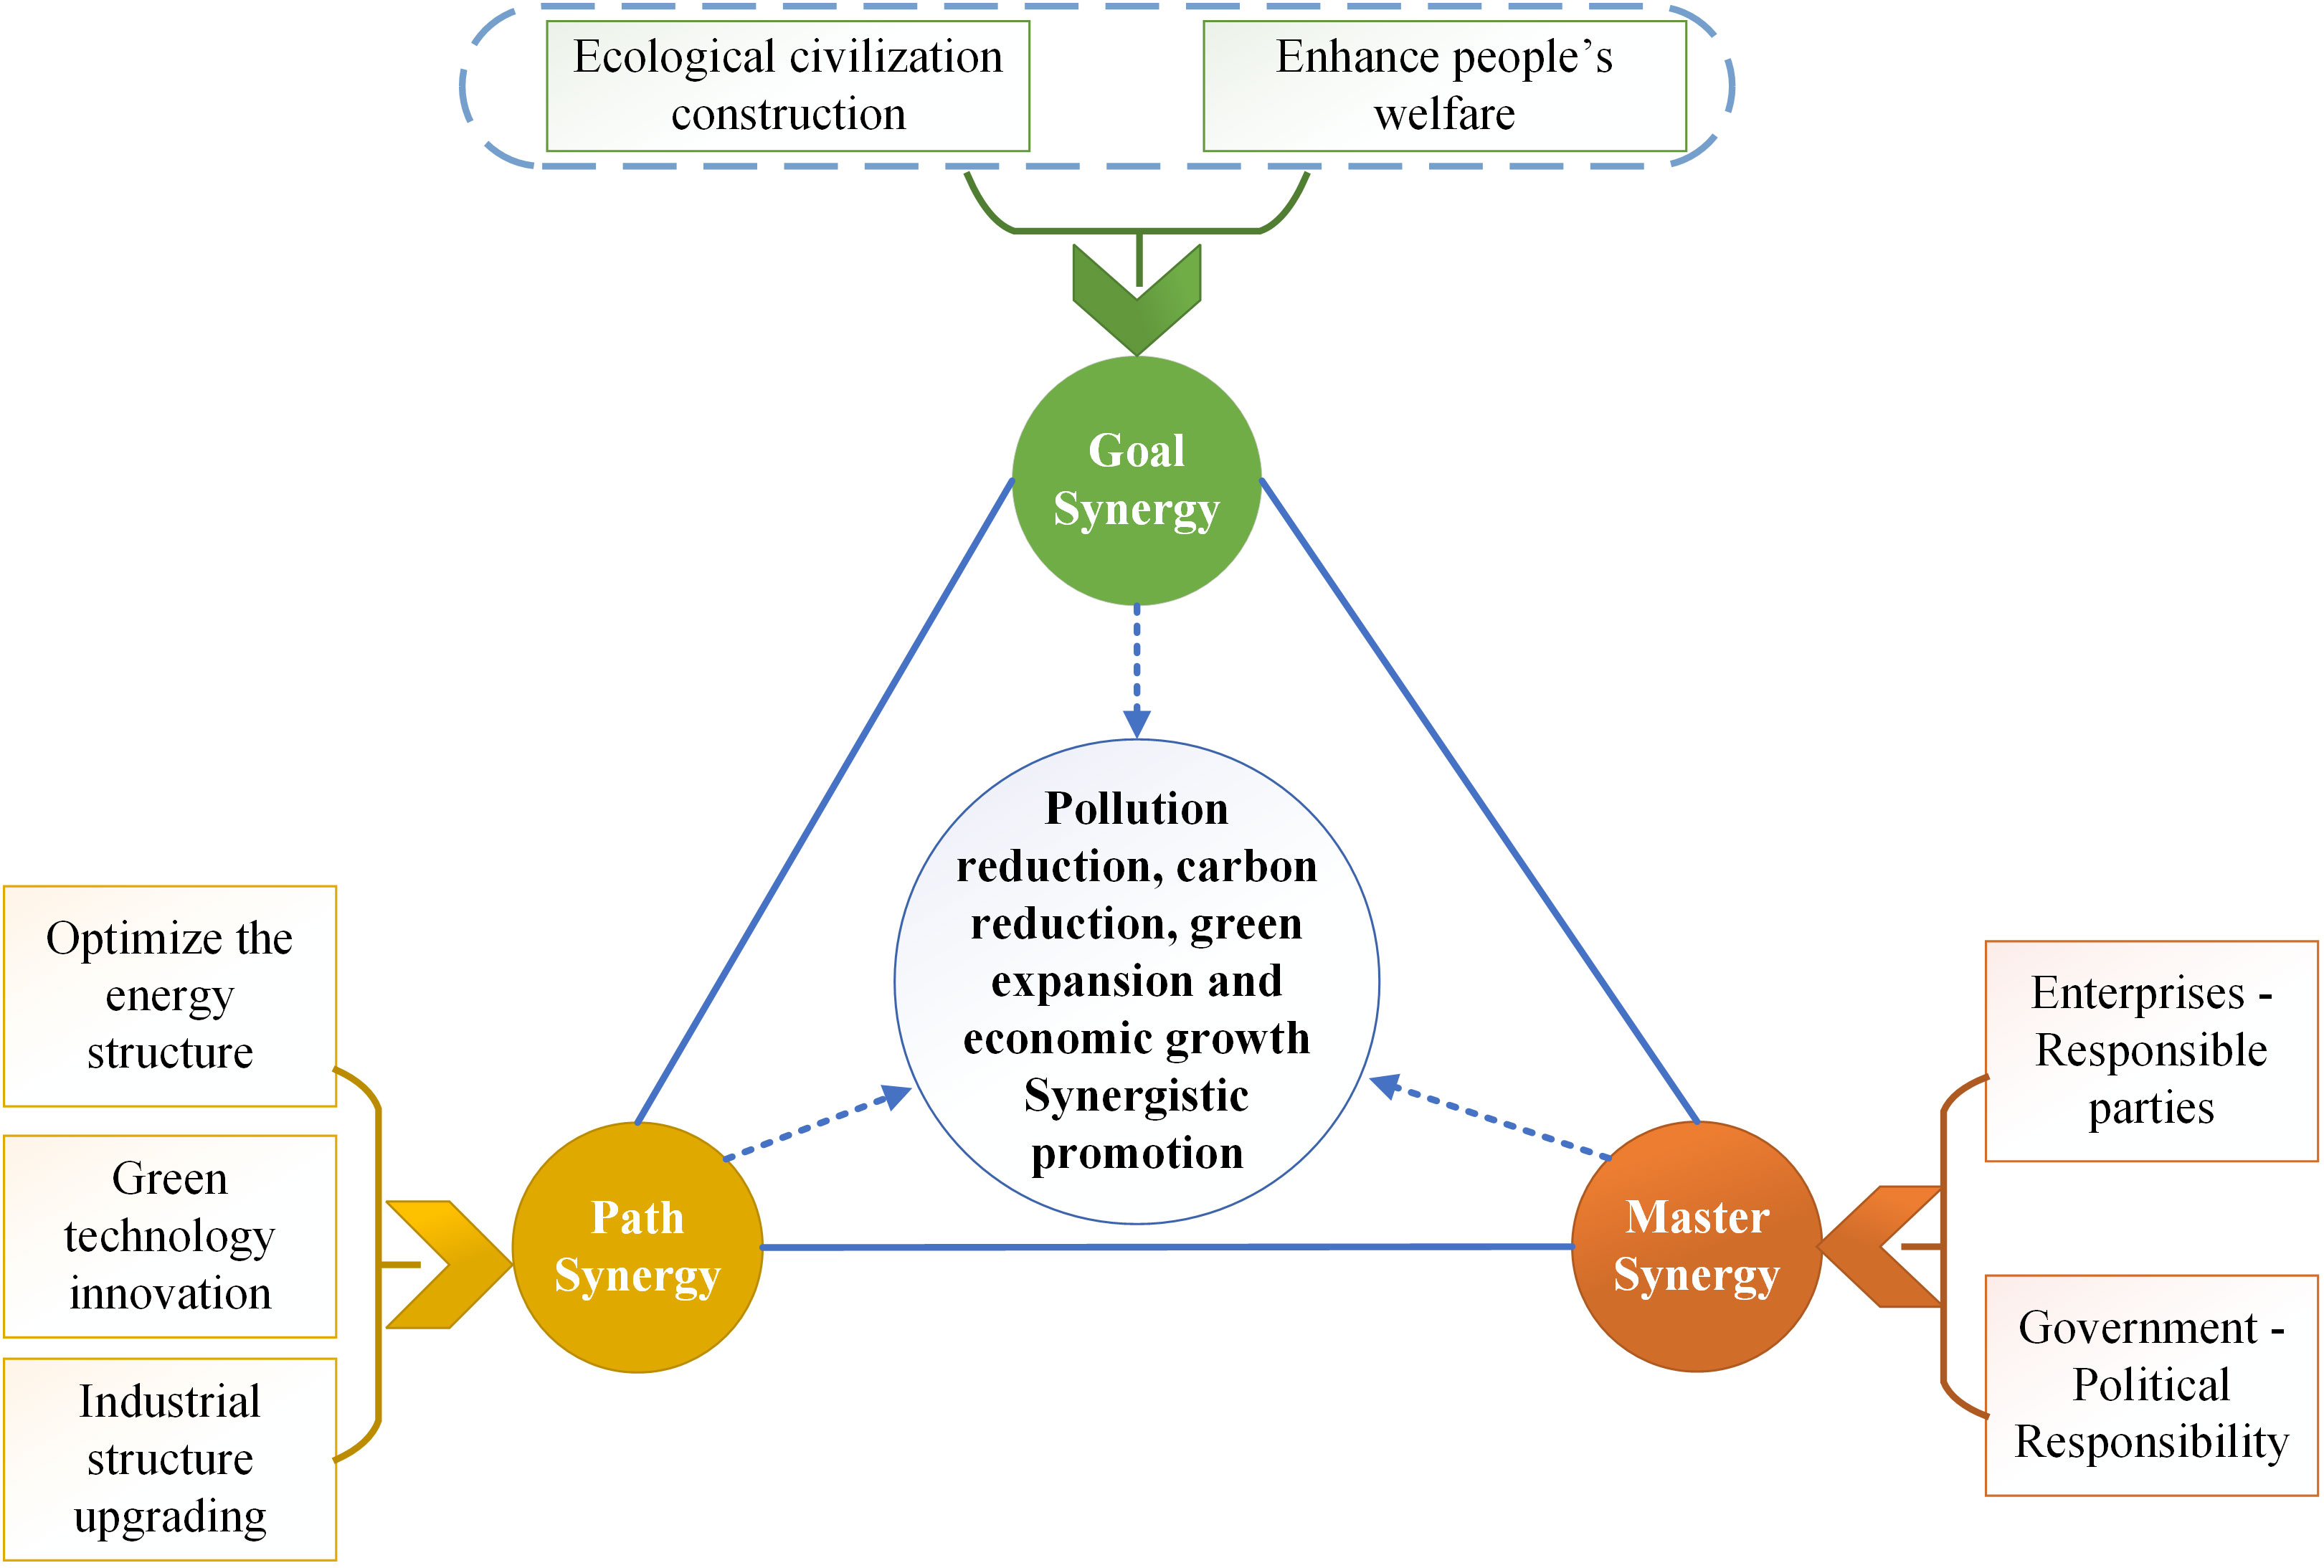
Figure 2 Coupled synergistic mechanism of “pollution reduction, carbon reduction, green expansion and economic growth”.
First, the goal of pollution reduction, carbon reduction, green expansion and economic growth is synergistic. In terms of its connotation, “carbon reduction” is about reducing pollutant emissions at source, reducing the proportion of a high-carbon economy, and increasing a low-carbon economy. “Pollution reduction” focuses on improving the quality of the ecological environment and developing a green economy. “Green expansion” is characterized by enhancing carbon sink capacity and ecological resilience, improving ecosystem diversity and stability, and strengthening biodiversity conservation. “Economic growth” means that economic development is based on a high level of ecological and environmental protection so as to achieve effective qualitative improvement and reasonable quantitative growth. Pollution reduction, carbon reduction, green expansion and economic growth are promoted in a concerted manner around achieving high-quality development, seeking a dynamic balance among the multiple objectives of economic and social development so as to form a spatial pattern of resource conservation and environmental protection and promoting a comprehensive green transformation of ecological environmental protection and economic development. Reducing pollutant and carbon emissions and improving ecological and environmental quality are all visionary goals of ecological civilization construction, which constantly meets the environmental needs of the people for a better life. From the perspective of individual health, deteriorating environmental quality substantially reduces health while inevitably causing economic losses (Guerriero et al., 2016). In turn, economic growth is a prerequisite for securing and improving the well-being of people. Regarding fundamental goals, pollution reduction, carbon reduction, green expansion and economic growth are tasks for sustainable and healthy economic and social development, responding to the people-centered development ideology. To this end, the principles of integration and balance should be upheld, and the synergy of pollution reduction, carbon reduction, green expansion and economic growth should be adhered to achieve unified planning, unified deployment, unified implementation, and unified acceptance and realize the fundamental goals in multiple objectives.
Second, the paths of pollution reduction, carbon reduction, green expansion and economic growth are synergistic. Atmospheric pollutants and carbon dioxide have the same root, source, and process (van Vuuren et al., 2006; Li et al., 2021), and the paths of pollutant management and carbon reduction are highly overlapping with the ways of economic development. On the one hand, optimizing the energy consumption structure and improving energy efficiency, curbing the consumption of fossil energy such as coal at source, and increasing the proportion of renewable energy consumption are effective ways to control air pollution and carbon emissions (Borghesi and Vergalli, 2022). Moreover, due to the rebound effect of energy efficiency, when energy efficiency is improved, it will increase the demand for energy services and bring new growth points for the economy. In addition, the synergy of pollution reduction, carbon reduction, and green expansion not only creates a great synergy for environmental protection but also overlaps with the path of economic development. On the one hand, the “double-carbon” target constraint helps to promote the green and low carbon adjustment of the industrial structure. China’s industrial structure is still dominated by high-energy-consuming and high-polluting industries such as iron, steel, and chemicals. Upgrading the industrial structure will change the highly polluting and inefficient production methods to green, clean, and efficient ones and improve environmental conditions. In addition, industrial structure upgrading will also promote the coordinated development of the regional economy by improving labor productivity, accelerating the accumulation of production factors, and adjusting residents’ consumption. The adjustment of energy structure and industrial structure can achieve the parallel development of environmental protection and economic growth. On the other hand, green consumption promotes a low-carbon and environmentally friendly life, which in turn forces green production and benefits the development of a green economy. The recycling of consumption makes the material resource inputs quantified and resourceful, maximizing the lifetime value of resources (Lin, 2022) and reducing unnecessary cost inputs for enterprises. The deep integration of traction development and conservation makes the GDP green and superior. In addition, green and low-carbon technology innovation plays a leading role in the synergistic promotion of pollution reduction, carbon reduction, green expansion and economic growth. Green low-carbon technology innovation through the adjustment of energy structure changes the source link of coal clean use. It can achieve a shift from end-of-pipe management of ecological and environmental quality to prevention at source and provide important support to synergistically promote pollution reduction, carbon reduction, green expansion and economic growth. And, ecological restoration projects such as reforestation not only contribute to ecological resilience. But also benefits people in terms of carbon sequestration and oxygen release, and contributes to reducing pollution and carbon emissions. It also makes an important contribution to the economy through timber supply and forest tourism, leading to green and sustainable growth (Zhang et al., 2023). Overall, there are overlapping pathways to achieving pollution reduction, carbon reduction, green expansion and economic growth, and multiple benefits can be achieved in one fell swoop with strong initiatives.
Third, the main synergy of pollution reduction, carbon reduction, green expansion and economic growth. Iron and steel, electric power, petrochemicals, transportation and other industries are major contributors to pollution, but they are also the dominant sectors driving national economic development. High-energy-consuming and high-emission enterprises are also responsible for pollution reduction, carbon reduction, green expansion and economic growth. The government’s administrative intervention is also essential (Yan et al., 2023); furthermore, the relevant departments are politically responsible for pollution reduction, carbon reduction, green expansion and economic growth. They coordinate the formulation of policies, regulations, and action guidelines for environmental protection and economic development, leading the top-level design and improvement of the system. All departments and units work together in planning and deployment, concrete implementation, and regular scheduling to effectively fulfill the responsibilities and tasks of synergistic promotion of pollution reduction, carbon reduction, green expansion and economic growth.
Pollution reduction, carbon reduction, green expansion and economic growth interact with each other are highly synergistic. On the one hand, economic transformation is used to achieve pollution reduction, carbon reduction, green expansion and economic growth. On the other hand, economic transformation is forced based on pollution reduction, carbon reduction and green expansion requirements, leading to high-quality economic development. The four subsystems form a symbiotic coupling coordination relationship.
Based on the synergistic mechanism of pollution management, carbon reduction, green expansion and economic growth and the existing research results (Yang et al., 2021; Chen et al., 2022), and following the principles of scientificity, systematicity, and comprehensiveness. This study comprehensively evaluates the level of synergistic development of pollution reduction, carbon reduction, green expansion and economic growth in cities from four subsystems: pollution management, low-carbon development, ecological protection, and economic construction. Among them, air quality, pollution pressure, and pollution remediation are used as evaluation indicators for pollution management; the low-carbon development system is evaluated by carbon emission and resource consumption; ecological protection is assessed by greening degree and land use; and the economic system is measured by selecting indicators from three aspects: economic efficiency, economic potential, and infrastructure. Finally, 19 indicators are determined to build an index system to evaluate the synergistic development of pollution reduction, carbon reduction, green expansion, and economic growth, as shown in Table 1.
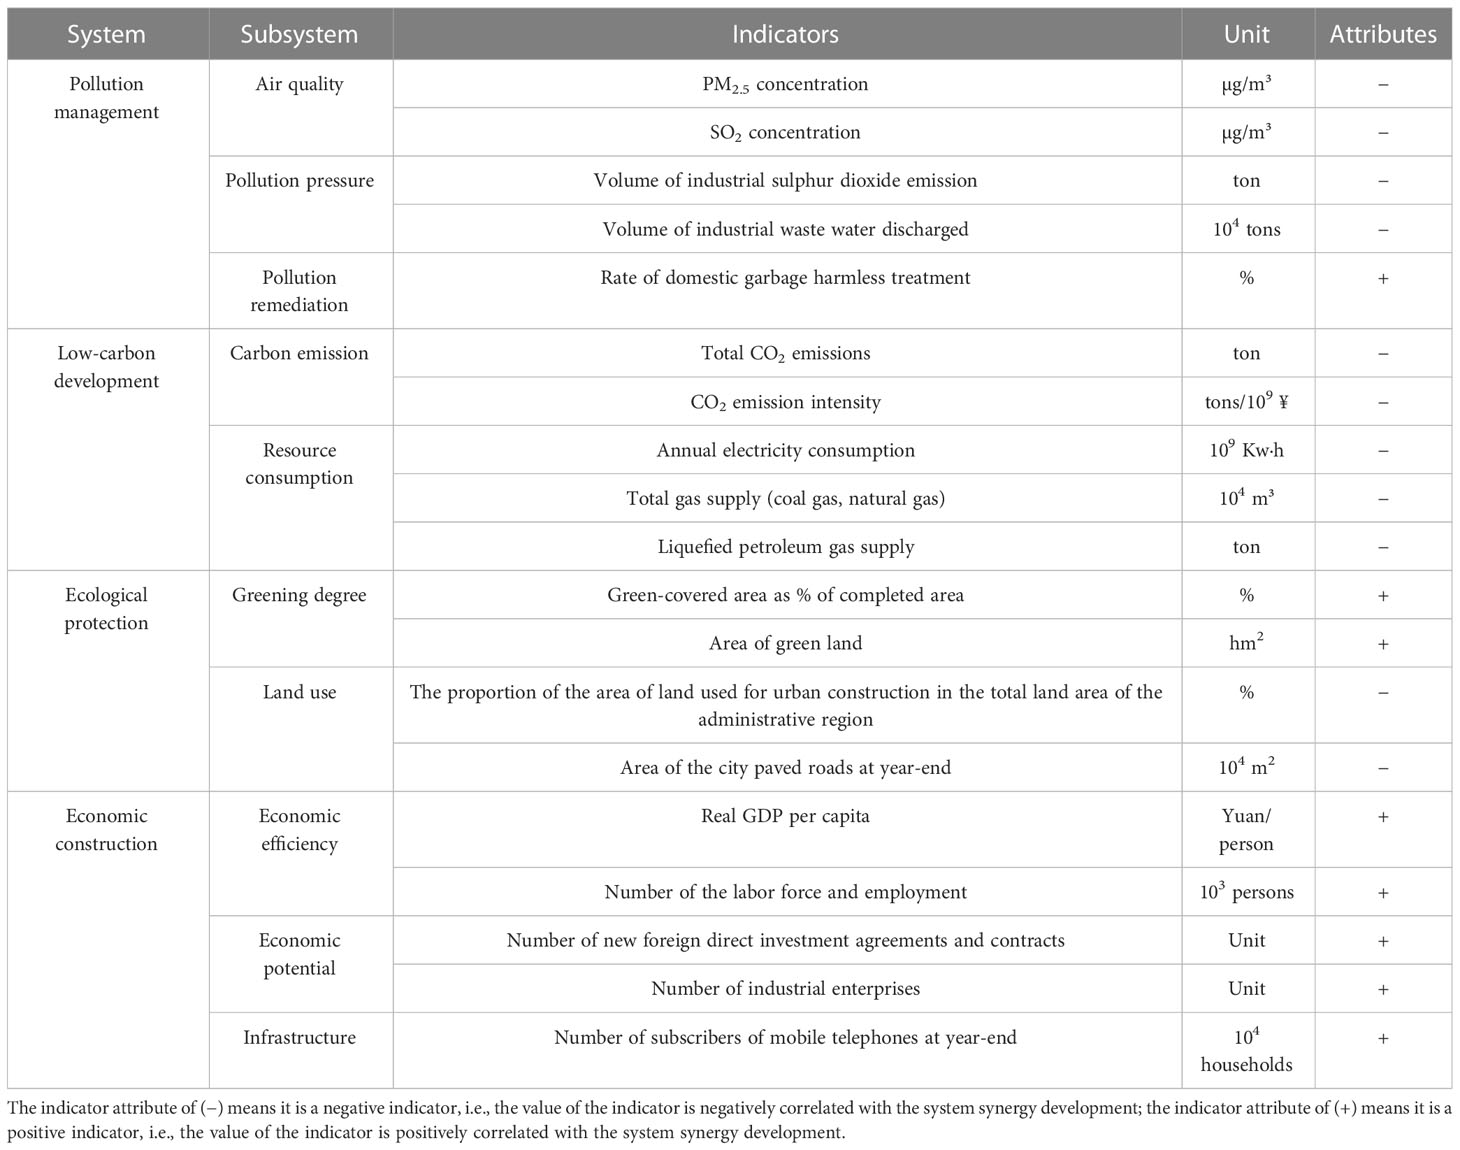
Table 1 “Pollution reduction, carbon reduction, green expansion, and economic growth” synergistic development evaluation system.
Based on the characteristics of each subsystem of pollution management, low-carbon development, ecological protection, and economical construction, considering the availability of data and the actual situation of the country, and further drawing on the comprehensive evaluation methods of existing studies (Sun et al., 2021). This study adopts the entropy value method to measure the weights of each indicator before the comprehensive evaluation of pollution reduction, carbon reduction, green expansion and economic growth. The entropy method was originally developed from the concept of information entropy, which is gradually and widely used in social disciplines to reflect the information utility value of individual indicators and to determine the weight of evaluation indicators. The entropy method is a more objective assignment method, and the higher the value of the weight, the greater the impact of the indicator on the system. The measurement is shown in Eqs. (1)–(11) (Chen and Chen, 2021; Li et al., 2022a).
(1) Standardization of indicator data
Where: denotes the standardized data of the i city j index, is the original data, and and denote the minimum and maximum values of the original data of the j index, respectively. Also, i = 1, 2, 3……n; j = 1, 2, 3……m.
(2) Calculate the index weight for the i city j index
(3) Calculate the entropy of the j indicator
(4) Calculate the coefficient of variation of the j indicator
(5) Calculate the entropy weight of the j indicator
(6) Calculation of each subsystem score
Where: , , , and denote the comprehensive scores of pollution management, low-carbon development, ecological protection, and economic construction systems subsystems, respectively. , , , and correspond to the standardized data of individual indicators in the subsystem, and is the corresponding weight of each indicator.
(7) Overall evaluation index score
Where: α, β, γ, and δ correspond to the weight coefficients of environmental governance, low-carbon development, ecological protection, and economical construction subsystems, respectively. The degree of coupling is not greatly affected by the coefficients, and all four subsystems are equally important, so the weight is set to 1/4 (Chen and Zhao, 2019).
Coupling refers to the interactive exchange of two or more systems (Xing et al., 2019). The coupling degree is an index to measure the degree of interaction between systems. When the degree of coupling is higher, it indicates that the systems interact more benignly with each other, thus driving each other’s development; on the contrary, it means that the coupling interaction between subsystems is weaker. There is a coupling interaction between four subsystems of pollution management, low carbon development, ecological protection and economic construction that affect each other. So, we attempt to construct a coupling degree model. However, when the development level of each subsystem is low, the measured coupling degree may be high, i.e., the phenomenon of “pseudo-coupling” appears, and the single coupling degree model does not reflect the coherence of coordination between systems. To reflect the synergistic effects more accurately among environmental governance, low-carbon development, ecological protection and economic construction systems, we introduce a coupling coordination degree model with the specific calculation formulae shown in Eqs. (12) and (13) (Xiao et al., 2021).
Coupling degree:
Where: indicates the synergistic level of the four systems of environmental governance, low-carbon development, ecological protection, and economic construction; the value range of is [0, 1]. indicates the comprehensive evaluation index of the composite system.
Referring to the classification criteria of existing results, we classify the composite system’s coupling coordination degree into the following categories, as shown in Table 2.
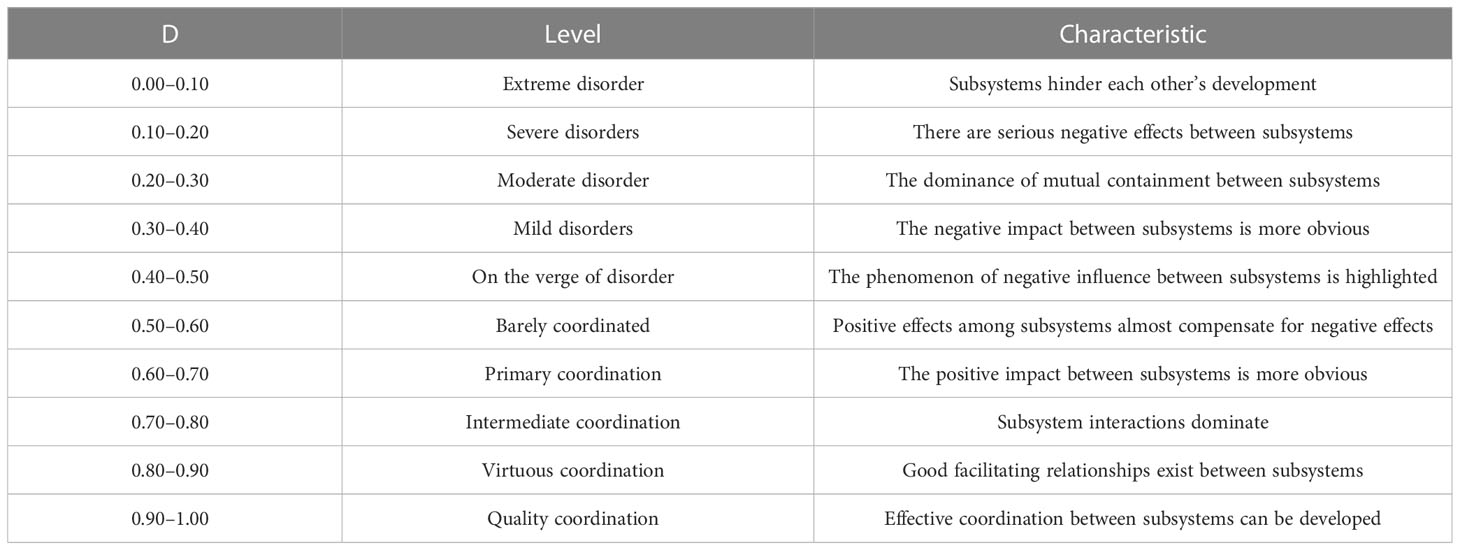
Table 2 Classification criteria of coupling coordination level.
The standard deviational ellipse (SDE) as a method of statistical analysis of spatial patterns was proposed by Lefever (1926), which can reveal the spatial distribution and multi-directional characteristics of study objects (Kong et al., 2022). It is measured as follows:
Azimuth:
The x-axis (long semi-axis) and y-axis (short semi-axis) standard deviation
Elliptical area:
Where: n is the number of sample cities, and (, ) denotes the geographical coordinates of the latitude and longitude of each prefecture-level city. The () is the relative coordinates of () distance distribution focus, where , . denotes the weight, and this study takes the synergistic level of pollution reduction, carbon reduction, green expansion and economic growth as the weight; is the azimuth of the standard deviation ellipse; and are the standard deviations of the -axis and -axis of the ellipse, respectively; is the area of the standard deviation ellipse.
To characterize the regional differences in environmental management, low-carbon development, ecological protection and economical construction coordination. We subdivide the country into three study regions: East, Central, and West, according to the policy division basis. Thus, using the Dagum Gini coefficient measurement analysis further to further reveal the relative regional differences and sources of differences (Li et al., 2022b) can reflect the relative differences of regions and overcome the problem of duplication of data. The Dagum Gini coefficient method can decompose regional differences into three parts: intra-regional differences, inter-regional differences and intensity of transvariation. The definition of the Dagum Gini coefficient is shown in Eq. (18) (Dagum, 1997).
Where: denotes the number of regions, () denotes the synergy degree of pollution reduction, carbon reduction, green expansion and economic growth of city in region , () denotes the number of cities in region , n is the total number of cities in the study sample (including 243 cities), and is the mean value of the coupling coordination degree of the composite system.
The Dagum Gini coefficient consists of intra-regional variation , inter-regional variation , and intensity of transvariation , i.e., . The specific calculation of , , and is referred to in the relevant literature (Han et al., 2020; Wen et al., 2023).
Equations (19), (20), and (21) are the contribution rates of intra-regional variation (), inter-regional variation (), and intensity of transvariation (), respectively. Also, , . Equation (22) is the relative impact of the coupling coordination degree of pollution reduction, carbon reduction, green expansion and economic growth between regions and .
The Kernel density estimation method is a nonparametric estimation method that can describe the dynamic trend of the spatial-temporal distribution of variables. We analyze the dynamic evolution characteristics of regional differences in the synergistic development of pollution reduction, carbon reduction, green expansion and economic growth in the whole country and the three regions by depicting the distribution position, shape, extension, and polarization trend of the Kernel density curve. The Gaussian Kernel function is calculated as shown in Eqs. (23) and (24) (Lee et al., 2017; Xue et al., 2022).
Where: f(x) is the density estimate, K(·) denotes the kernel function, N is the number of cities in the study sample, and denote independently distributed observations and mean values, respectively, and h denotes the broadband.
The Markov chain method is used to analyze the probability of a subject moving from one state space to another and to obtain the transfer characteristics and patterns of the coupling coordination degree of pollution reduction, carbon reduction, green expansion and economic growth through the conditional transfer probability. In this paper, the synergistic level of pollution reduction, carbon reduction, green expansion and economic growth is divided into four types according to the quartiles (0.25/0.5/0.75): low (LL), medium-low (ML), medium-high (MH), and high levels (HH). Also, the Markov chain method is combined with the spatial lag to form the spatial Markov chain method, which fully considers the spatial factors in the coupling coordination degree of pollution reduction, carbon reduction, green expansion and economic growth. The formula is as follows (Hu et al., 2023):
Where the spatial weight matrix represents the spatial relationship between the city and the city, which is defined using the inverse distance squared spatial weight matrix. denotes the value of an attribute of the city and is the spatial lag value of the region and denotes the neighborhood status of the city region.
In order to reveal the spatially focused characteristics of the coupled coordination degree of pollution reduction, carbon reduction, green expansion and economic growth, we selected the global spatial autocorrelation to study the characteristics of the whole regional space. The calculation formula is as follows.
Global Moran’s
Where: n is the sample size, and are the coupling coordination of pollution reduction, carbon reduction, green expansion and economic growth in city and city , respectively, and is the mean value. Global Moran’s I is in the range of [−1,1]. When Global Moran’s > 0, it means the spatial distribution is positively correlated, and the more it tends to 1, the stronger the positive correlation is. Conversely, when Global Moran’s < 0, it means that the spatial distribution is negatively correlated. Also, Global Moran’s = 0 means there is no spatial correlation. is the spatial weight matrix, and two spatial weight matrices are constructed in this study. The first one is the inverse distance squared spatial weight matrix, . The second one is the seven nearest-neighbor spatial weights matrix. The global spatial autocorrelation will ignore the atypical characteristics of local areas. For this reason, local autocorrelation is introduced to analyze the spatial clustering of high or low-value elements. The model is set as follows.
Where the variables are defined as shown in Eq. (27). When local Moran’s I > 0, it is high value surrounded by high value (H-H) or low value surrounded by low value (L-L) spatial agglomeration. When local Moran’s I< 0, it is high value surrounded by low value (H-L) or low value surrounded by high value (L-H) spatial agglomeration.
Compared with traditional regression methods, spatial econometric models consider the spatial dependence and spatial correlation of samples. Also, common spatial econometric models are classified as Spatial Lag Model (SLM), Spatial Error Model (SEM), and Spatial Durbin Model (SDM), and the model settings are shown below (Yuan et al., 2020; Yu et al., 2021).
Where: denotes the spatial weight matrix, is the explanatory variable, i.e., the synergistic level of pollution reduction, carbon reduction, green expansion and economic growth, and is the explanatory variable. The denotes the spatial lag coefficient, denotes the spatial autoregressive coefficient of the explanatory variable, is the degree of influence of the explanatory variable on the explanatory variable, and is the spatial error coefficient. In addition, and denote individual and time-fixed effects, respectively, and is the random disturbance term.
Considering the availability of data and the real situation in China, we take 243 cities at the prefecture level and above from 2005 to 2020 as the study sample (excluding Tibet, Hong Kong, Macao, and Taiwan, and samples with incomplete data). The study data for this study are mainly obtained from the 2006 to 2021 China City Statistical Yearbook, local statistical yearbooks, statistical bulletins, and the China Premium Database (CEIC). In addition, the pollutants PM2.5 and SO2 were obtained from the raster data of Columbia University’s Center for Socioeconomic Data and Applications and the website of NASA, respectively. Carbon emission data are from the Institute of Public and Environmental Affairs (IPE), and carbon intensity is calculated by dividing total carbon emissions by real GDP. Also, missing values are filled in using interpolation. In order to eliminate the effect of price changes over time, economic indicators such as GDP are based on 2005.
To concretize the current situation of the synergistic promotion of pollution reduction, carbon reduction, green expansion and economic growth, the level of synergistic development of pollution reduction, carbon reduction, green expansion and economic growth from 2005 to 2020 was measured by using the coupled coordination model based on the evaluation index system. At the same time, based on the classification standard of coupled coordination level in Table 2, with the division method of ArcGIS software, the synergistic level of pollution reduction, carbon reduction, green expansion and economic growth in 2005, 2010, 2015, and 2020 was divided into six levels to explore the characteristics of its spatial pattern. The results are shown in Figure 3.
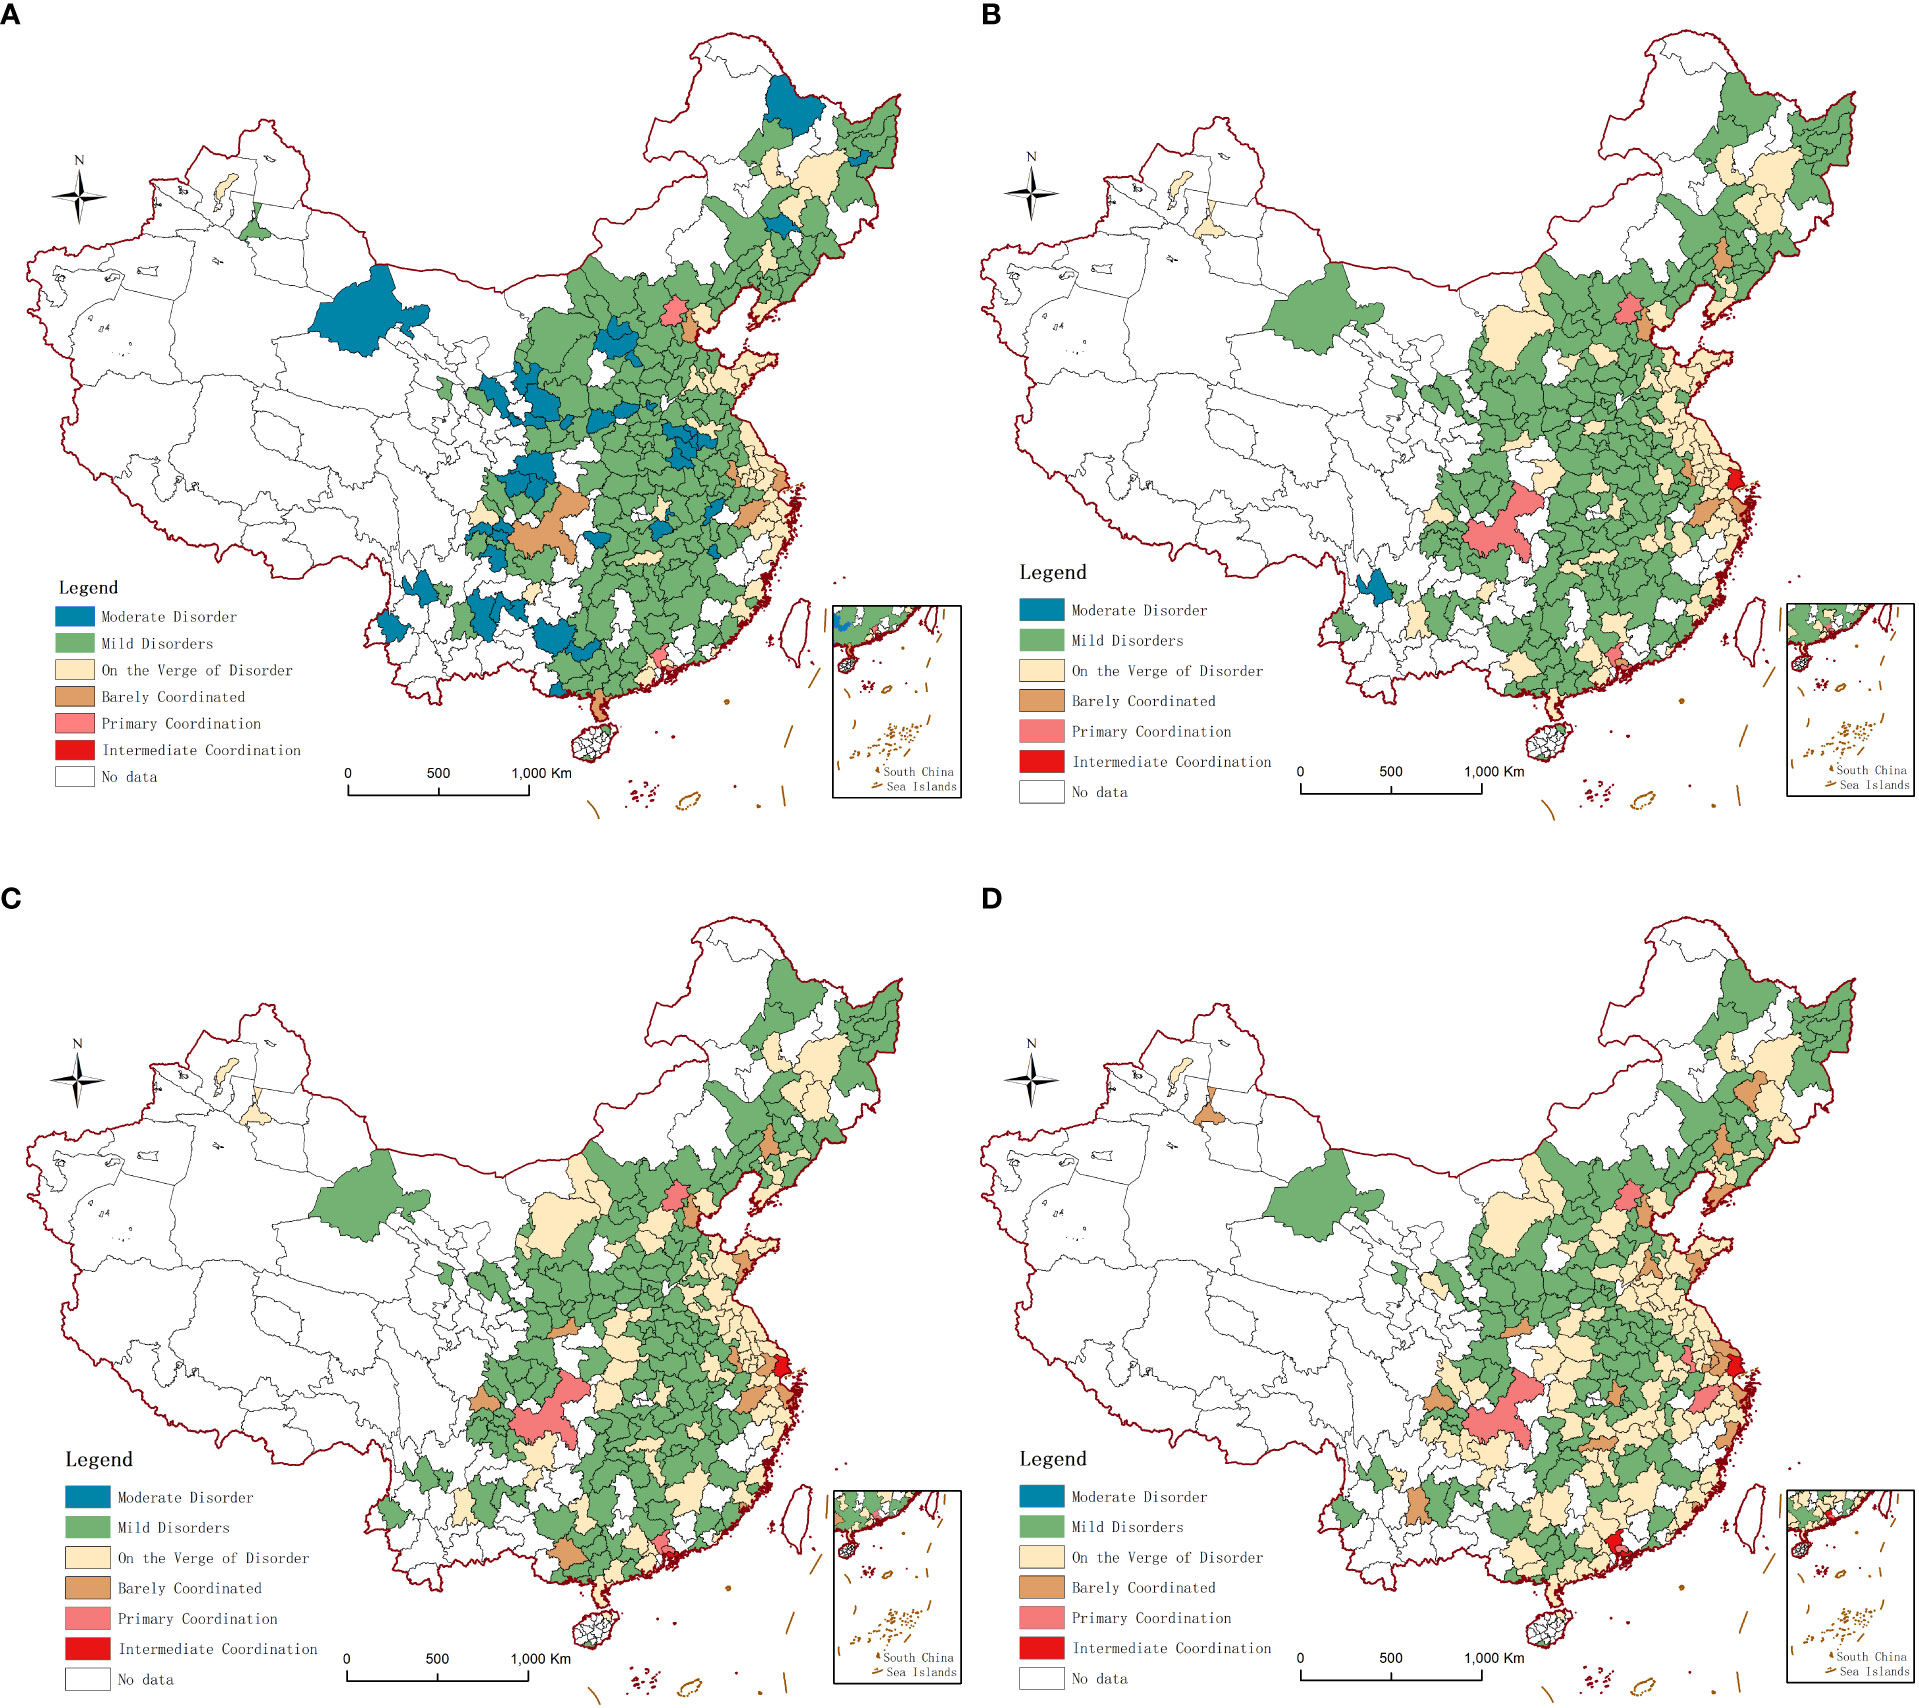
Figure 3 Spatial pattern of the synergy of “pollution reduction, carbon reduction, green expansion and economic growth”. (A) 2005; (B) 2010; (C) 2015; (D) 2020. Note: Produced based on the standard map with review number GS (2019) 1822 on the Ministry of Natural Resources of the People’s Republic of China Standard Map Service website (http://bzdt.ch.mnr.gov.cn/). And, no changes to the base map boundary.
At the time level, 64.20% of the cities had a synergy of pollution reduction, carbon reduction, green expansion and economic growth at a mild disorder level in 2005. Beijing, Guangzhou, and Shenzhen were in the primary stage of coupling coordination. The number of cities with moderate coupling disorder decreased sharply; only Lijiang was still in moderate coupling disorder, and Shanghai joined the intermediate coupling coordination stage in 2010. In the meantime, 69.55% of cities with pollution reduction, carbon reduction, green expansion and economic growth synergy were in mild disorder in 2010. The synergistic level of pollution reduction, carbon reduction, green expansion and economic growth has improved significantly in 243 cities in China, with 100% of cities already at the mild disorder stage and above in 2015. Still, only Shanghai and Shenzhen have reached the intermediate coordination stage. Compared to 2015, by 2020, the synergistic level of pollution reduction, carbon reduction, green expansion and economic growth in Chinese cities on the verge of disorder had increased. In addition, Guangzhou has squeezed into the intermediate coupling coordination stage, so the number of intermediate coupling coordination cities has increased to three in 2020. Overall, the synergistic level of pollution reduction, carbon reduction, green expansion and economic growth in Chinese cities has been improving yearly from 2005 to 2020, but there is significant spatial heterogeneity.
At the regional level, the synergistic level of pollution reduction, carbon reduction, green expansion and economic growth is highest in the eastern region of China, followed by the central and western regions, and the overall synergy of each region shows a fluctuating upward evolution. The higher and lower coordination levels of the synergistic level pollution reduction, carbon reduction, green expansion and economic growth are characterized by a scattered distribution, while the medium level is characterized by the spatial evolution of clusters. The intermediate level of coordination areas, such as Shanghai, Guangzhou, and Shenzhen, are distributed in the southeast, while the primary coordination areas are also scattered. The mildly dysfunctional and near-dysfunctional cities are in clusters, and the proportion is increasing. The barely coordinated cities are mainly located in the eastern coastal region, while the moderately dysfunctional cities are also scattered in the southwest, northwest, northeast, and other regions, while their proportion contracted sharply. In addition, there were no cities in a moderately dysfunctional stage in 2015. In summary, the synergistic level of pollution reduction, carbon reduction, green expansion and economic growth in Chinese cities from 2005 to 2020 has evolved significantly, with the level of coordination increasing, and the level of medium disorder gradually disappearing. The number of cities in the intermediate coordination stage increases, and the higher coordination level shows an eastern direction of distribution, in the form of the spatial structure characterized by “high in the east—low in the west.”
The reason for its development process may be that the Fifth Plenary Session of the 16th Central Committee of the Communist Party of China (CPC) has identified the building of a resource-saving and environment-friendly society as a strategic task for China, and environmental protection has reached an unprecedented level. Especially since the 18th Central Committee of the Communist Party of China (CPC) of China, ecological civilization has formed a huge system from concept to practice, from task to system. The development of pollution prevention and control action plans in various regions has led to good results in ecological protection, which to a certain extent has contributed to the improvement of the synergistic level of pollution reduction, carbon reduction, green expansion and economic growth. However, due to the differences in resource endowment, industrial foundation, and policy implementation, there are spatial differences in the synergistic level of pollution reduction, carbon reduction, green expansion and economic growth. The eastern coastal region accelerates industrial transformation and upgrading, focuses on the development of high-tech industries, and has a higher level of economic development, so the synergistic effect is improved. In contrast, the northeast region has long been dominated by heavy industry, and it is challenging to realize the transformation in the short term. Similarly, the synergistic increase in the central region also faces many problems, such as in Shanxi and Inner Mongolia, with coal-based energy consumption at the forefront. These factors make the synergistic level of pollution reduction, carbon reduction, green expansion and economic growth dysfunctional.
To further explore the spatial dynamic evolution of the synergy of pollution reduction, carbon reduction, green expansion and economic growth in China, this study relies on ArcGIS 10.2 software to calculate its standard deviation and center of gravity parameters, as shown in Table 3. In addition, four characteristic points in 2005, 2010, 2015, and 2020 were selected to draw the migration trajectory of the center of gravity and standard deviation of the synergistic level of pollution reduction, carbon reduction, green expansion and economic growth in China, as shown in Figure 4. During the study period, the standard deviation ellipse of the synergistic level of pollution reduction, carbon reduction, green expansion and economic growth in China showed a “northeast-southwest” pattern, with a slight change in the standard deviation ellipse, an overall shift to the southwest, and an insignificant change in the coverage area. From the viewpoint of the length of the long semi-axis, the long semi-axis has experienced a trend of “shortening,” shortening from 1,126.04 km in 2005 to 1,118.40 km in 2020. It indicates that the spatial distribution of the synergistic level of pollution reduction, carbon reduction, green expansion and economic growth in the direction of the long semi-axis has evolved into aggregation. In terms of the short semi-axis, the short semi-axis has experienced the process of “extension-shortening,” indicating that the synergistic level of pollution reduction, carbon reduction, green expansion and economic growth has evolved through dispersion and then aggregation. It indicates that the spatial distribution of the synergistic level pollution reduction, carbon reduction, green expansion and economic growth synergy in the direction of the short semi-axis evolves in a dynamic process of dispersion, then aggregation.
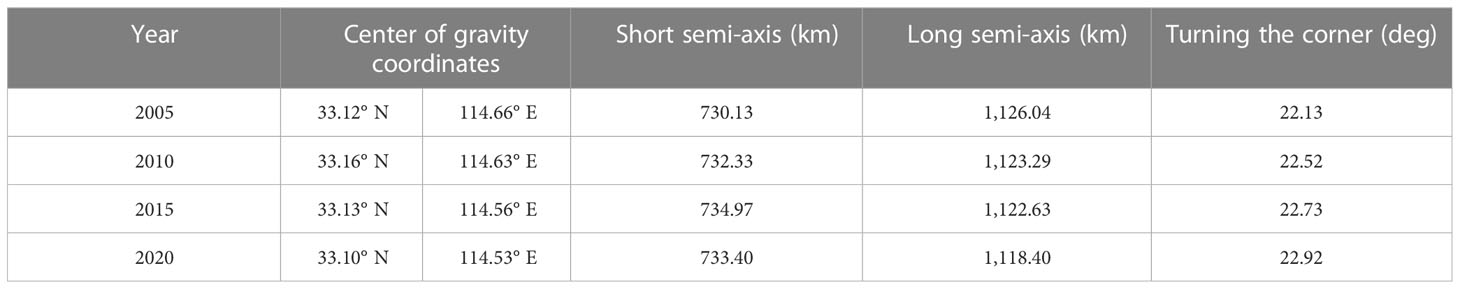
Table 3 Standard deviation ellipse and center of gravity parameters.
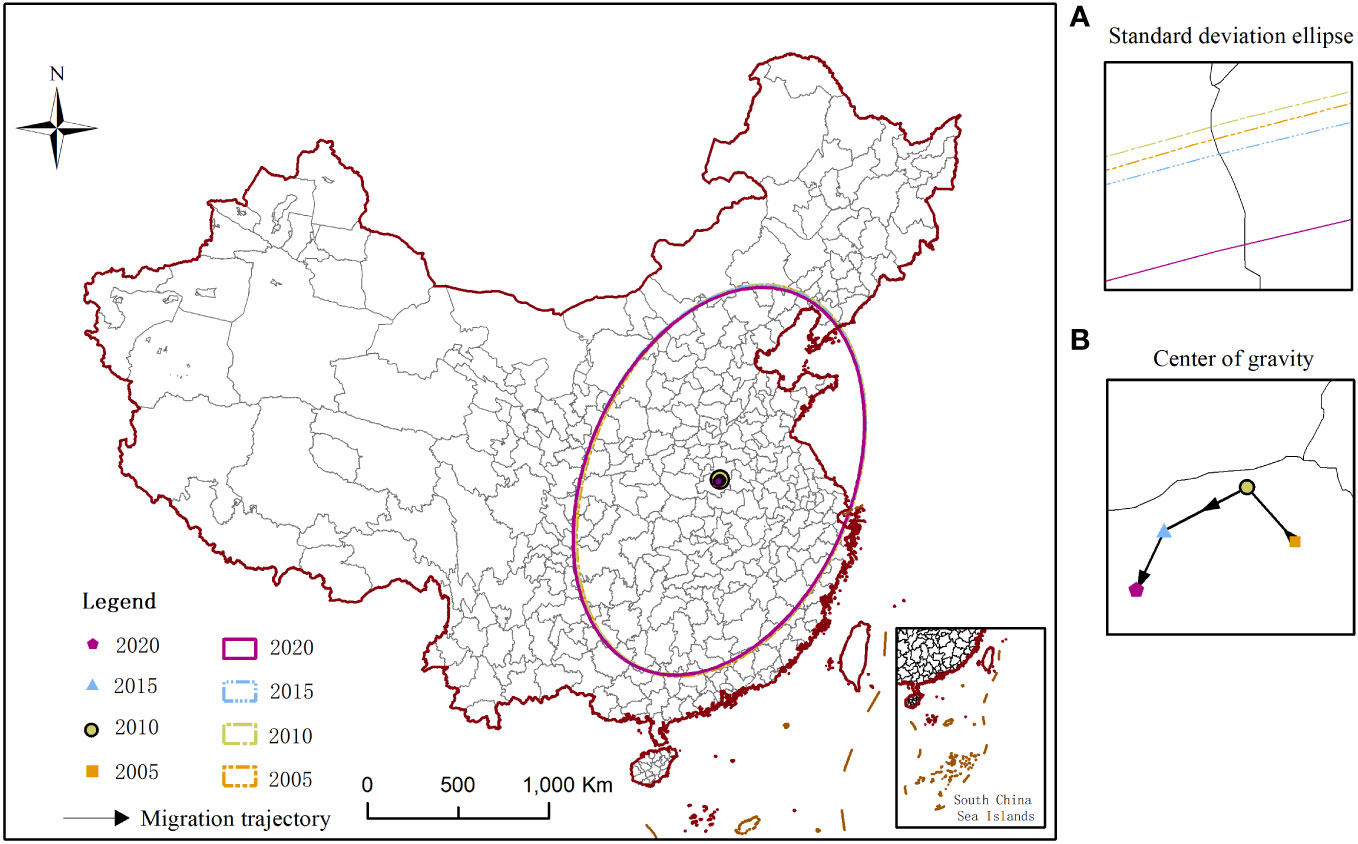
Figure 4 Standard deviation ellipse and center of gravity trajectory of the synergistic level of “pollution reduction, carbon reduction, green expansion and economic growth”. (A) Standard deviation ellipse; (B) Center of gravity migration trajectory. Note: Produced based on the standard map with review number GS (2019) 1822 on the Ministry of Natural Resources of the People’s Republic of China Standard Map Service website (http://bzdt.ch.mnr.gov.cn/). And, no changes to the base map boundary.
From the trajectory of the center of gravity, the center of gravity of the synergy of pollution reduction, carbon reduction, green expansion and economic growth in China during 2005–2020 varies from 33.12° N to 33.10° N and 114.66° E to 114.53° E, both of which are distributed near Zhumadian, Henan Province, with an overall migration pattern of “southeast-northwest-southwest,” and the distance and speed of the center of gravity are gradually increasing. With the promotion of the western development strategy, industrial policy support and financial subsidies have accelerated the development of the west regional economy, and the continuous popularization of the green financial policy has made financial resources and financial services such as capital and technology sink to the southwest, which is conducive to solving the financing constraints faced by the development and green transformation of enterprises in the southwest. The awareness and ability of enterprises to compensate ecologically have been enhanced under strict environmental regulations, and the discharge of wastewater and gas emissions has been reduced. In addition, the ecological protection work has increased the value of urban greening and forest carbon sinks in Southwest China. To sum up, the synergy of pollution reduction, carbon reduction, green expansion, and growth in the southwest has been rapidly improved, which may be an important reason for shifting the center of gravity to the southwest. At the same time, the azimuth Angle has been gradually increasing, from 22.13° in 2005 to 22.92° in 2020, which shows that the synergistic level of pollution reduction, carbon reduction, green expansion and economic growth in China has been shifting counterclockwise, and the change of angle is relatively small.
This study adopts the Dagum Gini coefficient method to reveal the regional differences and sources of the synergistic development level of pollution reduction, carbon reduction, green expansion and economic growth. Also, measuring the Gini coefficients for the nation, the east, the west, and the central and revealing the sources of regional differences. The results are shown in Tables 4, 5 and Figures 5–7.
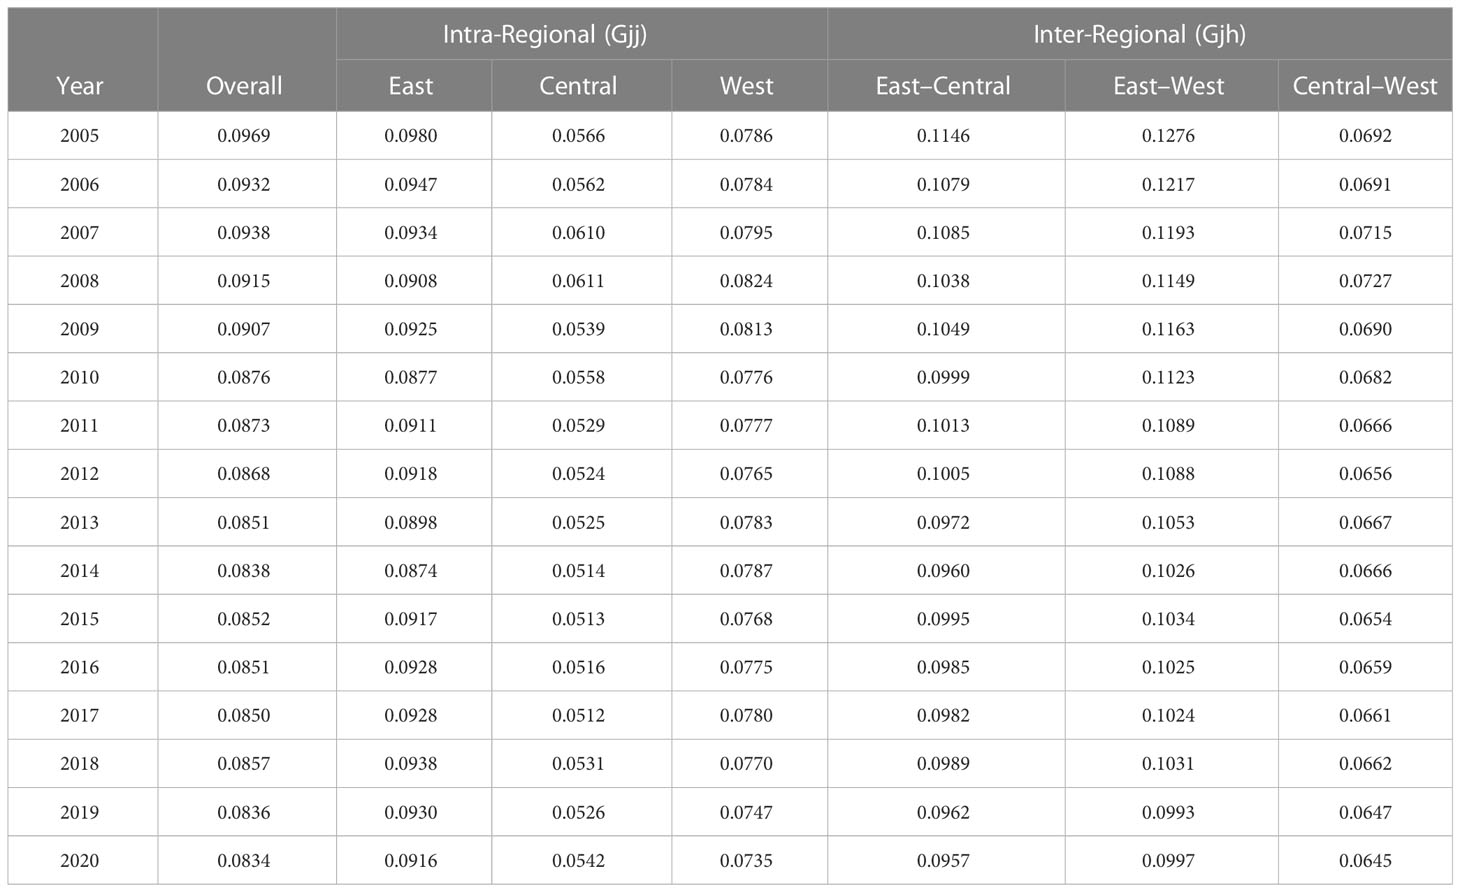
Table 4 Regional Dagum Gini coefficients.
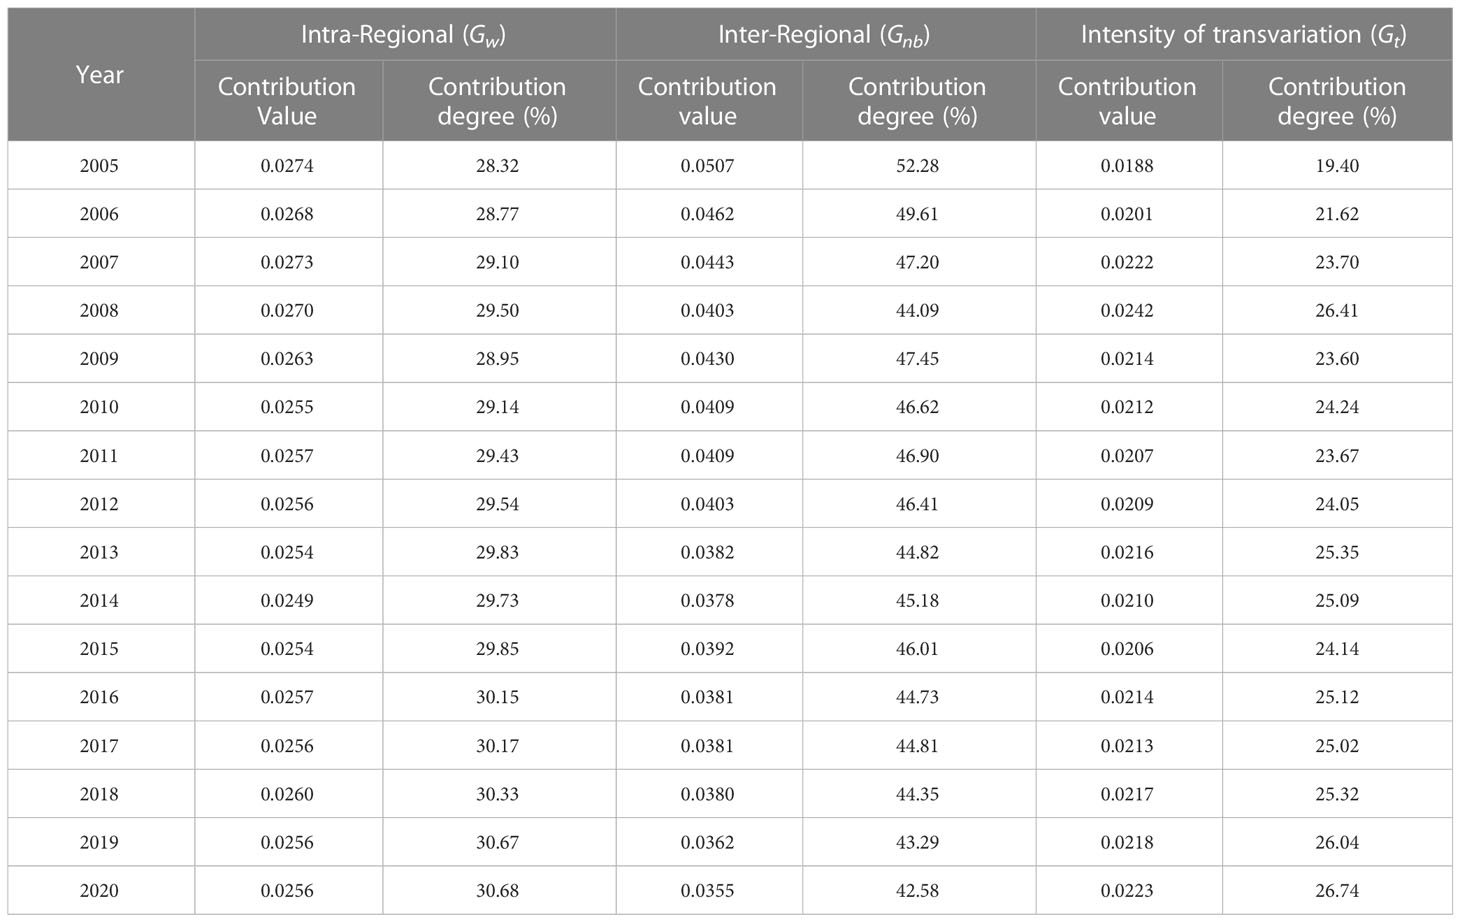
Table 5 Regional difference sources and contribution rate.
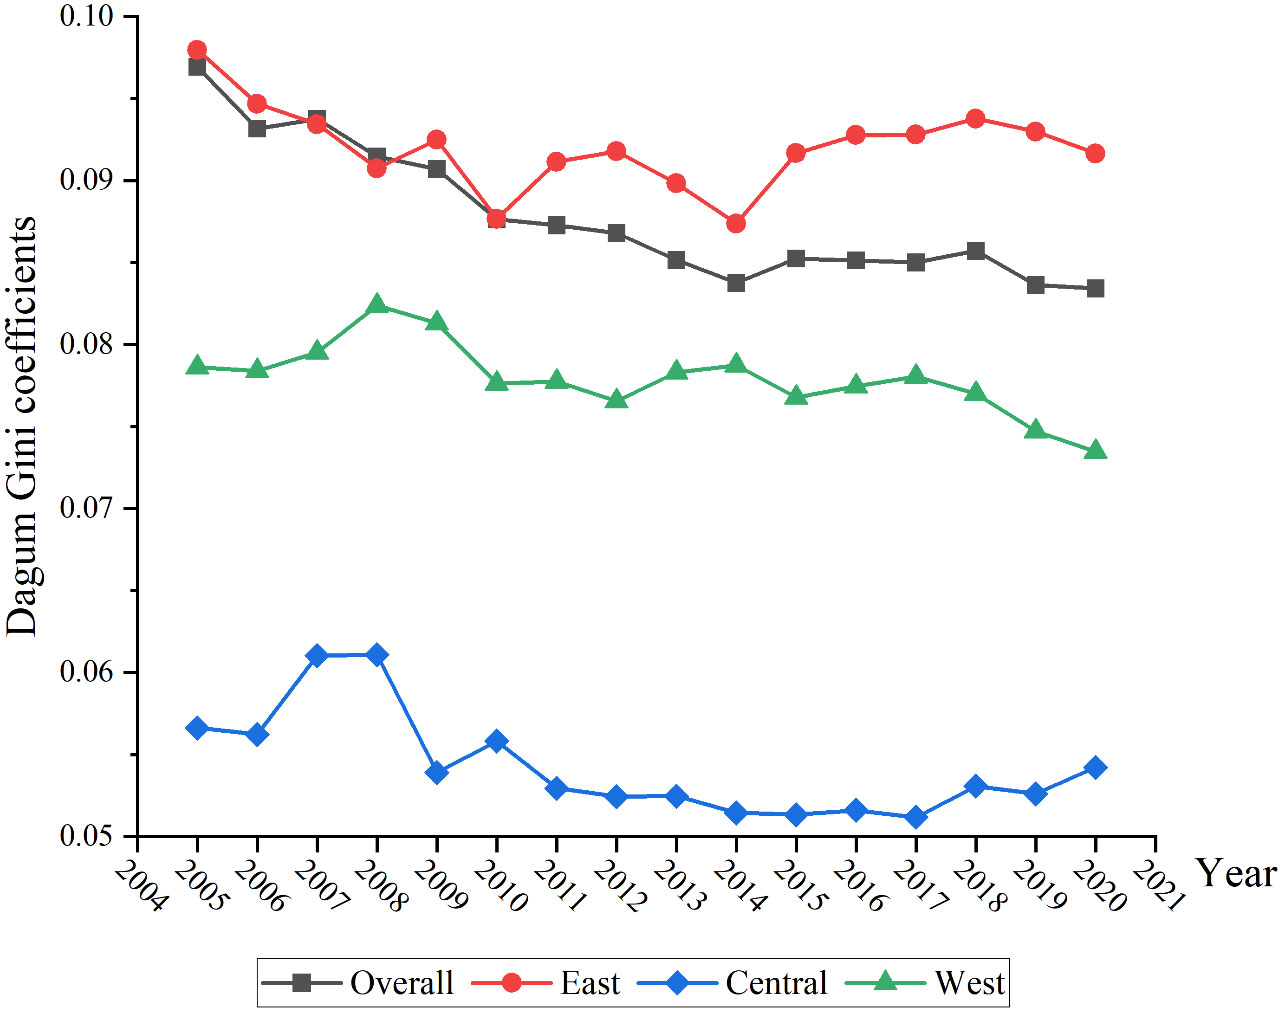
Figure 5 Intra-regional differences and trends.
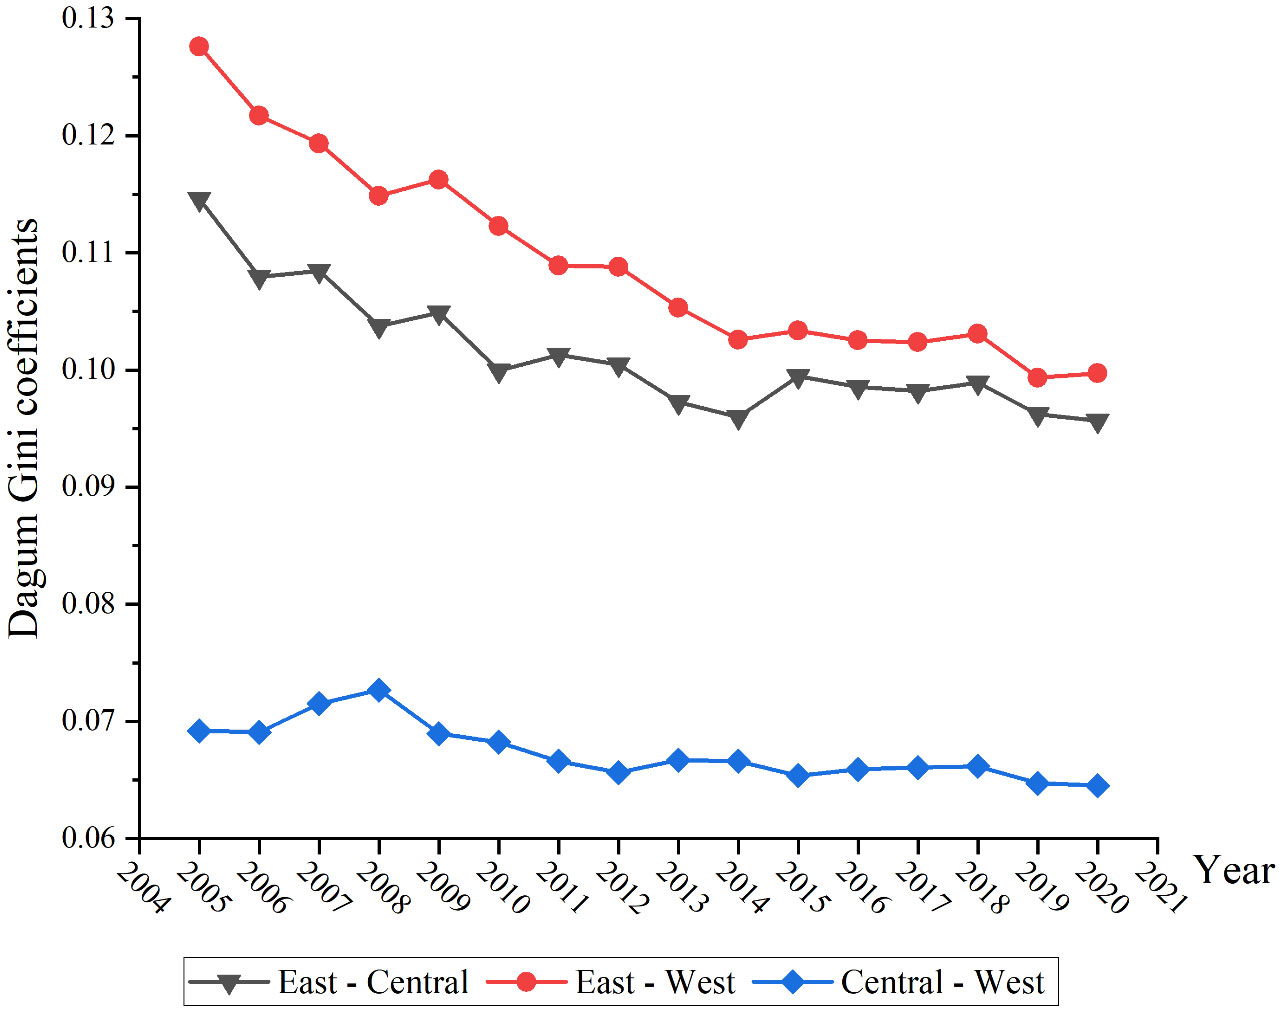
Figure 6 Regional differences and evolution trend.
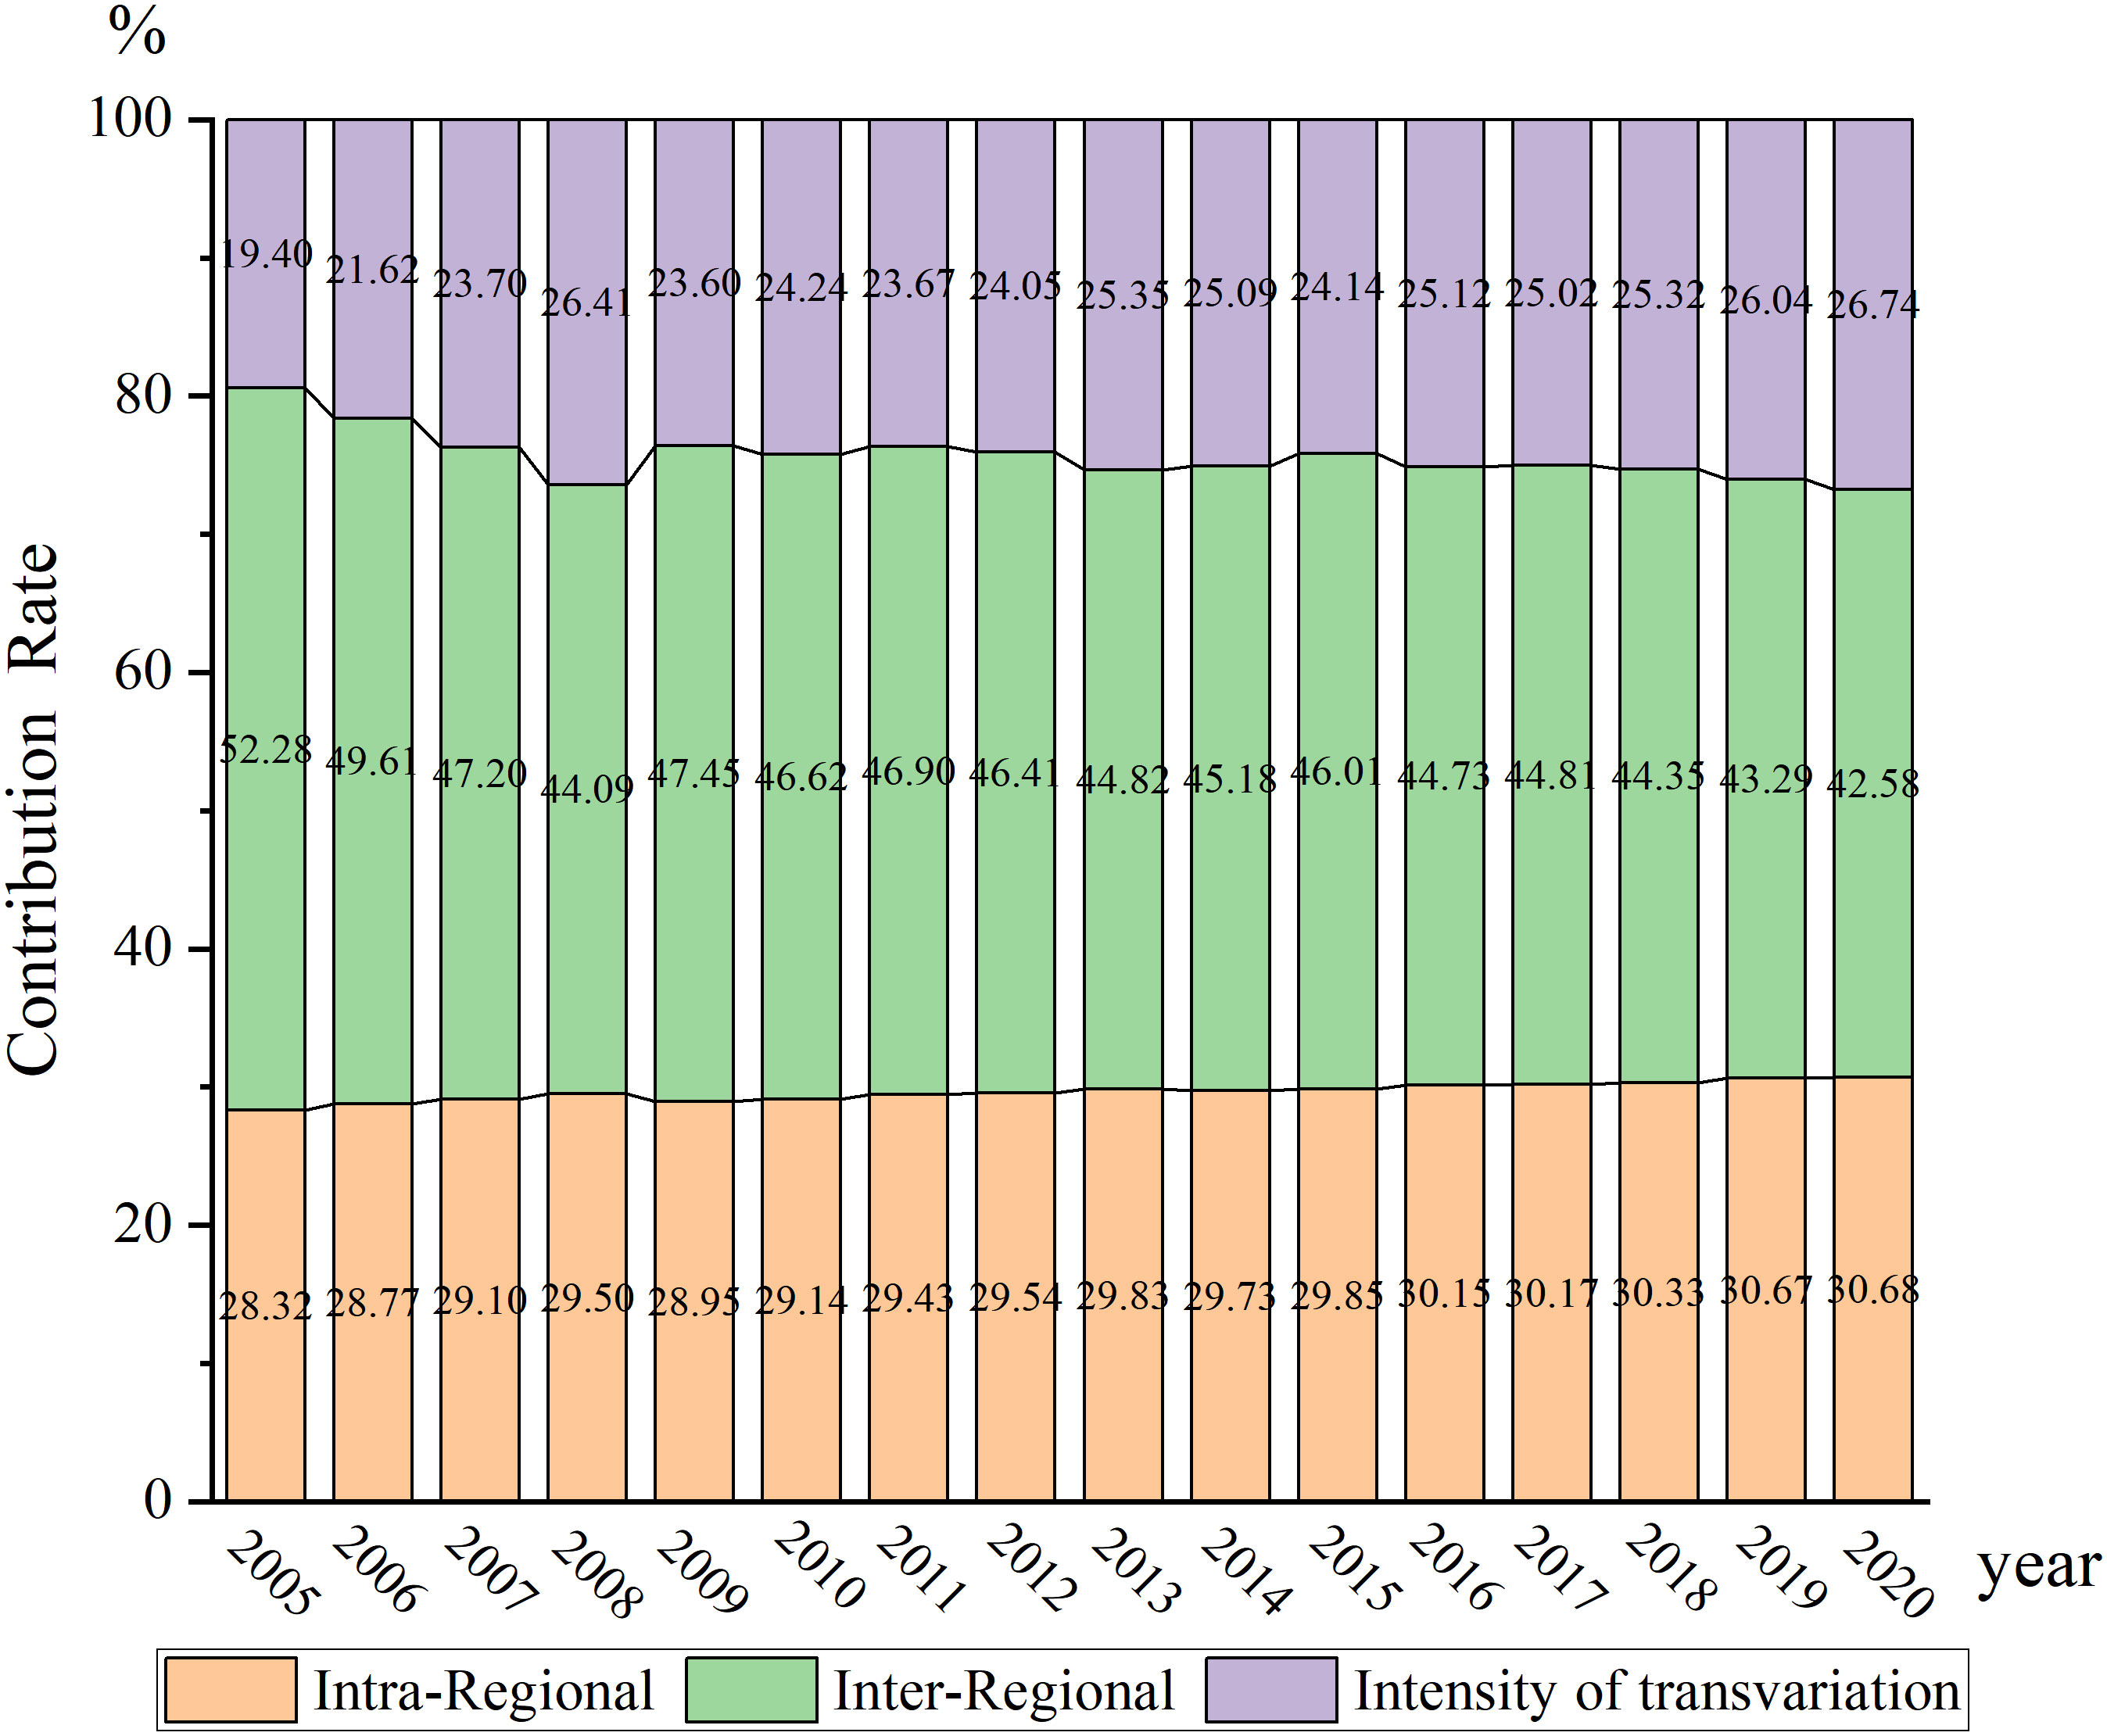
Figure 7 Regional differential contribution rate and evolution trend.
Combining the results in Table 4 and Figure 5, it can be seen that the overall variation across the country shows a trend of “fluctuating decline—gentle rise—slight decline.” It shows a fluctuating decline from 2005 to 2014, shows a gentle rise from 2014 to 2018, and shows a slight decline from 2019 to 2020. The overall Gini coefficient decreased from 0.0969 in 2005 to 0.0834 in 2020, which is inseparable from the vigorous promotion of ecological civilization construction across China. During the sample investigation period, the synergistic level of pollution reduction, carbon reduction, green expansion and economic growth synergy among regions showed more obvious heterogeneity. The intra-regional differences in the level of synergistic development in the eastern region are the largest, with the Gini coefficient values mainly concentrated 0.09-0.10, while the intra-regional differences in the level of synergistic development in the western region are the second largest, both of which are higher than those in the central region.
The intra-regional differences in all three regions showed an overall trend of first narrowing and then stabilizing, like the overall national trend. The evolutionary trend of the difference in the east region is more fluctuating, with a rebound in 2009, 2012, and 2016, but the decreasing trend of the intra-regional difference has not changed. The intra-regional difference in the west region showed an expanding trend from 2005 to 2008, then a fluctuating downward trend until 2020. The intra-regional difference in the central region experienced a significant narrowing in 2009, then stabilized at 0.053 or so, and then slightly expanded in 2018. Overall, there is an uneven development among regions in the synergistic level of pollution reduction, carbon reduction, green expansion and economic growth in Chinese cities, and the intra-regional differences are generally decreasing.
As can be seen from Figure 6, the inter-regional differences in the synergistic level of pollution reduction, carbon reduction, green expansion and economic growth are “East–West > East–Central > Central–West” from 2005 to 2020. From a longitudinal comparison, the inter-regional differences in the synergistic level of pollution reduction, carbon reduction, green expansion and economic growth between East–West, East–Central, and Central–West are generally fluctuating and decreasing. The trend of the inter-regional differences in synergy between East–West and East–Central is basically the same, and the overall change is significant. In contrast, the trend of the difference between the Central–West is more moderate, and the change is not obvious. In terms of specific values, the Gini coefficients of East–Central and East–West are approaching each other over time, while the Gini coefficients of Central–West remain at a low and stable level. This indicates that the differences in the synergistic level of pollution reduction, carbon reduction, green expansion and economic growth among regions are mainly between East–West and East–Central, while the differences between Central–West are smaller.
Figure 7 depicts the evolution trend of regional sources of variation and their contribution rates. Regarding the overall contribution rate, the values of the inter-regional variance contribution rate range from 42.58% to 52.28%, and the values of the intra-regional variance contribution rate range from 28.32% to 30.68% from 2005 to 2020. Specifically, the intra-regional variance contribution rate has changed steadily during the examination period, showing a slight increase. Also, the inter-regional variance contribution rate showed a rapid decline from 2005 to 2008. After a brief rebound in 2009, it continued its declining trend, but the rate of decline was more moderate. The contribution rate of intensity of transvariation is in an overall upward trend, reaching a minimum value of 19.40% in 2005 and a peak of 26.74% in 2020, then fluctuating and stabilizing at about 25%. Compared with the fluctuation pattern, we can see that the contribution rate of intra-regional variation fluctuates and then stabilizes, while the contribution rate of inter-regional variation fluctuates and decreases, and the contribution of the intensity of transvariation fluctuates and increases. The contribution rate of inter-regional differences is higher than that of intra-regional differences and the intensity of transvariation, which indicates that inter-regional differences are the primary source of the unbalanced development levels of pollution reduction, carbon reduction, green expansion and economic growth.
The Gini coefficient reflects the relative differences in the level of coordinated development. However, it could not sufficiently reflect the absolute differences and evolution trend of the level of coordinated development. To intuitively describe the synergistic distribution characteristics and dynamic evolution process of the synergistic level of pollution reduction, carbon reduction, green expansion and economic growth in Chinese cities, the density distribution pattern is estimated based on the Gaussian kernel function, and the dynamic evolution is analyzed in the time dimension. The observation periods of 2005, 2010, 2015, and 2020 are selected as the Kernel density maps of the whole country, east, central, and west, as shown in Figure 8.
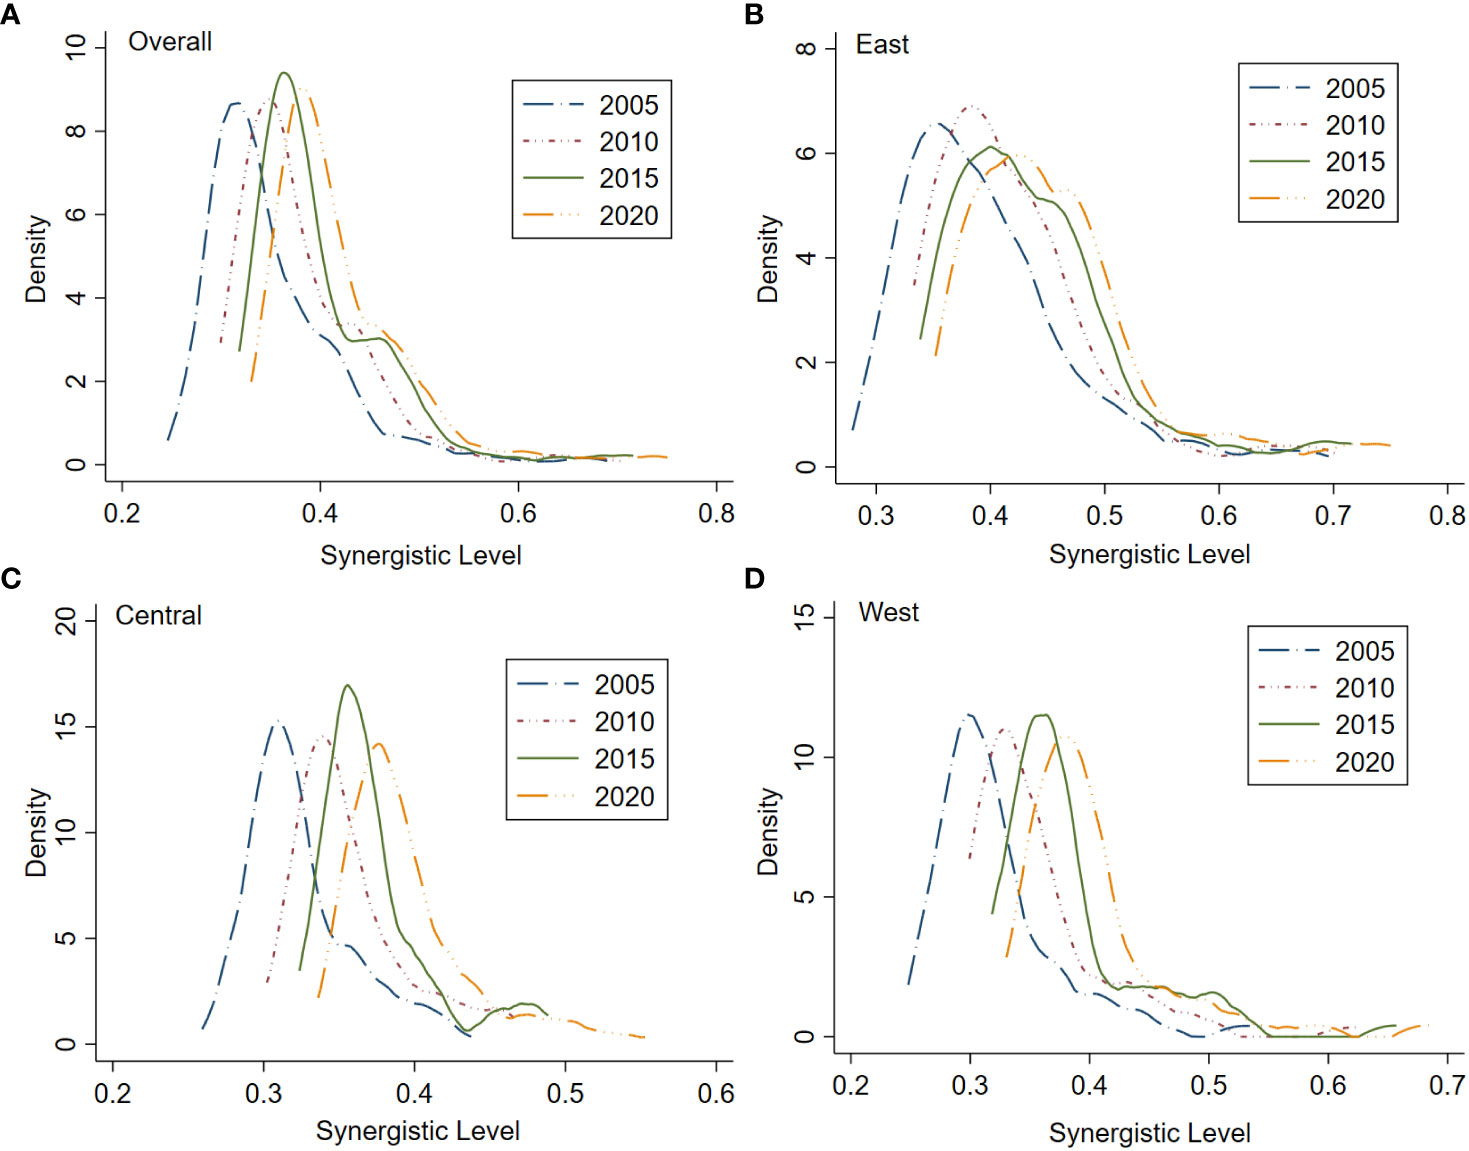
Figure 8 Traditional Kernel density curve. (A) Overall; (B) East; (C) Central; (D) West.
As shown in the picture, the Kernel density curves of the whole country and the eastern, central, and western regions all show a tendency to move to the right, indicating that the synergistic level of pollution reduction, carbon reduction, green expansion and economic growth in China as a whole and each region is on an upward trajectory and is improving year by year. Also, the synergistic level of pollution reduction, carbon reduction, green expansion and economic growth in China’s cities has been effectively synergized. The height of the main peak of the overall Kernel density curve tends to rise and then fall, and the width of the main peak does not change significantly. Compared with 2005, the height of the main peak of the overall Kernel density curve increased in 2020. This means that the absolute difference in the synergistic level of pollution reduction, carbon reduction, green expansion and economic growth across the country strengthens first and then weakens, and the overall level of synergistic development becomes concentrated. At the same time, from the perspective of polarization, the overall shows a “double-wave peak” form. There is a right-trailing phenomenon in the Kernel density curve, which indicates that the synergistic level of pollution reduction, carbon reduction, green expansion and economic growth synergistic is in the two-stage differentiation spatial evolution stage in the national.
The comparison at the regional level shows that the nucleus density curves in all three regions show a trend of shifting to the right year by year during the sample investigation period. In terms of distribution pattern, the height of the main peak in the east region tends to first increase and then decrease, while the width of the main peak changes to first a sharp peak and then to a broad peak. The height of the main peak in the central and west regions roughly shows a dynamic evolution process of first decreasing, then increasing, and finally decreasing. In general, the height of the main peak of the Kernel density curve in the East, Central, and West decreases in 2020 compared to 2005. This indicates that while the synergistic level of pollution reduction, carbon reduction, green expansion and economic growth in cities in east, central, and west regions is increasing, the regional differences show a trend of first narrowing and then widening. From the perspective of distribution extension, the Kernel density in the east, central, and west regions all show a right-trailing trend year by year. In terms of the number of peaks, the Kernel density curve shifts from “single-peak” to “double-peak.” In the east region, the side peaks are less obvious, and it is easy to see that the central and west regions have changed from single peaks to weak double peaks or even multiple peaks. Among them, the west region was single-peaked at the beginning of the sample examination period, and the number of peaks increased after 2015, which means that the polarization of the level of synergistic development of “pollution reduction, carbon reduction, green expansion and economic growth” in the three regions gradually emerged.
Figure 9 shows the unconditional kernel density diagram and density contours of the synergistic level of pollution reduction, carbon reduction, green expansion and economic growth in China from 2005 to 2020. In unconditional Kernel density estimation, the x-axis is the level of synergistic development of the city in year t, the y-axis is the level of synergistic development of the city in year t + 3, and the z-axis represents the probability of each point in the X-Y plane. In the unconditional density contours, the x-axis and y-axis also represent the level of synergistic development, and the density contours represent different probability values. According to Figure 9, the estimated probabilities of unconditional kernel density for the synergistic level of pollution reduction, carbon reduction, green expansion and economic growth are mainly concentrated on the positive 45° diagonal, indicating that the synergistic level of each city has a strong continuity and does not change significantly within the 3-year time span. In addition, there are four major wave peaks distributed along the diagonal, which are distributed around 0.35, 0.5, 0.65, and 0.75 on the x-axis. Among them, in the interval where the coupling coordination degree of pollution reduction, carbon reduction, green expansion and economic growth is below 0.35, most of the graphs are concentrated above the 45° diagonal. This indicates that the distribution of the synergistic level from period t to t + 3 has changed significantly, showing a tendency to shift to a higher level. In general, the synergistic level of pollution reduction, carbon reduction, green expansion and economic growth in the city as a whole maintains a long-term stable development trend, and the synergistic level in the very low-level areas has been improved to a certain extent.
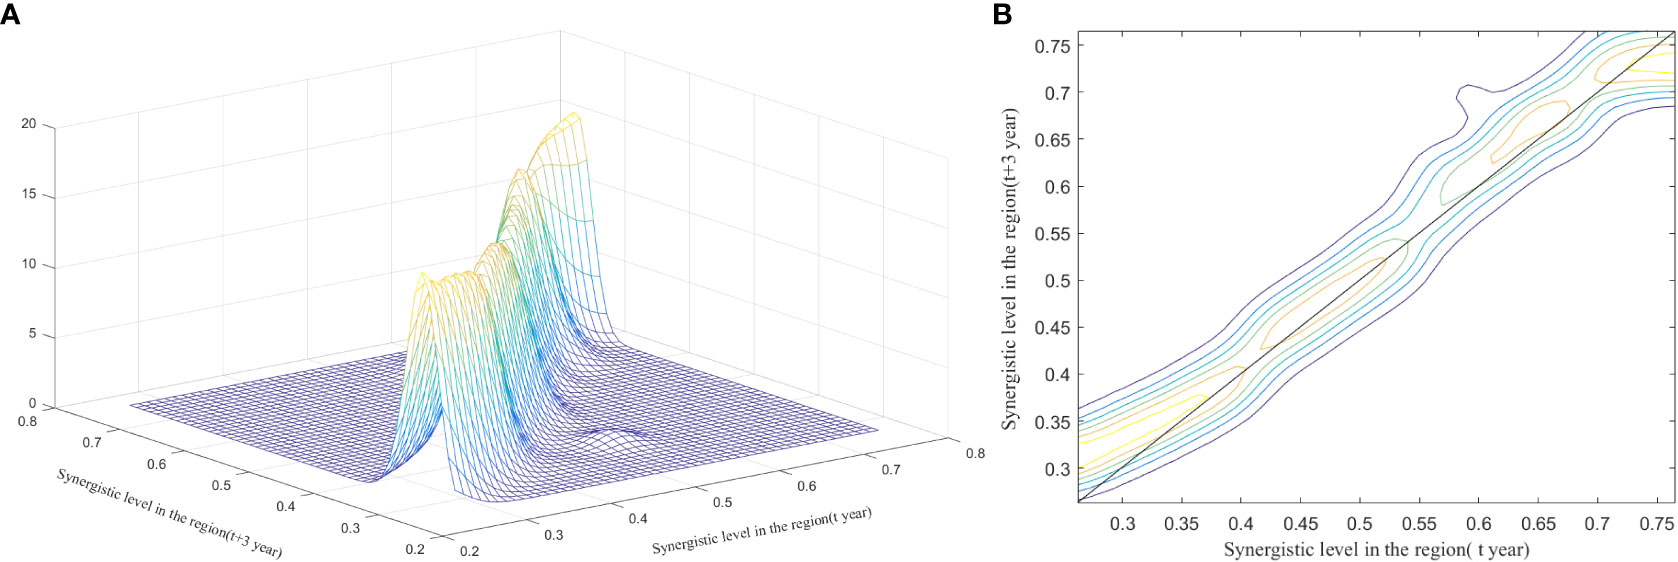
Figure 9 Unconditional Kernel density curve and density contours. (A) Unconditional kernel density; (B) unconditional density contours.
Figure 10 presents the spatial static kernel density and density contours of the synergistic level of pollution reduction, carbon reduction, green expansion and economic growth. The spatial static kernel density estimates can be used to further examine the spatial correlation of the distribution of China. x-axis is the synergistic development level of neighboring cities in year t, and the y-axis is the synergistic development level of the city in year t. If there are obvious spatial effects, i.e., cities with high levels of synergistic development are adjacent to cities with high levels of synergistic development, and cities with low levels of synergistic development are adjacent to cities with low levels of synergistic development. The distribution of probabilities should be concentrated on and along a 45° diagonal. According to Figure 10, the spatially static evolution of the synergistic development level shows a “fault” phenomenon, with 0.55 as the dividing point of the synergistic development level of neighboring cities, which shows different evolutionary trends. When the x-axis is less than 0.55, it is mainly concentrated 0–0.55 in the y-axis, which means that the cities with low synergistic development levels below 0.55 significantly influence the change of the city’s synergistic development level. When the whole synergistic development level is 0.30–0.60, the probability subjects are roughly distributed near the positive 45° diagonal, and their synergistic development levels show an obvious positive correlation at this time. At this stage, the flow of factors such as technology and human capital between neighboring regions will help to improve the level of synergy between these cities. Also, when the efficiency level of neighboring provinces is between 0.60 and 0.75, the probability main body starts to be parallel to the x-axis. This indicates that when the level of synergistic development reaches a certain height, it is difficult to promote a higher level of local coordination through spatial spillover effects, even if it is in close proximity to a higher-level city. It may be necessary to rely on one’s own industrial restructuring and green technology innovation in order to achieve the synergistic promotion of pollution reduction, carbon reduction, green expansion and economic growth.
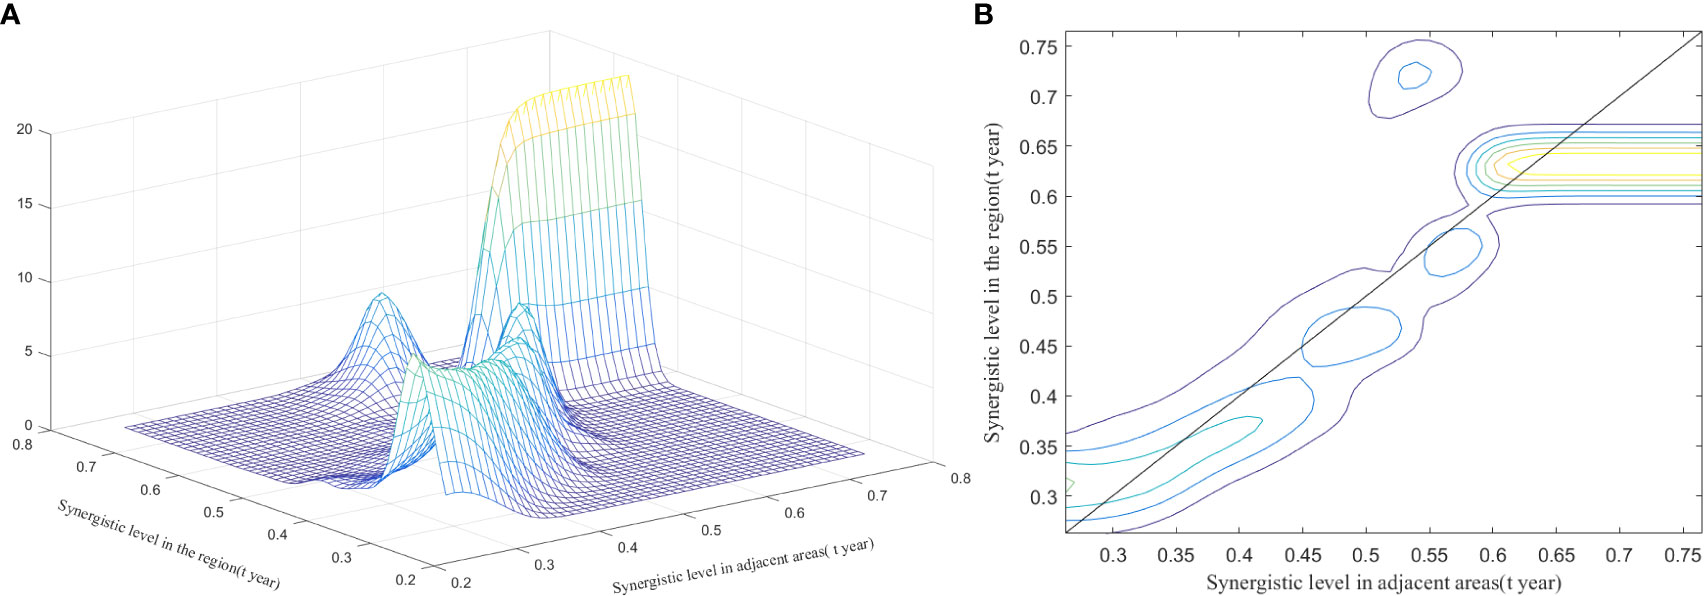
Figure 10 Static Kernel density curve and density contours. (A) Spatial static Kernel density; (B) spatial static density contours.
In this paper, we further analyze the dynamic influence of neighboring cities on the level of synergistic development of this city in the current period by considering the time span on the basis of spatial conditions at the same time. In Figure 11, the horizontal axis is the synergistic development level of neighboring cities in year t, and the vertical axis is the synergistic development level of this city in year t + 3. The spatial dynamic conditions are both similar to and slightly different from the spatial static conditions, indicating that temporal factors can influence the interaction between the synergistic level of pollution reduction, carbon reduction, green expansion and economic growth cities in China. As a whole, there is also a more pronounced “discontinuity” in the spatial dynamics of the level of synergistic development. Again, using 0.55 as the cut-off point for the level of synergistic development of neighboring cities, when the level of synergistic development of neighboring cities in year t is lower than 0.55, the distribution is 0–0.55 mainly on the y-axis, which does not change much compared with the estimated results under the spatial static condition. The probability is roughly distributed around the positive 45°diagonal throughout the process, suggesting that the level of synergistic development between cities still exhibits positive spatial correlation at this point in time when a 3-year lag is included. However, compared to the spatially static results, the distribution of probability subjects is more dispersed on the y-axis, which also indicates that the spatial correlation of the level of synergistic development among cities is weakened under the time lag condition. When the level of synergistic development of neighboring cities is higher than 0.55, the 3-year lag period does not have a significant effect, and the distribution position and distribution pattern of the probability subjects remain almost the same as those under the spatial static condition. In general, for medium- and low-level neighboring cities, the extension of the time span can significantly reduce the spatial correlation effect between cities. However, for high-level neighboring cities, the time condition does not play a significant role in the process of promoting the upward shift of the city’s synergistic development level.
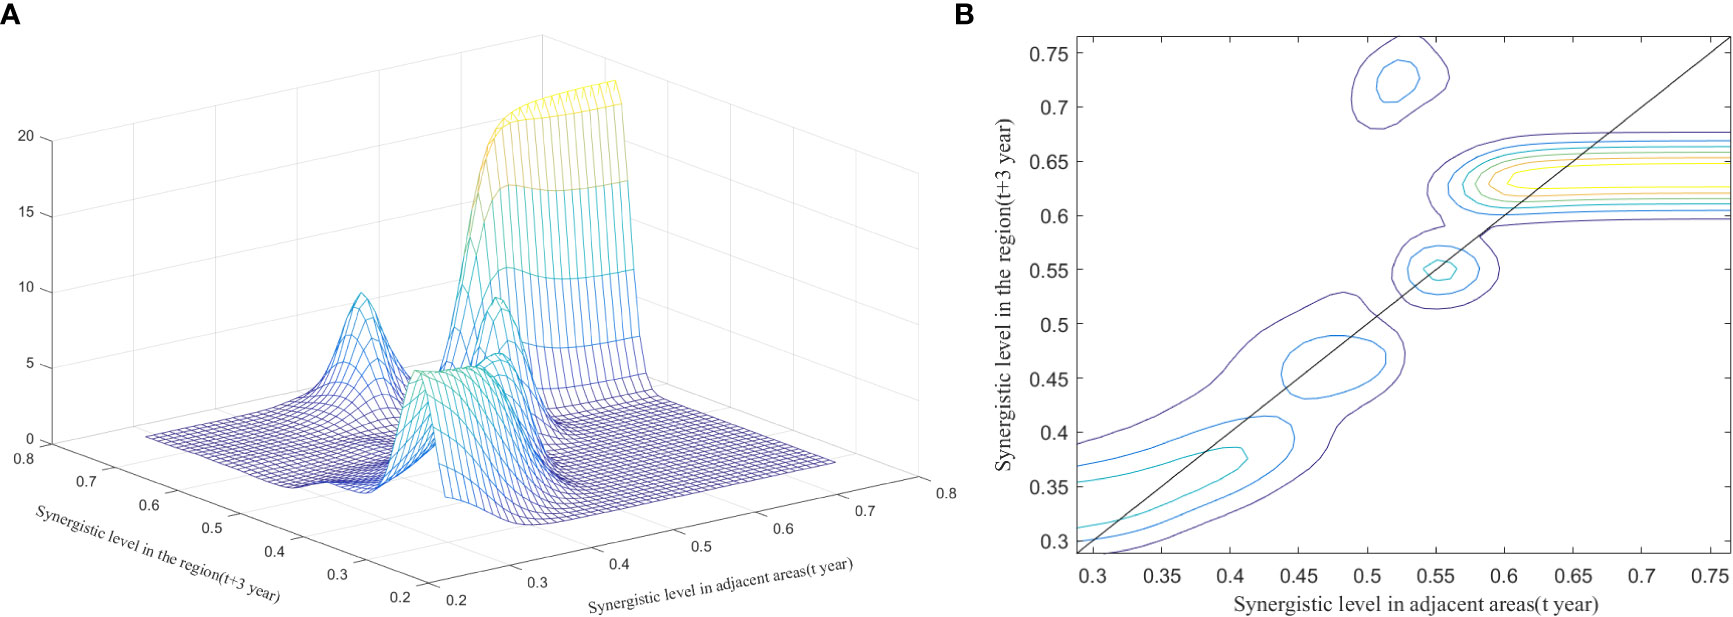
Figure 11 Dynamic Kernel density curve and density contours. (A) Spatial dynamic kernel density; (B) spatial dynamic density contours.
In order to determine the specific transfer pattern of the synergistic level of pollution reduction, carbon reduction, green expansion and economic growth and the impact of neighboring cities on the cities in the region, this paper uses the spatial Markov chain method to carry out the analysis. The spatial Markov shift probability matrix is shown in Table 6.
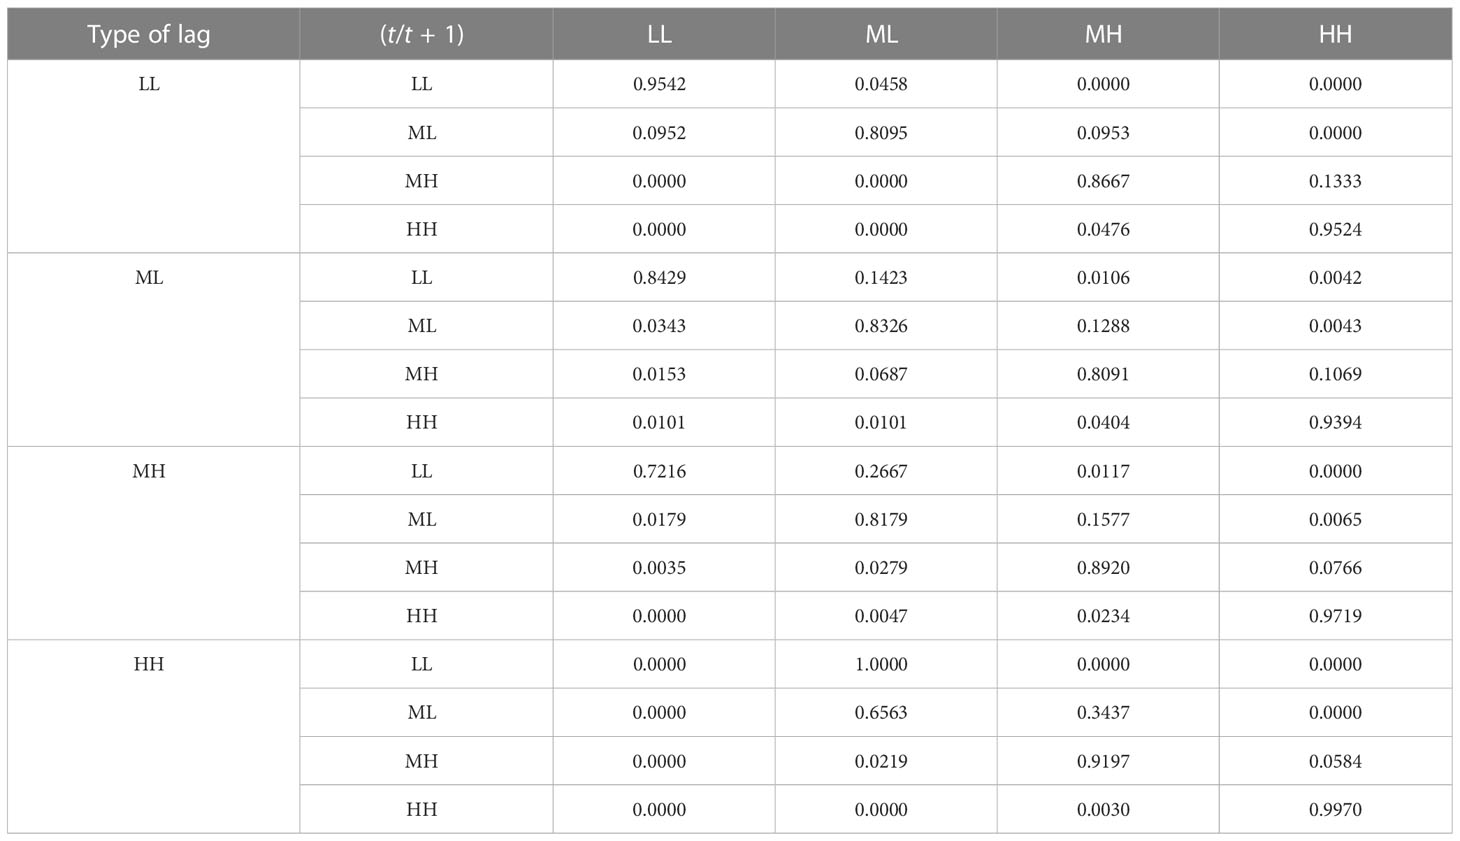
Table 6 Spatial Markov transfer probability matrix.
In general, the four transfer probability matrices are different for different spatial lag types. It indicates that the probability of a shift in the synergistic level of pollution reduction, carbon reduction, green expansion and economic growth in the city varies, showing the differences in the synergistic level of pollution reduction, carbon reduction, green expansion and economic growth in the neighboring cities. The diagonal elements of the transfer probability matrix for different spatial lag types are not entirely larger than the non-diagonal elements. What this means is that the probability of “rank locking” of the synergistic level of pollution reduction, carbon reduction, green expansion and economic growth decreases under the spatial spillover effect, and this phenomenon is particularly obvious under the HH type of lag. In terms of nondiagonal elements, there are all nonzero elements. It indicates that there is instability in the synergistic level of pollution reduction, carbon reduction, green expansion and economic growth. Although the ideal upward shift can be achieved, there is also a certain risk of a downward shift, and a leapfrog shift. In addition, the impact of the same lag type on the synergistic level of pollution reduction, carbon reduction, green expansion and economic growth varies from one lag type to another. Specifically, under the low-level lag condition, the probability of achieving an upward transfer level is 4.58%, 9.53%, and 13.33% for LL, ML, and MH levels, respectively, in increasing order. This means that the probability of transfer is not only influenced by the type of lag but also by the initial level of the synergistic level of pollution reduction, carbon reduction, green expansion and economic growth.
The global Moran index is used to test the spatial correlation of the synergistic level of pollution reduction, carbon reduction, green expansion and growth (Ren et al., 2022), and the results are shown in Table 7. The global Moran’s I index of the inverse distance squared spatial weight matrix and the seven nearest-neighbor spatial weight matrix are all greater than 0, and they all pass the 1% significance level test. This indicates that the distribution of the synergistic level of pollution reduction, carbon reduction, green expansion and economic growth in geospatial locations is not completely random but has obvious clustering characteristics and positive spatial correlation. Compared to the previous two years, two different spatial weights of Moran’s I value increased substantially in 2010, probably because China made more efforts to eliminate backward production capacity this year. On 20 January, the State Council executive meeting put forward six specific targets for eliminating backward production capacity in key industries such as electricity, coal, coke, ferroalloy, calcium carbide, iron and steel, nonferrous metals, building materials, light industry, and textiles. In addition, China has also increased investment in clean energy, vigorously developing wind and solar energy and other clean energy. In order to significantly enhance multi-pollutant synergistic control and regional synergistic governance, industrial enterprises have been prompted by a number of environmental regulations to gradually realize green transformation and development. In addition, the spatial correlation of the synergistic level of pollution reduction, carbon reduction, green expansion and economic growth among cities has been strengthened by the superimposed technology spillover effect.
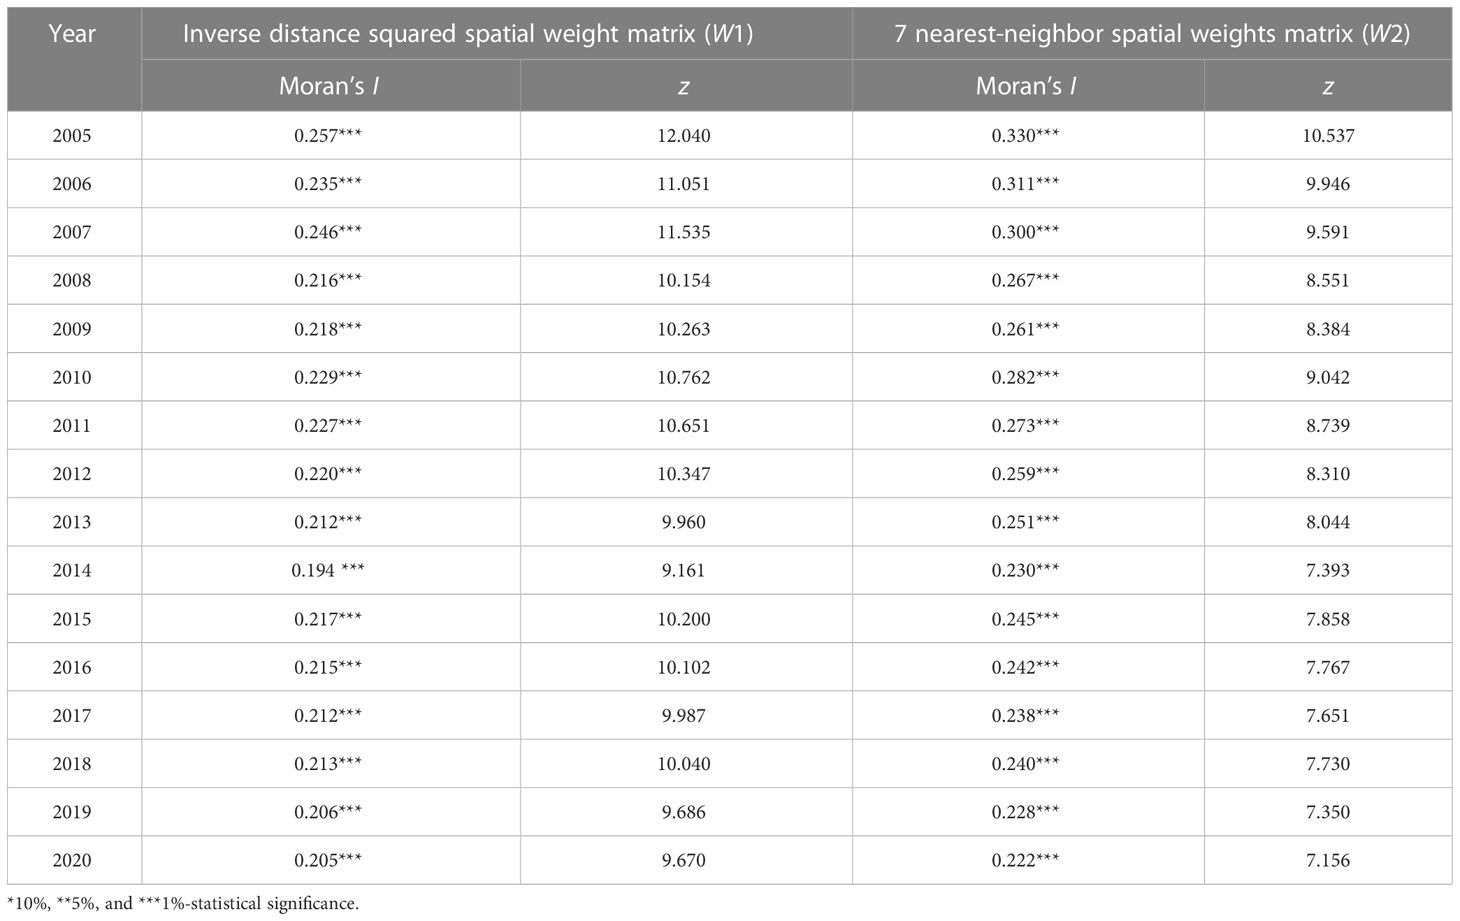
Table 7 Global Moran’s I.
After understanding the spatial correlation of the synergistic level of pollution reduction, carbon reduction, green expansion and economic growth in 243 cities at the prefectural level and above in China. The local Moran’s scatter diagram was further applied to examine the overall distribution and characteristics of the synergistic level of pollution reduction, carbon reduction, green expansion and economic growth at the local spatial level using 2005, 2010, 2015, and 2020 as the four typical time segments of the overall study period. The result is shown in Figure 12. According to the technology diffusion theory, we focus on the high-high-type (quadrant I HH) and low-low-type (quadrant III LL) regions. It can be seen from Figure 12 that there are more cities in quadrants I and III than in quadrants II and IV. There is indeed a significant positive correlation between the spatial distribution of the synergistic level of pollution reduction, carbon reduction, green expansion and economic growth in Chinese cities, which is consistent with the above global test results. Based on the above analysis, it is necessary to use a spatial econometric model when discussing the influential factors of the synergistic level of pollution reduction, carbon reduction, green expansion and economic growth.

Figure 12 Local Moran’s I. (A) 2005; (B) 2010; (C) 2015; (D) 2020.
Based on the previous analysis, the synergistic level of pollution reduction, carbon reduction, green expansion and economic growth is the result of the combined effect of various factors, such as regional innovation level, population size, financial development level, science and technology investment, government intervention, industrial structure, and urbanization level. In this study, we intend to analyze the drivers of the synergistic level of pollution reduction, carbon reduction, green expansion and economic growth in terms of the above indicators. The measures of each indicator are as follows: (1) Innovation level (lnPatt): the logarithmic of the total number of innovation patents granted; (2) Financial development (Financ): the proportion of the balance of RMB loans to GDP of financial institutions at the end of the year; (3) Level of external openness (Openne): Foreign direct investment as a proportion of GDP; (4) Industrial structure (Instru): ratio of secondary sector output to tertiary sector output; (5) Government intervention (Govene): the proportion of local general public budget expenditure to GDP; (6) Education investment (Educat): the proportion of local general public budget expenditure in education; and (7) Population size (lnPopu): the logarithm of the total resident population.
Based on this, this study selects the appropriate spatial econometric model by LM, Wald, LR and Hausman test, and the results are shown in Table 8. It expands the cross-sectional spatial weight matrix to the spatial panel weight matrix before the test to facilitate the extension of the test of the cross-sectional model to panel data analysis. The standard LM-Err and LM-Lag statistics in the LM test are significant. The robust LM test also remains significant when the spatial Durbin model (SDM) is selected, and further, the Wald and LR tests remain significant at the 1% confidence level, indicating that the results reject the original hypothesis and the SDM model cannot degenerate into a SAR or SEM model. So, we choose a spatiotemporal bifixed SDM model with fixed effects by combining the test selection effect and Hausman test results.
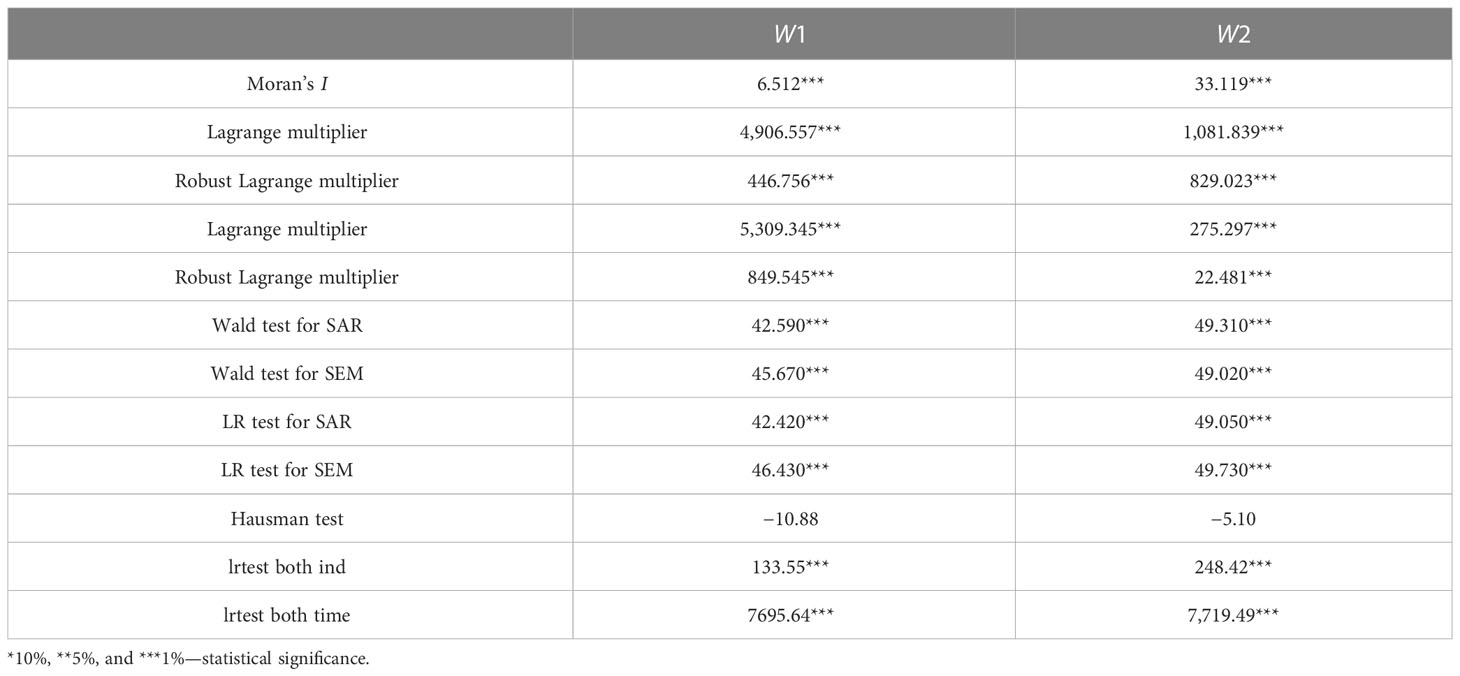
Table 8 LM, Hausman, Wald, and LR test results.
Table 9 presents the results of different factors on the synergistic level of pollution reduction, carbon reduction, green expansion and economic growth under two different weight settings of spatial measures.
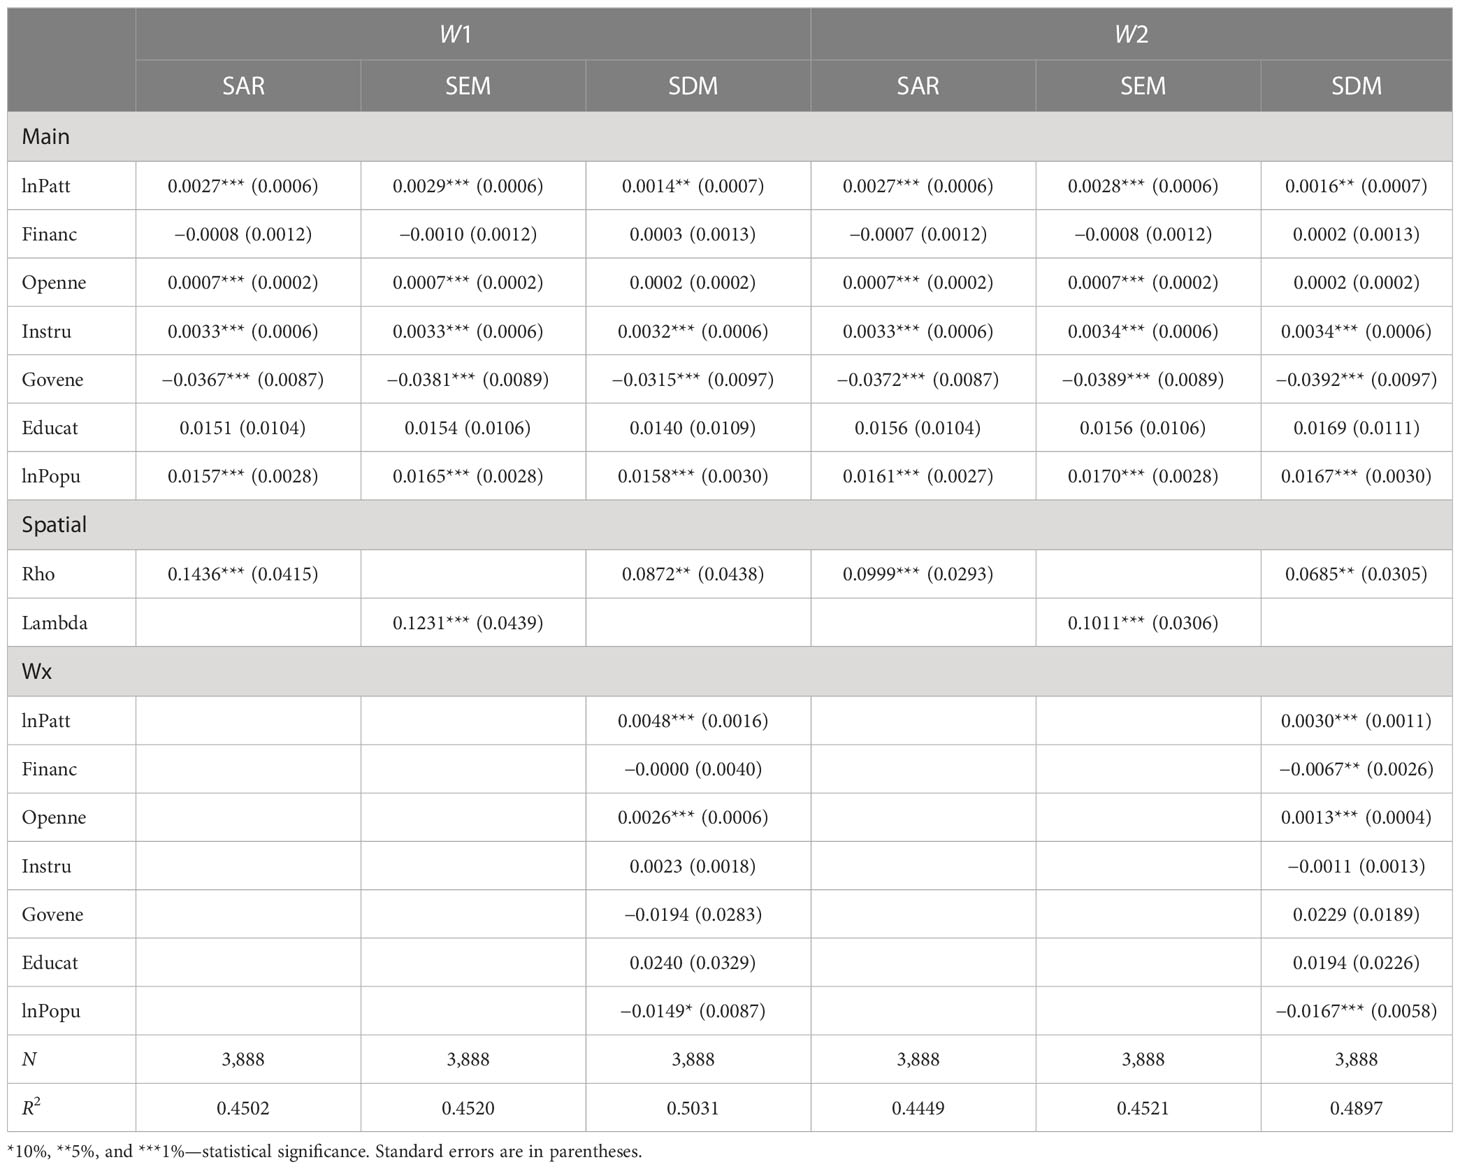
Table 9 Results of analysis of influencing factors.
According to the regression results, the regression coefficients of the level of technological innovation on the synergistic level of pollution reduction, carbon reduction, green expansion and growth are all positive and significant at a 5% confidence level, while the spatial lag coefficient is significantly positive at a 1% confidence level. It indicates that the increase in the level of green technology innovation is conducive to the synergistic promotion of pollution reduction, carbon reduction, green expansion and economic growth and positively affects neighboring cities. The increase in innovation patents implies that the level of green innovation in enterprises has increased, promoting green and sustainable development. The increase in the level of technological innovation is conducive to the effective allocation of resources within the enterprise, promoting the transformation and upgrading of the enterprise, optimizing the production structure of the enterprise, and thus reducing the pollution level of the enterprise. It is also easy for the surrounding areas to imitate and learn from the green technology tools in the region, generating positive spatial spillover effects and demonstration effects of technology (Yi et al., 2022).
The coefficient of the regression of the level of external openness on the synergy of pollution reduction, carbon reduction, green expansion and economic growth is positive but not significant, and the coefficient of the spatial lag is also significantly positive at the 1% confidence level. It indicates that the level of external openness helps to improve the synergistic level of pollution reduction, carbon reduction, green expansion and economic growth on neighboring cities. According to the “pollution halo” hypothesis, in the process of opening up to the outside world, advanced foreign technology and management experience will be introduced to the city’s high value-added industries, through the “spillover effect” of technology, the “demonstration effect” of foreign enterprises, and the “competition effect,” which will promote the optimization and innovation of production methods. At the same time, it also provides the neighboring regions with experience in technology and management methods to learn from. Also, with the increasingly stringent environmental regulations in China, the threshold for the introduction of foreign investment is also rising. The purpose of introducing foreign investment is not only to speed up economic development but also to enhance international competitiveness and achieve high-quality economic development. In this context, increased openness to the outside world can stimulate market vitality and productivity, providing opportunities and the technological basis for enterprises to “green transform,” thereby improving environmental quality and eco-efficiency and promoting the synergy between local and neighboring pollution prevention, carbon reduction, ecological protection, and socioeconomic construction.
The spatial regression coefficients of industrial structure on the synergistic level of pollution reduction, carbon reduction, green expansion and economic growth are all significantly positive at the 1% confidence level, but the spatial lag coefficient is not significant. It indicates that the larger the proportion of secondary industry in GDP, the better the synergistic level of pollution reduction, carbon reduction, green expansion and economic growth. The industrial structure is an essential link between economic development and ecological construction, and the degree of resource consumption and environmental impact in the green innovation process depends on the industrial structure characteristics of each economy. Although the traditional secondary industry will reduce energy efficiency, production may generate economies of scale when it reaches a certain scale. At the same time, local governments implement more stringent environmental standards to accelerate the formation of green production methods in secondary industries. The green and low-carbon industry’s development is beginning to bear fruit, promoting a synergistic effect of pollution reduction, carbon expansion and green growth. However, the spatial spillover effect of the industrial structure is not obvious.
The regression coefficient of government intervention on the synergistic level of pollution reduction, carbon reduction, green expansion and economic growth is negative and meets the 1% significance level, but the spatial lag coefficient is not significant. It indicates that greater government intervention is not conducive to improving the synergistic level of pollution reduction, carbon reduction, green expansion and economic growth. The paper suggests that the “crowding out effect” in the innovation process caused by excessive fiscal expenditure, i.e., local enterprises rely excessively on government financial support and thus reduce their incentive to innovate, resulting in lower efficiency of green innovation, which is not conducive to the sustainable development of enterprises. Appropriate government controls should ensure a steady increase the synergistic level of pollution reduction, carbon reduction, green expansion and economic growth. Therefore, the level of government intervention should be kept within a suitable threshold, and the “catalyst” effect of administrative tools should be effectively utilized.
The spatial regression coefficients of population size on the synergistic level of pollution reduction, carbon reduction, green expansion and economic growth are all significantly positive at a 1% confidence level, while the spatial lag coefficient is significantly negative, at least 10% significant. The possible reasons for this are that the economically developed areas show a “siphon effect” on the population of neighboring cities. Cities with larger populations usually imply higher economic development and higher transportation efficiency, which are conducive to enhancing synergy. On the one hand, economically developed cities have higher requirements for green policies, such as environmental regulations and higher human capital costs. They are more likely to concentrate on high-value added, usually environmentally friendly industries. Therefore, the population size is conducive to promoting the synergistic level of pollution reduction, carbon reduction, green expansion and economic growth. On the other hand, as people “vote with their feet,” the larger the population size of the city, the greater the population flow in the neighboring areas, resulting in the reduction of human capital in neighboring cities. It is easy to cause the phenomenon of talent “depression” in the surrounding regions and a lack of green innovation vitality, which makes it difficult to promote the synergistic level of pollution reduction, carbon reduction, green expansion and economic growth.
In order to measure the magnitude of the impact of the influencing factors on the synergistic level of “pollution reduction, carbon reduction, green expansion and economic growth”, the direct, indirect, and total effects of the model need to be further estimated. The results are shown in Table 10. Taking the inverse distance square spatial weight matrix (W1) as an example, analyze the direct effect, indirect effect, and total effect.
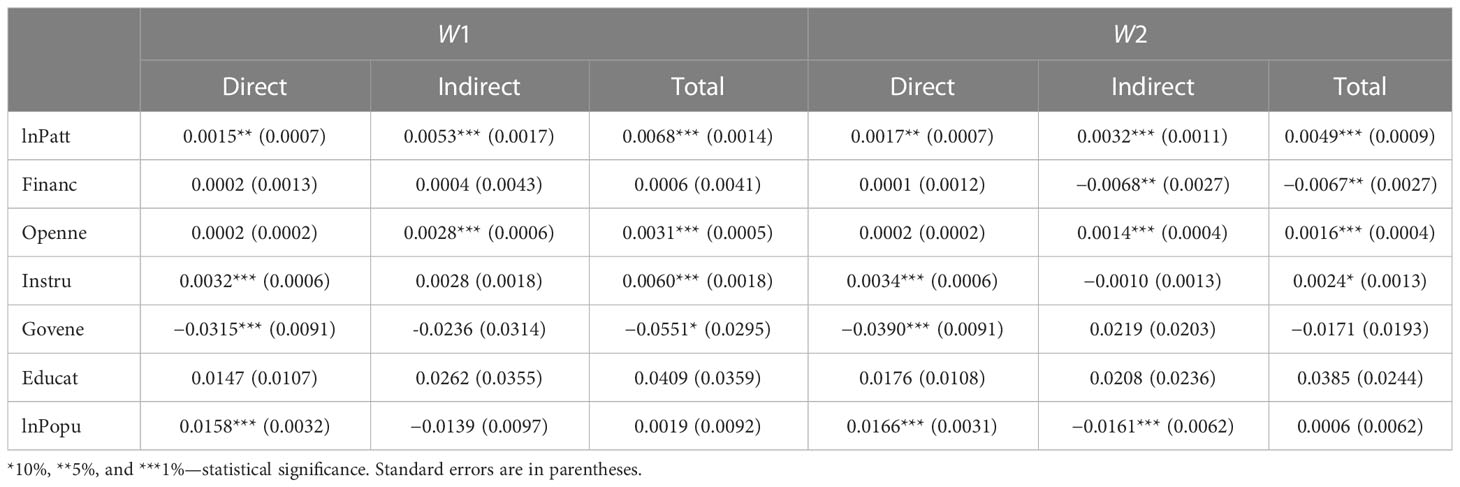
Table 10 Direct effects, indirect effects, and total effects.
From the direct effect, innovation level, industrial structure, government intervention, and population size, the regression coefficients for the synergistic level of pollution reduction, carbon reduction, green expansion and economic growth in the region area are 0.0015, 0.0032, −0.0315, and 0.0158, respectively. Among them, population size is the most important factor affecting the synergistic level in the region, and the support of the population plays a vital important role in the synergistic level of pollution control, carbon emission reduction, green expansion and economic growth.
In terms of indirect effects, for innovation level and level of external openness, the regression coefficients for the synergistic level of pollution reduction, carbon reduction, green expansion and economic growth in neighboring areas is 0.0053 and 0.0028, respectively. Among them, the positive spatial spillover effect of the innovation level is the most obvious. In terms of the total effect of each variable (in innovation level, level of external openness, industrial structure, and government intervention), the regression coefficients for the synergistic level of pollution reduction, carbon reduction, green expansion and economic growth in neighboring areas is 0.0068, 0.0031, 0.0060, and −0.0551, respectively.
This study constructs a comprehensive system evaluation index system of “pollution reduction, carbon reduction, green expansion and economic growth.” We adopt a coupled coordination model to measure the synergistic level of pollution reduction, carbon reduction, green expansion and economic growth of 243 cities in China from 2005 to 2020. Combining the Dagum Gini coefficient, standard deviation ellipse, Kernel density analysis, Markov Chain, spatial exploration analysis method, and spatial econometric model are used to explore the spatial and temporal characteristics, regional differences and sources, evolutionary trends, and driving factors of the synergistic level of pollution reduction, carbon reduction, green expansion and economic growth and the following main conclusions are drawn.
(1) During the study period, the synergistic level of pollution reduction, carbon reduction, green expansion and economic growth in Chinese cities has fluctuated and increased. There were still cities in the moderate disorder stage in 2005, and 100% of cities were already in the mild disorder stage or above in 2015. In terms of spatial pattern, it shows the distribution characteristics of “high in the east - low in the west”. Also, the higher and lower coupling coordination degrees are characterized by a scattered distribution, while the medium level is characterized by the spatial evolution of clusters. The spatial evolution shows a “northeast-southwest” pattern in the standard deviation ellipse, and the center of gravity moves in a “southeast-northwest-southwest” trend.
(2) From the decomposition of regional differences, regional differences are mainly rooted in inter-regional differences; intra-regional differences are generally East > West > Central. In addition, East-West inter-regional differences are the most prominent, followed by East-Central and Central-West inter-regional differences, which are smaller. Without considering the spatial factor, the coupling coordination degree shows a steady increase and has strong continuity. There is a polarization phenomenon in the east, central, and west regions. Under the spatial condition, the static and dynamic estimation results are similar but different, and both have positive spatial correlations. However, when the synergy degree of neighboring cities is at a medium or low level, the positive spatial correlation decreases significantly with the addition of the time factor. Also, the probability of “rank locking” of synergistic development level has been reduced, and there is a leapfrog shift.
(3) The spatial patterns of the synergistic level of pollution reduction, carbon reduction, green expansion and economic growth have a significant positive spatial correlation. Further, innovation level, level of external openness, industrial structure, and population size have a more obvious role in promoting local coordinated development. However, government intervention has a negative impact on synergy. Meanwhile, innovation levels and levels of external openness generate positive spatial spillover effects and contribute to the improvement of synergy in the neighborhood. In contrast, the population size shows a negative spatial spillover effect, relatively hurting the synergistic level of pollution reduction, carbon reduction, green expansion and economic growth in neighboring regions.
Based on the above research findings, the following countermeasures are proposed.
(1) Strengthen the top-level design and build a policy system for synergistic promotion of the four elements. Local governments should take action to effectively implement the dual carbon goals and requirements: “separate and manage” pollution reduction and carbon reduction. While also taking economic construction as the main line of work, they also need to innovate the policy system for the coordinated promotion of pollution reduction, carbon reduction, green expansion and economic growth and form a coordinated and mutually integrated institutional mechanism. Strengthen the top-level design, clarify the timetable and roadmap for the synergistic promotion of pollution reduction, carbon reduction, green expansion and economic growth, and carry out monitoring, evaluation, and assessment of the synergistic promotion of the transportation, power, and chemical industries. Accelerate the establishment of management regulations for collaborative promotion, formulate and improve relevant laws and regulations, establish sound rules and regulations, and strengthen law enforcement capacity building.
(2) Strengthen the role of radiation to achieve overall regional synergy. Emphasis is placed on the spatial linkage of synergistic development between cities to accelerate the development of pilot demonstration areas for collaborative promotion of pollution reduction, carbon reduction, green expansion and economic growth. Summarizing and promoting the experience of high-level coordination areas such as Shenzhen and Shanghai promptly, giving full play to the advantages of economic location, and encouraging key areas to carry out pilot demonstration work is significant. Strengthen exchanges and cooperation among cities and expand the radiation-driven role of high coordination level areas in the synergistic promotion of pollution reduction, carbon reduction, green expansion and economic growth using technology overflow, talent overflow, and system overflow. Encourage those who live in locations with low levels of regional cooperation to study and adopt cutting-edge green technologies from their neighbors and to continuously explore the potential of pollution reduction and carbon reduction. By promoting joint prevention and control of the regional ecological environment to eliminate the spatial pattern of differentiated urban ecological resilience, reduce the local risk of ecological resilience, and reduce pollutant and carbon emissions. High-level regions should dovetail well with other regions to achieve complementary advantages and a reasonable division of labor in order to eliminate current regional barriers and impediments to factor flows to gradually narrow the gap inter-regionally in terms of the level of development of the synergistic level of pollution reduction, carbon reduction, green expansion and economic growth.
(3) To enhance the vitality of collaborative development by applying precise policies according to local conditions. According to the current situation of synergistic level of pollution reduction, carbon reduction, green expansion and economic growth, each city should combine its resource characteristics, economic foundation, and ecological advantages and scientifically formulate the strategy of coordinated promotion. The government should increase investment in R&D funding and education, promote the transformation of green patent results, and enhance regional collaborative innovation capabilities to enhance ecological resilience and adaptability. It should also reasonably guide population clustering, effectively develop strategies to attract talent, and break down barriers to the flow of resources such as cultural innovation, capital, and talent. Actively study and learn from advanced resource management experience and technical means at domestic and international levels, benchmark advanced production technology, and accelerate the restructuring of energy-intensive industries. Based on the principle of governance at source, promote the green and low-carbon transformation of key secondary industries such as oil and cement, accelerate the green transformation of industrial sectors, and guide industries to green production and prevention at source. Cities should continuously deepen the reform of regional administrative management systems and effectively break down administrative barriers that are not conducive to the free flow of factor resources. The government should establish a decision-making mechanism to guide high-quality economic development and adhere to long-term government actions.
Although this study analyzes in depth the spatial and temporal differentiation and driving forces of the synergistic level of carbon reduction, pollution expansion and green growth and obtains many valuable conclusions, there are still some limitations. Firstly, the scope of the study can be more diverse. Based on the availability of data, this study constructs a systematic and comprehensive evaluation index system of pollution reduction, carbon reduction, green expansion and economic growth based on city-level statistics. In future studies, based on the availability of data, the research sample will be expanded to the county level. Secondly, there are various factors affecting the synergistic development of carbon reduction, pollution expansion, green growth and economic growth etc. This paper analyzes the influence of the level of innovation, financial development, level of openness to the outside world, industrial structure, government intervention, investment in education, and population size. In future research, more factors affecting the synergistic level of carbon reduction, pollution reduction, green expansion and economic growth, such as the digital economy, need to be identified to further clarify the path. Thirdly, the synergistic promotion of carbon reduction, pollution reduction, green expansion and economic growth is a dynamic process, and its connotation is constantly enriched and improved. In future research, the comprehensive index system of carbon reduction, pollution reduction, green expansion and economic growth should be adjusted according to the development of the times. Moreover, the dimensions of “green expansion” can be further refined to build a more scientific and comprehensive index system to improve the precision of the research. In addition, a more in-depth analysis of the synergistic mechanisms of the four is also the focus of future research work.
The original contributions presented in the study are included in the article/supplementary material. Further inquiries can be directed to the corresponding authors.
Conceptualization: CH and XM. Methodology: CH, QL, and LY. Software: CH, LY, and QL. Validation: CH, YL, and XC. Data curation: CH, XC, and LY. Writing—original draft preparation: CH. Writing—review and editing: CH, XM, QL, LY, and XC. Visualization: CH, XM, and QL. Supervision: CH, XM, and QL. Project administration: XM. Funding acquisition: XM and QL. All authors contributed to the article and approved the submitted version.
This research was funded by the National Natural Science Foundation of China (Grant No. 72003144), the National Social Science Foundation of China (No. 21XRK007), the Planning Research Project of Guangxi Philosophy and Social Science (Grant No. 21CYJ016), and the Innovation Project of Guangxi Graduate Education (Grant No. YCSW2022164; YCSW2023122).
We are so grateful to the reviewers and editors for their suggestions.
The authors declare that the research was conducted in the absence of any commercial or financial relationships that could be construed as a potential conflict of interest.
All claims expressed in this article are solely those of the authors and do not necessarily represent those of their affiliated organizations, or those of the publisher, the editors and the reviewers. Any product that may be evaluated in this article, or claim that may be made by its manufacturer, is not guaranteed or endorsed by the publisher.
Abdullah S., Morley B. (2014). Environmental taxes and economic growth: Evidence from panel causality tests. Energy Econ. 42, 27–33. doi: 10.1016/j.eneco.2013.11.013
Ali M. U., Gong Z., Ali M. U., Wu X., Yao C. (2021). Fossil energy consumption, economic development, inward FDI impact on CO2 emissions in Pakistan: Testing EKC hypothesis through ARDL model. Int. J. Financ. Econ. 26, 3210–3221. doi: 10.1002/ijfe.1958
Almeida T. A. D. N., Cruz L., Barata E., García-Sánchez I. (2017). Economic growth and environmental impacts: An analysis based on a composite index of environmental damage. Ecol. Indic. 76, 119–130. doi: 10.1016/j.ecolind.2016.12.028
Bai C., Quayson M., Sarkis J. (2021). COVID-19 pandemic digitization lessons for sustainable development of micro-and small- enterprises. Sustain. Prod. Consump. 27, 1989–2001. doi: 10.1016/j.spc.2021.04.035
Bollen J., van der Zwaan B., Brink C., Eerens H. (2009). Local air pollution and global climate change: A combined cost-benefit analysis. Resour. Energy Econ. 31, 161–181. doi: 10.1016/j.reseneeco.2009.03.001
Borghesi S., Vergalli S. (2022). The European green deal, energy transition and decarbonization. Environ. Resource Economics. 83, 1–3. doi: 10.1007/s10640-022-00726-6
Boyce J. K., Zwickl K., Ash M. (2016). Measuring environmental inequality. Ecol. Econ. 124, 114–123. doi: 10.1016/j.ecolecon.2016.01.014
Bradbury I., Kirkby R. (1996). China's agenda 21: A critique. Appl. Geogr. 16, 97–107. doi: 10.1016/0143-6228(95)00030-5
Burtraw D., Krupnick A., Palmer K., Paul A., Toman M., Bloyd C. (2003). Ancillary benefits of reduced air pollution in the US from moderate greenhouse gas mitigation policies in the electricity sector. J. Environ. Econ. Manage. 45, 650–673. doi: 10.1016/S0095-0696(02)00022-0
Chen W., Chen Y. (2021). Two-step measurement of water–energy–food symbiotic coordination and identification of key influencing factors in the Yangtze River Basin. Entropy. 23, 798. doi: 10.3390/e23070798
Chen Z., Li B., Jia S., Ye X. (2023). Modeling and simulation analysis of vehicle pollution and carbon reduction management model based on system dynamics. Environ. Sci. pollut. Res. 30, 14745–14759. doi: 10.1007/s11356-022-23245-9
Chen J., Zhang W., Song L., Wang Y. (2022). The coupling effect between economic development and the urban ecological environment in Shanghai port. Sci. Total Environ. 841, 156734. doi: 10.1016/j.scitotenv.2022.156734
Chen Y., Zhao L. (2019). Exploring the relation between the industrial structure and the eco-environment based on an integrated approach: A case study of Beijing, China. Ecol. Indic. 103, 83–93. doi: 10.1016/j.ecolind.2019.04.001
Chen J., Zhou C., Wang S., Li S. (2018). Impacts of energy consumption structure, energy intensity, economic growth, urbanization on PM2.5 concentrations in countries globally. Appl. Energy. 230, 94–105. doi: 10.1016/j.apenergy.2018.08.089
Cheng Z., Chen X., Wen H. (2022). How does environmental protection tax affect corporate environmental investment? Evidence from Chinese listed enterprises. Sustainability. 14, 2932. doi: 10.3390/su14052932
Dagum C. (1997). A new approach to the decomposition of the Gini income inequality ratio. Empir. Econ. 22, 515–531. doi: 10.1007/978-3-642-51073-1_4
Dang H. H., Trinh T. (2021). Does the COVID-19 lockdown improve global air quality? New cross-national Evidence on its unintended consequences. J. Environ. Econ. Manage. 105, 102401. doi: 10.1016/j.jeem.2020.102401
Deng G., Li X., Chen J. (2021). Research on coupling coordination and the development of green shipping and economic growth in China. Sustainability. 13, 13901. doi: 10.3390/su132413901
Dinda S. (2004). Environmental Kuznets curve hypothesis: A survey. Ecol. Econ. 49, 431–455. doi: 10.1016/j.ecolecon.2004.02.011
Dong Z., Xia C., Fang K., Zhang W. (2022). Effect of the carbon emissions trading policy on the co-benefits of carbon emissions reduction and air pollution control. Energy Policy. 165, 112998. doi: 10.1016/j.enpol.2022.112998
Du M., Zhang X. (2020). Urban greening: A new paradox of economic or social sustainability? Land Use Pol. 92, 104487. doi: 10.1016/j.landusepol.2020.104487
Fan Q., Qiao Y., Zhang T., Huang K. (2021). Environmental regulation policy, corporate pollution control and economic growth effect: Evidence from China. Environ. Challenges. 5, 100244. doi: 10.1016/j.envc.2021.100244
Grossman G. M., Krueger A. B. (1995). Economic growth and the environment. Q. J. Economics. 110, 353–377. doi: 10.2307/2118443
Gu A., Teng F., Feng X. (2018). Effects of pollution control measures on carbon emission reduction in China: Evidence from the 11th and 12th Five-Year Plan. Clim. Policy. 18, 198–209. doi: 10.1080/14693062.2016.1258629
Guerriero C., Chatzidiakou L., Cairns J., Mumovic D. (2016). The economic benefits of reducing the levels of nitrogen dioxide (NO2) near primary schools: The case of london. J. Environ. Manage. 181, 615–622. doi: 10.1016/j.jenvman.2016.06.039
Haken H., Wunderlin A., Yigitbasi S. (1995). An introduction to synergetics. Open Syst. Inf. Dyn. 3, 97–130. doi: 10.1007/BF02228811
Han H., Ding T., Nie L., Hao Z. (2020). Agricultural eco-efficiency loss under technology heterogeneity given regional differences in China. J. Clean Prod. 250, 119511. doi: 10.1016/j.jclepro.2019.119511
He M., Xu Z., Hou D., Gao B., Cao X., Ok Y. S., et al. (2022). Waste-derived biochar for water pollution control and sustainable development. Nat. Rev. Earth Environ. 3, 444–460. doi: 10.1038/s43017-022-00306-8
Holland S. P., Mansur E. T., Muller N. Z. (2020). Decompositions and policy consequences of an extraordinary decline in air pollution from power generation. Am. Economic Journal: Economic Policy. 12, 244–274. doi: 10.1257/pol.20190390
Hou H., Su L., Guo D., Xu H. (2023). Resource utilization of solid waste for the collaborative reduction of pollution and carbon emissions: Case study of fly ash. J. Clean Prod. 383, 135449. doi: 10.1016/j.jclepro.2022.135449
Hu J. (2023). Synergistic effect of pollution reduction and carbon emission mitigation in the digital economy. J. Environ. Manage. 337, 117755. doi: 10.1016/j.jenvman.2023.117755
Hu H., Lv T., Zhang X., Xie H., Fu S., Geng C., et al. (2023). Spatiotemporal heterogeneity and decoupling decomposition of industrial carbon emissions in the Yangtze River Delta urban agglomeration of China. Environ. Sci. pollut. Res. 30, 50412–50430. doi: 10.1007/s11356-023-25794-z
Jia W., Li L., Lei Y., Wu S. (2023). Synergistic effect of CO2 and PM2.5 emissions from coal consumption and the impacts on health effects. J. Environ. Manage. 325, 116535. doi: 10.1016/j.jenvman.2022.116535
Jiang P., Khishgee S., Alimujiang A., Dong H. (2020). Cost-effective approaches for reducing carbon and air pollution emissions in the power industry in China. J. Environ. Manage. 264, 110452. doi: 10.1016/j.jenvman.2020.110452
Jin X., Li X., Feng Z., Wu J., Wu K. (2020). Linking ecological efficiency and the economic agglomeration of China based on the ecological footprint and nighttime light data. Ecol. Indic. 111, 106035. doi: 10.1016/j.ecolind.2019.106035
Klinenberg E., Araos M., Koslov L. (2020). Sociology and the climate crisis. Annu. Rev. Sociol. 46, 649–669. doi: 10.1146/annurev-soc-121919-054750
Kong Y., He W., Zhang Z., Shen J., Yuan L., Gao X., et al. (2022). Spatial-temporal variation and driving factors decomposition of agricultural grey water footprint in China. J. Environ. Manage. 318, 115601. doi: 10.1016/j.jenvman.2022.115601
Lee J., Gong J., Li S. (2017). Exploring spatiotemporal clusters based on extended Kernel estimation methods. Int. J. geographical Inf. Sci. IJGIS. 31, 1154–1177. doi: 10.1080/13658816.2017.1287371
Lefever D. W. (1926). Measuring geographic concentration by means of the standard deviational ellipse. Am. J. Sociol. 32, 88–94. doi: 10.1086/214027
Li C., Gan Y. (2021). The spatial spillover effects of green finance on ecological environment–Empirical research based on spatial econometric model. Environ. Sci. pollut. Res. 28 (5), 5651–5665. doi: 10.1007/s11356-020-10961-3
Li X., Hu Z., Cao J. (2021). The impact of carbon market pilots on air pollution: Evidence from China. Environ. Sci. pollut. Res. 28, 62274–62291. doi: 10.1007/s11356-021-14995-z
Li Z., Luan R., Lin B. (2022b). The trend and factors affecting renewable energy distribution and disparity across countries. Energy. 254, 124265. doi: 10.1016/j.energy.2022.124265
Li F., Wang X., Liu H., Li X., Zhang X., Sun Y., et al. (2018). Does economic development improve urban greening? Evidence from 289 cities in China using spatial regression models. Environ. Monit. Assess. 190, 541. doi: 10.1007/s10661-018-6871-4
Li G., Yanase A. (2022). Trade, resource use and pollution: A synthesis. Environ. Resource Economics. 83, 861–901. doi: 10.1007/s10640-022-00713-x
Li Q., Yang L., Jiang F., Liu Y., Guo C., Han S. (2022a). Distribution characteristics, regional differences and spatial convergence of the water-energy-land-food nexus: A case study of China. Land. 11, 1543. doi: 10.3390/land11091543
Liang W., Yang M. (2019). Urbanization, economic growth and environmental pollution: Evidence from China. Sustain. Computing: Inf. Systems. 21, 1–9. doi: 10.1016/j.suscom.2018.11.007
Lin B. (2022). China's high-quality economic growth in the process of carbon neutrality(in Chinese). Economic Res. J. 57, 56–71. Available at: https://kns.cnki.net/kcms2/article/abstract?v=dlzqEeXOOWsfclRzsGCRe7KrvyNpgoQSB9to5AuL9Nz-Oc3-tVDFNGu4Av7ZrLElJEVIhURz6o9X0chbextO63D6uCu7dppZT9tZ7S2aogwamqZZoTWBp6fMjv5PKCbiefKPAPACqsc=&uniplatform=NZKPT&language=CHS.
Lin B., Sun C. (2010). Evaluating carbon dioxide emissions in international trade of China. Energy Policy. 38, 613–621. doi: 10.1016/j.enpol.2009.10.014
Liu H., Chen Y. D., Liu T., Lin L. (2019). The river chief system and river pollution control in China: A case study of Foshan. Water. 11, 1606. doi: 10.3390/w11081606
Liu B., Wang J., Li R. Y. M., Peng L., Mi L. (2022a). Achieving carbon neutrality – the role of heterogeneous environmental regulations on urban green innovation. Front. Ecol. Evol. 10, 923354. doi: 10.3389/fevo.2022.923354
Liu J., Zhou W., Yang J., Ren H., Zakeri B., Tong D., et al. (2022b). Importing or self-dependent: Energy transition in Beijing towards carbon neutrality and the air pollution reduction co-benefits. Clim. Change. 173, 18. doi: 10.1007/s10584-022-03413-z
Mallucci E. (2022). Natural disasters, climate change, and sovereign risk. J. Int. Econ. 139, 103672. doi: 10.1016/j.jinteco.2022.103672
Mardani A., Streimikiene D., Cavallaro F., Loganathan N., Khoshnoudi M. (2019). Carbon dioxide (CO2) emissions and economic growth: A systematic review of two decades of research from 1995 to 2017. Sci. Total Environ. 649, 31–49. doi: 10.1016/j.scitotenv.2018.08.229
Muringani J., Fitjar R. D., Rodríguez-Pose A. (2021). Social capital and economic growth in the regions of Europe. Environ. planning. A. 53, 1412–1434. doi: 10.1177/0308518X211000059
Nam K., Waugh C. J., Paltsev S., Reilly J. M., Karplus V. J. (2014). Synergy between pollution and carbon emissions control: Comparing China and the United States. Energy Econ. 46, 186–201. doi: 10.1016/j.eneco.2014.08.013
Nepal R., Paija N. (2019). Energy security, electricity, population and economic growth: The case of a developing South Asian resource-rich economy. Energy Policy. 132, 771–781. doi: 10.1016/j.enpol.2019.05.054
Ongan S., Işık C., Amin A., Bulut U., Rehman A., Alvarado R., et al. (2023). Are economic growth and environmental pollution a dilemma? Environ. Sci. pollut. R. 30, 49591–49604. doi: 10.1007/s11356-0
Orubu C. O., Omotor D. G. (2011). Environmental quality and economic growth: Searching for environmental Kuznets curves for air and water pollutants in Africa. Energy Policy. 39, 4178–4188. doi: 10.1016/j.enpol.2011.04.025
Özokcu S., Özdemir Ö. (2017). Economic growth, energy, and environmental Kuznets curve. Renewable Sustain. Energy Rev. 72, 639–647. doi: 10.1016/j.rser.2017.01.059
Qi Y., Zhang J., Chen J. (2023). Tax incentives, environmental regulation and firms’ emission reduction strategies: Evidence from China. J. Environ. Econ. Manage. 117, 102750. doi: 10.1016/j.jeem.2022.102750
Qiao H., Zheng F., Jiang H., Dong K. (2019). The greenhouse effect of the agriculture-economic growth-renewable energy nexus: Evidence from G20 countries. Sci. Total Environ. 671, 722–731. doi: 10.1016/j.scitotenv.2019.03.336
Qureshi M. I., Rasli A. M., Zaman K. (2016). Energy crisis, greenhouse gas emissions and sectoral growth reforms: Repairing the fabricated mosaic. J. Clean. Prod. 112, 3657–3666. doi: 10.1016/j.jclepro.2015.08.017
Rao C., Yan B. (2020). Study on the interactive influence between economic growth and environmental pollution. Environ. Sci. pollut. R. 27, 39442–39465. doi: 10.1007/s11356-020-10017-6
Ren S., Hao Y., Xu L., Wu H., Ba N. (2021). Digitalization and energy: How does internet development affect China's energy consumption? Energy Econ. 98, 105220. doi: 10.1016/j.eneco.2021.105220
Ren S., Hao Y., Wu H. (2022). How does green investment affect environmental pollution? Evidence from China. Environmental and Resource Economics. 81, 25–51. doi: 10.1007/s10640-021-00615-4
Shu Y., Hu J., Zhang S., Schöpp W., Tang W., Du J., et al. (2022). Analysis of the air pollution reduction and climate change mitigation effects of the Three-Year Action Plan for Blue Skies on the “2+26“ cities in China. J. Environ. Manage. 317, 115455. doi: 10.1016/j.jenvman.2022.115455
Song M., Peng J., Wang J., Zhao J. (2018). Environmental efficiency and economic growth of China: A ray slack-based model analysis. Eur. J. Oper. Res. 269, 51–63. doi: 10.1016/j.ejor.2017.03.073
Sun C., Yan X., Zhao L. (2021). Coupling efficiency measurement and spatial correlation characteristic of water–energy–food nexus in China. Resources Conserv. Recycling. 164, 105151. doi: 10.1016/j.resconrec.2020.105151
Sun X., Zhang H., Ahmad M., Xue C. (2022). Analysis of influencing factors of carbon emissions in resource-based cities in the Yellow River Basin under carbon neutrality target. Environ. Sci. pollut. Res. 29, 23847–23860. doi: 10.1007/s11356-021-17386-6
Tang Y., Zhao X., Jiao J. (2020). Ecological security assessment of Chaohu Lake Basin of China in the context of River Chief System Reform. Environ. Sci. pollut. Res. 27, 2773–2785. doi: 10.1007/s11356-019-07241-0
United Nations (UN) (2015) Transforming our world: the 2030 agenda for sustainable development. Available at: https://sustainabledevelopment.un.org/post2015/transformingourworld/publication.
van Vuuren D. P., Cofala J., Eerens H. E., Oostenrijk R., Heyes C., Klimont Z., et al. (2006). Exploring the ancillary benefits of the Kyoto Protocol for air pollution in Europe. Energy Policy. 34, 444–460. doi: 10.1016/j.enpol.2004.06.012
Wang M., Feng C. (2023). Measuring capacity utilization under the constraints of energy consumption and CO2 emissions using meta-frontier DEA: A case of China's non-ferrous metal industries. Resour. Policy. 80, 103278. doi: 10.1016/j.resourpol.2022.103278
Wang N., Fu X., Wang S. (2022). Spatial-temporal variation and coupling analysis of residential energy consumption and economic growth in China. Appl. Energy. 309, 118504. doi: 10.1016/j.apenergy.2021.118504
Wang L., Wang H., Dong Z., Wang S., Cao Z. (2021). The air pollution effect of government economic growth expectations: Evidence from China’s cities based on green technology. Environ. Sci. pollut. Res. 28, 27639–27654. doi: 10.1007/s11356-021-12536-2
Wang J., Wei X., Guo Q. (2018). A three-dimensional evaluation model for regional carrying capacity of ecological environment to social economic development: model development and a case study in China. Ecol. Indic. 89, 348–355. doi: 10.1016/j.ecolind.2018.02.005
Wang L., Zhang M. (2021). Exploring the impact of narrowing urban-rural income gap on carbon emission reduction and pollution control. PloS One. 16, e259390. doi: 10.1371/journal.pone.0259390
Wen H., Liang W., Lee C. C. (2023). China's progress toward sustainable development in pursuit of carbon neutrality: Regional differences and dynamic evolution. Environ. Impact Assess. Rev. 98, 106959. doi: 10.1016/j.eiar.2022.106959
Xia F., Xu J. (2020). Green total factor productivity: A re-examination of quality of growth for provinces in China. China Econ. Rev. 62, 101454. doi: 10.1016/j.chieco.2020.101454
Xiao R., Yu X., Xiang T., Zhang Z., Wang X., Wu J. (2021). Exploring the coordination between physical space expansion and social space growth of China’s urban agglomerations based on hierarchical analysis. Land Use Pol. 109, 105700. doi: 10.1016/j.landusepol.2021.105700
Xie H., Wen J., Choi Y. (2021). How the SDGs are implemented in China–a comparative study based on the perspective of policy instruments. J. Clean. Prod. 291, 125937. doi: 10.1016/j.jclepro.2021.125937
Xing L., Xue M., Hu M. (2019). Dynamic simulation and assessment of the coupling coordination degree of the economy–resource–environment system: Case of Wuhan City in China. J. Environ. Manage. 230, 474–487. doi: 10.1016/j.jenvman.2018.09.065
Xu Z., Chau S. N., Chen X., Zhang J., Li Y., Dietz T., et al. (2020). Assessing progress towards sustainable development over space and time. Nature. 577, 74–78. doi: 10.1038/s41586-019-1846-3
Xu W., Cheng B., You M., Yu J. (2022). Economic growth, urban governance, and environment protection. Emerg. Mark. Financ. Trade. 58, 2218–2228. doi: 10.1080/1540496X.2021.1967740
Xu Y., Masui T. (2009). Local air pollutant emission reduction and ancillary carbon benefits of SO2 control policies: Application of AIM/CGE model to China. Eur. J. Oper. Res. 198, 315–325. doi: 10.1016/j.ejor.2008.07.048
Xue W., Lei Y., Liu X., Shi X., Liu Z., Xu Y., et al. (2023). Synergistic assessment of air pollution and carbon emissions from the economic perspective in China. Sci. Total Environ. 858, 159736. doi: 10.1016/j.scitotenv.2022.159736
Xue D., Yue L., Ahmad F., Draz M. U., Chandio A. A., Ahmad M., et al. (2022). Empirical investigation of urban land use efficiency and influencing factors of the Yellow River Basin Chinese Cities. Land Use Pol. 117, 106117. doi: 10.1016/j.landusepol.2022.106117
Yan Z., Zhou Z., Du K. (2023). How does environmental regulatory stringency affect energy consumption? Evidence from Chinese firms. Energy Econ. 118, 106503. doi: 10.1016/j.eneco.2023.106503
Yang Y., Ji X., Deng L., Ma R. (2023). How does a good environment affect firms’ productivity? Evidence from urban public green spaces in China. Front. Energy Res. 10. doi: 10.3389/fenrg.2022.1054699
Yang X., Lin W., Gong R., Zhu M., Springer C. (2021). Transport decarbonization in big cities: An integrated environmental co-benefit analysis of vehicles purchases quota-limit and new energy vehicles promotion policy in Beijing. Sust. Cities Soc. 71, 102976. doi: 10.1016/j.scs.2021.102976
Yang Y., Qu S., Cai B., Liang S., Wang Z., Wang J., et al. (2020). Mapping global carbon footprint in China. Nat. Commun. 11, 2237. doi: 10.1038/s41467-020-15883-9
Yi M., Lu Y., Wen L., Luo Y., Xu S., Zhang T. (2022). Whether green technology innovation is conducive to haze emission reduction: Empirical Evidence from China. Environ. Sci. pollut. Res. 29, 12115–12127. doi: 10.1007/s11356-021-16467-w
Yu Y., Jin Z., Li J., Jia L. (2020). Low-carbon development path research on China’s power industry based on synergistic emission reduction between CO2 and air pollutants. J. Clean. Prod. 275, 123097. doi: 10.1016/j.jclepro.2020.123097
Yu D., Li X., Yu J., Li H. (2021). The impact of the spatial agglomeration of foreign direct investment on green total factor productivity of Chinese cities. J. Environ. Manage. 290, 112666. doi: 10.1016/j.jenvman.2021.112666
Yuan H., Feng Y., Lee J., Liu H., Li R. (2020). The spatial threshold effect and its regional boundary of financial agglomeration on green development: A case study in China. J. Clean Prod. 244, 118670. doi: 10.1016/j.jclepro.2019.118670
Yue S., Lu R., Chen H., Yuan J. (2018). Does financial development promote the win-win balance between environmental protection and economic growth? Environ. Sci. pollut. Res. 25, 36438–36448. doi: 10.1007/s11356-018-3549-y
Zahoor Z., Latif M. I., Khan I., Hou F. (2022). Abundance of natural resources and environmental sustainability: The roles of manufacturing value-added, urbanization, and permanent cropland. Environ. Sci. pollut. Res. 29, 82365–82378. doi: 10.1007/s11356-022-21545-8
Zhang R., Zhong C. (2023). The establishment of the national key ecological functional zone and the county’s ecological green development. Front. Ecol. Evol. 11. doi: 10.3389/fevo.2023.1144245
Zhang J., Zhang P., Wang R., Liu Y., Lu S. (2023). Identifying the coupling coordination relationship between urbanization and forest ecological security and its impact mechanism: Case study of the Yangtze River Economic Belt, China. J. Environ. Manage. 342, 118327. doi: 10.1016/j.jenvman.2023.118327
Zhao X., Mahendru M., Ma X., Rao A., Shang Y. (2022). Impacts of environmental regulations on green economic growth in China: New guidelines regarding renewable energy and energy efficiency. Renew. Energy. 187, 728–742. doi: 10.1016/j.renene.2022.01.076
Zhu K., Zhou Q., Cheng Y., Zhang Y., Li T., Yan X., et al. (2023). Regional sustainability: Pressures and responses of tourism economy and ecological environment in the Yangtze River Basin, China. Front. Ecol. Evol. 11. doi: 10.3389/fevo.2023.1148868
Zhuo Z., Du E., Zhang N., Nielsen C. P., Lu X., Xiao J., et al. (2022). Cost increase in the electricity supply to achieve carbon neutrality in China. Nat. Commun. 13, 3172. doi: 10.1038/s41467-022-30747-0
Keywords: high-quality development, urban ecological security, synergistic effect, Dagum Gini coefficient, Kernel Density, factor analysis
Citation: Hu C, Ma X, Yang L, Chang X and Li Q (2023) Spatial-temporal variation and driving forces of the synergy of “pollution reduction, carbon reduction, green expansion and economic growth”: evidence from 243 cities in China. Front. Ecol. Evol. 11:1202898. doi: 10.3389/fevo.2023.1202898
Received: 09 April 2023; Accepted: 20 June 2023;
Published: 28 July 2023.
Edited by:
Hualin Xie, Jiangxi University of Finance and Economics, ChinaReviewed by:
Ying Zhu, Xi’an University of Architecture and Technology, ChinaCopyright © 2023 Hu, Ma, Yang, Chang and Li. This is an open-access article distributed under the terms of the Creative Commons Attribution License (CC BY). The use, distribution or reproduction in other forums is permitted, provided the original author(s) and the copyright owner(s) are credited and that the original publication in this journal is cited, in accordance with accepted academic practice. No use, distribution or reproduction is permitted which does not comply with these terms.
*Correspondence: Qiangyi Li, bGlxaWFuZ3lpQGd4bnUuZWR1LmNu; Xiaoyu Ma, bWF4aWFveXVAeGp1LmVkdS5jbg==
Disclaimer: All claims expressed in this article are solely those of the authors and do not necessarily represent those of their affiliated organizations, or those of the publisher, the editors and the reviewers. Any product that may be evaluated in this article or claim that may be made by its manufacturer is not guaranteed or endorsed by the publisher.
Research integrity at Frontiers
Learn more about the work of our research integrity team to safeguard the quality of each article we publish.