 Sheng Ye1,2,3,4*
 Desheng Pei5*
- 1Chongqing University, Chongqing, China
- 2Chongqing Institute of Green and Intelligent Technology, Chinese Academy of Sciences, Chongqing School, University of Chinese Academy of Sciences, Chongqing, China
- 3Chongqing Geomatics and Remote Sensing Center, Chongqing, China
- 4Key Laboratory of Monitoring, Evaluation and Early Warning of Territorial Spatial Planning Implementation, Ministry of Natural Resources, Chongqing, China
- 5School of Public Health, Chongqing Medical University, Chongqing, China
Microplastic (MP) pollution is an emerging environmental issue. While it is evident that human activities are the primary source of MP pollution, the relationship between land use and MP pollution in rivers requires further study. Using data from 26 MP monitoring sites in the Chongqing section of the Yangtze River, we analyzed MP data along with land use and construction data. We improved the model for the Land Use Intensity Composite Index (LUI) to obtain correlations between land use and MP pollution. We found: 1) The concentration of microplastics in surface water (MPsw) in the Chongqing section of the Yangtze River gradually declined from upstream (central urban section of Chongqing) to downstream (northeastern section of Chongqing). 2) From 2016 to 2020, MPsw in the Chongqing section of the Yangtze River decreased by about 7.5-fold. 3) MPsw in the Chongqing section of the Yangtze River was positively correlated with the amount of surrounding urban and garden land. When the buffer radius was 1 km, the correlation coefficient was 0.53 (p < 0.05). With increasing buffer radius, the correlation between land use and gradually weakened. 4) The LUI was also strongly correlated with MPsw. The correlation was strongest when the buffer radius was 1 km, with a correlation coefficient of 0.59 (p < 0.05). At all buffer scales, microplastics in sediments (MPss) was positively correlated with village land and arable land . Unlike MPsw, as the buffer radius increased, the strength of the correlations between land use types and MPss gradually increased. The LUI was strongly correlated with MPsw . As the buffer radius increases, the correlation between the two gradually weakens. These results provide information useful for remediation and reduction of MP in river systems.
Highlights
● Microplastics are declining in the Chongqing section of the Yangtze River.
● There are spatial differences in microplastics in the Chongqing section of the Yangtze River.
● The correlation between land use and microplastics is affected by buffer scale.
● Microplastics were positively correlated with urban and garden areas.
1 Introduction
Water resources cover about 71% of the surface of the earth and are the main source of water for human life, agriculture, and development (Bhuvanesh et al., 2022). Due to anthropogenic influences, surface water resources have become polluted, posing a threat to human health and aquatic ecosystems (Anas et al., 2019). Thus, surface water pollution is one of the main global crises faced by humans. In addition to sulfur dioxide, nitrogen oxides, fine particles, chemical oxygen demand, ammonia nitrogen, and other conventional pollutants, new pollutants such as microplastics have recently been found in surface water resources (Mao R. et al., 2020; Issaka et al., 2023). Microplastics (MP) are a new type of persistent organic pollutant with a particle size of<5 mm (Agarwal, 2020; Lozano and Rillig, 2020; Rillig and Lehmann, 2020). MP are becoming an increasing focus of research in environmental science and ecology because of their differences in degradation and complex interactions with environmental media and other pollutants, which can directly or indirectly affect aquatic and terrestrial communities (Bank and Hansson, 2019; Baho et al., 2021; Hoellein and Rochman, 2021). Microplastics are globally distributed, and have been documented in the Arctic, Antarctic, Mariana Trench, Mount Everest, Rhine River, Yangtze River, Seine River, Columbia River, the Great Lakes of the United States, Qinghai Tibet Plateau lakes, Qinghai Lake, and many other areas (Browne et al., 2011; Auta et al., 2017; Ajith et al., 2020; Yuan et al., 2022). Most research on MP globally has focused on marine environments (Bakir et al., 2020; Fang et al., 2021; Liu M. et al., 2021), with research on MP in freshwater environments being relatively scarce. In fact, the concentration of microplastics in some inland rivers is much higher than that in the ocean (Luo et al., 2018). Compared to the marine environment, the inland freshwater environment is more closely linked to human activities. Existing research on MP in freshwater environments has mainly focused on regions such as the middle and lower reaches of the Yangtze River (Li et al., 2020), and the Pearl River in China (Yan et al., 2019), while there has been relatively little research on river MP in more remote areas such as the upper reaches of the Yangtze River.
Land is a bridge between humans and natural ecosystems, and changes in land use can affect ecosystems such as the aquatic environment, leading to changes in the structure and function of these ecosystems (Luan and Liu, 2022; Katusiime et al., 2023). Human activities are the main source of MP production and therefore, land use changes will inevitably have an impact on MP pollution (Chen et al., 2021; Wei et al., 2022). Recent studies have begun to analyze the relationship between land use and MP (Klein et al., 2015; Barrows et al., 2018). For example, Zhang et al. (2022) studied the effects of land use on the distribution of soil MP in the Qinghai-Tibet Plateau. Hao et al. (2022) studied the effects of land use on the abundance of MP in the Loess Plateau. Guo et al. (2020) and Bläsing and Amelung (2018) conducted studies on the origins of MP in soil. Research on factors influencing MP pollution currently focuses on aspects such as the impact of land use methods on soil MP; there have been relatively few preliminary studies of factors influencing river MP. For example, Fan et al. (2022) and others have conducted preliminary analysis and research on the factors influencing MP in surface water of the Xishui River Basin. Research on the relationship between river MP and land use is also limited. In particular, research on the relationship between land use intensity and river MP has not yet been conducted. Here we present research on the relationship between land use and MP in the aquatic environment at multiple scales. The results of this research can inform policy recommendations and future research prospects for better prevention and remediation of MP pollution in river systems.
1.1 Study area
The Yangtze River is the third longest river in the world, with a total length of 6,300 km. Previous studies have suggested that the Yangtze River is the largest source of MP to the ocean (Lebreton et al., 2017; Mai et al., 2020), but controversy remains (Meijer et al., 2021). The Chongqing section of the Yangtze River flows through mountainous and hilly areas at the southern border of the Sichuan Basin and the Eqian Mountains. The Chongqing section of the Yangtze River runs from Yangshi Town in Jiangjin District to Peishi Township in Wushan County, with a total length of about 691 km. The Yangtze River traverses the territory of Chongqing from west to east, and flows through 18 districts and counties, including Jiangjin, Yongchuan, Banan, and Dadukou, with a drainage area of 82,000 km2. With a large population and rapid economic development, Chongqing is the economic center of the upper reaches of the Yangtze River, with an urbanization rate of over 70%. These variations in land use provide a suitable area for this study. The scope of the study area is shown in Figure 1.
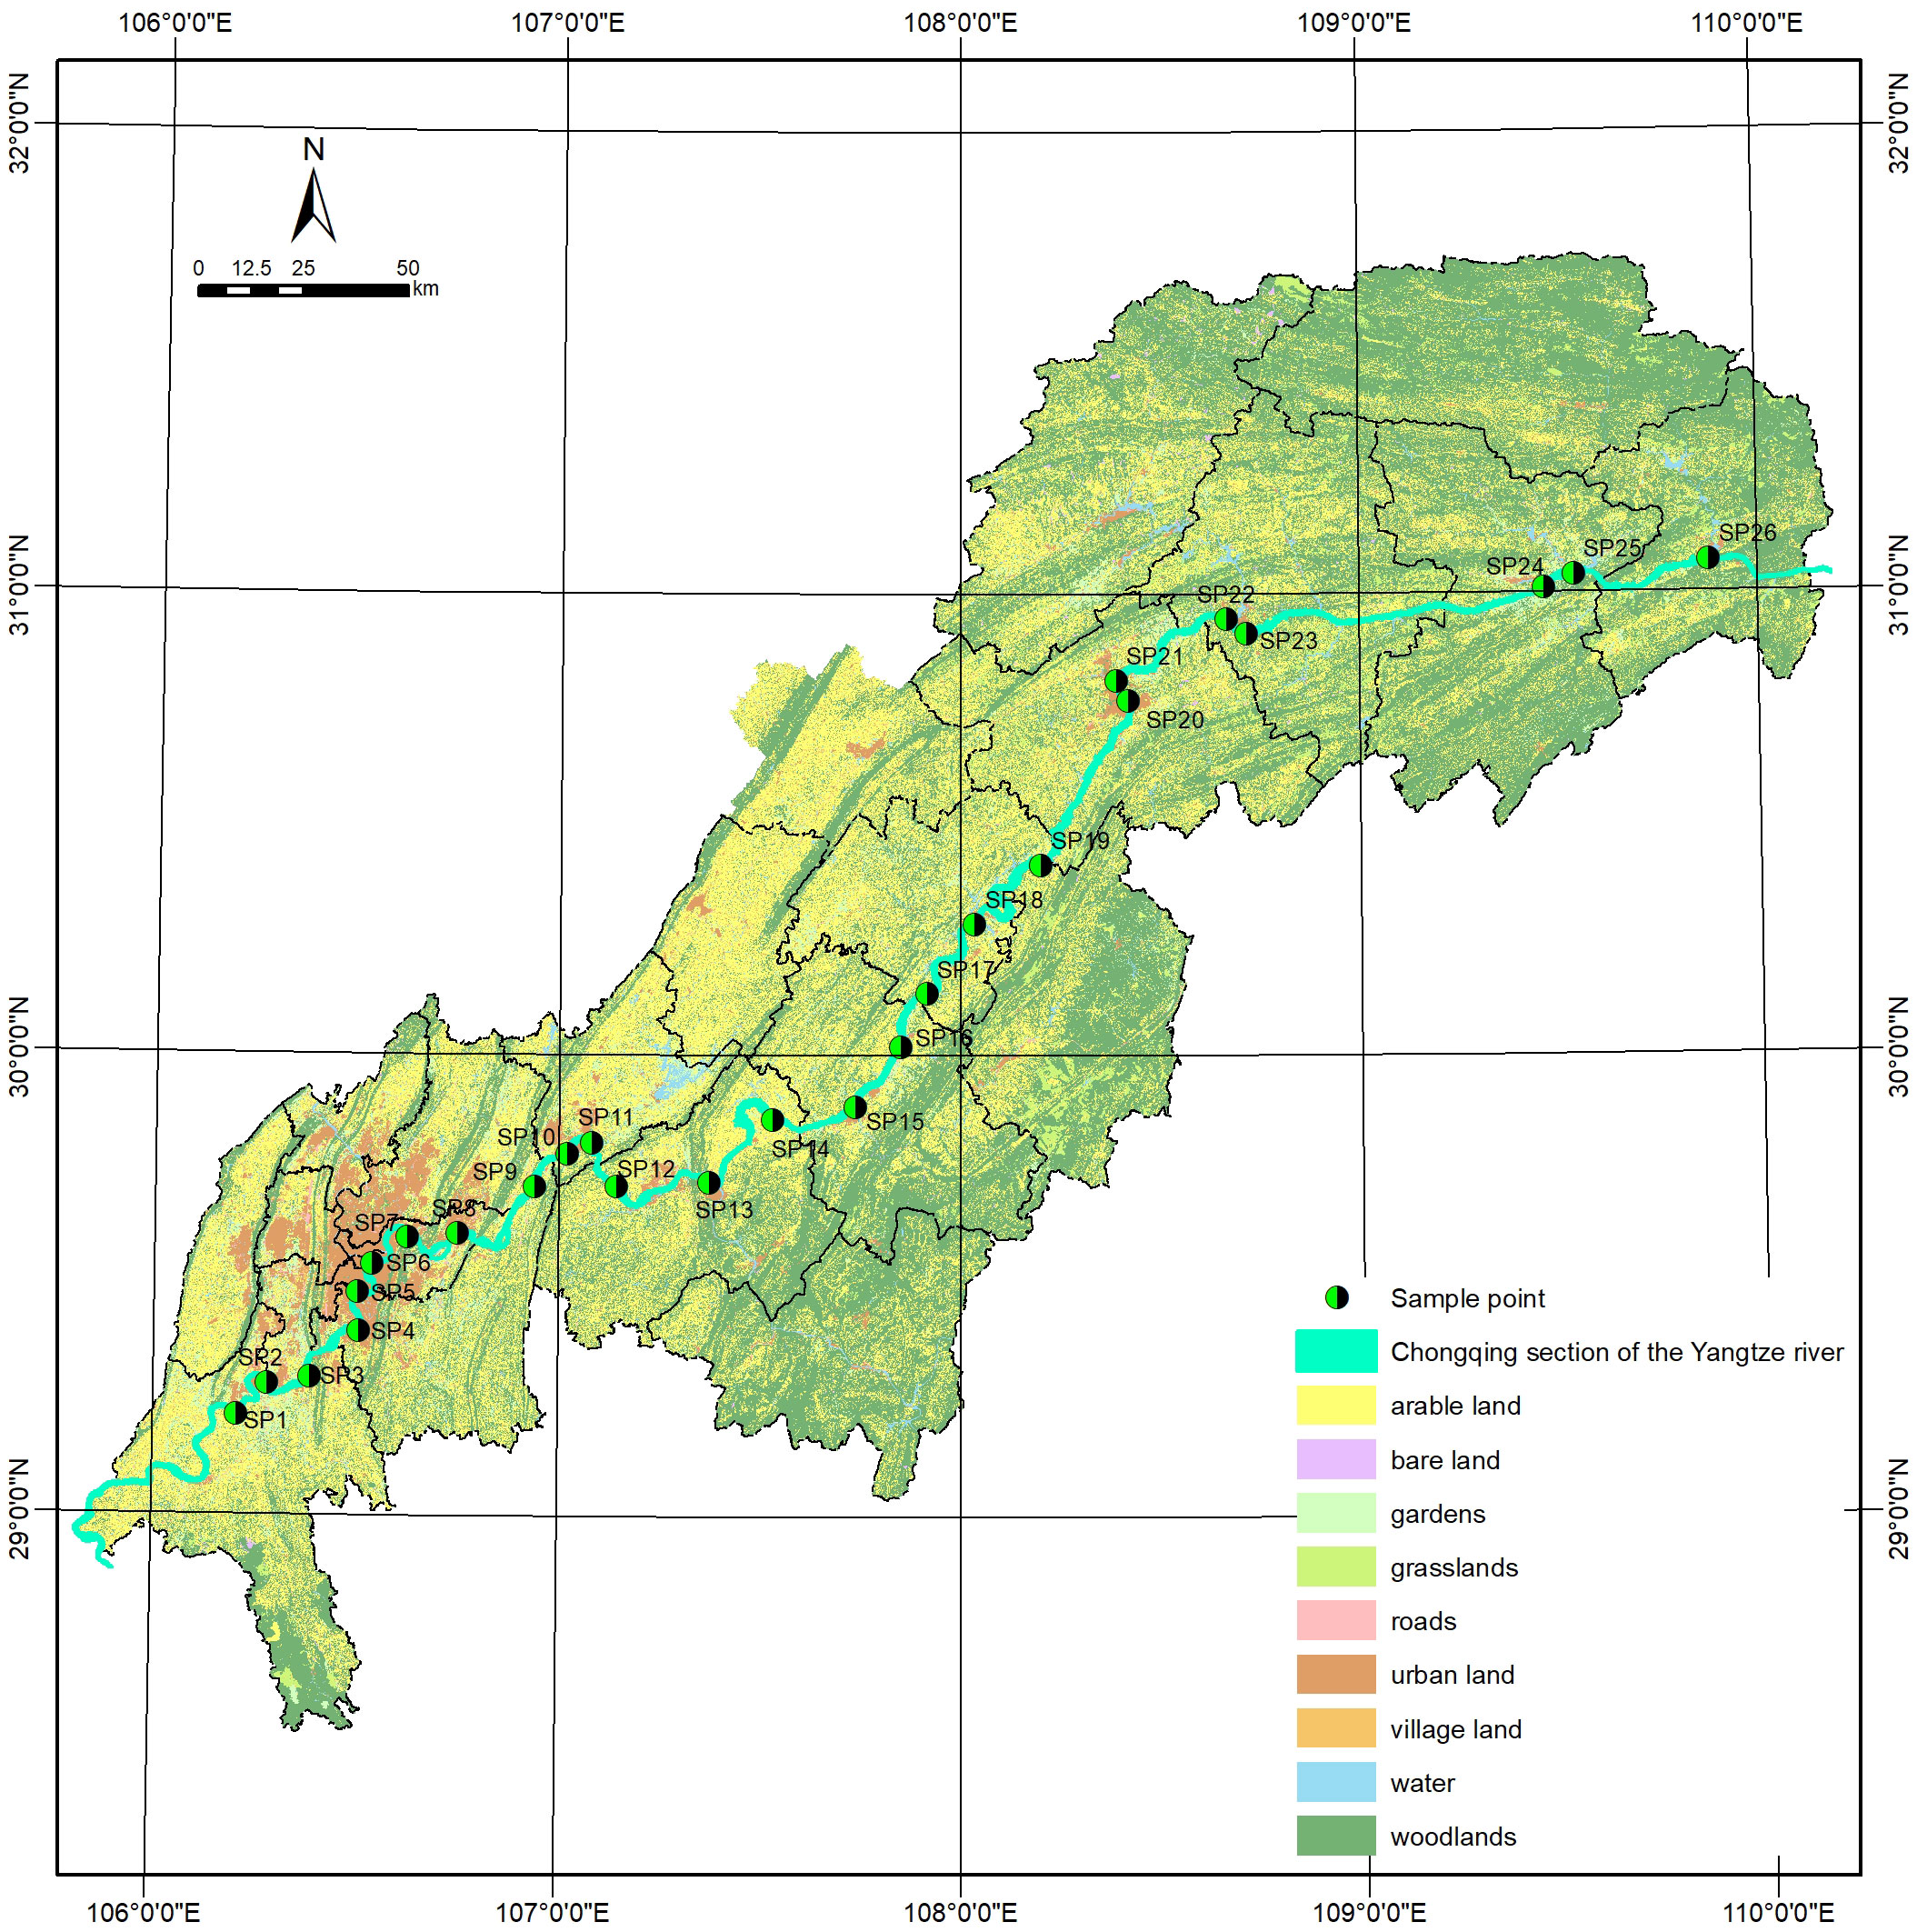
Figure 1 Study area map.
1.2 Data sources
We used three main types of data for this study: ① MP concentrations in surface water and sediments of the Chongqing section of the Yangtze River collected in 2016 and 2020 were obtained from Wuhan Botanical Garden, Chinese Academy of Sciences (Di, 2019; Yuan et al., 2022); ② current land use data for Chongqing in 2020 were obtained from remote sensing interpretation; and ③ building data in 2020 were obtained from a 1:2000 topographic map.
1.3 Methods
1.3.1 Sampling and analysis of river MP samples
Twenty-six sampling sites were selected that were evenly distributed in the Chongqing section of the Yangtze River, including urban, suburban, and rural areas. The coordinates of the sampling points were recorded with a GPS locator. Twenty-five liters of surface water were collected from each sampling point at a sampling depth of 1 m, filtered through a 48-μm stainless steel sieve, and the residue on the filter was rinsed with deionized water into a 50-mL wide-mouth glass bottle. Samples were fixed in 5% formalin at 4°C prior to laboratory analysis. At the same location, sediment was collected using a grab sampler, placed in a 1-L glass wide-mouth bottle, and stored at 4°C. Replicate sample numbers were established for each sampling point for water and sediment samples. During the sampling process, all sampling tools and solvents were isolated from contact with plastic materials at all times to prevent contamination. All sampling tools were cleaned before each sample collection (Di, 2019). Water samples were treated with 30% H2O2 for 12 h to dissolve natural organic matter in the water (Liebezeit and Dubaish, 2012). Each sample was diluted with an appropriate amount of deionized water and then vacuum-filtered. The filter membrane was 0.45-μm glass fiber filter paper (GF/F, diameter 47 mm, Whatman). The filter paper was placed in a glass Petri dish, dried in a 50°C oven, and the material on the film was observed with a stereoscopic microscope.
Extraction of MP in sediments was conducted using the two-step density separation method of Nuelle et al. (Nuelle et al., 2014), with a slight modification. First, 500 g of sediment were placed in a 2-L glass beaker, 1 L of saturated NaCl solution was added, the mixture was stirred for 2 min and allowed to settle for 10 min. The supernatant was passed through a 48-μm stainless steel sieve, the MP on the sieve were washed into a beaker, and the beaker was covered with tinfoil. Each sample was extracted three times and the filtered NaCl solution was recovered. After the first extraction step, the remaining sediment was collected and transferred to a 500-mL triangular flask; 60% NaI solution was added to about 3/4 of the volume of the flask. The mixture was then shaken on a shaker at 200 rpm for 2 min and allowed to settle for 10 min. After stratification, the supernatant was treated as in the first step. The shaking and extraction process was repeated 3 times for each sample and the NaI solution was also recovered. Finally, the suspension obtained from these two steps was combined and 30% H2O2 was added to digest natural organic matter. The subsequent vacuum filtration and drying steps were the same as for the water samples.
Finally, a digital camera (M165FC, Leica, Germany) was used to visually inspect the material on the filter paper under a dissecting microscope. To avoid misidentification and underestimation of microplastics it is necessary to standardize the plastic particle selection, following certain criteria to guarantee proper identification. We visually distinguished plastics according to the following criteria: no cellular or organic structures are visible, fibers should be equally thick throughout their entire length, particles must present clear and homogeneous colors, and if they are transparent or white, they must be examined under high magnification and a fluorescence microscope (Hidalgo-Ruz et al., 2012). During observation of the MP, the concentration of MP in each sample was recorded. The MP concentration for surface water samples was calculated as the number of MP per m3 (n/m³). The concentration of MP in sediments was calculated as the number of MP per kg (n/kg wet weight).
1.3.2 Redundancy analysis
Redundancy analysis (RDA) models were used to study the ability to explain the MP concentrations based on land use. The RDA models were tested using the Monte Carlo method (500 random samples) along with the significance of the RDA analysis results. In gradient sorting calculations, RDA and canonical correspondence analysis (CCA) can be used for linear or single peaks, respectively. Generally, de-trend correspondence analysis (DCA) is used to determine the maximum values of the gradients along four axes before gradient sorting. If the gradient is short (≤3), linear fitting is better; i.e., the RDA linear model method is more suitable for sorting. If the gradient is long (≥4), the single-peak model fits better and the CCA single-peak model is more suitable. If the gradient is between 3 and 4, both methods are applicable (Jan and Petr, 2003). The general RDA calculation formula is:
where (X;Wk) and (Y;Vz) are two sets of standardized variables for X- and Y-extracted components, respectively. The ecological analysis software Canoco (v.5) was used to analyze the relationship between MP concentration and land use in the Chongqing section of the Yangtze River. The correlation between the two in the sorting chart of the RDA analysis is represented by the cosine of the angle between the arrows. The larger the cosine value, the greater the correlation between the two. A longer arrow line indicates that that type of land use has a greater influence on the abundance of MP than shorter arrow lines.
1.3.3 Improved comprehensive index model of land use intensity
Land-use intensity composite index models are used to measure the extent to which human activities affect land use patterns. Based on relevant research (Zhuang and Liu, 1997; Brown and Vivas, 2005; Chen and Lin, 2013; Chen et al., 2015; Ge and Yue, 2016), the standard method was improved to support the study environment and goals. Using the previous method, land use intensity was divided into four levels according to land use type: other land (corresponding to bare land); woodlands, grass, and water (corresponding to woodlands, grasslands, and water); agricultural land (corresponding to arable lands, gardens); and developed land (corresponding to towns, villages, industrial mines, and transportation infrastructure) with intensity classification indices of 1, 2, 3, and 4, respectively. Considering that the intensity of developed land varies greatly, this level should be further broken down to provide greater objectivity and reflect realistic conditions. Therefore, in this study, developed land was further refined into three grades based on the actual proportion of developed land. For a volume ratio ≤ 1, the intensity classification index was set to 4; for 1< volume ratio ≤ 3, the intensity classification index was set to 5; and when the volume ratio was > 3, the intensity classification index was set to 6. Therefore, in this study, the land use intensity classification index was established as 1, 2, 3, 4, 5, and 6 in increasing order. Since there may be a variety of land use patterns in each region, the comprehensive index of land use intensity (LUI) was used to reflect the intensity of land use, with the following formula:
where LUI is the comprehensive index of land use intensity for the sampling area, Ai is the grade i land use intensity classification index for the sampling area, Si is the area of grade i land use in the sampling area, S is the total area in the sampling area, and n is the number of land use intensity grades.
2 Results
2.1 MP concentrations in the Chongqing section of the Yangtze River
The average concentration of microplastics in surface water (MPsw) in the Chongqing section of the Yangtze River was 4807 ± 2706n/m³, gradually decreasing from upstream (Chongqing central city section) to downstream (northeast section of Chongqing). The average MPsw in the central urban section of Chongqing was 6811 ± 3101 n/m³, in the northeast section of Chongqing was 3564 ± 1640n/m³, and in the central urban area was about twice that of the northeastern section of Chongqing. The highest MPsw was located at the SP7 sampling site in Nan’an District, while other relatively high concentrations were present at the Changshou SP10 sampling site and the Fuling SP13 sampling site. There was a clear turning point at the SP14 sampling site in eastern Fuling, where the MPsw changed from high to low (Figure 2).
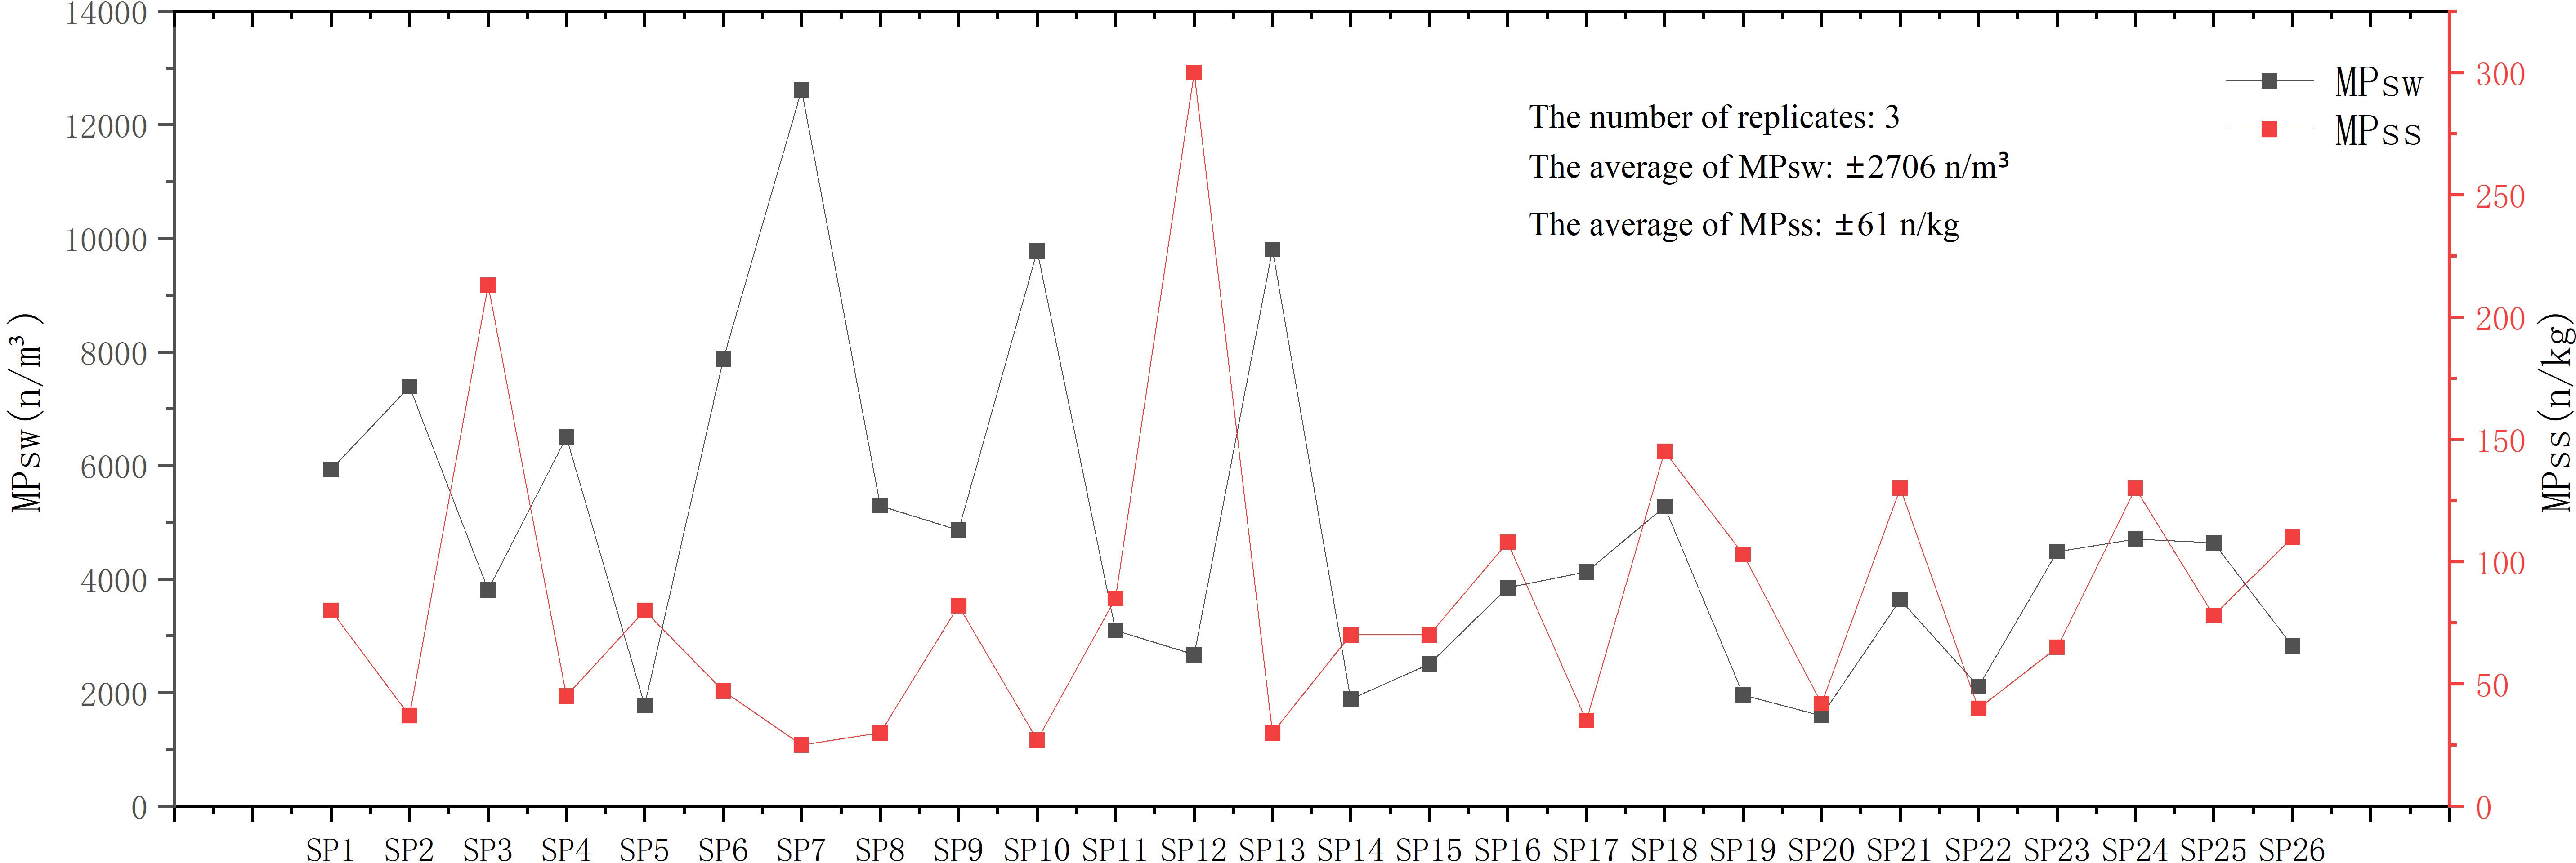
Figure 2 MP concentrations in the Chongqing section of the Yangtze River.
The average concentration of microplastics in sediments (MPss) in the Chongqing section of the Yangtze River was 84.9 ± 61 n/kg, gradually increasing from upstream (central urban section of Chongqing) to downstream (northeastern section of Chongqing). The average MPss in the central urban area of Chongqing was 45.4 ± 28 n/kg, in the northeastern section of Chongqing was 89.6 ± 69 n/kg, and the northeastern section of Chongqing was about twice that of the central urban section of Chongqing (Figure 2).
2.2 Trends in MP concentration in the Chongqing section of the Yangtze River
In recent years, levels of MPsw pollution in the Chongqing section of the Yangtze River have been improving. From 2016 to 2020, the MPsw of the Chongqing section of the Yangtze River decreased by about 7.5 times. In 2016, the average MPsw in the Chongqing section of the Yangtze River was 4700 ± 2605 n/m³ and had declined to 623 ± 265 n/m³ by 2020. Subregionally, MPsw in the central urban section of Chongqing improved more than the northeast section of Chongqing. From 2016 to 2020, MPsw in the central urban section of Chongqing fell from 6227 ± 2889 n/m³ to 589 ± 243 n/m³, a decrease of about 10.6 times. From 2016 to 2020, MPsw in the northeast section of Chongqing fell from 4016 ± 1876 n/m³ to 705 ± 271 n/m³, a decrease of about 5.7 times. Judging from this data comparison, the central urban section of Chongqing has received better treatment or source control of MP.
2.3 Composition of land use types at different scales
Previous studies have shown that the land use from 100 to 2000 m from the shoreline is significantly correlated with the water quality of the river (Duan et al., 2017; Xu et al., 2017; Xiang et al., 2018). Combined with the width of the Yangtze River, buffer radii of 1 km, 1.5 km, and 2 km from the sampling points were selected for this study. ArcGIS 10.3 software was used to plot circles with buffer radii of 1 km, 1.5 km, and 2 km around each sampling point. The three buffer ranges were superimposed on the land use maps and land use data within the three buffer ranges around each sample were obtained. The field fusion tool was used to combine the land use data for different sampling points to ensure that there was only one record for each land type within the buffer range of each sampling point. Finally, the attribute sheet records for the sampling points were exported to Excel and Origin for sorting and statistical analysis.
When the buffer radius was 1 km, the proportion of towns, villages, roads, and arable land was small, and that of woodland, grassland, bare land, and garden land was large. When the buffer radius was 2 km, the proportion of towns, villages, roads, and arable land was large, and that of woodland, grassland, bare land, and garden land was small.
When the buffer radius was 1 km, water area accounted for 62.9% of the total, followed by urban land at 21.8%. Sampling points SP4, SP5, SP6, and SP7 were located in the central urban section of Chongqing in the main stream of the Yangtze River, so the proportion of urban land use was relatively high. In addition, SP10 and SP20 were located in the Changshou urban section and the Wanzhou urban section of the Yangtze River, respectively (Figure 3).
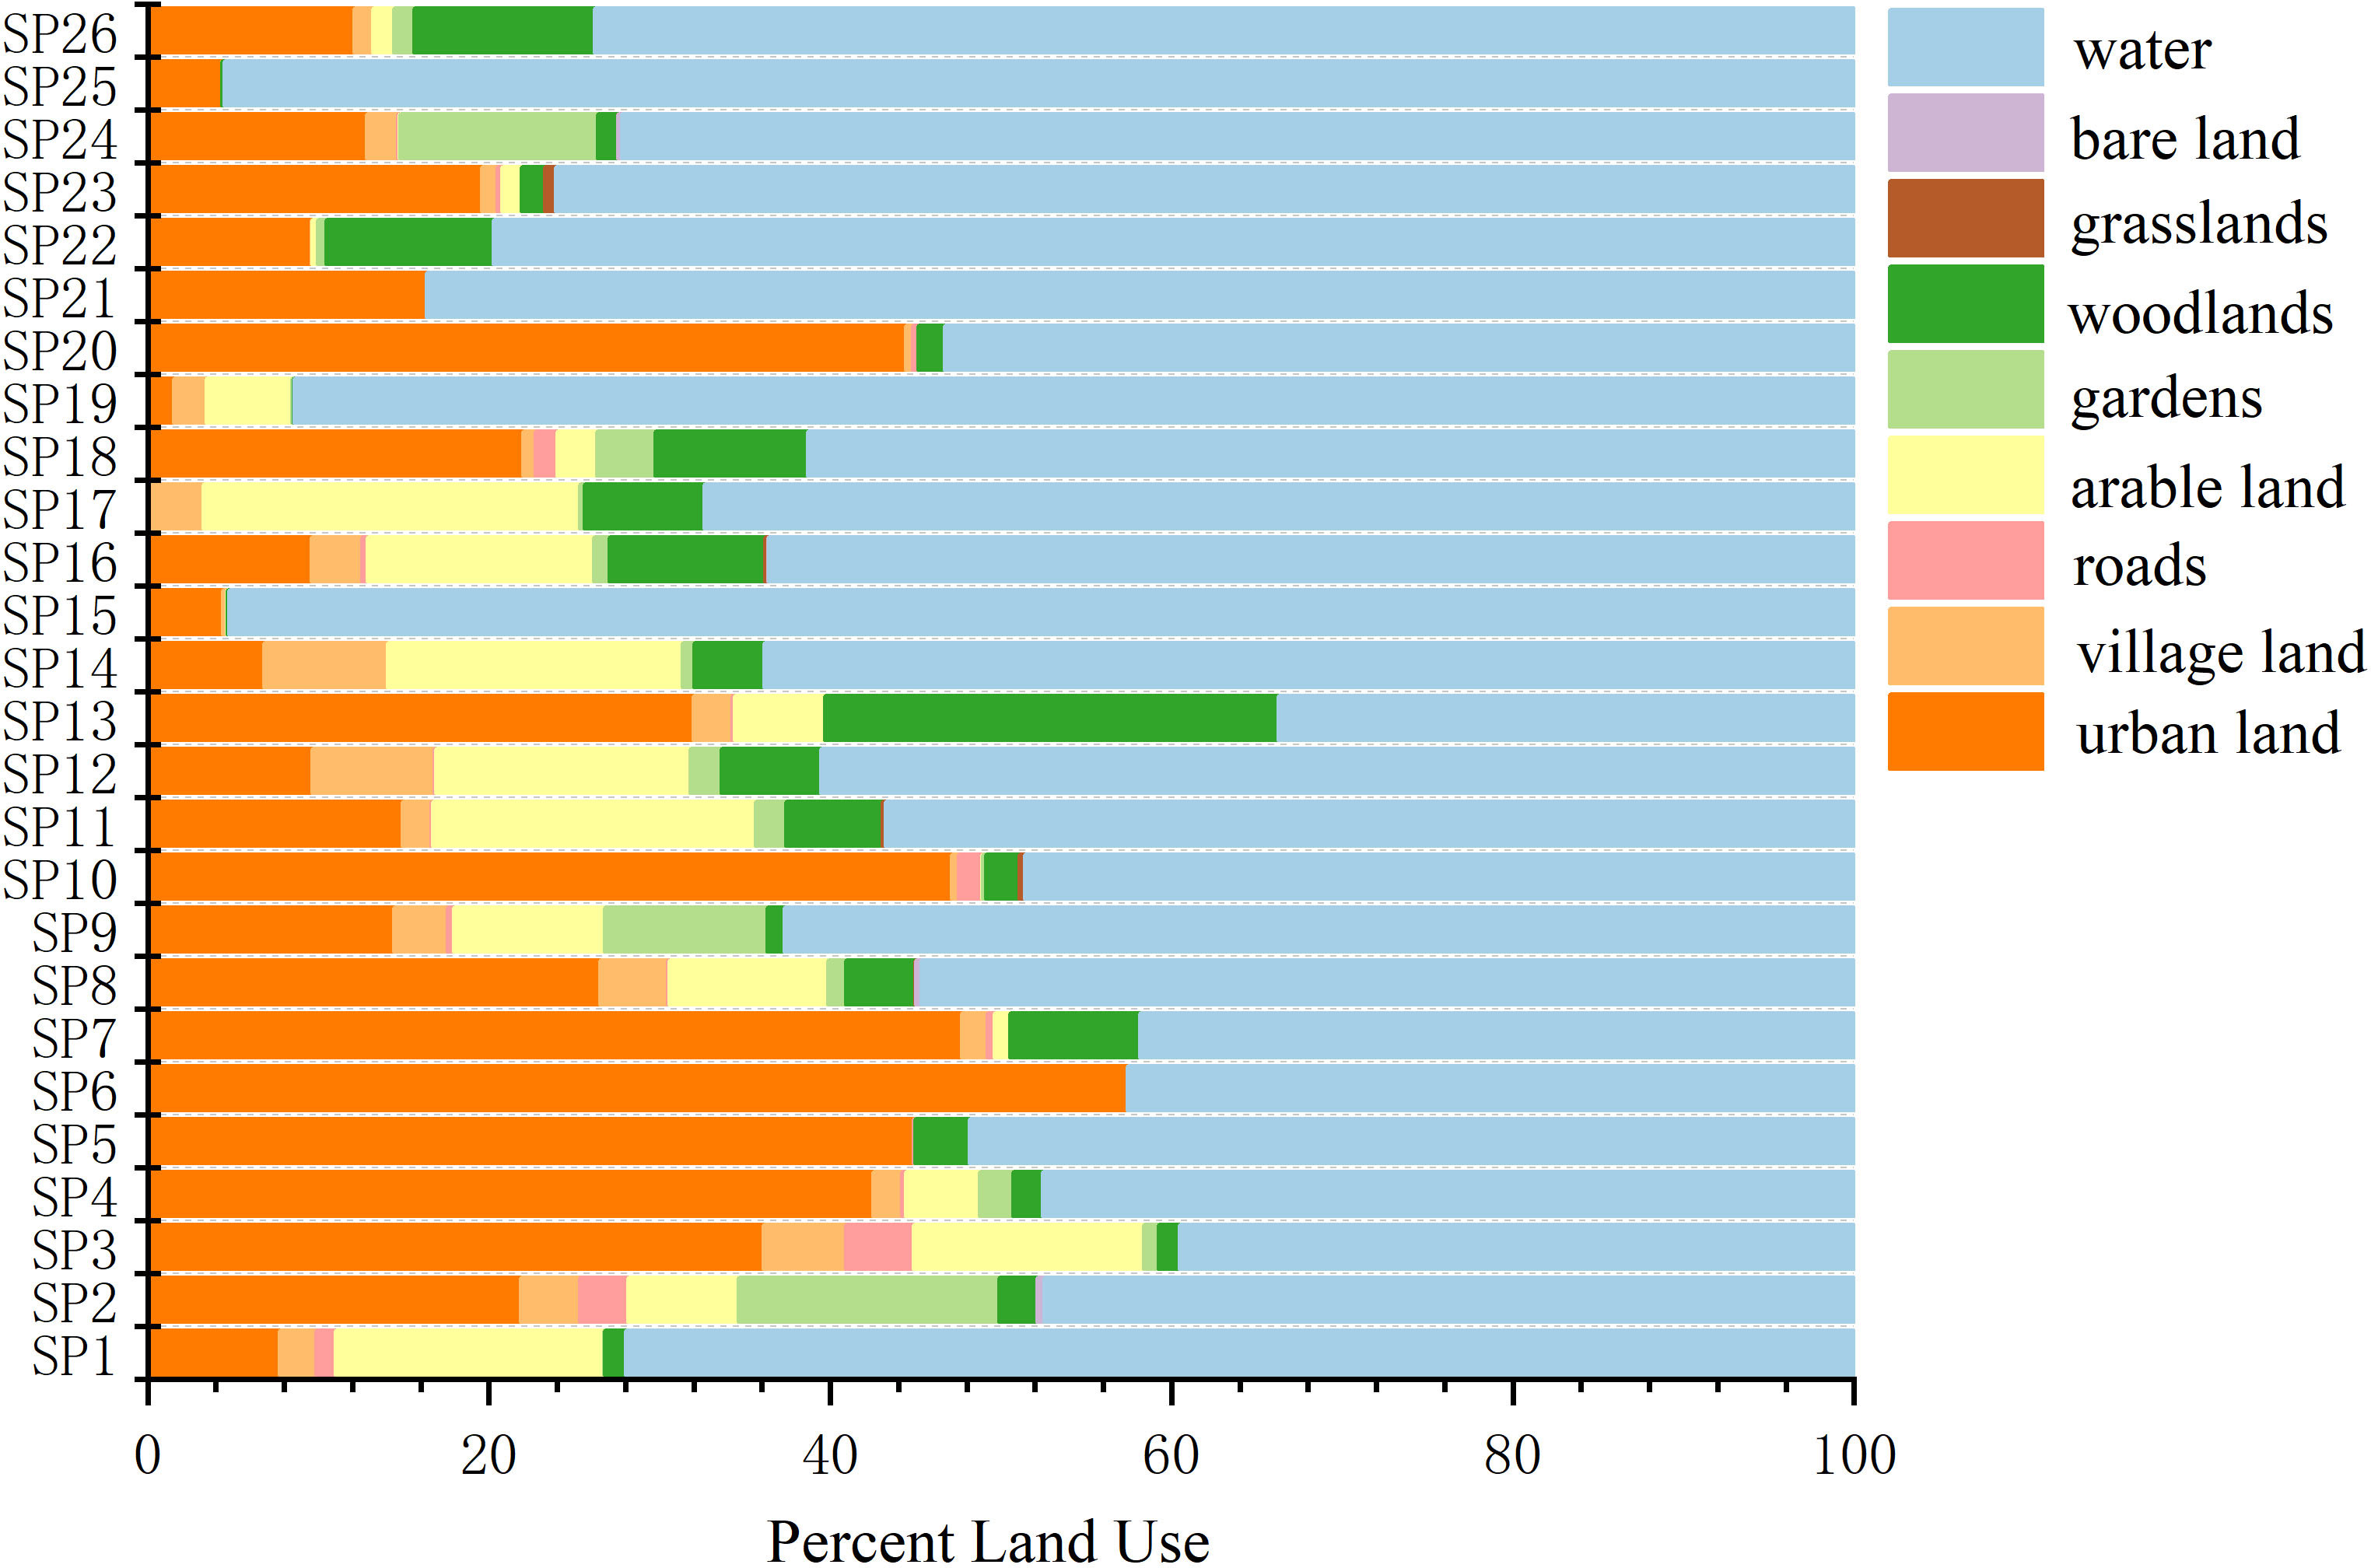
Figure 3 Land types within a 1-km buffer radius.
When the buffer radius was expanded to 1.5 km, the proportions of all types of land uses other than water areas increased. Among these, the proportions of urban land and arable land increased significantly, by 7.25% and 4.13% respectively, and the proportion of water areas decreased by 17.5% (Figure 4).

Figure 4 Land types within a 1.5-km buffer radius.
When the buffer radius was expanded to 2 km, the proportions of all types of land use except water areas continued to increase, but the increase was small, on average about 1%, indicating that the proportions of all types of land uses were stabilizing (Figure 5).
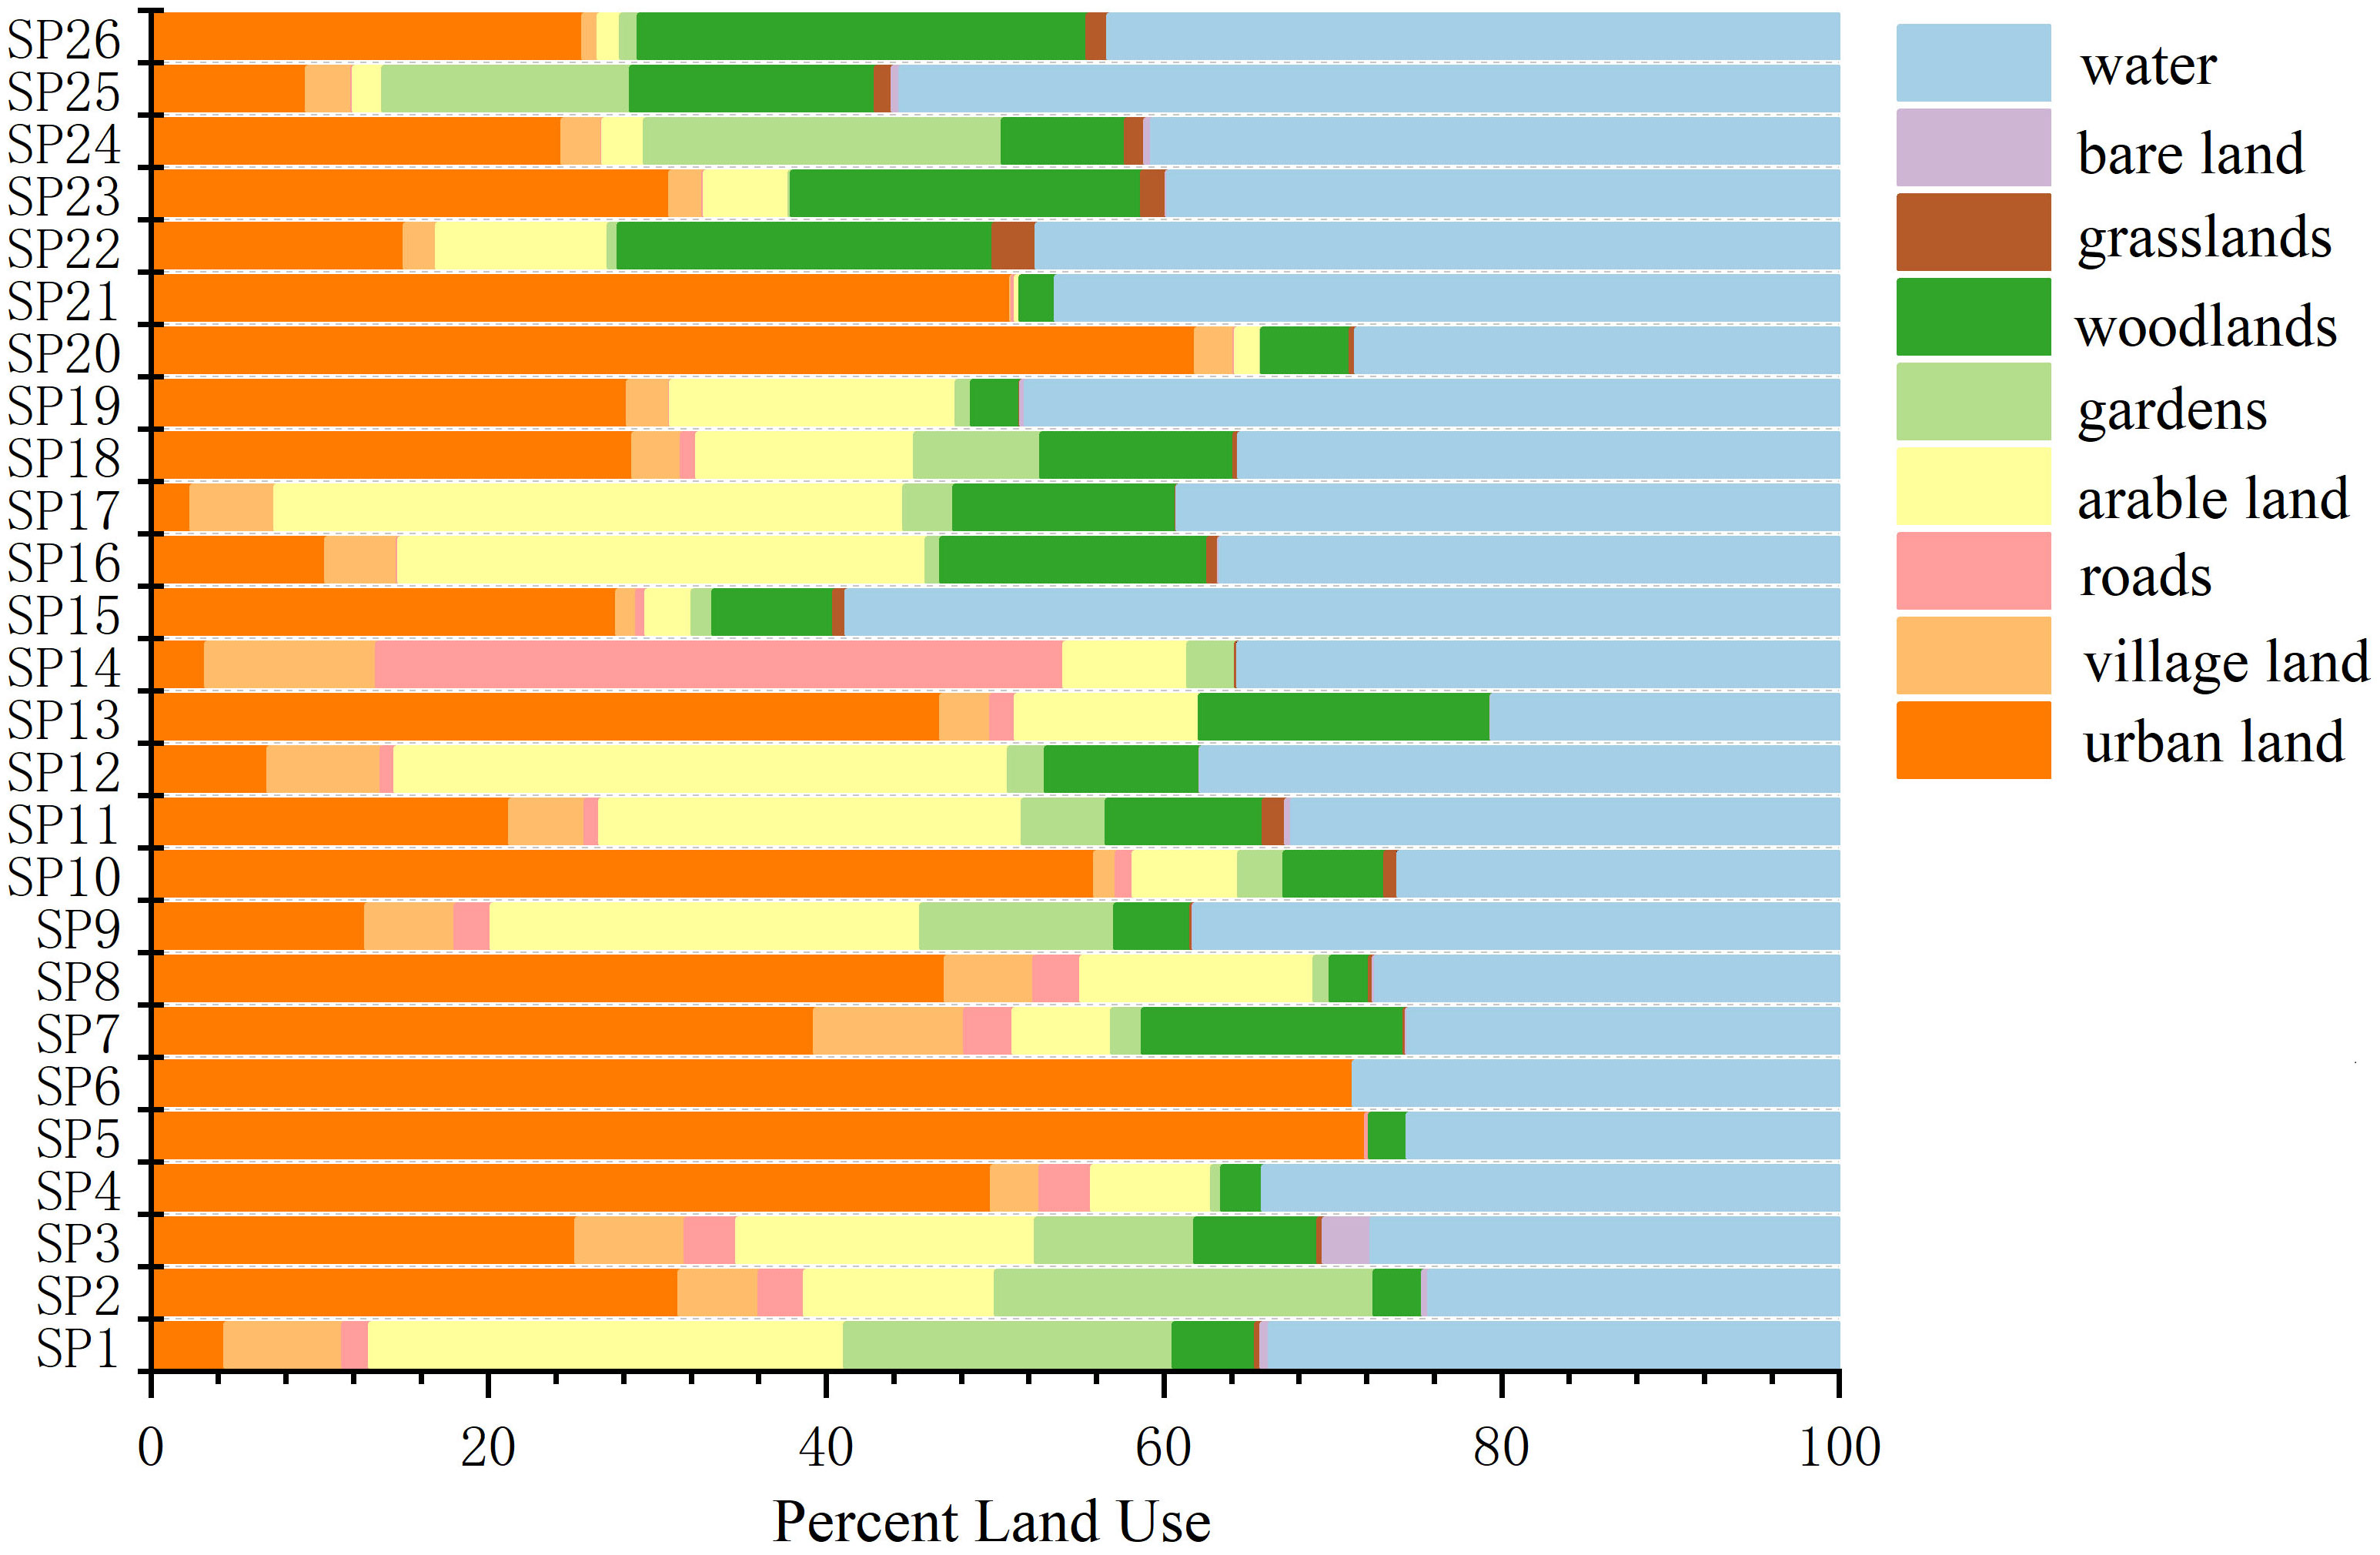
Figure 5 Land types within a 2-km buffer radius.
2.4 Composite index of land use intensity at different scales
The land use type takes into account both the land type and the spatial structure of the land, while the LUI is a measure of the degree of land transformation. The focus of the two are not the same. To calculate the optimized comprehensive index model of LUI, the same three buffer scales were used (Figure 6). We found that with expansion of the buffer radius, the LUI also gradually increases. This is because as the buffer radius expands, the proportion of developed land use gradually increases. Overall, from the upper reaches of the Yangtze River (central urban section of Chongqing) to the lower reaches (northeast section of Chongqing), the LUI gradually declined. The LUI was highest near the SP4 sampling site located in Longzhou Bay, in the central city of Chongqing. The LUIs for SP4 within buffer radii of 1 km, 1.5 km, and 2 km were 3.23, 3.53, and 3.55, respectively. The LUI was lowest near the SP25 sampling site in Fengjie. The LUIs for SP25 within the buffer radii of 1 km, 1.5 km, and 2 km were 2.09, 2.36, and 2.4, respectively.
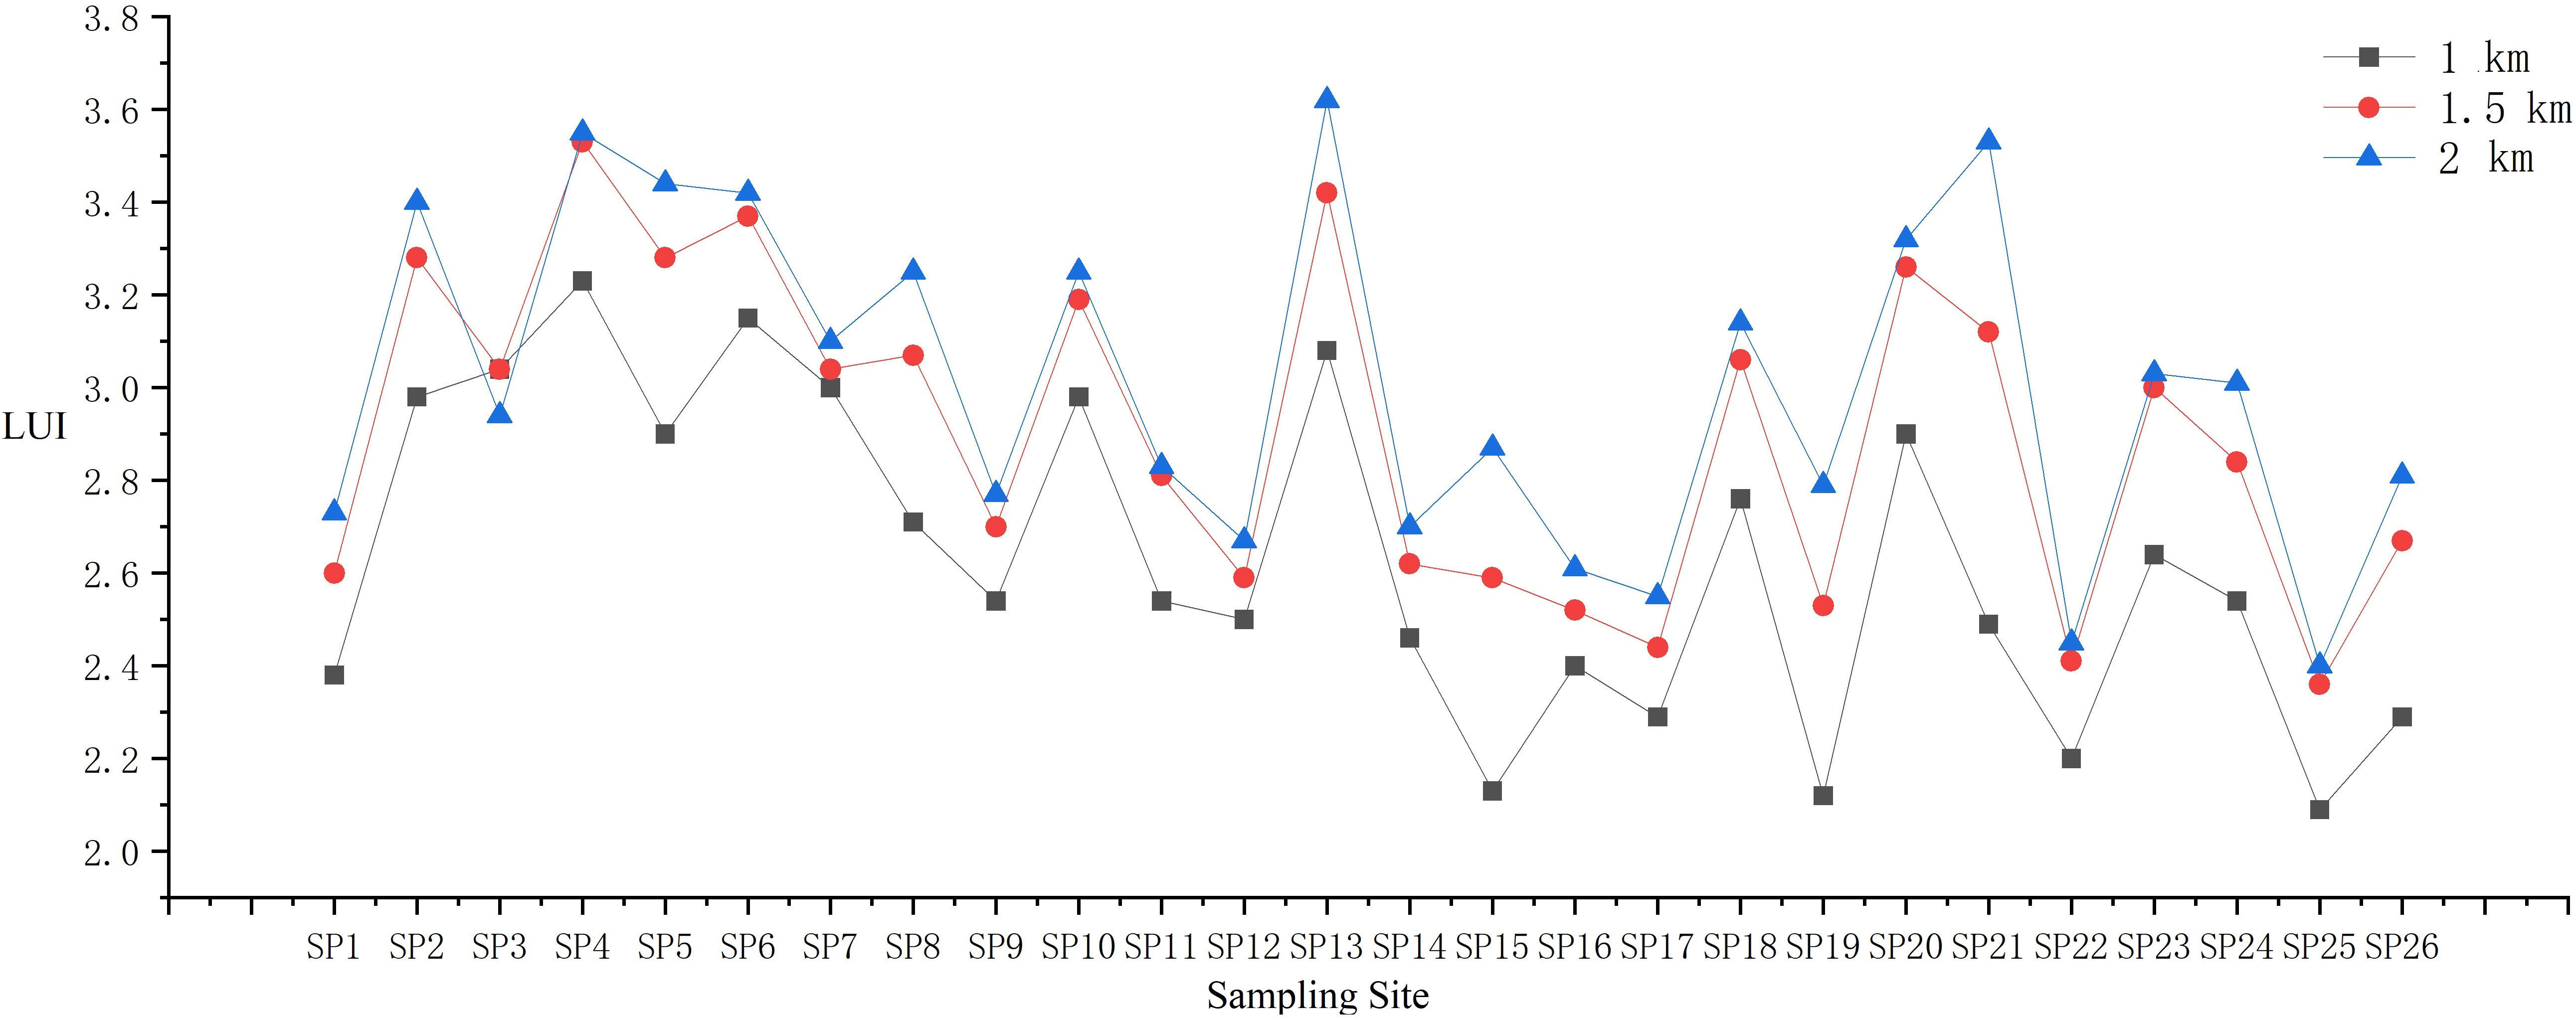
Figure 6 LUIs within different buffer radii around MP sampling sites.
2.5 Correlation between land types and MP concentrations
At all buffer scales, MPss was positively correlated with village land and arable land. With increasing buffer radius, the strength of the correlation between land use types and MPss gradually increased (Figure 7). When the buffer radius was 1 km, MPsw was positively correlated with urban land, roads, gardens, woodlands, and bare land. When the buffer radius was 1.5 km, MPsw was positively correlated with urban land, roads, gardens, and woodlands (Figure 8). When the buffer radius was expanded to 2 km, MPsw had a weak positive correlation with urban land, village land, and gardens (Figure 9).
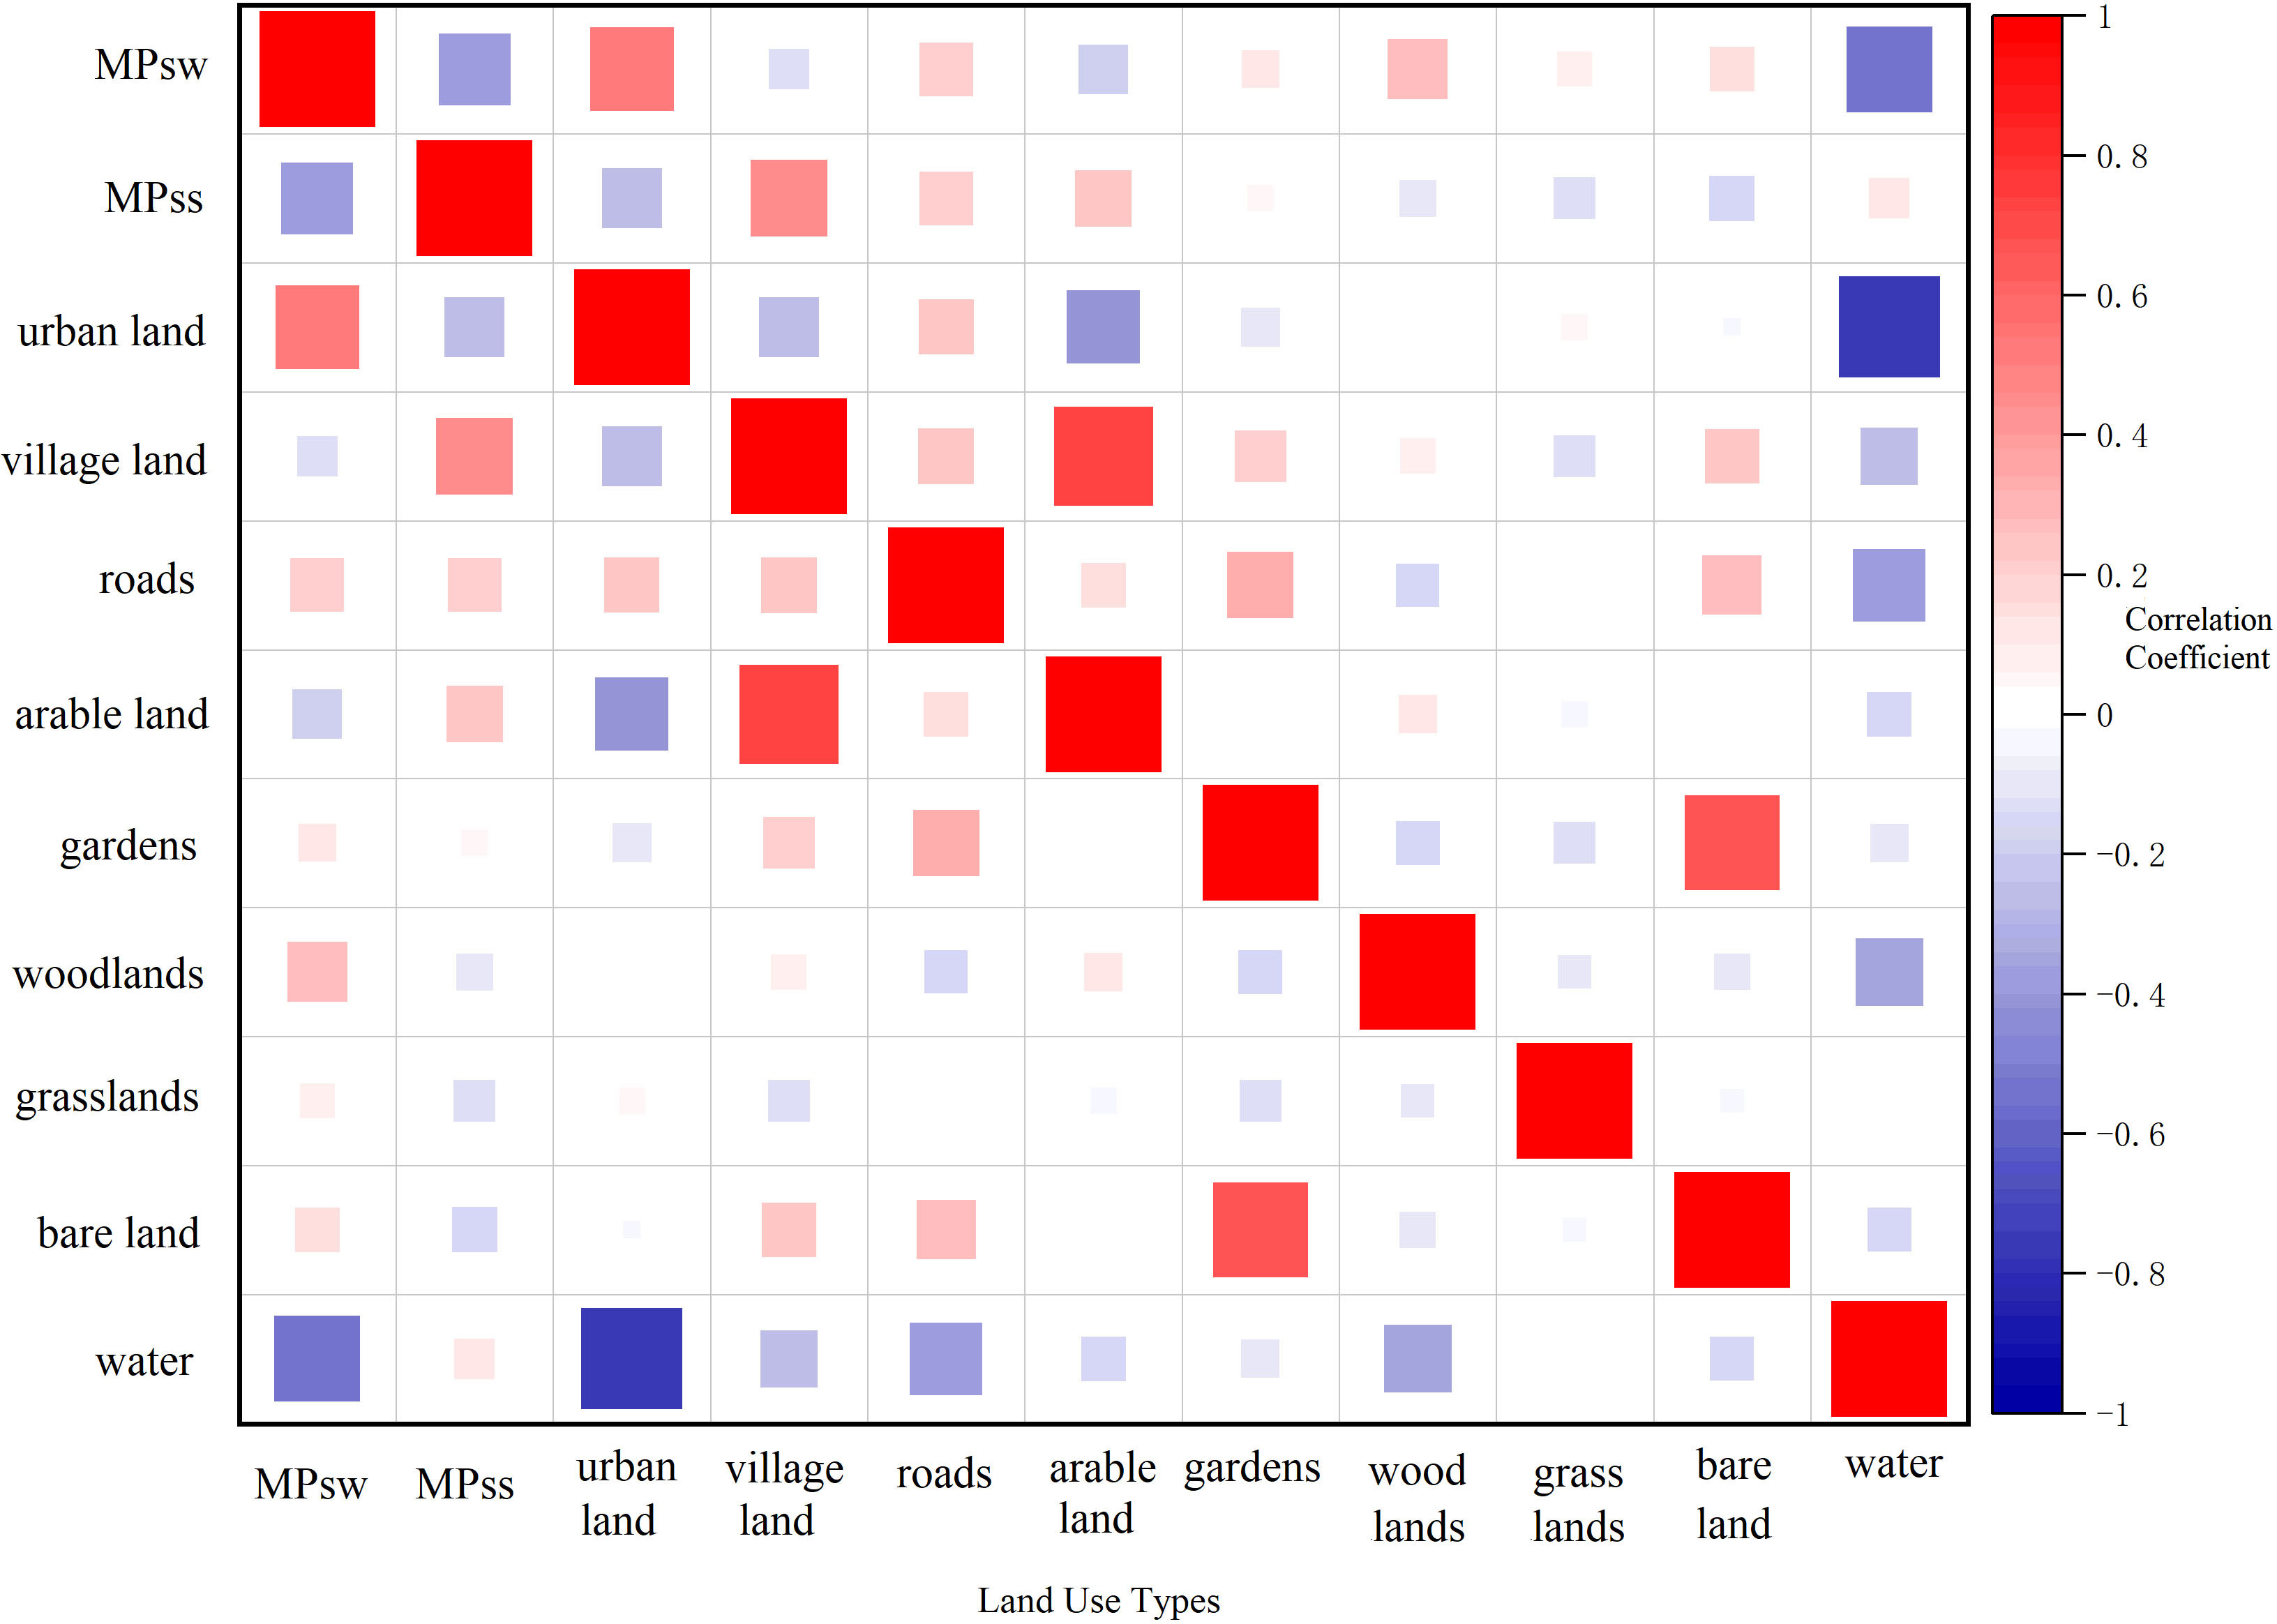
Figure 7 Correlation analysis of land types and MP concentrations within a 1-km buffer radius.
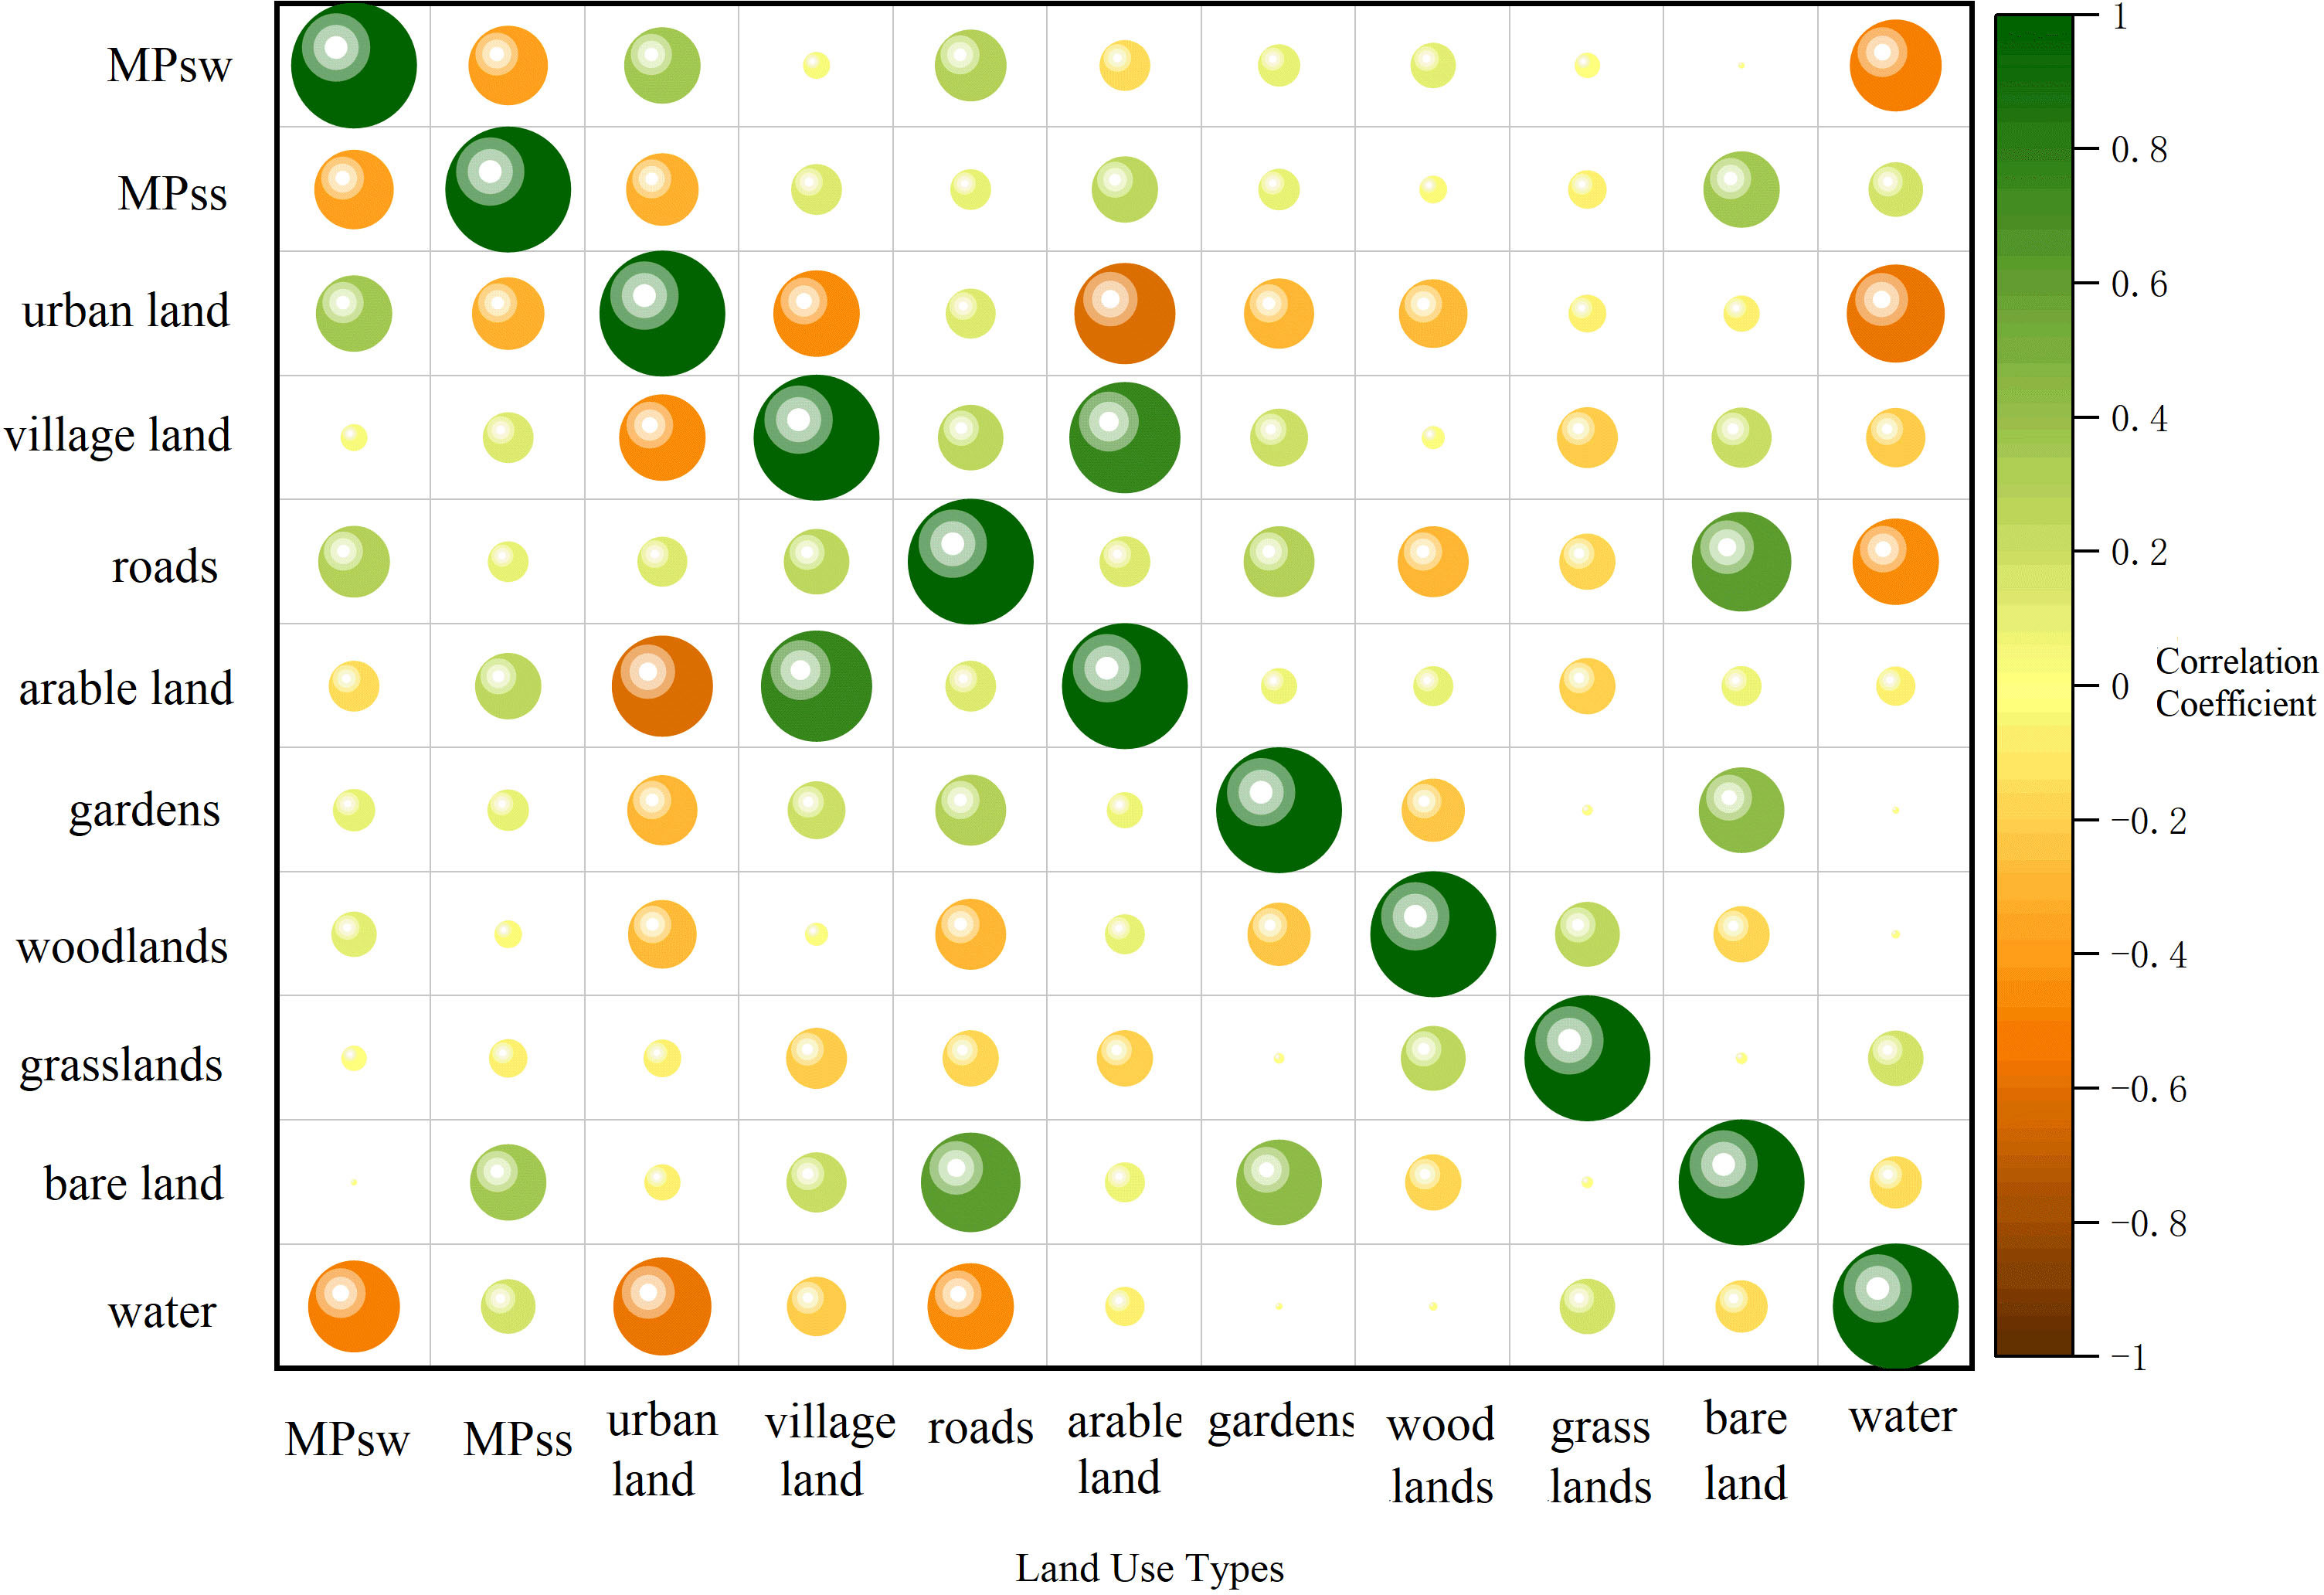
Figure 8 Correlation analysis of land types and MP concentrations within a 1.5-km buffer radius.
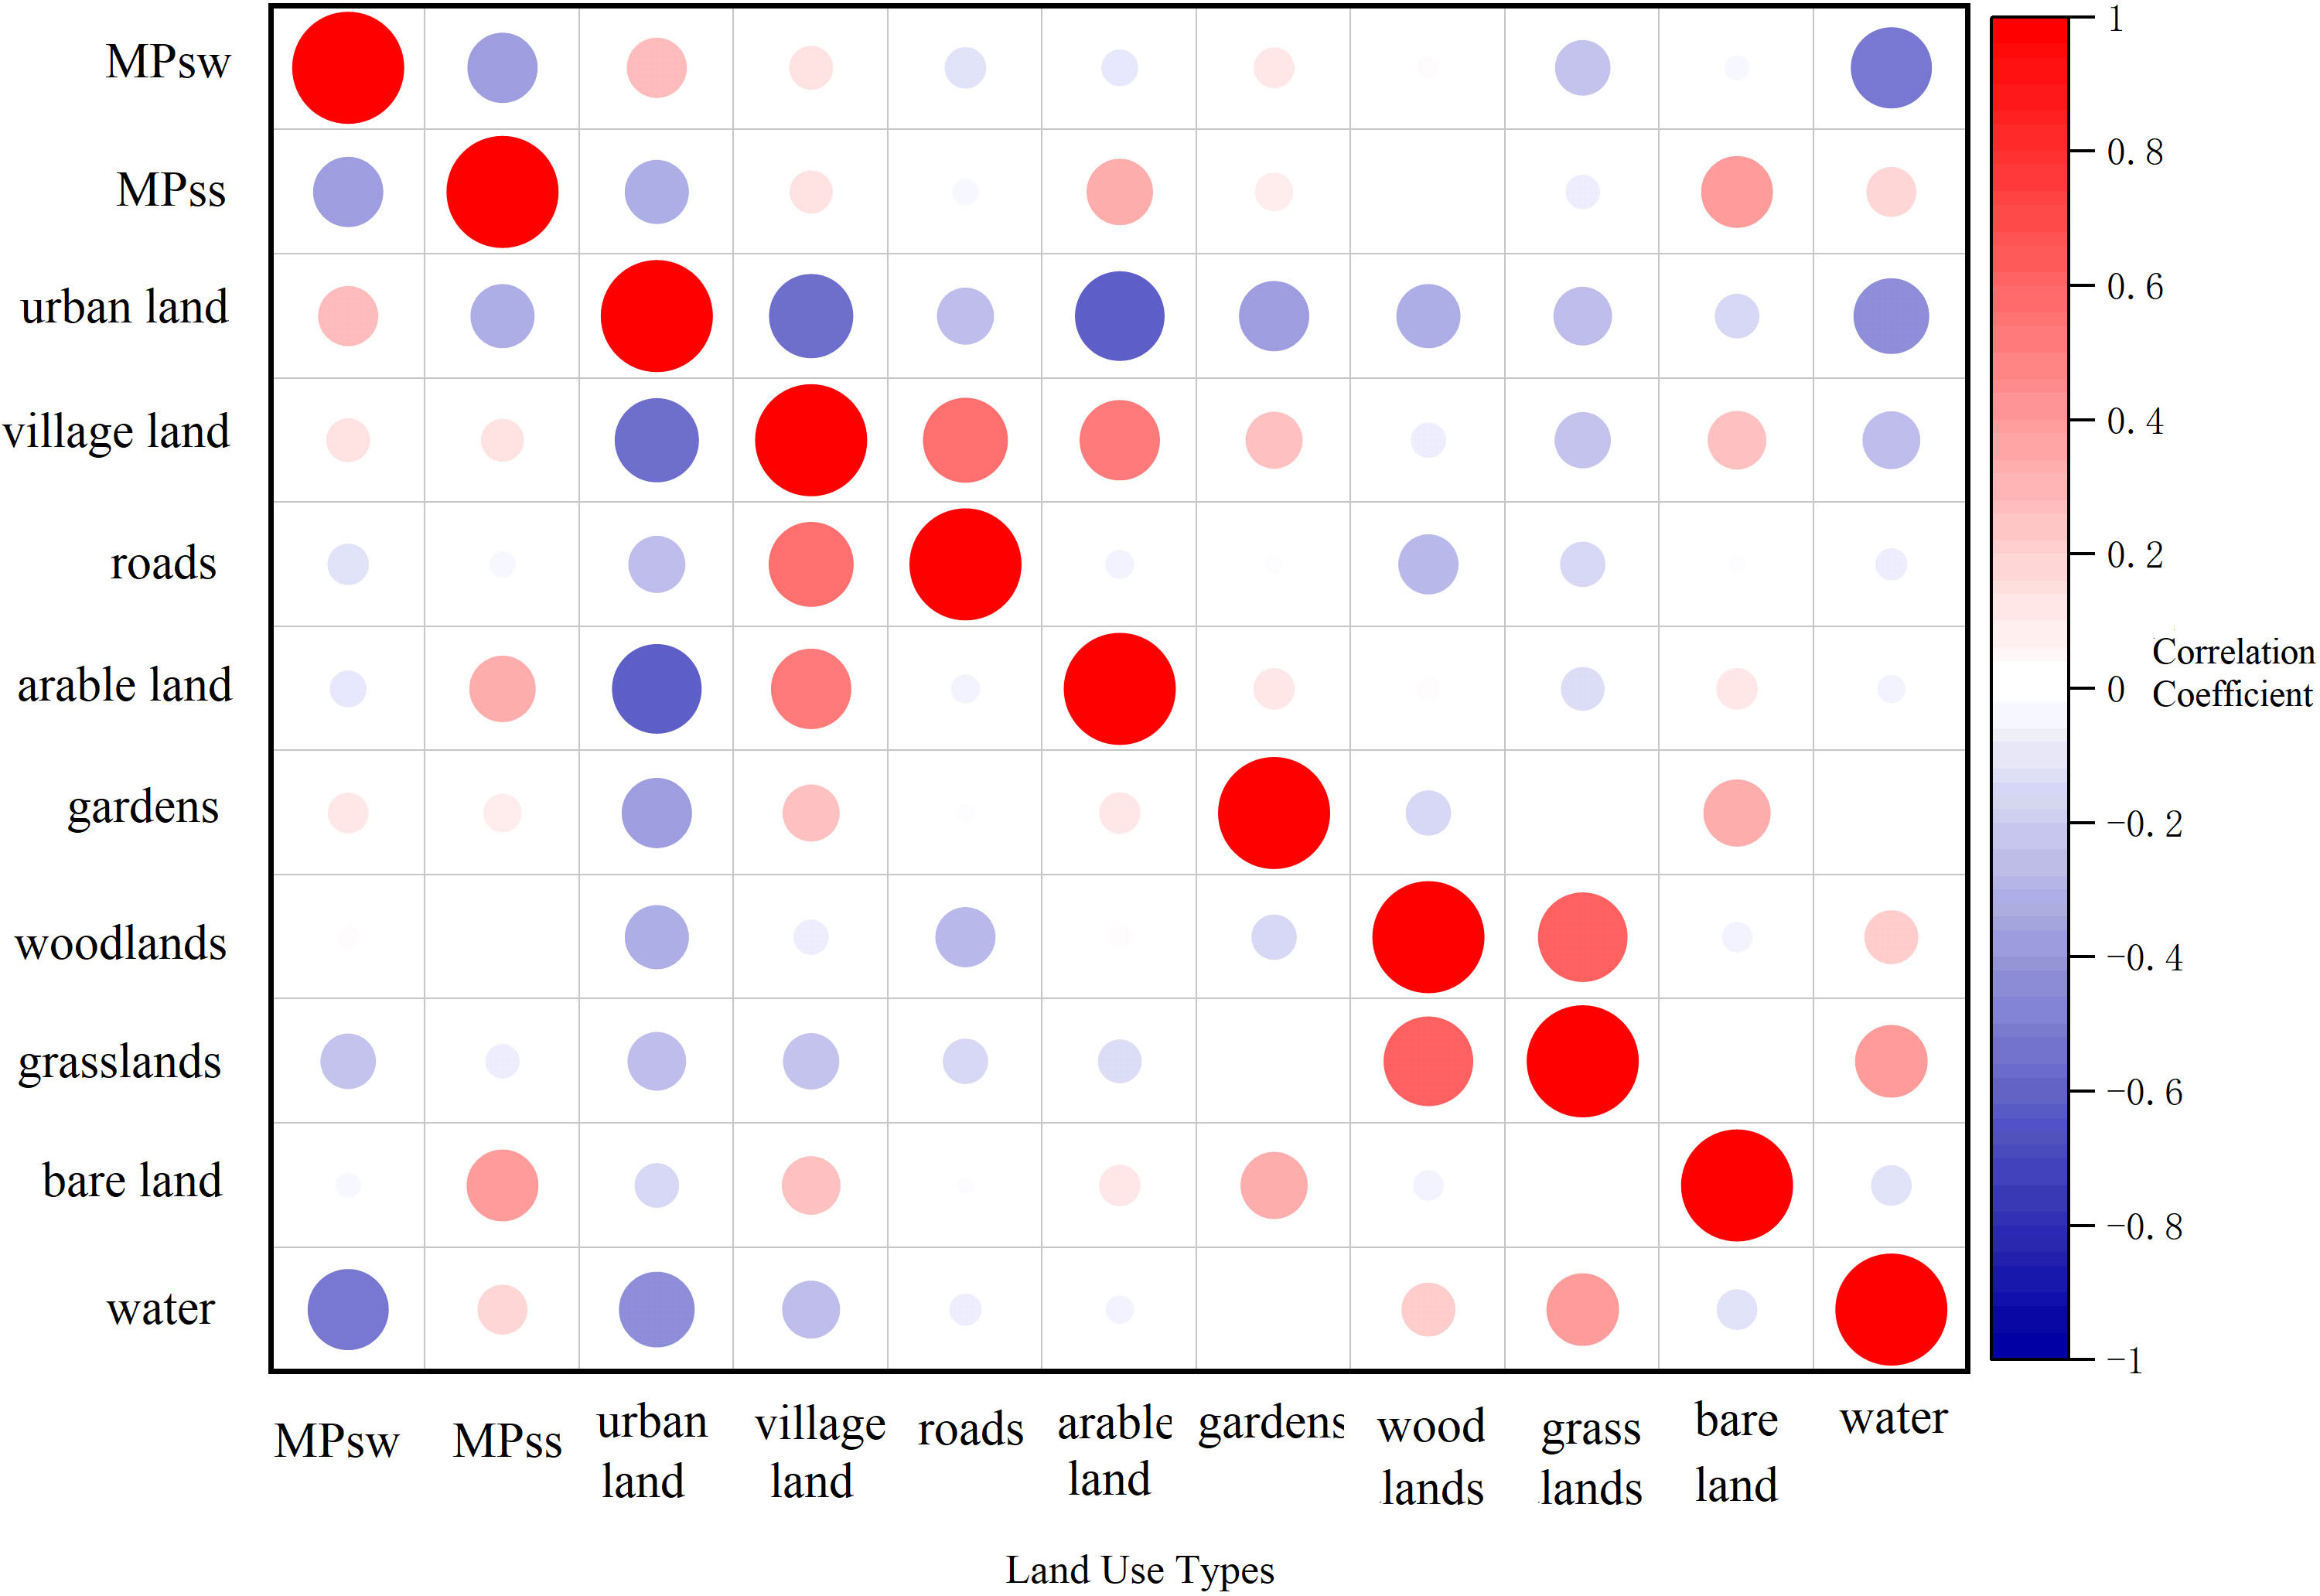
Figure 9 Correlation analysis of land types and MP concentrations within a 2-km buffer radius.
Redundancy analysis showed that as the radius of the buffer zone increased, the difference in interpretation rates among different land types gradually decreased. When the buffer zone radius was 1 km, the difference in the interpretation rate of land type on MP concentration was up to 17%. When the buffer radius was 1.5 km, the difference was 11.2%, and when the buffer radius was 2 km, the difference was 7.2% (Figures 10–12).
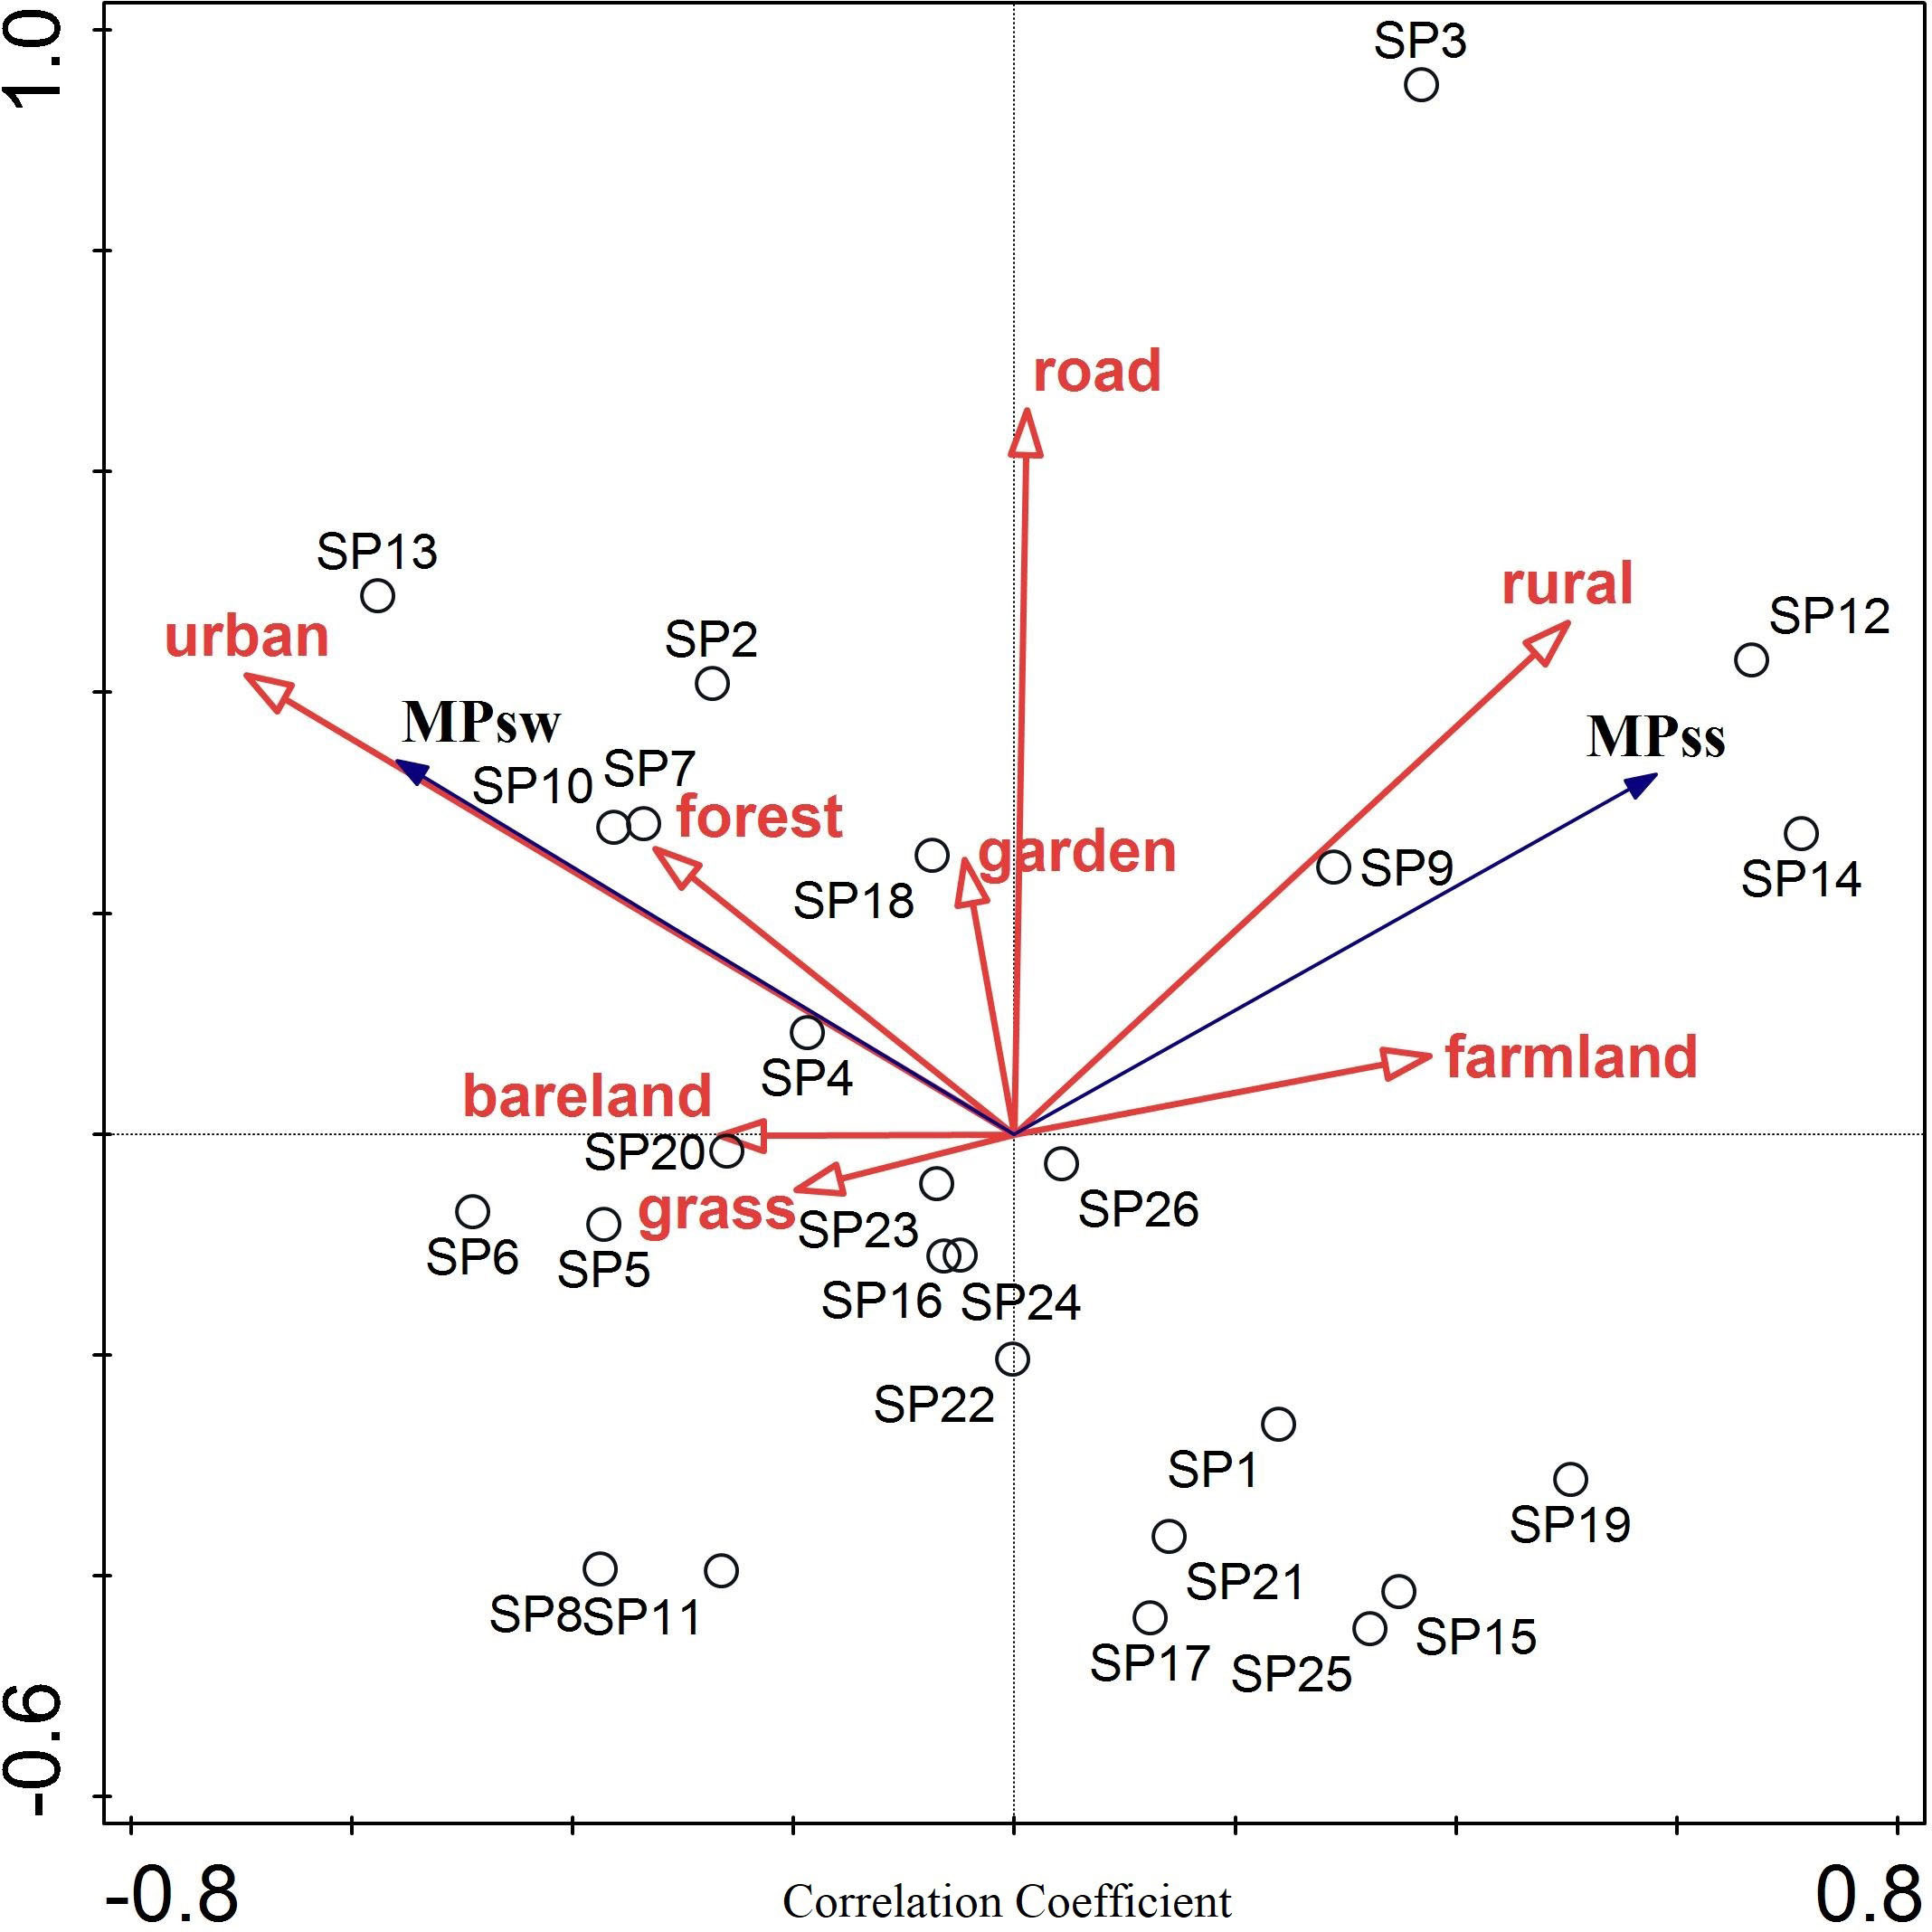
Figure 10 Redundancy analysis of land types and MP concentrations within a 1-km buffer radius.

Figure 11 Redundancy analysis of land types and MP concentrations within a 1.5-km buffer radius.
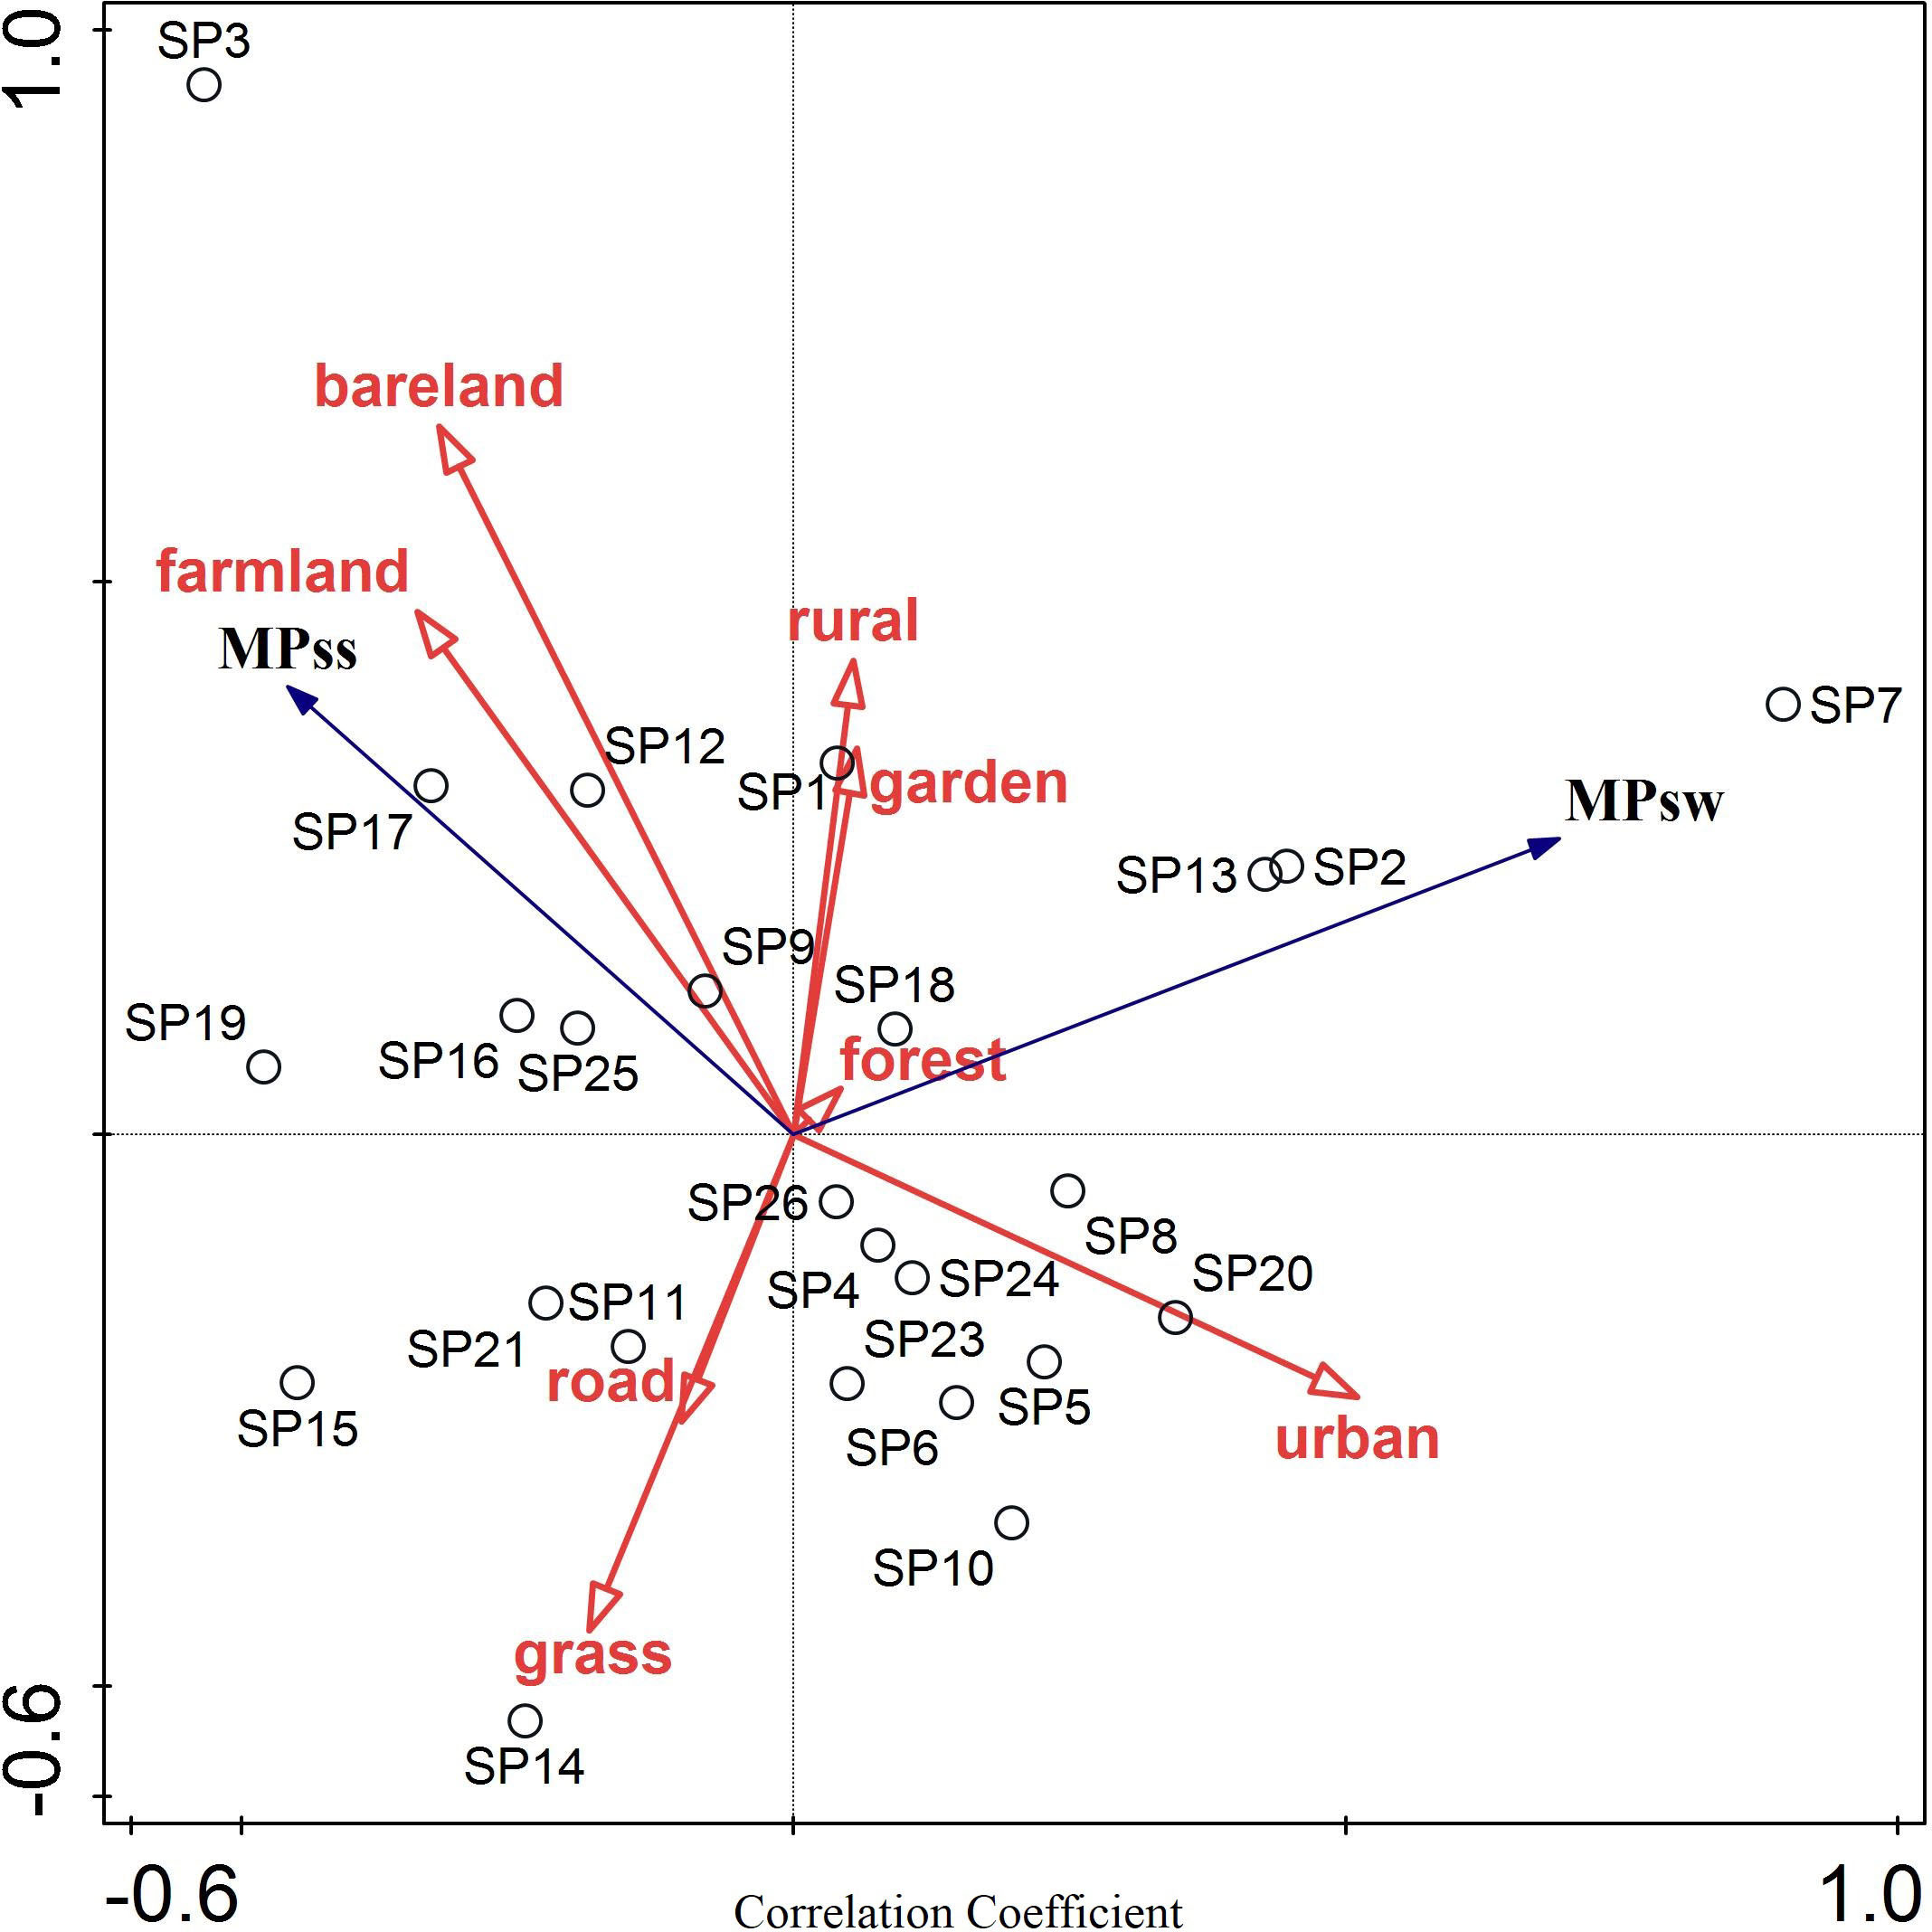
Figure 12 Redundancy analysis of land types and MP concentrations within a 2-km buffer radius.
When the buffer radius was 1 km, the correlation between the LUI and MPsw was strongest at 0.59 (p< 0.05). At all buffer scales, there was no significant correlation between the LUI and MPss (Figure 13). When the buffer radius was 1 km, the LUI interpretation rate for the MP concentration was highest, at 18.9% (Figure 14).
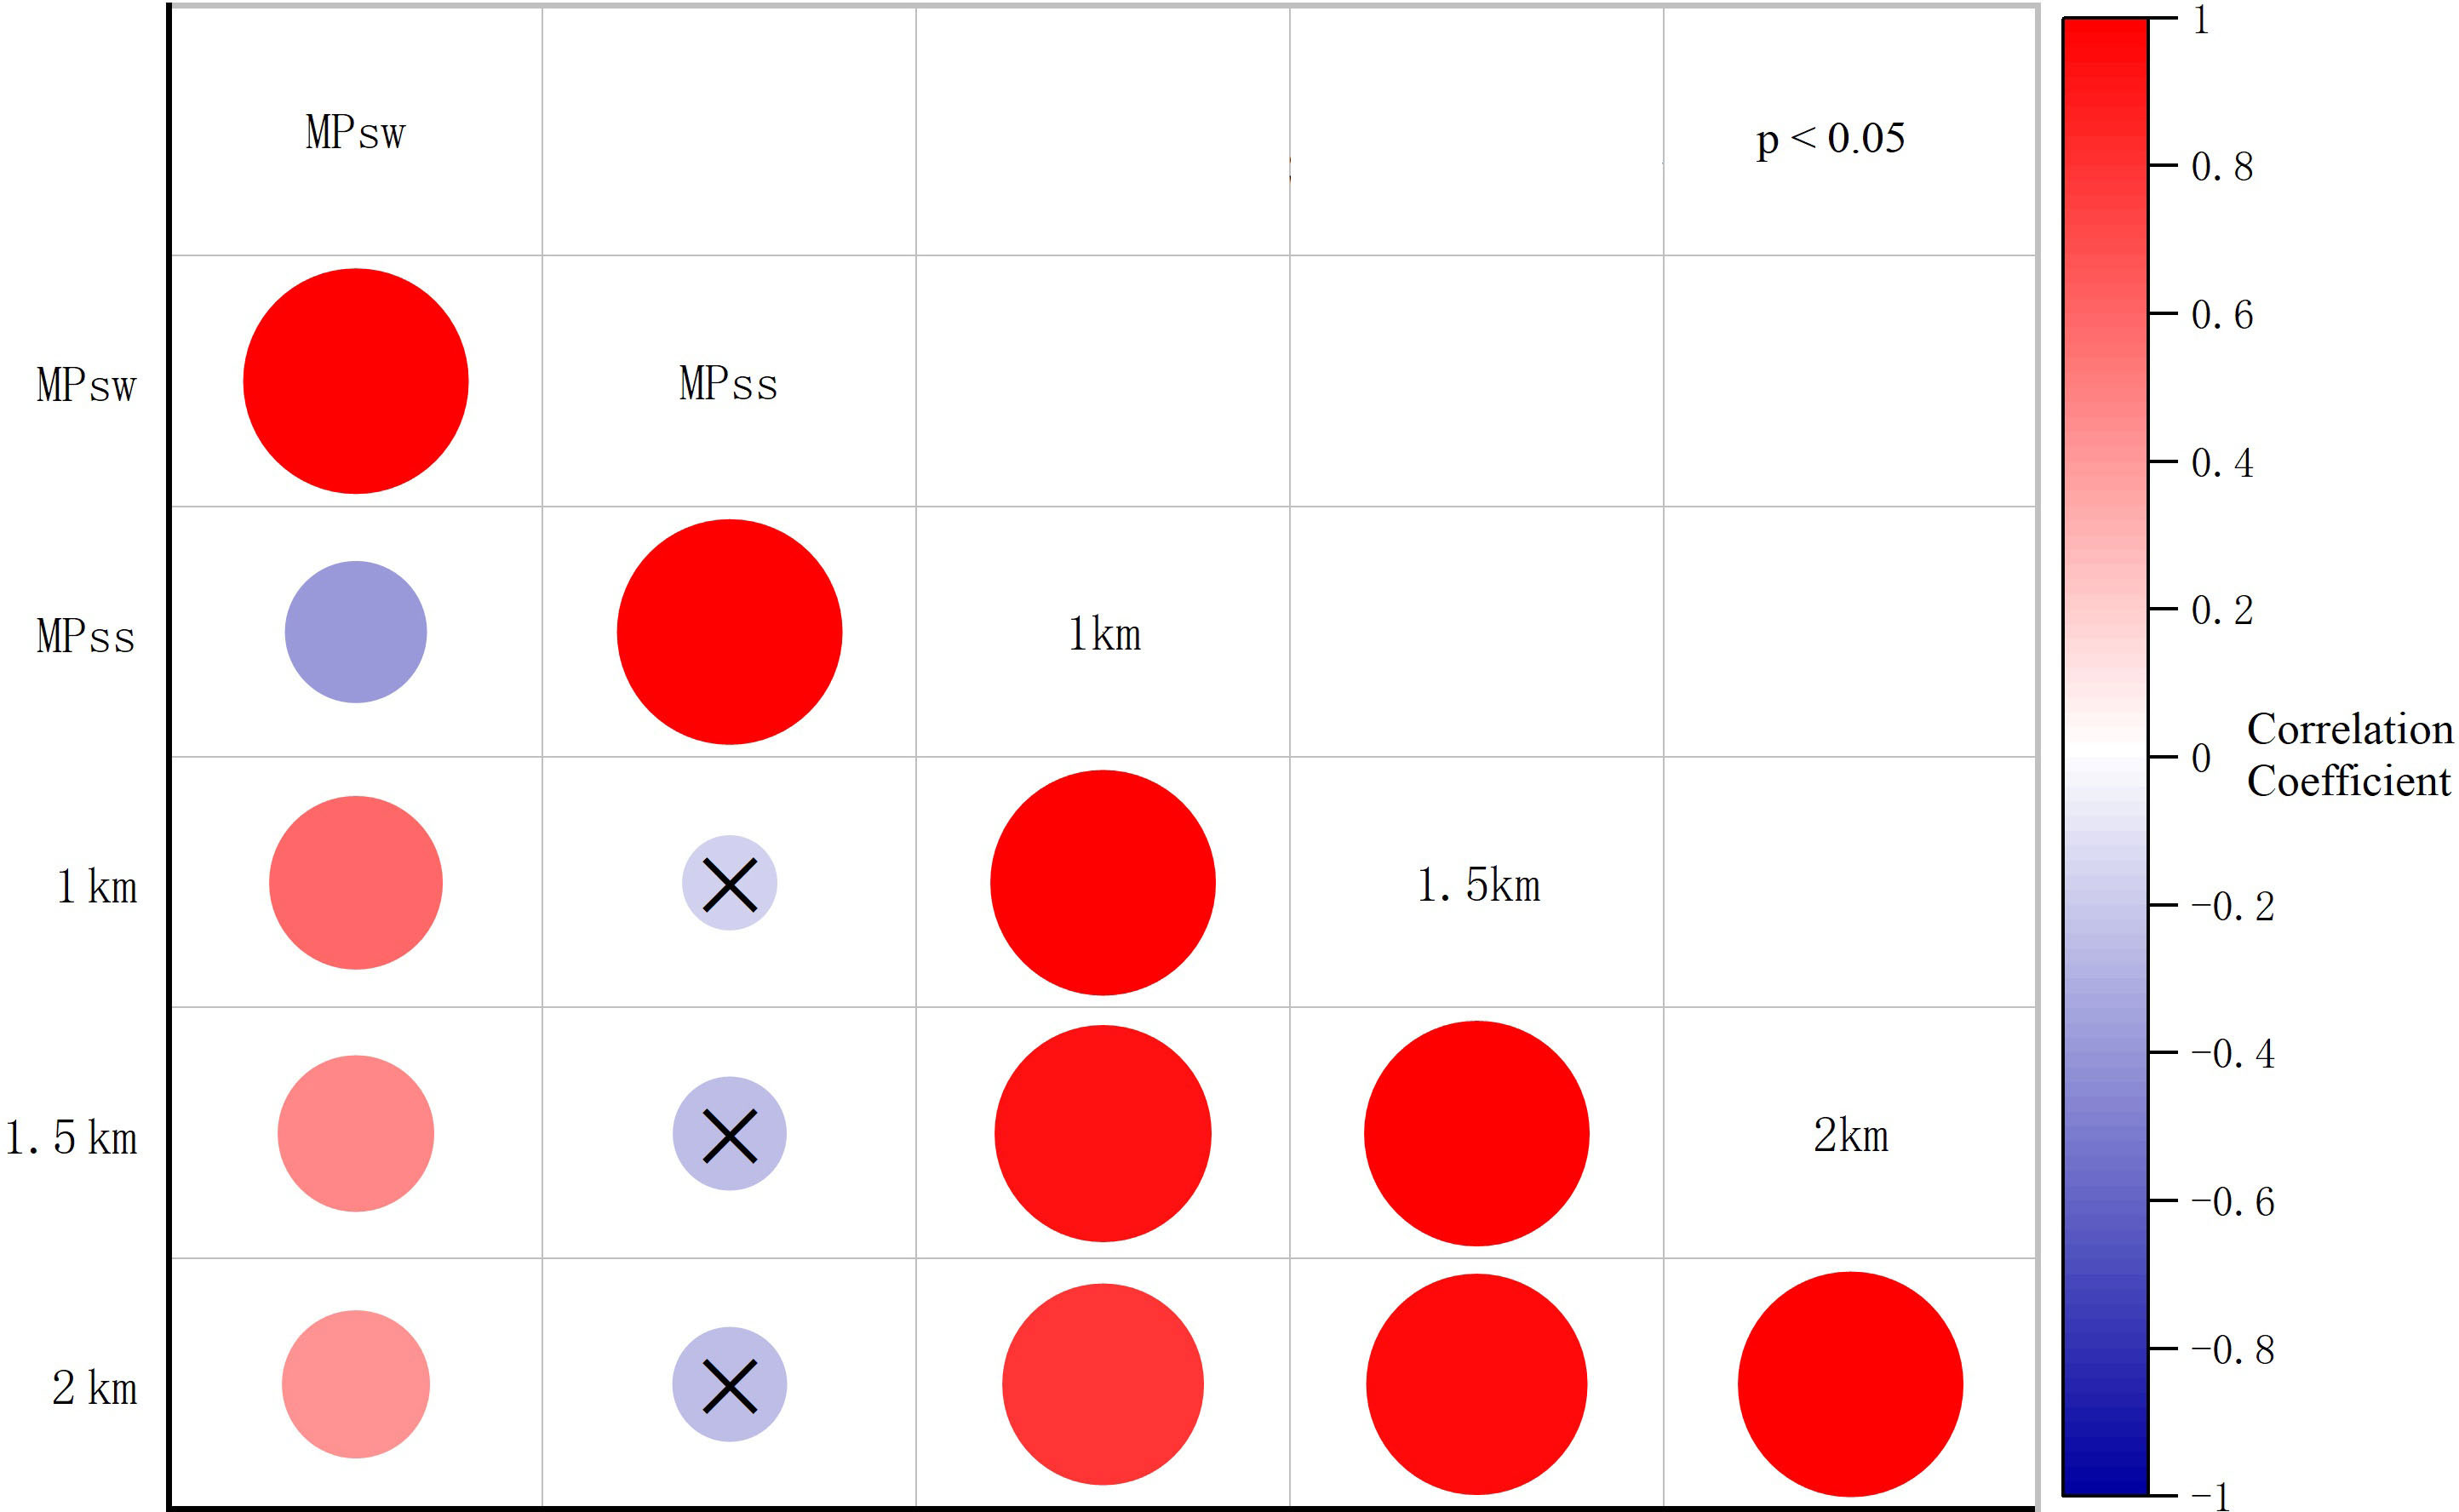
Figure 13 Correlation analysis of LUIs and MP concentrations at several buffer scales.
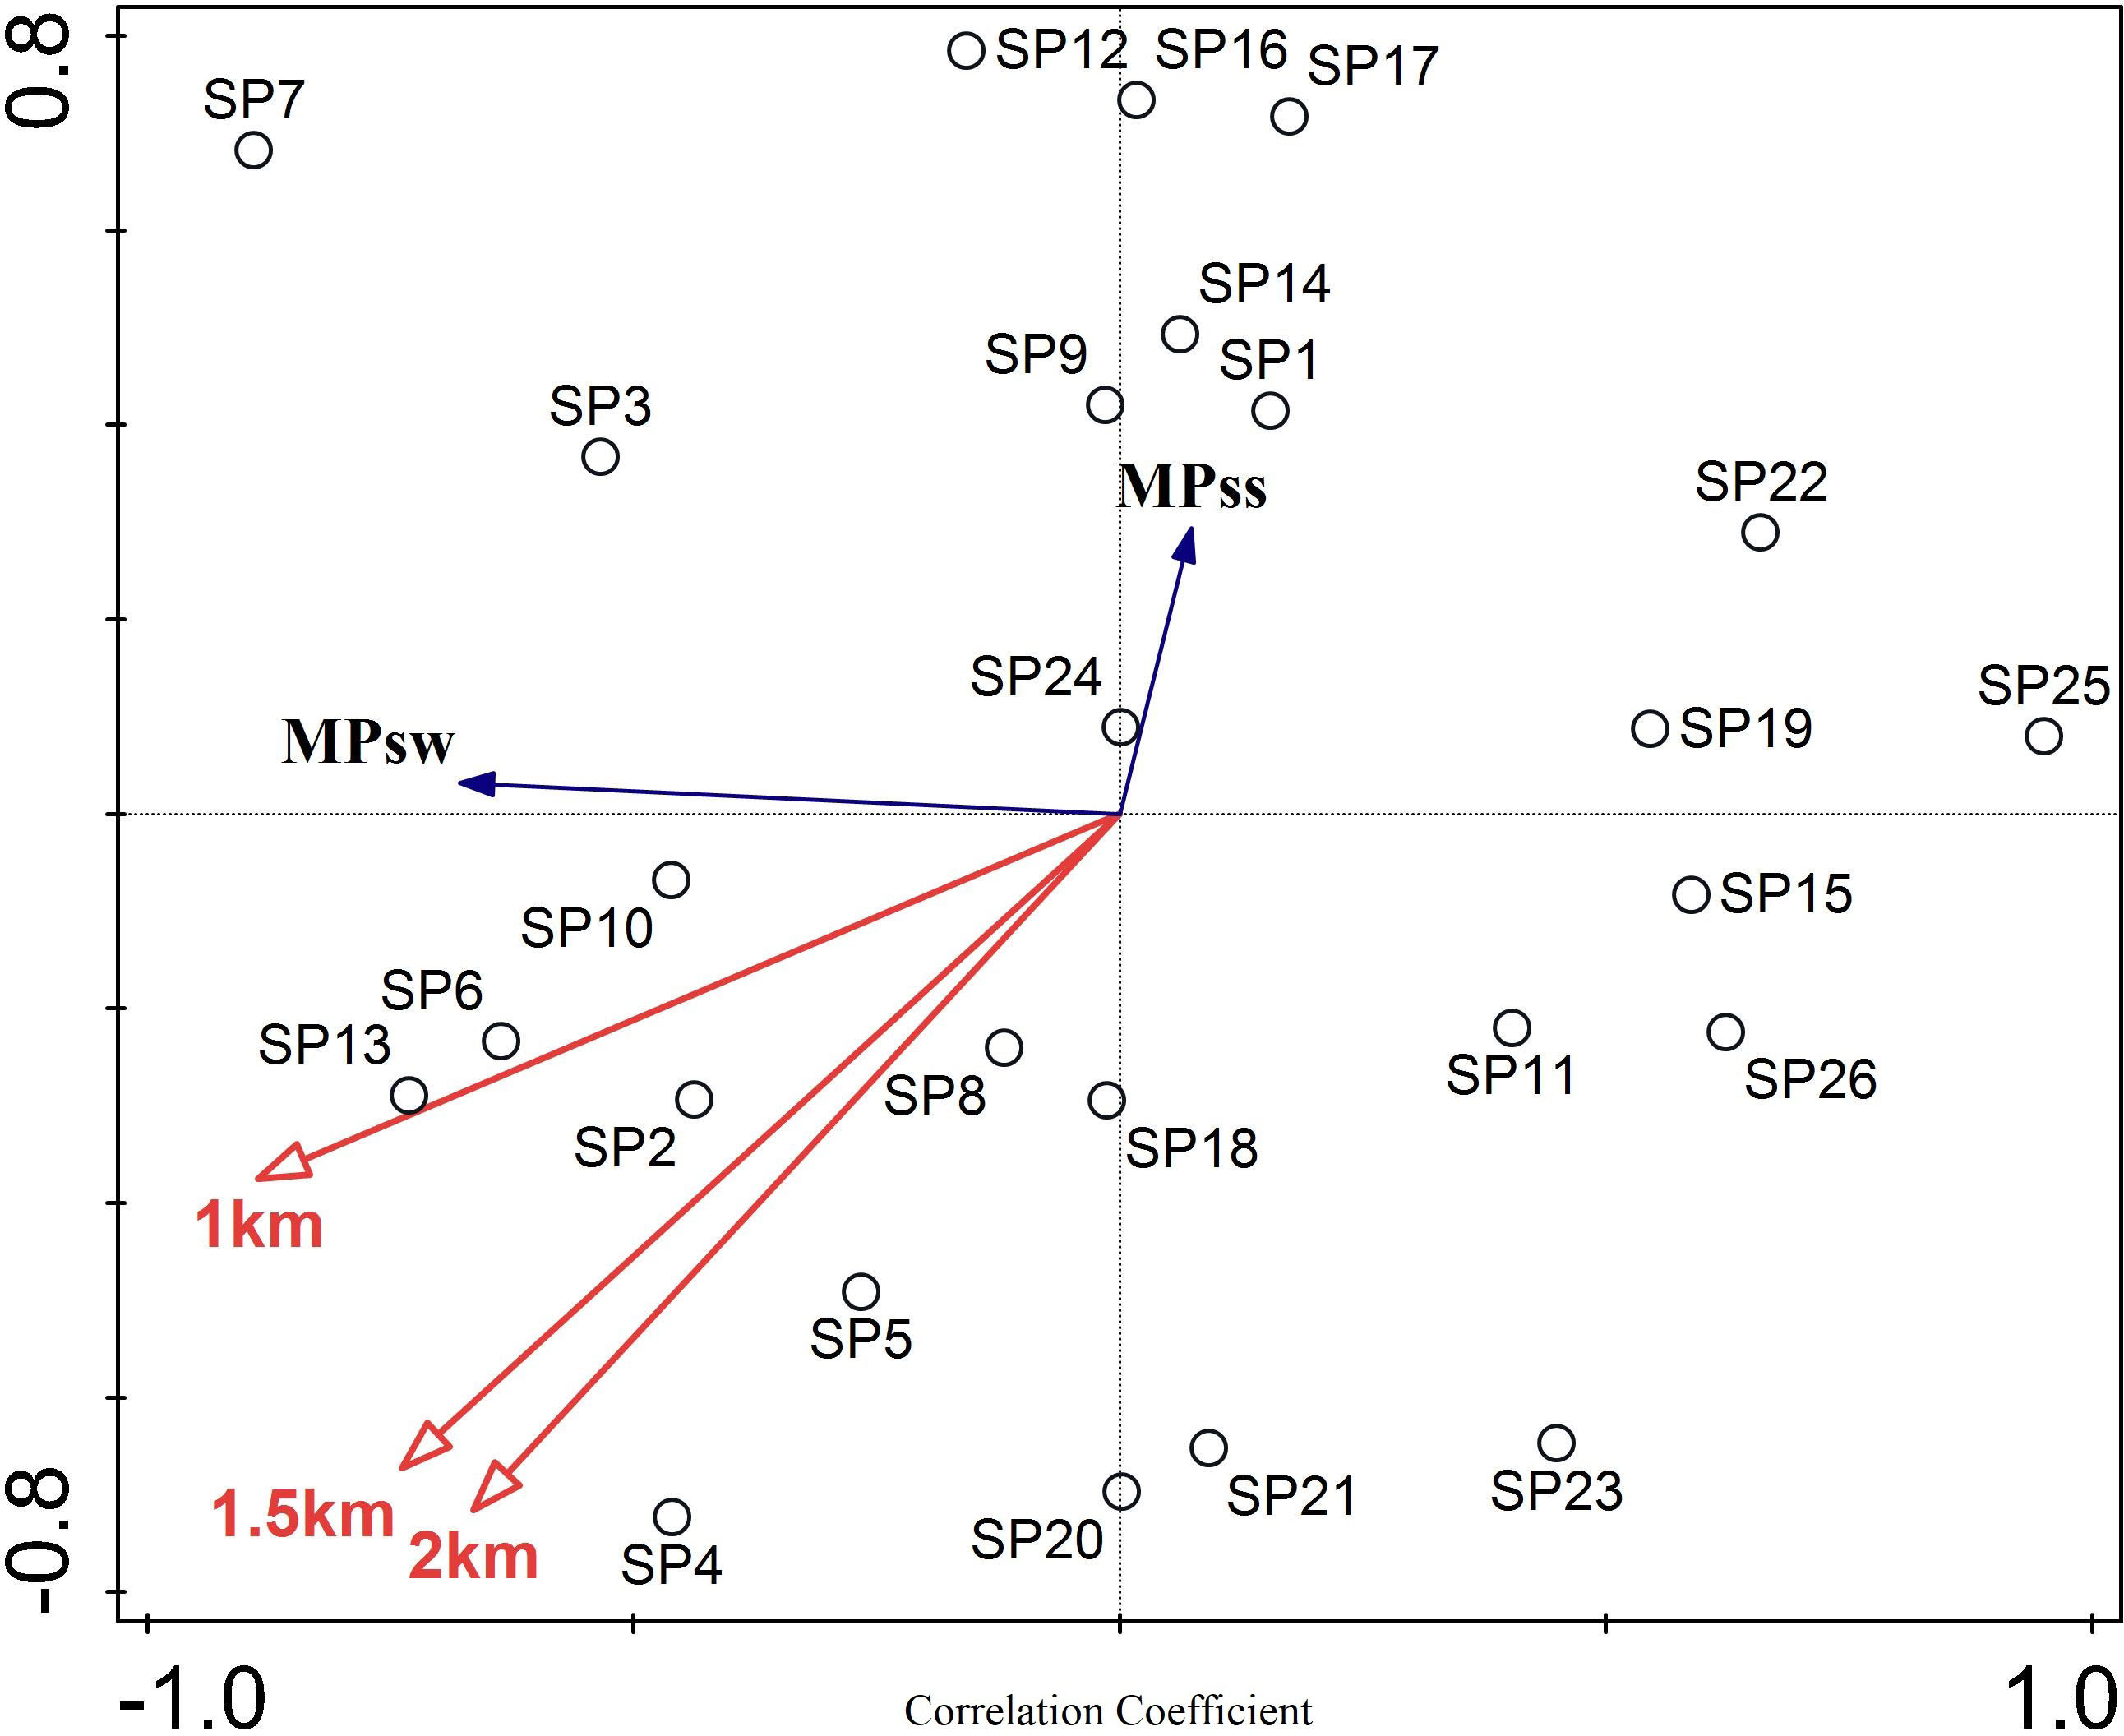
Figure 14 Redundancy analysis of LUIs and MP concentrations at several buffer scales.
3 Discussion
3.1 Characteristics and origin of MP concentrations in the Chongqing section of the Yangtze River
The MPsw in the Chongqing section of the Yangtze River gradually decreased from upstream (central urban section of Chongqing) to downstream (northeast section of Chongqing). There was a clear transition at the SP14 sampling site in eastern Fuling (Figure 2), where MPsw changed from high to low. These results are largely consistent with those of Zhang et al. (2022). The reason for this phenomenon may be that the SP1–SP13 sampling sites were generally located in the central urban areas of Changshou, Fuling, etc. These regions have relatively developed economies and are densely populated, and plastic products are used relatively often. The SP15–SP26 sampling sites were mainly located in the northeastern region of Chongqing. The level of social and economic development there is relatively low and the use of plastic products is relatively low. We found that there is a clear negative correlation between MPss and MPsw for sampling sites SP1–SP13 (central urban area, Changshou, Fuling section). The data for MPss and MPsw for sampling sites SP14–SP26 (northeastern section of Chongqing) had a weaker negative correlation. Moreover, MPss at the SP1–SP13 sampling sites (central urban area, Changshou, Fuling section) was generally lower than at the SP14–SP26 sampling sites (northeastern Chongqing section). The SP1–SP13 sampling sites (central urban area, Changshou, Fuling section) were located in the upper reaches of the Yangtze River; the MP discharged into the surface water of this area of the Yangtze River may be carried by surface flow downstream to areas such as the SP14–SP26 section (northeastern section of Chongqing). MPsw sink during downstream transport when combined with other minerals and organic matter and MP that are ingested by aquatic biota also sink when excreted. Previous studies have found that more than half of MPsw sinks to the riverbed (Choy et al., 2019; Kane et al., 2020; Pohl et al., 2020). In addition, MP in the river will also migrate into the sediments through Brownian diffusion and gravity sedimentation (Li et al., 2019; Wong et al., 2020). As a result, MPsw originating upstream may become MPss downstream, consistent with the studies cited above. Therefore, MPsw in the SP1–SP13 section (central urban area, Changshou, Fuling section) was high, while MPss was low. Conversely, MPsw was low in the SP14–SP26 section (northeast section of Chongqing), while MPss was relatively high.
3.2 Effects of land use types on the concentration of MP in the river at different scales
Origin (v. 2022) software was used to analyze correlations between land use types and MP concentrations at various buffer ranges and scales. At all buffer scales, MPsw was positively correlated with urban and garden land, and negatively correlated with arable land. Urban land with intensive human activity increases the concentration of MP, consistent with previous studies (McCormick et al., 2014; Mao R. et al., 2020; Nguyen et al., 2021). Townsend et al. (2019) also found that the concentration of MP is positively correlated with the level of urbanization in watersheds. As the buffer radius increases, the strength of the correlation between land use and MPsw gradually decreases and the number of land use types that are directly correlated with it also gradually decreases (Gu et al., 2019). In the present study, five types of land use were directly correlated with MPsw with a 1-km buffer radius, four types with a 1.5-km buffer radius, and three types with a 2-km buffer radius.
At all buffer scales, MPss was positively correlated with village land and arable land (Li et al., 2022). Unlike MPsw, as the buffer radius increased, the strength of the correlations between land use types and MPss gradually increased (Figure 7).
When the buffer radius was 1 km, MPsw was positively correlated with urban land, roads, gardens, woodland, and bare land, consistent with (Mao Y. et al., 2020). The correlation coefficient for urban land was strongly positive (0.53, p< 0.05), while the remaining land types had weak positive correlations (Figure 7). Village land and arable land had weak negative correlations with MPsw. There was no obvious correlation between MPsw and grasslands. The results of this study are similar to those of Hong et al. (2016), who found that water pollution was positively correlated with urban land and arable land and negatively correlated with grasslands. MPss was positively correlated with village land, roads, and arable land. The correlation with village land was moderately positive (0.44, p< 0.05). MPss had weak negative correlations with urban land (−0.27, p< 0.05), woodland (−0.1, p< 0.05), grasslands (−0.13, p< 0.05), and bare land (−0.16, p< 0.05). There was no significant correlation between MPss and gardens.
When the buffer radius was 1.5 km, MPsw was positively correlated with urban land, roads, gardens, and woodland, consistent with (Townsend et al., 2019). Among these, MPsw had moderate positive correlations with urban land (0.4, p< 0.05) and roads (0.32, p< 0.05), while the other land types had weak positive correlations (Figure 8). There was a weak negative correlation between arable land and MPsw and no obvious correlations between MPsw and village land, grasslands, or bare land. MPss was positively correlated with village land, roads, arable land, gardens, and bare land. The correlation was moderately positive for bare land (0.37, p< 0.05) and arable land (0.3, p< 0.05). MPss was negatively correlated with urban land (−0.33, p< 0.05). There were no significant correlations between MPss and woodlands or grasslands.
When the buffer radius was expanded to 2 km, MPsw had weak positive correlations with urban land (0.29, p< 0.05), village land (0.15, p< 0.05), and gardens (0.13, p< 0.05). MPsw had weak negative correlations with roads (−0.14, p< 0.05), arable land (−0.11, p< 0.05), and grasslands (−0.25, p< 0.05), consistent with (Hong et al., 2016). No significant correlations between MPsw and woodland or bare land were found (Figure 9). MPss was positively correlated with village land, arable land, gardens, and bare land; correlations were moderately strong for bare land (0.41, p< 0.05) and arable land (0.35, p< 0.05). MPss was negatively correlated with urban land (−0.33, p< 0.05), which may be due to effects such as sediment migration, gravity settlement, and adhesion settlement as MP migrate from urban to rural areas of the river (Li et al., 2019; Wong et al., 2020). There were no significant correlations between MPss and roads, woodland, or grasslands.
Based on the correlation analysis, redundant analysis methods were further used to explain and analyze the concentration of MP with multi-scale land use types (Figures 10–12). When the buffer radius was 2 km, the land use type best explains the concentration of MP, with an explanation rate of 46.4%. When the buffer radius was 2 km, the proportion of each land use type was relatively balanced, which can comprehensively explain changes in the concentration of MP by land use type (Liu C. J. et al., 2021). With increasing buffer radius, differences in the interpretation rates of the various land use types gradually decreased. When the buffer radius was 1 km, land use types had interpretation rates for MP concentration that differed by as much as 17%. When the buffer radius was 1.5 km, the difference was 11.2%, and when the buffer radius was 2 km, the difference was 7.2%. For all buffer radii, urban land had the highest explanation rate for MP concentrations, consistent with the conclusions of the correlation analysis. Urban populations intensively produce and use the most plastic products, so more MP are released. Village land and bare land also had high explanation rates for MP concentrations. Village populations are also relatively active and produce a fair amount of plastic products. The high explanation rate for MP concentrations by bare ground is because it is generally used to store garbage containing large amounts of plastic waste, which is a major source of MP.
3.3 Effects of land use intensity on fluvial MP concentrations at different scales
At all buffer scales, the LUI was strongly correlated with MPsw (Figure 13). As the buffer radius increases, the correlation between the two gradually weakens (Zeng et al., 2022). In this analysis, when the buffer radius was 1 km, the correlation between the two was strongest at 0.59 (p< 0.05). When the buffer radius was 1.5 km, the correlation coefficient was 0.48 (p< 0.05) and when the buffer radius was 2 km, the correlation coefficient was 0.43 (p< 0.05). There was no significant correlation between the LUI and MPss at any buffer scale. Thus, the LUI had a greater impact on MPsw than on MPss.
Further using the redundancy analysis method, a multi-scale LUI interpretive analysis of MP concentrations was conducted (Figure 14). When the buffer radius was 1 km, the LUI interpretation rate for the MP concentration was highest at 18.9%. When the buffer radii were 1.5 and 2 km, the LUI interpretation rates for the MP concentration were low, 4% and 4.7%, respectively. Thus, the LUI within a buffer radius of 1 km of the sampling site has the strongest impact on MP concentrations.
4 Conclusions
Using the Chongqing section of the Yangtze River as an example, we explored relationships between land use and MP concentrations in water and sediments, with the following conclusions. 1) MPsw gradually decreased from upstream (central urban section) to downstream (northeastern section of Chongqing). 2) From 2016 to 2020, MPsw decreased by about 7.5 times overall. 3) MPsw was positively correlated with the proportion of surrounding urban and garden lands. When the buffer radius was 1 km, the MPsw was most strongly correlated with urban land (0.53, p< 0.05). As the buffer radius increased, the correlation between land use and MPsw gradually weakened. 4) The LUI was also strongly correlated with MPsw, particularly at a buffer radius of 1 km (0.59, p< 0.05).
We also identified an interesting phenomenon. During migration downstream, MPsw can sink when it binds to other minerals and organic matter, as well as with the waste of aquatic organisms that ingest them. MPsw was higher in the upper reaches of the Yangtze River (central urban section of Chongqing) than in the lower reaches (northeast section of Chongqing), while the MPss was lower in the upper reaches than in the lower reaches. The discovery of this phenomenon suggests how MP may move through river systems. In future studies, we will explore whether this phenomenon also occurs in other rivers.
To our knowledge, this is the first study of the relationship between the LUI and river MP concentrations, and the first exploration of the relationship between MP concentrations and land use in the upper reaches of the Yangtze River. These results enrich our understanding of the sources and transport of MP in freshwater environments and provide information useful for remediation and reduction of MP in river systems.
Data availability statement
The original contributions presented in the study are included in the article/supplementary material. Further inquiries can be directed to the corresponding authors.
Author contributions
SY: data curation, writing the original draft, and software analysis. DP: conceptualization, funding acquisition, project administration, writing, and editing. All authors contributed to the article and approved the submitted version.
Funding
High-level Talents Project of Chongqing Medical University (No. R4014), CAS Team Project of the Belt and Road (to DP), Research Program of Chongqing Science and Technology Commission (No. cstc2019jcyj-zdxmX0035 and CSTCCXLJRC201714), National Natural Science Foundation of China (No.42001269), China–Sri Lanka Joint Center for Education and Research of the Chinese Academy of Sciences (CAS), International Partnership Program of CAS (No.121311kysb20190071), and Program of China–Sri Lanka Joint Center for WaterTechnology Research and Demonstration of the Chinese Academy of Sciences (CAS). Special Project for Performance Incentive and Guidance of Research Institutions in Chongqing (No.DLYG2022JXJL004).
Acknowledgments
The authors are grateful for the Wuhan Botanical Garden, Chinese Academy of Sciences for providing data on microplastics.
Conflict of interest
The authors declare that the research was conducted in the absence of any commercial or financial relationships that could be construed as a potential conflict of interest.
Publisher’s note
All claims expressed in this article are solely those of the authors and do not necessarily represent those of their affiliated organizations, or those of the publisher, the editors and the reviewers. Any product that may be evaluated in this article, or claim that may be made by its manufacturer, is not guaranteed or endorsed by the publisher.
References
Agarwal S. (2020). Biodegradable polymers: present opportunities and challenges in providing a microplastic-free environment. Macromol. Chem. Phys. 221 (6), 2000017. doi: 10.1002/macp.202000017
Ajith N., Arumugam S., Parthasarathy S., Manupoori S., Janakiraman S. (2020). Global distribution of microplastics and its impact on marine environment-a review. Environ. Sci. pollut. Res. 27 (21), 25970–25986. doi: 10.1007/s11356-020-09015-5
Anas N. A. A., Fen Y. W., Omar N. A. S., Daniyal W. M. E. M. M., Ramdzan N. S. M., Saleviter S. (2019). Development of graphene quantum dots-based optical sensor for toxic metal ion detection. Sensors 19 (18), 3850. doi: 10.3390/s19183850
Auta H. S., Emenike C. U., Fauziah S. H. (2017). Distribution and importance of microplastics in the marine environment: a review of the sources, fate, effects, and potential solutions. Environ. Int. 102, 165–176. doi: 10.1016/j.envint.2017.02.013
Baho D. L., Bundschuh M., Futter M. N. (2021). Microplastics in terrestrial ecosystems: moving beyond the state of the art to minimize the risk of ecological surprise. Glob. Chang. Biol. 27 (17), 3969–3986. doi: 10.1111/gcb.15724
Bakir A., Desender M., Wilkinson T., Van Hoytema N., Amos R., Airahui S., et al. (2020). Occurrence and abundance of meso and microplastics in sediment, surface waters, and marine biota from the south pacific region. Mar. pollut. Bull. 160, 111572. doi: 10.1016/j.marpolbul.2020.111572
Bank M. S., Hansson S. V. (2019). The plastic cycle: a novel and holistic paradigm for the anthropocene. Environ. Sci. Technol. 53 (13), 7177–7179. doi: 10.1021/acs.est.9b02942
Barrows A. P. W., Christiansen K. S., Bode E. T., Hoellein T. J. (2018). A watershed-scale, citizen science approach to quantifying microplastic concentration in a mixed land-use river. Water Res. 147, 382–392. doi: 10.1016/j.watres.2018.10.013
Bhuvanesh N., Kumaresan G., Renuka K., Mukeshu R., Mohammed. H., Harish V. N. N. (2022). Investigation on development and performance analysis of water trash collector. Mater. Today: Proc. 66 (P3), 1216–1220. doi: 10.1016/J.MATPR.2022.05.014
Bläsing M., Amelung W. (2018) Plastics in soil: Analytical methods and possible sources. Sci. Total Environ. 612, 422–435. 10.1016/j.scitotenv.2017.08.086
Brown M. T., Vivas M. B. (2005). Landscape development intensity index. Environ. Monit. Assess. 101 (1-3), 289–309. doi: 10.1007/s10661-005-0296-6
Browne M. A., Crump P., Niven S. J., Teuten E., Tonkin A., Galloway T., et al. (2011). Accumulation of microplastic on shorelines woldwide: sources and sinks. Environ. Sci. Technol. 45 (21), 9175–9179. doi: 10.1021/es201811s
Chen G., Li Y., Wang J. (2021). Occurrence and ecological impact of microplastics in aquaculture ecosystems. Chemosphere 274, 129989. doi: 10.1016/j.chemosphere.2021.129989
Chen T.-S., Lin H.-J. (2013). Development of a framework for landscape assessment of Taiwanese wetlands. Ecol. Indic. 25, 121–132. doi: 10.1016/j.ecolind.2012.09.012
Chen Q., Zhu H. M., HE R., A.Dahlgren R., Zhang M. H., Mei K. (2015). Evaluating the impacts of land use on surface water quality using geographically weighted regression. Acta Scientiae Circumstantiae 35 (05), 1571–1580. doi: 10.13671/j.hjkxxb.2015.0013
Choy C. A., Robison B. H., Gagne T. O., Erwin B., Firl E., Halden R. U., et al. (2019). The vertical distribution and biological transport of marine microplastics across the epipelagic and mesopelagic water column. Sci. Rep. 9 (1), 7843. doi: 10.1038/s41598-019-44117-2
Di M. X. (2019). A study on microplastic pollution in river-style reservoirs of the Yangtze river basin and adsorption behavior of estradiol onto microplastics (Wuhan Botanical Garden, Chinese Academy of Sciences).
Duan S. Q., An Y. L., Su X. L., Wu Q. X., Jin T., Hou Y. L., et al. (2017). Effects of multi-scale land use on water quality in sancha river. Environ. pollut. Control 39 (05), 525–529 + 533. doi: 10.15985/j.cnki.1001-3865.2017.05.013
Fan M.Y., Huang Y.M., Zhang H.X., Li H.H., Huang Q.(2022). Distribution, risk, and influencing factors of microplastics in surface water of Huangshui River Basin. Environ. Sci. 43 (10), 4430–4439. doi: 10.13227/j.hjkx.202201087
Fang L., Qz B., Jia X. A., Yl B., Yc B., Km D., et al. (2021). Microplastics in biota and surface seawater from tropical aquaculture area from hainan, China. Gondwana Res. 108), 41–48. doi: 10.1016/j.gr.2021.11.008
Ge S., Yue W. (2016). Spatial and temporal distribution of land use pattern change in songnen high plain. Trans. Chin. Soc. Agric. Eng. 32 (18), 225–233. doi: 10.11975/j.issn.1002-6819.2016.18.031
Gu Q., Hu H., Ma L., Sheng L., Yang S., Zhang X., et al. (2019). Characterizing the spatial variations of the relationship between land use and surface water quality using self-organizing map approach. Ecol. Indic. 102, 633–643. doi: 10.1016/j.ecolind.2019.03.017
Guo J.-J., Huang X.-P., Xiang L., Wang Y.-Z., Li Y.-W., et al. (2020). Source, migration and toxicology of microplastics in soil. Environ. Int. 137, 105263. doi: 10.1016/j.envint.2019.105263
Hao Y.L., Hu Y.X., Bai X.X., Guo S.L. (2022). Abundances and morphology patterns of microplastics under different land use types on the loess plateau. Environ. Sci. 43 (09), 4748–4755. doi: 10.13227/j.hjkx.202112199
Hidalgo-Ruz V., Gutow L., Thompson R. C., Thiel M. (2012). Microplastics in the marine environment: a review of the methods used for identification and quantification. Environ. Sci. Technol. 46 (6), 3060–3075. doi: 10.1021/es2031505
Hoellein T. J., Rochman C. M. (2021). The “plastic cycle”: a watershed-scale model of plastic pools and fluxes. Front. Ecol. Environ. 19 (3), 176–183. doi: 10.1002/fee.2294
Hong C., Xiaode Z., Mengjing G., Wu W. (2016). Land use change and its effects on water quality in typical inland lake of arid area in China. J. Environ. Biol. 37 (4), 603–609. doi: 10.1360/972010-1322
Issaka E., Yakubu S., Sulemana H., Kerkula A., Nyame-do A. O. (2023). Current status of the direct detection of microplastics in environments and implications for toxicological effects. Chem. Eng. J. Adv. 14 (01), 432–443. doi: 10.1016/J.CEJA.2023.100449
Jan L., Petr S. (2003). Multivariate analysis of ecological data using CANOCO (Cambridge University Press).
Kane I. A., Clare M. A., Miramontes E., Wogelius R., Rothwell J. J., Garreau P., et al. (2020). Seafloor microplastic hotspots controlled by deep-sea circulation. Science 368 (6495), 1140–1145. doi: 10.1126/science.aba5899
Katusiime J., Schütt B., Mutai N. (2023). The relationship of land tenure, land use and land cover changes in lake Victoria basin. Land Use Policy 126 (02), 231–245. doi: 10.1016/J.LANDUSEPOL.2023.106542
Klein S., Worch E., Knepper T. P. (2015). Occurrence and spatial distribution of microplastics in river shore sediments of the Rhine-main area in Germany. Environ. Sci. Technol. 49 (10), 6070–6076. doi: 10.1021/acs.est.5b00492
Lebreton L. C. M., van der Zwet J., Damsteeg J. W., Slat B., Andrady A., Reisser J. (2017). River plastic emissions to the world’s oceans. Nat. Commun. 8, 15611. doi: 10.1038/ncomms15611
Li W.-H., Jian M.-F., Liu S.-L., Jiang Y.-M., Deng Y.-B., Zhu L. (2020). Occurrence Relationship between microplastics and heavy metals pollutants in the estuarine sediments of poyang lake and the Yangtze river. Environ. Sci. 41 (1), 242–252. doi: 10.13227/j.hjkx.201907169
Li W. G., Jian M. F., Nie J. M., Wu X. E. (2022). Spationtemporal distribution and multi-source characteristics of microplastics in the soil and water environment of poyang lake Wetland,China. Chin. J. Appl. Ecol. 33 (10), 2862–2870. doi: 10.13287/j.1001-9332.202210.034
Li Y., Wang X., Fu W., Xia X., Liu C., Min J., et al. (2019). Interactions between nano/micro plastics and suspended sediment in water: implications on aggregation and settling. Water Res. 161, 486–495. doi: 10.1016/j.watres.2019.06.018
Liebezeit G., Dubaish F. (2012). Microplastics in beaches of the East Frisian islands spiekeroog and kachelotplate. Bull. Environ. Contam. Toxicol. 89 (1), 213–217. doi: 10.1007/s00128-012-0642-7
Liu M., Ding Y., Huang P., Zheng H., Wang W., Ke H., et al. (2021). Microplastics in the western pacific and south China Sea: spatial variations reveal the impact of kuroshio intrusion. Environ. pollut. 288, 117745. doi: 10.1016/j.envpol.2021.117745
Liu C. J., Xia J., Song J. X., Zhang Y., Cheng B. F. (2021). Spatial and temporal characteristics of water quality and Response identification of land use patterns in middle and downstream of hanjiang river. Res. Environ. Sci. 34 (4), 910–919. doi: 10.13198/j.issn.1001-6929.2020.08.15
Lozano Y. M., Rillig M. C. (2020). Effects of microplastic fibers and drought on plant communities. Environ. Sci. Technol. 54 (10), 6166–6173. doi: 10.1021/acs.est.0c01051
Luan C. X., Liu R. Z. (2022). A comparative study of various land use and land cover change models to predict ecosystem service value. Int. J. Environ. Res. Public Health 19 (24), 16484. doi: 10.3390/IJERPH192416484
Luo W., Su L., Craig N. J., Du F., Wu C., Shi H. (2018). Comparison of microplastic pollution in different water bodies from urban creeks to coastal waters. Environ. pollut. 246, 174–182. doi: 10.1016/j.envpol.2018.11.081
Mai L., Sun X. F., Xia L. L., Bao L. J., Liu L. Y., Zeng E. Y. (2020). Global riverine plastic outflows. Environ. Sci. Technol. 54 (16), 10049–10056. doi: 10.1021/acs.est.0c02273
Mao R., Hu Y., Zhang S., Wu R., Guo X. (2020). Microplastics in the surface water of wuliangsuhai lake, northern China. Sci. Total Environ. 723, 137820. doi: 10.1016/j.scitotenv.2020.137820
Mao Y., Li H., Gu W., Yang G., Liu Y., He Q. (2020). Distribution and characteristics of microplastics in the yulin river, China: role of environmental and spatial factors. Environ. pollut. 265 (Pt A), 115033. doi: 10.1016/j.envpol.2020.115033
McCormick A., Hoellein T. J., Mason S. A., Schluep J., Kelly J. J. (2014). Microplastic is an abundant and distinct microbial habitat in an urban river. Environ. Sci. Technol. 48 (20), 11863–11871. doi: 10.1021/es503610r
Meijer L. J. J., van Emmerik T., van der Ent R., Schmidt C., Lebreton L. (2021). More than 1000 rivers account for 80% of global riverine plastic emissions into the ocean. Sci. Adv. 7 (18), eaaz5803. doi: 10.1126/sciadv.aaz5803
Nguyen N. B., Kim M. K., Le Q. T., Ngo D. N., Zoh K. D., Joo S. W. (2021). Spectroscopic analysis of microplastic contaminants in an urban wastewater treatment plant from Seoul, south Korea. Chemosphere 263, 127812. doi: 10.1016/j.chemosphere.2020.127812
Nuelle M. T., Dekiff J. H., Remy D., Fries E. (2014). A new analytical approach for monitoring microplastics in marine sediments. Environ. pollut. 184, 161–169. doi: 10.1016/j.envpol.2013.07.027
Pohl F., Eggenhuisen J. T., Kane I. A., Clare M. A. (2020). Transport and burial of microplastics in deep-marine sediments by turbidity currents. Environ. Sci. Technol. 54 (7), 4180–4189. doi: 10.1021/acs.est.9b07527
Rillig M. C., Lehmann A. (2020). Microplastic in terrestrial ecosystems. Science 368 (6498), 1430–1431. doi: 10.1126/science.abb5979
Townsend K. R., Lu H. C., Sharley D. J., Pettigrove V. (2019). Associations between microplastic pollution and land use in urban wetland sediments. Environ. Sci. Pollut. Res. 26 (22), 22551–22561. doi: 10.1007/s11356-019-04885-w
Wei Y. F., Ma W. G., Xu Q., Sun C. Y., Wang X. Y., Gao F. (2022). Microplastic distribution and influence factor analysis of seawater and surface sediments in a typical bay with diverse functional areas: a case study in xincun lagoon, China. Front. Environ. Sci. 10. doi: 10.3389/FENVS.2022.829942
Wong J. K. H., Lee K. K., Tang K. H. D., Yap P. S. (2020). Microplastics in the freshwater and terrestrial environments: prevalence, fates, impacts and sustainable solutions. Sci. Total Environ. 719, 137512. doi: 10.1016/j.scitotenv.2020.137512
Xiang S., Pang Y., Dou J. S., Lu X. Z., Xue L. Q., Chu Z. S. (2018). Impact of land use on the water quality of inflow river to erhai lake at different temporal and spatial scales. Acta Ecologica Sin. 38 (03), 876–885. doi: 10.5846/stxb201612192610
Xu N., Gao J. Q., Wang Q. (2017). Simulation of non-point source pollution in the state river basin based on SWAT model. Haihe Water Resour. 05), 53–56. doi: 10.3969/j.issn.1004-7328.2017.05.018
Yan M., Nie H., Xu K., He Y., Hu Y., Huang Y., et al. (2019). Microplastic abundance, distribution and composition in the pearl river along guangzhou city and pearl river estuary, China. Chemosphere 217, 879–886. doi: 10.1016/j.chemosphere.2018.11.093
Yuan W., Christie-Oleza J. A., Xu E. G., Li J., Zhang H., Wang W., et al. (2022). Environmental fate of microplastics in the world’s third-largest river: basin-wide investigation and microplastic community analysis. Water Res. 210, 118002. doi: 10.1016/j.watres.2021.118002
Zeng Z. W. Y. H., Ning Q. M., Tang H. (2022). Temporal and spatial evolution of land use intensity and its impact on ecosystem services in dongting lake zone. Economic Geogr. 42 (9), 176–185. doi: 10.15957/j.cnki.jjdl.2022.09.020
Zhang X. Q., Peng M., Wang Y., Li L. J., Chai Y., Shen Z. W., et al. (2022). Composition and distribution characteristics of microplastics insurface water of chongqing section of the three gorges reservoir. Freshw. Fisheries 52 (01), 90–95. doi: 10.13721/j.cnki.dsyy.20211125.001
Keywords: microplastics, land use, correlation analysis, redundancy analysis, buffer scale
Citation: Ye S and Pei D (2023) Relationships between microplastic pollution and land use in the Chongqing section of the Yangtze River. Front. Ecol. Evol. 11:1202562. doi: 10.3389/fevo.2023.1202562
Received: 08 April 2023; Accepted: 05 June 2023;
Published: 15 June 2023.
Edited by:
Cletah Shoko, University of the Witwatersrand, South AfricaReviewed by:
Andrea Augusto Sfriso, University of Ferrara, ItalyMuhsan Ehsan, Bahria University, Pakistan
Copyright © 2023 Ye and Pei. This is an open-access article distributed under the terms of the Creative Commons Attribution License (CC BY). The use, distribution or reproduction in other forums is permitted, provided the original author(s) and the copyright owner(s) are credited and that the original publication in this journal is cited, in accordance with accepted academic practice. No use, distribution or reproduction is permitted which does not comply with these terms.
*Correspondence: Sheng Ye, eXNjY3h6QG91dGxvb2suY29t; Desheng Pei, cGVpZHNAY3FtdS5lZHUuY24=